Embed Size (px)
Citation preview
HGI9201/2012
The Bankers Investment Trust PLC is managed by
This report is printed on Revive, a paper containing 50% recycled fibre from both pre- and post-consumer waste and 50% FSC® certified virgin fibre. Pulps used are elemental chlorine free manufactured at a mill accredited with the ISO 14001 environmental management system.
The FSC logo identifies products which contain wood from well managed forests certified in accordance with the rules of the Forest Stewardship Council.
This report was printed by Pureprint Group using their pureprint environmental print technology which minimises the negative environmental impacts of the printing process. Vegetable-based inks were used throughout and 99% of the dry waste and 95% of the cleaning solvents associated with this production were recycled. Pureprint Group is a CarbonNeutral® company.
The B
ankers In
vestmen
t Trust PLC
– Rep
ort an
d Fin
ancial Statem
ents fo
r the year en
ded
31 Octo
ber 2012
HG
I9201/2012
The Bankers Investment Trust PLCReport and Financial Statements for the year ended 31 October 2012
67899_Henderson-Cover.indd 1 16/01/2013 19:35
The Bankers Investment Trust PLC
l To achieve long term asset growth in excess of
the FTSE All-Share Index.
l To achieve regular dividend growth in excess of the
increase in the Retail Prices Index.
l To achieve both these objectives by investing in a
broadly diversified international portfolio of shares.
Objectives
Policy
The Company is a member of
Investor Informationcontinued
DirectorsRichard Brewster (Chairman) Richard Burns Susan Inglis (appointed 1 November 2012) Richard Killingbeck (Senior Independent Director) Peter Sullivan Matthew Thorne
Audit CommitteeMatthew Thorne (Chairman) Susan Inglis Richard Killingbeck Peter Sullivan
Management Engagement CommitteeRichard Brewster (Chairman) Richard Burns Susan Inglis Richard Killingbeck Peter Sullivan Matthew Thorne
Nominations CommitteeRichard Brewster (Chairman) Richard Killingbeck Peter Sullivan
Investment ManagerHenderson Global Investors Limited is authorised and regulated by the Financial Services Authority and is represented by Alex Crooke
SecretaryHenderson Secretarial Services Limited represented by Wendy King FCIS
Registered NumberRegistered in England No. 00026351
Registered Office201 Bishopsgate, London EC2M 3AETelephone: 020 7818 1818
The Company is a member of
Independent AuditorsPricewaterhouseCoopers LLP, 7 More London Riverside, London SE1 2RT
Registrars
UK RegistrarEquiniti Limited, Aspect House, Spencer Road, Lancing, West Sussex BN99 6DA Telephone: 0871 384 2471 +44(0)121 415 7047 Calls to this number cost 8p per minute plus network extras. Lines are open 8.30 am to 5.30 pm, Monday to Friday.
There is now a range of shareholder information online. You can check your holding and find practical help on transferring shares or updating your details at www.shareview.co.uk
New Zealand RegistrarComputershare Investor Services Limited, Private Bag 92119, Victoria Street West, Auckland 1142, New Zealand Telephone: (New Zealand) (64) 09 488 8777
Stockbrokers
UKJP Morgan Cazenove, 25 Bank Street, Canary Wharf, London E14 5SP
New Zealand First NZ Capital Securities, Level 20, ANZ Centre, 23-29 Albert Street, PO Box 5333, Auckland, New Zealand
SolicitorsNorton Rose, 3 More London Riverside, London SE1 2AQ
CustodianBNP Paribas Securities Services, 55 Moorgate, London EC2R 6PA
Halifax Share Dealing Limited Lovell Park Road, Leeds LS1 1NS Telephone: 0845 609 0408 Email: communications@halifax Website: www.halifax.co.uk
67899_Henderson-Cover.indd 2 16/01/2013 19:35
Performance
Highlights of the Year
31 October 31 October Change 2012 2011 %
Consolidated Assets
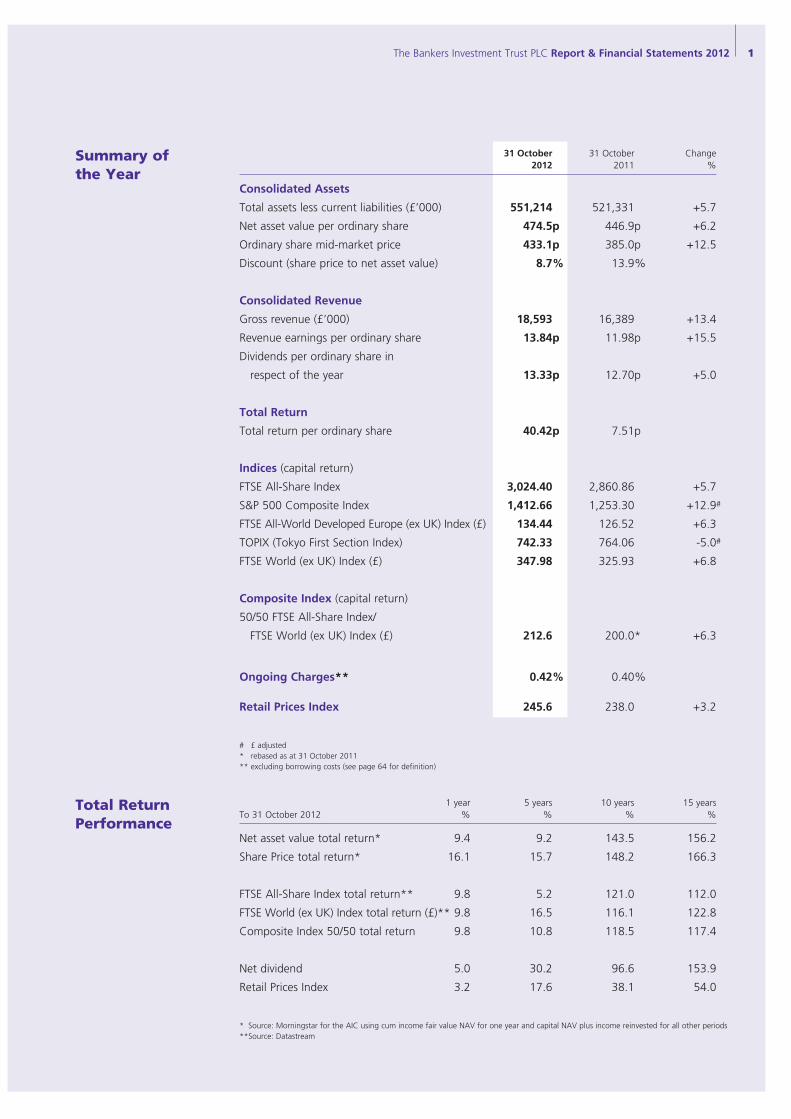
Total assets less current liabilities (£’000) 551,214 521,331 +5.7
Net asset value per ordinary share 474.5p 446.9p +6.2
Ordinary share mid-market price 433.1p 385.0p +12.5
Discount (share price to net asset value) 8.7% 13.9%
Consolidated Revenue
Gross revenue (£’000) 18,593 16,389 +13.4
Revenue earnings per ordinary share 13.84p 11.98p +15.5
Dividends per ordinary share in
respect of the year 13.33p 12.70p +5.0
Total Return
Total return per ordinary share 40.42p 7.51p
Indices (capital return)
FTSE All-Share Index 3,024.40 2,860.86 +5.7
S&P 500 Composite Index 1,412.66 1,253.30 +12.9#
FTSE All-World Developed Europe (ex UK) Index (£) 134.44 126.52 +6.3
TOPIX (Tokyo First Section Index) 742.33 764.06 -5.0#
FTSE World (ex UK) Index (£) 347.98 325.93 +6.8
Composite Index (capital return)
50/50 FTSE All-Share Index/
FTSE World (ex UK) Index (£) 212.6 200.0* +6.3
Ongoing Charges** 0.42% 0.40%
Retail Prices Index 245.6 238.0 +3.2
# £ adjusted * rebased as at 31 October 2011 ** excluding borrowing costs (see page 64 for definition)
Summary of the Year
Total Return Performance
1 year 5 years 10 years 15 years To 31 October 2012 % % % %
Net asset value total return* 9.4 9.2 143.5 156.2
Share Price total return* 16.1 15.7 148.2 166.3
FTSE All-Share Index total return** 9.8 5.2 121.0 112.0
FTSE World (ex UK) Index total return (£)** 9.8 16.5 116.1 122.8
Composite Index 50/50 total return 9.8 10.8 118.5 117.4
Net dividend 5.0 30.2 96.6 153.9
Retail Prices Index 3.2 17.6 38.1 54.0
**Source: Morningstar for the AIC using cum income fair value NAV for one year and capital NAV plus income reinvested for all other periods ** Source: Datastream
The Bankers Investment Trust PLC Report & Financial Statements 2012 1
67899_Hendersons-TEXT.indd 1 17/01/2013 14:01

2 The Bankers Investment Trust PLC Report & Financial Statements 2012
Contents
Directors’ Review
* Objectives and Policy
1 Summary of the Year and Total Return
Performance
3 Chairman’s Statement
Portfolio Review
5 Manager’s Review
6 United Kingdom
8 Europe
10 North America
12 Japan
14 Pacific (ex Japan)
16 Emerging Markets
16 Fixed Interest
17 Performance Attribution
17 Explanation of Movement in Net Asset Value
per Ordinary Share
18 Portfolio Structure
Directors’ Report
19 Directors and Management
20 Report of the Directors
32 Directors’ Remuneration Report
33 Statement of Directors’ Responsibilities
Financial Statements
34 Consolidated Statement of Comprehensive
Income
35 Consolidated and Parent Company Statements
of Changes in Equity
36 Consolidated and Parent Company Balance
Sheets
37 Consolidated and Parent Company Cash Flow
Statements
38 Notes to the Financial Statements
Investor Information
61 Independent Auditors’ Report
62 Statistical Record (Unaudited)
62 Rates of Exchange
62 Distribution of Assets and Liabilities
63 Largest Investments
63 Changes in Investments
64 Investor Information
*Inside front cover
67899_Hendersons-TEXT.indd 2 16/01/2013 21:00
Performance and MarketsIt is pleasing to be able to present to shareholders an increase in net asset value, share price and dividend. Our careful and diverse selection of investments continues to deliver steady growth. A further recovery in investment income has allowed us to exceed our forecast and raise the annual dividend again.
However, it is disappointing to repeat the same problems that have overhung markets in recent years being high levels of government debt and little evidence of a lasting resolution in Europe. It appeared that a degree of progress was being made in the US during the first half of our year and this lifted expectations. The summer months witnessed a return to uncertainty which held back consumer spending and corporate investment, delaying orders and causing company earnings to stall. The second half of the year produced little progress in share prices and a return to more volatile market conditions. Despite all of this the Company achieved a net asset value total return of 9.4% over the year, which compared to a total return of 9.8% for the composite benchmark index, with the majority of our investment returns being made in the first half. Our performance has closely matched the index returns for much of the year with our Portfolio Manager making gains by successful stock selection in most markets, but which were eroded by the overall regional asset allocation. Asset allocation is always challenging as it involves so many variable global factors, but we expect to add value in this area, in addition to gains from stock selection. Greater resources are being engaged by our Manager to assist in optimising returns from geographic allocations and this should further improve results over time.
As I reported to you last year, stock selection has in general exceeded the returns from local indices but this useful work has been negated by an underweight position in US stocks, which delivered the greatest returns, in sterling terms, for a second year. The UK, European, Japanese and Pacific regional portfolios all beat their local index returns, reflecting our Portfolio Managers’ careful selection of stocks that pay good dividends and have strong franchises. The results in the Pacific region were particularly welcome, delivering a 15.7% total return and justifying our overweight stance in this area of the world. The two regions that underperformed their respective indices were the US and Emerging Markets. The strategy of focusing on medium sized companies in the US resulted in under performance relative to the largest capitalised stocks, which increased in value more, possibly benefiting from their additional overseas earnings and a flight to safety by investors. The shortfall in the emerging markets portfolio was due to the decline in the value of commodities which impacted the
holdings of both Impala Platinum and Petroleo Brasileiros. In recent months our position in Petroleo Brasileiros has been reduced significantly while we expect a recovery in the platinum price will improve the prospects for Impala.
Revenue and DividendsThere has been a substantial recovery in our investment income over the year, with gross revenue up 13.4% compared to last year. While a portion of the growth in income has been as a result of a number of special dividends, the underlying investment income increased by 11.9%, year on year. There is typically a time lag between the recovery of earnings and dividends as companies wait for confidence to return to their businesses before they increase dividends. It is encouraging that we are now seeing the benefits of the recovery in corporate profits. It is interesting to note that our overseas investment income has exceeded that of our UK based investments for the second year running. This reflects both the increased asset allocation overseas in recent years, and most especially the fact that in the US market companies like Apple are paying dividends for the first time. The rate of growth in income will moderate in the coming year but our forecasts still show further progress in revenue even excluding any uplift from further special dividends.
We are recommending a final dividend of 3.43p, making a total of 13.33p for the year, an increase of 5%. This reflects a better outturn than we predicted last year and extends our long term record of increasing dividends to shareholders every year since 1966. The great strength of the size of our revenue reserve is the ability to protect shareholders from the volatility of earnings and smooth the dividends we pay out. Looking to 2013, we are able to forecast a dividend per share of not less than 13.86p, which represents an increase of 4%.
Annual General MeetingThe Annual General Meeting this year will be held at Stationers’ Hall, Ave Maria Lane, London EC4M 7DD on 26 February 2013 at 12 noon. This is the same venue that we used in 2012. We are returning for two reasons. First, it is my own Livery Hall and I have a great affection for it but, more importantly, it proved very popular with shareholders who attended last year. Full details of the business of the Meeting are set out in the Notice of Meeting, which accompanies this Report and Financial Statements. Directions and a map showing the location of the AGM can also be found on the Notice of the AGM. As usual our Portfolio Manager, Alex Crooke, and his team will be making a presentation. After the official business of the meeting and refreshments I am delighted to offer shareholders the opportunity of a short talk which will be given by
Chairman’s Statement
Richard Brewster
The Bankers Investment Trust PLC Report & Financial Statements 2012 3
• Net Asset Value total return was 9.4% over the year
• Total annual dividend for 2012 increased by 5% and forecasting a minimum increase of 4% for 2013
• 46th consecutive year of dividend increases
67899_Hendersons-TEXT.indd 3 18/01/2013 12:28
4 The Bankers Investment Trust PLC Report & Financial Statements 2012
Chairman’s Statementcontinued
Tim Connell, Professor Emeritus, City University London entitled “Would the City be the City without Livery Companies”.
Governance and Board changesInvestment Trust Boards are proud of being able to demonstrate levels of governance that open-ended investment products do not have. Your Board is independent and takes its responsibilities most seriously. We review the Manager’s performance throughout the year and hold a major review of all aspects of the service provided by your Manager at the end of the financial year. Our priority is to ensure that the management agreement serves the best interests of shareholders as a whole. It is our opinion that the current relationship with Henderson Global Investors achieves this. Good governance is dependent on having a Board of Directors with the right blend of skills, experience and character. In this respect I am pleased to bring you up to date with developments.
On 1 November 2012 we strengthened your Board by the appointment of Susan Inglis. Sue is the first woman to join the Board in our long history and she is a most welcome addition bringing with her a legal and investment company corporate finance background.
It is eight years since I became Chairman and it is time to pass on the baton to a younger person. I am pleased to tell you that Richard Killingbeck has agreed to take on the Chairmanship from this summer. Richard has served your Company most diligently for nine years and especially as senior independent director over the last two years. He has very considerable experience in financial services and fund management in particular and I am confident that he will maintain the values and standards that are the hallmark of Bankers’ long term success.
Retail Distribution ReviewFrom 1 January 2013, the market place for selling retail investment products in the UK has changed radically, as commissions paid to advisers by funds have been banned. This should provide a more level playing field for investment companies such as Bankers when competing for investors with open-ended products and we hope more advisers will recommend investment companies to their clients.
In view of the above comments we have decided to simplify the management fee arrangements and drop the performance fee paid to our Manager and return to a simple fixed percentage fee of 0.4% per annum of net assets (following regulatory approval). On 1 November 2013 this is expected to move to 0.45%, subject to review (more details can be found on page 22). This fee remains one of the
lowest in the Global Growth sector, and indeed amongst all investment trusts. We believe that the key characteristics of Bankers, offering consistent growth in income and capital from a broadly diversified portfolio of global companies, is very attractive and your Board is working with our Manager to spread this message to a wider audience of new investors.
We are also making changes to how we present figures to allow a better comparison with the wider spectrum of investment funds. We have adopted the standardised definitions of gearing and expenses (now called “ongoing charges”) recently recommended by the AIC.
OutlookThe Company will be 125 years old in April and, at times over those years, my predecessors had to contend with an outlook that must have been truly bleak. However, the Company has endured and remained true to its long term commitment of growing shareholders’ capital and income. There remain some notable barriers to returning the world to a steady state of economic growth but it is likely that the events that currently trouble investors such as the slowing Chinese economy or balancing the US deficit will in due course be resolved. The high level of debt in the world may mean that economies will grow at a slower pace than in previous periods of expansion but well managed companies should succeed in growing at a greater pace. The quality of corporate balance sheets and earnings has significantly improved since the downturn which gives us comfort that their dividends and in turn their attraction to investors should continue to increase. Good quality companies can provide both attractive yields and a degree of protection from rising inflation that bonds do not.
A global equity fund such as Bankers is therefore well placed to offer an attractive investment for people saving for their future. £1,000 invested 30 years ago with all dividends re-invested would today have a value of £38,951. This compares with the return from cash invested in a bank deposit account with interest re-invested over that same period of £4,145. These are difficult times for savers as cash deposits carry negative real interest rates; whereas there are real merits of investing in a savings product offering, such as Bankers. It has a superior track record of long-term capital growth and increasing dividends in real terms. The above figures showing the comparison of returns over 30 years speak for themselves.
Richard Brewster, Chairman 18 January 2013
67899_Hendersons-TEXT.indd 4 18/01/2013 14:32
The Bankers Investment Trust PLC Report & Financial Statements 2012 5
Manager’s Review
I commented last year that there had been a notable shift in
stock market sentiment towards quality companies, both
defensive and growth orientated, with dependable and
consistent earnings growth. This investment style remained in
favour during our financial year and our stock selection once
more produced good returns above benchmarks in most
regions. The UK, Europe and Japan produced a second year of
outperformance and the Pacific region turned in a strong year
outperforming by 8.3%, more than offsetting the -2.2%
underperformance in 2011. The US and Emerging Markets both
missed their performance targets due to a small number of
poorly performing investments, although the US did in addition
suffer from a size bias where the mid and smaller capitalised
stocks that have benefited us in the past underperformed the
very largest companies last year. It is now ten years since I
started managing Bankers and over this period the stock
selection element of our performance has delivered a positive
contribution of 7.7% during eight of these ten years.
I believe this demonstrates the strength in stock selection of the
team that manages the assets.
Asset allocation, by contrast, is often more difficult to get right,
particularly given the desire to balance a revenue account and our
requirement to deliver inflation-beating dividend growth. Our
principal challenge has always been capturing returns when the
US market outperforms other markets. The US market carries
roughly half the dividend return of the Pacific, Europe or the UK
and, given its size, it is challenging to fully weight an exposure to
the US and still generate an adequate level of income. During the
past decade we have had a positive contribution from asset
allocation in six years out of ten in aggregate generating over
6.4% of outperformance. It is telling that in each of the four
years where there has been a negative contribution from asset
allocation the US market has outperformed the wider global
equity market. Over the last ten years Bankers net asset total
return has delivered growth of 143%, comfortably ahead of the
composite benchmark return of 118% and far in excess of the
concept of a “lost decade” for equity investors perpetuated by
many bearish commentators.
We have ended the period with gearing of 3.9%, slightly higher
than the previous year end of 3.2%. However there was a degree
Alex Crooke
of movement during the year as we liquidated holdings in early
summer following a sharp upward movement in share prices.
There was a growing feeling that corporate earnings were
recovering but we felt the degree of optimism might be
misplaced. We decided to reduce holdings in both the UK and
Europe as negotiations in Europe concerning the euro were
stagnating and economic activity in the region was impacted
negatively by the impasse. Cash balances were rebuilt, to such a
level that they offset the debentures, resulting in no net gearing
during the summer. By September we felt more comfortable in
terms of supportive comments from Mario Draghi, the new
Governor of the European Central Bank, along with a reduction
in corporate profit forecasts, resetting valuations to more realistic
levels. The cash balances were run down through purchases in
the US, Pacific and Europe.
Our stock selection remains biased towards dividend paying
companies as we feel they offer the best balance of security and
the ability to distribute growing levels of cash flow generated
by their businesses. Corporates have progressively reduced
borrowings since 2008 resulting in equities being generally safer
investments and allowing the potential for special dividends or
share buybacks to support returns. We are gradually rebuilding
an exposure to more cyclically exposed sectors such as mining
and industrials but we will need greater clarity about economic
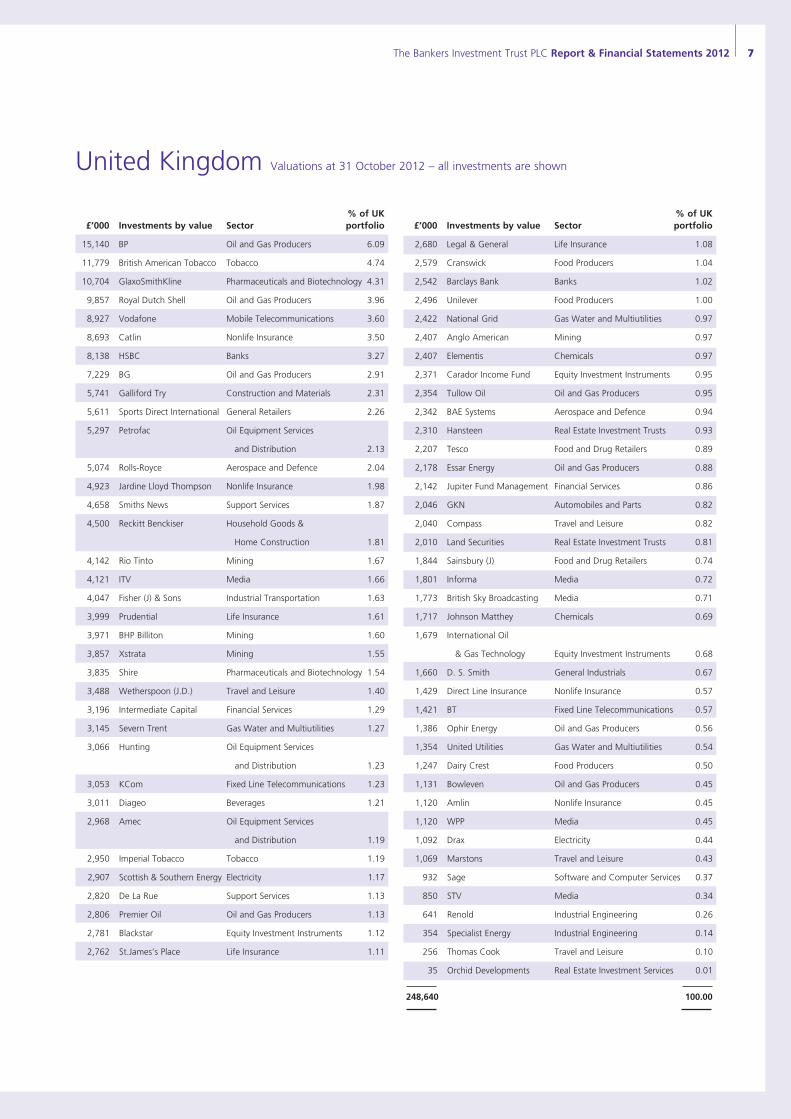
growth before rotating the portfolio more radically. The overall
portfolio is biased toward mid-sized companies (£250m to
£20bn) as shown above and therefore less exposed to the very
largest mega-cap companies. This bias has served us well in the
past, as mid-sized companies are big enough to garner scale
efficiencies while having potential to grow more quickly, taking
market share from larger competitors.
Alex Crooke
18 January 2013
0
10
20
30
40
50
60
>£20bn £1-20bn £250m-£1bn <£250m
%
Bankers
50:50 Composite Benchmark
Percentage of total assets invested by company market capitalisation
Source: Henderson Global Investors Ltd
67899_Hendersons-TEXT.indd 5 16/01/2013 21:00

6 The Bankers Investment Trust PLC Report & Financial Statements 2012
ReviewThe UK economy has been weak all year as austerity measures and government cutbacks have depressed consumer and corporate spending. The one bright spot of the economy was the UK exporting sector but, by the middle of the year, even this was tempered by the slowdown in Europe and the Far East. Against this backdrop it is impressive that the FTSE All-Share Index rose in value during the year by 9.8%, albeit with a sharp setback in May. This turned out to be one of the best performances by any stock market globally, reflecting both the high quality of UK companies and the low valuations that equities had fallen to.
The Bankers UK portfolio outperformed the FTSE All-Share Index by 2.0%, recording a second year of higher returns. The main factors behind the performance were an overweight position in key sectors such as insurance and industrials whilst having limited exposure to underperforming sectors like mining, real estate and leisure. Furthermore a number of the smaller mid-sized companies, such as Sports Direct, Jardine Lloyd Thompson and Galliford Try, performed exceptionally well on the back of improving results.
Generally the higher quality companies and those with defensive earnings fared the best as investors sought safe investments. The poor performance from the commodity sectors such as mining and oils were affected by falling metal prices and slowing demand from China. There was limited growth in UK corporate earnings although this outcome reflected big downgrades to mining profits offset by some modest growth at many domestically focused companies. Generally companies are benefiting from lower refinancing costs and reduced corporate tax rates which have helped to push margins up despite the weak state of government and consumer spending. The valuation for the UK market has risen through the year from a P/E of 11x to 12x reflecting share price appreciation rather than any movement in company earnings.
ActivityAs a result of the strong performance of the insurance sector, we decided to reduce certain holdings because valuations had become expensive given the sector’s prospects. Sales were made of the holdings in Admiral and Aviva while positions in Catlin and Jardine Lloyd Thompson were reduced in size. Valuations also appeared full in the utility sector and we reduced the National Grid position. Other positions that we sold included those in sectors where deteriorating prospects in Europe were
expected to impact earnings, such as Vodafone in the Telecoms sector and DS Smith in paper and packaging.
Purchases were made in some smaller sized positions such as Sports Direct, Jupiter Asset Management and Compass as results were much better than expected and these businesses have strong momentum to deliver profit growth next year. We also increased holdings in the mining sector and oil services, both of which were poor performers during the year but where prospects should improve next year.
OutlookThe UK economy will remain weak and prospects for 2013 look dull. However, if growth picks up in Asia and the US then UK shares could still appreciate because of the global nature of many companies in the index. Mining, oils and industrials comprise a significant proportion of the UK market and will find support if there are better prospects for growth in the global economy. Domestically, consumer spending might respond well to the tax cuts that have already been announced in April but consumer confidence needs to pick up or the improvement in spending power may well lead to increased saving, not consumption. Stock selection will remain focused on global companies and those with strong franchises that are taking market share.
United Kingdom
Total Return (Year to 31 Oct 2012) %
Bankers 11.8
FTSE All-Share 9.8
UK portfolio classified by market value of company at 31 October 2012
Market Capitalisation
A FTSE 100 (over £3bn)
B FTSE Mid 250 (£320m-£3bn)
C Smaller Companies
(under £320m)
Last year’s figures in brackets
B
C
A 64% (70%)
27% (22%)
9% (8%)
67899_Hendersons-TEXT.indd 6 16/01/2013 21:00
The Bankers Investment Trust PLC Report & Financial Statements 2012 7
United Kingdom Valuations at 31 October 2012 – all investments are shown
% of UK £’000 Investments by value Sector portfolio
2,680 Legal & General Life Insurance 1.08
2,579 Cranswick Food Producers 1.04
2,542 Barclays Bank Banks 1.02
2,496 Unilever Food Producers 1.00
2,422 National Grid Gas Water and Multiutilities 0.97
2,407 Anglo American Mining 0.97
2,407 Elementis Chemicals 0.97
2,371 Carador Income Fund Equity Investment Instruments 0.95
2,354 Tullow Oil Oil and Gas Producers 0.95
2,342 BAE Systems Aerospace and Defence 0.94
2,310 Hansteen Real Estate Investment Trusts 0.93
2,207 Tesco Food and Drug Retailers 0.89
2,178 Essar Energy Oil and Gas Producers 0.88
2,142 Jupiter Fund Management Financial Services 0.86
2,046 GKN Automobiles and Parts 0.82
2,040 Compass Travel and Leisure 0.82
2,010 Land Securities Real Estate Investment Trusts 0.81
1,844 Sainsbury (J) Food and Drug Retailers 0.74
1,801 Informa Media 0.72
1,773 British Sky Broadcasting Media 0.71
1,717 Johnson Matthey Chemicals 0.69
1,679 International Oil
& Gas Technology Equity Investment Instruments 0.68
1,660 D. S. Smith General Industrials 0.67
1,429 Direct Line Insurance Nonlife Insurance 0.57
1,421 BT Fixed Line Telecommunications 0.57
1,386 Ophir Energy Oil and Gas Producers 0.56
1,354 United Utilities Gas Water and Multiutilities 0.54
1,247 Dairy Crest Food Producers 0.50
1,131 Bowleven Oil and Gas Producers 0.45
1,120 Amlin Nonlife Insurance 0.45
1,120 WPP Media 0.45
1,092 Drax Electricity 0.44
1,069 Marstons Travel and Leisure 0.43
932 Sage Software and Computer Services 0.37
850 STV Media 0.34
641 Renold Industrial Engineering 0.26
354 Specialist Energy Industrial Engineering 0.14
256 Thomas Cook Travel and Leisure 0.10
35 Orchid Developments Real Estate Investment Services 0.01
248,640 100.00
% of UK £’000 Investments by value Sector portfolio
15,140 BP Oil and Gas Producers 6.09
11,779 British American Tobacco Tobacco 4.74
10,704 GlaxoSmithKline Pharmaceuticals and Biotechnology 4.31
9,857 Royal Dutch Shell Oil and Gas Producers 3.96
8,927 Vodafone Mobile Telecommunications 3.60
8,693 Catlin Nonlife Insurance 3.50
8,138 HSBC Banks 3.27
7,229 BG Oil and Gas Producers 2.91
5,741 Galliford Try Construction and Materials 2.31
5,611 Sports Direct International General Retailers 2.26
5,297 Petrofac Oil Equipment Services
and Distribution 2.13
5,074 Rolls-Royce Aerospace and Defence 2.04
4,923 Jardine Lloyd Thompson Nonlife Insurance 1.98
4,658 Smiths News Support Services 1.87
4,500 Reckitt Benckiser Household Goods &
Home Construction 1.81
4,142 Rio Tinto Mining 1.67
4,121 ITV Media 1.66
4,047 Fisher (J) & Sons Industrial Transportation 1.63
3,999 Prudential Life Insurance 1.61
3,971 BHP Billiton Mining 1.60
3,857 Xstrata Mining 1.55
3,835 Shire Pharmaceuticals and Biotechnology 1.54
3,488 Wetherspoon (J.D.) Travel and Leisure 1.40
3,196 Intermediate Capital Financial Services 1.29
3,145 Severn Trent Gas Water and Multiutilities 1.27
3,066 Hunting Oil Equipment Services
and Distribution 1.23
3,053 KCom Fixed Line Telecommunications 1.23
3,011 Diageo Beverages 1.21
2,968 Amec Oil Equipment Services
and Distribution 1.19
2,950 Imperial Tobacco Tobacco 1.19
2,907 Scottish & Southern Energy Electricity 1.17
2,820 De La Rue Support Services 1.13
2,806 Premier Oil Oil and Gas Producers 1.13
2,781 Blackstar Equity Investment Instruments 1.12
2,762 St.James’s Place Life Insurance 1.11
67899_Hendersons-TEXT.indd 7 16/01/2013 21:00
8 The Bankers Investment Trust PLC Report & Financial Statements 2012
Europe
Review
Europe has seen another turbulent year, with the euro
continuing to stumble from one summit to the next. However,
there has been recognition of two crucial facts: the developed
world is battling with the same issues in respect of government
borrowing and the European authorities have made it quite
clear that they will do “all it takes” to save the euro.
The debate has therefore moved on, and while sceptics may
point out that the system is structurally flawed and doomed
to failure, we prefer to work with the more simple facts:
Europe will remain in a period of low growth for years and
efforts to reduce government debt and borrowing will
continue. European equity markets have been performing
better recently but share prices remain at low valuation points.
At the same time bonds have rallied leaving ten year yields in
some ‘safe haven’ countries at extraordinarily low levels. The
introduction of an outright monetary transactions (OMT)
policy by the ECB helped remove fears of a euro break-up
causing a decent rally towards the end of the period.
We have maintained the same policy of investing in good
quality, reliable, consistent companies and, once again, this
has produced superior performance. In the year to the end of
October the European equities held by Bankers have produced
a total return of 11.2%, comfortably ahead of the Index
return of 6.1%. If we see a strong rally in poor quality stocks
(predominantly banks) we may lag the index. However, rather
than chase laggards, we maintain that the persistence of low
economic growth in the region favours quality companies.
Activity
We have persisted with a dogged “buy and carefully monitor”
approach in the portfolio, therefore the changes have been
minimal. We have sold out of France Telecom and invested in
Deutsche Telekom, as we think its dividend is more secure
and its international strategy to be undervalued. We have also
sold Givaudan, the fragrance and flavourings company, as we
see better growth elsewhere. An example would be our new
holding in DKSH – a company that has a 120 year record of
helping companies establish a market presence in the fast
growing Asian markets. It listed earlier this year and we think
this could prove to be an interesting investment over the next
few years.
Outlook
For some time European markets have been trading at very
cheap valuations as “macro” concerns have encouraged a
flight from “risk” (equities) to “safety” (bonds). Domestic
investors have record low levels of equities in their portfolios,
and are now questioning how much return they are likely to
receive in the next few years by investing in bonds with such a
low yield, especially if inflation remains stubbornly high. We
believe that we could be at the start of a gradual shift in
international investors’ exposure towards equities in Europe,
helped by the fact that a few of the fundamental issues
relating to the euro’s survival may actually start to be
addressed. Not all problems are easily solved. The whole
process of sorting out fiscal union, banking union and
reducing debt will take years and we believe that GDP growth
will stay at low levels. Therefore, we intend to maintain the
consistent policy of investing in quality companies, mindful
also of the need to adapt if the environment improves for
some of the beleaguered industries such as banks.
Total Return (£) (Year to 31 Oct 2012) %
Bankers 11.2
FTSE All-World Developed Europe (ex UK) 6.1
European portfolio classified by market value of company at 31 October 2012
Market Capitalisation
A Over £20bn
B £3bn-£20bn
C Under £3bn
Last year’s figures in brackets
B
C
A 39% (37%)
59% (61%)
2% (2
%)
67899_Hendersons-TEXT.indd 8 16/01/2013 21:00
The Bankers Investment Trust PLC Report & Financial Statements 2012 9
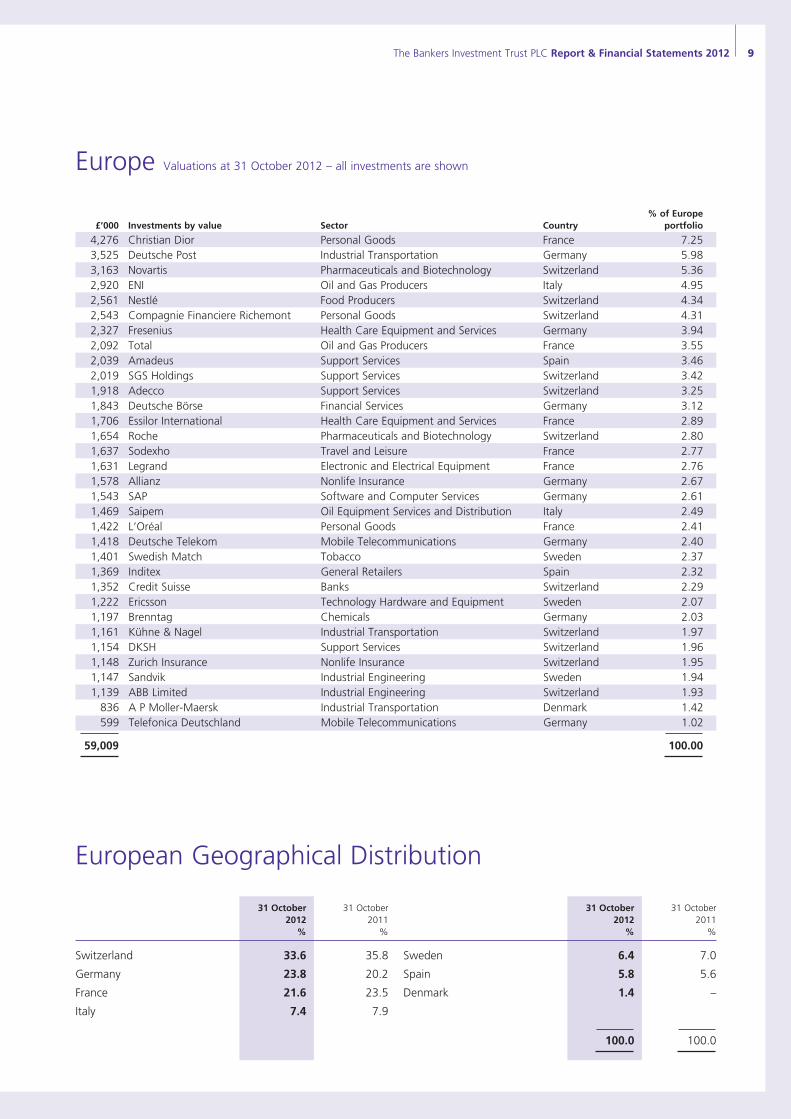
Europe Valuations at 31 October 2012 – all investments are shown
European Geographical Distribution
31 October 31 October 31 October 31 October 2012 2011 2012 2011 % % % %
Switzerland 33.6 35.8 Sweden 6.4 7.0
Germany 23.8 20.2 Spain 5.8 5.6
France 21.6 23.5 Denmark 1.4 –
Italy 7.4 7.9 100.0 100.0
% of Europe £’000 Investments by value Sector Country portfolio
4,276 Christian Dior Personal Goods France 7.25 3,525 Deutsche Post Industrial Transportation Germany 5.98 3,163 Novartis Pharmaceuticals and Biotechnology Switzerland 5.36 2,920 ENI Oil and Gas Producers Italy 4.95 2,561 Nestlé Food Producers Switzerland 4.34 2,543 Compagnie Financiere Richemont Personal Goods Switzerland 4.31 2,327 Fresenius Health Care Equipment and Services Germany 3.94 2,092 Total Oil and Gas Producers France 3.55 2,039 Amadeus Support Services Spain 3.46 2,019 SGS Holdings Support Services Switzerland 3.42 1,918 Adecco Support Services Switzerland 3.25 1,843 Deutsche Börse Financial Services Germany 3.12 1,706 Essilor International Health Care Equipment and Services France 2.89 1,654 Roche Pharmaceuticals and Biotechnology Switzerland 2.80 1,637 Sodexho Travel and Leisure France 2.77 1,631 Legrand Electronic and Electrical Equipment France 2.76 1,578 Allianz Nonlife Insurance Germany 2.67 1,543 SAP Software and Computer Services Germany 2.61 1,469 Saipem Oil Equipment Services and Distribution Italy 2.49 1,422 L’Oréal Personal Goods France 2.41 1,418 Deutsche Telekom Mobile Telecommunications Germany 2.40 1,401 Swedish Match Tobacco Sweden 2.37 1,369 Inditex General Retailers Spain 2.32 1,352 Credit Suisse Banks Switzerland 2.29 1,222 Ericsson Technology Hardware and Equipment Sweden 2.07 1,197 Brenntag Chemicals Germany 2.03 1,161 Kühne & Nagel Industrial Transportation Switzerland 1.97 1,154 DKSH Support Services Switzerland 1.96 1,148 Zurich Insurance Nonlife Insurance Switzerland 1.95 1,147 Sandvik Industrial Engineering Sweden 1.94 1,139 ABB Limited Industrial Engineering Switzerland 1.93 836 A P Moller-Maersk Industrial Transportation Denmark 1.42 599 Telefonica Deutschland Mobile Telecommunications Germany 1.02 59,009 100.00
67899_Hendersons-TEXT.indd 9 16/01/2013 21:00
10 The Bankers Investment Trust PLC Report & Financial Statements 2012
Review The US equity market performed well over the twelve months,
recovering from the political driven debt ceiling debacle in the
summer of 2011 and proving able to shake off the concerns
about the Eurozone and the slowing of growth in China. The
domestic US economy has continued to recover, albeit at a
slow pace, supported by a less aggressive tightening in fiscal
policy than we have seen in Europe and a continuation of very
supportive monetary policy.
Performance was disappointing with the portfolio
underperforming the rising market by 5.1%. This
underperformance can be attributed principally to poor stock
selection in the consumer sectors. The position in Tempur Pedic
(mattress manufacturer), having been one of the best
performers in the previous year, removed nearly 2% from
performance over the period as the mattress industry entered a
period of intense competition and the share price fell sharply
on poor earnings. The holding was subsequently sold from the
portfolio. Carnival Cruise (following the Costa Concordia
tragedy) and Mead Johnson (suffering from a loss of market
share and weaker overall market for infant nutritionals in
China) were the two other significant underperformers.
ActivityDuring the year the changes to the shape of portfolio were
modest after the reduction of the US portfolio down to 35
names over the previous year. Anadarko Petroleum struggled
this year under the cloud of a legal dispute while producing
good results. The case should be resolved in early 2013 and
we continue to believe that the strong fundamentals of the
company will result in a higher valuation. On a more positive
note our largest holding, Apple, performed well as it continues
its rapid pace of new product launches into both the smart
phone and tablet markets.
We have added General Electric to the portfolio for the first
time in a number of years. The company is being restructured
to reduce dependence on financial businesses and is once again
emerging as a powerful global industrial conglomerate with
leading positions in a number of interesting areas including
healthcare, infrastructure and aerospace.
Perhaps more controversially we bought a position in AIG as
the US government sold down the controlling stake that it
acquired in 2008 to save the company from failure. A meeting
with the Chief Executive confirmed to us how far they have
come in returning the company to its roots and how many
opportunities there remain to improve profitability and release
excess capital. The stock is lowly valued as investors remain
somewhat sceptical and we see upside on a rerating as
management delivers change.
OutlookThe US elections are now behind us. The political landscape is
essentially unchanged but the outlook for fiscal policy is still
uncertain. Our expectation is that the economy will continue
to improve in 2013 as the housing market recovery gathers
momentum and job creation lowers unemployment. The
housing market is crucial to the momentum of the overall
economy. It is not only a benefit to the companies active in
housing related industries but has a positive effect on consumer
confidence, the financial sector and on employment growth.
As fiscal policy uncertainties diminish and earnings continue to
grow, the equity market is likely to produce satisfactory returns
although perhaps at a lower level than in the last twelve
months. We see the best returns coming from companies that
can produce robust earnings in a slow growth environment and
the portfolio remains skewed towards these investments.
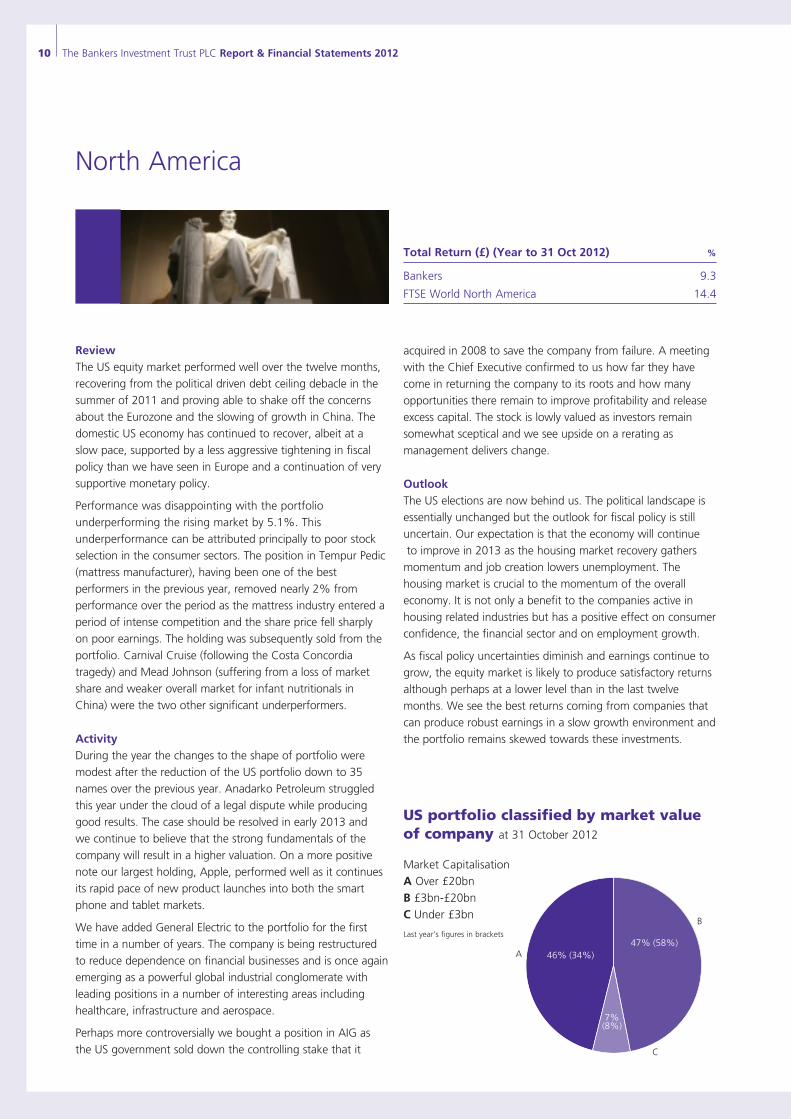
North America
Total Return (£) (Year to 31 Oct 2012) %
Bankers 9.3
FTSE World North America 14.4
US portfolio classified by market value of company at 31 October 2012
Market Capitalisation
A Over £20bn
B £3bn-£20bn
C Under £3bn
Last year’s figures in brackets
B
C
A 46% (34%)47% (58%)
7%(8%)
67899_Hendersons-TEXT.indd 10 16/01/2013 21:00
The Bankers Investment Trust PLC Report & Financial Statements 2012 11
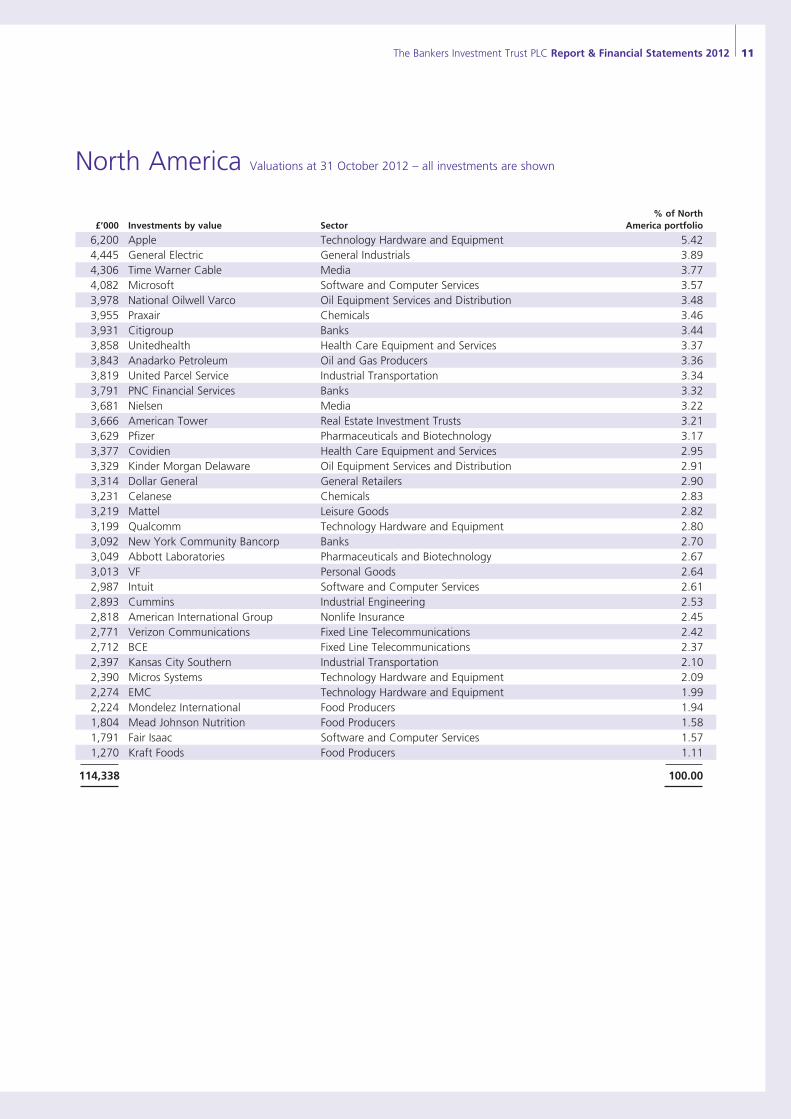
North America Valuations at 31 October 2012 – all investments are shown
% of North £’000 Investments by value Sector America portfolio
6,200 Apple Technology Hardware and Equipment 5.42 4,445 General Electric General Industrials 3.89 4,306 Time Warner Cable Media 3.77 4,082 Microsoft Software and Computer Services 3.57 3,978 National Oilwell Varco Oil Equipment Services and Distribution 3.48 3,955 Praxair Chemicals 3.46 3,931 Citigroup Banks 3.44 3,858 Unitedhealth Health Care Equipment and Services 3.37 3,843 Anadarko Petroleum Oil and Gas Producers 3.36 3,819 United Parcel Service Industrial Transportation 3.34 3,791 PNC Financial Services Banks 3.32 3,681 Nielsen Media 3.22 3,666 American Tower Real Estate Investment Trusts 3.21 3,629 Pfizer Pharmaceuticals and Biotechnology 3.17 3,377 Covidien Health Care Equipment and Services 2.95 3,329 Kinder Morgan Delaware Oil Equipment Services and Distribution 2.91 3,314 Dollar General General Retailers 2.90 3,231 Celanese Chemicals 2.83 3,219 Mattel Leisure Goods 2.82 3,199 Qualcomm Technology Hardware and Equipment 2.80 3,092 New York Community Bancorp Banks 2.70 3,049 Abbott Laboratories Pharmaceuticals and Biotechnology 2.67 3,013 VF Personal Goods 2.64 2,987 Intuit Software and Computer Services 2.61 2,893 Cummins Industrial Engineering 2.53 2,818 American International Group Nonlife Insurance 2.45 2,771 Verizon Communications Fixed Line Telecommunications 2.42 2,712 BCE Fixed Line Telecommunications 2.37 2,397 Kansas City Southern Industrial Transportation 2.10 2,390 Micros Systems Technology Hardware and Equipment 2.09 2,274 EMC Technology Hardware and Equipment 1.99 2,224 Mondelez International Food Producers 1.94 1,804 Mead Johnson Nutrition Food Producers 1.58 1,791 Fair Isaac Software and Computer Services 1.57 1,270 Kraft Foods Food Producers 1.11 114,338 100.00
67899_Hendersons-TEXT.indd 11 16/01/2013 21:00

12 The Bankers Investment Trust PLC Report & Financial Statements 2012
Review
Barring the brief flurry of enthusiasm following intervention
in the foreign exchange market in February, Japanese
equities endured a tortuous time in relation to the
performance of markets elsewhere. The total return of the
FTSE World Japan Index ended the period down -3.1%,
partly due to the value of the yen falling, thus negating
returns for sterling investors. While authorities elsewhere
continued in their efforts to stimulate activity via further
monetary easing, the Bank of Japan was rather less keen to
follow suit although additions were made to their Asset
Purchase Programme. The market traded within a narrow
band for much of the year, unable to follow the gains
recorded by markets overseas. The end of the period
witnessed a sudden drop in economic activity partly on
account of a dispute between Japan and China concerning
sovereignty over several islands but also due to sluggish
wage growth and potential capital spending delays
impacting activity.
The largest contributors to the portfolio’s outperformance
were the overweight positions in the financial and
information technology sectors as earnings were generally
better than had been anticipated. Banking, broker and
insurance stocks all made a positive showing while Oracle
Japan (software) also performed strongly. Keyence
(machinery) contributed positively given the company’s
strong level of profitability while Daiwa House recorded an
increase in profits which lifted its share price. On the
downside the vibrant consumer demand of last year
suffered a setback so that the commitment to the
consumer discretionary sector was the largest drag on
performance. Yamada Denki (retail) suffered a profit
downgrade which weighed on the share price. Elsewhere
Mitsui O.S.K. slipped as the shipping industry struggled in
the face of weakness in the Chinese economy.
Activity
Given the choppy nature of the market’s performance, activity
centred on keeping the bias of the portfolio favouring higher
growth companies, by buying when prices were weak. Trading
was therefore reflective of reducing defensive issues on
strength in favour of more cyclical issues on any set back. It was
noteworthy just how expensive the quality end of the market
became as the year progressed – a trend witnessed in other
markets. Full disposals included Asahi Group (brewer), Oracle
Japan and Hakuhodo (advertising), all of which had performed
strongly against the market and where there were better
opportunities elsewhere. New additions to the portfolio
included Nitori (retailing), Nomura Research (software) and
Japan Airlines which was relisted after a period of rehabilitation.
A small position was established in Sony which has done much
to restructure itself in the face of increasing competition.
Outlook
Weighed down by a rather sudden, but hopefully short-lived,
deterioration in economic conditions and an earnings season
where companies appear to have taken a conservative outlook
for profits, the equity market remains at an interesting juncture.
Once the disappointment from the results season has been
digested investors should be able to look forward with a
greater degree of clarity. Equities have remained range bound
for several months and a distinct break to move higher
would be a welcome development, perhaps triggered by a
continuation of recent yen weakness driven by a more
accommodative Bank of Japan. The elections held in December
which returned the Liberal Democratic Party to power may well
provide such encouragement as prime minister Abe-san has
vowed to return Japan to an acceptable level of economic
growth and to put further pressure on the Bank of Japan to
allow more quantitative easing. Investors have generally been
shy of Japan so there remains the potential of a return to the
market on any sign of an improvement in conditions.
Japan
Total Return (£) (Year to 31 Oct 2012) %
Bankers -0.9
FTSE World Japan -3.1
67899_Hendersons-TEXT.indd 12 16/01/2013 21:00
The Bankers Investment Trust PLC Report & Financial Statements 2012 13
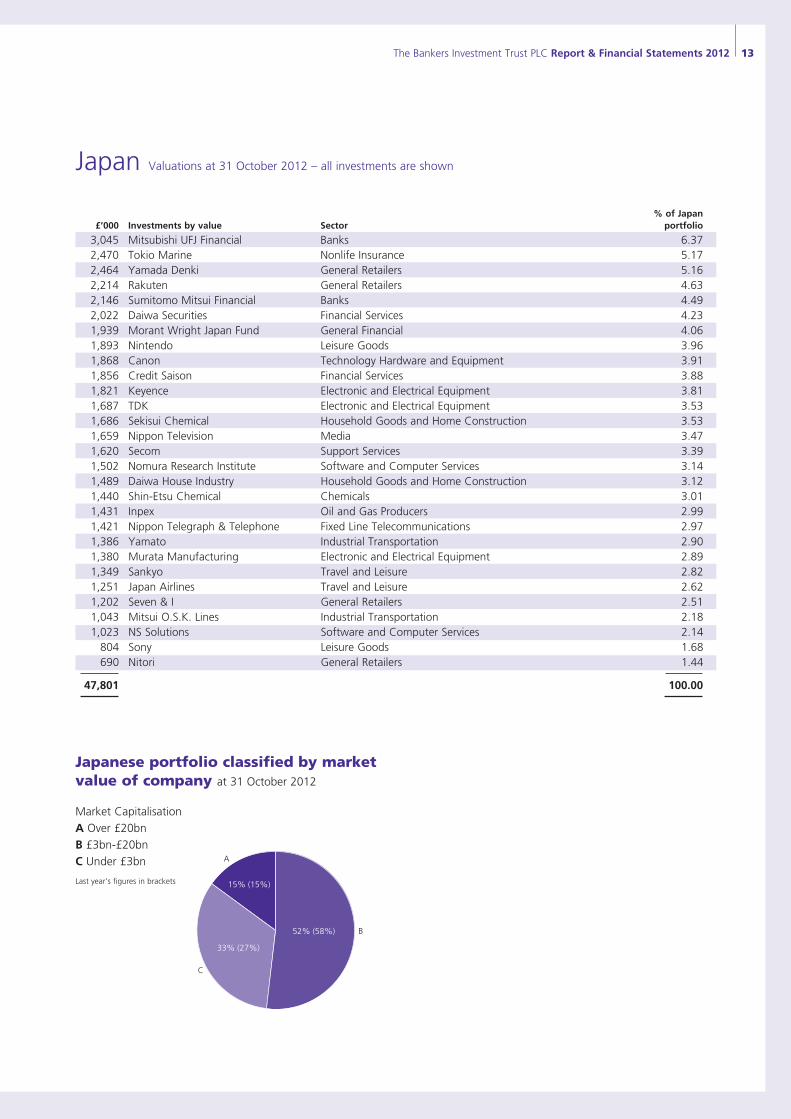
Japan Valuations at 31 October 2012 – all investments are shown
% of Japan £’000 Investments by value Sector portfolio
3,045 Mitsubishi UFJ Financial Banks 6.37 2,470 Tokio Marine Nonlife Insurance 5.17 2,464 Yamada Denki General Retailers 5.16 2,214 Rakuten General Retailers 4.63 2,146 Sumitomo Mitsui Financial Banks 4.49 2,022 Daiwa Securities Financial Services 4.23 1,939 Morant Wright Japan Fund General Financial 4.06 1,893 Nintendo Leisure Goods 3.96 1,868 Canon Technology Hardware and Equipment 3.91 1,856 Credit Saison Financial Services 3.88 1,821 Keyence Electronic and Electrical Equipment 3.81 1,687 TDK Electronic and Electrical Equipment 3.53 1,686 Sekisui Chemical Household Goods and Home Construction 3.53 1,659 Nippon Television Media 3.47 1,620 Secom Support Services 3.39 1,502 Nomura Research Institute Software and Computer Services 3.14 1,489 Daiwa House Industry Household Goods and Home Construction 3.12 1,440 Shin-Etsu Chemical Chemicals 3.01 1,431 Inpex Oil and Gas Producers 2.99 1,421 Nippon Telegraph & Telephone Fixed Line Telecommunications 2.97 1,386 Yamato Industrial Transportation 2.90 1,380 Murata Manufacturing Electronic and Electrical Equipment 2.89 1,349 Sankyo Travel and Leisure 2.82 1,251 Japan Airlines Travel and Leisure 2.62 1,202 Seven & I General Retailers 2.51 1,043 Mitsui O.S.K. Lines Industrial Transportation 2.18 1,023 NS Solutions Software and Computer Services 2.14 804 Sony Leisure Goods 1.68 690 Nitori General Retailers 1.44 47,801 100.00
Japanese portfolio classified by market value of company at 31 October 2012
Market Capitalisation
A Over £20bn
B £3bn-£20bn
C Under £3bn
Last year’s figures in brackets
B
C
A
15% (15%)
52% (58%)
33% (27%)
67899_Hendersons-TEXT.indd 13 16/01/2013 21:00
14 The Bankers Investment Trust PLC Report & Financial Statements 2012
Review
In the year under review our portfolio grew by 15.7%
compared to the FTSE All-World Asia Pacific (ex Japan) Index,
which rose by 7.4% in sterling terms. The period was
dominated by global themes with political news flow from
Europe and economic news from the US dictating the market
direction. Stock selection was the greatest contributor to
outperformance with companies such as Lenovo in China,
Kasikornbank in Thailand and Fraser and Neave in Singapore
all posting significant gains. The higher dividend yields
available in many Asian markets, combined with the potential
for growth, have attracted investors back to the region and
favoured sectors and stocks with strong dividend records.
From an economic standpoint Asian economies continue to
perform better than their western counterparts although the
subdued economic environment in the US and Europe has
resulted in weaker GDP growth in all countries with the
exception of Indonesia and Malaysia. The cyclical economies
of Taiwan and Korea and the city states of Singapore and
Hong Kong have fared worst with all four posting GDP
growth in 3Q12 below 2.5%. The trajectory of growth in
China and India continues to slow. The former posted 7.4%
year on year GDP growth in 3Q12 which apart from the
global financial crisis was the lowest level for ten years while
India continues to struggle with inflationary pressure and high
interest rates which has slowed economic growth to a little
over 5%.
With a backdrop of slowing growth it is no surprise to see
that earnings expectations have also been lowered. At the
start of 2012 analysts were expecting earnings growth of
15% for the full year – this was revised down to around 9%
at the half year stage and may finish the year in the 5% to
7% range. The significant downgrades have been confined to
the cyclical sectors, with commodities and materials in
particular being hard hit. In more domestically based sectors,
the earnings have been resilient and although companies are
not overly optimistic about the immediate future due to lack
of visibility, there is a quiet optimism about the opportunities
that could arise in the next few years.
The best performing markets were the Philippines, Thailand
and Malaysia which benefited from focused sectors while
India, Korea and Taiwan were the laggards. Our focus on
stability of earnings was justified by the strong returns from
telecommunications companies while energy and industrial
companies joined material companies by underperforming the
overall Index.
Activity
The portfolio retains a high weighting to China where the
holdings are largely unchanged apart from the disposal of
Skyworth Digital and the introduction of China Mobile which
we consider will benefit from increased mobile data usage in
China. There were more changes in Australia where we
switched casino operator Crown into another gaming
company Tabcorp and sold Incitec Pivot in favour of
department store operator Myer. Elsewhere we also sold
Korean telecom company KT Corp and bought into their
competitor company SK Telecom and added Taiwan Cement
and the Thai integrated agricultural producer, Charoen
Pokphand Foods, to the portfolio.
Outlook
We remain positive on the long term outlook for the Asia
Pacific markets. The economic fundamentals are generally
favourable and valuations are attractive both relative to their
own history and domestic bonds. Despite this, we expect that
returns in the short term will continue to be dominated by
news flow from Europe and the strength of both the US and
Chinese economies. We will continue to retain our focus on
domestically orientated companies and look for any
opportunities to add holdings when opportunities arise.
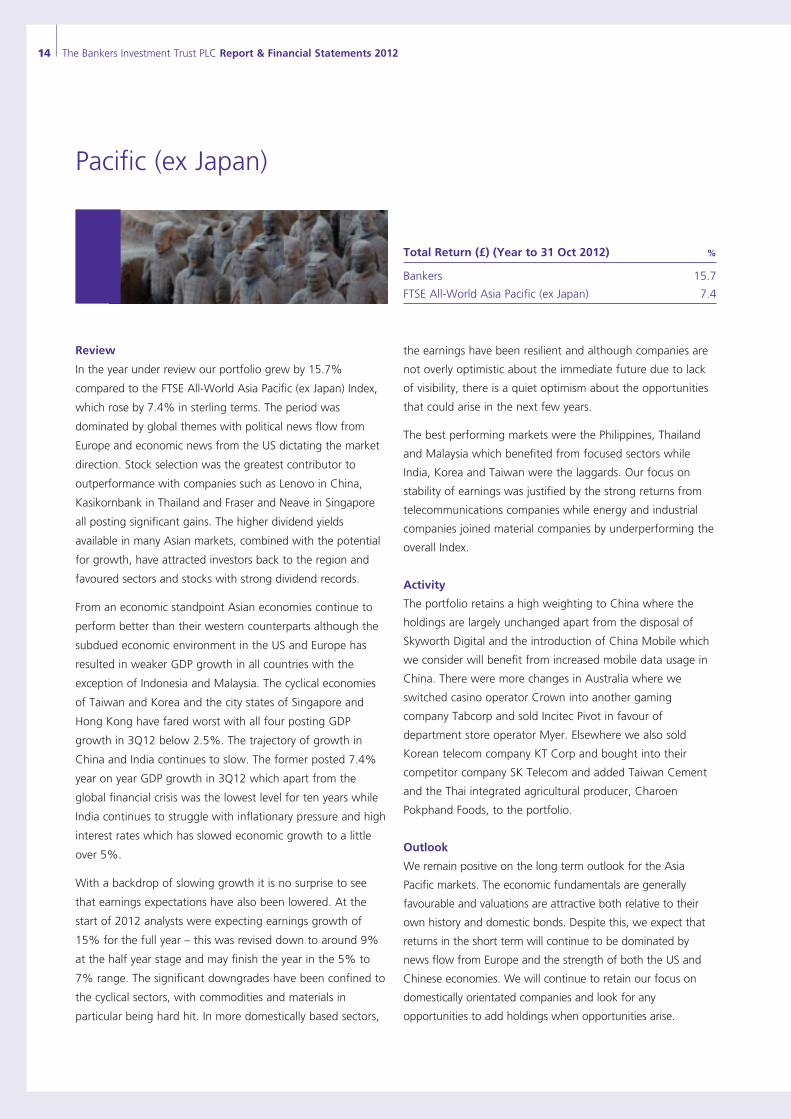
Pacific (ex Japan)
Total Return (£) (Year to 31 Oct 2012) %
Bankers 15.7
FTSE All-World Asia Pacific (ex Japan) 7.4
67899_Hendersons-TEXT.indd 14 16/01/2013 21:00
The Bankers Investment Trust PLC Report & Financial Statements 2012 15
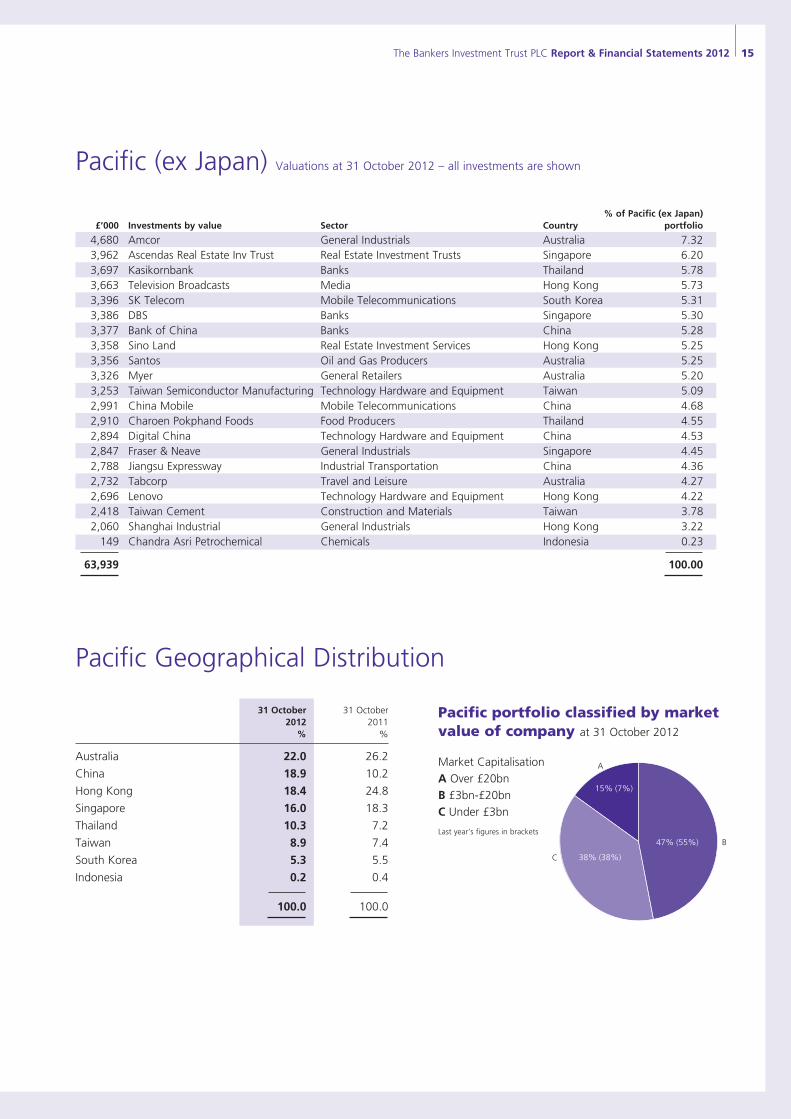
Pacific (ex Japan) Valuations at 31 October 2012 – all investments are shown
% of Pacific (ex Japan) £’000 Investments by value Sector Country portfolio
4,680 Amcor General Industrials Australia 7.32 3,962 Ascendas Real Estate Inv Trust Real Estate Investment Trusts Singapore 6.20 3,697 Kasikornbank Banks Thailand 5.78 3,663 Television Broadcasts Media Hong Kong 5.73 3,396 SK Telecom Mobile Telecommunications South Korea 5.31 3,386 DBS Banks Singapore 5.30 3,377 Bank of China Banks China 5.28 3,358 Sino Land Real Estate Investment Services Hong Kong 5.25 3,356 Santos Oil and Gas Producers Australia 5.25 3,326 Myer General Retailers Australia 5.20 3,253 Taiwan Semiconductor Manufacturing Technology Hardware and Equipment Taiwan 5.09 2,991 China Mobile Mobile Telecommunications China 4.68 2,910 Charoen Pokphand Foods Food Producers Thailand 4.55 2,894 Digital China Technology Hardware and Equipment China 4.53 2,847 Fraser & Neave General Industrials Singapore 4.45 2,788 Jiangsu Expressway Industrial Transportation China 4.36 2,732 Tabcorp Travel and Leisure Australia 4.27 2,696 Lenovo Technology Hardware and Equipment Hong Kong 4.22 2,418 Taiwan Cement Construction and Materials Taiwan 3.78 2,060 Shanghai Industrial General Industrials Hong Kong 3.22 149 Chandra Asri Petrochemical Chemicals Indonesia 0.23 63,939 100.00
Pacific Geographical Distribution
31 October 31 October 2012 2011 % %
Australia 22.0 26.2
China 18.9 10.2
Hong Kong 18.4 24.8
Singapore 16.0 18.3
Thailand 10.3 7.2
Taiwan 8.9 7.4
South Korea 5.3 5.5
Indonesia 0.2 0.4
100.0 100.0
Pacific portfolio classified by market value of company at 31 October 2012
Market Capitalisation
A Over £20bn
B £3bn-£20bn
C Under £3bn
Last year’s figures in bracketsB
C
A
15% (7%)
47% (55%)
38% (38%)
67899_Hendersons-TEXT.indd 15 16/01/2013 21:00
16 The Bankers Investment Trust PLC Report & Financial Statements 2012
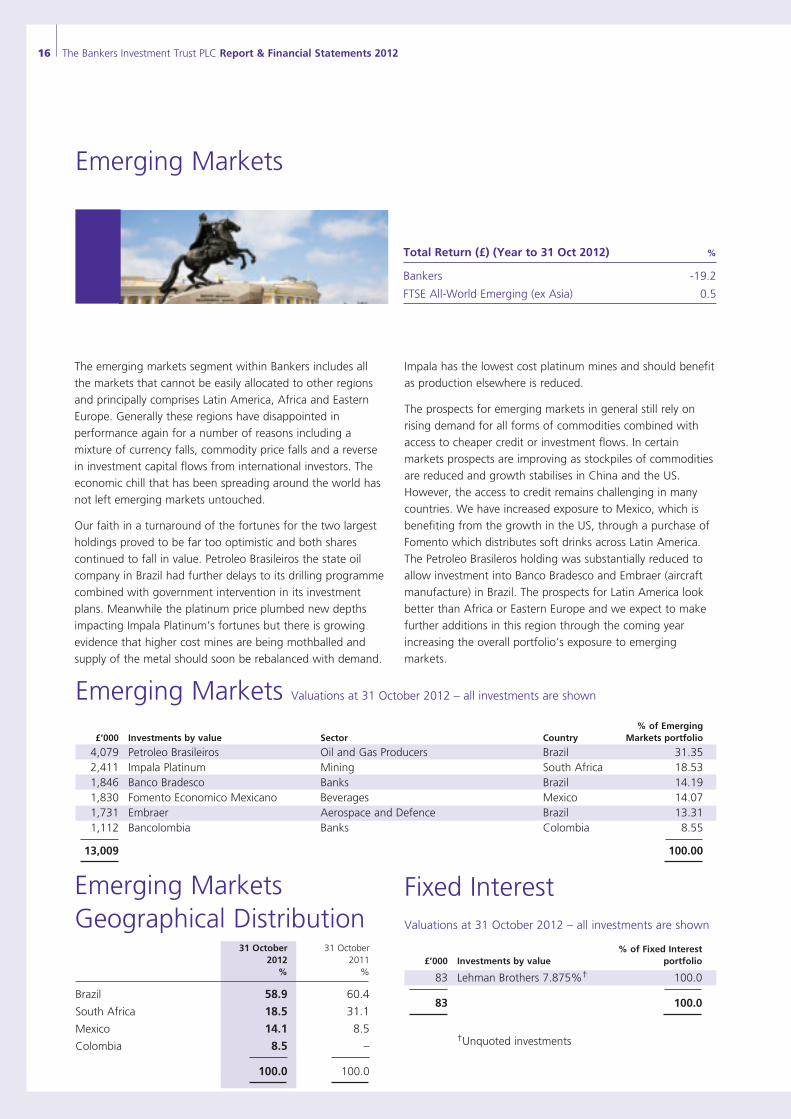
Emerging Markets
Total Return (£) (Year to 31 Oct 2012) %
Bankers -19.2
FTSE All-World Emerging (ex Asia) 0.5
Emerging Markets Valuations at 31 October 2012 – all investments are shown
% of Emerging £’000 Investments by value Sector Country Markets portfolio
4,079 Petroleo Brasileiros Oil and Gas Producers Brazil 31.35 2,411 Impala Platinum Mining South Africa 18.53 1,846 Banco Bradesco Banks Brazil 14.19 1,830 Fomento Economico Mexicano Beverages Mexico 14.07 1,731 Embraer Aerospace and Defence Brazil 13.31 1,112 Bancolombia Banks Colombia 8.55 13,009 100.00
Emerging Markets Geographical Distribution
Fixed Interest Valuations at 31 October 2012 – all investments are shown
% of Fixed Interest £’000 Investments by value portfolio
83 Lehman Brothers 7.875%† 100.0
83 100.0
†Unquoted investments
31 October 31 October 2012 2011 % %
Brazil 58.9 60.4
South Africa 18.5 31.1
Mexico 14.1 8.5
Colombia 8.5 –
100.0 100.0
The emerging markets segment within Bankers includes all
the markets that cannot be easily allocated to other regions
and principally comprises Latin America, Africa and Eastern
Europe. Generally these regions have disappointed in
performance again for a number of reasons including a
mixture of currency falls, commodity price falls and a reverse
in investment capital flows from international investors. The
economic chill that has been spreading around the world has
not left emerging markets untouched.
Our faith in a turnaround of the fortunes for the two largest
holdings proved to be far too optimistic and both shares
continued to fall in value. Petroleo Brasileiros the state oil
company in Brazil had further delays to its drilling programme
combined with government intervention in its investment
plans. Meanwhile the platinum price plumbed new depths
impacting Impala Platinum’s fortunes but there is growing
evidence that higher cost mines are being mothballed and
supply of the metal should soon be rebalanced with demand.
Impala has the lowest cost platinum mines and should benefit
as production elsewhere is reduced.
The prospects for emerging markets in general still rely on
rising demand for all forms of commodities combined with
access to cheaper credit or investment flows. In certain
markets prospects are improving as stockpiles of commodities
are reduced and growth stabilises in China and the US.
However, the access to credit remains challenging in many
countries. We have increased exposure to Mexico, which is
benefiting from the growth in the US, through a purchase of
Fomento which distributes soft drinks across Latin America.
The Petroleo Brasileros holding was substantially reduced to
allow investment into Banco Bradesco and Embraer (aircraft
manufacture) in Brazil. The prospects for Latin America look
better than Africa or Eastern Europe and we expect to make
further additions in this region through the coming year
increasing the overall portfolio’s exposure to emerging
markets.
67899_Hendersons-TEXT.indd 16 16/01/2013 21:00
The Bankers Investment Trust PLC Report & Financial Statements 2012 17
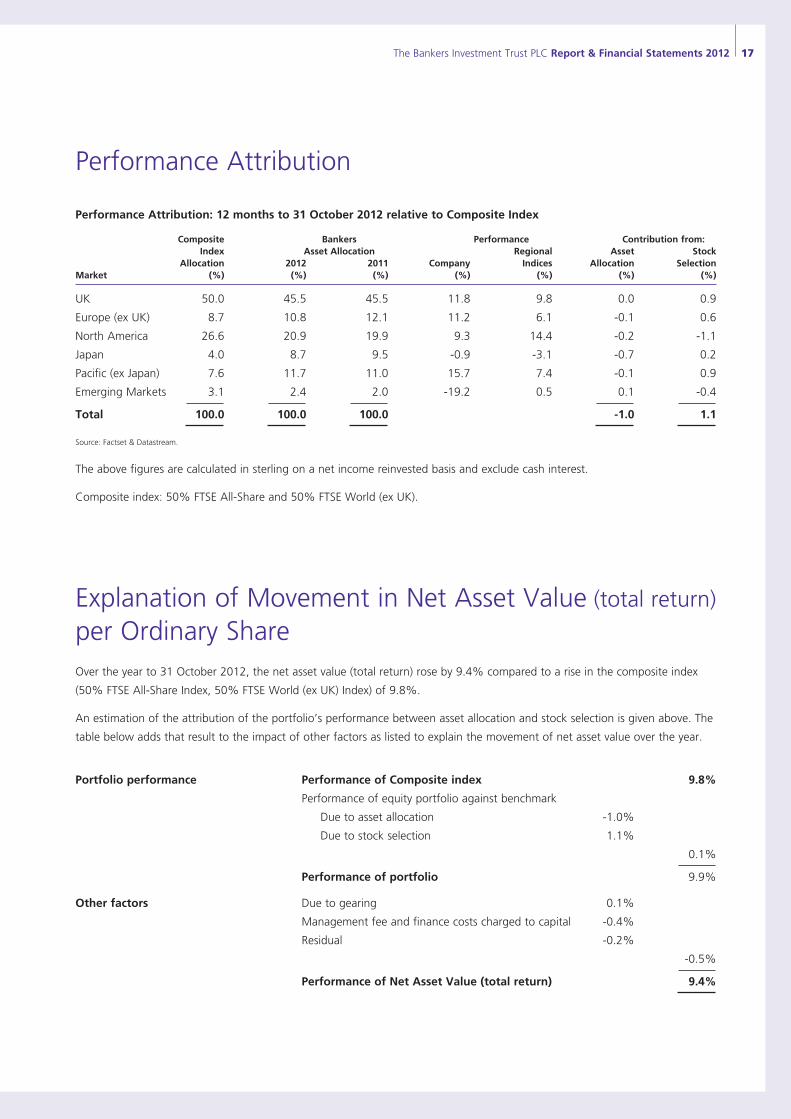
Performance Attribution
Performance Attribution: 12 months to 31 October 2012 relative to Composite Index
Composite Bankers Performance Contribution from: Index Asset Allocation Regional Asset Stock Allocation 2012 2011 Company Indices Allocation Selection Market (%) (%) (%) (%) (%) (%) (%)
UK 50.0 45.5 45.5 11.8 9.8 0.0 0.9
Europe (ex UK) 8.7 10.8 12.1 11.2 6.1 -0.1 0.6
North America 26.6 20.9 19.9 9.3 14.4 -0.2 -1.1
Japan 4.0 8.7 9.5 -0.9 -3.1 -0.7 0.2
Pacific (ex Japan) 7.6 11.7 11.0 15.7 7.4 -0.1 0.9
Emerging Markets 3.1 2.4 2.0 -19.2 0.5 0.1 -0.4 Total 100.0 100.0 100.0 -1.0 1.1
Source: Factset & Datastream.
The above figures are calculated in sterling on a net income reinvested basis and exclude cash interest.
Composite index: 50% FTSE All-Share and 50% FTSE World (ex UK).
Explanation of Movement in Net Asset Value (total return) per Ordinary ShareOver the year to 31 October 2012, the net asset value (total return) rose by 9.4% compared to a rise in the composite index
(50% FTSE All-Share Index, 50% FTSE World (ex UK) Index) of 9.8%.
An estimation of the attribution of the portfolio’s performance between asset allocation and stock selection is given above. The
table below adds that result to the impact of other factors as listed to explain the movement of net asset value over the year.
Portfolio performance Performance of Composite index 9.8%
Performance of equity portfolio against benchmark
Due to asset allocation -1.0%
Due to stock selection 1.1%
0.1% Performance of portfolio 9.9%
Other factors Due to gearing 0.1%
Management fee and finance costs charged to capital -0.4%
Residual -0.2%
-0.5% Performance of Net Asset Value (total return) 9.4%
67899_Hendersons-TEXT.indd 17 16/01/2013 21:00
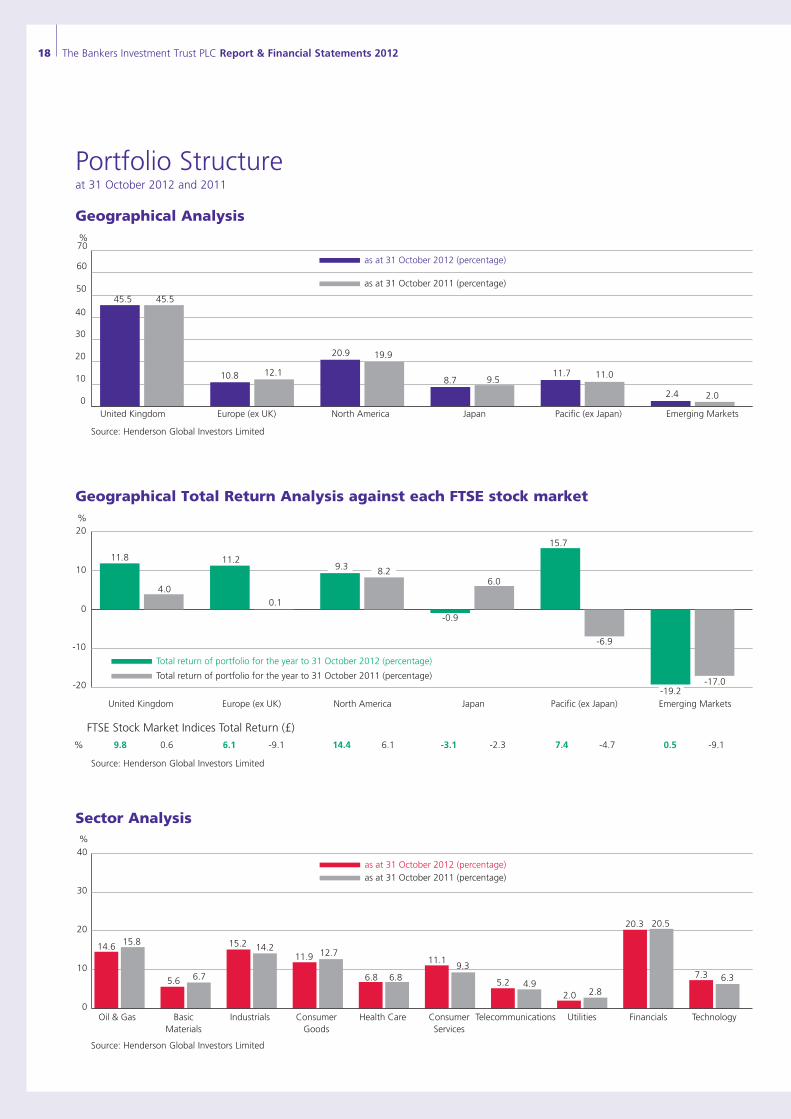
18 The Bankers Investment Trust PLC Report & Financial Statements 2012
Geographical Analysis
Portfolio Structureat 31 October 2012 and 2011
Geographical Total Return Analysis against each FTSE stock market
-20
-10
0
10
20
United Kingdom Europe (ex UK) North America Japan Pacific (ex Japan) Emerging Markets
Total return of portfolio for the year to 31 October 2011 (percentage)
Total return of portfolio for the year to 31 October 2012 (percentage)
4.0
11.8
0.1
11.2
6.0
-0.9
-6.9
15.7
-17.0
% 0.69.8 6.1 14.4 -3.1 7.4 0.5-9.1 6.1 -2.3 -4.7 -9.1
FTSE Stock Market Indices Total Return (£)
%
8.29.3
-19.2
Sector Analysis
Oil & Gas BasicMaterials
Industrials ConsumerGoods
Health Care TelecommunicationsConsumerServices
FinancialsUtilities Technology0
10
20
30
40
as at 31 October 2011 (percentage)as at 31 October 2012 (percentage)
15.814.6
6.75.6
14.215.212.711.9
9.311.1
6.86.8
2.82.04.95.2 6.37.3
20.520.3
%
0
10
20
30
40
50
60
70
United Kingdom Europe (ex UK) North America Japan Pacific (ex Japan) Emerging Markets
as at 31 October 2011 (percentage)
as at 31 October 2012 (percentage)
45.545.5
10.8 8.7
20.9
2.4
12.19.5
11.7
19.9
11.0
2.0
%
Source: Henderson Global Investors Limited
Source: Henderson Global Investors Limited
Source: Henderson Global Investors Limited
67899_Hendersons-TEXT.indd 18 16/01/2013 21:00

The Bankers Investment Trust PLC Report & Financial Statements 2012 19
Directors
Richard Brewster*‡ FCA (Chairman) was appointed as a director in 1991 and became Chairman in 2005. Having qualified as a Chartered Accountant he has spent over 30 years in industry. From 1983 he was Chief Executive Officer of D.S. Smith plc until 1991 when he became Chief Executive Officer of Jarvis Porter plc until 1998. Since then he has taken an interest in a number of private equity investments both as Chairman and investor. He is the former Chairman of BlackRock Smaller Companies Trust plc.
Richard Burns* was appointed a director in 2006. He is a former joint senior partner of Baillie Gifford & Co and former fund manager of Monks Investment Trust plc. He is also a non-executive director of EP Global Opportunities Trust plc, Euronova European Smaller Companies Fund, JPMorgan Indian Investment Trust plc, Mid Wynd International Investment Trust plc and Standard Life Equity Income Trust plc. From 1999 to 2006 he was a director of the AIC.
Richard Killingbeck*†‡ (Senior Independent Director) was appointed as a director in 2003. He has been involved in the financial services industry for 25 years, initially as a fund manager and latterly in a number of senior management roles, at Singer & Friedlander Investment Management and Close Brothers. During his career he has been based primarily in London, but has also spent part of this time in New York. Currently he is Chief Executive Officer and Head of Private Wealth Management at WH Ireland Group plc. He was previously a Managing Director of Credit Suisse (UK) Private Bank.
Matthew Thorne*† FCA, MA (Audit Committee Chairman) was appointed as a director in 2008. Mr Thorne is an adviser to the Consensus Business Group. He was Group Finance Director of McCarthy & Stone plc and also Investment Director of Beazer plc. A Chartered Accountant, he has significant experience as a finance director, predominantly in the property sector.
Peter Sullivan*†‡ was appointed a director in February 2011. He was formerly executive director and CEO (Hong Kong) at Standard Chartered Plc, also responsible for operations in Japan, The Philippines, Australia and the joint venture in China. He is currently a non-executive director of Axa China Region, Techtronic Industries, JPMorgan Indian Investment Trust plc and Chairman of Healthcare Locums (HCL) and was previously Chairman of Cenkos Securities plc.
Susan Inglis*† was appointed as a director on 1 November 2012. A qualified lawyer, Ms Inglis was a partner, and head of the funds and financial services group, at Shepherd & Wedderburn, a leading Scottish law firm. In 1999 she was a founding partner of Intelli Corporate Finance, an advisory boutique firm focusing on the asset management and investment company sectors which was acquired by Canaccord Genuity in 2009. Ms Inglis is currently Managing Director – Corporate Finance at Cantor Fitzgerald Europe, having held the same position at Canaccord Genuity until its merger with Collins Stewart.
*Member of the Management Engagement Committee†Member of the Audit Committee‡Member of the Nominations Committee
Management
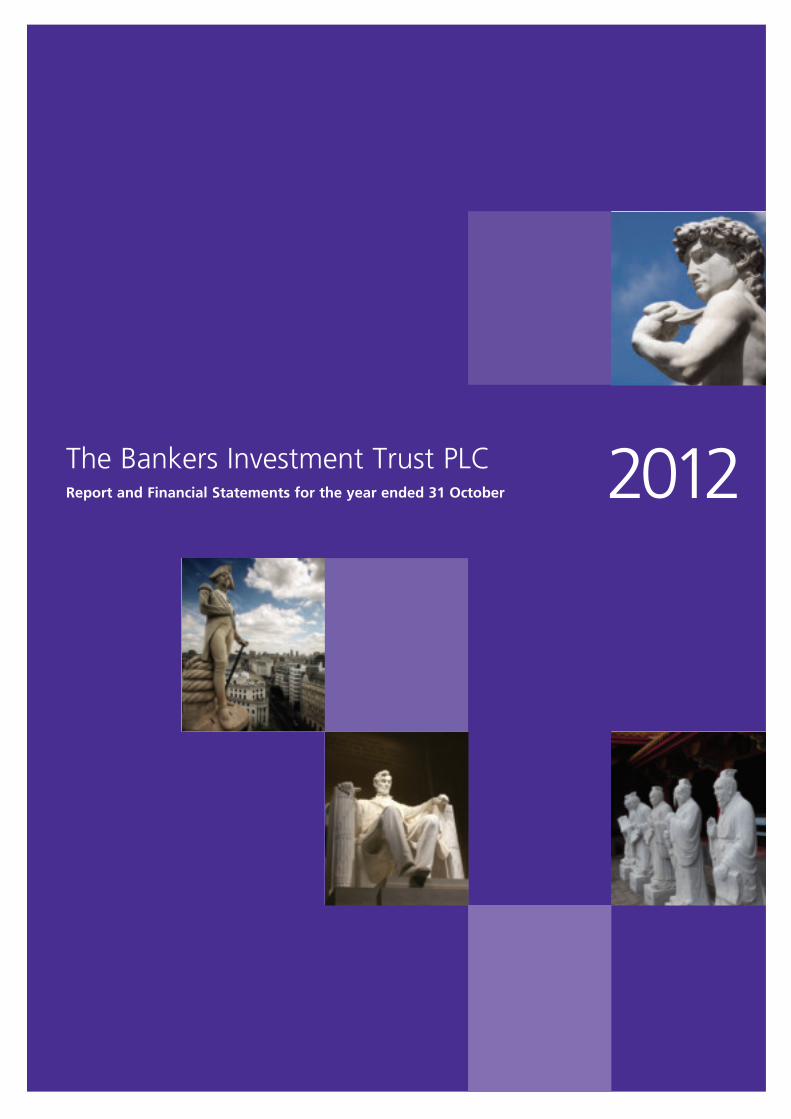
Tim Stevenson
The portfolio is managed by Alex Crooke who is engaged full time in investment management. He is assisted by Tim Stevenson (Europe), Antony Gifford (North America), Michael Kerley (Pacific ex-Japan) and Michael Wood-Martin (Japan). Wendy King acts as the Company Secretary and is the representative of Henderson Secretarial Services Limited, the corporate secretary to the Company.
Peter SullivanMatthew Thorne Susan InglisRichard KillingbeckRichard BurnsRichard Brewster
Alex Crooke Antony Gifford Mike Kerley Wendy KingMichael Wood-Martin
67899_Hendersons-TEXT.indd 19 18/01/2013 11:46
20 The Bankers Investment Trust PLC Report & Financial Statements 2012
Report of the Directors
The directors present their report and the audited financial
statements for the Group for the year ended 31 October 2012.
Business Review
The following review is designed to provide information
primarily about the Company’s business and results for the
year from 1 November 2011 to 31 October 2012. The business
review should be read in conjunction with the Chairman’s
Statement on pages 3 and 4 and the Portfolio Review on
pages 5 to 18, which gives a detailed review of the investment
activities for the year and an outlook for the future.
a) Status
The Company is incorporated in England and Wales and
domiciled in the United Kingdom (registered number
00026351). It traded throughout the year. It is an investment
company as defined in Section 833 of the Companies Act
2006 and operates as an investment trust in accordance with
Section 1158 of the Corporation Tax Act 2010. It was
required to seek HM Revenue & Customs approval of its
status as an investment trust under the above-mentioned
Section 1158 every year up to and including 1 November
2011. Approval of the Company’s status as an investment
trust has been received in respect of the year ended
31 October 2011 although this approval is subject to there
being no subsequent enquiries under Corporation Tax Self
Assessment. The directors are of the opinion that the
Company has continued to conduct its affairs in a manner
that will enable it to continue to gain such approval. For years
beginning on or after 1 November 2012 approval will be by
way of a one-off application in advance. The Company
intends to make the one-off application for investment trust
status during the year ending 31 October 2013 and will
conduct its affairs in order to maintain this status. The
Company is liable to corporation tax on its net revenue profits
but is exempt from corporation tax on capital gains if it has
complied at all times with Section 1158. The Company has
no employees.
The Company is not a close company.
The Company intends to continue to manage its affairs so
that its investments fully qualify for a stocks and shares
component of an ISA.
b) Investment objectives and policy
The Company’s objectives are to achieve long term asset
growth in excess of the FTSE All-Share Index and regular
dividend growth in excess of the increase in the Retail Prices
Index. To achieve these objectives the Company’s investment
policy is to invest its assets in a portfolio primarily composed
of international equities. The portfolio is broadly diversified by
both geography and sector in order to reduce investment risk.
The Manager has the flexibility to invest in any geographic
region and has no set limits on individual country or sector
exposures, although the Board regularly monitors the
Company’s investments and the Manager’s investment
activity. The Manager primarily employs a bottom up value
based investment process to identify suitable opportunities
and pays particular regard to cash generation and dividends.
While the Company will mainly invest in international equities
there is the flexibility to invest in debt securities, such as
convertibles, corporate bonds or sovereign debt, if it is
deemed that these will, at a particular time or for a particular
period, enhance the performance of the Company in the
pursuit of its objectives. The use of any derivative instruments
such as financial futures, options and currency hedges will
only be for the purposes of efficient portfolio management.
The Company will not invest more than 15% of its investment
portfolio in any single investment on acquisition, nor will it
invest more than 15% of its investment portfolio in any other
UK listed investment trusts or investment companies.
The Company will at times borrow money, both short and
long term, in order to enhance performance. The draw down
of borrowings may be in currencies other than Sterling,
provided that the borrowings do not exceed the assets in that
particular currency. The gearing range is between 0% and
20% and gearing will not exceed 20% of net asset value at
the time of draw down of the relevant borrowings.
The Company achieves an appropriate spread of investment
risk principally through a broadly diversified portfolio which at
31 October 2012 contained 199 individual investments. At
31 October 2012 the largest single investment was BP which
accounted for 2.77% of total investments, while the top 25
holdings totalled 29.4% of total investments. Investment risk
67899_Hendersons-TEXT.indd 20 16/01/2013 21:00
The Bankers Investment Trust PLC Report & Financial Statements 2012 21
Report of the Directorscontinued
The Company also has two debentures, details of which
can be found in note 16 on page 49.
l Gearing
Gearing is calculated by dividing total assets (less cash and
cash equivalents) by equity shareholders’ funds,
x 100. There was gearing of 3.9% at 31 October 2012
(2011: 3.2%).
l Future developments
While the future performance of the Company is dependent,
to a large degree, on the performance of international
financial markets, which, in turn, are subject to many
external factors, the Board’s intention is that the Company
will continue to pursue its stated investment objectives in
accordance with the strategy outlined earlier. Further
comments on the outlook for the Company for the next
twelve months are set out in both the Chairman’s Statement
on pages 3 and 4 and the Portfolio Review on pages 5 to 18.
l Going Concern
The directors believe that it is appropriate to continue to
adopt the going concern basis in preparing the financial
statements as the assets of the Company consist mainly of
securities which are readily realisable and, accordingly, that
the Group has adequate financial resources to continue in
operational existence for the foreseeable future.
d) Performance measurement and key performance
indicators
In order to measure the success of the Company in meeting
its objectives and to evaluate the performance of the
Manager, the directors take into account the following key
performance indicators (see page 1):
l Performance measured against the Benchmark
The Board reviews and compares, at each meeting, the
performance of the portfolio as well as the net asset value
and share price for the Company and its benchmark.
l Discount to Net Asset Value (“NAV”)
At each Board meeting, the Board monitors the level of the
Company’s discount/premium to NAV and reviews the
average discount/premium for the Company’s relevant
Association of Investment Companies (“AIC”) sector.
may be further reduced through the use of currency hedging,
foreign borrowings and derivatives.
Information regarding the Company’s investment exposures
can be found on page 18, and performance attribution
against our composite benchmark is contained on page 17.
Further information regarding investment risk and activity
throughout the year can be found in the Manager’s Review
and accompanying regional pages.
c) Financial review
l Assets
Total net assets at 31 October 2012 amounted to
£526,214,000 compared with £496,331,000 at 31 October
2011 and the net asset value per ordinary share increased
by 6.2% from 446.9p to 474.5p.
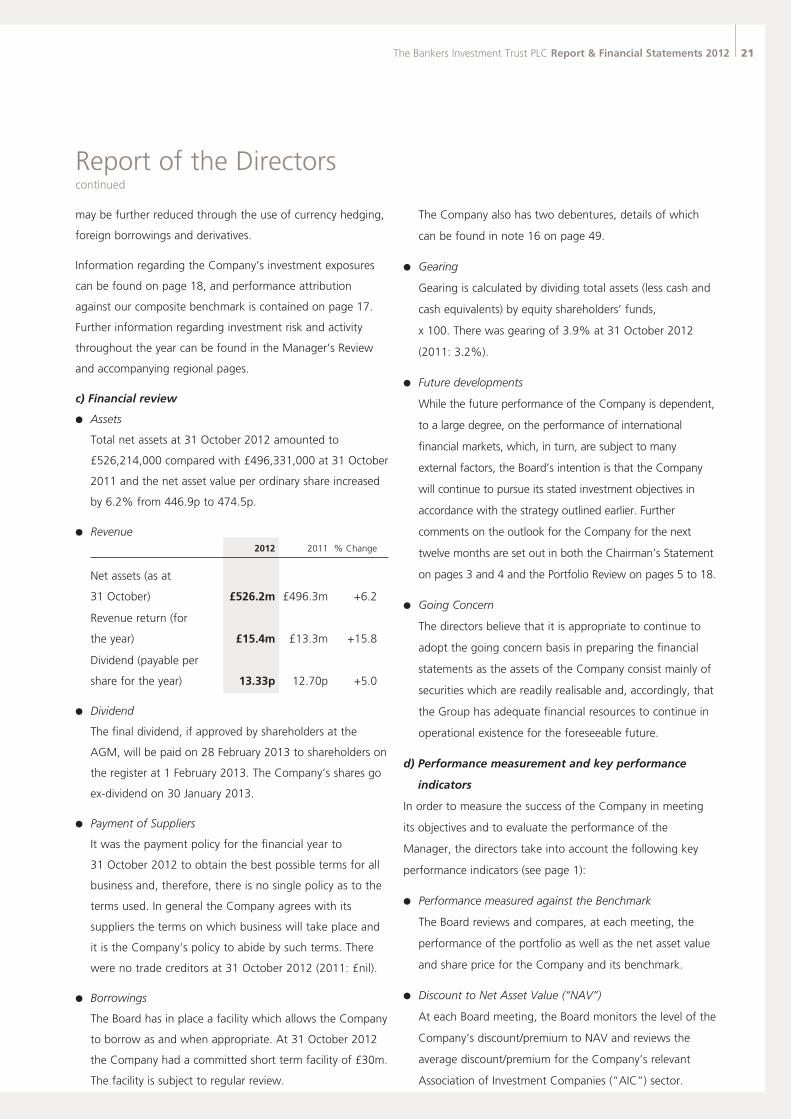
l Revenue 2012 2011 % Change
Net assets (as at
31 October) £526.2m £496.3m +6.2
Revenue return (for
the year) £15.4m £13.3m +15.8
Dividend (payable per
share for the year) 13.33p 12.70p +5.0
l Dividend
The final dividend, if approved by shareholders at the
AGM, will be paid on 28 February 2013 to shareholders on
the register at 1 February 2013. The Company’s shares go
ex-dividend on 30 January 2013.
l Payment of Suppliers
It was the payment policy for the financial year to
31 October 2012 to obtain the best possible terms for all
business and, therefore, there is no single policy as to the
terms used. In general the Company agrees with its
suppliers the terms on which business will take place and
it is the Company’s policy to abide by such terms. There
were no trade creditors at 31 October 2012 (2011: £nil).
l Borrowings
The Board has in place a facility which allows the Company
to borrow as and when appropriate. At 31 October 2012
the Company had a committed short term facility of £30m.
The facility is subject to regular review.
67899_Hendersons-TEXT.indd 21 17/01/2013 14:18
22 The Bankers Investment Trust PLC Report & Financial Statements 2012
Report of the Directorscontinued
The Board considers the use of share buy-backs to enhance
shareholder value. During the year 145,000 shares were
purchased. The Company publishes a NAV per share figure
on a daily basis through the official newswire of the
London Stock Exchange. This figure is calculated in
accordance with the AIC formula.
l Performance against the Company’s peer group
In addition to comparison against the benchmark and
various indices, the Board also considers the performance
of its AIC peer group at each Board meeting.
l Ongoing Charges
The ongoing charges are a measure of the total expenses
incurred by the Company, including those charged to
capital, expressed as a percentage of the average
shareholders’ funds over the year. The ongoing charges,
before borrowing costs, amounted to 0.42% (2011:
0.40%) of the assets of the Company. No performance fee
was paid during the year. The Board regularly reviews the
ongoing charges and monitors all Company expenses.
e) Related party transactions
Other than the relationship between the Company and its
Directors, the provision of services by Henderson is the only
related party arrangement currently in place. Other than the
fees payable by the Company in the ordinary course of
business there have been no material transactions with this
related party which has affected the financial position or
performance of the Company in the financial year.
f) Custody arrangements
Global custody services are provided by BNP Paribas Securities
Services.
g) Management arrangements
Investment management, accounting, company secretarial
and administrative services are provided to the Group by
wholly owned subsidiary companies of Henderson Group plc
(”Henderson“). Under the terms of the management contract:
To 31 December 2012 the basic annual management fee was
0.30% per annum of the average gross assets on the last day
of October of the preceding two years.
The Manager was eligible for a fee based on the degree of
outperformance, calculated on the basis of the average net
asset value total return over a rolling three year period
compared to a composite index representing in equal
proportions the FTSE All-Share Index and the FTSE World
(ex UK) Index.
The payment of a performance fee was subject to an
outperformance hurdle rate of 1.5% per annum.
For the first 1% of outperformance in excess of the hurdle
rate, a performance fee of 0.15% of average gross assets
was paid, and in respect of each further 1% of
outperformance, a fee of a further 0.2% of average gross
assets up to a maximum performance fee in any one year of
0.55% of average gross assets, so that the maximum total fee
payable in any one year was 0.85% of average gross assets.
No performance fee was paid if either the Company’s net
asset value or its share price was lower at the end of the
financial year than at the end of the previous financial year.
No performance fee was paid if in any financial year
distributable income plus revenue reserves was lower than the
gross dividends payable in the previous financial year. No
performance fee was payable in respect of the year ended
31 October 2012 (last paid in 2007).
From 1 January 2013, the Company has simplified its fee
arrangements by abolishing the performance fee and
increasing the management fee rate. For the period 1 January
2013 to 31 October 2013 the management fee will be
charged at a rate of 0.40% of the average value of net assets
on the last day of October in each of the two preceding years
(following regulatory approval). Subject to Henderson’s overall
performance and the Board’s approval, from 1 November
2013 the management fee rate will increase to 0.45%.
The notice period for termination of the management
contract is six months.
During the year under review the Manager used certain
services which were provided by or paid for by various
brokers. In return it placed business, which may have included
transactions relating to the Company, with these brokers.
67899_Hendersons-TEXT.indd 22 17/01/2013 14:01
Report of the Directorscontinued
The Bankers Investment Trust PLC Report & Financial Statements 2012 23
h) Principal risks and uncertainties
The Board has drawn up a matrix of risks facing the Company
and has put in place a schedule of investment limits and
restrictions, appropriate to the Company’s investment
objectives and policy, in order to mitigate these risks as far as
practicable. The principal risks which have been identified and
the steps taken by the Board to mitigate these are as follows:
l Portfolio and market
Although the Company invests almost entirely in securities
that are quoted on recognised markets, share prices may
move sharply. The companies in which investments are
made may operate unsuccessfully, or fail entirely. A fall in
the market value of the Company’s portfolio would have
an adverse effect on shareholders’ funds. The Board
reviews the portfolio each month and mitigates this risk
through diversification of investments in the portfolio.
l Investment activity and performance
An inappropriate investment strategy (for example, in
terms of asset allocation or the level of gearing) may result
in underperformance against the Company’s benchmark
index and the companies in its peer group. The Board
monitors investment performance at each Board meeting
and regularly reviews the extent of its borrowings.
l Tax and regulatory risks
A breach of Section 1158 of the Corporation Tax Act 2010
could lead to a loss of investment trust status, resulting in
capital gains realised within the portfolio being subject to
corporation tax. A breach of the UKLA Listing Rules could
result in suspension of the Company’s shares, while a
breach of the Companies Act 2006 could lead to criminal
proceedings, or financial or reputational damage. The
Company must also ensure compliance with the listing
rules of the New Zealand Stock Exchange. The Manager
has contracted to provide investment, company secretarial,
administration and accounting services through qualified
professionals. The Board receives internal control reports
produced by the Manager on a quarterly basis, which
confirmed regulatory compliance during the year.
l Financial
By its nature as an investment trust, the Company’s
business activities are exposed to market risk (including
market price risk, currency risk and interest rate risk),
liquidity risk, and credit and counterparty risk. Details of
these risks and how they are managed are contained in
Note 17 to the Financial Statements on pages 49 to 57.
l Operational
Disruption to, or failure of, the Manager’s accounting,
dealing or payment systems or the custodian’s records
could prevent the accurate reporting and monitoring of the
Company’s financial position. The Company is also exposed
to the operational risk that one or more of its suppliers
may not provide the required level of service. Details of
how the Board monitors the services provided by the
Manager and its other suppliers, and the key elements
designed to provide effective internal control, are explained
further in the internal controls section on pages 28 and 29.
Corporate Governance Statement
a) Application of the AIC Code’s Principles
The Board is accountable to shareholders for the governance
of the Company’s affairs. Paragraph 9.8.6 of the UK Listing
Rules requires all listed companies to disclose how they have
applied the principles and complied with the provisions of the
UK Corporate Governance Code (the “UK Code”). As an
investment trust, most of the Company’s day-to-day
responsibilities are delegated to third parties, the Company
has no employees and the directors are all non-executive.
Thus, not all the provisions of the UK Code are directly
applicable to the Company.
The Financial Reporting Council (the “FRC”) confirmed in
September 2010 that it remained the view of the FRC that by
following the Corporate Governance Guide for Investment
Companies produced by the Association of Investment
Companies (the “AIC Guide”), boards of investment
companies should fully meet their obligations in relation to
the UK Code and paragraph 9.8.6 of the Listing Rules. The
AIC Code of Corporate Governance (the “AIC Code”), as
explained by the AIC Guide, addresses all the principles set
out in the UK Code, as well as setting out additional principles
and recommendations on issues that are of specific relevance
to investment trusts.
67899_Hendersons-TEXT.indd 23 17/01/2013 19:27
24 The Bankers Investment Trust PLC Report & Financial Statements 2012
Report of the Directorscontinued
The Board of The Bankers Investment Trust PLC believes that
reporting against the AIC Code by reference to the AIC
Guide provides the most appropriate information to
shareholders and has therefore followed the principles and
recommendations set out in the AIC Code. Copies of the AIC
Code and the AIC Guide can be found on
www.theaic.co.uk.
The directors believe that this Annual Report and Financial
Statements presents a balanced and understandable
assessment of the Company’s position and prospects.
b) New Zealand Listing
It should be noted that the UK Codes of Corporate
Governance may materially differ from the New Zealand Stock
Exchange’s corporate governance rules and principles of the
Corporate Best Practice Code.
c) Statement of compliance
The AIC Code comprises 21 principles. The Board attaches
importance to the matters set out in the AIC Code and lists
below how the AIC Code’s principles have been applied.
The directors believe that during the year under review they
have complied with the provisions of the AIC Code, and
insofar as they apply to the Company’s business, with the
provisions of the UK Code except as noted below.
l The role of chief executive
Since all directors are non-executive and day-to-day
management responsibilities are sub-contracted to the
Manager, the Company does not have a Chief Executive.
l Executive directors’ remuneration
As the Board has no executive directors, it is not required
to comply with the principles of the UK Code in respect of
executive directors’ remuneration and does not have a
Remuneration Committee. Directors’ fees are detailed in
the Directors’ Remuneration Report on page 32.
l Internal audit function
As the Company delegates to third parties its day-to-day
operations and has no employees, the Board has
determined that there is no requirement for an internal
audit function. The directors annually review whether a
function equivalent to an internal audit is needed and will
continue to monitor its systems of internal controls in order
to provide assurance that they operate as intended.
d) Directors
l Board composition
The Board currently consists of six directors, all of whom are
non-executive.
The names and biographies of the directors holding office
at the date of this report are listed on page 19. With the
exception of Susan Inglis, who joined the Board on
1 November 2012, all the current directors served on the
Board throughout the financial year.
l Directors’ appointment, retirement and rotation
The Board may appoint directors to the Board without
shareholder approval. Any director so appointed must
stand for appointment by the shareholders at the next
AGM in accordance with the articles of association.
The total number of directors shall not be less than three
nor more than eight.
Under the articles of association, shareholders may remove
a director before the end of his or her term by passing a
special resolution. A special resolution is passed if more
than 75 per cent of the votes cast, in person or by proxy,
are in favour of the resolution.
The Company’s articles of association provide that one
third of directors retire by rotation each year. Directors are
also required to retire if they have served more than nine
years on the Board, but may then offer themselves for
annual re-appointment. Notwithstanding these
requirements, the UK Code requires all directors of FTSE
350 Companies to retire annually. Therefore all the
directors will retire at the forthcoming AGM and, being
eligible, offer themselves for re-appointment.
l Board independence and tenure policy
The Board is conscious of the need to maintain continuity
on the Board, and believes that retaining directors with
67899_Hendersons-TEXT.indd 24 17/01/2013 19:27
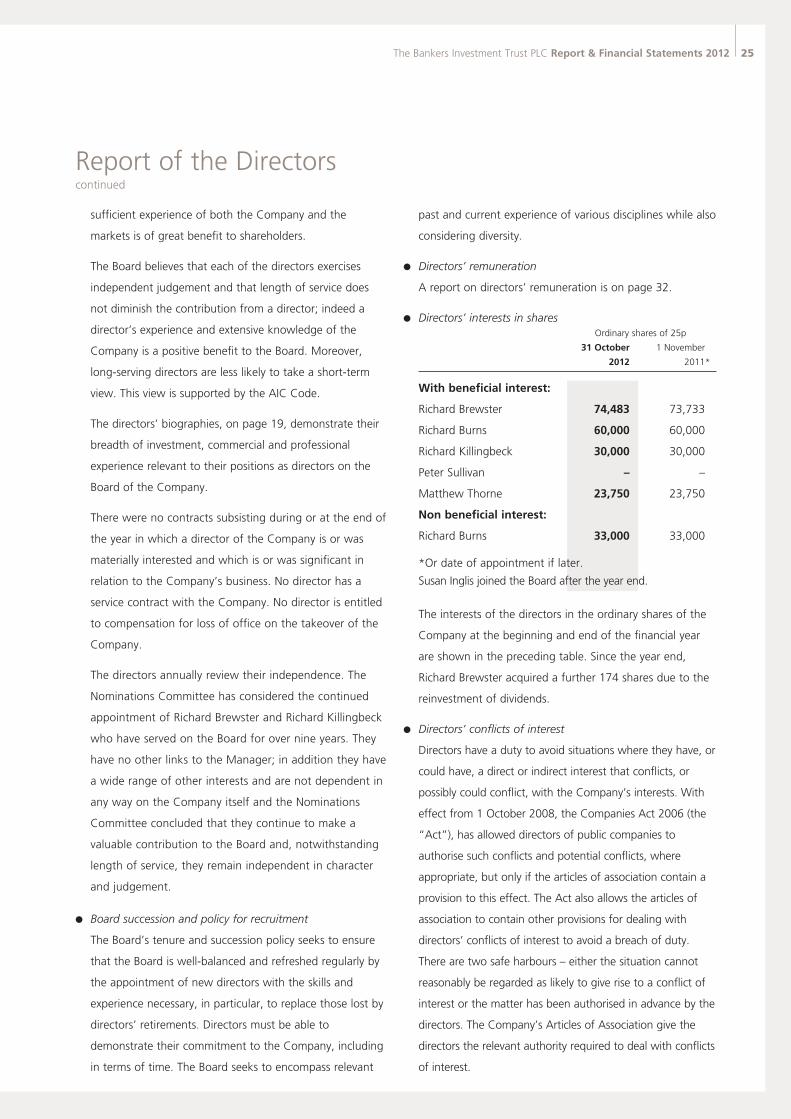
The Bankers Investment Trust PLC Report & Financial Statements 2012 25
Report of the Directorscontinued
sufficient experience of both the Company and the
markets is of great benefit to shareholders.
The Board believes that each of the directors exercises
independent judgement and that length of service does
not diminish the contribution from a director; indeed a
director’s experience and extensive knowledge of the
Company is a positive benefit to the Board. Moreover,
long-serving directors are less likely to take a short-term
view. This view is supported by the AIC Code.
The directors’ biographies, on page 19, demonstrate their
breadth of investment, commercial and professional
experience relevant to their positions as directors on the
Board of the Company.
There were no contracts subsisting during or at the end of
the year in which a director of the Company is or was
materially interested and which is or was significant in
relation to the Company’s business. No director has a
service contract with the Company. No director is entitled
to compensation for loss of office on the takeover of the
Company.
The directors annually review their independence. The
Nominations Committee has considered the continued
appointment of Richard Brewster and Richard Killingbeck
who have served on the Board for over nine years. They
have no other links to the Manager; in addition they have
a wide range of other interests and are not dependent in
any way on the Company itself and the Nominations
Committee concluded that they continue to make a
valuable contribution to the Board and, notwithstanding
length of service, they remain independent in character
and judgement.
l Board succession and policy for recruitment
The Board’s tenure and succession policy seeks to ensure
that the Board is well-balanced and refreshed regularly by
the appointment of new directors with the skills and
experience necessary, in particular, to replace those lost by
directors’ retirements. Directors must be able to
demonstrate their commitment to the Company, including
in terms of time. The Board seeks to encompass relevant
past and current experience of various disciplines while also
considering diversity.
l Directors’ remuneration
A report on directors’ remuneration is on page 32.
l Directors’ interests in shares Ordinary shares of 25p
31 October 1 November
2012 2011*
With beneficial interest:
Richard Brewster 74,483 73,733
Richard Burns 60,000 60,000
Richard Killingbeck 30,000 30,000
Peter Sullivan – –
Matthew Thorne 23,750 23,750
Non beneficial interest:
Richard Burns 33,000 33,000
*Or date of appointment if later.
Susan Inglis joined the Board after the year end.
The interests of the directors in the ordinary shares of the
Company at the beginning and end of the financial year
are shown in the preceding table. Since the year end,
Richard Brewster acquired a further 174 shares due to the
reinvestment of dividends.
l Directors’ conflicts of interest
Directors have a duty to avoid situations where they have, or
could have, a direct or indirect interest that conflicts, or
possibly could conflict, with the Company’s interests. With
effect from 1 October 2008, the Companies Act 2006 (the
“Act”), has allowed directors of public companies to
authorise such conflicts and potential conflicts, where
appropriate, but only if the articles of association contain a
provision to this effect. The Act also allows the articles of
association to contain other provisions for dealing with
directors’ conflicts of interest to avoid a breach of duty.
There are two safe harbours – either the situation cannot
reasonably be regarded as likely to give rise to a conflict of
interest or the matter has been authorised in advance by the
directors. The Company’s Articles of Association give the
directors the relevant authority required to deal with conflicts
of interest.
67899_Hendersons-TEXT.indd 25 17/01/2013 19:27
26 The Bankers Investment Trust PLC Report & Financial Statements 2012
Report of the Directorscontinued
Each of the directors has provided a statement of all conflicts
of interest and potential conflicts of interest applicable to
the Company. A register of conflicts of interest has been
compiled and approved by the Board. The directors have
also all undertaken to notify the Chairman as soon as they
become aware of any new potential conflicts of interest that
would need to be approved by the Board and added to the
register, which will be reviewed annually by the Board.
The directors advise the Chairman and the Company
Secretary in advance of any proposed external appointment
and new directors will be asked to submit a list of potential
situations falling within the conflicts of interest provisions
of the Act in advance of joining the Board. The Chairman
determines whether the relevant appointment causes a
conflict or potential conflict of interest and should
therefore be considered by the Board.
Only directors who have no interest in the matter being
considered are able to participate in the Board approval
process. In deciding whether to approve a conflict of
interest, directors act in a way they consider, in good faith,
will be most likely to promote the Company’s success in
taking such a decision. The Board can impose limits or
conditions when giving authorisation if the directors
consider this to be appropriate.
The Board has reviewed its conflicts of interest procedures
during the year and confirms that its powers of authorisation
of conflicts has operated effectively since they were
introduced on 1 October 2008 and that its procedures for
the approval of conflicts of interest have been followed by
all the directors.
l Directors’ professional development
When a new director is appointed he or she is offered a
training seminar which is held by the Manager. Directors
are also provided on a regular basis with key information
on the Company’s activities including regulatory and
statutory requirements and internal controls. Changes
affecting directors’ responsibilities are advised to the Board
as they arise. Directors also regularly participate in relevant
training and industry seminars.
l Directors’ indemnity
Directors’ and officers’ liability insurance cover is in place in
respect of the directors. The Company’s articles of
association provide, subject to the provisions of UK
legislation, an indemnity for directors in respect of costs
which they may incur relating to the defence of any
proceedings brought against them arising out of their
positions as directors, in which they are acquitted or
judgement is given in their favour by the Court.
e) The Board
l Chairman
The Chairman, Richard Brewster, is an independent non-
executive director who has no conflicting relationships.
l Senior Independent Director
Richard Killingbeck is the Senior Independent Director.
l Responsibilities of the Board and its Committees
The Board has appointed a number of Committees as set out
below. Copies of the terms of reference which clearly define
the responsibilities and duties for each Committee are
available on the website, www.bankersinvestmenttrust.com,
or on request and will be available for inspection at the AGM.
l Audit Committee
The Audit Committee comprises Matthew Thorne, Richard
Killingbeck, Peter Sullivan and Susan Inglis, all of whom are
considered independent. The Chairman of the Audit
Committee is Matthew Thorne. The Board has satisfied
itself that at least one of the Committee’s members has
recent and relevant financial experience and the directors
biographies are shown on page 19. The Committee has
written terms of reference, which clearly define its
responsibilities and duties.
The Committee meets at least three times each year to review
the internal financial and non-financial controls, to consider
and recommend to the Board for approval the contents of
the Half-Year and Annual Report & Financial Statements to
shareholders and to review the accounting policies and
significant financial reporting judgements. Representatives of
the Manager’s internal audit and compliance departments
attend these meetings at the Chairman’s request. In addition,
the Committee reviews the auditors’ independence,
67899_Hendersons-TEXT.indd 26 17/01/2013 19:27
The Bankers Investment Trust PLC Report & Financial Statements 2012 27
Report of the Directorscontinued
objectivity and effectiveness, appointment and remuneration
(see note 6 on page 44), the quality of the services of the
service providers to the Company, and, together with the
Manager, reviews the Company’s compliance with financial
reporting and regulatory requirements. From 30 April 2011,
audit committees have been required to formulate a written
policy on the provision of non-audit services by the
Company’s statutory independent auditors. The Audit
Committee has formulated a policy on the provision of non-
audit services by the Company’s auditors and has determined
that the Company’s appointed auditors will not be
considered for the provision of non-audit services, such as
accounting and preparation of the financial statements,
internal audit and custody. The auditors may, if required,
provide non-audit services relating to a review of the
Company’s half year report and a review of the calculation of
any performance fee provision. All other non-audit services
will be judged on a case-by-case basis.
During the year the Company engaged
PricewaterhouseCoopers in Taiwan for tax compliance
services in respect of the Taiwanese investments as
required by the law in Taiwan. The directors have ensured
that the provision of this non-audit service did not impact
the independence of the audit. There were no other non-
audit services provided by the auditors during the year.
The Audit Committee remains satisfied with the
effectiveness of the audit provided by
PricewaterhouseCoopers LLP, the Company’s auditors, and
therefore has not considered it necessary to date to require
an independent tender process. This year’s audit is the
second year that the current audit partner has been in place.
Representatives of PricewaterhouseCoopers LLP attend the
Committee meeting at which the Annual Report and
Financial Statements are reviewed and are given the
opportunity to speak to the Committee members without
the presence of the representatives of the Manager.
The Chairman of the Audit Committee will be present
at the AGM to deal with questions relating to the
Financial Statements.
l Management Engagement Committee
The Management Engagement Committee’s membership
comprises all the members of the Board. The Chairman of
the Committee is Richard Brewster. The Committee meets
at least annually to review the investment management
agreement with the Company’s Manager and to review
the services provided by the Manager.
l Nominations Committee
The Nominations Committee comprises Richard Brewster,
Richard Killingbeck and Peter Sullivan. The Chairman
of the Nominations Committee is Richard Brewster. The
Committee, which meets at least annually, reviews the
Board’s size and structure and is responsible for Board
succession planning. The other members of the Board may
attend meetings of the Nominations Committee by invitation.
l Charities Committee
The Charities Committee was dissolved during 2011 and
any requests for charitable donations are considered by the
Board. During the year no donations were made (2011:
£1,500).
l Board attendance
Currently, the Board meets seven times per annum and is
responsible for the effective stewardship of the Company’s
affairs. Certain strategic issues have been considered at
various meetings of the Board and additional meetings of
the Board may be arranged as required. The Board has a
formal schedule of matters specifically reserved for its
decision which are categorised under various headings
including strategy, management, structure, capital,
financial reporting, internal controls, gearing, asset
allocation, share price discount, contracts, policy, finance,
risk, investment restrictions, performance, corporate
governance and Board membership and appointments. In
order to enable them to discharge their responsibilities, all
directors have full and timely access to relevant
information. At each meeting, the Board reviews the
Company’s investment performance and considers financial
analyses and other reports of an operational nature. The
Board monitors compliance with the Company’s objectives
and is responsible for setting asset allocation parameters,
67899_Hendersons-TEXT.indd 27 17/01/2013 19:27
28 The Bankers Investment Trust PLC Report & Financial Statements 2012
Report of the Directorscontinued
investment and gearing limits within which the Manager
has discretion to act. The Board thus supervises the
management of the investment portfolio, which is
contractually delegated to the Manager. The Board has
responsibility for the approval of unquoted investments
and all investments in in-house funds managed or advised
by the Manager. It also has adopted a procedure for
directors, in the furtherance of their duties, to take
independent professional advice at the expense of the
Company.
The Chairman attends meetings of all the chairmen of the
investment trust companies managed by the Manager; these
meetings provide a forum to discuss a variety of relevant
matters and the Chairman reports on them to the Board.
The number of meetings of the Board and its Committees
held during the year and the attendance of individual
directors are shown below. All directors attend the Annual
General Meeting.
Management
Audit Nominations Engagement
Board Committee Committee Committee
No. of meetings 7 3 1 1
Richard Brewster 7 n/a 1 1
Richard Burns 6 n/a n/a 1
Richard Killingbeck 7 3 1 1
Matthew Thorne 7 3 n/a 1
Peter Sullivan 7 3 1 1
The membership of each Committee is shown on page 19.
f) Performance evaluation
l The Company
The performance of the Company is considered in detail at
each Board meeting.
l The Board
In order to review the effectiveness of the Board, the
Committees and the individual directors, the Chairman has
put in place and carried out a thorough appraisal process.
This was implemented by way of a questionnaire and
interviews with the Chairman. In respect of the Chairman,
interviews were held between the directors and the Senior
Independent Director. The process is considered by the
Board to be constructive in terms of identifying areas for
improving the functioning and performance of the Board
and the Committees, the contribution of individual
directors, as well as building on and developing individual
and collective strengths. In accordance with the UK Code,
the Company is required to engage an external facilitator
for the Board evaluation every three years and will do so
during 2013. The evaluation for the year under review was
conducted internally.
The Board has direct access to company secretarial advice
and services provided by the Manager which, through its
nominated representative, is responsible for ensuring that
the Board and Committee procedures are followed and
that applicable regulations are complied with. During the
year the Company has maintained insurance cover in
respect of legal action against the directors; this does not
cover fraud, negligence or wilful default.
g) Internal controls
The Board has overall responsibility for the Company’s systems
of internal controls and for reviewing their effectiveness.
These controls aim to ensure that assets of the Company are
safeguarded, proper accounting records are maintained, and
the financial information used within the business and for
publication is reliable. Control of the risks identified, covering
financial, operational, compliance and risk management, is
embedded in the controls of the Company by a series of
regular investment performance and attribution statements,
financial and risk analyses and Manager’s reports, and a
quarterly control report. Key risks have been identified and
controls have been put in place to mitigate such risks,
including those risks that are not directly the responsibility of
the Manager. The effectiveness of the internal controls is
assessed by the Manager’s compliance and risk departments
on a continuing basis and is also reviewed by the Company.
The Manager and the custodian maintain their own systems of
internal controls and the Board and Audit Committee receive
regular reports from the Manager. The control systems are
designed to provide reasonable, but not absolute, assurance
against material misstatement or loss, and to manage rather
than eliminate risk of failure to achieve objectives.
67899_Hendersons-TEXT.indd 28 17/01/2013 19:27
The Bankers Investment Trust PLC Report & Financial Statements 2012 29
Report of the Directorscontinued
The Board has established an ongoing process for identifying,
evaluating and managing any major risks faced by the
Company. The process has been in place since 2000 and is
subject to regular review by the Board. Up to the date of this
report, the process accords with the Turnbull Guidance.
The Board, assisted by the Manager, has undertaken an
annual review of the effectiveness of the Company’s system
of internal control and the business risks have been analysed
and recorded in a risk map which is reviewed regularly. The
Board receives each quarter from the Manager a formal report
which details the steps taken to monitor the areas of risk,
including those that are not directly the responsibility of the
Manager, and which reports the details of any known internal
control failures. The Board receives each year from the
Manager a report on its internal controls which includes a
report from the Manager’s reporting accountants on the
control policies and procedures in operation.
The Board confirms that in the event of any significant failings
or weakness identified from the annual review of the
effectiveness of the Company’s system of internal control,
necessary actions would be taken to remedy them. No
significant failings or weaknesses in respect of the Company
were identified in the year under review.
h) Accountability and relationship with the Manager
The Statement of Directors’ Responsibilities in respect of the
Financial Statements is set out on page 33, the Report of the
Independent Auditors on page 61 and the Statement of
Going Concern on page 21.
The Board has delegated contractually to the Manager and
other external third parties the management of the
investment portfolio, the custodial services (which include the
safeguarding of the assets) and the day-to-day accounting,
company secretarial, administration and registration services.
Each of these contracts was entered into after full and proper
consideration by the Board of the quality and cost of the
services offered, including the control systems in operation in
so far as they relate to the affairs of the Company.
The Board receives and considers regular reports from the
Manager and ad hoc reports and information are supplied to
the Board as required.
The Board has reviewed the implications of the Bribery Act
2010, which came into force on 1 July 2011 and confirmed its
zero tolerance of bribery and corruption in its business activities.
It has sought and received assurances from its main contractors
and suppliers that they will maintain adequate safeguards to
protect against any potentially illegal behaviour by their
employees and agents.
i) Continued appointment of the Investment Manager
The Board reviews the performance of the Investment Manager
(Manager) at each Board meeting and the Management
Engagement Committee meets annually to review the
continuing appointment of the Manager. In the opinion of the
Directors the continued appointment of the Manager on the
terms agreed is in the best interests of the Company’s
shareholders as a whole. The Manager has extensive investment
management resources and wide experience in managing and
administering investment companies.
j) Share capital and shareholders
l Share capital
At 31 October 2012 the Company had in issue 110,906,839
ordinary shares of 25p each. The voting rights of the ordinary
shares on a poll are one vote for every four shares held. There
are no restrictions on the transfer of the Company’s shares
and there are no shares which carry specific rights with
regard to control of the Company. The market price per share
at that date was 433.1p, giving the Company a market
capitalisation of £480.3 million. Total equity was £526.2
million, the net asset value per share at that date being
474.5p per share (inclusive of retained revenue for the year).
Accordingly, the market price per share stood at a discount of
8.7% to the net asset value (inclusive of retained revenue for
the year). The Company seeks shareholder authority annually
to buy back its shares in the market for cancellation. During
the year the Company bought back 145,000 of its ordinary
shares (representing 0.1% of the called-up share capital as at
31 October 2012) at an average discount of 13.4% for a
total consideration of £594,000.
Since the end of the year and the date of this report no
further ordinary shares have been bought back by the
Company.
67899_Hendersons-TEXT.indd 29 17/01/2013 19:27
30 The Bankers Investment Trust PLC Report & Financial Statements 2012
Report of the Directorscontinued
l Substantial share interests
Declarations of interests in the voting rights of the
Company, at 31 October 2012, are set out below.
Shareholder % of voting rights
Investec Wealth & Investment Management 8.4
F&C Asset Management 5.0
Since the year end, no changes in substantial share interests
have been notified to the Company.
In addition, the Board is aware that, at 31 October 2012,
13.7% of the issued share capital was held on behalf of
participants in the Halifax Share Dealing products run by
Halifax Share Dealing Limited (“HSDL”), which is now part
of Lloyds Banking Group. In accordance with the
arrangements made between HSDL and Henderson, the
participants in the Halifax Share Dealing products are given
the opportunity to instruct the nominee company of HSDL to
exercise the voting rights appertaining to their shares in
respect of all general meetings of the Company. HSDL has
undertaken to instruct its nominee company to exercise the
voting rights of any shares held through the Halifax Share
Dealing products that have not been exercised by the
individual participants in them. It will do so by voting for or
against all resolutions to be put at all general meetings of
the Company (or by withholding votes on such resolutions)
pro rata to the aggregate voting instructions for each
resolution received from those participants who have
chosen to exercise their voting rights.
l Relations with shareholders
Shareholder relations are given high priority by both the
Board and the Manager. The prime medium by which the
Company communicates with shareholders is through the
Half-Year and Annual Report and Financial Statements which
aim to provide shareholders with a clear understanding of
the Company’s activities and their results. This information is
supplemented by the daily calculation and by the publication
at the Stock Exchange of the net asset value (NAV) of the
Company’s ordinary shares and a monthly fact sheet.
Information about the Company can be found at
www.bankersinvestmenttrust.com
At each AGM a presentation is made by the Manager
following the business of the meeting. Shareholders have
the opportunity to address questions to the Chairman and
the Chairmen of the Committees of the Board at the AGM.
All shareholders are encouraged to attend the AGM.
It is the intention of the Board that the Annual Report and
Financial Statements and Notice of the AGM be issued to
shareholders so as to provide at least twenty working days’
notice of the AGM. Shareholders wishing to lodge
questions in advance of the AGM are invited to do so by
writing to the Company Secretary at the address given on
the inside back cover. At other times the Company
responds to letters from shareholders on a range of issues.
General presentations to both shareholders and analysts
follow the announcement of the annual results. All
meetings between the Manager and shareholders are
reported to the Board.
k) Corporate responsibility
l Responsible investment (SEE statement)
Responsible Investment is the term Henderson uses to cover
its work on corporate governance and corporate
responsibility (or social, environmental and ethical issues) in
the companies in which it invests on its clients’ behalf,
across all funds. In May 2005 Henderson became a founding
signatory to the United Nations Principles for Responsible
Investment. The Principles, developed under the auspices of
the UN Secretary-General, are a voluntary and aspirational
framework for incorporating environmental, social and
corporate governance issues into mainstream investment
decision-making and ownership practices.
The way companies respond to sustainability and corporate
responsibility can affect their business performance, both
directly and indirectly. An investee company’s policy on
social responsibility and the environment is therefore
considered as part of the investment risk decision.
l Voting policy
Henderson’s Responsible Investment Policy sets out the
Manager’s approach to corporate governance and corporate
responsibility for all the companies in which it invests on
behalf of its clients, and its policy on proxy voting. The Policy
67899_Hendersons-TEXT.indd 30 17/01/2013 19:27
The Bankers Investment Trust PLC Report & Financial Statements 2012 31
Report of the Directorscontinued
also sets out how Henderson implements the Stewardship
Code. The Company has delegated responsibility for voting
to the Manager. The Board will receive a report, at least
annually, on the voting undertaken by the Manager on
behalf of the Company.
The Board and Henderson believe that voting at general
meetings is an important aspect of corporate stewardship
and a means of signalling shareholder views on Board
policy, practices and performance. Voting recommendations
are guided by the best interests of the investee companies’
shareholders. Depending on the nature of the resolution,
the Portfolio Manager and/or members of the Board will
give specific instructions on voting non-routine and unusual
or controversial resolutions. Decisions not to support
resolutions and the rationale therefore are fed back to
the investee company prior to voting.
The Henderson Responsible Investment Policy and further
details of Henderson’s responsible investment activities can
be found on the Henderson website, www.henderson.com
l Employee and environmental matters
The Company’s has no employees and outsources its
investment management and Company Secretarial Services
to subsidiaries of Henderson. Henderson has implemented
environmental management practices including systems to
limit the use of non-renewable resources and to minimise the
impact of operations on the environment. Henderson is
focused on reducing greenhouse gas emissions and
minimising waste, where possible.
Annual General Meeting (“AGM”)
The AGM will be held on 26 February 2013 at 12 noon.
Separate resolutions will be proposed for each substantive issue.
The formal notice of the AGM as well as full details of the
resolutions to be put at the AGM are contained in the separate
circular being sent to shareholders with this Annual Report.
PricewaterhouseCoopers LLP have indicated their willingness
to continue in office. Accordingly, resolutions to re-appoint
PricewaterhouseCoopers LLP as auditors to the Company, and
to authorise the directors to determine their remuneration will
be proposed at the AGM.
Directors’ Statement as to Disclosure of Information
to Auditors
The Directors who were members of the Board at the time of
approving this Report are listed on page 19. Each of those
Directors confirms that:
l to the best of his or her knowledge and belief, there is no
information relevant to the preparation of the Annual
Report and Financial Statements of which the Company’s
auditors are unaware; and
l he or she has taken all the steps a Director might
reasonably be expected to have taken to be aware of
relevant audit information and to establish that the
Company’s auditors are aware of that information.
By order of the Board
Wendy King FCIS
For and on behalf of Henderson Secretarial Services Limited
Secretary
18 January 2013
Warning to Shareholders
Many companies have become aware that their shareholders have received unsolicited phone calls or
correspondence concerning investment matters. These are typically from overseas based ‘brokers’ who target
UK shareholders offering to sell them what often turn out to be worthless or high risk shares in US or UK
investments. They can be very persistent and extremely persuasive. Shareholders are therefore advised to be
very wary of any unsolicited advice, offers to buy shares at a discount or offers of free company reports.
Please note that it is very unlikely that either the Company or the Company’s Registrar, Equiniti Limited, would
make unsolicited telephone calls to shareholders and that any such calls would relate only to official
documentation already circulated to shareholders and never in respect of investment ‘advice’.
If you are in any doubt about the veracity of an unsolicited phone call, please call either the Company Secretary
or the Registrar at the numbers provided on the inside back cover.
67899_Hendersons-TEXT.indd 31 17/01/2013 19:27
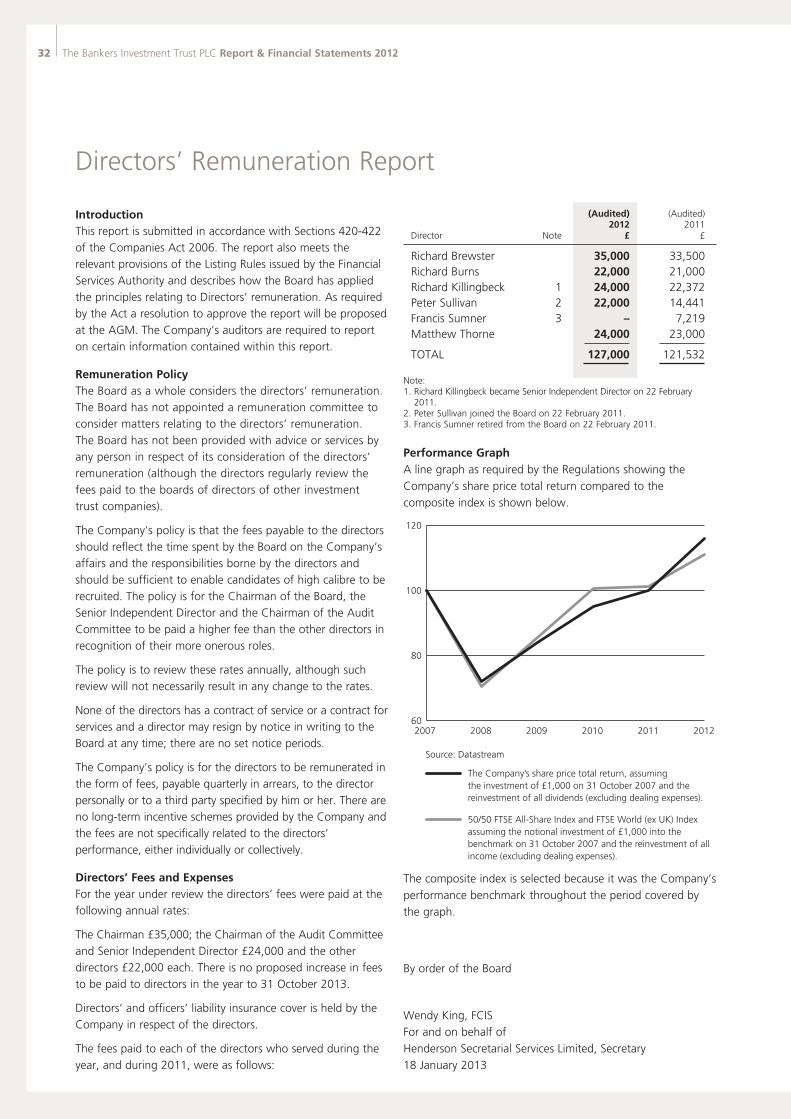
32 The Bankers Investment Trust PLC Report & Financial Statements 2012
Directors’ Remuneration Report
Introduction This report is submitted in accordance with Sections 420-422
of the Companies Act 2006. The report also meets the
relevant provisions of the Listing Rules issued by the Financial
Services Authority and describes how the Board has applied
the principles relating to Directors’ remuneration. As required
by the Act a resolution to approve the report will be proposed
at the AGM. The Company’s auditors are required to report
on certain information contained within this report.
Remuneration PolicyThe Board as a whole considers the directors’ remuneration.
The Board has not appointed a remuneration committee to
consider matters relating to the directors’ remuneration.
The Board has not been provided with advice or services by
any person in respect of its consideration of the directors’
remuneration (although the directors regularly review the
fees paid to the boards of directors of other investment
trust companies).
The Company’s policy is that the fees payable to the directors
should reflect the time spent by the Board on the Company’s
affairs and the responsibilities borne by the directors and
should be sufficient to enable candidates of high calibre to be
recruited. The policy is for the Chairman of the Board, the
Senior Independent Director and the Chairman of the Audit
Committee to be paid a higher fee than the other directors in
recognition of their more onerous roles.
The policy is to review these rates annually, although such
review will not necessarily result in any change to the rates.
None of the directors has a contract of service or a contract for
services and a director may resign by notice in writing to the
Board at any time; there are no set notice periods.
The Company’s policy is for the directors to be remunerated in
the form of fees, payable quarterly in arrears, to the director
personally or to a third party specified by him or her. There are
no long-term incentive schemes provided by the Company and
the fees are not specifically related to the directors’
performance, either individually or collectively.
Directors’ Fees and ExpensesFor the year under review the directors’ fees were paid at the
following annual rates:
The Chairman £35,000; the Chairman of the Audit Committee
and Senior Independent Director £24,000 and the other
directors £22,000 each. There is no proposed increase in fees
to be paid to directors in the year to 31 October 2013.
Directors’ and officers’ liability insurance cover is held by the
Company in respect of the directors.
The fees paid to each of the directors who served during the
year, and during 2011, were as follows:
(Audited) (Audited) 2012 2011 Director Note £ £
Richard Brewster 35,000 33,500Richard Burns 22,000 21,000Richard Killingbeck 1 24,000 22,372Peter Sullivan 2 22,000 14,441Francis Sumner 3 – 7,219Matthew Thorne 24,000 23,000 TOTAL 127,000 121,532
Note: 1. Richard Killingbeck became Senior Independent Director on 22 February
2011.2. Peter Sullivan joined the Board on 22 February 2011. 3. Francis Sumner retired from the Board on 22 February 2011.
Performance GraphA line graph as required by the Regulations showing the
Company’s share price total return compared to the
composite index is shown below.
The composite index is selected because it was the Company’s
performance benchmark throughout the period covered by
the graph.
By order of the Board
Wendy King, FCIS
For and on behalf of
Henderson Secretarial Services Limited, Secretary
18 January 2013
The Company’s share price total return, assumingthe investment of £1,000 on 31 October 2007 and thereinvestment of all dividends (excluding dealing expenses).
Source: Datastream
50/50 FTSE All-Share Index and FTSE World (ex UK) Index assuming the notional investment of £1,000 into the benchmark on 31 October 2007 and the reinvestment of all income (excluding dealing expenses).
60
80
100
120
2007 2008 2009 201220112010
67899_Hendersons-TEXT.indd 32 16/01/2013 21:00
The Bankers Investment Trust PLC Report & Financial Statements 2012 33
Statement of Directors’ Responsibilities in respect of the Annual Report, the Directors’ Remuneration Report and the Financial Statements
The directors are responsible for preparing the Annual
Report, the Directors’ Remuneration Report and the
Financial Statements in accordance with applicable law and
regulations.
Company law requires the directors to prepare financial
statements for each financial year. Under that law the
directors have prepared the Group and Parent Company
financial statements in accordance with International
Financial Reporting Standards (IFRSs) as adopted by the
European Union. Under company law the directors must
not approve the financial statements unless they are
satisfied that they give a true and fair view of the state of
affairs of the Group and the Company and of the profit or
loss of the Group for that period. In preparing these
financial statements, the directors are required to:
l select suitable accounting policies and then apply them
consistently;
l make judgements and accounting estimates that are
reasonable and prudent;
l state whether applicable IFRSs as adopted by the
European Union have been followed, subject to any
material departures disclosed and explained in the
financial statements; and
l prepare the financial statements on the going concern
basis unless it is inappropriate to presume that the Group
and Company will continue in business.
The directors are responsible for keeping adequate
accounting records that are sufficient to show and explain
the Group and Company’s transactions and disclose with
reasonable accuracy at any time the financial position of
the Company and the Group and enable them to ensure
that the financial statements and the Directors’
Remuneration Report comply with the Companies Act
2006 and, as regards the Group financial statements,
Article 4 of the IAS Regulation. They are also responsible
for safeguarding the assets of the Company and the Group
and hence for taking reasonable steps for the prevention
and detection of fraud and other irregularities.
Statement of Directors’ Responsibilities under
DTR 4.1.12
Each of the directors, who are listed on page 19, confirms
that, to the best of his or her knowledge:
l the Group financial statements, which have been
prepared in accordance with IFRSs as adopted by the
EU, give a true and fair view of the assets, liabilities,
financial position and profit of the Group; and
l the Report of the Directors in this Report and Financial
Statements includes a fair review of the development and
performance of the business and the position of the
Group and Company, together with a description of the
principal risks and uncertainties that it faces.
For and on behalf of the Board
Richard Brewster
Chairman
18 January 2013
The financial statements are published on the www.bankersinvestmenttrust.com website, which is a website maintained by
the Company’s Manager, Henderson Group plc (“Henderson”). The maintenance and integrity of the website maintained by
Henderson or any of its subsidiaries is, so far as it relates to the Company, the responsibility of Henderson. The work carried
out by the auditors does not involve consideration of the maintenance and integrity of this website and, accordingly, the
auditors accept no responsibility for any changes that have occurred to the financial statements since they were initially
presented on the website. Visitors to the website need to be aware that legislation in the United Kingdom governing the
preparation and dissemination of the financial statements may differ from legislation in other jurisdictions.
67899_Hendersons-TEXT.indd 33 16/01/2013 21:00
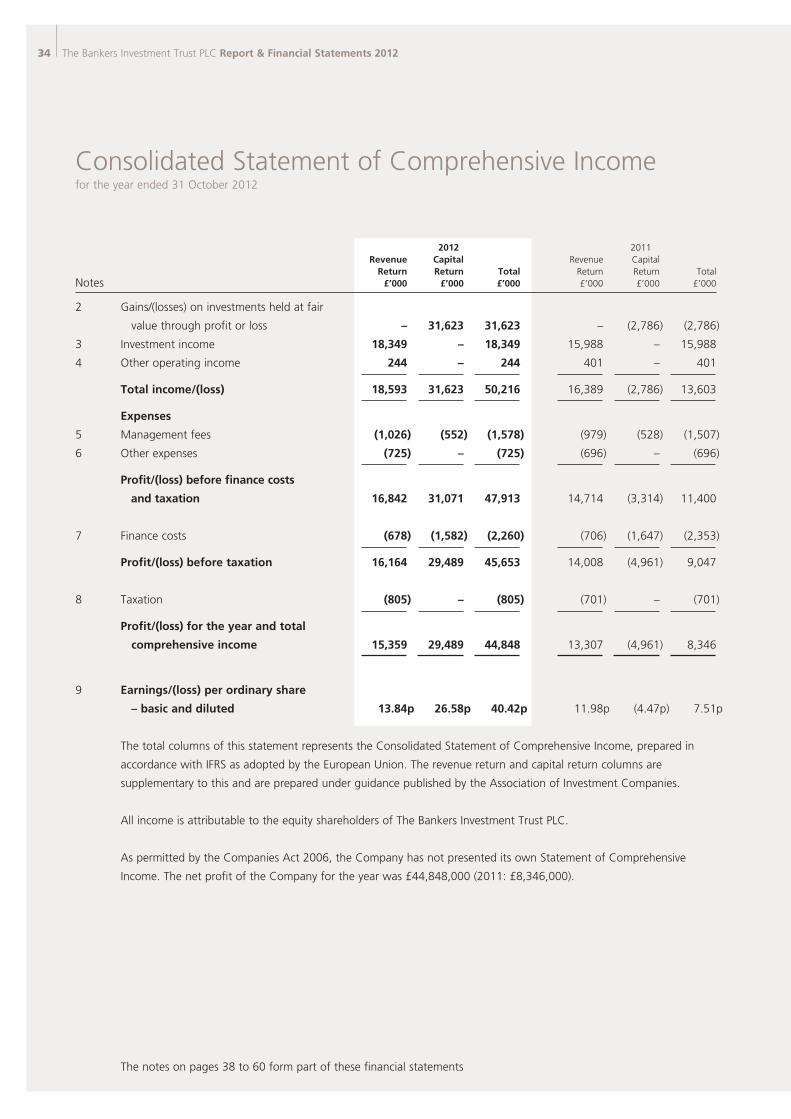
34 The Bankers Investment Trust PLC Report & Financial Statements 2012
Consolidated Statement of Comprehensive Incomefor the year ended 31 October 2012
The notes on pages 38 to 60 form part of these financial statements
2012 2011 Revenue Capital Revenue Capital Return Return Total Return Return Total Notes £’000 £’000 £’000 £’000 £’000 £’000
2 Gains/(losses) on investments held at fair
value through profit or loss – 31,623 31,623 – (2,786) (2,786)
3 Investment income 18,349 – 18,349 15,988 – 15,988
4 Other operating income 244 – 244 401 – 401
Total income/(loss) 18,593 31,623 50,216 16,389 (2,786) 13,603
Expenses
5 Management fees (1,026) (552) (1,578) (979) (528) (1,507)
6 Other expenses (725) – (725) (696) – (696)
Profit/(loss) before finance costs
and taxation 16,842 31,071 47,913 14,714 (3,314) 11,400
7 Finance costs (678) (1,582) (2,260) (706) (1,647) (2,353)
Profit/(loss) before taxation 16,164 29,489 45,653 14,008 (4,961) 9,047
8 Taxation (805) – (805) (701) – (701)
Profit/(loss) for the year and total
comprehensive income 15,359 29,489 44,848 13,307 (4,961) 8,346
9 Earnings/(loss) per ordinary share
– basic and diluted 13.84p 26.58p 40.42p 11.98p (4.47p) 7.51p
The total columns of this statement represents the Consolidated Statement of Comprehensive Income, prepared in
accordance with IFRS as adopted by the European Union. The revenue return and capital return columns are
supplementary to this and are prepared under guidance published by the Association of Investment Companies.
All income is attributable to the equity shareholders of The Bankers Investment Trust PLC.
As permitted by the Companies Act 2006, the Company has not presented its own Statement of Comprehensive
Income. The net profit of the Company for the year was £44,848,000 (2011: £8,346,000).
67899_Hendersons-TEXT.indd 34 16/01/2013 21:00
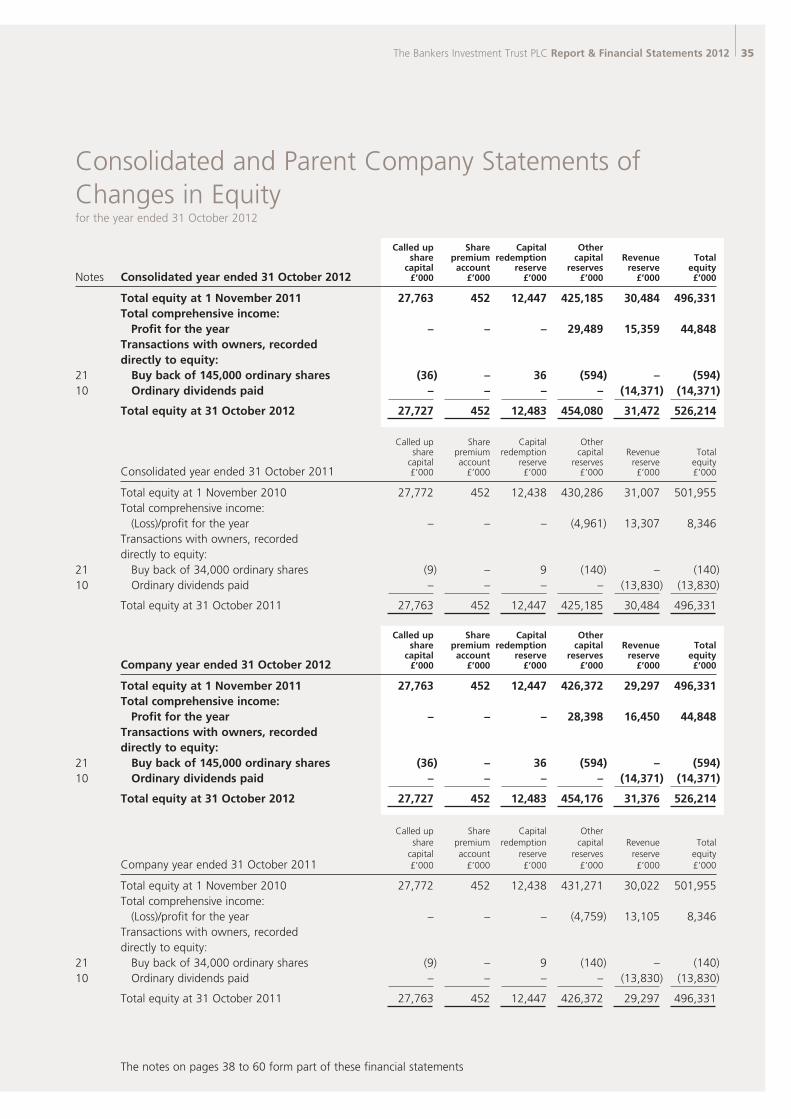
The Bankers Investment Trust PLC Report & Financial Statements 2012 35
The notes on pages 38 to 60 form part of these financial statements
Consolidated and Parent Company Statements of Changes in Equityfor the year ended 31 October 2012
Called up Share Capital Other share premium redemption capital Revenue Total capital account reserve reserves reserve equity Notes Consolidated year ended 31 October 2012 £’000 £’000 £’000 £’000 £’000 £’000
Total equity at 1 November 2011 27,763 452 12,447 425,185 30,484 496,331 Total comprehensive income: Profit for the year – – – 29,489 15,359 44,848 Transactions with owners, recorded directly to equity: 21 Buy back of 145,000 ordinary shares (36) – 36 (594) – (594)10 Ordinary dividends paid – – – – (14,371) (14,371) Total equity at 31 October 2012 27,727 452 12,483 454,080 31,472 526,214
Called up Share Capital Other share premium redemption capital Revenue Total capital account reserve reserves reserve equity Consolidated year ended 31 October 2011 £’000 £’000 £’000 £’000 £’000 £’000
Total equity at 1 November 2010 27,772 452 12,438 430,286 31,007 501,955 Total comprehensive income: (Loss)/profit for the year – – – (4,961) 13,307 8,346 Transactions with owners, recorded directly to equity: 21 Buy back of 34,000 ordinary shares (9) – 9 (140) – (140)10 Ordinary dividends paid – – – – (13,830) (13,830) Total equity at 31 October 2011 27,763 452 12,447 425,185 30,484 496,331
Called up Share Capital Other share premium redemption capital Revenue Total capital account reserve reserves reserve equity Company year ended 31 October 2012 £’000 £’000 £’000 £’000 £’000 £’000
Total equity at 1 November 2011 27,763 452 12,447 426,372 29,297 496,331 Total comprehensive income: Profit for the year – – – 28,398 16,450 44,848 Transactions with owners, recorded directly to equity: 21 Buy back of 145,000 ordinary shares (36) – 36 (594) – (594)10 Ordinary dividends paid – – – – (14,371) (14,371) Total equity at 31 October 2012 27,727 452 12,483 454,176 31,376 526,214
Called up Share Capital Other share premium redemption capital Revenue Total capital account reserve reserves reserve equity Company year ended 31 October 2011 £’000 £’000 £’000 £’000 £’000 £’000
Total equity at 1 November 2010 27,772 452 12,438 431,271 30,022 501,955 Total comprehensive income: (Loss)/profit for the year – – – (4,759) 13,105 8,346 Transactions with owners, recorded directly to equity: 21 Buy back of 34,000 ordinary shares (9) – 9 (140) – (140)10 Ordinary dividends paid – – – – (13,830) (13,830) Total equity at 31 October 2011 27,763 452 12,447 426,372 29,297 496,331
67899_Hendersons-TEXT.indd 35 16/01/2013 21:00
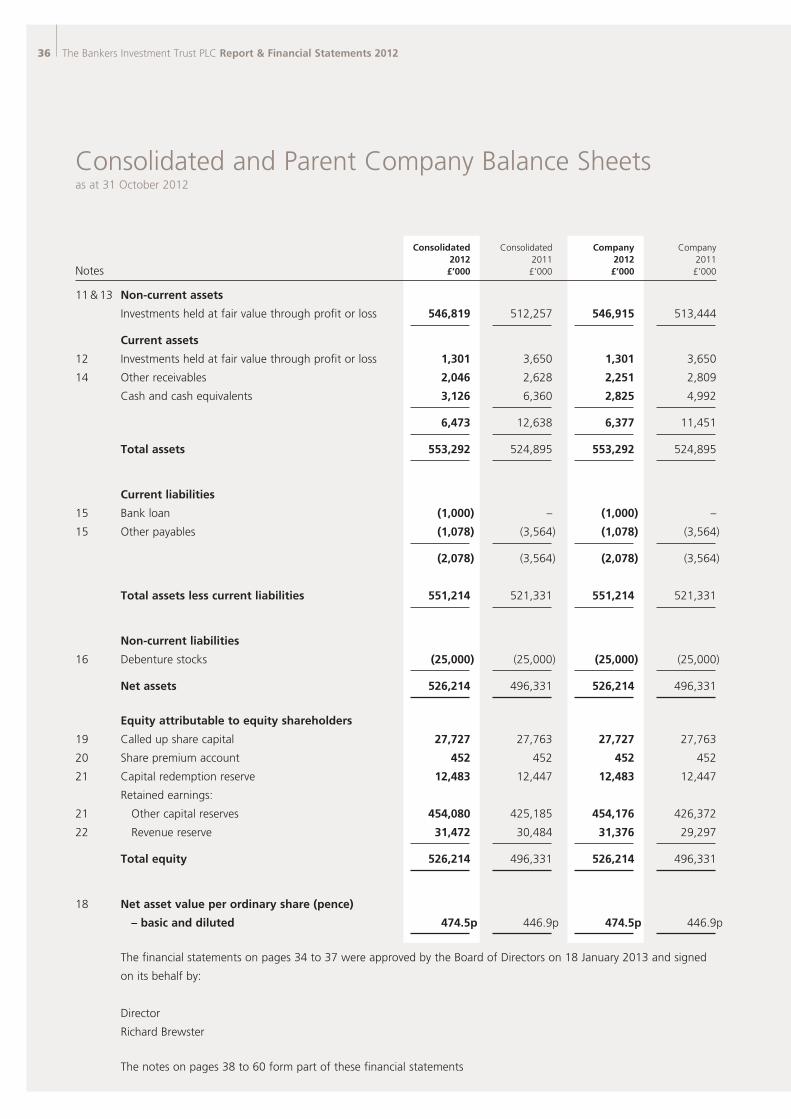
36 The Bankers Investment Trust PLC Report & Financial Statements 2012
Consolidated and Parent Company Balance Sheetsas at 31 October 2012
Consolidated Consolidated Company Company 2012 2011 2012 2011 Notes £’000 £’000 £’000 £’000
11 & 13 Non-current assets
Investments held at fair value through profit or loss 546,819 512,257 546,915 513,444
Current assets
12 Investments held at fair value through profit or loss 1,301 3,650 1,301 3,650
14 Other receivables 2,046 2,628 2,251 2,809
Cash and cash equivalents 3,126 6,360 2,825 4,992
6,473 12,638 6,377 11,451
Total assets 553,292 524,895 553,292 524,895
Current liabilities
15 Bank loan (1,000) – (1,000) –
15 Other payables (1,078) (3,564) (1,078) (3,564)
(2,078) (3,564) (2,078) (3,564)
Total assets less current liabilities 551,214 521,331 551,214 521,331
Non-current liabilities
16 Debenture stocks (25,000) (25,000) (25,000) (25,000)
Net assets 526,214 496,331 526,214 496,331
Equity attributable to equity shareholders
19 Called up share capital 27,727 27,763 27,727 27,763
20 Share premium account 452 452 452 452
21 Capital redemption reserve 12,483 12,447 12,483 12,447
Retained earnings:
21 Other capital reserves 454,080 425,185 454,176 426,372
22 Revenue reserve 31,472 30,484 31,376 29,297
Total equity 526,214 496,331 526,214 496,331
18 Net asset value per ordinary share (pence)
– basic and diluted 474.5p 446.9p 474.5p 446.9p
The financial statements on pages 34 to 37 were approved by the Board of Directors on 18 January 2013 and signed
on its behalf by:
Director
Richard Brewster
The notes on pages 38 to 60 form part of these financial statements
67899_Hendersons-TEXT.indd 36 16/01/2013 21:00
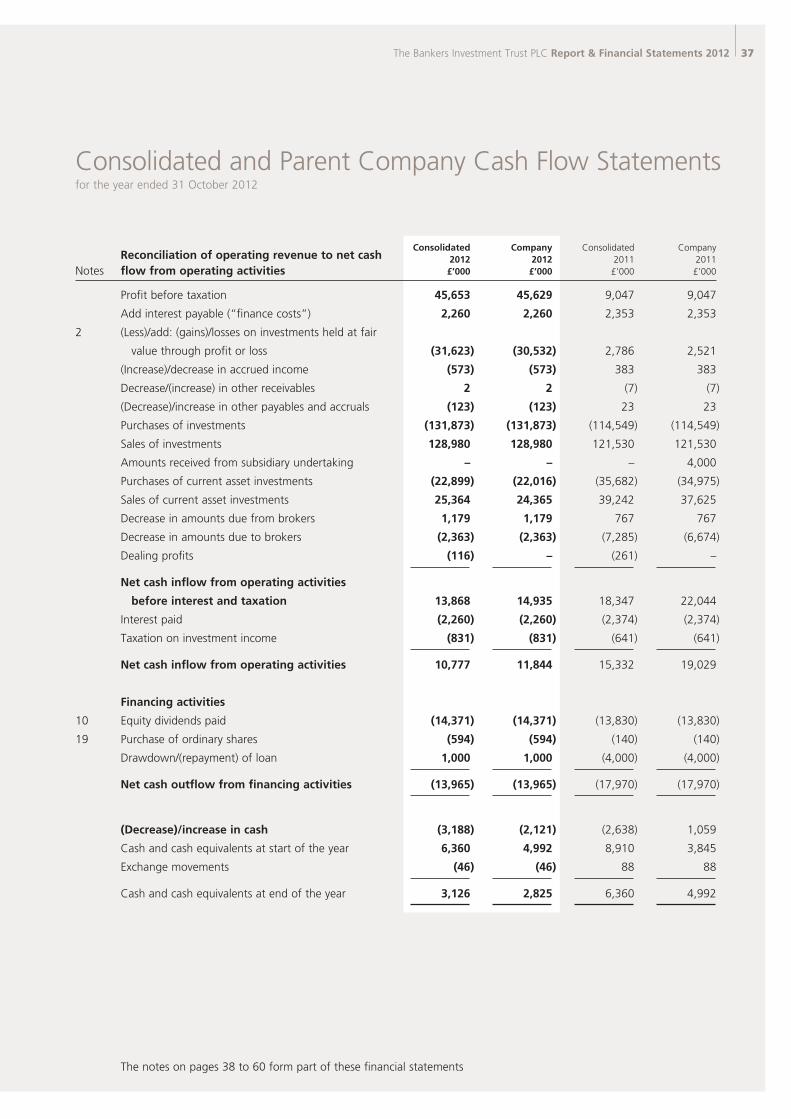
The Bankers Investment Trust PLC Report & Financial Statements 2012 37
The notes on pages 38 to 60 form part of these financial statements
Consolidated and Parent Company Cash Flow Statementsfor the year ended 31 October 2012
Consolidated Company Consolidated Company Reconciliation of operating revenue to net cash 2012 2012 2011 2011 Notes flow from operating activities £’000 £’000 £’000 £’000
Profit before taxation 45,653 45,629 9,047 9,047
Add interest payable (“finance costs”) 2,260 2,260 2,353 2,353
2 (Less)/add: (gains)/losses on investments held at fair
value through profit or loss (31,623) (30,532) 2,786 2,521
(Increase)/decrease in accrued income (573) (573) 383 383
Decrease/(increase) in other receivables 2 2 (7) (7)
(Decrease)/increase in other payables and accruals (123) (123) 23 23
Purchases of investments (131,873) (131,873) (114,549) (114,549)
Sales of investments 128,980 128,980 121,530 121,530
Amounts received from subsidiary undertaking – – – 4,000
Purchases of current asset investments (22,899) (22,016) (35,682) (34,975)
Sales of current asset investments 25,364 24,365 39,242 37,625
Decrease in amounts due from brokers 1,179 1,179 767 767
Decrease in amounts due to brokers (2,363) (2,363) (7,285) (6,674)
Dealing profits (116) – (261) –
Net cash inflow from operating activities
before interest and taxation 13,868 14,935 18,347 22,044
Interest paid (2,260) (2,260) (2,374) (2,374)
Taxation on investment income (831) (831) (641) (641)
Net cash inflow from operating activities 10,777 11,844 15,332 19,029
Financing activities
10 Equity dividends paid (14,371) (14,371) (13,830) (13,830)
19 Purchase of ordinary shares (594) (594) (140) (140)
Drawdown/(repayment) of loan 1,000 1,000 (4,000) (4,000)
Net cash outflow from financing activities (13,965) (13,965) (17,970) (17,970)
(Decrease)/increase in cash (3,188) (2,121) (2,638) 1,059
Cash and cash equivalents at start of the year 6,360 4,992 8,910 3,845
Exchange movements (46) (46) 88 88
Cash and cash equivalents at end of the year 3,126 2,825 6,360 4,992
67899_Hendersons-TEXT.indd 37 18/01/2013 14:33
38 The Bankers Investment Trust PLC Report & Financial Statements 2012
Notes to the Financial Statements
1 Accounting policies
(a) Basis of preparation
The consolidated and parent company financial statements for the year ended 31 October 2012 have been prepared in
accordance with International Financial Reporting Standards (“IFRSs”) as adopted by the European Union and with those
parts of the Companies Act 2006 applicable to companies reporting under IFRSs. IFRSs comprise standards and
interpretations approved by the International Accounting Standards Board (“IASB”), together with interpretations of the
International Accounting Standards and Standing Interpretations Committee approved by the International Accounting
Standards Committee (“IASC”) that remain in effect, to the extent that IFRSs have been adopted by the European Union.
The financial statements have been prepared on a going concern basis and on the historical cost basis, except for the
revaluation of certain financial instruments. The principal accounting policies adopted are set out below. Where
presentational guidance set out in the Statement of Recommended Practice (“the SORP”) for investment trusts issued by
the Association of Investment Companies (“the AIC”) in January 2009 is consistent with the requirements of IFRSs, the
directors have sought to prepare the financial statements on a basis consistent with the recommendations of the SORP.
Accounting Standards
(i) New and amended standards adopted by the Company:
l IFRS 1 (amendment), First Time Adoption of International Financial Reporting Standards – amendments resulting
from the 2010 annual improvement review. No impact on the financial statements.
l IFRS 7 (amendment), Financial lnstruments – Disclosures – amendments resulting from the 2010 annual
improvement review. No impact on the financial statements.
l lAS 24 (revised), Related Party Disclosures – disclosure amendment in respect of ‘commitments’ with related
parties. No impact on the financial statements.
(ii) New standards, amendments and interpretations issued but not effective for the current financial year
and not early adopted by the Company:
l IFRS 7 (amendment),’ Financial Instruments – Disclosures’ (effective for periods beginning on or after 1 January
2013) – amendments enhancing disclosures about offsetting financial assets and financial liabilities.
l IFRS 9, ‘Financial instruments’ (effective for financial periods beginning on or after 1 January 2015) – addresses
the classification, measurement and recognition of financial assets and financial liabilities. IFRS 9 was issued in
November 2009 and October 2010. It replaces the parts of lAS 39 that relate to the classification and
measurement of financial instruments. IFRS 9 requires financial assets to be classified into two measurement
categories: those measured as at fair value and those measured at amortised cost. The determination is made at
initial recognition. The classification depends on the entity’s business model for managing its financial instruments
and the contractual cash flow characteristics of the instrument. For financial liabilities, the standard retains most
of the lAS 39 requirements. The main change is that, in cases where the fair value option is taken for financial
liabilities, the part of a fair value change due to an entity’s own credit risk is recorded in other comprehensive
income rather than the income statement, unless this creates an accounting mismatch. The company is yet to
assess IFRS 9’s full impact and intends to adopt lFRS 9 no later than the accounting period beginning on or after
1 January 2013, subject to endorsement by the EU.
l IFRS 12, ‘Disclosures of interests in other entities’ (effective for annual periods beginning on or after 1 January
2012) – includes the disclosure requirements for all forms of interests in other entities, including joint
arrangements, associates, special purpose vehicles and other off balance sheet vehicles. The Company is yet to
assess IFRS 12’s full impact and intends to adopt IFRS 12 no later than the accounting period beginning on or
after 1 January 2013, subject to endorsement by the EU.
67899_Hendersons-TEXT.indd 38 16/01/2013 21:00
The Bankers Investment Trust PLC Report & Financial Statements 2012 39
Notes to the Financial Statementscontinued
1 Accounting policies (continued)
l IFRS 13, ‘Fair value measurement’ (effective for annual periods beginning on or after 1 January 2013) – aims to
improve consistency and reduce complexity by providing a precise definition of fair value and a single source of
fair value measurement and disclosure requirements for use across IFRSs. The requirements, which are largely
aligned between lFRSs and US GAAP, do not extend the use of fair value accounting but provide guidance on
how it should be applied where its use is already required or permitted by other standards within IFRSs or US
GAAP. The company is yet to assess IFRS 13’s full impact and intends to adopt IFRS 13 no later than the
accounting period beginning on or after 1 January 2012, subject to endorsement by the EU.
l lAS 32, ‘Financial instruments: Presentation’ (effective for financial periods beginning on or after 1 January 2014)
– updates the application guidance in lAS 32, ‘Financial instruments: Presentation’, to clarify some of the
requirements for offsetting financial assets and financial liabilities on the balance sheet.
(iii) New standards, amendments and interpretations issued but not effective for the current financial
year and not relevant to the Company’s operations:
l IFRS 1 (amendments), First Time Adoption of International Financial Reporting Standards
l IFRS 10, Consolidated financial statements
l IFRS 11, Joint Arrangements
l lAS 1 (amendment) Financial Statement Presentation
l lAS 12 (amendment) Income Taxes
l lAS 19 (amendment) Employee Benefits
l lAS 27 Separate Financial Statements
l lAS 28 Associates and joint venture
(b) Basis of consolidation
The Group accounts consolidate the accounts of the Company and of its sole wholly owned subsidiary undertaking,
The Army and Navy Investment Company Limited. Consistent accounting policies have been used across the Group.
The intragroup balances are eliminated on consolidation. The investment in the subsidiary is recognised at fair value
in the financial statements of the Company.
(c) Investments held at fair value through profit or loss
All investments are designated upon initial recognition as held at fair value through profit or loss. Investment
transactions are accounted for on a trade date basis. Assets are de-recognised at the trade date of the disposal.
Proceeds are measured at fair value, which are regarded as the proceeds of sale less any transaction costs. The fair
value of the financial instruments in the balance sheet is based on their quoted bid price at the balance sheet date,
without deduction of the estimated future selling costs. Unquoted investments (including the Company’s investment in
its subsidiary) are valued by the directors using primary valuation techniques such as earnings multiples, recent
transactions and net assets. Where fair value cannot be reliably measured, the investment will be carried at the
previous reporting date value unless there is evidence that the investment has since been impaired, in which case the
value will be reduced.
Changes in the fair value of investments held at fair value through profit or loss and gains and losses on disposal are
recognised in the Consolidated Statement of Comprehensive Income as “Gains or losses on investments held at fair
value through profit or loss”. Also included within this caption are transaction costs in relation to the purchase or sale of
investments, including the difference between the purchase price of an investment and its bid price at the date of
purchase.
67899_Hendersons-TEXT.indd 39 16/01/2013 21:00
40 The Bankers Investment Trust PLC Report & Financial Statements 2012
Notes to the Financial Statementscontinued
1 Accounting policies (continued)
(d) Presentation of Statement of Comprehensive Income
In accordance with guidance issued by the AIC, supplementary information which analyses the Statement of
Comprehensive Income between items of a revenue and capital nature has been presented alongside the Statement
of Comprehensive Income. In accordance with the Company’s status as a UK investment company under Section 833
of the Companies Act 2006, net capital returns may not be distributed by way of dividend. Additionally, the net
revenue is the measure the directors believe appropriate in assessing the Group’s compliance with certain requirements
set out in Section 1158 of the Corporation Tax Act 2010.
(e) Income
Dividends receivable on equity shares are recognised as revenue for the year on an ex-dividend basis. Special dividends
are treated as revenue return or as capital return, depending on the facts of each individual case. Income from fixed
interest debt securities is recognised using the effective interest rate method. The trading profits of the subsidiary
undertaking, which represent realised gains and losses on the sale of current asset investments, are disclosed in the
revenue return column of the Statement of Comprehensive Income as a revenue item. Bank deposit interest and stock
lending income are accounted for on an accruals basis.
Where the Company enters into a commitment to underwrite an issue of securities in exchange for the receipt of
commission, a derivative financial instrument is recognised initially at fair value. The derivative is re-measured
subsequently at fair value, with the related gains and losses being reflected in the Statement of Comprehensive Income.
Net losses arising from these derivatives, where actual or expected loss from taking up the securities underwritten
exceeds the commission income are allocated to the capital return. Net gains are allocated to the revenue return.
(f) Expenses
All expenses and interest payable are accounted for on an accruals basis. On the basis of the Board’s expected long-
term split of total returns in the form of capital and revenue returns of 70% and 30%, respectively, the Company
charges 70% of its finance costs and investment management fees to capital. Any performance fees payable are
allocated wholly to capital, reflecting the fact that, although they are calculated on a total return basis, they are
expected to be attributable largely, if not wholly, to capital performance. Expenses which are incidental to the
purchase or sale of an investment are charged to the capital return column of the Statement of Comprehensive
Income and allocated to other capital reserves. All other operating expenses are charged to the revenue return column
of the Statement of Comprehensive Income.
(g) Taxation
The tax expense represents the sum of the tax currently payable and deferred tax.
The tax currently payable is based on the taxable profit for the year. Taxable profit differs from net profit as reported
in the Statement of Comprehensive Income because it excludes items of income or expense that are taxable or
deductible in other years and it further excludes items that are never taxable or deductible. The Group’s liability for
current tax is calculated using the effective tax rate of corporation tax for the accounting period.
In line with the recommendations of the SORP, the allocation method used to calculate tax relief on expenses
presented against capital returns in the supplementary information in the Statement of Comprehensive Income is the
“marginal basis”. Under this basis, if taxable income is capable of being offset entirely by expenses presented in the
revenue return column of the Statement of Comprehensive Income, then no tax relief is transferred to the capital
return column.
67899_Hendersons-TEXT.indd 40 17/01/2013 19:24

The Bankers Investment Trust PLC Report & Financial Statements 2012 41
Notes to the Financial Statementscontinued
1 Accounting policies (continued)
Deferred tax is the tax expected to be payable or recoverable on differences between the carrying amounts of assets
and liabilities in the financial statements and the corresponding tax bases used in the computation of taxable profit,
and is accounted for using the balance sheet liability method. Deferred tax liabilities are recognised for all taxable
temporary differences and deferred tax assets are recognised to the extent that it is probable that taxable profits will
be available against which deductible temporary differences can be utilised. Investment trusts which have approval as
such under Section 1158 of the Corporation Tax Act 2010 are not liable for taxation on capital gains.
The carrying amount of deferred tax assets is reviewed at each balance sheet date and reduced to the extent that it is
no longer probable that sufficient taxable profits will be available to allow all or part of the asset to be recovered.
Deferred tax is calculated at the tax rates that are expected to apply in the period when the liability is settled or the
asset is realised. Deferred tax is charged or credited in the Statement of Comprehensive Income, except when it relates
to items charged or credited directly to equity, in which case the deferred tax is also dealt with in equity.
(h) Dividends payable to shareholders
Dividends payable to shareholders are recognised in the financial statements when they are paid or, in the case of final
dividends, when they are approved by shareholders. Dividends paid are disclosed in the Statement of Changes in Equity.
(i) Foreign currency
For the purposes of the consolidated financial statements, the results and financial position of each entity is expressed in
pounds sterling, which is the functional currency of the Company and the presentation currency of the Group. Sterling
is the functional currency because it is the currency of the primary economic environment in which the Company and its
subsidiary operate.
Transactions recorded in overseas currencies during the year are translated into sterling at the appropriate daily
exchange rates. Monetary assets and liabilities and equity investments held at fair value through profit or loss that are
denominated in overseas currencies at the balance sheet date, are translated into sterling at the exchange rates ruling
at that date. Exchange gains and losses on investments held at fair value through profit or loss are included within
“Gains or losses on investments held at fair value through profit or loss”.
(j) Cash and cash equivalents
Cash comprises cash in hand and on demand deposits. Cash equivalents are short-term, highly liquid investments that
are readily convertible to known amounts of cash and that are subject to an insignificant risk of changes in value.
(k) Borrowings
Interest-bearing bank loans, overdrafts and debentures are recorded initially at fair value, being the proceeds received,
net of direct issue costs. They are subsequently measured at amortised cost. Finance charges, including premiums
payable on settlement or redemption and direct issue costs, are accounted for on an accruals basis in the Statement of
Comprehensive Income using the effective interest rate method and are added to the carrying amount of the
instrument to the extent that they are not settled in the period in which they arise.
(l) Repurchase of ordinary shares
The cost of repurchasing ordinary shares including related stamp duty and transaction costs are taken directly to equity
and disclosed in the Statement of Changes in Equity. Share repurchase transactions are accounted for on a trade date
basis. The nominal value of ordinary share capital repurchased and cancelled is transferred out of called-up share
capital and into the capital redemption reserve.
67899_Hendersons-TEXT.indd 41 16/01/2013 21:00
42 The Bankers Investment Trust PLC Report & Financial Statements 2012
Notes to the Financial Statementscontinued
1 Accounting policies (continued)
(m) Capital reserves
The following are accounted for in the “Capital reserve arising on investments sold”:
– expenses and finance costs charged to capital net of tax relief;
– gains and losses on the disposals of investments;
– realised foreign exchange differences of a capital nature; and
– costs of repurchasing ordinary share capital.
The following are accounted for in the “Capital reserve arising on investments held”:
– increases and decreases in the valuation of investments held at the year end; and
– unrealised foreign exchange differences of a capital nature.
(n) Key estimates and assumptions
Estimates and assumptions used in preparing the financial statements are reviewed on an ongoing basis and are based
on historical experience and various other factors that are believed to be reasonable under the circumstances. The
results of these estimates and assumptions form the basis of making judgements about carrying values of assets and
liabilities that are not readily apparent from other sources.
There are no estimates and assumptions that may cause material adjustment to the carrying value of assets and liabilities.
(o) Policy on operating segments
Under IFRS 8, operating segments are considered to be the components of an entity, about which separate financial
information is available, that is evaluated regularly by the chief operating decision-maker (the Investment Manager, with
oversight from the Board) in deciding how to allocate resources and in assessing performance. The directors meet
regularly to consider investment strategy and to monitor the Company’s performance. The Portfolio Manager, who has
been appointed to manage the Company’s investments, attends all Board meetings at which investment strategy and
performance are discussed. The directors consider that the Group has two operating segments: (i) the Parent Company,
The Bankers Investment Trust PLC, which invests in shares and securities primarily for capital appreciation and dividend
growth in accordance with the Company’s published investment objective; and (ii) its wholly owned subsidiary, The Army
and Navy Investment Company Limited, which trades in securities to enhance the Group’s returns. See also note 25 for
further details on operating segments.
The business is not managed on a geographical basis, however, for the convenience of investors, disclosure by
geographical segment has been provided in note 3 and in the Portfolio Review on pages 5 to 18. Further analyses of
expenses, investment gains or losses, profit and other assets and liabilities by country have not been given as either it
is not possible to prepare such information in a meaningful way or the results are not considered to be significant.
67899_Hendersons-TEXT.indd 42 16/01/2013 21:00
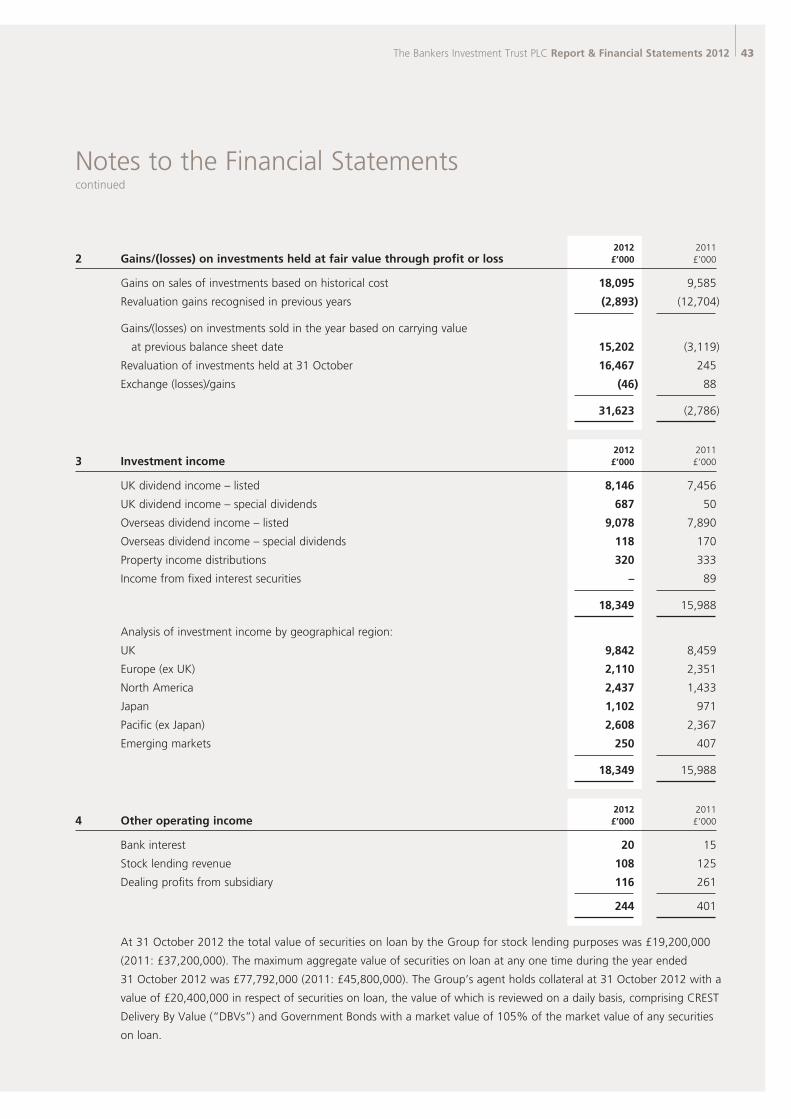
The Bankers Investment Trust PLC Report & Financial Statements 2012 43
Notes to the Financial Statementscontinued
2012 2011 2 Gains/(losses) on investments held at fair value through profit or loss £’000 £’000
Gains on sales of investments based on historical cost 18,095 9,585
Revaluation gains recognised in previous years (2,893) (12,704)
Gains/(losses) on investments sold in the year based on carrying value
at previous balance sheet date 15,202 (3,119)
Revaluation of investments held at 31 October 16,467 245
Exchange (losses)/gains (46) 88
31,623 (2,786)
2012 2011 3 Investment income £’000 £’000
UK dividend income – listed 8,146 7,456
UK dividend income – special dividends 687 50
Overseas dividend income – listed 9,078 7,890
Overseas dividend income – special dividends 118 170
Property income distributions 320 333
Income from fixed interest securities – 89
18,349 15,988
Analysis of investment income by geographical region:
UK 9,842 8,459
Europe (ex UK) 2,110 2,351
North America 2,437 1,433
Japan 1,102 971
Pacific (ex Japan) 2,608 2,367
Emerging markets 250 407
18,349 15,988
2012 2011 4 Other operating income £’000 £’000
Bank interest 20 15
Stock lending revenue 108 125
Dealing profits from subsidiary 116 261 244 401
At 31 October 2012 the total value of securities on loan by the Group for stock lending purposes was £19,200,000
(2011: £37,200,000). The maximum aggregate value of securities on loan at any one time during the year ended
31 October 2012 was £77,792,000 (2011: £45,800,000). The Group’s agent holds collateral at 31 October 2012 with a
value of £20,400,000 in respect of securities on loan, the value of which is reviewed on a daily basis, comprising CREST
Delivery By Value (“DBVs”) and Government Bonds with a market value of 105% of the market value of any securities
on loan.
67899_Hendersons-TEXT.indd 43 16/01/2013 21:00
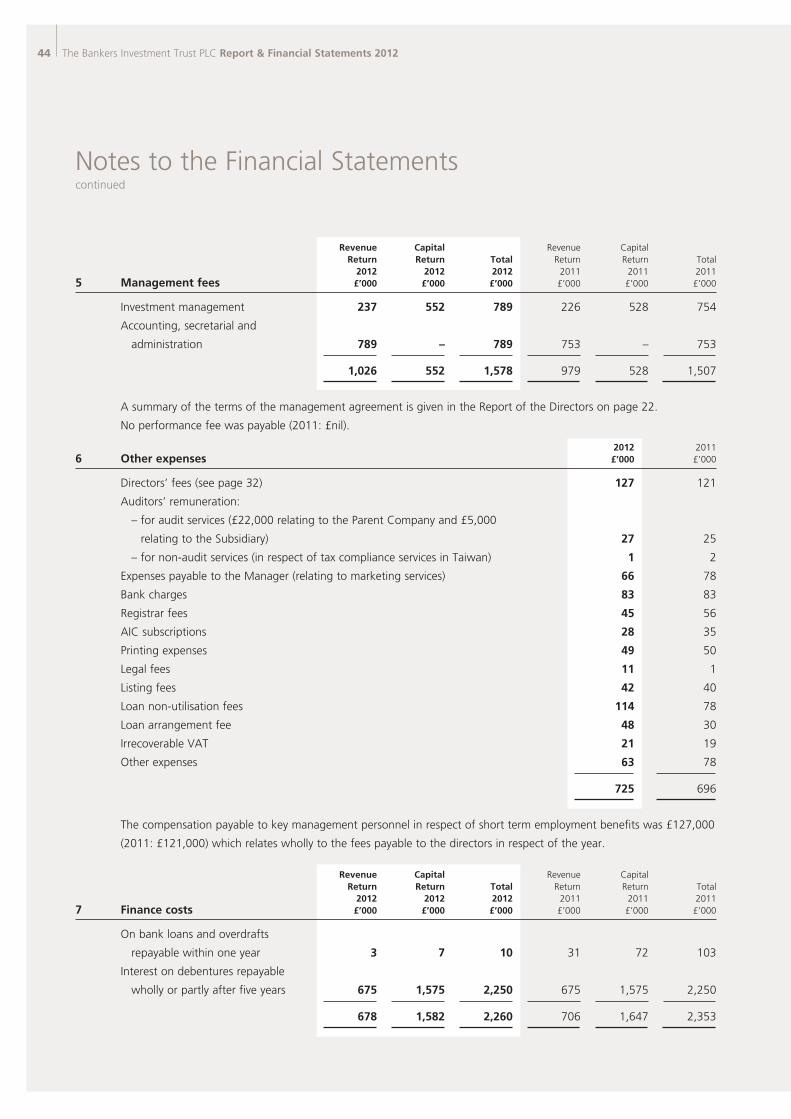
44 The Bankers Investment Trust PLC Report & Financial Statements 2012
Notes to the Financial Statementscontinued
Revenue Capital Revenue Capital Return Return Total Return Return Total 2012 2012 2012 2011 2011 2011 5 Management fees £’000 £’000 £’000 £’000 £’000 £’000
Investment management 237 552 789 226 528 754
Accounting, secretarial and
administration 789 – 789 753 – 753
1,026 552 1,578 979 528 1,507
A summary of the terms of the management agreement is given in the Report of the Directors on page 22.
No performance fee was payable (2011: £nil).
2012 2011 6 Other expenses £’000 £’000
Directors’ fees (see page 32) 127 121
Auditors’ remuneration:
– for audit services (£22,000 relating to the Parent Company and £5,000
relating to the Subsidiary) 27 25
– for non-audit services (in respect of tax compliance services in Taiwan) 1 2
Expenses payable to the Manager (relating to marketing services) 66 78
Bank charges 83 83
Registrar fees 45 56
AIC subscriptions 28 35
Printing expenses 49 50
Legal fees 11 1
Listing fees 42 40
Loan non-utilisation fees 114 78
Loan arrangement fee 48 30
Irrecoverable VAT 21 19
Other expenses 63 78
725 696
The compensation payable to key management personnel in respect of short term employment benefits was £127,000
(2011: £121,000) which relates wholly to the fees payable to the directors in respect of the year.
Revenue Capital Revenue Capital Return Return Total Return Return Total 2012 2012 2012 2011 2011 2011 7 Finance costs £’000 £’000 £’000 £’000 £’000 £’000
On bank loans and overdrafts
repayable within one year 3 7 10 31 72 103
Interest on debentures repayable
wholly or partly after five years 675 1,575 2,250 675 1,575 2,250
678 1,582 2,260 706 1,647 2,353
67899_Hendersons-TEXT.indd 44 17/01/2013 14:21
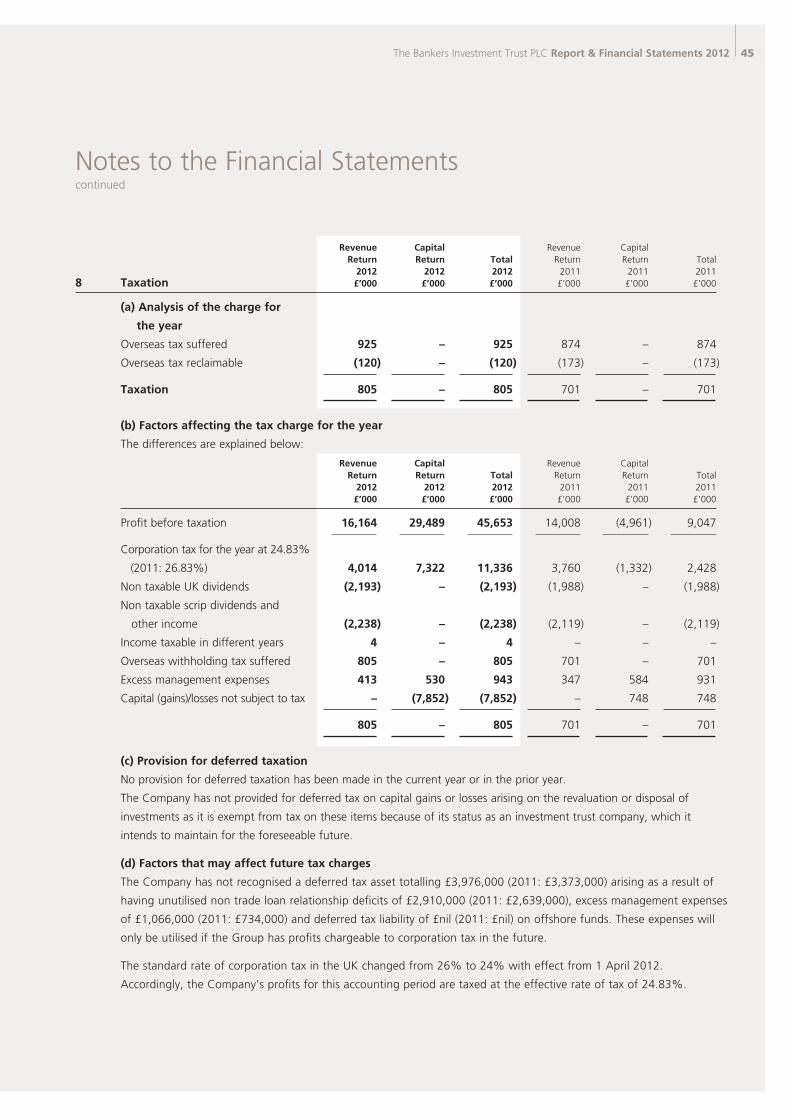
The Bankers Investment Trust PLC Report & Financial Statements 2012 45
Notes to the Financial Statementscontinued
Revenue Capital Revenue Capital Return Return Total Return Return Total 2012 2012 2012 2011 2011 2011 8 Taxation £’000 £’000 £’000 £’000 £’000 £’000
(a) Analysis of the charge for
the year
Overseas tax suffered 925 – 925 874 – 874
Overseas tax reclaimable (120) – (120) (173) – (173)
Taxation 805 – 805 701 – 701
(b) Factors affecting the tax charge for the year
The differences are explained below:
Revenue Capital Revenue Capital Return Return Total Return Return Total 2012 2012 2012 2011 2011 2011 £’000 £’000 £’000 £’000 £’000 £’000
Profit before taxation 16,164 29,489 45,653 14,008 (4,961) 9,047
Corporation tax for the year at 24.83%
(2011: 26.83%) 4,014 7,322 11,336 3,760 (1,332) 2,428
Non taxable UK dividends (2,193) – (2,193) (1,988) – (1,988)
Non taxable scrip dividends and
other income (2,238) – (2,238) (2,119) – (2,119)
Income taxable in different years 4 – 4 – – –
Overseas withholding tax suffered 805 – 805 701 – 701
Excess management expenses 413 530 943 347 584 931
Capital (gains)/losses not subject to tax – (7,852) (7,852) – 748 748
805 – 805 701 – 701
(c) Provision for deferred taxation
No provision for deferred taxation has been made in the current year or in the prior year.
The Company has not provided for deferred tax on capital gains or losses arising on the revaluation or disposal of
investments as it is exempt from tax on these items because of its status as an investment trust company, which it
intends to maintain for the foreseeable future.
(d) Factors that may affect future tax charges
The Company has not recognised a deferred tax asset totalling £3,976,000 (2011: £3,373,000) arising as a result of
having unutilised non trade loan relationship deficits of £2,910,000 (2011: £2,639,000), excess management expenses
of £1,066,000 (2011: £734,000) and deferred tax liability of £nil (2011: £nil) on offshore funds. These expenses will
only be utilised if the Group has profits chargeable to corporation tax in the future.
The standard rate of corporation tax in the UK changed from 26% to 24% with effect from 1 April 2012.
Accordingly, the Company’s profits for this accounting period are taxed at the effective rate of tax of 24.83%.
67899_Hendersons-TEXT.indd 45 16/01/2013 21:00
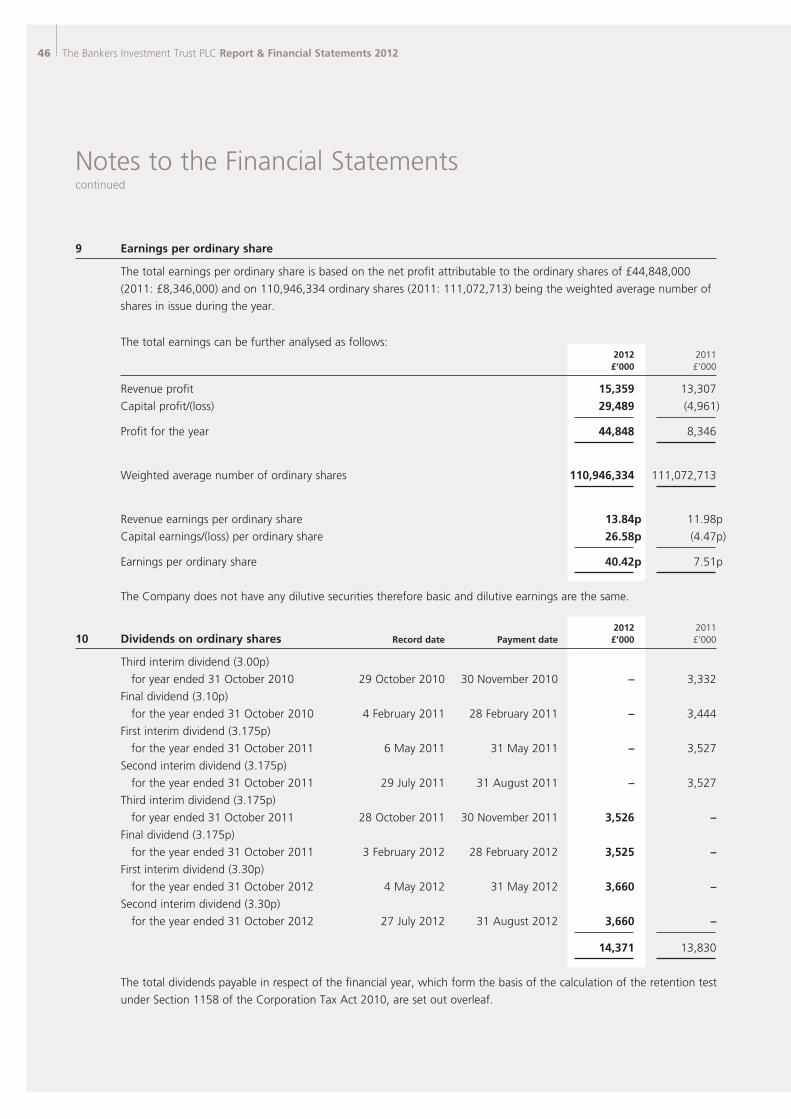
46 The Bankers Investment Trust PLC Report & Financial Statements 2012
Notes to the Financial Statementscontinued
9 Earnings per ordinary share
The total earnings per ordinary share is based on the net profit attributable to the ordinary shares of £44,848,000
(2011: £8,346,000) and on 110,946,334 ordinary shares (2011: 111,072,713) being the weighted average number of
shares in issue during the year.
The total earnings can be further analysed as follows: 2012 2011 £’000 £’000
Revenue profit 15,359 13,307
Capital profit/(loss) 29,489 (4,961)
Profit for the year 44,848 8,346
Weighted average number of ordinary shares 110,946,334 111,072,713
Revenue earnings per ordinary share 13.84p 11.98p
Capital earnings/(loss) per ordinary share 26.58p (4.47p)
Earnings per ordinary share 40.42p 7.51p
The Company does not have any dilutive securities therefore basic and dilutive earnings are the same.
2012 2011 10 Dividends on ordinary shares Record date Payment date £’000 £’000
Third interim dividend (3.00p)
for year ended 31 October 2010 29 October 2010 30 November 2010 – 3,332
Final dividend (3.10p)
for the year ended 31 October 2010 4 February 2011 28 February 2011 – 3,444
First interim dividend (3.175p)
for the year ended 31 October 2011 6 May 2011 31 May 2011 – 3,527
Second interim dividend (3.175p)
for the year ended 31 October 2011 29 July 2011 31 August 2011 – 3,527
Third interim dividend (3.175p)
for year ended 31 October 2011 28 October 2011 30 November 2011 3,526 –
Final dividend (3.175p)
for the year ended 31 October 2011 3 February 2012 28 February 2012 3,525 –
First interim dividend (3.30p)
for the year ended 31 October 2012 4 May 2012 31 May 2012 3,660 –
Second interim dividend (3.30p)
for the year ended 31 October 2012 27 July 2012 31 August 2012 3,660 –
14,371 13,830
The total dividends payable in respect of the financial year, which form the basis of the calculation of the retention test
under Section 1158 of the Corporation Tax Act 2010, are set out overleaf.
67899_Hendersons-TEXT.indd 46 16/01/2013 21:00
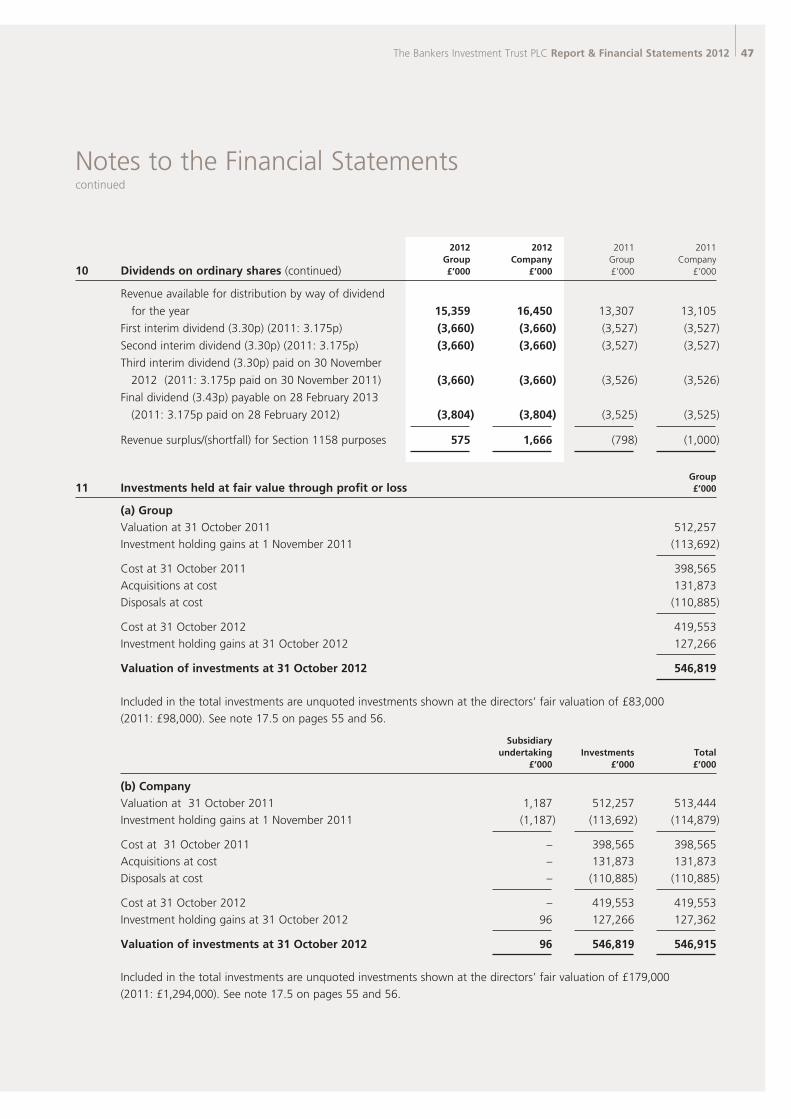
The Bankers Investment Trust PLC Report & Financial Statements 2012 47
Notes to the Financial Statementscontinued
2012 2012 2011 2011 Group Company Group Company 10 Dividends on ordinary shares (continued) £’000 £’000 £’000 £’000
Revenue available for distribution by way of dividend
for the year 15,359 16,450 13,307 13,105
First interim dividend (3.30p) (2011: 3.175p) (3,660) (3,660) (3,527) (3,527)
Second interim dividend (3.30p) (2011: 3.175p) (3,660) (3,660) (3,527) (3,527)
Third interim dividend (3.30p) paid on 30 November
2012 (2011: 3.175p paid on 30 November 2011) (3,660) (3,660) (3,526) (3,526)
Final dividend (3.43p) payable on 28 February 2013
(2011: 3.175p paid on 28 February 2012) (3,804) (3,804) (3,525) (3,525)
Revenue surplus/(shortfall) for Section 1158 purposes 575 1,666 (798) (1,000)
Group 11 Investments held at fair value through profit or loss £’000
(a) Group
Valuation at 31 October 2011 512,257
Investment holding gains at 1 November 2011 (113,692)
Cost at 31 October 2011 398,565
Acquisitions at cost 131,873
Disposals at cost (110,885)
Cost at 31 October 2012 419,553
Investment holding gains at 31 October 2012 127,266
Valuation of investments at 31 October 2012 546,819
Included in the total investments are unquoted investments shown at the directors’ fair valuation of £83,000
(2011: £98,000). See note 17.5 on pages 55 and 56.
Subsidiary undertaking Investments Total £’000 £’000 £’000
(b) Company
Valuation at 31 October 2011 1,187 512,257 513,444
Investment holding gains at 1 November 2011 (1,187) (113,692) (114,879)
Cost at 31 October 2011 – 398,565 398,565
Acquisitions at cost – 131,873 131,873
Disposals at cost – (110,885) (110,885)
Cost at 31 October 2012 – 419,553 419,553
Investment holding gains at 31 October 2012 96 127,266 127,362
Valuation of investments at 31 October 2012 96 546,819 546,915
Included in the total investments are unquoted investments shown at the directors’ fair valuation of £179,000
(2011: £1,294,000). See note 17.5 on pages 55 and 56.
67899_Hendersons-TEXT.indd 47 17/01/2013 19:25
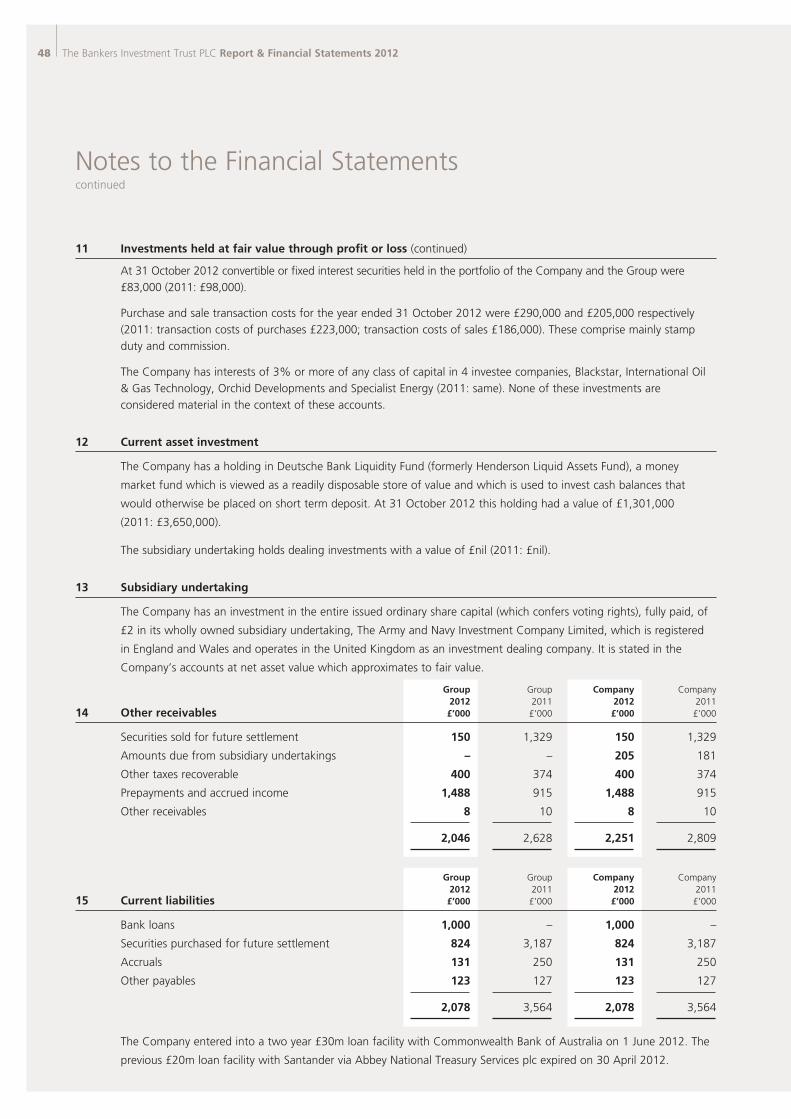
48 The Bankers Investment Trust PLC Report & Financial Statements 2012
Notes to the Financial Statementscontinued
11 Investments held at fair value through profit or loss (continued)
At 31 October 2012 convertible or fixed interest securities held in the portfolio of the Company and the Group were
£83,000 (2011: £98,000).
Purchase and sale transaction costs for the year ended 31 October 2012 were £290,000 and £205,000 respectively
(2011: transaction costs of purchases £223,000; transaction costs of sales £186,000). These comprise mainly stamp
duty and commission.
The Company has interests of 3% or more of any class of capital in 4 investee companies, Blackstar, International Oil
& Gas Technology, Orchid Developments and Specialist Energy (2011: same). None of these investments are
considered material in the context of these accounts.
12 Current asset investment
The Company has a holding in Deutsche Bank Liquidity Fund (formerly Henderson Liquid Assets Fund), a money
market fund which is viewed as a readily disposable store of value and which is used to invest cash balances that
would otherwise be placed on short term deposit. At 31 October 2012 this holding had a value of £1,301,000
(2011: £3,650,000).
The subsidiary undertaking holds dealing investments with a value of £nil (2011: £nil).
13 Subsidiary undertaking
The Company has an investment in the entire issued ordinary share capital (which confers voting rights), fully paid, of
£2 in its wholly owned subsidiary undertaking, The Army and Navy Investment Company Limited, which is registered
in England and Wales and operates in the United Kingdom as an investment dealing company. It is stated in the
Company’s accounts at net asset value which approximates to fair value.
Group Group Company Company 2012 2011 2012 2011 14 Other receivables £’000 £’000 £’000 £’000
Securities sold for future settlement 150 1,329 150 1,329
Amounts due from subsidiary undertakings – – 205 181
Other taxes recoverable 400 374 400 374
Prepayments and accrued income 1,488 915 1,488 915
Other receivables 8 10 8 10
2,046 2,628 2,251 2,809
Group Group Company Company 2012 2011 2012 2011 15 Current liabilities £’000 £’000 £’000 £’000
Bank loans 1,000 – 1,000 –
Securities purchased for future settlement 824 3,187 824 3,187
Accruals 131 250 131 250
Other payables 123 127 123 127
2,078 3,564 2,078 3,564
The Company entered into a two year £30m loan facility with Commonwealth Bank of Australia on 1 June 2012. The
previous £20m loan facility with Santander via Abbey National Treasury Services plc expired on 30 April 2012.
67899_Hendersons-TEXT.indd 48 16/01/2013 21:00
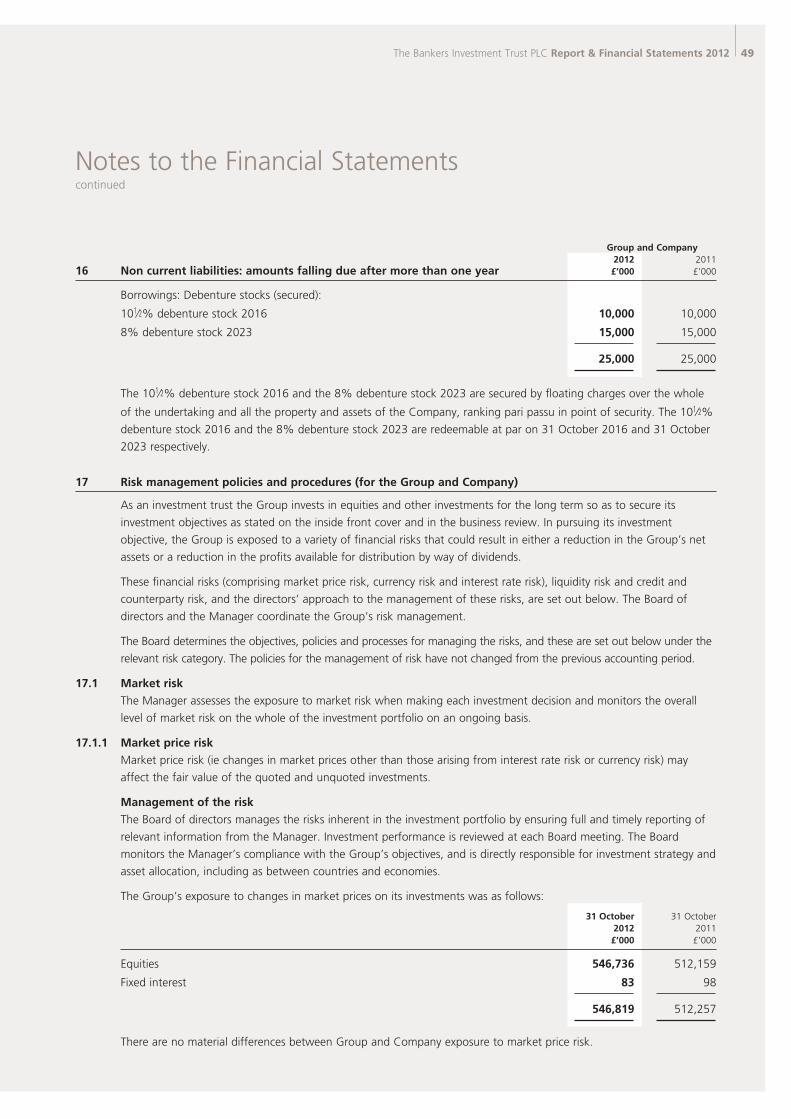
The Bankers Investment Trust PLC Report & Financial Statements 2012 49
Notes to the Financial Statementscontinued
Group and Company 2012 2011 16 Non current liabilities: amounts falling due after more than one year £’000 £’000
Borrowings: Debenture stocks (secured):
101⁄2% debenture stock 2016 10,000 10,000
8% debenture stock 2023 15,000 15,000
25,000 25,000
The 101⁄2% debenture stock 2016 and the 8% debenture stock 2023 are secured by floating charges over the whole
of the undertaking and all the property and assets of the Company, ranking pari passu in point of security. The 101⁄2%
debenture stock 2016 and the 8% debenture stock 2023 are redeemable at par on 31 October 2016 and 31 October
2023 respectively.
17 Risk management policies and procedures (for the Group and Company)
As an investment trust the Group invests in equities and other investments for the long term so as to secure its
investment objectives as stated on the inside front cover and in the business review. In pursuing its investment
objective, the Group is exposed to a variety of financial risks that could result in either a reduction in the Group’s net
assets or a reduction in the profits available for distribution by way of dividends.
These financial risks (comprising market price risk, currency risk and interest rate risk), liquidity risk and credit and
counterparty risk, and the directors’ approach to the management of these risks, are set out below. The Board of
directors and the Manager coordinate the Group’s risk management.
The Board determines the objectives, policies and processes for managing the risks, and these are set out below under the
relevant risk category. The policies for the management of risk have not changed from the previous accounting period.
17.1 Market risk
The Manager assesses the exposure to market risk when making each investment decision and monitors the overall
level of market risk on the whole of the investment portfolio on an ongoing basis.
17.1.1 Market price risk
Market price risk (ie changes in market prices other than those arising from interest rate risk or currency risk) may
affect the fair value of the quoted and unquoted investments.
Management of the risk
The Board of directors manages the risks inherent in the investment portfolio by ensuring full and timely reporting of
relevant information from the Manager. Investment performance is reviewed at each Board meeting. The Board
monitors the Manager’s compliance with the Group’s objectives, and is directly responsible for investment strategy and
asset allocation, including as between countries and economies.
The Group’s exposure to changes in market prices on its investments was as follows:
31 October 31 October 2012 2011 £’000 £’000
Equities 546,736 512,159
Fixed interest 83 98
546,819 512,257
There are no material differences between Group and Company exposure to market price risk.
67899_Hendersons-TEXT.indd 49 16/01/2013 21:00
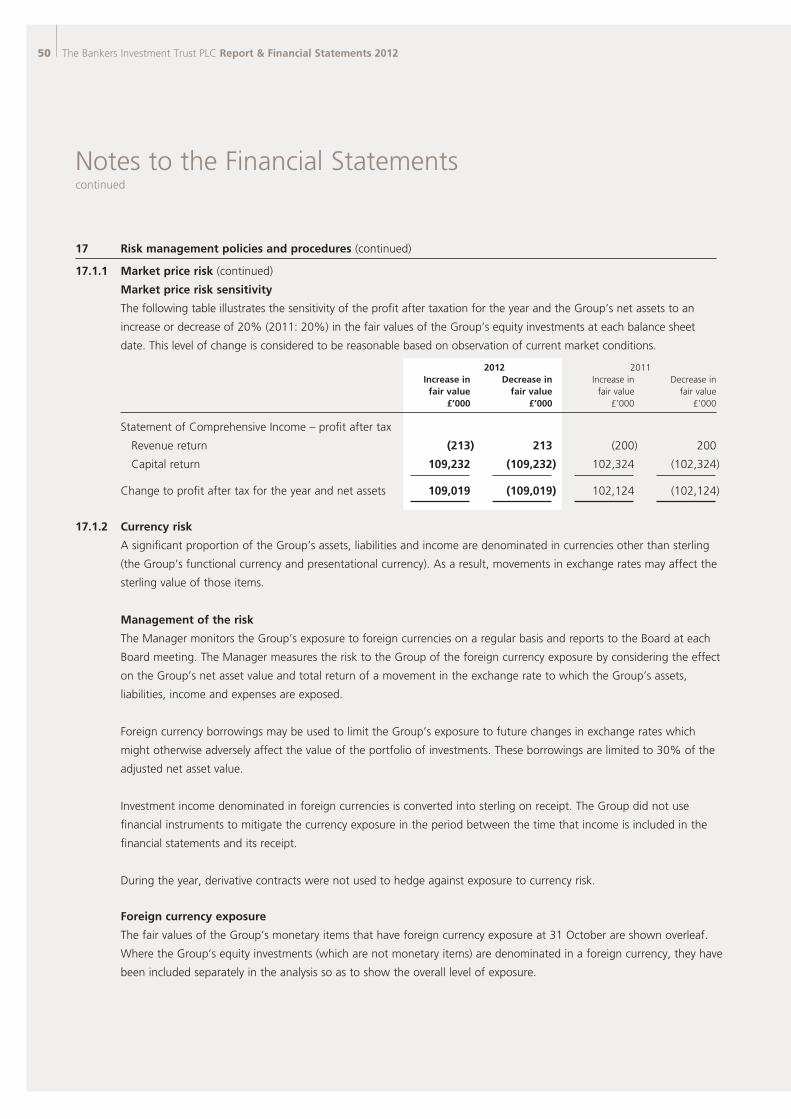
50 The Bankers Investment Trust PLC Report & Financial Statements 2012
Notes to the Financial Statementscontinued
17 Risk management policies and procedures (continued)
17.1.1 Market price risk (continued)
Market price risk sensitivity
The following table illustrates the sensitivity of the profit after taxation for the year and the Group’s net assets to an
increase or decrease of 20% (2011: 20%) in the fair values of the Group’s equity investments at each balance sheet
date. This level of change is considered to be reasonable based on observation of current market conditions.
2012 2011 Increase in Decrease in Increase in Decrease in fair value fair value fair value fair value £’000 £’000 £’000 £’000
Statement of Comprehensive Income – profit after tax
Revenue return (213) 213 (200) 200
Capital return 109,232 (109,232) 102,324 (102,324)
Change to profit after tax for the year and net assets 109,019 (109,019) 102,124 (102,124)
17.1.2 Currency risk
A significant proportion of the Group’s assets, liabilities and income are denominated in currencies other than sterling
(the Group’s functional currency and presentational currency). As a result, movements in exchange rates may affect the
sterling value of those items.
Management of the risk
The Manager monitors the Group’s exposure to foreign currencies on a regular basis and reports to the Board at each
Board meeting. The Manager measures the risk to the Group of the foreign currency exposure by considering the effect
on the Group’s net asset value and total return of a movement in the exchange rate to which the Group’s assets,
liabilities, income and expenses are exposed.
Foreign currency borrowings may be used to limit the Group’s exposure to future changes in exchange rates which
might otherwise adversely affect the value of the portfolio of investments. These borrowings are limited to 30% of the
adjusted net asset value.
Investment income denominated in foreign currencies is converted into sterling on receipt. The Group did not use
financial instruments to mitigate the currency exposure in the period between the time that income is included in the
financial statements and its receipt.
During the year, derivative contracts were not used to hedge against exposure to currency risk.
Foreign currency exposure
The fair values of the Group’s monetary items that have foreign currency exposure at 31 October are shown overleaf.
Where the Group’s equity investments (which are not monetary items) are denominated in a foreign currency, they have
been included separately in the analysis so as to show the overall level of exposure.
67899_Hendersons-TEXT.indd 50 16/01/2013 21:00
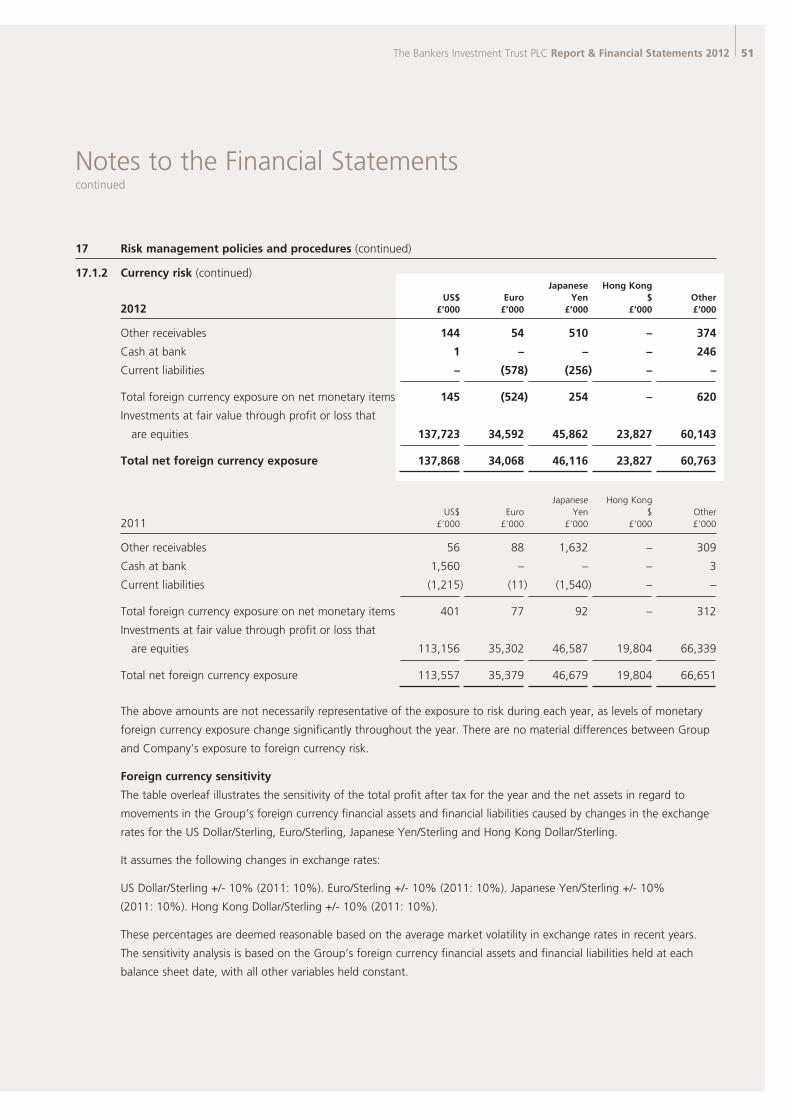
The Bankers Investment Trust PLC Report & Financial Statements 2012 51
Notes to the Financial Statementscontinued
17 Risk management policies and procedures (continued)
17.1.2 Currency risk (continued) Japanese Hong Kong US$ Euro Yen $ Other 2012 £’000 £’000 £’000 £’000 £’000
Other receivables 144 54 510 – 374
Cash at bank 1 – – – 246
Current liabilities – (578) (256) – –
Total foreign currency exposure on net monetary items 145 (524) 254 – 620
Investments at fair value through profit or loss that
are equities 137,723 34,592 45,862 23,827 60,143
Total net foreign currency exposure 137,868 34,068 46,116 23,827 60,763
Japanese Hong Kong US$ Euro Yen $ Other 2011 £’000 £’000 £’000 £’000 £’000
Other receivables 56 88 1,632 – 309
Cash at bank 1,560 – – – 3
Current liabilities (1,215) (11) (1,540) – –
Total foreign currency exposure on net monetary items 401 77 92 – 312
Investments at fair value through profit or loss that
are equities 113,156 35,302 46,587 19,804 66,339
Total net foreign currency exposure 113,557 35,379 46,679 19,804 66,651
The above amounts are not necessarily representative of the exposure to risk during each year, as levels of monetary
foreign currency exposure change significantly throughout the year. There are no material differences between Group
and Company’s exposure to foreign currency risk.
Foreign currency sensitivity
The table overleaf illustrates the sensitivity of the total profit after tax for the year and the net assets in regard to
movements in the Group’s foreign currency financial assets and financial liabilities caused by changes in the exchange
rates for the US Dollar/Sterling, Euro/Sterling, Japanese Yen/Sterling and Hong Kong Dollar/Sterling.
It assumes the following changes in exchange rates:
US Dollar/Sterling +/- 10% (2011: 10%). Euro/Sterling +/- 10% (2011: 10%). Japanese Yen/Sterling +/- 10%
(2011: 10%). Hong Kong Dollar/Sterling +/- 10% (2011: 10%).
These percentages are deemed reasonable based on the average market volatility in exchange rates in recent years.
The sensitivity analysis is based on the Group’s foreign currency financial assets and financial liabilities held at each
balance sheet date, with all other variables held constant.
67899_Hendersons-TEXT.indd 51 16/01/2013 21:00
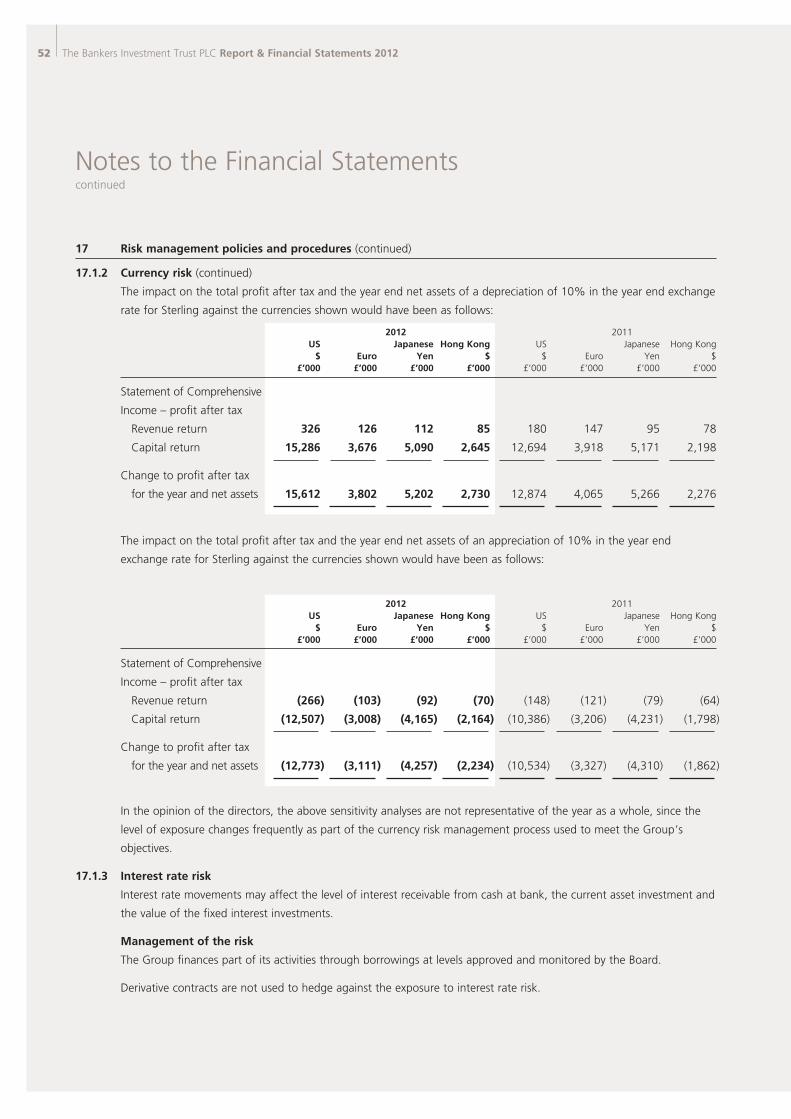
52 The Bankers Investment Trust PLC Report & Financial Statements 2012
Notes to the Financial Statementscontinued
17 Risk management policies and procedures (continued)
17.1.2 Currency risk (continued)
The impact on the total profit after tax and the year end net assets of a depreciation of 10% in the year end exchange
rate for Sterling against the currencies shown would have been as follows:
2012 2011 US Japanese Hong Kong US Japanese Hong Kong $ Euro Yen $ $ Euro Yen $ £’000 £’000 £’000 £’000 £’000 £’000 £’000 £’000
Statement of Comprehensive
Income – profit after tax
Revenue return 326 126 112 85 180 147 95 78
Capital return 15,286 3,676 5,090 2,645 12,694 3,918 5,171 2,198
Change to profit after tax
for the year and net assets 15,612 3,802 5,202 2,730 12,874 4,065 5,266 2,276
The impact on the total profit after tax and the year end net assets of an appreciation of 10% in the year end
exchange rate for Sterling against the currencies shown would have been as follows:
2012 2011 US Japanese Hong Kong US Japanese Hong Kong $ Euro Yen $ $ Euro Yen $ £’000 £’000 £’000 £’000 £’000 £’000 £’000 £’000
Statement of Comprehensive
Income – profit after tax
Revenue return (266) (103) (92) (70) (148) (121) (79) (64)
Capital return (12,507) (3,008) (4,165) (2,164) (10,386) (3,206) (4,231) (1,798)
Change to profit after tax
for the year and net assets (12,773) (3,111) (4,257) (2,234) (10,534) (3,327) (4,310) (1,862)
In the opinion of the directors, the above sensitivity analyses are not representative of the year as a whole, since the
level of exposure changes frequently as part of the currency risk management process used to meet the Group’s
objectives.
17.1.3 Interest rate risk
Interest rate movements may affect the level of interest receivable from cash at bank, the current asset investment and
the value of the fixed interest investments.
Management of the risk
The Group finances part of its activities through borrowings at levels approved and monitored by the Board.
Derivative contracts are not used to hedge against the exposure to interest rate risk.
67899_Hendersons-TEXT.indd 52 16/01/2013 21:00
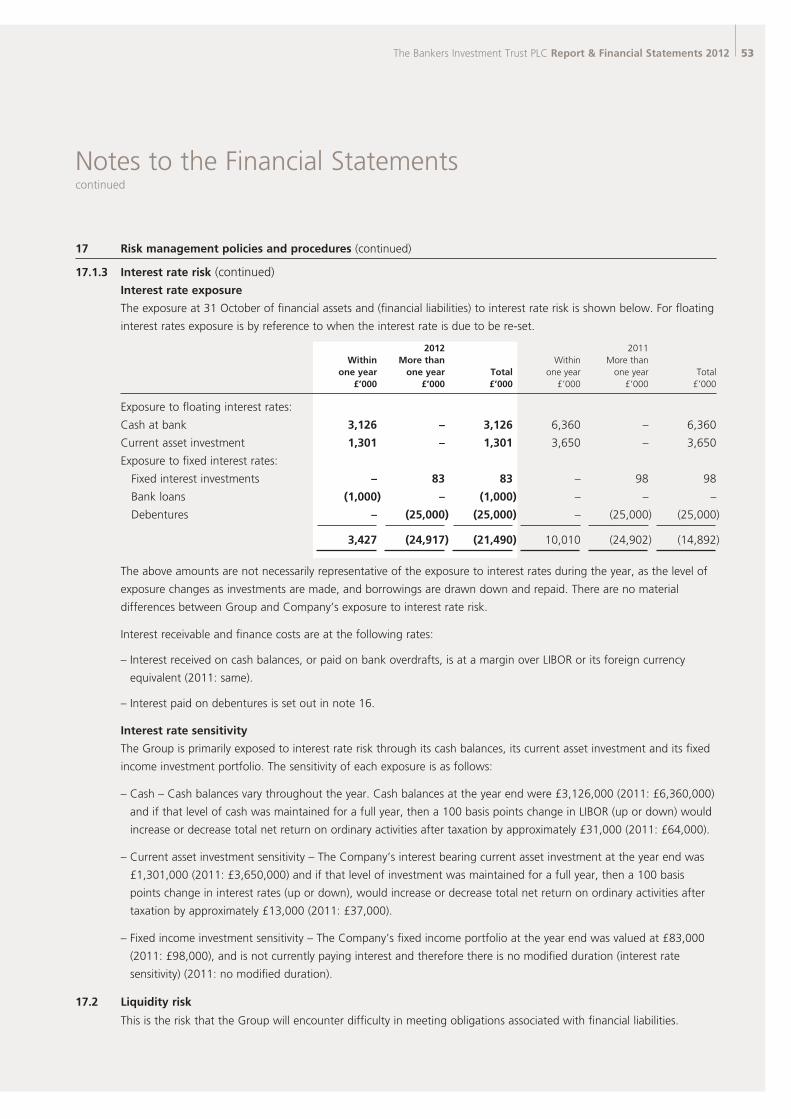
The Bankers Investment Trust PLC Report & Financial Statements 2012 53
Notes to the Financial Statementscontinued
17 Risk management policies and procedures (continued)
17.1.3 Interest rate risk (continued)
Interest rate exposure
The exposure at 31 October of financial assets and (financial liabilities) to interest rate risk is shown below. For floating
interest rates exposure is by reference to when the interest rate is due to be re-set.
2012 2011 Within More than Within More than one year one year Total one year one year Total £’000 £’000 £’000 £’000 £’000 £’000
Exposure to floating interest rates:
Cash at bank 3,126 – 3,126 6,360 – 6,360
Current asset investment 1,301 – 1,301 3,650 – 3,650
Exposure to fixed interest rates:
Fixed interest investments – 83 83 – 98 98
Bank loans (1,000) – (1,000) – – –
Debentures – (25,000) (25,000) – (25,000) (25,000)
3,427 (24,917) (21,490) 10,010 (24,902) (14,892)
The above amounts are not necessarily representative of the exposure to interest rates during the year, as the level of
exposure changes as investments are made, and borrowings are drawn down and repaid. There are no material
differences between Group and Company’s exposure to interest rate risk.
Interest receivable and finance costs are at the following rates:
– Interest received on cash balances, or paid on bank overdrafts, is at a margin over LIBOR or its foreign currency
equivalent (2011: same).
– Interest paid on debentures is set out in note 16.
Interest rate sensitivity
The Group is primarily exposed to interest rate risk through its cash balances, its current asset investment and its fixed
income investment portfolio. The sensitivity of each exposure is as follows:
– Cash – Cash balances vary throughout the year. Cash balances at the year end were £3,126,000 (2011: £6,360,000)
and if that level of cash was maintained for a full year, then a 100 basis points change in LIBOR (up or down) would
increase or decrease total net return on ordinary activities after taxation by approximately £31,000 (2011: £64,000).
– Current asset investment sensitivity – The Company’s interest bearing current asset investment at the year end was
£1,301,000 (2011: £3,650,000) and if that level of investment was maintained for a full year, then a 100 basis
points change in interest rates (up or down), would increase or decrease total net return on ordinary activities after
taxation by approximately £13,000 (2011: £37,000).
– Fixed income investment sensitivity – The Company’s fixed income portfolio at the year end was valued at £83,000
(2011: £98,000), and is not currently paying interest and therefore there is no modified duration (interest rate
sensitivity) (2011: no modified duration).
17.2 Liquidity risk
This is the risk that the Group will encounter difficulty in meeting obligations associated with financial liabilities.
67899_Hendersons-TEXT.indd 53 16/01/2013 21:00
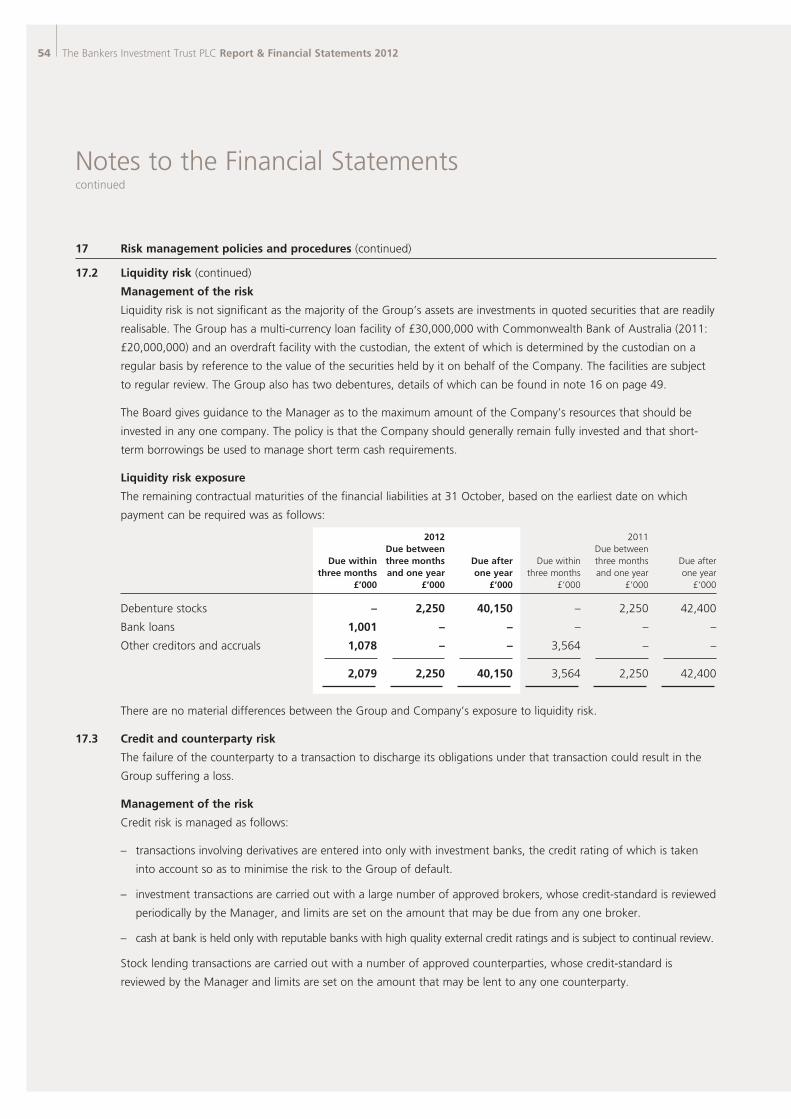
54 The Bankers Investment Trust PLC Report & Financial Statements 2012
Notes to the Financial Statementscontinued
17 Risk management policies and procedures (continued)
17.2 Liquidity risk (continued)
Management of the risk
Liquidity risk is not significant as the majority of the Group’s assets are investments in quoted securities that are readily
realisable. The Group has a multi-currency loan facility of £30,000,000 with Commonwealth Bank of Australia (2011:
£20,000,000) and an overdraft facility with the custodian, the extent of which is determined by the custodian on a
regular basis by reference to the value of the securities held by it on behalf of the Company. The facilities are subject
to regular review. The Group also has two debentures, details of which can be found in note 16 on page 49.
The Board gives guidance to the Manager as to the maximum amount of the Company’s resources that should be
invested in any one company. The policy is that the Company should generally remain fully invested and that short-
term borrowings be used to manage short term cash requirements.
Liquidity risk exposure
The remaining contractual maturities of the financial liabilities at 31 October, based on the earliest date on which
payment can be required was as follows:
2012 2011 Due between Due between Due within three months Due after Due within three months Due after three months and one year one year three months and one year one year £’000 £’000 £’000 £’000 £’000 £’000
Debenture stocks – 2,250 40,150 – 2,250 42,400
Bank loans 1,001 – – – – –
Other creditors and accruals 1,078 – – 3,564 – –
2,079 2,250 40,150 3,564 2,250 42,400
There are no material differences between the Group and Company’s exposure to liquidity risk.
17.3 Credit and counterparty risk
The failure of the counterparty to a transaction to discharge its obligations under that transaction could result in the
Group suffering a loss.
Management of the risk
Credit risk is managed as follows:
– transactions involving derivatives are entered into only with investment banks, the credit rating of which is taken
into account so as to minimise the risk to the Group of default.
– investment transactions are carried out with a large number of approved brokers, whose credit-standard is reviewed
periodically by the Manager, and limits are set on the amount that may be due from any one broker.
– cash at bank is held only with reputable banks with high quality external credit ratings and is subject to continual review.
Stock lending transactions are carried out with a number of approved counterparties, whose credit-standard is
reviewed by the Manager and limits are set on the amount that may be lent to any one counterparty.
67899_Hendersons-TEXT.indd 54 17/01/2013 19:26
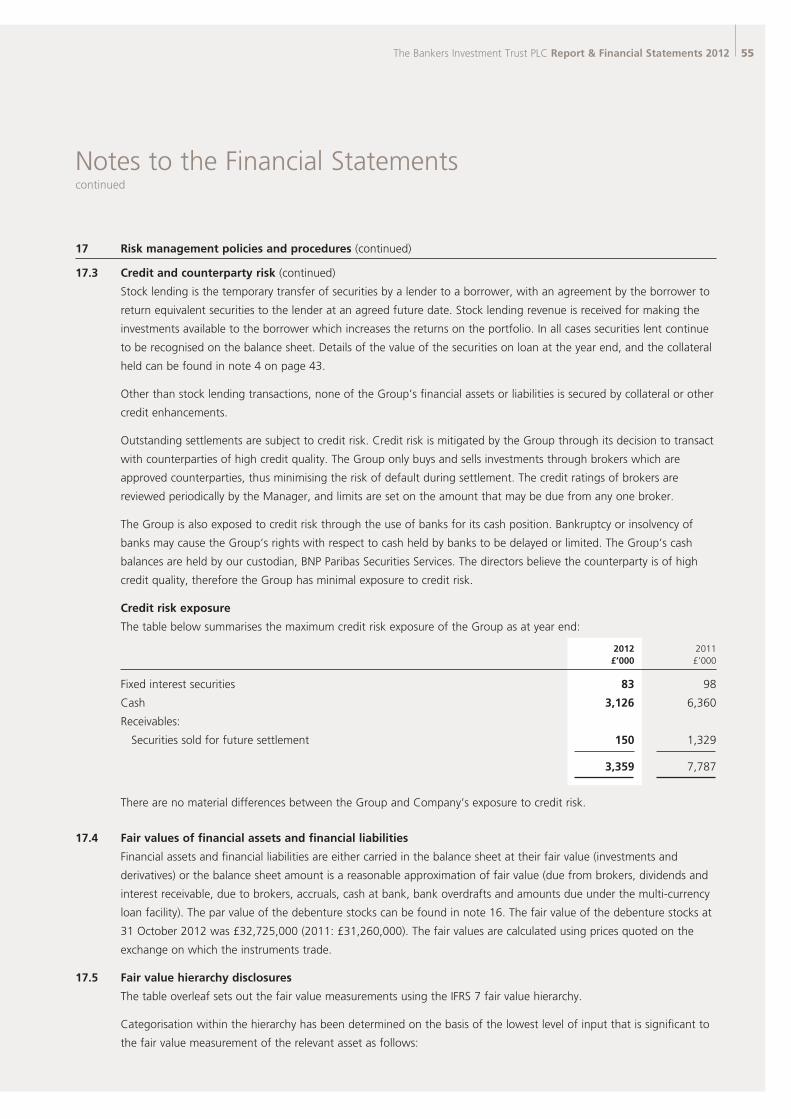
The Bankers Investment Trust PLC Report & Financial Statements 2012 55
Notes to the Financial Statementscontinued
17 Risk management policies and procedures (continued)
17.3 Credit and counterparty risk (continued)
Stock lending is the temporary transfer of securities by a lender to a borrower, with an agreement by the borrower to
return equivalent securities to the lender at an agreed future date. Stock lending revenue is received for making the
investments available to the borrower which increases the returns on the portfolio. In all cases securities lent continue
to be recognised on the balance sheet. Details of the value of the securities on loan at the year end, and the collateral
held can be found in note 4 on page 43.
Other than stock lending transactions, none of the Group’s financial assets or liabilities is secured by collateral or other
credit enhancements.
Outstanding settlements are subject to credit risk. Credit risk is mitigated by the Group through its decision to transact
with counterparties of high credit quality. The Group only buys and sells investments through brokers which are
approved counterparties, thus minimising the risk of default during settlement. The credit ratings of brokers are
reviewed periodically by the Manager, and limits are set on the amount that may be due from any one broker.
The Group is also exposed to credit risk through the use of banks for its cash position. Bankruptcy or insolvency of
banks may cause the Group’s rights with respect to cash held by banks to be delayed or limited. The Group’s cash
balances are held by our custodian, BNP Paribas Securities Services. The directors believe the counterparty is of high
credit quality, therefore the Group has minimal exposure to credit risk.
Credit risk exposure
The table below summarises the maximum credit risk exposure of the Group as at year end:
2012 2011 £’000 £’000
Fixed interest securities 83 98
Cash 3,126 6,360
Receivables:
Securities sold for future settlement 150 1,329
3,359 7,787
There are no material differences between the Group and Company’s exposure to credit risk.
17.4 Fair values of financial assets and financial liabilities
Financial assets and financial liabilities are either carried in the balance sheet at their fair value (investments and
derivatives) or the balance sheet amount is a reasonable approximation of fair value (due from brokers, dividends and
interest receivable, due to brokers, accruals, cash at bank, bank overdrafts and amounts due under the multi-currency
loan facility). The par value of the debenture stocks can be found in note 16. The fair value of the debenture stocks at
31 October 2012 was £32,725,000 (2011: £31,260,000). The fair values are calculated using prices quoted on the
exchange on which the instruments trade.
17.5 Fair value hierarchy disclosures
The table overleaf sets out the fair value measurements using the IFRS 7 fair value hierarchy.
Categorisation within the hierarchy has been determined on the basis of the lowest level of input that is significant to
the fair value measurement of the relevant asset as follows:
67899_Hendersons-TEXT.indd 55 18/01/2013 12:29
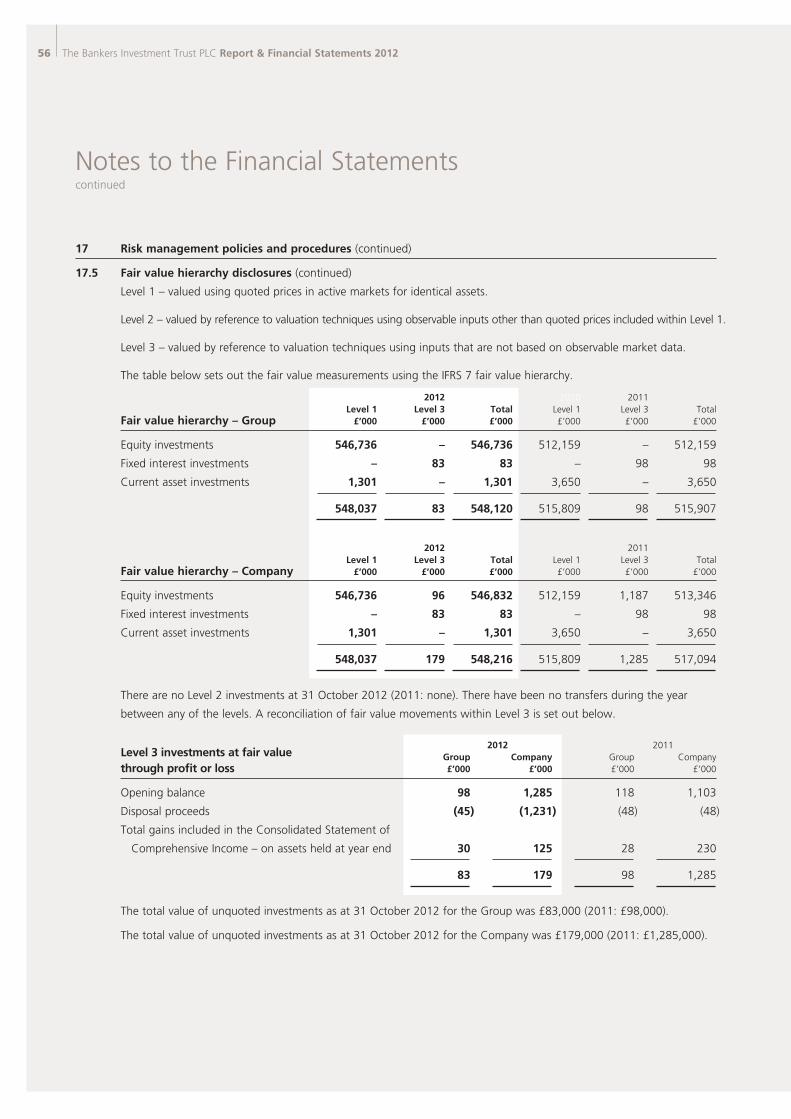
56 The Bankers Investment Trust PLC Report & Financial Statements 2012
Notes to the Financial Statementscontinued
17 Risk management policies and procedures (continued)
17.5 Fair value hierarchy disclosures (continued)
Level 1 – valued using quoted prices in active markets for identical assets.
Level 2 – valued by reference to valuation techniques using observable inputs other than quoted prices included within Level 1.
Level 3 – valued by reference to valuation techniques using inputs that are not based on observable market data.
The table below sets out the fair value measurements using the IFRS 7 fair value hierarchy.
2012 2011 2010 2011 Level 1 Level 3 Total Level 1 Level 3 Total Fair value hierarchy – Group £’000 £’000 £’000 £’000 £’000 £’000
Equity investments 546,736 – 546,736 512,159 – 512,159
Fixed interest investments – 83 83 – 98 98
Current asset investments 1,301 – 1,301 3,650 – 3,650
548,037 83 548,120 515,809 98 515,907
2012 2011 Level 1 Level 3 Total Level 1 Level 3 Total Fair value hierarchy – Company £’000 £’000 £’000 £’000 £’000 £’000
Equity investments 546,736 96 546,832 512,159 1,187 513,346
Fixed interest investments – 83 83 – 98 98
Current asset investments 1,301 – 1,301 3,650 – 3,650
548,037 179 548,216 515,809 1,285 517,094
There are no Level 2 investments at 31 October 2012 (2011: none). There have been no transfers during the year
between any of the levels. A reconciliation of fair value movements within Level 3 is set out below.
Level 3 investments at fair value Group Company Group Company through profit or loss £’000 £’000 £’000 £’000
Opening balance 98 1,285 118 1,103
Disposal proceeds (45) (1,231) (48) (48)
Total gains included in the Consolidated Statement of
Comprehensive Income – on assets held at year end 30 125 28 230
83 179 98 1,285
The total value of unquoted investments as at 31 October 2012 for the Group was £83,000 (2011: £98,000).
The total value of unquoted investments as at 31 October 2012 for the Company was £179,000 (2011: £1,285,000).
2012 2011
67899_Hendersons-TEXT.indd 56 16/01/2013 21:00
The Bankers Investment Trust PLC Report & Financial Statements 2012 57
Notes to the Financial Statementscontinued
17 Risk management policies and procedures (continued)
17.6 Capital management policies and procedures
The Group’s capital management objectives are:
– to ensure that it will be able to continue as a going concern, and
– to generate total return to its equity shareholders in accordance with its objectives through an appropriate balance
of equity capital and debt.
The portfolio includes unquoted investments which represent less than 0.02% (2011: 0.02%) of the total portfolio
and which are held at directors’ fair valuations.
The Group’s capital at 31 October 2012 comprises its equity share capital, reserves and debt that are shown in the
balance sheet at a total of £552,214,000 (2011: £521,331,000).
The Board, with the assistance of the Manager, monitors and reviews the broad structure of the Group’s capital on an
ongoing basis. This review includes:
– the need to buy back equity shares for cancellation, which takes account of the difference between the net asset
value per share and the share price (ie the level of share price discount or premium);
– the need for new issues of equity shares;
– the extent to which revenue in excess of that which is required to be distributed should be retained.
The Company’s policies and processes for managing capital are unchanged from the preceding accounting period.
The Company is subject to several externally imposed capital requirements:
– under the multi-currency facility total borrowings not to exceed 30% of net asset value and net asset value not to
fall below £150,000,000. These are measured in accordance with the policies used in the annual financial
statements.
– as a public company, the Company has a minimum share capital of £50,000.
– in order to be able to pay dividends out of profits available for distribution by way of dividends, the Company has
to be able to meet one of the two capital restriction tests imposed on investment companies by law.
– the terms of the debenture trust deeds have various covenants which prescribe that moneys borrowed should not
exceed 20% to 100% of the adjusted total of capital and reserves as defined in the debenture trust deeds. These
are measured in accordance with the policies used in the annual financial statements.
These requirements are unchanged since last year, and the Company has complied with them throughout the year.
67899_Hendersons-TEXT.indd 57 16/01/2013 21:00
58 The Bankers Investment Trust PLC Report & Financial Statements 2012
Notes to the Financial Statementscontinued
18 Net asset value per ordinary share
The net asset value per ordinary share is based on net assets attributable to ordinary shares of £526,214,000
(2011: £496,331,000) and on the 110,906,839 ordinary shares in issue at 31 October 2012 (2011: 111,051,839).
The Company has no securities in issue that could dilute the net asset value per ordinary share.
The movements during the year in net assets attributable to the ordinary shares were as follows:
2012 2011 £’000 £’000
Net assets attributable to ordinary shares at start of year 496,331 501,955
Total net profit on ordinary activities after taxation 44,848 8,346
Dividends paid (14,371) (13,830)
Buy back of ordinary shares (594) (140)
Net assets attributable to ordinary shares at end of year 526,214 496,331
2012 2011 19 Called up share capital (Group and Company) £’000 £’000
Authorised, allotted, issued and fully paid:
110,906,839 (2011: 111,051,839) ordinary shares of 25p each 27,727 27,763
During the year, 145,000 (2011: 34,000) ordinary shares were bought back for cancellation at a cost of £594,000
(2011: £140,000). Further details can be found on page 29.
2012 2011 20 Share premium account £’000 £’000
As at 31 October 452 452
Capital Capital reserve arising Capital reserve arising on revaluation Total redemption on investments of investments other capital reserve sold held reserves 21 Capital redemption and other capital reserves £’000 £’000 £’000 £’000
(a) Group
At 1 November 2011 12,447 311,493 113,692 425,185
Transfer on disposal of assets – 2,893 (2,893) –
Net gains on investments – 15,202 16,467 31,669
Net losses on foreign exchange – (46) – (46)
Expenses and finance costs charged to capital net
of tax relief – (2,134) – (2,134)
Purchases of own shares for cancellation 36 (594) – (594)
At 31 October 2012 12,483 326,814 127,266 454,080
67899_Hendersons-TEXT.indd 58 16/01/2013 21:00
The Bankers Investment Trust PLC Report & Financial Statements 2012 59
Notes to the Financial Statementscontinued
21 Capital redemption and other capital reserves (continued)
Capital Capital reserve arising Capital reserve arising on revaluation Total redemption on investments of investments other capital reserve sold held reserves £’000 £’000 £’000 £’000
(b) Company
At 1 November 2011 12,447 311,493 114,879 426,372
Transfer on disposal of assets – 2,893 (2,893) –
Net gains on investments – 15,202 15,376 30,578
Net losses on foreign exchange – (46) – (46)
Expenses and finance costs charged to capital net
of tax relief – (2,134) – (2,134)
Purchases of own shares for cancellation 36 (594) – (594)
At 31 October 2012 12,483 326,814 127,362 454,176
2012 2011 Group Company Group Company 22 Revenue reserve £’000 £’000 £’000 £’000
At start of year 30,484 29,297 31,007 30,022
Net revenue profit after tax for the year 15,359 16,450 13,307 13,105
Dividends paid (14,371) (14,371) (13,830) (13,830)
At end of year 31,472 31,376 30,484 29,297
23 Contingent commitments
As at 31 October 2012 there were no contingent commitments in respect of sub-underwriting for the Group and
Company (2011: none).
24 Transactions with the Investment Manager
Under the terms of an agreement dated 23 June 2006 the Company has appointed wholly owned subsidiary
companies of Henderson Group plc (“Henderson”) to provide investment management, accounting, secretarial and
administrative services. Details of the management fee arrangements for these services are given in the Report of the
Directors on page 22. The total fees paid or payable under this agreement to Henderson in respect of the year ended
31 October 2012 were £1,578,000 (2011: £1,507,000), of which £263,000 is included in prepayments at 31 October
2012 (2011: accrual £126,000).
No performance fee was payable to Henderson for the year ended 31 October 2012 (2011: £nil).
In addition to the above services, Henderson has provided the Company with marketing services during the year.
The total fees paid or payable for these services for the year ended 31 October 2012 amounted to a charge of
£66,000 (2011: £78,000), of which £5,000 was outstanding at 31 October 2012 (2011: £27,000).
67899_Hendersons-TEXT.indd 59 16/01/2013 21:00
60 The Bankers Investment Trust PLC Report & Financial Statements 2012
Notes to the Financial Statementscontinued
25 Operating segments
The Directors consider that the Group has two operating segments, being the parent Company, The Bankers
Investment Trust PLC, which invests in shares and securities primarily for capital appreciation in accordance with the
Company’s published investment objective, and its wholly owned subsidiary, The Army and Navy Investment Company
Limited, which trades in securities to enhance Group returns. Discrete financial information for these sectors is
reviewed regularly by the Manager and the Board who allocate resources and assess performance.
2012 2011 Parent Subsidiary Parent Subsidiary Company Undertaking Total Company Undertaking Total Segment financial information £’000 £’000 £’000 £’000 £’000 £’000
Total income – external 50,097 119 50,216 13,338 265 13,603
Total expenses (2,303) – (2,303) (2,203) – (2,203)
Finance costs (2,260) – (2,260) (2,353) – (2,353)
Taxation (781) (24) (805) (638) (63) (701)
Profit and total comprehensive income 44,753 95 44,848 8,144 202 8,346
Total assets 552,991 301 553,292 523,527 1,368 524,895
Total liabilities (26,873) (205) (27,078) (28,383) (181) (28,564)
Total equity 526,118 96 526,214 495,144 1,187 496,331
67899_Hendersons-TEXT.indd 60 16/01/2013 21:00
The Bankers Investment Trust PLC Report & Financial Statements 2012 61
Independent Auditors’ Report to the members of The Bankers Investment Trust PLC
We have audited the financial statements of The Bankers Investment Trust PLC for the year ended 31 October 2012 which comprise the Consolidated Statement of Comprehensive Income, the Consolidated and Parent Company Statements of Changes in Equity, the Consolidated and Parent Company Balance Sheets, the Consolidated and Parent Company Cash Flow Statements and the related notes. The financial reporting framework that has been applied in their preparation is applicable law and International Financial Reporting Standards (IFRSs) as adopted by the European Union and, as regards the parent company financial statements, as applied in accordance with the provisions of the Companies Act 2006.
Respective responsibilities of directors and auditors As explained more fully in the Statement of Directors’ Responsibilities set out on page 33, the directors are responsible for the preparation of the financial statements and for being satisfied that they give a true and fair view. Our responsibility is to audit and express an opinion on the financial statements in accordance with applicable law and International Standards on Auditing (UK and Ireland). Those standards require us to comply with the Auditing Practices Board’s Ethical Standards for Auditors.
This report, including the opinions, has been prepared for and only for the Company’s members as a body in accordance with Chapter 3 of Part 16 of the Companies Act 2006 and for no other purpose. We do not, in giving these opinions, accept or assume responsibility for any other purpose or to any other person to whom this report is shown or into whose hands it may come save where expressly agreed by our prior consent in writing.
Scope of the audit of the financial statements An audit involves obtaining evidence about the amounts and disclosures in the financial statements sufficient to give reasonable assurance that the financial statements are free from material misstatement, whether caused by fraud or error. This includes an assessment of: whether the accounting policies are appropriate to the Group’s and the Parent Company’s circumstances and have been consistently applied and adequately disclosed; the reasonableness of significant accounting estimates made by the directors; and the overall presentation of the financial statements. In addition, we read all the financial and non-financial information in the Report and Financial Statements to identify material inconsistencies with the audited financial statements. If we become aware of any apparent material misstatements or inconsistencies we consider the implications for our report.
Opinion on financial statements In our opinion:
l the financial statements give a true and fair view of the state of the Group’s and of the Parent Company’s affairs as at 31 October 2012 and of the Group’s profit and Group’s and Parent Company’s cash flows for the year then ended;
l the Group financial statements have been properly prepared in accordance with IFRSs as adopted by the European Union;
l the Parent Company financial statements have been properly prepared in accordance with IFRSs as adopted by the European Union and as applied in accordance with the provisions of the Companies Act 2006; and
l the financial statements have been prepared in accordance with the requirements of the Companies Act 2006 and, as regards the Group financial statements, Article 4 of the lAS Regulation.
Opinion on other matters prescribed by the Companies Act 2006 In our opinion:
l the part of the Directors’ Remuneration Report to be audited has been properly prepared in accordance with the Companies Act 2006; and
l the information given in the Report of the Directors for the financial year for which the financial statements are prepared is consistent with the financial statements.
Matters on which we are required to report by exception We have nothing to report in respect of the following:
Under the Companies Act 2006 we are required to report to you if, in our opinion:
l adequate accounting records have not been kept by the Parent Company, or returns adequate for our audit have not been received from branches not visited by us; or
l the Parent Company financial statements and the part of the Directors’ Remuneration Report to be audited are not in agreement with the accounting records and returns; or
l certain disclosures of directors’ remuneration specified by law are not made; or
l we have not received all the information and explanations we require for our audit.
Under the Listing Rules we are required to review:
l the directors’ statement, set out on page 21, in relation to going concern;
l the parts of the Corporate Governance Statement relating to the Company’s compliance with the nine provisions of the UK Corporate Governance Code specified for our review; and
l certain elements of the report to shareholders by the Board on directors’ remuneration.
Sally Cosgrove (Senior Statutory Auditor) for and on behalf of PricewaterhouseCoopers LLP Chartered Accountants and Statutory Auditors London, 18 January 2013
67899_Hendersons-TEXT.indd 61 16/01/2013 21:00
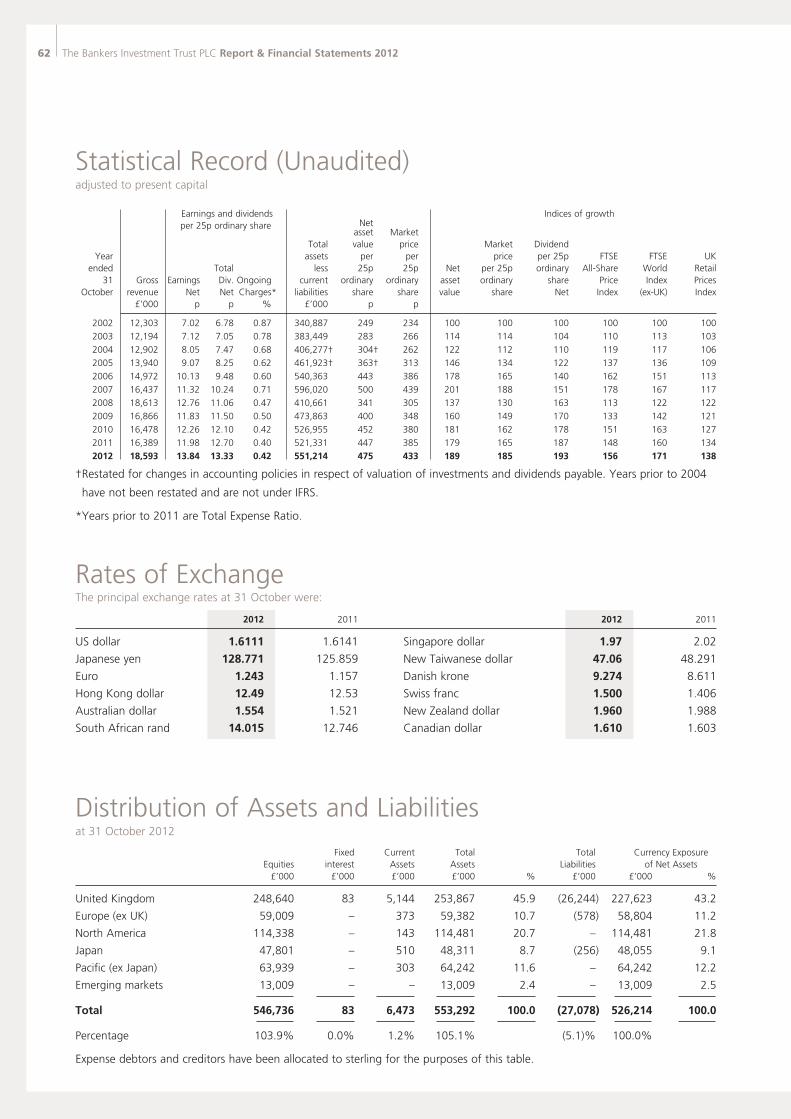
62 The Bankers Investment Trust PLC Report & Financial Statements 2012
Statistical Record (Unaudited)adjusted to present capital
Earnings and dividends Indices of growth per 25p ordinary share Net asset Market Total value price Market Dividend Year assets per per price per 25p FTSE FTSE UK ended Total less 25p 25p Net per 25p ordinary All-Share World Retail 31 Gross Earnings Div. Ongoing current ordinary ordinary asset ordinary share Price Index Prices October revenue Net Net Charges* liabilities share share value share Net Index (ex-UK) Index £’000 p p % £’000 p p
2002 12,303 7.02 6.78 0.87 340,887 249 234 100 100 100 100 100 100
2003 12,194 7.12 7.05 0.78 383,449 283 266 114 114 104 110 113 103
2004 12,902 8.05 7.47 0.68 406,277† 304† 262 122 112 110 119 117 106
2005 13,940 9.07 8.25 0.62 461,923† 363† 313 146 134 122 137 136 109
2006 14,972 10.13 9.48 0.60 540,363 443 386 178 165 140 162 151 113
2007 16,437 11.32 10.24 0.71 596,020 500 439 201 188 151 178 167 117
2008 18,613 12.76 11.06 0.47 410,661 341 305 137 130 163 113 122 122
2009 16,866 11.83 11.50 0.50 473,863 400 348 160 149 170 133 142 121
2010 16,478 12.26 12.10 0.42 526,955 452 380 181 162 178 151 163 127
2011 16,389 11.98 12.70 0.40 521,331 447 385 179 165 187 148 160 134
2012 18,593 13.84 13.33 0.42 551,214 475 433 189 185 193 156 171 138
† Restated for changes in accounting policies in respect of valuation of investments and dividends payable. Years prior to 2004
have not been restated and are not under IFRS.
* Years prior to 2011 are Total Expense Ratio.
Distribution of Assets and Liabilitiesat 31 October 2012
Fixed Current Total Total Currency Exposure Equities interest Assets Assets Liabilities of Net Assets £’000 £’000 £’000 £’000 % £’000 £’000 %
United Kingdom 248,640 83 5,144 253,867 45.9 (26,244) 227,623 43.2
Europe (ex UK) 59,009 – 373 59,382 10.7 (578) 58,804 11.2
North America 114,338 – 143 114,481 20.7 – 114,481 21.8
Japan 47,801 – 510 48,311 8.7 (256) 48,055 9.1
Pacific (ex Japan) 63,939 – 303 64,242 11.6 – 64,242 12.2
Emerging markets 13,009 – – 13,009 2.4 – 13,009 2.5
Total 546,736 83 6,473 553,292 100.0 (27,078) 526,214 100.0
Percentage 103.9% 0.0% 1.2% 105.1% (5.1)% 100.0%
Rates of ExchangeThe principal exchange rates at 31 October were:
2012 2011 2012 2011
US dollar 1.6111 1.6141 Singapore dollar 1.97 2.02
Japanese yen 128.771 125.859 New Taiwanese dollar 47.06 48.291
Euro 1.243 1.157 Danish krone 9.274 8.611
Hong Kong dollar 12.49 12.53 Swiss franc 1.500 1.406
Australian dollar 1.554 1.521 New Zealand dollar 1.960 1.988
South African rand 14.015 12.746 Canadian dollar 1.610 1.603
Expense debtors and creditors have been allocated to sterling for the purposes of this table.
67899_Hendersons-TEXT.indd 62 16/01/2013 21:00
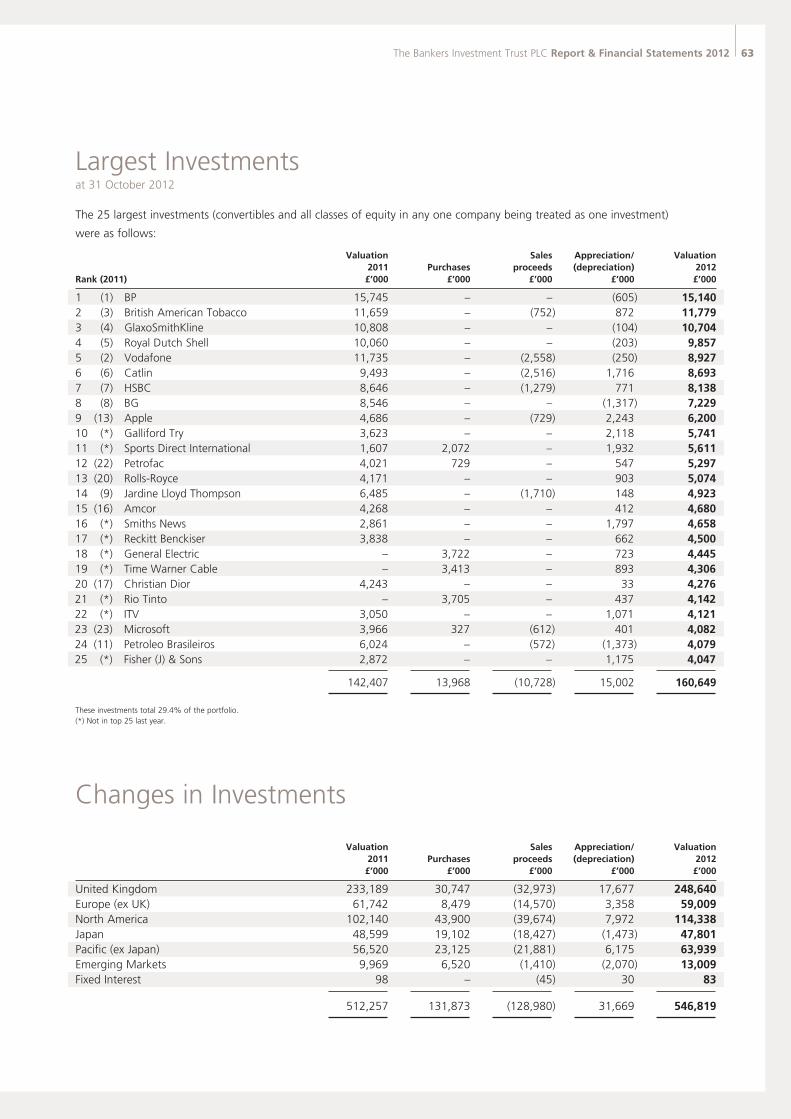
The Bankers Investment Trust PLC Report & Financial Statements 2012 63
Largest Investmentsat 31 October 2012
Changes in Investments
Valuation Sales Appreciation/ Valuation 2011 Purchases proceeds (depreciation) 2012 £’000 £’000 £’000 £’000 £’000
United Kingdom 233,189 30,747 (32,973) 17,677 248,640 Europe (ex UK) 61,742 8,479 (14,570) 3,358 59,009 North America 102,140 43,900 (39,674) 7,972 114,338 Japan 48,599 19,102 (18,427) (1,473) 47,801 Pacific (ex Japan) 56,520 23,125 (21,881) 6,175 63,939 Emerging Markets 9,969 6,520 (1,410) (2,070) 13,009 Fixed Interest 98 – (45) 30 83
512,257 131,873 (128,980) 31,669 546,819
The 25 largest investments (convertibles and all classes of equity in any one company being treated as one investment)
were as follows:
Valuation Sales Appreciation/ Valuation 2011 Purchases proceeds (depreciation) 2012 Rank (2011) £’000 £’000 £’000 £’000 £’000
1 (1) BP 15,745 – – (605) 15,140 2 (3) British American Tobacco 11,659 – (752) 872 11,779 3 (4) GlaxoSmithKline 10,808 – – (104) 10,704 4 (5) Royal Dutch Shell 10,060 – – (203) 9,857 5 (2) Vodafone 11,735 – (2,558) (250) 8,927 6 (6) Catlin 9,493 – (2,516) 1,716 8,693 7 (7) HSBC 8,646 – (1,279) 771 8,138 8 (8) BG 8,546 – – (1,317) 7,229 9 (13) Apple 4,686 – (729) 2,243 6,200 10 (*) Galliford Try 3,623 – – 2,118 5,741 11 (*) Sports Direct International 1,607 2,072 – 1,932 5,611 12 (22) Petrofac 4,021 729 – 547 5,297 13 (20) Rolls-Royce 4,171 – – 903 5,074 14 (9) Jardine Lloyd Thompson 6,485 – (1,710) 148 4,923 15 (16) Amcor 4,268 – – 412 4,680 16 (*) Smiths News 2,861 – – 1,797 4,658 17 (*) Reckitt Benckiser 3,838 – – 662 4,500 18 (*) General Electric – 3,722 – 723 4,445 19 (*) Time Warner Cable – 3,413 – 893 4,306 20 (17) Christian Dior 4,243 – – 33 4,276 21 (*) Rio Tinto – 3,705 – 437 4,142 22 (*) ITV 3,050 – – 1,071 4,121 23 (23) Microsoft 3,966 327 (612) 401 4,082 24 (11) Petroleo Brasileiros 6,024 – (572) (1,373) 4,079 25 (*) Fisher (J) & Sons 2,872 – – 1,175 4,047 142,407 13,968 (10,728) 15,002 160,649
These investments total 29.4% of the portfolio. (*) Not in top 25 last year.
67899_Hendersons-TEXT.indd 63 17/01/2013 19:26
64 The Bankers Investment Trust PLC Report & Financial Statements 2012
Investor Information
Results
Half year announced June
Full year announced January
The Report and Financial Statements are posted to shareholders
in January and the AGM is held in London in late February.
Share Price Information
The market price of the Company’s ordinary shares is
published in The Financial Times and other leading
newspapers. The share price and details of the Company’s
performance can be found on the following websites:
www.bankersinvestmenttrust.com
and www.henderson.com
The London Stock Exchange Daily Official List (SEDOL) code is
0076700.
The Financial Times also provides on a daily basis an estimate of
the net asset value and of the discount/premium.
A brief historyThe Company was incorporated in 1888. Since seven of the nine
original directors were bankers by profession, the name The
Bankers’ Investment Trust, Limited was considered appropriate.
The Company has paid dividends on the equity capital every year
since incorporation except in the years 1892 and 1893.
Keeping up to date with The Bankers Investment Trust PLC
WebsiteFor more information about The Bankers Investment Trust PLC
visit the website at www.bankersinvestmenttrust.com
HGiHGi is a content platform that offers a new level of online
personalisation where you can ‘follow’ investment experts,
topics and the trusts that are of interest to you. By creating
your HGi profile you will be updated regularly on the topics
that interest you most, bringing you closer to Henderson’s
investment expertise.
Scan the QR code or use this
short URL to register for HGi.
http://HGi.co/g51
Follow us on TwitterTo get the latest updates follow us on
Twitter @HGiTrusts
Investing in BankersOrdinary shares may be bought directly through Halifax Share
Dealing. In addition, they may be bought or sold directly
through a stockbroker, accountant, other independent financial
adviser or through a number of banks or building societies who
are also providing this service.
Dividends
Ordinary shares:
First interim paid end May
Second interim paid end August
Third interim paid end November
Final paid end February
Debenture stock interest
101⁄2% debenture stock 2016 and 8% debenture stock 2023
paid on 30 April and 31 October.
Ongoing charges
Ongoing charges are those expenses of a type which are likely to
recur in the foreseeable future, whether charged to capital or
revenue, and which relate to the operation of the Company as a
collective fund, excluding the costs of acquisition or disposal of
investments, financing charges and gains or losses arising on
investments. Ongoing charges are based on actual costs incurred
in the year as being the best estimate of future costs.
Nominee Code
l The Bankers Investment Trust PLC undertakes to provide
copies of shareholder communications to nominee operators
who have indicated in advance a wish to receive them, for
the purpose of distribution to their customers.
l Nominee operators are encouraged to advise investors that
they are able to attend meetings and to speak at meetings
when invited by the Chairman.
l Investors through Halifax Share Dealing Limited receive all
shareholder communications, an invitation to the AGM and
a Voting Instruction Form to facilitate voting.
Disability
Copies of this Report and Financial Statement or other
documents issued by the Company are available from the
Company Secretary.
If needed, copies can be made available in a variety of formats,
either Braille or on audio tape or larger type as appropriate.
You can contact our registrars, Equiniti Limited, who have
installed textphones to allow speech and hearing impaired
people who have their own textphone to contact them directly
by ringing 0870 600 3950 without the need for an intermediate
operator. Specially trained operators are available during normal
business hours to answer queries via this service.
Alternatively, if you prefer to go through a ‘typetalk’ operator
(provided by the Royal National Institute for Deaf People) you
should dial 18001 followed by the number you wish to dial.
67899_Hendersons-TEXT.indd 64 16/01/2013 21:00
The Bankers Investment Trust PLC
l To achieve long term asset growth in excess of
the FTSE All-Share Index.
l To achieve regular dividend growth in excess of the
increase in the Retail Prices Index.
l To achieve both these objectives by investing in a
broadly diversified international portfolio of shares.
Objectives
Policy
The Company is a member of
Investor Informationcontinued
DirectorsRichard Brewster (Chairman) Richard Burns Susan Inglis (appointed 1 November 2012) Richard Killingbeck (Senior Independent Director) Peter Sullivan Matthew Thorne
Audit CommitteeMatthew Thorne (Chairman) Susan Inglis Richard Killingbeck Peter Sullivan
Management Engagement CommitteeRichard Brewster (Chairman) Richard Burns Susan Inglis Richard Killingbeck Peter Sullivan Matthew Thorne
Nominations CommitteeRichard Brewster (Chairman) Richard Killingbeck Peter Sullivan
Investment ManagerHenderson Global Investors Limited is authorised and regulated by the Financial Services Authority and is represented by Alex Crooke
SecretaryHenderson Secretarial Services Limited represented by Wendy King FCIS
Registered NumberRegistered in England No. 00026351
Registered Office201 Bishopsgate, London EC2M 3AETelephone: 020 7818 1818
The Company is a member of
Independent AuditorsPricewaterhouseCoopers LLP, 7 More London Riverside, London SE1 2RT
Registrars
UK RegistrarEquiniti Limited, Aspect House, Spencer Road, Lancing, West Sussex BN99 6DA Telephone: 0871 384 2471 +44(0)121 415 7047 Calls to this number cost 8p per minute plus network extras. Lines are open 8.30 am to 5.30 pm, Monday to Friday.
There is now a range of shareholder information online. You can check your holding and find practical help on transferring shares or updating your details at www.shareview.co.uk
New Zealand RegistrarComputershare Investor Services Limited, Private Bag 92119, Victoria Street West, Auckland 1142, New Zealand Telephone: (New Zealand) (64) 09 488 8777
Stockbrokers
UKJP Morgan Cazenove, 25 Bank Street, Canary Wharf, London E14 5SP
New Zealand First NZ Capital Securities, Level 20, ANZ Centre, 23-29 Albert Street, PO Box 5333, Auckland, New Zealand
SolicitorsNorton Rose, 3 More London Riverside, London SE1 2AQ
CustodianBNP Paribas Securities Services, 55 Moorgate, London EC2R 6PA
Halifax Share Dealing Limited Lovell Park Road, Leeds LS1 1NS Telephone: 0845 609 0408 Email: communications@halifax Website: www.halifax.co.uk
67899_Henderson-Cover.indd 2 16/01/2013 19:35

HGI9201/2012
The Bankers Investment Trust PLC is managed by
This report is printed on Revive, a paper containing 50% recycled fibre from both pre- and post-consumer waste and 50% FSC® certified virgin fibre. Pulps used are elemental chlorine free manufactured at a mill accredited with the ISO 14001 environmental management system.
The FSC logo identifies products which contain wood from well managed forests certified in accordance with the rules of the Forest Stewardship Council.
This report was printed by Pureprint Group using their pureprint environmental print technology which minimises the negative environmental impacts of the printing process. Vegetable-based inks were used throughout and 99% of the dry waste and 95% of the cleaning solvents associated with this production were recycled. Pureprint Group is a CarbonNeutral® company.
The B
ankers In
vestmen
t Trust PLC
– Rep
ort an
d Fin
ancial Statem
ents fo
r the year en
ded
31 Octo
ber 2012
HG
I9201/2012
The Bankers Investment Trust PLCReport and Financial Statements for the year ended 31 October 2012
67899_Henderson-Cover.indd 1 16/01/2013 19:35