Embed Size (px)
Citation preview

Acta Medica Scandinavica. Vol. CX, fasc. 11-111, 1942.
Frorn The Bispebjerg Hospital, Medical Department C., Copenhagen.
The Bearing of the Ascorbic Acid Content of the Blood on the Course of the Blood
Sugar Curve. BY
K N U D SECHER.
(Submitted for publication December 15th, 1941).
l h e course of the blood sugar curve after loading with glucose or similar preparations was until now considered to show the carbo- hydrate metaholism of the person in question. Tolerance tests have been used as decisive factor in differential diagnoses, particu- larly with regard to the question of diabetes. Faber and Nargaard showed in 1910 t h a t the blood sugar threshold is a special characte- ristic of every single individual, as i t is found time and again a t the same level in the same person.
In later years, numerous investigations have been published showing tha t in connection with infections glycosurias may appeal, which disappear again when the infection is over. In 1932, Williams and ]lick have rendered a detailed account of this question and gathered together 1 he literature; reference is made to same. Men- tion should be made tha t Hibbard and Morissey have found gly- cosuria in connection with diphtheria, Commidge with diphtheria, scarlatina, typhus, appendicitis, morbilli; glycosuria has also been found in connection with malaria, lobar pneumonia, tonsillitis, etc.
Williams and Dick have found glycosuria in 4 1/2 per cent of patients suffering from acute infections.

256 K N U D S E C H E R .
From various quarters the assertion has been made that changes are encountered here which may possibly pave the way for a dia- betes. This view is held, for instance, by Brems and Nissen, in a paper from 1932. Upon loading with sugar, they found blood sugar values as high as 260 in patients suffering from infectious diseases.
I t has also proved possible to obtain the same result by injec- tion of killed bacteria: Bact. coli and proteus vulgaris (Zecker and Goodell), dysentery, Staphylococcus pyogen. aur., and others (Lavine and Kolan).
The examinations of the author have their point of departure in the works of Pemberton and his pupils on the carbohydrate metabolism in patients suffering from joint lesions. Pemberton has shown that in such patients the carbohydrate metabolism is lowered, and the curves obtained upon tolerance tests consequently correspond to those of diabetics; further, i t appears that as treat- ment proceeds, the curves change and become normal.
The results have been corroborated by Holsti, by Pringle and Miller, Bersaque and Berat.
The investigations of later years have shown that in patients suffering from infectious diseases, and also in sound persons a t cer- tain times of the year, particularly in spring, ascorbic acid may be found to be totally lacking in the blood. Together with the other investigations concerning the bearing of vitamins on infectious dise- ases, these results have formed the basis of the witamin treatment)) indicated by the author in connection with sanocrysin treatment.
With this background, it was natural to repeat Pemberton’s exa- minations in order to find out whether the ascorbic acid content of the blood had any bearing on the course of the bleod sugar curve. Tolerance tests have consequently been undertaken with a series of patients, with 70 g glucose or 77 g dextropur. The blood sugar analyses we1 e repeated ad modum Hagedorn-Norman Jensen. The blood samples were taken fasting, f / 4 , y2, 3/, 1, 1 %, 2, and 2 1/2 hours after ingestion of sugar. The ascorbic acid determina- tions were undertaken according to Farmer and Abt’s method.
As already mentioned in previous works, it proves that the reaction described by Pemberton is not characteristic of patients suffering fram diseases of the joints, such reaction being found in various kinds of patients who have in common that there is no ascorbic acid in the blood.
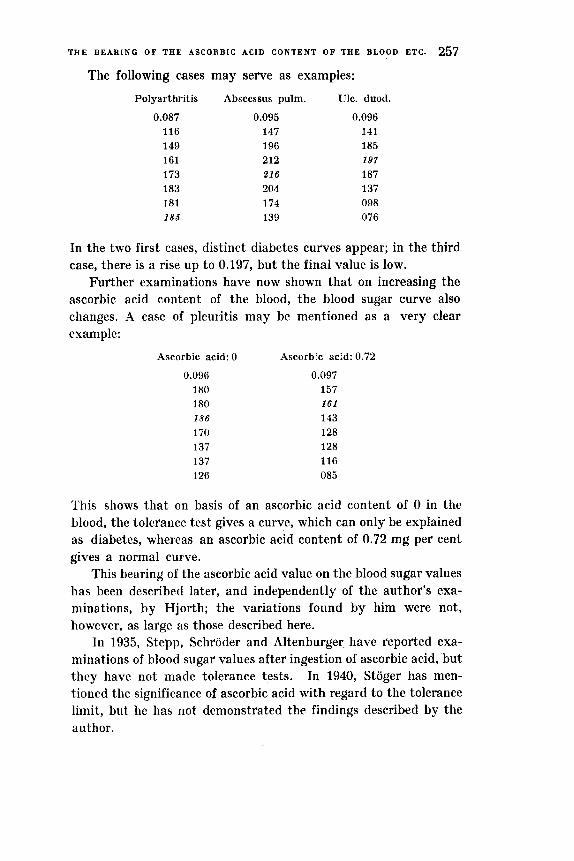
T H E B E A R I N G O F THE A S C O R B I C ACID C O N T E N T O F THE BLOOD ETC. 257
The following cases may serve as examples:
Polyarthritis
0.087 116 149 161 173 183 181 185
Abscessus pulm.
0.095 147 196 212 21 6 204 174 139
Ulc. duod.
0.096 141 185 197 187 137 098 076
In the two first cases, distinct diabetes curves appear; in the third case, there is a rise up to 0.197, but the final value is low.
Further examinations have now shown that on increasing the ascorbic acid content of the blood, the blood sugar curve also changes. A case of pleuritis may be mentioned as a very clear example:
Ascorbic acid: 0
0.096 180 180 186 170 137 137 126
Ascorbic acid: 0.72
0.097 157 161 143 128 128 116 085
'lhis shows that on basis of an ascorbic acid content of 0 in the blood, the tolerance test gives a curve, which can only be explained as diabetes, whereas an ascorbic acid content of 0.72 mg per cent gives a normal curve.
This bearing of the ascorbic acid value on the blood sugar values has been described later, and independently of the author's exa- minations, by Hjorth; the variations found by him were not, however, as large as those described here.
In 1935, Stepp, Schroder and Altenburger have reported exa- minations of blood sugar values after ingestion of ascorbic acid, but they have not made tolerance tests. In 1940, Stoger has men- tioned the significance of ascorbic acid with regard to the tolerance limit, but he has not demonstrated the findings described by the author.

258 K N U D S E C H E R .
As another example, a case of febris rheumatica may he stated:
Sernm-ascorbic acid 0.20
0.106 143 161 163 200
192 137 145
Serum-ascorb:c acid 1 .00
0.085 092 086 141 133 1 5 3
127 110
This case shows, with the low ascorbic acid value of 0.2 mg per cent, a rise to 200 and a closing value of 145, while the curve with 1.00 mg per cent is normal.
These factors mean a great deal in the differential diagnosis. One can no longer take i t for granted tha t an abnormal sugar tolerance curve nieans abnormal carbohydrate metabolism. In absolutely sound individuals, in whose urine sugar is found, an ascorbic acid value of 0 may render i t possible to find diabetes curves, whereas increase of the ascorbic acid value shows a normal curve as result.
The bearing of the ascorbic acid values on the blood sugar curve is elucidated by a few examples:
A case of croupous pneumonia:
Serum-ascorbic Serum-ascorbic Serum-ascorbic acid 0 acid 1.0 acid 0.72
0.1 08 150 193 225 225
209 172 148
0.099 137 155 157
143 124 128 124
0.075 135 153 1 6 1
149 141 114 127
With an ascorbic acid value of 0, blood sugar values as high as 0.225 are found; further values show a fall in the blood sugar curve, which does not, however, become normal during the time of obser- vation.

THE B E A R I N G O F T H E A S C O R B I C A C I D C O N T E N T O F THE BLOOD E T C . 259
A woman, 44 years old, is admitted after glycosuria has been substantiated:
25.5 0.098 137 174 198 182 126 108 102
3.6 0.086 117 181 154 139 123 112 092
The first curve shows a rise to 0.198, but after 200 mg ascorbic acid have been given for a couple of days, the rise is only to 0.154, a normal curve.
This bearing of the ascorbic acid content on the height of the curve is elucidated by the following case of bronchial asthma, sugar being found in the urine:
12.6 Serum-ascorbic acid 0.24
0.108 153 222 250 280 228 145 095
26.6 Serum-ascorbic acid 0.84
0.117 123 154 197 197 167 105 089
25.7 Serum-ascorbic acid 1.04
0.089 092 159 166 1 8 8 178 143 089
The maximum of the curves varies, falling from 0.280 to 0.197 and 0.188.
A patient is admitted, suffering from bronchitis. She states that 4 years ago diabetes was found, and she has taken insulin. The urine is free from sugar, and the blood sugar value is normal.
Serum-ascorbic acid 0.12 0.086
119 193 205 2 7 7 257 185 137
Serum-ascorbic acid 0.44 0.116 123 174 213 21 7 190 164 119

260 K h U D S E C H E R .
The tolerance curves show that even after the ascorbic acid con- tent has been increased, there is a diabetic curve, but with niateii- ally lower maximum than before.
A patient is admitted for observation for diabetes: Serum-ascorbic acid 0.00
0.1 130 141 212 206 + S 212
178 + S 145
Serum-ascorbic acid 0.8 0.086
112 149 188 203
' 201 180 149
The serum-ascorbic acid content is 0, but even after having raised it to 0.8, there is a typical diabetes curve.
The same applies of a case of pneumonia, in which a glycosuria called for tolerance tests:
Serum-ascorbic acid 0.48 0.086
109 158 178 183 185 182 150
Serum-ascorbic acid 1.2 0.088
108 145 182 197
168 149 115
A higher maximum of the curve is found here, in spite of a material increase of the ascorbic acid content.
As these cases show no fall in the curves, we must consequently presume that diabetes is present.
In pancreatitis, curves are also found, which are on the whole independent of even high ascorbic acid values, as shown by the fol- lowing example of this lesion:
Serum-ascorbic acid 1.12
0.108 126 155 180 186 190 182 172
Serum-ascorbic acid 1.08
0.106 114 145 166
164 153 172 122
Serum-ascorbic acid 1.28
0.086 094 129 143 162 162 170 166

T H E B E A R I N G OF THE A S C O R B I C ACID C O N T E E T O F T H E B L O O D ETC. 261
Quite similar conditions have been found in a case, where autopsy revealed cancer capitis pancreatis in a man, 37 years old:
Serum-ascorbic acid 0.40
0.093 100 117 176 210 202 155 130
In icterus cases, attempts have been made to utilize the blood sugar curve in the differential diagnosis. But also here it proves that the ascorbic acid content of the blood is of definite significance. However, in these cases it is not possible to titrate the ascorbic acid 011 account of the colour of the serum.
In a case of ordinary hepatitis epidemica, 300 mg ascorbic acid are given daily after the first determination:
0.088 100 133 1 1 4 3 39 112 1 oa 067
0.091 121 117 151 151 131 112 100
Here a fall is seen which gives another impression of the metabo- lism.
This applies to a still higher degree of a case of cancer papil. Vateri (autopsy):
0.093 125 121 14 1 177 197 152 131
0.099 099 154 1 5 6 113 109 100 099

262 K Y U D S E C H E R .
The Iirst curve is a diabetic curve, whereas the other one is normal after ingestion of 300 mg ascorbic acid for a few days.
In Basedow's disease, as is well known, there is a reduction of the carbohydrate metabolism. I t is therefore of interest to learn whether ascorbic acid deficiency has any bearing also 011 t h c w determinations:
Case No. 1.
Serum-ascorbic Serum-ascorbic acid 0.52 acid 0.68
hfetabolism 141 per cent Metabolism 121 per cent
0.10 176 236 260 266 + S . 186 172 + S. 085
0.087 112 151 190 186 136 065 050
In case No. 1, the ascorbic acid value of the blood is found t o I)? above normal in both curves. The peaks of the blood sugar curves show a fall from 0.266 to 0.190 in connection with the fall in the metabolism.
Metabolism 170 per cent Serum-ascorbic
acid 0.24
0.080 105 1 3 4 191 206 150 I11 105
Case No. 2.
Metabolism 144 per cent Serum-ascorbic
acid 0.56
0.076 103 168 208 203 153 119 059
Metabolism 116 per cent Serum-ascorbic
acid 0.4
0.088 1 1 9 177 189 173 117 080 055
Very much the same is found in case No. 2, in which the serum-ascor- Iiic acid content lies a t t h e normal border-line in the two last deter- minations of the hlood sugar.
I n case No. 3, the serum-ascorbic acid has been raised rather high in the sccond determination, without obtaining a normal 1)lood

T H E B E A R I N G O F T H E A S C O R B I C A C I D C O N T E N T O F T H E B L O O D ETC. 263
sugar curve. But the metabolism does not differ from the first determination, and so there is no doubt tha t the high ascorbic acid value is of significance with regard to the form of the curve.
Metabolism 152 per cent Serum-ascorbic
acid 0.24 0.094
131 203 223
215 172 144 096
Case No. 3. I\letabolism 152 per cent
Serum-ascorbic acid 1.56
0.085 116 182 I 8 6 145 131 141 104
Metabolism 118 per cent Serum-ascorbic
acid 1.0 0.079
098 139 162 135 135 115 086
In the third determination, the curve falls, but the metabo- lism has fallen from 152 per cent to 118.
lhcse determinations show tha t thc higher blood sugar values in Basedow’s disease are genuine.
From the cxamples above, i t appears tha t although it is possible in cases of diabetes t o obtain sonicwhat lower curves by increasing the ascorbic acid contant of the blood, such curves do not become normal. Consequently, statement should be made to the effect tha t ascorbic acid is of no significance in the treatment of diabetes. This may be proved by the following example:
A woman, 63 years old, suffering from diabetes, is kept on a constant diet and constant amount of insulin. The serum-ascorbic
Date
22.1 1 23. 25. 26. 27. 28. 29. 30.
2.12 -1 . 8.
11. 18.
Serum-ascorbic acid
0 0 0 ascorb. acid. 0 0 0.12
20 40 G4 74 64 80 80
Blood Ordinary diet 24 init. sugar units of Insulin 0.262 ._
224 - 228
237
218 234 234
280 286 298
-
-
- - __ _ _ -
__ 278 -.
- -

264 K N U D S E C H E X .
acid is 0. By supplying ascorbic acid, the serum-ascorbic acid is raised to 0.8, but as will be seen, a steady rise in the blood sugar content takes place.
These examinations show that the ascorbic acid content of the blood is of considerable significance with regard to th course of the blood sugar curve. This means in reality that i t is not warrantable to use the sugar tolerance test for diagnostic purposes without having assured oneself beforehand that the ascorbic acid content is normal.
This demand should be made first and foremost when the ques- tion is of persons who have suffered from infectious diseases, but in fact it should he made regarding everyone, as values of 0 are also found in normal persons.
As regards normal individuals, this question is of particular inte- rest from an insurance point of view, as i t often proves that glycosu- ria is a casual finding upon examination for life insurance. In such cases, the question of benign glycosuria or diabetes incipiens was settled by means of the sugar tolerance test. In future, the finding of a curve indicative of diabetes cannot be judged of in the right way, unless a determination of the ascorbic acid content has also been made.
There is also the possibility that ,traumatic diabetes)) may be interpreted as a result of ascorbic acid deficiency, and may be cured by a change of diet. At any rate, i t is necessary to undertake revising examinations in such cases on basis of the outlines given here.
No explanation of the conditions here described has been pub- lished, and what has been said above is thus to be considered solely a demonstration of the bearing of ascorbic acid on the blood sugar curve. Experiments in vitro have shown that addition of ascorbic acid to the blood in concentrations corresponding to the conditions of the organism havr no influence on the result of the sugar titration.
Summary. 1. Ascorbic acid deficiency in the blood is a frequent condition
in normal individuals as well as in patients suffering from infectious diseases.

T H E B E A R I ~ C O F T H E A S C O R B I C A C I D C O N T E N T O F T H E B L O O D E T C . 265
2. Abnoimally high blood sugar curves and curves of the dia- betic type may be changed to nornial curves in individuals with ascorbic acid deficiency by removing the ascorbic acid deficiency of the blood.
3. Judgment of the blood sugar curve is consequently insuffi- cient, if the ascorbic acid content of the blood is not known. This is of special practical significance from an insurance point of view, as the blood sugar curve in certain cases determines the assessment and thereby the payment of premiums.
4. The hyperglycemia in arthritis described by Pemberton, and in infectious diseases as described by numerous researchers, may he deduced from the deficiency in ascorbic acid.
Literature.
Brems, A. and N. J. Nissen: Ugeskrift f . Lsger 1932 1203. - Faber, K and A. Nergaard: Bibliothek f . Lsger 1920. 53. - Hjorth, P.: Acta Medica. Scand. 105. 67. 1940. - Holsti, 0.: Acta Medica Scand. 3. 137. 1922. - Pemberton, R.: Arthritis and Rheumatoid Conditions. 1935. - Secher, K.: Nordisk Medicin 6. 821. 1940. - Secher, K.: Zeit. f. Rheumaf. 3. Jahr. 232. 1940. - Secher, K.: Zeit. f. Rheumaf. 3. Jahr. 239. 1940. - Secher, K:. Acta tuberculosea Vol. 15. 321. 1941. - Stepp, Schroder u. Altenburger: Klin. Woch. 1935 I. 933. - Stoger: Klin. Woch. 1940. I . 171. -Williams, J. L. and G. Dick: Arch. Int. Med. 50. 801. 1932.
17 -~ A d a med. scundinau. Vol . C X .