Embed Size (px)
Citation preview
Computers and Electronics in Agriculture 107 (2014) 1–7
Contents lists available at ScienceDirect
Computers and Electronics in Agriculture
journal homepage: www.elsevier .com/locate /compag
The benefits of using otolith weight in statistical fish age classification:A case study of Atlantic cod species
http://dx.doi.org/10.1016/j.compag.2014.06.0010168-1699/� 2014 Elsevier B.V. All rights reserved.
⇑ Tel.: +34 4016758.E-mail address: [email protected]
Sergio Bermejo ⇑Departament d’Enginyeria Electrònica, Universitat Politècnica de Catalunya (UPC), Jordi Girona 1-3 (C4 building), 08034 Barcelona, Spain
a r t i c l e i n f o
Article history:Received 5 July 2013Received in revised form 22 April 2014Accepted 4 June 2014
Keywords:Automated fish age classificationAtlantic cod otolithsStatistical pattern recognitionSupport vector machines
a b s t r a c t
In this paper, the discriminative capability of a combination of biological and shape features for fish ageclassification are analyzed. In particular, the usefulness of otolith weight in several species, incombination with other features such as otolith shape features and biological features such fish length,weight and sex is evaluated. The classification performance for different state-of-the-art statisticallearning classifiers (i.e. several non-linear, non-parametric classifiers such different types of multi-classsupport vector machines) using an Atlantic cod database has been tested in which otolith weight hasshown to be a powerful characteristic for classification purposes but the greatest accuracy is achievedwhen it is used simultaneously with other features.
� 2014 Elsevier B.V. All rights reserved.
1. Introduction
Proper stock assessment and management of fish populationsdepends, among other elements, on an accurate determination offish age (Girdler et al., 2010). This task has traditionally determinedby analyzing hard parts of the body, such as otoliths, since thefish’s age and growth history are encoded in their macroscopicgrowth patterns (McGurk, 1987; Dulcic, 1995; Arneri et al.,2001). Manual age estimation through prior knowledge about themacroscopic growth of the otolith can be misleading since a directinterpretation of these growth patterns is complex, i.e. otolithgrowth depends on many factors (Oxenford et al., 1994) and ishighly subject to the researcher’s skills (Boehlert and Yoklavich,1984). Besides, if the resulting fish age estimators are used laterto infer its growth, this procedure introduces an element of circu-larity in reasoning. Consequently, automatic methods such asstate-of-the-art statistical pattern learning techniques (Devroyeet al., 1996; Bishop, 2007; Webb and Copsey, 2012) have been con-sidered recently in order to make this task more reliable (Fablet,2006; Bermejo et al., 2007; Robotham et al., 2010; Hua et al., 2012).
Several otolith features have been proposed for use in auto-matic fish age estimation or classification. Since the number oftranslucent or opaque otolith rings is proportional to fish age,many researchers have proposed extracting otolith growth-ringfeatures (Fablet and Le Josse, 2005; Burke et al., 2008). Howeverthe presence of ancillary rings on many otoliths could limit the
robustness of this approach if taken solely (Fletcher, 1995).Additionally, otolith shape can be used to differentiate betweenfish of the same species (Bird et al., 1986; Castonguay et al.,1991; Campana and Casselman, 1993; Vignon, 2012). Cod, eel, tur-bot and anchovy were widely studied in European project FABOSA(Fish Ageing By Otolith Shape Analysis, 2001) and the authors con-cluded that the physical length and surface area of the otolith werevery useful for predicting age. Also, the discrimination of stocksusing automatic shape analysis and classification methods hasbeen studied extensively (e.g. Watkinson and Gillis, 2005) and thisis still an active area of research (Benzinou et al., 2013).
On the other hand, otolith weight has also been proposed for ageprediction based on otolith weight and fish age relationships usinglinear regression achieving good results (Boehlert, 1985; Pillinget al., 2003; Pino et al., 2004; Francis et al., 2005; Lou et al., 2005,2007; Metin and Ilkyak, 2008; Ochwada et al., 2008). But if it is con-sidered that fish age estimation becomes a classification problemwhen fish age is taken as a discrete variable, then a more directapproach like estimating fish age frontiers in a feature space witha statistical learning classifier will benefit from a better generaliza-tion capacity. This fact is a direct consequence of some of the resultsobtained in statistical learning theory (Vapnik, 1998), which con-densed in one of its main principles can be formulated as: whensolving a given statistical inference problem using a restrictedamount of data, it must be avoided to solve a more general problemas an intermediate step (Vapnik, 1999). In other words, when havingdiscrete fish age variables, classification solutions will presumablyprofit from better generalization than those based on regression,and particularly those that estimate class borders directly instead
2 S. Bermejo / Computers and Electronics in Agriculture 107 (2014) 1–7
of obtaining posterior class probabilities through regression as anintermediate step. (For further details on the relationship betweenregression, classification and the different forms of constructing astatistical classifier, the reader is referred to Ripley, 1996.)
In the above direction, several preliminary studies are availablefor fish age linear classification using otolith weight. Pawson(1990) proposed a feature space in which linear class borders areestimated based on fish length and linear transformation of otolithweight and fish length to give an index of age; nevertheless, thislinear combination of features merely rotates the original featureand, thus, does not enhance fish age class separability. Fletcher(1995) suggested the use of linear classifier in a one-dimensionalfeature space based on otolith weight computing class borders asthe middle points of the average otolith weight computed for eachfish age; this way of obtaining class frontiers assumes a parametricprobabilistic modeling based on normal (or Gaussian) classes,which can be far from being accurate. Doering-Arjes et al. (2008)applied stepwise discriminant analysis based on the use of otolithweight and morphometrics and normalized Fourier descriptors ofotolith shape in a variety of cross-validation schemes that involveddealing with true fish ages and reader’s expert opinions. Accord-ingly, extensions to non-linear and non-parametric fish age classi-fication when otolith weight is used solely or in combination as afeature should be considered; in this direction, a family of state-of-the-art non-linear, non-parametric classifiers called supportvector machines (SVMs, Cristianini and Shawe-Taylor, 2000;Steinwart and Christmann, 2008) are among the best candidatessince: (1) SVMs project the input vectors through some nonlinearmapping into a high-dimensional internal space in which a sepa-rating hyperplane is constructed; (2) SVMs maintain good general-ization properties in spite of the projection of input data into ahigh-dimensional space due to their separating hyperplane is con-structed based on large-margin principles, which allow controllinglearning machine capacity in accordance to recent developments instatistical learning theory (Vapnik, 1998; Kulkarni and Harman,2011); and (3) SVMs exhibit superior performance on a wide rangeof applications (Ma and Guo, 2014).
Here, the usefulness of the combination of biological featureslike otolith weight and shape features for statistical fish age classi-fication are analyzed. In particular, the classification performanceachieved in this study for SVMs in an Atlantic cod database revealsthat otolith weight is in fact a leading characteristic for classifica-tion purposes. Nevertheless, the greatest accuracy is achievedwhen this feature is employed with other few biological featureslike fish length, weight and sex.
2. Materials and methods
2.1. Atlantic cod database
The fish database consists of Atlantic cod from the Plateau stockthat were hatched the same year and later kept and reared in pen
Table 1Otolith weight statistics of the cod database.
Age Number ofexamples
Otolith weight (mg)(mean ± variance)
Range(mg)
2 27 4.921 ± 0.116 4.724–5.250
3 30 5.574 ± 0.156 5.256–5.872
4 30 6.006 ± 0.149 5.682–6.347
5 30 6.220 ± 0.131 5.936–6.440
6 28 6.318 ± 0.122 6.028–6.602
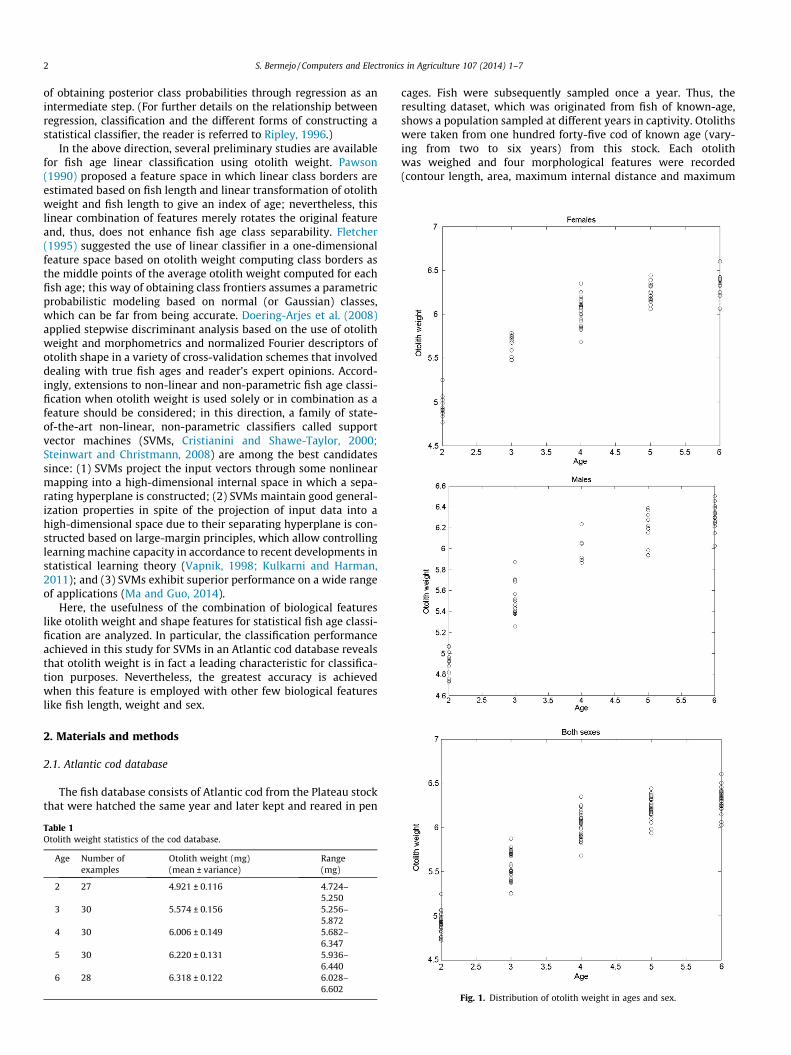
cages. Fish were subsequently sampled once a year. Thus, theresulting dataset, which was originated from fish of known-age,shows a population sampled at different years in captivity. Otolithswere taken from one hundred forty-five cod of known age (vary-ing from two to six years) from this stock. Each otolithwas weighed and four morphological features were recorded(contour length, area, maximum internal distance and maximum
Fig. 1. Distribution of otolith weight in ages and sex.
S. Bermejo / Computers and Electronics in Agriculture 107 (2014) 1–7 3
perpendicular distance) following the image analysis proceduredescribed in Bermejo et al. (2007). Fish length, weight and sex werealso available for each sample. Finally, sex was codified in a featurecomponent as a discrete value, with 1 assigned to females and 0assigned to males. This dataset is an extension of that used inBermejo (2007) due to the inclusion of otolith weight.
Table 1 displays the mean, variance, maximum and minimumvalues of otolith weight for different fish ages; this data shows thatotolith weight alone is a good feature for classification purposes,especially in separating fish aged two years and older. It is impor-tant to stress that greater variability in growth could be found in awild population due to environmental variation, resulting in amore variable relationship between otolith weight, age and length.
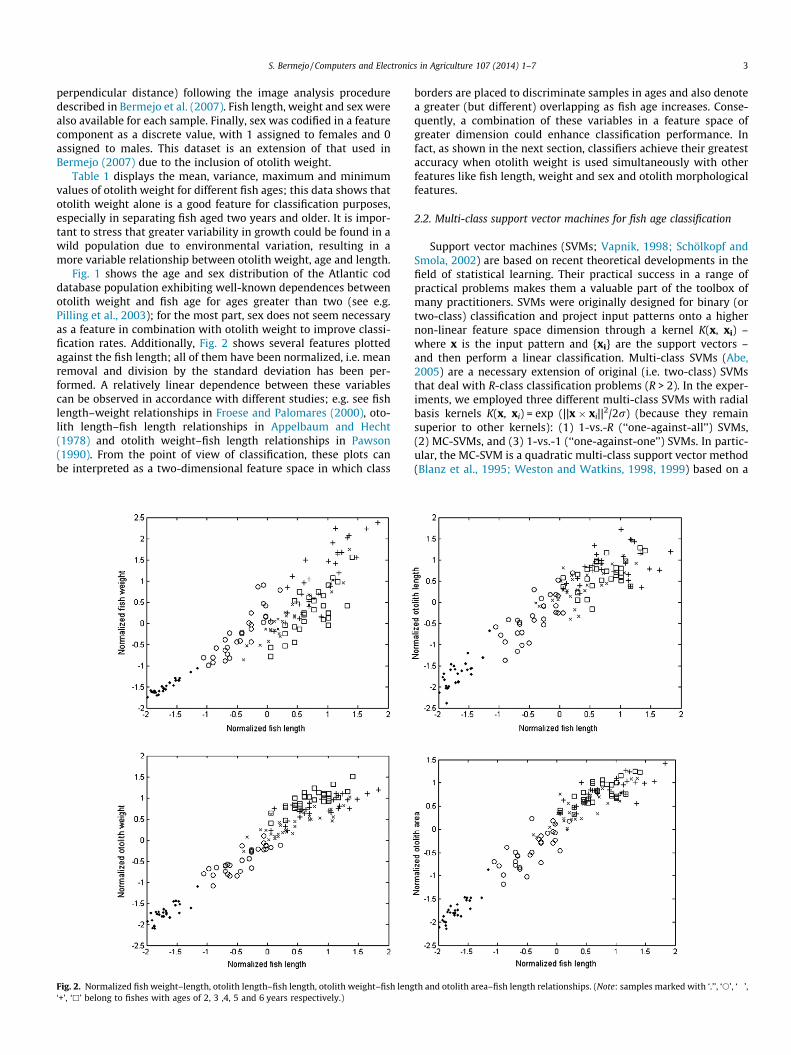
Fig. 1 shows the age and sex distribution of the Atlantic coddatabase population exhibiting well-known dependences betweenotolith weight and fish age for ages greater than two (see e.g.Pilling et al., 2003); for the most part, sex does not seem necessaryas a feature in combination with otolith weight to improve classi-fication rates. Additionally, Fig. 2 shows several features plottedagainst the fish length; all of them have been normalized, i.e. meanremoval and division by the standard deviation has been per-formed. A relatively linear dependence between these variablescan be observed in accordance with different studies; e.g. see fishlength–weight relationships in Froese and Palomares (2000), oto-lith length–fish length relationships in Appelbaum and Hecht(1978) and otolith weight–fish length relationships in Pawson(1990). From the point of view of classification, these plots canbe interpreted as a two-dimensional feature space in which class
Fig. 2. Normalized fish weight–length, otolith length–fish length, otolith weight–fish leng‘+’, ‘h’ belong to fishes with ages of 2, 3 ,4, 5 and 6 years respectively.)
borders are placed to discriminate samples in ages and also denotea greater (but different) overlapping as fish age increases. Conse-quently, a combination of these variables in a feature space ofgreater dimension could enhance classification performance. Infact, as shown in the next section, classifiers achieve their greatestaccuracy when otolith weight is used simultaneously with otherfeatures like fish length, weight and sex and otolith morphologicalfeatures.
2.2. Multi-class support vector machines for fish age classification
Support vector machines (SVMs; Vapnik, 1998; Schölkopf andSmola, 2002) are based on recent theoretical developments in thefield of statistical learning. Their practical success in a range ofpractical problems makes them a valuable part of the toolbox ofmany practitioners. SVMs were originally designed for binary (ortwo-class) classification and project input patterns onto a highernon-linear feature space dimension through a kernel K(x, xi) –where x is the input pattern and {xi} are the support vectors –and then perform a linear classification. Multi-class SVMs (Abe,2005) are a necessary extension of original (i.e. two-class) SVMsthat deal with R-class classification problems (R > 2). In the exper-iments, we employed three different multi-class SVMs with radialbasis kernels K(x, xi) = exp (||x � xi||2/2r) (because they remainsuperior to other kernels): (1) 1-vs.-R (‘‘one-against-all’’) SVMs,(2) MC-SVMs, and (3) 1-vs.-1 (‘‘one-against-one’’) SVMs. In partic-ular, the MC-SVM is a quadratic multi-class support vector method(Blanz et al., 1995; Weston and Watkins, 1998, 1999) based on a
th and otolith area–fish length relationships. (Note: samples marked with ‘.’’, ‘s’, ‘�’,
4 S. Bermejo / Computers and Electronics in Agriculture 107 (2014) 1–7
direct generalization of the SVM for binary classification (Cortesand Vapnik, 1995).
As pre-processing, mean removal and scaling by the variance ofeach feature was performed on the available data (as shown inFig. 2) because they are very differently scaled and SVMs are sen-sitive to these variations. The rationale for doing this is that SVMsrely on estimating large margin solutions (Smola et al., 2000),which have a relevant sensitivity to affine data transformationsof the data and, more importantly, to directions with large dataspread (Shivaswamy and Jebara, 2010). One way of limiting tosome extent both sensitivities is whiten the data as a preprocessingstage to the SVM. In order to avoid the computational difficulties ofusing a covariance matrix, standardization – i.e. mean removal andvariance scaling – is often done instead at the level of the input
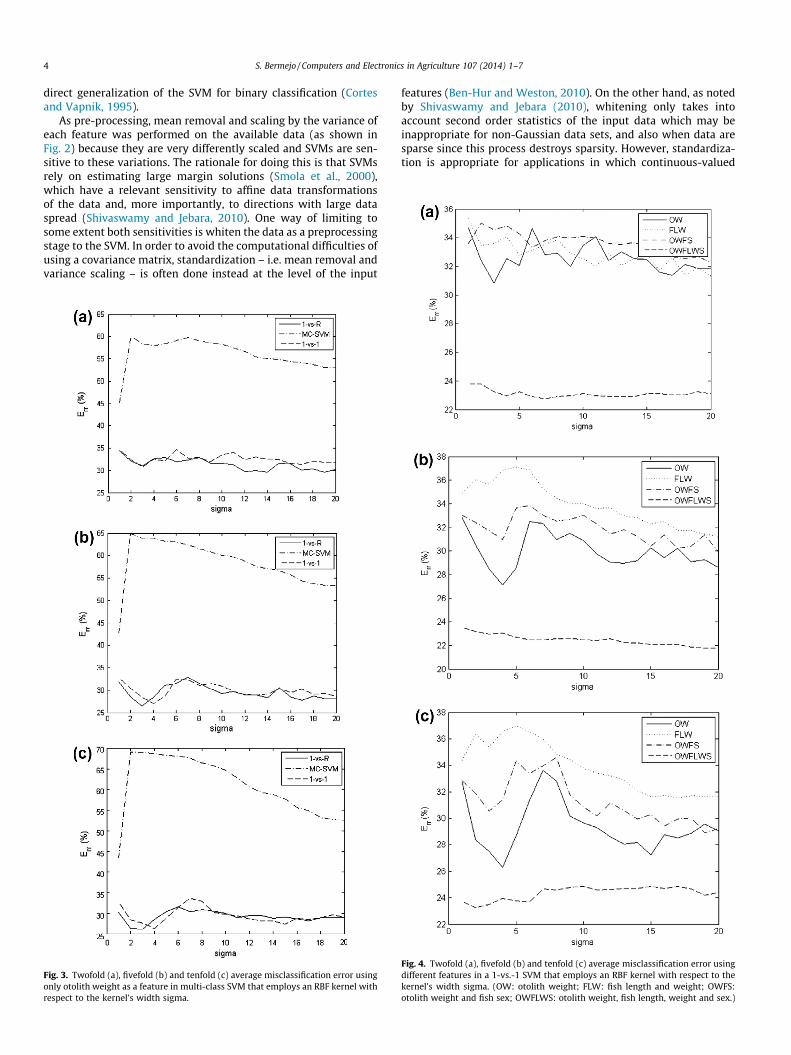
Fig. 3. Twofold (a), fivefold (b) and tenfold (c) average misclassification error usingonly otolith weight as a feature in multi-class SVM that employs an RBF kernel withrespect to the kernel’s width sigma.
features (Ben-Hur and Weston, 2010). On the other hand, as notedby Shivaswamy and Jebara (2010), whitening only takes intoaccount second order statistics of the input data which may beinappropriate for non-Gaussian data sets, and also when data aresparse since this process destroys sparsity. However, standardiza-tion is appropriate for applications in which continuous-valued
Fig. 4. Twofold (a), fivefold (b) and tenfold (c) average misclassification error usingdifferent features in a 1-vs.-1 SVM that employs an RBF kernel with respect to thekernel’s width sigma. (OW: otolith weight; FLW: fish length and weight; OWFS:otolith weight and fish sex; OWFLWS: otolith weight, fish length, weight and sex.)
S. Bermejo / Computers and Electronics in Agriculture 107 (2014) 1–7 5
features has a different range and, thus, are measured in a verydiverse scale (Ben-Hur and Weston, 2010), like the cod datasetstudied here. This simple form of normalization has been demon-strated a powerful strategy to dramatically improve classificationaccuracy of SVMs (see e.g. Graf et al., 2003; Ali and Smith-Miles,2006).
For further details on the application of multi-class SVM in fishage classification and other related problems the reader is referredto Robotham et al. (2010), Bermejo and Monegal (2007), andBermejo et al. (2007).
2.3. Statistical assessment of experiments
A k-fold cross-validation (Hastie et al., 2009) with k = 2, 5 and10 has been used as a method of statistical validation in our exper-iments following the specific recommendation of its use in smalldata sets given by Dreyfus and Guyon (2006). In this technique,data are split into k equal-sized parts. The classifier is then com-puted with k�1 parts and tested with the kth part. This procedureis repeated k times and the results are averaged. This splitting isrepeated ten times to reduce variance in the estimates of classifica-tion accuracy. We also balanced the database (i.e. all partitionshave the same number of samples for each class) in order to createan equiprobable setting for the classification problem. A similartechnique in the context of the age–length key method in fisheriesresearch is known as length-stratified sampling (Ketchen, 1950;Francis et al., 2005).
3. Results and discussion
Fig. 3 shows the twofold, fivefold and tenfold average misclassi-fication error using only otolith weight as a feature in the threemulti-class SVMs with the radial basis kernel’s width varying fromr = 1, . . . ,20. Considerably good results were achieved in 1-vs.-1and 1-vs.-R SVM, i.e. a classification rate around 70%. These resultssuggest that this feature, which can easily be computed from anotolith, can be used alone for such a task. However, to what extentcan these results be improved using more features?
We carried out experiments to compare the accuracy of classi-fication using different features. Fig. 4 shows a 1-vs.-1 SVM thatemploys different feature sets: (1) only otolith weight (OW); (2)only fish length and weight (FLW); (3) otolith weight and fishsex (OWFS); and (4) all four features (OWFLWS). Fivefold and ten-fold show most clearly that the best results were achieved whenotolith weight and fish length, weight and sex are employed as fea-tures, followed at some distance by the classifiers that only useotolith weight. (Moreover, the average misclassification error isalmost unaffected by kernel’s width variations in classifiers basedon OWFLWS.) The combined use of fish sex and otolith weightincreased the number of classification errors. Finally, the worstresults were those obtained by 1-vs.-1 SVMs based on fish length
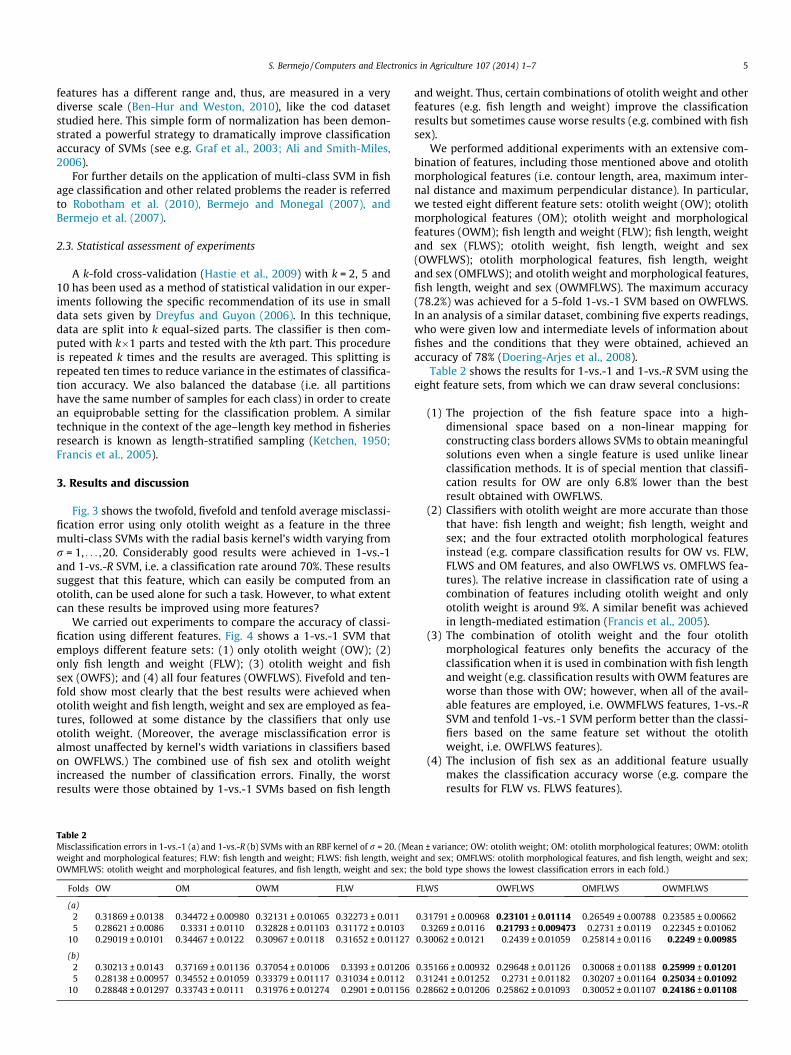
Table 2Misclassification errors in 1-vs.-1 (a) and 1-vs.-R (b) SVMs with an RBF kernel of r = 20. (Meweight and morphological features; FLW: fish length and weight; FLWS: fish length, weighOWMFLWS: otolith weight and morphological features, and fish length, weight and sex; t
Folds OW OM OWM FLW
(a)2 0.31869 ± 0.0138 0.34472 ± 0.00980 0.32131 ± 0.01065 0.32273 ± 0.0115 0.28621 ± 0.0086 0.3331 ± 0.0110 0.32828 ± 0.01103 0.31172 ± 0.0103
10 0.29019 ± 0.0101 0.34467 ± 0.0122 0.30967 ± 0.0118 0.31652 ± 0.01127
(b)2 0.30213 ± 0.0143 0.37169 ± 0.01136 0.37054 ± 0.01006 0.3393 ± 0.012065 0.28138 ± 0.00957 0.34552 ± 0.01059 0.33379 ± 0.01117 0.31034 ± 0.0112
10 0.28848 ± 0.01297 0.33743 ± 0.0111 0.31976 ± 0.01274 0.2901 ± 0.01156
and weight. Thus, certain combinations of otolith weight and otherfeatures (e.g. fish length and weight) improve the classificationresults but sometimes cause worse results (e.g. combined with fishsex).
We performed additional experiments with an extensive com-bination of features, including those mentioned above and otolithmorphological features (i.e. contour length, area, maximum inter-nal distance and maximum perpendicular distance). In particular,we tested eight different feature sets: otolith weight (OW); otolithmorphological features (OM); otolith weight and morphologicalfeatures (OWM); fish length and weight (FLW); fish length, weightand sex (FLWS); otolith weight, fish length, weight and sex(OWFLWS); otolith morphological features, fish length, weightand sex (OMFLWS); and otolith weight and morphological features,fish length, weight and sex (OWMFLWS). The maximum accuracy(78.2%) was achieved for a 5-fold 1-vs.-1 SVM based on OWFLWS.In an analysis of a similar dataset, combining five experts readings,who were given low and intermediate levels of information aboutfishes and the conditions that they were obtained, achieved anaccuracy of 78% (Doering-Arjes et al., 2008).
Table 2 shows the results for 1-vs.-1 and 1-vs.-R SVM using theeight feature sets, from which we can draw several conclusions:
(1) The projection of the fish feature space into a high-dimensional space based on a non-linear mapping forconstructing class borders allows SVMs to obtain meaningfulsolutions even when a single feature is used unlike linearclassification methods. It is of special mention that classifi-cation results for OW are only 6.8% lower than the bestresult obtained with OWFLWS.
(2) Classifiers with otolith weight are more accurate than thosethat have: fish length and weight; fish length, weight andsex; and the four extracted otolith morphological featuresinstead (e.g. compare classification results for OW vs. FLW,FLWS and OM features, and also OWFLWS vs. OMFLWS fea-tures). The relative increase in classification rate of using acombination of features including otolith weight and onlyotolith weight is around 9%. A similar benefit was achievedin length-mediated estimation (Francis et al., 2005).
(3) The combination of otolith weight and the four otolithmorphological features only benefits the accuracy of theclassification when it is used in combination with fish lengthand weight (e.g. classification results with OWM features areworse than those with OW; however, when all of the avail-able features are employed, i.e. OWMFLWS features, 1-vs.-RSVM and tenfold 1-vs.-1 SVM perform better than the classi-fiers based on the same feature set without the otolithweight, i.e. OWFLWS features).
(4) The inclusion of fish sex as an additional feature usuallymakes the classification accuracy worse (e.g. compare theresults for FLW vs. FLWS features).
an ± variance; OW: otolith weight; OM: otolith morphological features; OWM: otolitht and sex; OMFLWS: otolith morphological features, and fish length, weight and sex;he bold type shows the lowest classification errors in each fold.)
FLWS OWFLWS OMFLWS OWMFLWS
0.31791 ± 0.00968 0.23101 ± 0.01114 0.26549 ± 0.00788 0.23585 ± 0.006620.3269 ± 0.0116 0.21793 ± 0.009473 0.2731 ± 0.0119 0.22345 ± 0.01062
0.30062 ± 0.0121 0.2439 ± 0.01059 0.25814 ± 0.0116 0.2249 ± 0.00985
0.35166 ± 0.00932 0.29648 ± 0.01126 0.30068 ± 0.01188 0.25999 ± 0.012010.31241 ± 0.01252 0.2731 ± 0.01182 0.30207 ± 0.01164 0.25034 ± 0.010920.28662 ± 0.01206 0.25862 ± 0.01093 0.30052 ± 0.01107 0.24186 ± 0.01108
6 S. Bermejo / Computers and Electronics in Agriculture 107 (2014) 1–7
(5) The variance of misclassification errors for the reportedexperiments, which are shown in Table 2, are small in accor-dance of the expected behavior of k-fold cross-validationmethod – more specifically, it tends to be decreased as thenumber of folds is increased. This behavior is, in fact, the rea-son why this cross-validation technique is recommended forsmall data sets instead of e.g. the leave-one-out procedure,which exhibits a large variance (Dreyfus and Guyon, 2006).
Finally, it is worth noting to observe that the study presentedhere was specially focused on studying the effect of otolith weightin combination with other features that has been previously stud-ied in a related work based on the use of otolith shape descriptors(Bermejo, 2007). Hence, there was no intention to state any kind ofsuperior performance or preference of these shape descriptors thanthose based on Fourier descriptors (e.g. Galley et al., 2006), whichhave been widely employed in otoliths analysis. Further researchshould be done in order to study which one is of greater benefitin this context.
4. Conclusions
In the light of the above experiments, otolith weight has beendemonstrated as a powerful feature for fish age classification. Ifthese results are confirmed in further experiments with moresimilar datasets, otolith weight for fish age classification can pro-vide a fast and economic method for stock assessment. Also, asdemonstrated in this study, better classification rates (and morestable with respect to classifier’s parameters in the case of SVMs)can be obtained with the inclusion of features like fish length,weight and sex and, finally, otolith morphological features at theexpense, in this latter case, of a higher time-consuming and,consequently, expensive process.
Acknowledgements
The author would like to thank the Institute of Marine Sciencesof Barcelona (ICM-CSIC) for supplying the otolith images used inthis work. Also, it is acknowledged the funding received in theEU’s IBACS project under Contract No. QQLRT-2001-01610. Finally,the author thanks the anonymous reviewers for their carefulreading of previous versions of the manuscript and their insightfulcomments and suggestions.
References
Abe, S., 2005. Support Vector Machines for Pattern Classification. Springer, NewYork.
Ali, S., Smith-Miles, K.A., 2006. Improved support vector machine generalizationusing normalized input space. In: Sattar, A., Kang, B.H. (Eds.), Advances inArtificial Intelligence Lecture Notes in Computer Science, vol. 4304. Springer-Verlag, Berlin, pp. 362–371.
Appelbaum, S., Hecht, T., 1978. Otolith length/fish length relationship ofleptocephali, elvers, and sub-adult (reared) eels Anguilla Anguilla. Environ.Biol. Fish. 3, 245–247.
Arneri, E., Colella, S., Giannetti, G., 2001. Age determination and growth of turbotand brill in the Adriatic Sea. J. Appl. Ichthyol. 17, 256–261.
Ben-Hur, A., Weston, J., 2010. A user’s guide to support vector machines. In: Carugo,O., Eisenhaber, F. (Eds.), Data Mining Techniques for the Life Sciences. Springer-Verlag, Berlin, pp. 223–239.
Benzinou, A., Carbini, S., Nasreddine, K., Elleboode, R., Mahé, K., 2013.Discriminating stocks of striped red mullet (Mullus surmuletus) in theNorthwest European seas using three automatic shape classification methods.Fish. Res. 143, 153–160.
Bermejo, S., 2007. Fish age classification based on length, weight, sex and otolithmorphological features. Fish. Res. 84, 270–274.
Bermejo, S., Monegal, B., 2007. Fish age analysis and classification with kernelmethods. Pattern Recogn. Lett. 28, 1164–1171.
Bermejo, S., Monegal, B., Cabestany, J., 2007. Fish age categorization from otolithimages using multi-class support vector machines. Fish. Res. 84, 247–253.
Bird, J.L., Eppler, D.T., Checkley, D.M., 1986. Comparisons of hearing otoliths usingFourier series shape analysis. Can. J. Fish. Aquat. Sci. 43, 1228–1234.
Bishop, C.M., 2007. Pattern Recognition and Machine Learning. Springer, New York.Blanz, V., Vapnik, V., Burges. C., 1995. Multiclass discrimination with an extended
support vector machine. Talk given at AT&T Bell Labs.Boehlert, G., 1985. Using objective criteria and multiple regression models for age
determination in fishes. Fish. Bull. US 83, 103–118.Boehlert, G.W., Yoklavich, M.M., 1984. Variability in age estimates in Sebastes as a
function of methodology, different readers, and different laboratories. Calif. FishGame 70, 210–224.
Burke, N., Brophy, D., King, P.A., 2008. Shape analysis of otolith annuli in Atlanticherring (Clupea harengus); a new method for tracking fish populations. Fish.Res. 91, 133–143.
Campana, S.E., Casselman, J.M., 1993. Stock discrimination using otolith shapeanalysis. Can. J. Fish. Aquat. Sci. 50, 1062–1083.
Castonguay, M., Simard, P., Gagnon, P., 1991. Usefulness of Fourier analysis ofotolith shape for Atlantic mackerel (Scomber scombrus) stock discrimination.Can. J. Fish. Aquat. Sci. 48, 296–302.
Cortes, C., Vapnik, V., 1995. Support vector networks. Mach. Learn. 20, 273–297.Cristianini, N., Shawe-Taylor, J., 2000. An Introduction to Support Vector Machines
and Other Kernel-based Learning Methods. Cambridge University Press,Cambridge.
Devroye, L., Györfi, L., Lugosi, G., 1996. A Probabilistic Theory of Pattern Recognition.Springer-Verlag, Berlin.
Doering-Arjes, P., Cardinale, M., Mosegaard, H., 2008. Estimating population agestructure using otolith morphometrics: a test with known-age Atlantic cod(Gadus morhua) individuals. Can. J. Fish. Aquat. Sci. 65, 2342–2350.
Dreyfus, G., Guyon, I., 2006. Assessment methods. In: Guyon, I., Gunn, S., Nikravesh,M., Zadeh, L.A. (Eds.), Feature Extraction: Foundations and Applications.Springer-Verlag, Berlin, pp. 65–88.
Dulcic, J., 1995. Estimation of age and growth of sardine, Sardina pilchardus(Walbaum, 1792), larvae by reading daily otolith increments. Fish. Res. 22, 265–277.
Fablet, R., 2006. Statistical learning applied to computer-assisted fish age andgrowth estimation from otolith images. Fish. Res. 81, 219–228.
Fablet, R., Le Josse, N., 2005. Automated fish age estimation from otolith imagesusing statistical learning. Fish. Res. 72, 279–290.
FABOSA, Fish Ageing by Otolith Shape Analysis, 2001. In: Final Report to theEuropean Commission, Contract No. FAIR CT97 3402.
Fletcher, W.J., 1995. Application of the otolith weight–age relationship for thepilchard, Sardinops sagax neopilchardus. Can. J. Fish. Aquat. Sci. 52, 657–664.
Francis, R.I.C.C., Harley, S.J., Campana, S.E., Doering-Arjes, P., 2005. Use of otolithweight in length-mediated estimation of proportions at age. Mar. FreshwaterRes. 56, 735–743.
Froese, R., Palomares, M.L., 2000. Growth, natural mortality, length–weightrelationship, maximum length and length-at-first-maturity of the coelacanthLatimeria chalumnae. Environ. Biol. Fishes 58, 45–52.
Galley, E.A., Wright, P.J., Gibb, F.M., 2006. Combined methods of otolith shapeanalysis improve identification of spawning areas of Atlantic cod. ICES J. Mar.Sci. 63, 1710–1717.
Girdler, A., Wellby, I., Welcomme, R., 2010. Fisheries Management: A Manual forStill-Water Coarse Fisheries. Wiley-Blackwell, Oxford.
Graf, A.B.A., Smola, A.J., Borer, S., 2003. Classification in a normalized feature spaceusing support vector machines. IEEE Trans. Neur. Net. 14, 597–605.
Hastie, T., Tibshirani, R., Friedman, J., 2009. The Elements of Statistical Learning,second ed. Springer, New York.
Hua, J., Li, D., Duan, Q., Han, Y., Chen, G., Si, X., 2012. Fish species classification bycolor, texture and multi-class support vector machine using computer vision.Comput. Electron. Agric. 88, 133–140.
Ketchen, K.S., 1950. Stratified sub-sampling for determining age-distributions.Trans. Am. Fish. Soc. 79, 205–212.
Kulkarni, S., Harman, G., 2011. An Elementary Introduction to Statistical LearningTheory. John Wiley & Sons, New Jersey.
Lou, D.C., Mapstone, B.D., Russ, G.R., Davies, C.R., Begg, G.A., 2005. Using otolithweight–age relationships to predict age-based metrics of coral reef fishpopulations at different spatial scales. Fish. Res. 71, 279–294.
Lou, D.C., Mapstone, B.D., Russ, G.R., Davies, C.R., Begg, G.A., Davies, C.R., 2007. Usingotolith weight–age relationships to predict age based metrics of coral reef fishpopulations across different temporal studies. Fish. Res. 83, 216–227.
Ma, Y., Guo, G. (Eds.), 2014. Support Vector Machines Applications. Springer, Berlin.McGurk, M.D., 1987. Age and growth of Pacific herring larvae based on length-
frequency analysis and otolith ring number. Environ. Biol. Fishes 20, 33–47.Metin, G., Ilkyak, G.M., 2008. Use of otolith length and weight in age
determination of poor cod (Trisopterus minutus Linn., 1758). Turk. Zool.Derg. 32, 293–297.
Ochwada, F.A., Scandol, J.P., Gray, C.A., 2008. Predicting the age of fish using generaland generalized linear models of biometric data: a case study of two estuarinefinfish from New South Wales, Australia. Fish. Res. 90, 187–197.
Oxenford, H.A., Hunte, W., Deane, R., Campana, S.E., 1994. Otolith age validation andgrowth-rate variation in flyingfish (Hirundichthys affinis) from the easternCaribbean. Mar. Biol. 118, 585–592.
Pawson, M.G., 1990. Using otolith weight to age fish. J. Fish Biol. 36, 521–531.Pilling, G.M., Grandcourt, E.M., Kirkwood, G.P., 2003. The utility of otolith weight as
a predictor of age in the emperor Lethrinus mahsena and other tropical fishspecies. Fish. Res. 60, 493–506.
Pino, C.A., Cubillos, L.A., Araya, M., Sepúlveda, A., 2004. Otolith weight as anestimator of age in the Patagonian grenadier, Macruronus magellanicus, incentral-south Chile. Fish. Res. 66, 145–156.

S. Bermejo / Computers and Electronics in Agriculture 107 (2014) 1–7 7
Ripley, B.D., 1996. Pattern Recognition and Neural Networks. Cambridge UniversityPress, Cambridge.
Robotham, H., Bosch, P., Gutiérrez-Estrada, J.C., Castillo, J., Pulido-Calvo, I., 2010.Acoustic identification of small pelagic fish species in Chile using support vectormachines and neural networks. Fish. Res. 102, 115–122.
Schölkopf, B., Smola, A.J., 2002. Learning With Kernels: Support Vector Machines,Regularization, Optimization, and Beyond. MIT Press, Cambridge.
Shivaswamy, P.K., Jebara, T., 2010. Maximum relative margin and data-dependentregularization. J. Mach. Learn. Res. 11, 747–788.
Smola, A.J., Bartlett, P., Schölkopf, B., Schuurmans, D. (Eds.), 2000. Advances in LargeMargin Classifiers. MIT Press, Cambridge.
Steinwart, I., Christmann, A., 2008. Support Vector Machines. Springer, Berlin.Vapnik, V., 1998. Statistical Learning Theory. Wiley InterScience, New York.Vapnik, V., 1999. The Nature of Statistical Learning Theory, second ed. Springer,
New York.
Vignon, M., 2012. Ontogenetic trajectories of otolith shape during shift in habitatuse: interaction between otolith growth and environment. J. Exp. Mar. Biol.Ecol. 420–421, 26–32.
Watkinson, D.A., Gillis, D.M., 2005. Stock discrimination of Lake Winnipeg walleyebased on Fourier and wavelet description of scale outline signals. Fish. Res. 72,193–203.
Webb, A.R., Copsey, K.D., 2012. Statistical Pattern Recognition, second ed. Wiley,New York.
Weston, J., Watkins, C., 1998. Multi-class support vector machines. In: TechnicalReport CSD-TR-98-04, Department of Computer Science, Royal Holloway,University of London, UK.
Weston, J., Watkins, C., 1999. Multi-Class Support Vector Machines, ProceedingsESANN. D Facto, Brussels.