Embed Size (px)
Citation preview

The Improvement in Home Improvement
As with most recoveries, the homebuilder rebound occurred against a backdrop of fear and pessimism, long before the signs of change were readily discernible. As measured by the ITB (iShares Dow Jones US Home Construction ETF), the homebuilders are up 40% year-to-date, one of the
top performing sectors in an otherwise lackluster market. The stocks bottomed in the Fall of 2011, long before any signs of housing’s turn were visible to the naked eye. By the time it’s obvious, it’s too late to buy anything.
Or is it?
While the homebuilders have already surged, one company set to profit with the recovery has seen only modest gains: Lowe’s (LOW), the home improvement retailer locked in a quasi-duopoly with Home Depot (HD).
LOW has obviously suffered astride the extended housing bust. With a negative 1.35% 5-yr annualized return (with dividends reinvested), LOW has underperformed the S&P 500 by a beat. Yet company fundamentals have only gone from good to better, as free cash flows have leapt to $2.54 billion — up from $106 million, $463 million, and $586 million in 2005, 2006 and 2007 respectively.
How’s that? Free cash flow rising 24 fold, from $106 million to $2.54 billion, during the housing collapse? Yes, it’s true — if widely unappreciated by the market. Part of the story is that LOW cut back drastically on capital expenditure, halving it to $2 billion by slowing expansion and closing underperforming stores. The downside to this cash flow generation strategy is obviously the retrenchment in revenue growth, as the company transitions from dynamic, go-go momentum play to a value investment reincarnated as cash cow.
THE BERMAN VALUE FOLIO A Trefis Interactive Portfolio Report
Volume 1 Number 8 July 2012
James Berman
James Berman, the president and founder of JBGlobal.com LLC, a registered investment advi-
sory firm (SEC registered), specializes in asset management for high-net-worth individuals and
trusts. Mr. Berman is a faculty member in the Finance Department of NYU SCPS. He has ap-
peared on CNBC and the Fox Business Channel and has been quoted and published in a vari-
ety of publications, including Barron's, Fortune, Bloomberg, The Huffington Post and CNN
Money. Mr. Berman holds a B.A., Magna Cum Laude, Phi Beta Kappa, in English & American
Literature from Harvard and a J.D. from Harvard Law School.
CONTENTS Lowe’s (LOW) 1
Lowe’s: A Bearish Scenario 3
Lowe’s: A Bullish Scenario 4 Company Highlights 5 Procter & Gamble (PG) 5 CSX (CSX) 6 Paychex (PAYX) 7 eBay (EBAY) 8 The Berman Value Folio 9

2
The cutbacks in capex are unsustainable, and LOW will have to spend at least $2.5 billion per year on a normalized basis, just to shore up the existing store base. But that still leaves $2 billion in free cash flow, even without a housing recovery.
Trefis estimates an intrinsic value of $33.67 per each LOW share, with community opinions ranging from $26—$49:
As you can see, LOW’s business is literally home improvement, with plumbing, electrical and kitchen comprising the major slug of value — and the international business, as yet only a fledgling operation.
The conventional outlook on housing is still decidedly pessimistic, with any pundit’s call for a recovery couched in carefully hedged phrases like “we’ve seen false starts before” or “caution warranted.” These are good signs for the bulls, as it implies prices are still distressed. Even as a rebound occurs, no one really believes it, thus creating a tremendous buying opportunity. This may be a false dawn for the housing market (note my own mealy-mouthed disclaimer), but the sector will recover eventually and when it does, LOW will be a major beneficiary.
The real question is not when things turn, but what’s the intrinsic value range for LOW assuming it does. If sufficiently high, the wait should be no impediment to investment for the patient buyer, because the expected return will be more than adequate.
The Trefis Dow
Ticker
Trefis
Market Price Price
IBM 229 195
CVX 109 108
MCD 98.2 92.63
MMM 97.11 91.04
XOM 93.22 85.83
CAT 111 82.71
KO 75.7 76.89
UTX 102 75.33
BA 90.91 74.51
WMT 71.17 71.6
JNJ 73.76 69.19
PG 65.8 64.84
TRV 69.44 63.58
AXP 59.65 56.18
HD 55.73 51.1
DIS 51.53 49.28
DD 57.14 48.98
VZ 41.9 44.91
MRK 41.04 43.87
KFT 39.92 40.08
T 34 35.56
JPM 47.94 35.07
MSFT 39.2 30.62
INTC 31.97 26.02
PFE 25.07 23.72
GE 19.97 19.72
HPQ 32.48 19.14
CSCO 23.4 16.66
AA 10.28 8.41
BAC 9.86 7.5
Raw Sum 1907.39 1707.97
Dow Divisor 0.132129493 0.132129493
DOW
Trefis Market
Price Price
14,436 12,926
Undervaluation 12%
The Trefis Price for the Dow
is now 14,436, 12% above
the market price.

3
Lowe’s: A Bearish Scenario Assuming housing does recover some day, if not today or tomorrow, we can model a bearish scenario which pushes that resurgence back another 3-5 years and condemns LOW to flatline at least that long. Key assumptions are:
(1) The plumbing, electrical and kitchen market retrenching by as much as 2.8% over the next
two years before finally starting to recover by 2014 or 2015.
(2) The building materials sector suffering even steeper declines to reflect a further fall-off in new housing starts, with a contraction of 6.5% through 2015.
This dire scenario hammers intrinsic value down to $30.51, still 20% above the current market price of $25.39. If we steepen the decline to 10% to reflect another recessionary leg downwards in housing starts, we reach $30:
Finally, if we assume that Amazon (AMZN) steals further market share (as with other big box retailers), LOW’s intrinsic value drops to $28. I believe the home improvement sector is more immune to the ravages of e-tailers than electronics and consumer staples, but AMZN is still a daunting competitor.
4
Lowe’s: A Bullish Scenario
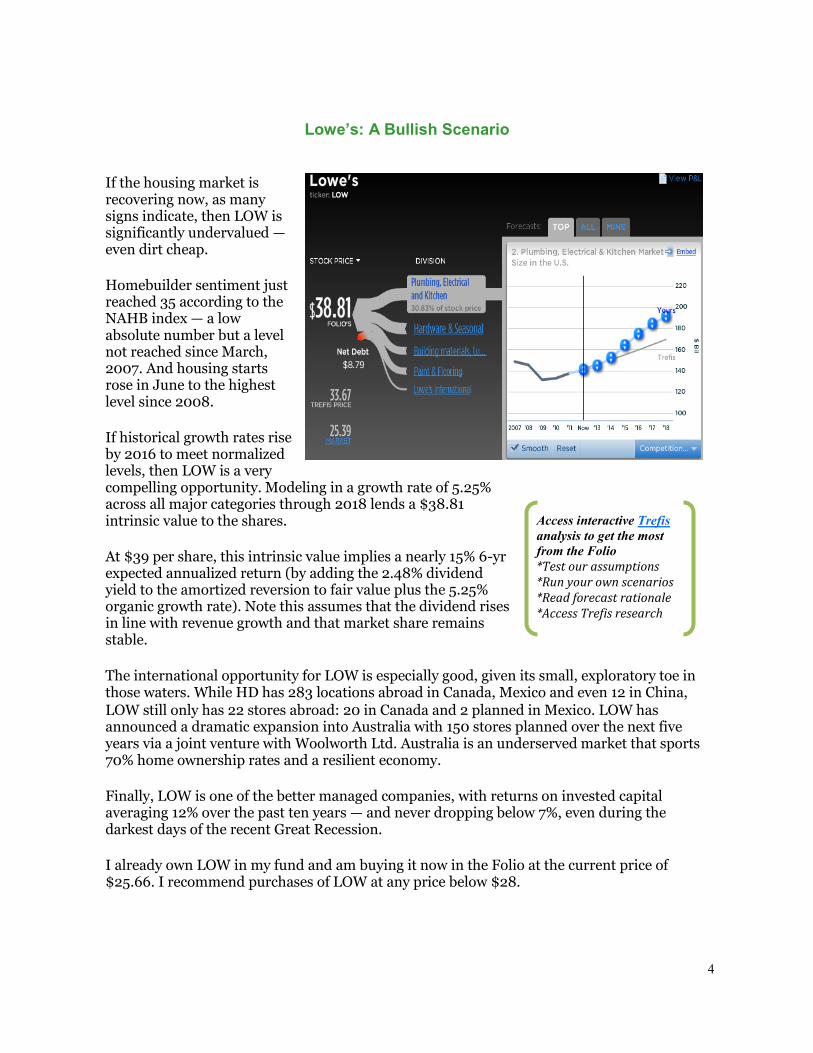
If the housing market is recovering now, as many signs indicate, then LOW is significantly undervalued — even dirt cheap.
Homebuilder sentiment just reached 35 according to the NAHB index — a low absolute number but a level not reached since March, 2007. And housing starts rose in June to the highest level since 2008.
If historical growth rates rise by 2016 to meet normalized levels, then LOW is a very compelling opportunity. Modeling in a growth rate of 5.25% across all major categories through 2018 lends a $38.81 intrinsic value to the shares.
At $39 per share, this intrinsic value implies a nearly 15% 6-yr expected annualized return (by adding the 2.48% dividend yield to the amortized reversion to fair value plus the 5.25% organic growth rate). Note this assumes that the dividend rises in line with revenue growth and that market share remains stable.
The international opportunity for LOW is especially good, given its small, exploratory toe in those waters. While HD has 283 locations abroad in Canada, Mexico and even 12 in China, LOW still only has 22 stores abroad: 20 in Canada and 2 planned in Mexico. LOW has announced a dramatic expansion into Australia with 150 stores planned over the next five years via a joint venture with Woolworth Ltd. Australia is an underserved market that sports 70% home ownership rates and a resilient economy.
Finally, LOW is one of the better managed companies, with returns on invested capital averaging 12% over the past ten years — and never dropping below 7%, even during the darkest days of the recent Great Recession.
I already own LOW in my fund and am buying it now in the Folio at the current price of $25.66. I recommend purchases of LOW at any price below $28.
Access interactive Trefis
analysis to get the most
from the Folio
*Test our assumptions *Run your own scenarios *Read forecast rationale *Access Trefis research

5
Company Highlights
Procter & Gamble (PG) Berman’s Take: I just covered Procter & Gamble (PG) in last month’s issue, but some recent events warrant another update. Noted activist investor Bill Ackman has taken a large position in PG and is advocating for a breakup of the company and/or management change. As a long-term investor I’m always suspicious of reshuffling the asset deck with dispositions or sales as a quick fix. Such recommendations often benefit short-termers and investment bankers, often at the expense of committed shareholders. On the other hand, Ackman is an astute, thoughtful investor with ample points about PG’s underperformance. I believe PG has tremendous intrinsic value as it is, but there’s logic to spinning off the “non-core” Iams pet food and Duracell battery divisions.
(Access Interactive Model at Trefis)
Trefis Key Drivers:
The Beauty division, which consists of fragrances and deodorants, hair care products such as Head & Shoulders and Pantene, and skin care products including the Olay and Old Spice brands, accounts for 23% of the Trefis price estimate for P&G’s stock. Trefis expects significant growth in this segment as the company looks to expand into emerging markets, many of which have seen growing demand for branded products such as fragrances, deodorants, skin care and makeup products. Even though Ackman’s current stake is barely 1% of P&G’s market capitalization, the move has put pressure on management to accelerate its cost-cutting and restructuring measures that have so far been slow. A divestiture of non-core assets could allow the company to focus on its more profitable, higher-growth business lines.
Market Capitalization
Annual Revenues Dividend/Yield
52 Week Range
$177.4 B $85.1 B $2.24/3.4% $57.56-67.95

6
Company Highlights
CSX (CSX) Berman’s Take: It’s impossible to say which energy source will eventually win the sweepstakes for market share. The likely contenders range from sustainables like solar and wind to conventional fuels like natural gas. I’m more comfortable picking the loser than the winner — and that’s coal. Coal is cheap but the surge in natural gas volumes has rendered coal less competitive. Last month, for the first time in U.S. history, natural gas generated more energy than coal. Natural gas is cleaner, producing on average 40% less in carbon emissions. 26% of CSX’s core value is coal shipments and current coal volume declines are pressuring CSX. A question of concern is whether coal’s descent is cyclical and secular. If secular, CSX will face major obstacles for a long, long time. I am reducing CSX to a hold.
(Access Interactive Model at Trefis)
Trefis Key Drivers:
Trefis estimates that industrial freight, the transportation of industrial products such as chemical and petroleum products as well as metals and autos, is the primary value driver for CSX. It has surpassed coal freight as the top driver largely as a result of soft domestic coal demand and a weak near-term outlook for coal. Trefis expects that a rebound in industrial activity and automotive demand will drive shipments, while elevated gas prices could allow railroad carriers to capture market share from the trucking industry. Additionally, despite significant near-term weakness, Trefis expects that coal demand will rebound somewhat as natural gas prices inevitably rise. Given that natural gas is more environmentally friendly, it will likely remain the preferred fuel for electricity generation, but as its price bounces back its advantage will deteriorate. This should allow for a mild recovery in coal shipments.
Market Capitalization
Annual Revenues Dividend/Yield
52 Week Range
$22.7 B $11.7 B $0.56/2.2% $17.69 - 25.69

7
Company Highlights
Paychex (PAYX) Berman’s Take: Paychex (PAYX) held its first investor day this week, outlining growth strategies for the coming years. CEO Martin Mucci and the rest of the executive team presented a very thorough review (see webcast here). Mucci discussed the significant growth in new businesses such as insurance, where PAYX has signed 107,000 clients — and in retirement administration, with 59,000 plans under administration. Regulatory complexity continues to compel companies to outsource these functions. Other product expansions include employee verifications (background checks). PAYX has also fostered some initial international expansion with 2,000 clients in Germany. I think PAYX remains the classic “time arbitrage” value investment with long-term promise obscured by the short-term headwinds of unemployment. I disagree with the Trefis price and continue to put fair value above $35, mainly as a result of lowering the discount rate.
(Access Interactive Model on Trefis)
Trefis Key Drivers:
According to Trefis analysis, Paychex is more dependent on future employment growth than competitor ADP. This is largely due to the fact that ADP focuses on larger institutional clients where revenues tend to be more stable. Paychex’s core payroll services are more targeted at small and medium-sized businesses for which revenues—and therefore employment figures - can be more volatile. However, Trefis does expect significant growth in interest revenue earned on client payroll funds, driven by an eventual normalization of interest rates and a long-term increase in total client funds as economic conditions and employment figures recover. Should conditions improve more rapidly than expected there could be a significant upside to the Trefis price estimate for Paychex’s stock.
Market Capitalization
Annual Revenues Dividend/Yield
52 Week Range
$11.8B $2.2 B $0.32/3.9% $25.12—33.40

8
Company Highlights
eBay (EBAY) Berman’s Take: EBAY reported strong Q2 revenues of $3.4 billion. The marketplaces division, which includes online auctions, showed surprising resiliency. CEO John Donahoe may have finally stabilized that core business. PayPal put in another strong showing with 26% revenue growth. At 40% of sales and 30% of core value, PayPal’s growth trajectory is providing heft to overall results. I believe payment processing and auctions remain two of the best businesses you can be in, with recurring revenues, low capex, and wide economic moats. Despite PayPal’s network effect, however, EBAY will face growing competition on the payments side from Google, Facebook and others. EBAY is also no longer a huge bargain, trading only 8% below fair value. I am maintaining the position but wouldn’t buy more at this price.
(Access Interactive Model on Trefis)
Trefis Key Drivers:
Despite the high-growth nature of PayPal’s business, the division still only accounts for 31% of the
Trefis price estimate for eBay’s stock, significantly less than the Marketplaces division. Marketplaces
saw 9% revenue growth in the second quarter, which was overshadowed by PayPal’s 26% growth but is
nonetheless impressive for a more mature business. While Marketplaces’ slowing growth has been a
concern for many investors, the company has thus far done a good job managing the business, with its
mobile apps in particular providing a boost to sales. Management expects to generate $8 billion in
mobile transaction volume in 2012.
Market Capitalization
Annual Revenues Dividend/Yield
52 Week Range
$57.8 B $12.1B $ - / - $26.86-45.48

9
Ticker Name
Buy Hold Sell
Reference Date
Reference Price ($)
Market Price
($)
Total Re-turn Since Reference Date($)
Trefis Esti-mate
($)
Basic Materials
AA Alcoa Buy 12/21/2011 $8.87 $8.26 (6.3%) $10.28
DOW Dow Chemi-cal
Buy 12/21/2011 $26.98 $30.92 15.5% $31.61
Consumer
HNZ H.J. Heinz Buy 12/21/2011 $53.15 $54.97 6.3% $57.24
LOW Lowe’s New Buy
07/20/2012 $25.63 $25.63 —————- $33.67
PG Procter & Gamble
Buy 12/21/2011 $65.84 $64.73 (0.1%) $65.80
WMT Wal-Mart Hold 12/21/2011 $59.49 $72.25 23.0% $71.17
Energy
BP BP Buy 12/21/2011 $41.33 $41.55 2.9% $59.51
Financial Services
BK BNY Mellon Buy 12/21/2011 $19.43 $20.77 8.1% $27.04
C Citigroup Buy 12/21/2011 $25.74 $25.87 0.6% $37.00
JPM JP Morgan Buy 12/21/2011 $32.12 $33.90 7.0% $46.05
Pharmaceuticals
JNJ Johnson & Johnson
Buy 03/21/2012 $65.21 $68.63 6.3% $73.76
PFE Pfizer Buy 01/21/2012 $21.90 $21.90 10.4% $25.07
Tech, Media, Telecom
ADP ADP Buy 12/21/2011 $53.21 $56.10 7.7% $58.49
EBAY eBay Hold 12/21/2011 $30.18 $44.85 48.6% $50.05
FB Facebook Buy 06/01/2012 $27.72 $28.76 3.8% $33.19
PAYX Paychex Buy 12/21/2011 $29.14 $32.43 13.6% $29.31
Industrials & Transportation
CSX CSX Hold 12/21/2011 $20.80 $22.37 8.8% $23.55
UPS UPS Buy 12/21/2011 $72.40 $78.45 10.0% $85.97
UTX UTX Buy 04/21/2012 $80.40 $74.23 (7.7%) $102.00
Total 11.2%
Total return is calculated since inception date of 12/21/2011, including reinvested dividends, on an equal dollar-weighted portfolio.
The Berman Value Folio
PORTFOLIO CHANGES
Added Lowe’s (LOW) at $25.66.
Estimated fair value is around $35, or
as high as $39 if the housing market
rebounds by 2013.
10
The Berman Value Folio (TBVF) is published monthly and provides information and investment ideas on stocks. All material in TBVF is copyright 2012 by Trefis and may not be reproduced in whole or in part in any form without written consent. TBVF is intended for experienced investors, who understand the risks, costs, mechanics and consequences of investing. None of the content in this newsletter is intended to be, nor should be interpreted as, a solicitation to buy or sell securities. The selection of portfolio stocks is based on rigorous fundamental analysis. There is, however, no assurance that these securities will produce profits.
Performance results are based on model portfolios and do not reflect actual trading. Actual performance will vary based on a variety of factors, including market conditions and trading costs. TBVF results may not reflect the impact that material economic and market factors might have had on the adviser's decision-making if the adviser were actually managing clients' money in this portfolio. TBVF contains stocks that are managed with a view towards capital appreciation. James Berman and JBGlobal.com may manage other portfolios with different strategies and returns that materially differ from TBVF results. TBVF model results do not reflect the deduction of any advisory fees, brokerage or other commissions, bid-ask spreads and any other expenses that a client would have paid or actually paid in a real portfolio. All return figures assume the reinvestment of all dividends. Returns quoted are for an equal dollar-weighted portfolio, where each holding is purchased in equal dollar weights. Past performance does not guarantee future results. Any forward-looking statement is inherently uncertain and cannot be relied upon as a statement of actual performance. Investment in stocks can result in serious loss. It should not be assumed that recommendations made in the future will be profitable or will equal the performance of the securities in this list.
Although all content is derived from data believed to be reliable, accuracy cannot be guaranteed. James Berman, JBGlobal.com LLC, Insight Guru Inc., Trefis, TBVF’s publisher and distributor(s) and their employees assume no liability whatsoever for any investment losses as a result of securities purchased on TBVF recommendations. TBVF is not intended to provide personalized investment advice. Readers and subscribers should consult their financial advisor before investment.
James Berman is an investor in Insight Guru Inc., the parent company of Trefis, both personally and through the venture fund he subadvises. Employees of TBVF, Insight Guru Inc., JBGlobal.com L.L.C. and Trefis may hold positions in some or all of the stocks mentioned here. James Berman and JBGlobal.com L.L.C. may hold positions in some or all of the stocks mentioned here, both personally and in the accounts and funds they manage for others. No compensation for recommending particular securities, services, or financial advisors is solicited or accepted. If you are unwilling or unable to abide by any conditions of this disclaimer, then you may obtain a refund for the unused portion of your subscription at any time.