Embed Size (px)
Citation preview
RESEARCH ARTICLE Open Access
The burden of headache disorders in theEastern Mediterranean Region, 1990-2016:findings from the Global Burden of Diseasestudy 2016Kia Vosoughi1,16, Lars Jacob Stovner2,3, Timothy J. Steiner2,4,5, Maziar Moradi-Lakeh1*,Seyed-Mohammad Fereshtehnejad6,7, Farshad Farzadfar8, Pouria Heydarpour9, Reza Malekzadeh10,Mohsen Naghavi11, Mohammad Ali Sahraian9, Sadaf G. Sepanlou10, Arash Tehrani-Banihashemi12,13,Reza Majdzadeh14, Valery L. Feigin11,15, Theo Vos11, Ali H. Mokdad11 and Christopher J. L. Murray11
Abstract
Objectives: Using the findings of the Global Burden of Disease Study (GBD), we report the burden of primaryheadache disorders in the Eastern Mediterranean Region (EMR) from 1990 to 2016.
Methods: We modelled headache disorders using DisMod-MR 2.1 Bayesian meta-regression tool to ensure consistencybetween prevalence, incidence, and remission. Years lived with disability (YLDs) were calculated by multiplyingprevalence and disability weight (DW) of migraine and tension-type headache (TTH). We assumed primary headachedisorders as non-fatal, so their YLD is equal to disability-adjusted life years (DALYs).
Results: Migraine and TTH were the second and twentieth leading causes of YLDs in EMR. Between 1990 and 2016,the absolute YLD numbers of migraine and TTH increased from 2.3 million (95% uncertainty interval (UI): 1.5–3.2) to4.7 million (95%UI: 3–6.5) and from 383 thousand (95%UI: 240–562) to 816 thousand (95%UI: 516–1221), respectively.During the same period, age-standardised YLD rates of migraine and TTH in EMR increased by 0.7% and 2.5%,respectively, in comparison to a small decrease in the global rates (0.2% decrease in migraine and TTH). The bulk ofburden due to headache occurred in the 30–49 year age group, with a peak at ages 35–44 years. The age-standardisedYLD rates of both headache disorders were higher in women with female to male ratio of 1.69 for migraine and 1.38for TTH. All countries of the EMR except for Somalia and Djibouti had higher age-standardised YLD rates for migraineand TTH in compare to the global rates. Libya and Saudi Arabia had the highest increase in age-standardised YLD ratesof migraine and TTH, respectively.
Conclusion: The findings of this study show that primary headache disorders are a major and a growing cause ofdisability in EMR. Since 1990, burden of primary headache disorders has constantly been higher in EMR compared torest of the world, which indicates that health systems in EMR must focus further on developing and implementingpreventive and management strategies to control headache.
Keywords: Primary headache, Migraine, Tension-type headache, Burden, Prevalence, Years lived with disability (YLDs),Disability-adjusted life years (DALYs), Global burden of disease study (GBD), Eastern Mediterranean region (EMR)
© The Author(s). 2019 Open Access This article is distributed under the terms of the Creative Commons Attribution 4.0International License (http://creativecommons.org/licenses/by/4.0/), which permits unrestricted use, distribution, andreproduction in any medium, provided you give appropriate credit to the original author(s) and the source, provide a link tothe Creative Commons license, and indicate if changes were made.
* Correspondence: [email protected] Medicine and Public Health Research Center, Iran University ofMedical Sciences, Tehran, IranFull list of author information is available at the end of the article
The Journal of Headache and Pain
Vosoughi et al. The Journal of Headache and Pain (2019) 20:40 https://doi.org/10.1186/s10194-019-0990-3
IntroductionHeadache, with the global prevalence of 47%, is one ofthe most common neurological disorders [1] Headachecan be a secondary symptom of an underlying condi-tions (e.g. intracranial neoplasms, epileptic seizures, andintracranial infections); however, in most cases it is aprimary and non-fatal disorder [2, 3]. Primary headachessuch as migraine, tension-type headache (TTH), andcluster headache, although non-fatal, cause substantialdisability and economic cost [4–7].Global Burden of Diseases, Injuries and Risk Factors
study (GBD) is a comprehensive worldwide epidemio-logic study being performed since 1990 [8, 9]. Estimationof years lived with disability (YLDs) and prevalence ofdiseases were among the main objectives of GBD [4]. InGBD 2000, for the first time, migraine was included asthe only headache subtype. Since then, TTH was addedto the GBD study, and some of the limitations in theprevious estimates were addressed by using more com-prehensive and reliable epidemiologic data based onpopulation-based surveys from countries without previ-ous available data [4]. GBD 2016, provided more accur-ate estimations of prevalence and burden of headache bycountries, regions, and super regions [4].According to GBD 2016, prevalence of headache disor-
ders was variable across different geographic regions.For example, migraine was less frequent in African andWestern Pacific WHO regions and TTH was less frequentin African region. However, the overall global all-ageprevalence of migraine and TTH were estimated to be14.1% (95% uncertainty interval [UI] 13.5–14.8%), and25.6% (95% UI 23.1–28.4) respectively in 2016. Althoughprevalence of headache is an important epidemiologicmeasure, the burden of disability related to headache, asmeasured by YLD, is more informative for health policymaking. Globally, migraine, with 45,121,909 YLDs (95%UI 29,045,835-62,826,904), and TTH, with 7,195,122YLDs (95% UI 4,614,628-10,499,903), were the secondand 28 leading causes of disability.Despite the considerable burden, headache disorders
are still underestimated and underdiagnosed [1, 10]. Astudy has estimated that the headache diagnosis rate isunder 40% [11], which leads to a high undertreated rate.Effective treatment for most primary headache cases canbe provided by primary health service and with low cost[11]; therefore, improvement of the diagnosis and treat-ment rate will substantially reduce the burden ofheadache.GBD 2016 emphasized that primary headache disor-
ders are an important health priority. Estimating theburden of headache is the first step to implement furthermeasures to reduce its burden such as educating healthcare providers, developing primary care management,and allocating resources. In this study, we reported the
prevalence and burden of primary headache disorders(including migraine and TTH) in Eastern MediterraneanRegion (EMR) countries from 1990 to 2016 using dataand methods of the Global Burden of Diseases, Injuries,and Risk Factors Study 2016.
MethodsOverviewThe Global Burden of Diseases, Injuries, and RiskFactors Study 2016 (GBD 2016) is a standardised ana-lytical method that used all eligible sources to esti-mate the epidemiological data, including prevalence,mortality, years of life lost (YLL), YLDs, anddisability-adjusted life years (DALYs), for 328 causesby sex, age, and location from 1990 to 2016. It esti-mates all parameters for 195 countries and territories,nested in twenty-one regions and seven super-regions.Details of the methodology of GBD studies and themain changes applied in GBD 2016 has been ex-plained in another article [4].
Locations, causes, and parametersThe World Health Organization (WHO) EMR, hometo approximately 600 million people [12], contains22 countries: Afghanistan, Bahrain, Djibouti, Egypt,Iran, Iraq, Jordan, Kuwait, Lebanon, Libya, Morocco,Oman, Pakistan, Palestine, Qatar, Saudi Arabia,Somalia, Sudan, Syria, Tunisia, United Arab Emirates, andYemen. In this article all epidemiologic parameters havebeen reported for the whole EMR region and all countriesseparately.From the category of neurological disorders, we in-
cluded migraine and tension-type headache (TTH) - thetwo types of primary headache disorders which werecovered in GBD 2016. In the previous GBD iteration(GBD 2015), in addition to migraine and TTH, medica-tion overuse headache (MOH) was also included as aseparate disorder. In the present iteration, MOH hasbeen removed as an independent cause, and the YLDs ofMOH has been calculated as a sequel of migraine andTTH. Based on the previous studies, 73 % of total MOHYLDs were classified as a sequel of migraine (MOH dueto migraine) and the rest of them were classified as a se-quel of TTH (MOH due to TTH) [13–15]. Secondaryheadache disorders were not included in this study.In this article, we presented numbers and rates of
prevalence and YLDs of migraine and TTH in 2016 andthe changes from 1990 to 2016 for all EMR countries.We assumed that primary headache disorders do notlead to mortality and, therefore, disability adjustedlife-years (DALYs) of migraine and TTH are equal totheir YLDs.
Vosoughi et al. The Journal of Headache and Pain (2019) 20:40 Page 2 of 13
Data sourcesIn GBD 2016, systematic review for migraine, TTH,and MOH were updated as part of the GBD standardmethodology. Details on the data sources have beendescribed elsewhere [16]. From the EMR, data sourcesfrom Iran [17–19], Pakistan [20], Tunisia [21], andUAE [22] for migraine, and data sources from Iran[17, 19, 23], Pakistan [20], and Qatar [24] for TTHwere used in GBD 2016; however, data inputs fromall over the world were used to model the burden ofmigraine and TTH in EMR countries.
ModelingIn order to make data more consistent and suitablefor modelling, age-sex splitting was applied to thesources that had reported data by age or sex but notby both age and sex.Non-fatal modelling, using DisMod-MR 2.1, were
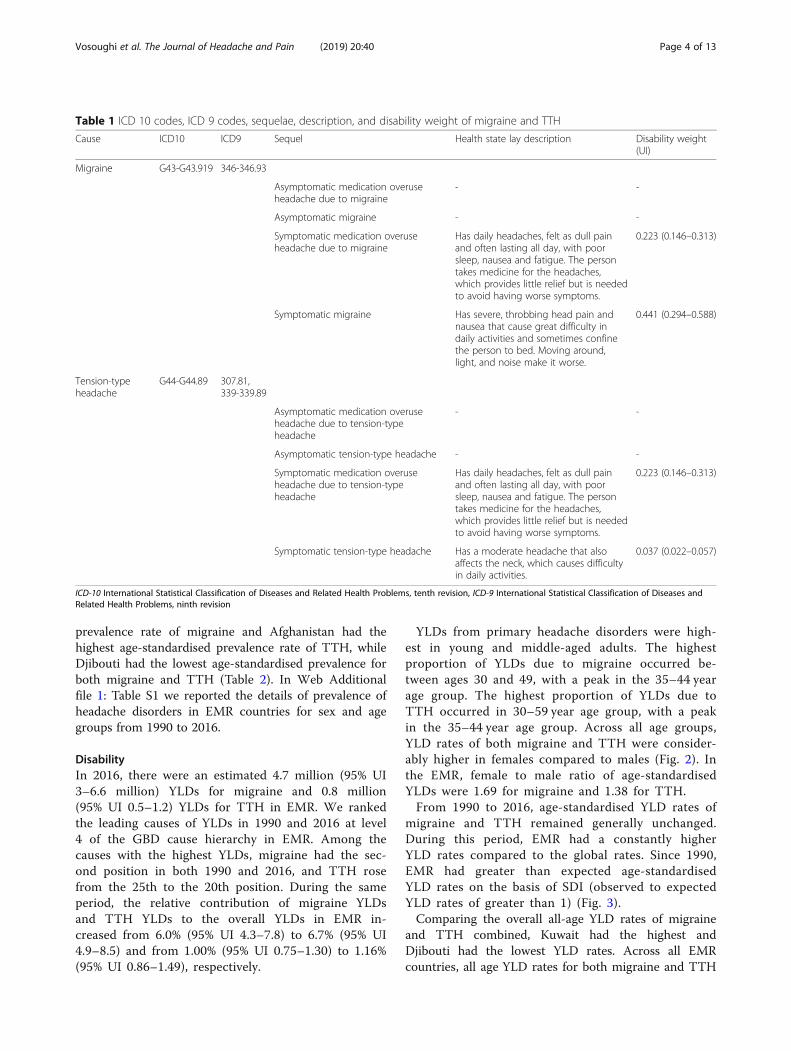
performed to estimate prevalence and incidence of mi-graine, TTH, and MOH. DisMod-MR 2.1 is a Bayesianmeta-regression method that estimates non-fatal out-comes using sparse and heterogeneous epidemiologicaldata. It also pools data from different sources and ad-justs them for variations in study methods acrosssources and enforces consistency between different epi-demiological parameters. Binary study-level covariateswere used in modelling to minimize residual errors ofthe estimated prevalence and YLDs. Using themixed-effects nonlinear regression on all the availabledata at the global level, super-region Bayesian priorswere generated; likewise, the super-region regressionmodel was then used to generate region Bayesian priors,and so on down the cascade. Bayesian priors of the EMRcountries were generated by using three differentsuper-region models: Eastern Sub-Saharan Africa modelfor Djibouti and Somalia, South Asia model for Pakistan,and North Africa and Middle East model for the rest ofEMR countries. For GBD 2016, the same disabilityweights (DW) as in GBD 2015 were used. Table 1 dis-plays ICD 10 and ICD 9 codes, sequelae, description,and DW of primary headache disorders.
YLD computationYLDs were calculated by multiplying prevalence andDW for each sequel, and then YLDs were adjustedfor occurrence of simultaneous comorbidities. Co-morbidity with additional disorders in a patient withprimary headache was estimated by calculating theindependent probability of having simultaneoussequelae.
Uncertainty interval and age-standardised valuesWe repeated calculation of comorbidity-adjustedYLDs 1000 times and generated a distribution with
the 1000 samples. The 25th and 975th values of the1000 draws determined the upper and lower boundsof the 95% UI. Age-standardised prevalence rate andage-standardised YLD rates were calculated using theGBD reference population [25].
Socio-demographic Index (SDI) and expected YLD rateson the basis of SDISDI was used to provide a comparable metric foroverall sociodemographic development. SDI, expressedon a scale of 0 to 1, is a summary measure that iden-tifies where GBD locations sit on the spectrum ofsocioeconomic development [26]. SDI was calculatedbased on the geometric mean of lag-distributed in-come (LDI), average years of schooling among popu-lations aged 15 years or older, and total fertility rate(TFR). Five SDI quintiles, high, high-middle, middle,low-middle, and low, were selected based on SDIvalues. More details regarding the calculation of SDIare provided in previous GBD publications [4, 27].Expected YLD rates at each level SDI were gener-
ated by a Gaussian regression model [4, 28]. ExpectedYLD rates on the basis of SDI was compared to theobserved values to investigate the performance ofcountries on the basis of what would be expected onthe basis of their overall development.
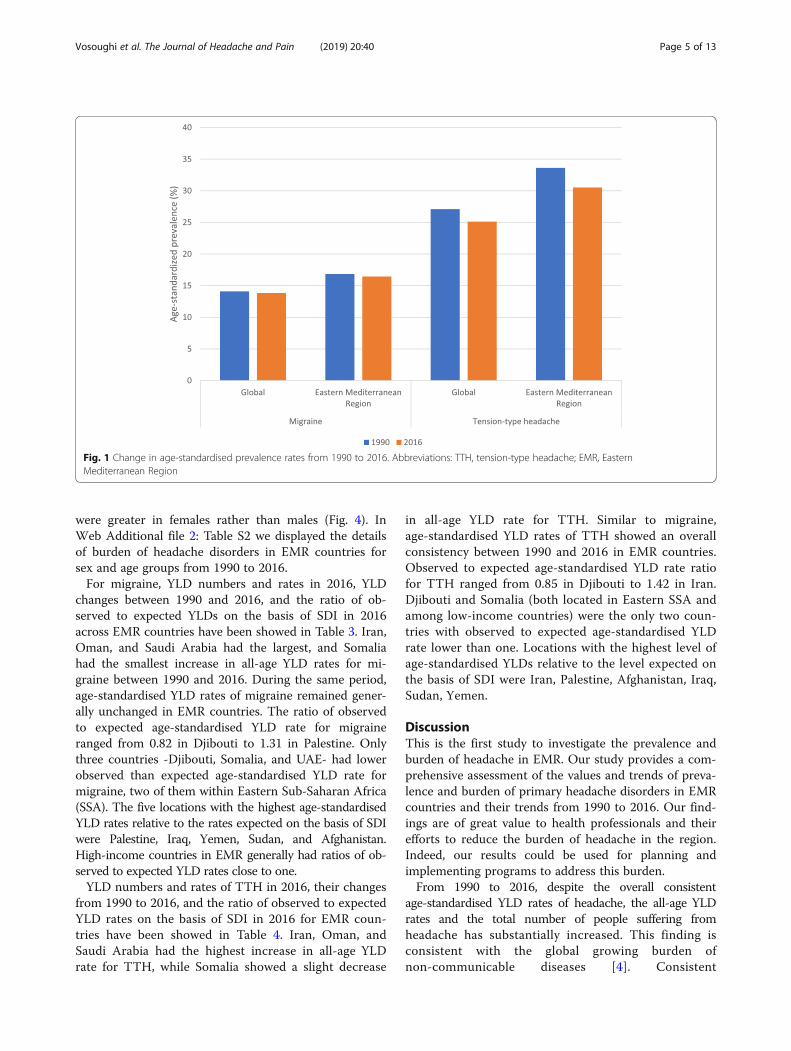
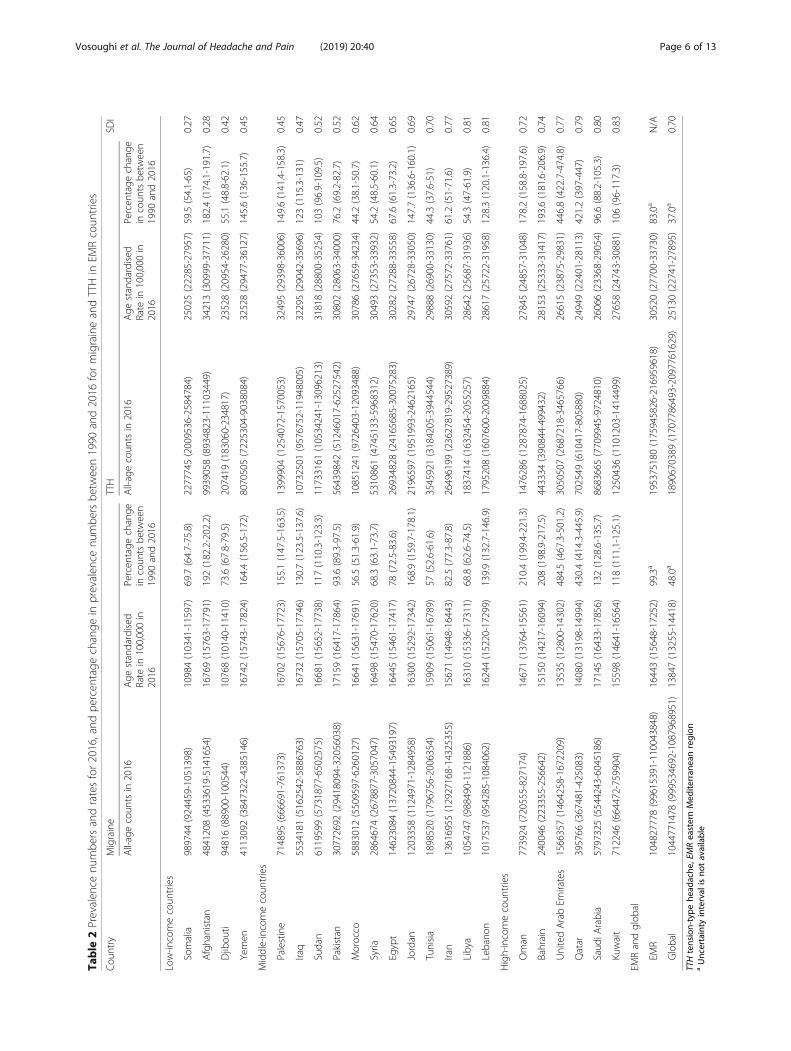
ResultsPrevalenceEstimated all-age prevalence of TTH and migraine inEMR for 2016 were 29.7% (95% UI 26.8–33) and15.9% (95% UI 15.2–16.8), respectively. Between1990 and 2016, the number of individuals with mi-graine in EMR increased from 53 million (95% UI50–55 million) to 105 million (95% UI 100–110million), and the number of individuals with TTHincreased from 107 million (95% UI 96–119 million)to 195 million (95% UI 176–217 million). From 1990to 2016, age-standardised prevalence of migraine andTTH remained generally unchanged both in theEMR and globally, with a constant higher rate in theEMR (Fig. 1).In the EMR, prevalence of headache was higher in fe-
males, with prevalence count female to male ratio of 1.7and 1.2 for migraine and TTH, respectively. Headachewas most common in young and middle-aged adults,with highest prevalence count in 35 to 39 year age groupfor both migraine (25.9, 95% UI 23.7–28.5%) and TTH(46, 95% UI 33.9–57.8%).Djibouti had the lowest and Pakistan had the highest
prevalence numbers for both migraine and TTH. From1990 to 2016, UAE had the highest increase in the num-ber of individuals with migraine and TTH (Table 2). In2016, Pakistan had the highest age-standardised
Vosoughi et al. The Journal of Headache and Pain (2019) 20:40 Page 3 of 13
prevalence rate of migraine and Afghanistan had thehighest age-standardised prevalence rate of TTH, whileDjibouti had the lowest age-standardised prevalence forboth migraine and TTH (Table 2). In Web Additionalfile 1: Table S1 we reported the details of prevalence ofheadache disorders in EMR countries for sex and agegroups from 1990 to 2016.
DisabilityIn 2016, there were an estimated 4.7 million (95% UI3–6.6 million) YLDs for migraine and 0.8 million(95% UI 0.5–1.2) YLDs for TTH in EMR. We rankedthe leading causes of YLDs in 1990 and 2016 at level4 of the GBD cause hierarchy in EMR. Among thecauses with the highest YLDs, migraine had the sec-ond position in both 1990 and 2016, and TTH rosefrom the 25th to the 20th position. During the sameperiod, the relative contribution of migraine YLDsand TTH YLDs to the overall YLDs in EMR in-creased from 6.0% (95% UI 4.3–7.8) to 6.7% (95% UI4.9–8.5) and from 1.00% (95% UI 0.75–1.30) to 1.16%(95% UI 0.86–1.49), respectively.
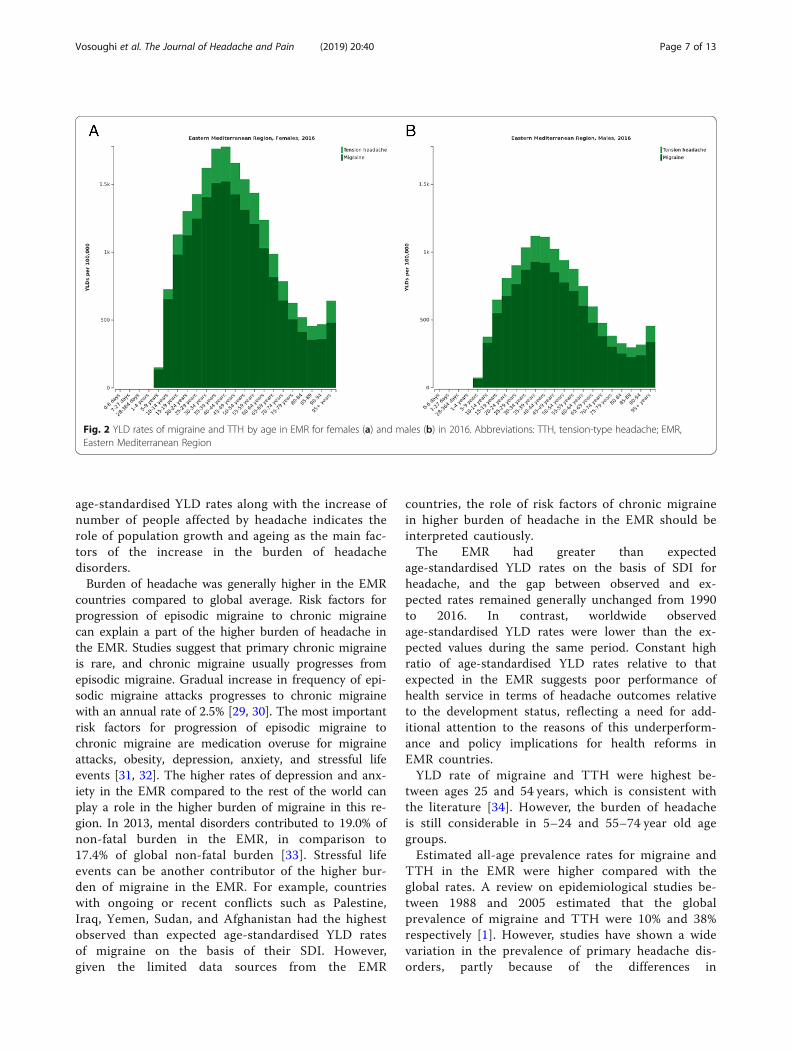
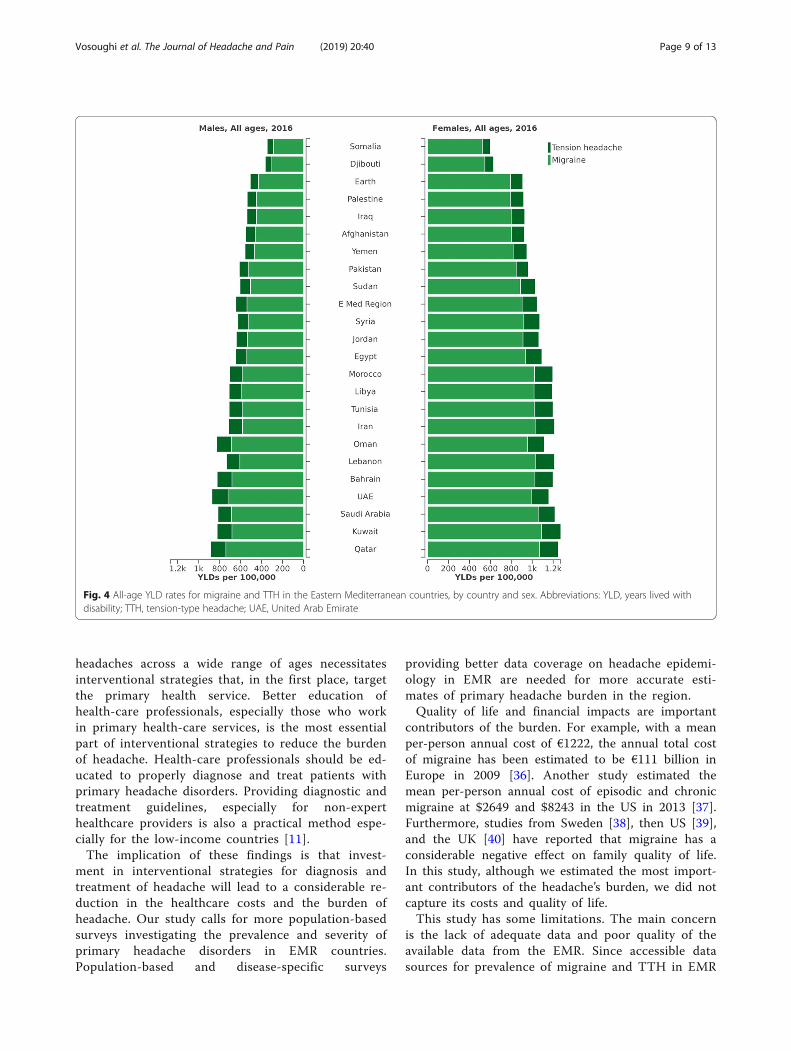
YLDs from primary headache disorders were high-est in young and middle-aged adults. The highestproportion of YLDs due to migraine occurred be-tween ages 30 and 49, with a peak in the 35–44 yearage group. The highest proportion of YLDs due toTTH occurred in 30–59 year age group, with a peakin the 35–44 year age group. Across all age groups,YLD rates of both migraine and TTH were consider-ably higher in females compared to males (Fig. 2). Inthe EMR, female to male ratio of age-standardisedYLDs were 1.69 for migraine and 1.38 for TTH.From 1990 to 2016, age-standardised YLD rates of
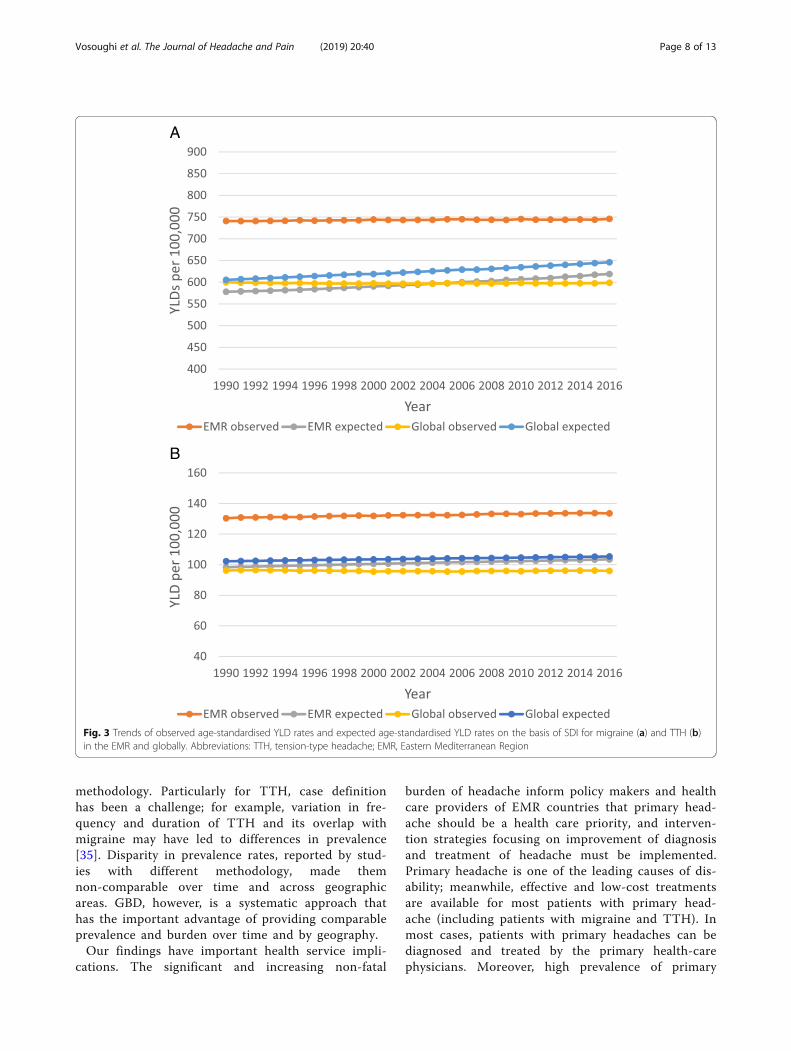
migraine and TTH remained generally unchanged.During this period, EMR had a constantly higherYLD rates compared to the global rates. Since 1990,EMR had greater than expected age-standardisedYLD rates on the basis of SDI (observed to expectedYLD rates of greater than 1) (Fig. 3).Comparing the overall all-age YLD rates of migraine
and TTH combined, Kuwait had the highest andDjibouti had the lowest YLD rates. Across all EMRcountries, all age YLD rates for both migraine and TTH
Table 1 ICD 10 codes, ICD 9 codes, sequelae, description, and disability weight of migraine and TTH
Cause ICD10 ICD9 Sequel Health state lay description Disability weight(UI)
Migraine G43-G43.919 346-346.93
Asymptomatic medication overuseheadache due to migraine
- -
Asymptomatic migraine - -
Symptomatic medication overuseheadache due to migraine
Has daily headaches, felt as dull painand often lasting all day, with poorsleep, nausea and fatigue. The persontakes medicine for the headaches,which provides little relief but is neededto avoid having worse symptoms.
0.223 (0.146–0.313)
Symptomatic migraine Has severe, throbbing head pain andnausea that cause great difficulty indaily activities and sometimes confinethe person to bed. Moving around,light, and noise make it worse.
0.441 (0.294–0.588)
Tension-typeheadache
G44-G44.89 307.81,339-339.89
Asymptomatic medication overuseheadache due to tension-typeheadache
- -
Asymptomatic tension-type headache - -
Symptomatic medication overuseheadache due to tension-typeheadache
Has daily headaches, felt as dull painand often lasting all day, with poorsleep, nausea and fatigue. The persontakes medicine for the headaches,which provides little relief but is neededto avoid having worse symptoms.
0.223 (0.146–0.313)
Symptomatic tension-type headache Has a moderate headache that alsoaffects the neck, which causes difficultyin daily activities.
0.037 (0.022–0.057)
ICD-10 International Statistical Classification of Diseases and Related Health Problems, tenth revision, ICD-9 International Statistical Classification of Diseases andRelated Health Problems, ninth revision
Vosoughi et al. The Journal of Headache and Pain (2019) 20:40 Page 4 of 13
were greater in females rather than males (Fig. 4). InWeb Additional file 2: Table S2 we displayed the detailsof burden of headache disorders in EMR countries forsex and age groups from 1990 to 2016.For migraine, YLD numbers and rates in 2016, YLD
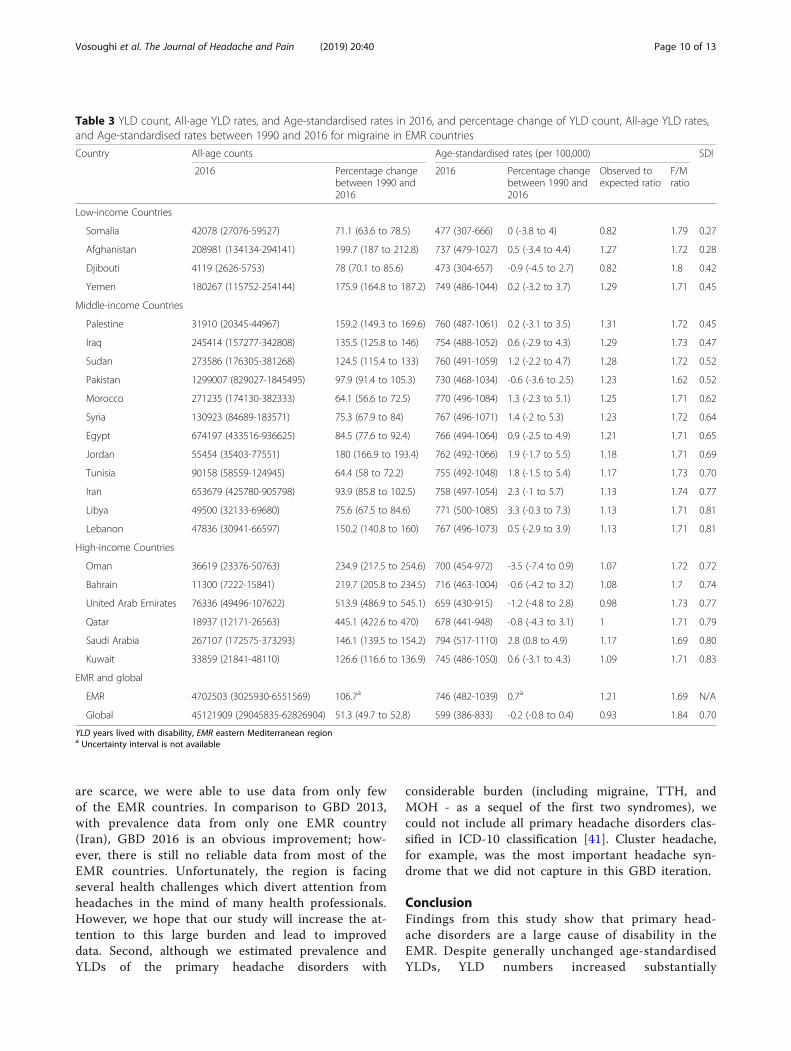
changes between 1990 and 2016, and the ratio of ob-served to expected YLDs on the basis of SDI in 2016across EMR countries have been showed in Table 3. Iran,Oman, and Saudi Arabia had the largest, and Somaliahad the smallest increase in all-age YLD rates for mi-graine between 1990 and 2016. During the same period,age-standardised YLD rates of migraine remained gener-ally unchanged in EMR countries. The ratio of observedto expected age-standardised YLD rate for migraineranged from 0.82 in Djibouti to 1.31 in Palestine. Onlythree countries -Djibouti, Somalia, and UAE- had lowerobserved than expected age-standardised YLD rate formigraine, two of them within Eastern Sub-Saharan Africa(SSA). The five locations with the highest age-standardisedYLD rates relative to the rates expected on the basis of SDIwere Palestine, Iraq, Yemen, Sudan, and Afghanistan.High-income countries in EMR generally had ratios of ob-served to expected YLD rates close to one.YLD numbers and rates of TTH in 2016, their changes
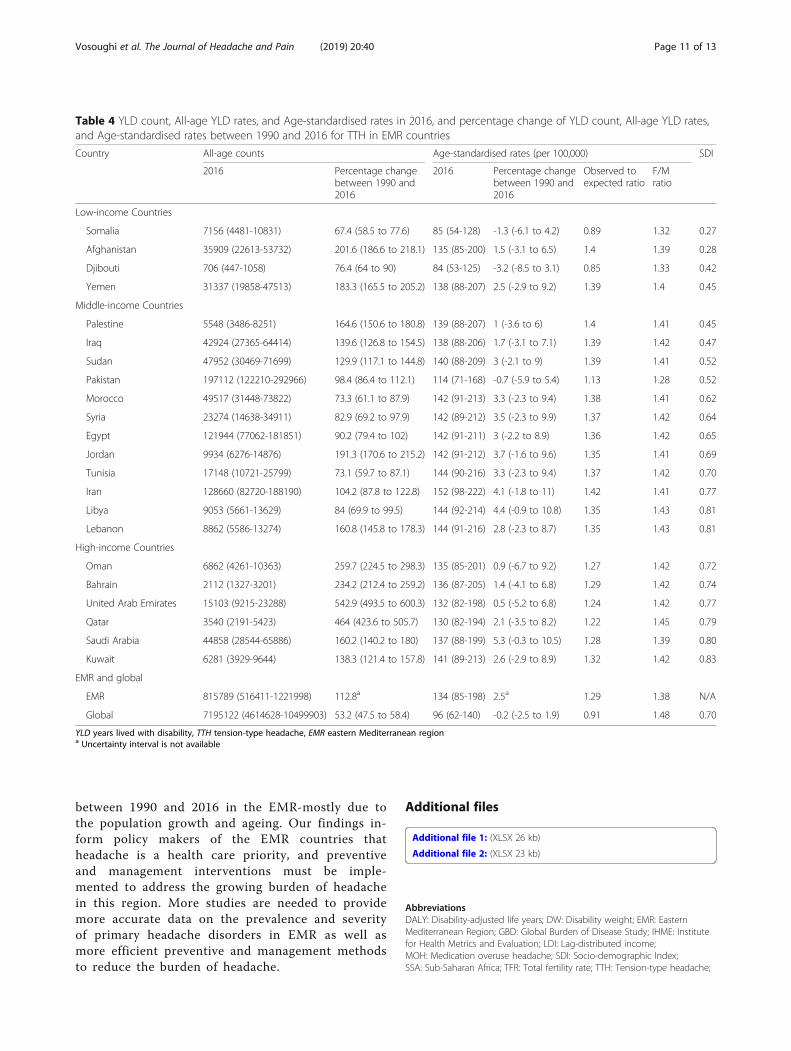
from 1990 to 2016, and the ratio of observed to expectedYLD rates on the basis of SDI in 2016 for EMR coun-tries have been showed in Table 4. Iran, Oman, andSaudi Arabia had the highest increase in all-age YLDrate for TTH, while Somalia showed a slight decrease
in all-age YLD rate for TTH. Similar to migraine,age-standardised YLD rates of TTH showed an overallconsistency between 1990 and 2016 in EMR countries.Observed to expected age-standardised YLD rate ratiofor TTH ranged from 0.85 in Djibouti to 1.42 in Iran.Djibouti and Somalia (both located in Eastern SSA andamong low-income countries) were the only two coun-tries with observed to expected age-standardised YLDrate lower than one. Locations with the highest level ofage-standardised YLDs relative to the level expected onthe basis of SDI were Iran, Palestine, Afghanistan, Iraq,Sudan, Yemen.
DiscussionThis is the first study to investigate the prevalence andburden of headache in EMR. Our study provides a com-prehensive assessment of the values and trends of preva-lence and burden of primary headache disorders in EMRcountries and their trends from 1990 to 2016. Our find-ings are of great value to health professionals and theirefforts to reduce the burden of headache in the region.Indeed, our results could be used for planning andimplementing programs to address this burden.From 1990 to 2016, despite the overall consistent
age-standardised YLD rates of headache, the all-age YLDrates and the total number of people suffering fromheadache has substantially increased. This finding isconsistent with the global growing burden ofnon-communicable diseases [4]. Consistent
Fig. 1 Change in age-standardised prevalence rates from 1990 to 2016. Abbreviations: TTH, tension-type headache; EMR, EasternMediterranean Region
Vosoughi et al. The Journal of Headache and Pain (2019) 20:40 Page 5 of 13
Table
2Prevalen
cenu
mbe
rsandratesfor2016,and
percen
tage
change
inprevalen
cenu
mbe
rsbe
tween1990
and2016
formigraineandTTHin
EMRcoun
tries
Cou
ntry
Migraine
TTH
SDI
All-agecoun
tsin
2016
Age
standardised
Rate
in100,000in
2016
Percen
tage
change
incoun
tsbe
tween
1990
and2016
All-agecoun
tsin
2016
Age
standardised
Rate
in100,000in
2016
Percen
tage
change
incoun
tsbe
tween
1990
and2016
Low-in
comecoun
tries
Somalia
989744
(924459-1051398)
10984(10341-11597)
69.7(64.7-75.8)
2277745(2009536-2584784)
25025(22285-27957)
59.5(54.1-65)
0.27
Afghanistan
4841208(4533619-5141654)
16769(15763-17791)
192(182.2-202.2)
9939058(8934823-11103449)
34213(30999-37711)
182.4(174.1-191.7)
0.28
Djibou
ti94816(88900-100544)
10768(10140-11410)
73.6(67.8-79.5)
207419
(183060-234817)
23528(20954-26280)
55.1(48.8-62.1)
0.42
Yemen
4113092(3847322-4385146)
16742(15743-17824)
164.4(156.5-172)
8070505(7225304-9038084)
32528(29477-36127)
145.6(136-155.7)
0.45
Middle-incomecoun
tries
Palestine
714895
(666691-761373)
16702(15676-17723)
155.1(147.5-163.5)
1399904(1254072-1570053)
32495(29398-36006)
149.6(141.4-158.3)
0.45
Iraq
5534181(5162542-5886763)
16732(15705-17746)
130.7(123.5-137.6)
10732501
(9576752-11948005)
32295(29042-35696)
123(115.3-131)
0.47
Sudan
6119599(5731877-6502575)
16681(15652-17738)
117(110.3-123.3)
11733161
(10534241-13096213)
31818(28800-35254)
103(96.9-109.5)
0.52
Pakistan
30772692
(29418094-32056038)
17159(16417-17864)
93.6(89.3-97.5)
56439842
(51246017-62527542)
30802(28063-34000)
76.2(69.2-82.7)
0.52
Morocco
5883012(5509597-6260127)
16641(15631-17691)
56.5(51.3-61.9)
10851241
(9726403-12093488)
30786(27659-34234)
44.2(38.1-50.7)
0.62
Syria
2864674(2678877-3057047)
16498(15470-17620)
68.3(63.1-73.7)
5310861(4745133-5968312)
30493(27353-33932)
54.2(48.5-60.1)
0.64
Egypt
14623084
(13720844-15493197)
16445(15461-17417)
78(72.5-83.6)
26934828
(24165685-30075283)
30282(27288-33558)
67.6(61.3-73.2)
0.65
Jordan
1203358(1124971-1284958)
16300(15292-17342)
168.9(159.7-178.1)
2196597(1951993-2462165)
29747(26728-33050)
147.7(136.6-160.1)
0.69
Tunisia
1898520(1796756-2006354)
15909(15061-16789)
57(52.6-61.6)
3545921(3184205-3944544)
29888(26900-33130)
44.3(37.6-51)
0.70
Iran
13616955
(12927168-14325355)
15671(14948-16443)
82.5(77.3-87.8)
26496199
(23627819-29527389)
30592(27572-33761)
61.2(51-71.6)
0.77
Libya
1054747(988490-1121886)
16310(15336-17311)
68.8(62.6-74.5)
1837414(1632454-2055257)
28642(25687-31936)
54.3(47-61.9)
0.81
Lebano
n1017537(954285-1084062)
16244(15220-17299)
139.9(132.7-146.9)
1795208(1607600-2009884)
28617(25722-31958)
128.3(120.1-136.4)
0.81
High-incomecoun
tries
Oman
773924
(720555-827174)
14671(13764-15561)
210.4(199.4-221.3)
1476286(1287874-1688025)
27845(24857-31048)
178.2(158.8-197.6)
0.72
Bahrain
240046
(223355-256642)
15150(14217-16094)
208(198.9-217.5)
443334
(390844-499432)
28153(25333-31417)
193.6(181.6-206.9)
0.74
UnitedArabEm
irates
1566357(1464258-1672209)
13535(12800-14302)
484.5(467.3-501.2)
3050507(2687218-3465766)
26615(23875-29831)
446.8(422.7-474.8)
0.77
Qatar
395766
(367481-425083)
14080(13198-14994)
430.4(414.3-445.9)
702549
(610417-805880)
24949(22401-28113)
421.2(397-447)
0.79
Saud
iArabia
5797325(5544243-6045186)
17145(16433-17856)
132(128.6-135.7)
8683665(7709945-9724810)
26066(23368-29054)
96.6(88.2-105.3)
0.80
Kuwait
712246
(664472-759904)
15598(14641-16564)
118(111.1-125.1)
1250436(1101203-1414499)
27658(24743-30881)
106(96-117.3)
0.83
EMRandglob
al
EMR
104827778(99615391-110043848)
16443(15648-17252)
99.3a
195375180(175945826-216959618)
30520(27700-33730)
83.0a
N/A
Global
1044771478
(999534692-1087968951)
13847(13255-14418)
48.0a
1890670389
(1707786493-2097761629)
25130(22741-27895)
37.0a
0.70
TTHtension-type
head
ache
,EMReasternMed
iterran
eanregion
aUncertainty
interval
isno
tavailable
Vosoughi et al. The Journal of Headache and Pain (2019) 20:40 Page 6 of 13
age-standardised YLD rates along with the increase ofnumber of people affected by headache indicates therole of population growth and ageing as the main fac-tors of the increase in the burden of headachedisorders.Burden of headache was generally higher in the EMR
countries compared to global average. Risk factors forprogression of episodic migraine to chronic migrainecan explain a part of the higher burden of headache inthe EMR. Studies suggest that primary chronic migraineis rare, and chronic migraine usually progresses fromepisodic migraine. Gradual increase in frequency of epi-sodic migraine attacks progresses to chronic migrainewith an annual rate of 2.5% [29, 30]. The most importantrisk factors for progression of episodic migraine tochronic migraine are medication overuse for migraineattacks, obesity, depression, anxiety, and stressful lifeevents [31, 32]. The higher rates of depression and anx-iety in the EMR compared to the rest of the world canplay a role in the higher burden of migraine in this re-gion. In 2013, mental disorders contributed to 19.0% ofnon-fatal burden in the EMR, in comparison to17.4% of global non-fatal burden [33]. Stressful lifeevents can be another contributor of the higher bur-den of migraine in the EMR. For example, countrieswith ongoing or recent conflicts such as Palestine,Iraq, Yemen, Sudan, and Afghanistan had the highestobserved than expected age-standardised YLD ratesof migraine on the basis of their SDI. However,given the limited data sources from the EMR
countries, the role of risk factors of chronic migrainein higher burden of headache in the EMR should beinterpreted cautiously.The EMR had greater than expected
age-standardised YLD rates on the basis of SDI forheadache, and the gap between observed and ex-pected rates remained generally unchanged from 1990to 2016. In contrast, worldwide observedage-standardised YLD rates were lower than the ex-pected values during the same period. Constant highratio of age-standardised YLD rates relative to thatexpected in the EMR suggests poor performance ofhealth service in terms of headache outcomes relativeto the development status, reflecting a need for add-itional attention to the reasons of this underperform-ance and policy implications for health reforms inEMR countries.YLD rate of migraine and TTH were highest be-
tween ages 25 and 54 years, which is consistent withthe literature [34]. However, the burden of headacheis still considerable in 5–24 and 55–74 year old agegroups.Estimated all-age prevalence rates for migraine and
TTH in the EMR were higher compared with theglobal rates. A review on epidemiological studies be-tween 1988 and 2005 estimated that the globalprevalence of migraine and TTH were 10% and 38%respectively [1]. However, studies have shown a widevariation in the prevalence of primary headache dis-orders, partly because of the differences in
Fig. 2 YLD rates of migraine and TTH by age in EMR for females (a) and males (b) in 2016. Abbreviations: TTH, tension-type headache; EMR,Eastern Mediterranean Region
Vosoughi et al. The Journal of Headache and Pain (2019) 20:40 Page 7 of 13
methodology. Particularly for TTH, case definitionhas been a challenge; for example, variation in fre-quency and duration of TTH and its overlap withmigraine may have led to differences in prevalence[35]. Disparity in prevalence rates, reported by stud-ies with different methodology, made themnon-comparable over time and across geographicareas. GBD, however, is a systematic approach thathas the important advantage of providing comparableprevalence and burden over time and by geography.Our findings have important health service impli-
cations. The significant and increasing non-fatal
burden of headache inform policy makers and healthcare providers of EMR countries that primary head-ache should be a health care priority, and interven-tion strategies focusing on improvement of diagnosisand treatment of headache must be implemented.Primary headache is one of the leading causes of dis-ability; meanwhile, effective and low-cost treatmentsare available for most patients with primary head-ache (including patients with migraine and TTH). Inmost cases, patients with primary headaches can bediagnosed and treated by the primary health-carephysicians. Moreover, high prevalence of primary
A
B
Fig. 3 Trends of observed age-standardised YLD rates and expected age-standardised YLD rates on the basis of SDI for migraine (a) and TTH (b)in the EMR and globally. Abbreviations: TTH, tension-type headache; EMR, Eastern Mediterranean Region
Vosoughi et al. The Journal of Headache and Pain (2019) 20:40 Page 8 of 13
headaches across a wide range of ages necessitatesinterventional strategies that, in the first place, targetthe primary health service. Better education ofhealth-care professionals, especially those who workin primary health-care services, is the most essentialpart of interventional strategies to reduce the burdenof headache. Health-care professionals should be ed-ucated to properly diagnose and treat patients withprimary headache disorders. Providing diagnostic andtreatment guidelines, especially for non-experthealthcare providers is also a practical method espe-cially for the low-income countries [11].The implication of these findings is that invest-
ment in interventional strategies for diagnosis andtreatment of headache will lead to a considerable re-duction in the healthcare costs and the burden ofheadache. Our study calls for more population-basedsurveys investigating the prevalence and severity ofprimary headache disorders in EMR countries.Population-based and disease-specific surveys
providing better data coverage on headache epidemi-ology in EMR are needed for more accurate esti-mates of primary headache burden in the region.Quality of life and financial impacts are important
contributors of the burden. For example, with a meanper-person annual cost of €1222, the annual total costof migraine has been estimated to be €111 billion inEurope in 2009 [36]. Another study estimated themean per-person annual cost of episodic and chronicmigraine at $2649 and $8243 in the US in 2013 [37].Furthermore, studies from Sweden [38], then US [39],and the UK [40] have reported that migraine has aconsiderable negative effect on family quality of life.In this study, although we estimated the most import-ant contributors of the headache’s burden, we did notcapture its costs and quality of life.This study has some limitations. The main concern
is the lack of adequate data and poor quality of theavailable data from the EMR. Since accessible datasources for prevalence of migraine and TTH in EMR
Fig. 4 All-age YLD rates for migraine and TTH in the Eastern Mediterranean countries, by country and sex. Abbreviations: YLD, years lived withdisability; TTH, tension-type headache; UAE, United Arab Emirate
Vosoughi et al. The Journal of Headache and Pain (2019) 20:40 Page 9 of 13
are scarce, we were able to use data from only fewof the EMR countries. In comparison to GBD 2013,with prevalence data from only one EMR country(Iran), GBD 2016 is an obvious improvement; how-ever, there is still no reliable data from most of theEMR countries. Unfortunately, the region is facingseveral health challenges which divert attention fromheadaches in the mind of many health professionals.However, we hope that our study will increase the at-tention to this large burden and lead to improveddata. Second, although we estimated prevalence andYLDs of the primary headache disorders with
considerable burden (including migraine, TTH, andMOH - as a sequel of the first two syndromes), wecould not include all primary headache disorders clas-sified in ICD-10 classification [41]. Cluster headache,for example, was the most important headache syn-drome that we did not capture in this GBD iteration.
ConclusionFindings from this study show that primary head-ache disorders are a large cause of disability in theEMR. Despite generally unchanged age-standardisedYLDs, YLD numbers increased substantially
Table 3 YLD count, All-age YLD rates, and Age-standardised rates in 2016, and percentage change of YLD count, All-age YLD rates,and Age-standardised rates between 1990 and 2016 for migraine in EMR countries
Country All-age counts Age-standardised rates (per 100,000) SDI
2016 Percentage changebetween 1990 and2016
2016 Percentage changebetween 1990 and2016
Observed toexpected ratio
F/Mratio
Low-income Countries
Somalia 42078 (27076-59527) 71.1 (63.6 to 78.5) 477 (307-666) 0 (-3.8 to 4) 0.82 1.79 0.27
Afghanistan 208981 (134134-294141) 199.7 (187 to 212.8) 737 (479-1027) 0.5 (-3.4 to 4.4) 1.27 1.72 0.28
Djibouti 4119 (2626-5753) 78 (70.1 to 85.6) 473 (304-657) -0.9 (-4.5 to 2.7) 0.82 1.8 0.42
Yemen 180267 (115752-254144) 175.9 (164.8 to 187.2) 749 (486-1044) 0.2 (-3.2 to 3.7) 1.29 1.71 0.45
Middle-income Countries
Palestine 31910 (20345-44967) 159.2 (149.3 to 169.6) 760 (487-1061) 0.2 (-3.1 to 3.5) 1.31 1.72 0.45
Iraq 245414 (157277-342808) 135.5 (125.8 to 146) 754 (488-1052) 0.6 (-2.9 to 4.3) 1.29 1.73 0.47
Sudan 273586 (176305-381268) 124.5 (115.4 to 133) 760 (491-1059) 1.2 (-2.2 to 4.7) 1.28 1.72 0.52
Pakistan 1299007 (829027-1845495) 97.9 (91.4 to 105.3) 730 (468-1034) -0.6 (-3.6 to 2.5) 1.23 1.62 0.52
Morocco 271235 (174130-382333) 64.1 (56.6 to 72.5) 770 (496-1084) 1.3 (-2.3 to 5.1) 1.25 1.71 0.62
Syria 130923 (84689-183571) 75.3 (67.9 to 84) 767 (496-1071) 1.4 (-2 to 5.3) 1.23 1.72 0.64
Egypt 674197 (433516-936625) 84.5 (77.6 to 92.4) 766 (494-1064) 0.9 (-2.5 to 4.9) 1.21 1.71 0.65
Jordan 55454 (35403-77551) 180 (166.9 to 193.4) 762 (492-1066) 1.9 (-1.7 to 5.5) 1.18 1.71 0.69
Tunisia 90158 (58559-124945) 64.4 (58 to 72.2) 755 (492-1048) 1.8 (-1.5 to 5.4) 1.17 1.73 0.70
Iran 653679 (425780-905798) 93.9 (85.8 to 102.5) 758 (497-1054) 2.3 (-1 to 5.7) 1.13 1.74 0.77
Libya 49500 (32133-69680) 75.6 (67.5 to 84.6) 771 (500-1085) 3.3 (-0.3 to 7.3) 1.13 1.71 0.81
Lebanon 47836 (30941-66597) 150.2 (140.8 to 160) 767 (496-1073) 0.5 (-2.9 to 3.9) 1.13 1.71 0.81
High-income Countries
Oman 36619 (23376-50763) 234.9 (217.5 to 254.6) 700 (454-972) -3.5 (-7.4 to 0.9) 1.07 1.72 0.72
Bahrain 11300 (7222-15841) 219.7 (205.8 to 234.5) 716 (463-1004) -0.6 (-4.2 to 3.2) 1.08 1.7 0.74
United Arab Emirates 76336 (49496-107622) 513.9 (486.9 to 545.1) 659 (430-915) -1.2 (-4.8 to 2.8) 0.98 1.73 0.77
Qatar 18937 (12171-26563) 445.1 (422.6 to 470) 678 (441-948) -0.8 (-4.3 to 3.1) 1 1.71 0.79
Saudi Arabia 267107 (172575-373293) 146.1 (139.5 to 154.2) 794 (517-1110) 2.8 (0.8 to 4.9) 1.17 1.69 0.80
Kuwait 33859 (21841-48110) 126.6 (116.6 to 136.9) 745 (486-1050) 0.6 (-3.1 to 4.3) 1.09 1.71 0.83
EMR and global
EMR 4702503 (3025930-6551569) 106.7a 746 (482-1039) 0.7a 1.21 1.69 N/A
Global 45121909 (29045835-62826904) 51.3 (49.7 to 52.8) 599 (386-833) -0.2 (-0.8 to 0.4) 0.93 1.84 0.70
YLD years lived with disability, EMR eastern Mediterranean regiona Uncertainty interval is not available
Vosoughi et al. The Journal of Headache and Pain (2019) 20:40 Page 10 of 13
between 1990 and 2016 in the EMR-mostly due tothe population growth and ageing. Our findings in-form policy makers of the EMR countries thatheadache is a health care priority, and preventiveand management interventions must be imple-mented to address the growing burden of headachein this region. More studies are needed to providemore accurate data on the prevalence and severityof primary headache disorders in EMR as well asmore efficient preventive and management methodsto reduce the burden of headache.
Additional files
Additional file 1: (XLSX 26 kb)
Additional file 2: (XLSX 23 kb)
AbbreviationsDALY: Disability-adjusted life years; DW: Disability weight; EMR: EasternMediterranean Region; GBD: Global Burden of Disease Study; IHME: Institutefor Health Metrics and Evaluation; LDI: Lag-distributed income;MOH: Medication overuse headache; SDI: Socio-demographic Index;SSA: Sub-Saharan Africa; TFR: Total fertility rate; TTH: Tension-type headache;
Table 4 YLD count, All-age YLD rates, and Age-standardised rates in 2016, and percentage change of YLD count, All-age YLD rates,and Age-standardised rates between 1990 and 2016 for TTH in EMR countries
Country All-age counts Age-standardised rates (per 100,000) SDI
2016 Percentage changebetween 1990 and2016
2016 Percentage changebetween 1990 and2016
Observed toexpected ratio
F/Mratio
Low-income Countries
Somalia 7156 (4481-10831) 67.4 (58.5 to 77.6) 85 (54-128) -1.3 (-6.1 to 4.2) 0.89 1.32 0.27
Afghanistan 35909 (22613-53732) 201.6 (186.6 to 218.1) 135 (85-200) 1.5 (-3.1 to 6.5) 1.4 1.39 0.28
Djibouti 706 (447-1058) 76.4 (64 to 90) 84 (53-125) -3.2 (-8.5 to 3.1) 0.85 1.33 0.42
Yemen 31337 (19858-47513) 183.3 (165.5 to 205.2) 138 (88-207) 2.5 (-2.9 to 9.2) 1.39 1.4 0.45
Middle-income Countries
Palestine 5548 (3486-8251) 164.6 (150.6 to 180.8) 139 (88-207) 1 (-3.6 to 6) 1.4 1.41 0.45
Iraq 42924 (27365-64414) 139.6 (126.8 to 154.5) 138 (88-206) 1.7 (-3.1 to 7.1) 1.39 1.42 0.47
Sudan 47952 (30469-71699) 129.9 (117.1 to 144.8) 140 (88-209) 3 (-2.1 to 9) 1.39 1.41 0.52
Pakistan 197112 (122210-292966) 98.4 (86.4 to 112.1) 114 (71-168) -0.7 (-5.9 to 5.4) 1.13 1.28 0.52
Morocco 49517 (31448-73822) 73.3 (61.1 to 87.9) 142 (91-213) 3.3 (-2.3 to 9.4) 1.38 1.41 0.62
Syria 23274 (14638-34911) 82.9 (69.2 to 97.9) 142 (89-212) 3.5 (-2.3 to 9.9) 1.37 1.42 0.64
Egypt 121944 (77062-181851) 90.2 (79.4 to 102) 142 (91-211) 3 (-2.2 to 8.9) 1.36 1.42 0.65
Jordan 9934 (6276-14876) 191.3 (170.6 to 215.2) 142 (91-212) 3.7 (-1.6 to 9.6) 1.35 1.41 0.69
Tunisia 17148 (10721-25799) 73.1 (59.7 to 87.1) 144 (90-216) 3.3 (-2.3 to 9.4) 1.37 1.42 0.70
Iran 128660 (82720-188190) 104.2 (87.8 to 122.8) 152 (98-222) 4.1 (-1.8 to 11) 1.42 1.41 0.77
Libya 9053 (5661-13629) 84 (69.9 to 99.5) 144 (92-214) 4.4 (-0.9 to 10.8) 1.35 1.43 0.81
Lebanon 8862 (5586-13274) 160.8 (145.8 to 178.3) 144 (91-216) 2.8 (-2.3 to 8.7) 1.35 1.43 0.81
High-income Countries
Oman 6862 (4261-10363) 259.7 (224.5 to 298.3) 135 (85-201) 0.9 (-6.7 to 9.2) 1.27 1.42 0.72
Bahrain 2112 (1327-3201) 234.2 (212.4 to 259.2) 136 (87-205) 1.4 (-4.1 to 6.8) 1.29 1.42 0.74
United Arab Emirates 15103 (9215-23288) 542.9 (493.5 to 600.3) 132 (82-198) 0.5 (-5.2 to 6.8) 1.24 1.42 0.77
Qatar 3540 (2191-5423) 464 (423.6 to 505.7) 130 (82-194) 2.1 (-3.5 to 8.2) 1.22 1.45 0.79
Saudi Arabia 44858 (28544-65886) 160.2 (140.2 to 180) 137 (88-199) 5.3 (-0.3 to 10.5) 1.28 1.39 0.80
Kuwait 6281 (3929-9644) 138.3 (121.4 to 157.8) 141 (89-213) 2.6 (-2.9 to 8.9) 1.32 1.42 0.83
EMR and global
EMR 815789 (516411-1221998) 112.8a 134 (85-198) 2.5a 1.29 1.38 N/A
Global 7195122 (4614628-10499903) 53.2 (47.5 to 58.4) 96 (62-140) -0.2 (-2.5 to 1.9) 0.91 1.48 0.70
YLD years lived with disability, TTH tension-type headache, EMR eastern Mediterranean regiona Uncertainty interval is not available
Vosoughi et al. The Journal of Headache and Pain (2019) 20:40 Page 11 of 13
WHO: World Health Organization; YLD: Years lived with disability; YLL: Yearsof life lost
AcknowledgementsNot applicable.
FundingBill & Melinda Gates Foundation.
Availability of data and materialsData are available at the website of the Institute for Health Metrics andEvaluation (IHME) (http://www.healthdata.org/gbd/data-visualizations).
Authors’ contributionsKV, MML, and AHM prepared the first draft and analysed the data. LJS, TJS,MN, VLF, TV, AHM, and CJLM developed and verified models and analysedthe data. All authors edited the first draft and the final version of the Article.All authors approved the final version of the Article.
Ethics approval and consent to participateNot applicable.
Consent for publicationAll authors have read and approved the submitted manuscript. Ourmanuscript has not been submitted elsewhere nor published elsewhere.
Competing interestsThe authors declare that they have no competing interests.
Publisher’s NoteSpringer Nature remains neutral with regard to jurisdictional claims inpublished maps and institutional affiliations.
Author details1Preventive Medicine and Public Health Research Center, Iran University ofMedical Sciences, Tehran, Iran. 2Department of Neuromedicine andMovement Science (INB), Norwegian University of Science and Technology(NTNU), Trondheim, Norway. 3Department of Neurology and ClinicalNeurophysiology, Norwegian Advisory Unit on Headache, St Olavs UniversityHospital, Trondheim, Norway. 4Division of Brain Sciences, Imperial CollegeLondon, London, UK. 5Lifting The Burden, London, UK. 6Division ofNeurology, Department of Medicine, The Ottawa Hospital, University ofOttawa, Ottawa, ON, Canada. 7Division of Clinical Geriatrics, Department ofNeurobiology, Care Sciences and Society (NVS), Karolinska Institutet,Stockholm, Sweden. 8Non-Communicable Diseases Research Center,Endocrinology and Metabolism Population Sciences Institute, TehranUniversity of Medical Sciences, Tehran, Iran. 9Multiple Sclerosis ResearchCenter, Tehran University of Medical Sciences, Tehran, Iran. 10DigestiveDisease Research Institute, Tehran University of Medical Sciences, Tehran,Iran. 11Department of Health Metrics Sciences, University of Washington,Seattle, WA, USA. 12Preventive Medicine and Public Health Research Center,Social Health Institute, Iran University of Medical Sciences, Tehran, Iran.13Department of Community Medicine, School of Medicine, Iran University ofMedical Sciences, Tehran, Iran. 14Knowledge Utilization Research Center,Tehran University of Medical Sciences, Tehran, Iran. 15National Institute forStroke and Applied Neurosciences, Auckland University of Technology,Auckland, New Zealand. 16Department of Medicine, Johns Hopkins MedicalInstitutions, Baltimore, MD, USA.
Received: 8 January 2019 Accepted: 29 March 2019
References1. Stovner LJ, Hagen K, Jensen R et al (2007) The global burden of headache:
a documentation of headache prevalence and disability worldwide.Cephalalgia. https://doi.org/10.1111/j.1468-2982.2007.01288.x
2. Grande RB, Aaseth K, Gulbrandsen P, Lundqvist C, Russell MB (2008)Prevalence of primary chronic headache in a population-based sample of30- to 44-year-old persons: the Akershus study of chronic headache.Neuroepidemiology. 30(2):76–83. https://doi.org/10.1159/000116244
3. Aaseth K, Grande RB, Kværner KJ, Gulbrandsen P, Lundqvist C, Russell MB(2008) Prevalence of secondary chronic headaches in a population-basedsample of 30-44-year-old persons. The Akershus study of chronic headache.Cephalalgia. 28(7):705–713. https://doi.org/10.1111/j.1468-2982.2008.01577.x
4. Vos T, Abajobir AA, Abbafati C et al (2017) Global, regional, and nationalincidence, prevalence, and years lived with disability for 328 diseases andinjuries for 195 countries, 1990-2016: a systematic analysis for the globalburden of disease study 2016. Lancet. 390(10100):1211–1259. https://doi.org/10.1016/S0140-6736(17)32154-2
5. Hu XH, Markson LE, Lipton RB, Stewart WF, Berger ML (1999) Burden ofmigraine in the United States: disability and economic costs. Arch InternMed. https://doi.org/10.1001/archinte.159.8.813
6. Berg J, Stovner LJ (2005) Cost of migraine and other headaches in Europe.Eur J Neurol. https://doi.org/10.1111/j.1468-1331.2005.01192.x
7. Berg J (2004) Economic evidence in migraine and other headaches: areview. Eur J Health Econ. https://doi.org/10.1007/s10198-005-0288-z
8. www.thelancet.com. https://www.thelancet.com/gbd. Accessed June 4, 20189. About GBD | Institute for Health Metrics and Evaluation. http://www.
healthdata.org/gbd/about. Accessed 4 June 201810. Steiner TJ, Birbeck GL, Jensen R, Katsarava Z, Martelletti P, Stovner LJ (2010)
Lifting the burden: the first 7 years. J Headache Pain. https://doi.org/10.1007/s10194-010-0264-6
11. Steiner TJ, Stovner LJ, Dua T et al (2011) Time to act on headache disorders.J Headache Pain 12(5):501–503. https://doi.org/10.1007/s10194-011-0368-7
12. Eastern WHO, Region M. Chapter 5 : WHO Eastern Mediterranean Region.2013;(May):67–72
13. Katsarava Z, Muessig M, Dzagnidze A, Fritsche G, Diener HC, Limmroth V(2005) Medication overuse headache: rates and predictors for relapse in a 4-year prospective study. Cephalalgia. 25(1):12–15. https://doi.org/10.1111/j.1468-2982.2004.00789.x
14. Colás R, Muñoz P, Temprano R, Gómez C, Pascual J. Chronic daily headachewith analgesic overuse: epidemiology and impact on quality of life.Neurology. 2004;62(8):1338–1342. http://www.ncbi.nlm.nih.gov/pubmed/15111671. Accessed August 27, 2018
15. Jonsson P, Hedenrud T, Linde M (2011) Epidemiology of medicationoveruse headache in the general Swedish population. Cephalalgia. 31(9):1015–1022. https://doi.org/10.1177/0333102411410082
16. Stovner LJ, Nichols E, Steiner TJ et al (2018) Global, regional, and nationalburden of migraine and tension-type headache, 1990–2016: a systematicanalysis for the global burden of disease study 2016. Lancet Neurol 17(11):954–976. https://doi.org/10.1016/S1474-4422(18)30322-3
17. Shahbeigi S, Fereshtehnejad S-M, Mohammadi N et al (2013) Epidemiologyof headaches in Tehran urban area: a population-based cross-sectionalstudy in district 8, year 2010. Neurol Sci 34(7):1157–1166. https://doi.org/10.1007/s10072-012-1200-0
18. Ayatollahi SMT, Moradi F, Ayatollahi SAR. Prevalences of migraine andtension-type headache in adolescent girls of shiraz (southern Iran).Headache. 2002;42(4):287–290. http://www.ncbi.nlm.nih.gov/pubmed/12010386. Accessed November 16, 2018
19. Fallahzadeh H, Alihaydari M (2011) Prevalence of migraine and tension-typeheadache among school children in Yazd, Iran. J Pediatr Neurosci 6(2):106–109. https://doi.org/10.4103/1817-1745.92818
20. Herekar AA, Ahmad A, Uqaili UL et al (2017) Primary headache disorders in theadult general population of Pakistan – a cross sectional nationwide prevalencesurvey. J Headache Pain. 18(1):28. https://doi.org/10.1186/s10194-017-0734-1
21. Romdhane NA, Ben Hamida M, Mrabet A et al (1993) Prevalence study ofneurologic disorders in Kelibia (Tunisia). Neuroepidemiology. 12(5):285–299.https://doi.org/10.1159/000110330
22. Bener A, Swadi H, Qassimi EM, Uduman S. Prevalence of headache and migrainein schoolchildren in the United Arab Emirates. Ann Saudi Med 18(6):522–524.http://www.ncbi.nlm.nih.gov/pubmed/17344729. Accessed 16 Nov 2018
23. Bahrami P, Zebardast H, Zibaei M, Mohammadzadeh M, Zabandan N.Prevalence and characteristics of headache in Khoramabad, Iran. PainPhysician 15(4):327–332. http://www.ncbi.nlm.nih.gov/pubmed/22828686.Accessed 16 Nov 2018
24. Bessisso MS, Bener A, Elsaid MF, Al-Khalaf FA, Huzaima KA. Pattern of headachein school children in the State of Qatar. Saudi Med J 2005;26(4):566–570. http://www.ncbi.nlm.nih.gov/pubmed/15900361. Accessed 16 Nov 2018
25. Global Burden of Disease Study 2016 (GBD 2016) Reference Life Table |GHDx. http://ghdx.healthdata.org/record/global-burden-disease-study-2016-gbd-2016-reference-life-table. Accessed 4 June 2018
Vosoughi et al. The Journal of Headache and Pain (2019) 20:40 Page 12 of 13
26. IHME. Rethinking development and health: findings from the Global Burdenof Disease Study. Seattle: Institute for Health Metrics and Evaluation; 2016.
27. Wang H, Abajobir AA, Abate KH et al (2017) Global, regional, and nationalunder-5 mortality, adult mortality, age-specific mortality, and lifeexpectancy, 1970–2016: a systematic analysis for the global burden ofdisease study 2016. Lancet. 390(10100):1084–1150. https://doi.org/10.1016/S0140-6736(17)31833-0
28. Naghavi M, Abajobir AA, Abbafati C et al (2017) Global, regional, andnational age-sex specific mortality for 264 causes of death, 1980–2016: asystematic analysis for the global burden of disease study 2016. Lancet.390(10100):1151–1210. https://doi.org/10.1016/S0140-6736(17)32152-9
29. Bigal ME, Serrano D, Buse D, Scher A, Stewart WF, Lipton RB (2008) Acutemigraine medications and evolution from episodic to chronic migraine: alongitudinal population-based study. Headache 48(8):1157–1168. https://doi.org/10.1111/j.1526-4610.2008.01217.x
30. Bigal ME, Lipton RB (2007) Concepts and mechanisms of migraineChronification. Headache 48(1):7–15. https://doi.org/10.1111/j.1526-4610.2007.00969.x
31. May A, Schulte LH (2016) Chronic migraine: risk factors, mechanisms andtreatment. Nat Rev Neurol 12(8):455–464. https://doi.org/10.1038/nrneurol.2016.93
32. Katsarava Z, Buse DC, Manack AN, Lipton RB (2012) Defining the differencesbetween episodic migraine and chronic migraine. Curr Pain Headache Rep16(1):86–92. https://doi.org/10.1007/s11916-011-0233-z
33. Charara R, Forouzanfar M, Naghavi M et al (2017) The burden of mentaldisorders in the eastern mediterranean region, 1990-2013. PLoS One 12(1):1–17. https://doi.org/10.1371/journal.pone.0169575
34. Lipton RB, Bigal ME, Diamond M et al (2007) Migraine prevalence, diseaseburden, and the need for preventive therapy. Neurology. 68(5):343–349.https://doi.org/10.1212/01.wnl.0000252808.97649.21
35. Jensen R, Stovner LJ (2008) Epidemiology and comorbidity of headache.Lancet Neurol 7(4):354–361. https://doi.org/10.1016/S1474-4422(08)70062-0
36. Linde M, Gustavsson A, Stovner LJ et al (2012) The cost of headachedisorders in Europe: the Eurolight project. Eur J Neurol 19(5):703–711.https://doi.org/10.1111/j.1468-1331.2011.03612.x
37. Messali A, Sanderson JC, Blumenfeld AM et al (2016) Direct and indirectcosts of chronic and episodic migraine in the United States: a web-basedsurvey. Headache 56(2):306–322. https://doi.org/10.1111/head.12755
38. Linde M, Dahlöf C (2004) Attitudes and burden of disease among self-considered migraineurs--a nation-wide population-based survey in Sweden.Cephalalgia. 24(6):455–465. https://doi.org/10.1111/j.1468-2982.2004.00703.x
39. Hamelsky SW, Lipton RB, Stewart WF (2005) An assessment of the burden ofmigraine using the willingness to pay model. Cephalalgia. 25(2):87–100.https://doi.org/10.1111/j.1468-2982.2005.00797.x
40. Lipton RB, Liberman JN, Kolodner KB, Bigal ME, Dowson A, Stewart WF(2003) Migraine headache disability and health-related quality-of-life: apopulation-based case-control study from England. Cephalalgia. 23(6):441–450. https://doi.org/10.1046/j.1468-2982.2003.00546.x
41. Free 2018 ICD-10-CM Codes. https://www.icd10data.com/ICD10CM/Codes.Accessed 4 June 2018
Vosoughi et al. The Journal of Headache and Pain (2019) 20:40 Page 13 of 13