Embed Size (px)
Citation preview
The CADDIS Urbanization Module (PDF version)
Urbanization is an increasingly pervasive land cover transformation that significantly alters the physical, chemical and biological environment within surface waters.
The diagram above provides a simple schematic illustrating pathways through which urbanization may affect stream ecosystems. Riparian/channel alteration, wastewater inputs,and stormwater runoff associated with urbanization can lead to changes in five general stressor categories: water/sediment quality, water temperature, hydrology, physical habitatwithin the channel, and basic energy sources for the stream food web.
This module is organized along these pathways (the nine shapes above), with subheadings for specific topics covered in greater detail. For an interactive version of this module, visit the CADDIS website (http://www.epa.gov/caddis).
URBANIZATION– The urban stream syndrome – Urbanization & biotic integrity– Catchment vs. riparian urbanization
Riparian/Channel Alteration– Riparian zones & channel morphology– Urbanization & riparian hydrology– Stream burial
Wastewater Inputs– Combined sewer overflows (CSOs) – Wastewater-related enrichment– Reproductive effects of WWTP effluents
Stormwater Runoff– Effective vs. total imperviousness – Imperviousness & biotic condition– Thresholds of imperviousness
Energy Sources– Terrestrial leaf litter – Primary production &
respiration– Quantity & quality of
DOC
Hydrology– Baseflow in urban
streams– Water withdrawals &
transfers– Biotic responses to
urban flows
Temperature– Heated surface runoff – Temperature & biotic
condition– Urbanization &
climate change
Physical Habitat– Channel enlargement – Road crossings– Bed substrates &
biotic condition
Water/Sediment Quality
– Conductivity – Nitrogen – PAHs
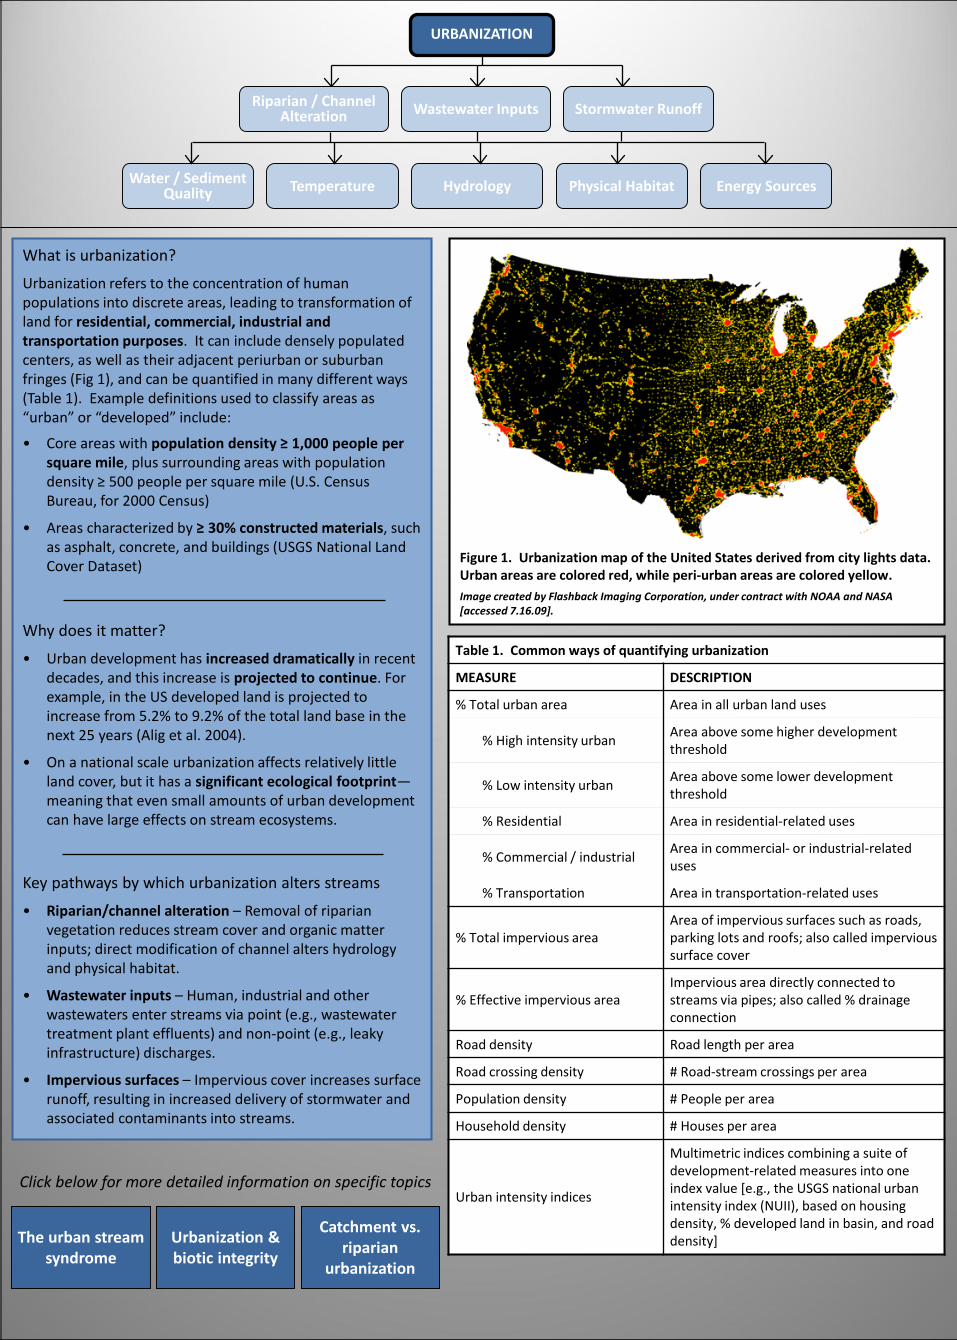
Table 1. Common ways of quantifying urbanization
MEASURE DESCRIPTION
% Total urban area Area in all urban land uses
% High intensity urban Area above some higher development threshold
% Low intensity urban Area above some lower development threshold
% Residential Area in residential-related uses
% Commercial / industrial Area in commercial- or industrial-related uses
% Transportation Area in transportation-related uses
% Total impervious areaArea of impervious surfaces such as roads, parking lots and roofs; also called impervious surface cover
% Effective impervious areaImpervious area directly connected to streams via pipes; also called % drainage connection
Road density Road length per area
Road crossing density # Road-stream crossings per area
Population density # People per area
Household density # Houses per area
Urban intensity indices
Multimetric indices combining a suite of development-related measures into one index value [e.g., the USGS national urban intensity index (NUII), based on housing density, % developed land in basin, and road density]
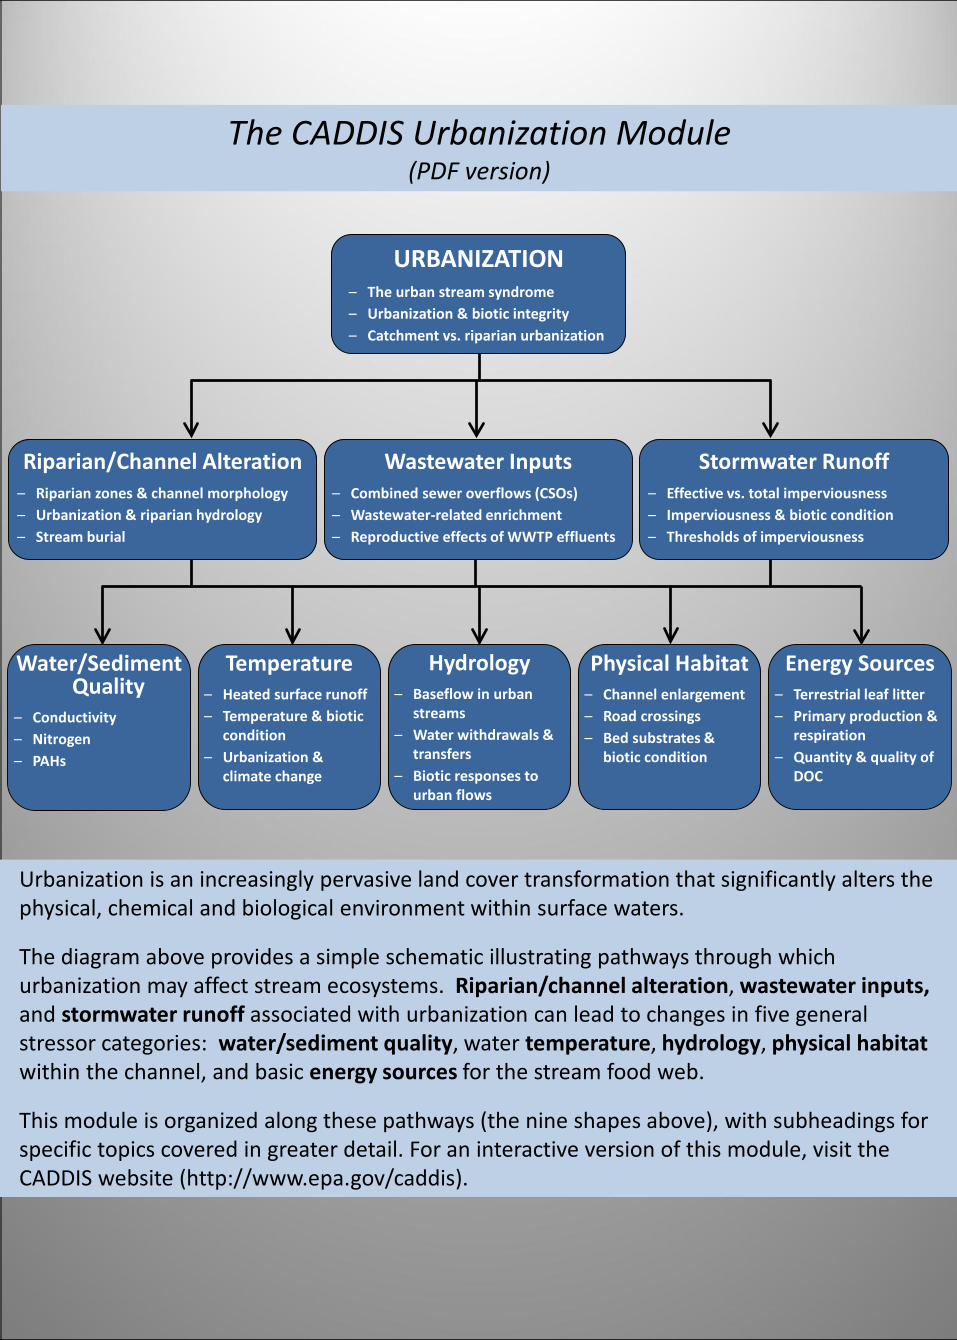
Figure 1. Urbanization map of the United States derived from city lights data. Urban areas are colored red, while peri-urban areas are colored yellow. Image created by Flashback Imaging Corporation, under contract with NOAA and NASA [accessed 7.16.09].
Click below for more detailed information on specific topics
The urban stream syndrome
Urbanization & biotic integrity
Catchment vs. riparian
urbanization
Why does it matter?
• Urban development has increased dramatically in recent decades, and this increase is projected to continue. For example, in the US developed land is projected to increase from 5.2% to 9.2% of the total land base in the next 25 years (Alig et al. 2004).
• On a national scale urbanization affects relatively little land cover, but it has a significant ecological footprint—meaning that even small amounts of urban development can have large effects on stream ecosystems.
What is urbanization?
Urbanization refers to the concentration of human populations into discrete areas, leading to transformation of land for residential, commercial, industrial and transportation purposes. It can include densely populated centers, as well as their adjacent periurban or suburban fringes (Fig 1), and can be quantified in many different ways (Table 1). Example definitions used to classify areas as “urban” or “developed” include:
Key pathways by which urbanization alters streams
• Riparian/channel alteration – Removal of riparian vegetation reduces stream cover and organic matter inputs; direct modification of channel alters hydrology and physical habitat.
• Wastewater inputs – Human, industrial and other wastewaters enter streams via point (e.g., wastewater treatment plant effluents) and non-point (e.g., leaky infrastructure) discharges.
• Impervious surfaces – Impervious cover increases surface runoff, resulting in increased delivery of stormwater and associated contaminants into streams.
• Core areas with population density ≥ 1,000 people per square mile, plus surrounding areas with population density ≥ 500 people per square mile (U.S. Census Bureau, for 2000 Census)
• Areas characterized by ≥ 30% constructed materials, such as asphalt, concrete, and buildings (USGS National Land Cover Dataset)
URBANIZATION
Water / Sediment Quality Temperature Hydrology Physical Habitat Energy Sources
Riparian / Channel Alteration Wastewater Inputs Stormwater Runoff
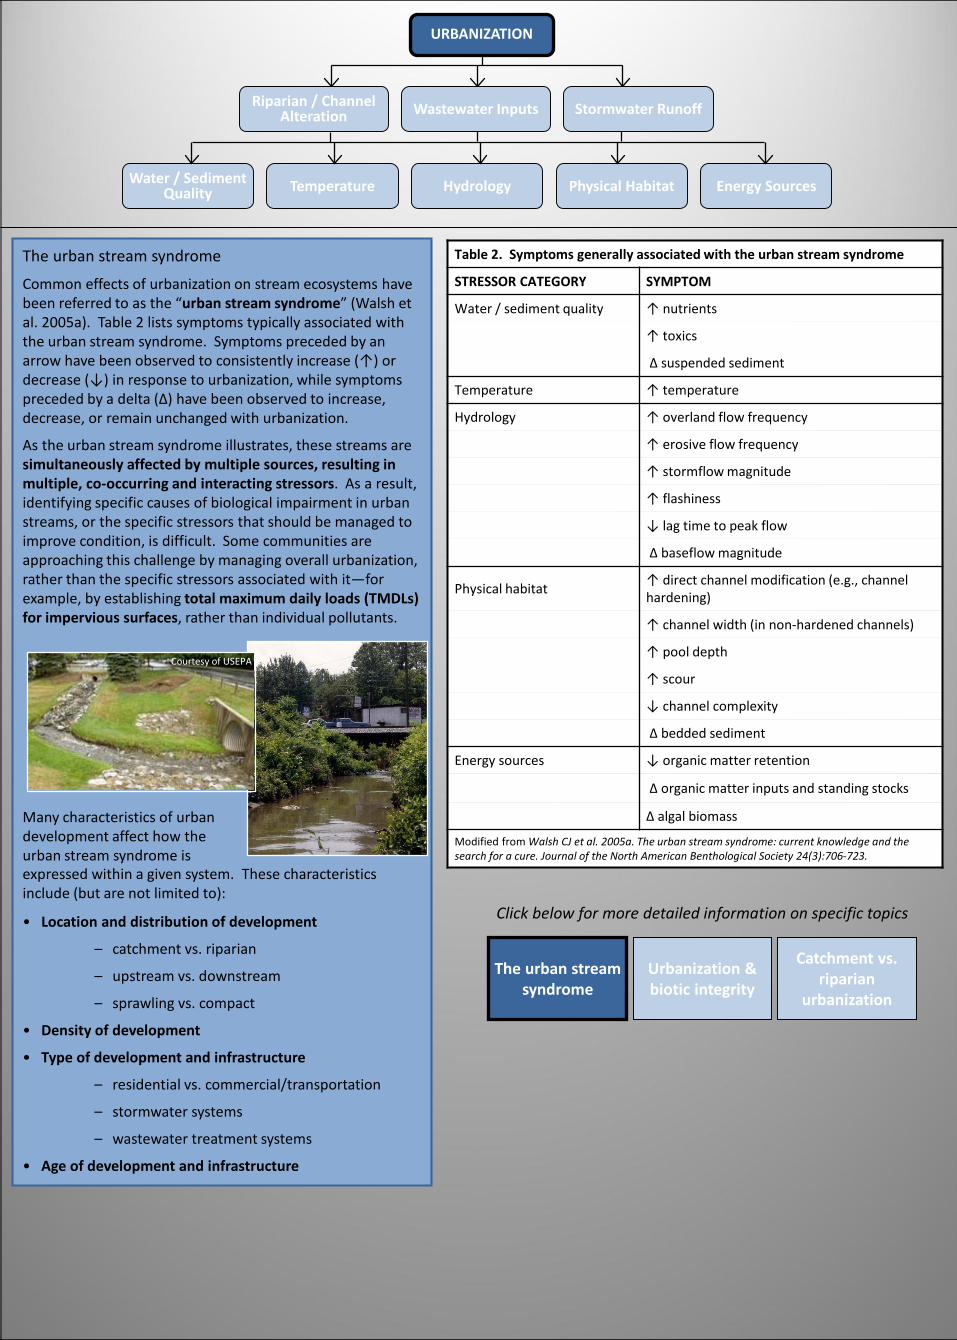
Table 2. Symptoms generally associated with the urban stream syndrome
STRESSOR CATEGORY SYMPTOM
Water / sediment quality ↑ nutrients
↑ toxics
Δ suspended sediment
Temperature ↑ temperature
Hydrology ↑ overland flow frequency
↑ erosive flow frequency
↑ stormflow magnitude
↑ flashiness
↓ lag time to peak flow
Δ baseflow magnitude
Physical habitat ↑ direct channel modification (e.g., channel hardening)
↑ channel width (in non-hardened channels)
↑ pool depth
↑ scour
↓ channel complexity
Δ bedded sediment
Energy sources ↓ organic matter retention
Δ organic matter inputs and standing stocks
Δ algal biomass
Modified from Walsh CJ et al. 2005a. The urban stream syndrome: current knowledge and the search for a cure. Journal of the North American Benthological Society 24(3):706-723.
URBANIZATION
Water / Sediment Quality Temperature Hydrology Physical Habitat Energy Sources
Riparian / Channel Alteration Wastewater Inputs Stormwater Runoff
Click below for more detailed information on specific topics
The urban stream syndrome
Urbanization & biotic integrity
Catchment vs. riparian
urbanization
The urban stream syndrome
Common effects of urbanization on stream ecosystems have been referred to as the “urban stream syndrome” (Walsh et al. 2005a). Table 2 lists symptoms typically associated with the urban stream syndrome. Symptoms preceded by an arrow have been observed to consistently increase (↑) or decrease (↓) in response to urbanization, while symptoms preceded by a delta (Δ) have been observed to increase, decrease, or remain unchanged with urbanization.
As the urban stream syndrome illustrates, these streams are simultaneously affected by multiple sources, resulting in multiple, co-occurring and interacting stressors. As a result, identifying specific causes of biological impairment in urban streams, or the specific stressors that should be managed to improve condition, is difficult. Some communities are approaching this challenge by managing overall urbanization, rather than the specific stressors associated with it—for example, by establishing total maximum daily loads (TMDLs) for impervious surfaces, rather than individual pollutants.
• Location and distribution of development
– catchment vs. riparian
– upstream vs. downstream
– sprawling vs. compact
• Density of development
• Type of development and infrastructure
– residential vs. commercial/transportation
– stormwater systems
– wastewater treatment systems
• Age of development and infrastructure
Many characteristics of urban development affect how the urban stream syndrome isexpressed within a given system. These characteristics include (but are not limited to):
Courtesy of USEPA
URBANIZATION
Water / Sediment Quality Temperature Hydrology Physical Habitat Energy Sources
Riparian / Channel Alteration Wastewater Inputs Stormwater Runoff
Urbanization & biotic integrity
Numerous studies have examined relationships between land use variables and stream biota, and shown that urban-related land uses can significantly alter stream assemblages.
Land use variables considered include % urban land (in the watershed and in riparian areas), % impervious surface area (total and effective), road density, and other measures of urbanization.
Biotic responses associated with these land use variables include (but are not limited to):
ALGAE
• ↑ abundance or biomass[Roy et al. 2003a, Taylor et al. 2004, Busse et al. 2006]
• other changes in assemblage structure (e.g., changes in diatom composition)[Winter & Duthie 2000, Sonneman et al. 2001, Newall & Walsh 2005]
BENTHIC MACROINVERTEBRATES
• ↓ total abundance, richness or diversity[Morley & Karr 2002, Moore & Palmer 2005, Walsh et al. 2007]
• ↓ EPT (Ephemeroptera, Plecoptera, Trichoptera) abundance, richness or diversity [Morley & Karr 2002, Roy et al. 2003a, Riley et al. 2005, Walsh 2006]
• ↑ abundance of tolerant taxa [Jones & Clark 1987, Walsh et al. 2007]
• other changes in assemblage structure (e.g., changes in functional feeding groups)[Stepenuck et al. 2002, Smith & Lamp 2008]
• ↓ quality of biotic index scores[Kennen 1999, Morley & Karr 2002, DeGasperi et al. 2009]
FISHES
• ↓ abundance, biomass, richness or diversity [Wang et al. 2003a, Bilby & Mollot 2008, Stranko et al. 2008]
• other changes in assemblage structure (e.g., changes in reproductive guilds)[Stepenuck et al. 2002, Roy et al. 2007, Helms et al. 2009]
• ↓ quality of biotic index scores[Snyder et al. 2003, Miltner et al. 2004, Morgan & Cushman 2005]
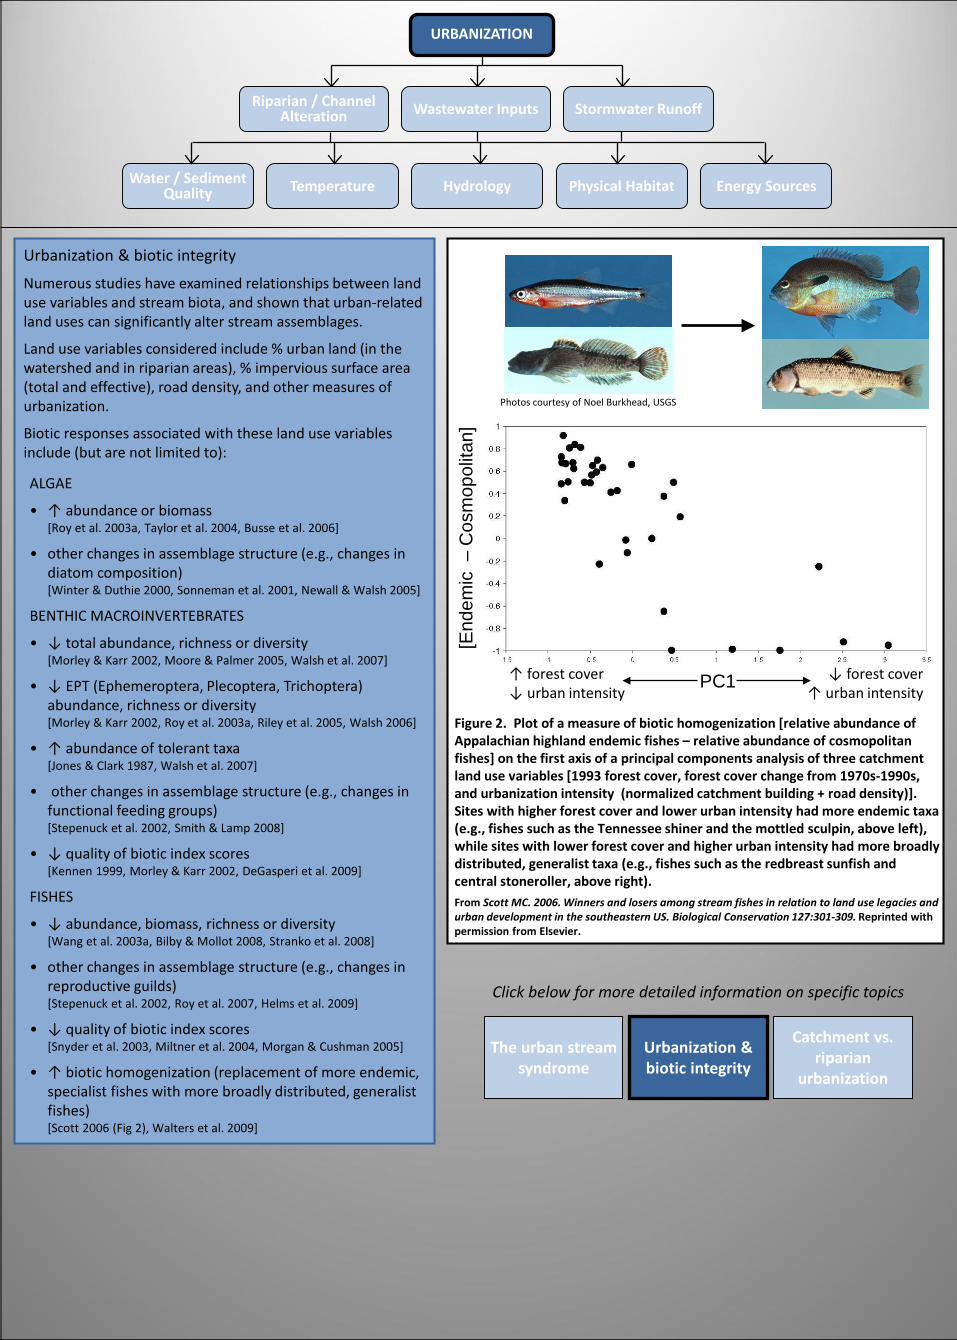
• ↑ biotic homogenization (replacement of more endemic, specialist fishes with more broadly distributed, generalist fishes) [Scott 2006 (Fig 2), Walters et al. 2009]
Click below for more detailed information on specific topics
The urban stream syndrome
Urbanization & biotic integrity
Catchment vs. riparian
urbanization
Figure 2. Plot of a measure of biotic homogenization [relative abundance of Appalachian highland endemic fishes – relative abundance of cosmopolitan fishes] on the first axis of a principal components analysis of three catchment land use variables [1993 forest cover, forest cover change from 1970s-1990s, and urbanization intensity (normalized catchment building + road density)]. Sites with higher forest cover and lower urban intensity had more endemic taxa (e.g., fishes such as the Tennessee shiner and the mottled sculpin, above left), while sites with lower forest cover and higher urban intensity had more broadly distributed, generalist taxa (e.g., fishes such as the redbreast sunfish and central stoneroller, above right). From Scott MC. 2006. Winners and losers among stream fishes in relation to land use legacies and urban development in the southeastern US. Biological Conservation 127:301-309. Reprinted with permission from Elsevier.
[End
emic
–C
osm
opol
itan]
PC1↑ forest cover↓ urban intensity
↓ forest cover↑ urban intensity
Photos courtesy of Noel Burkhead, USGS
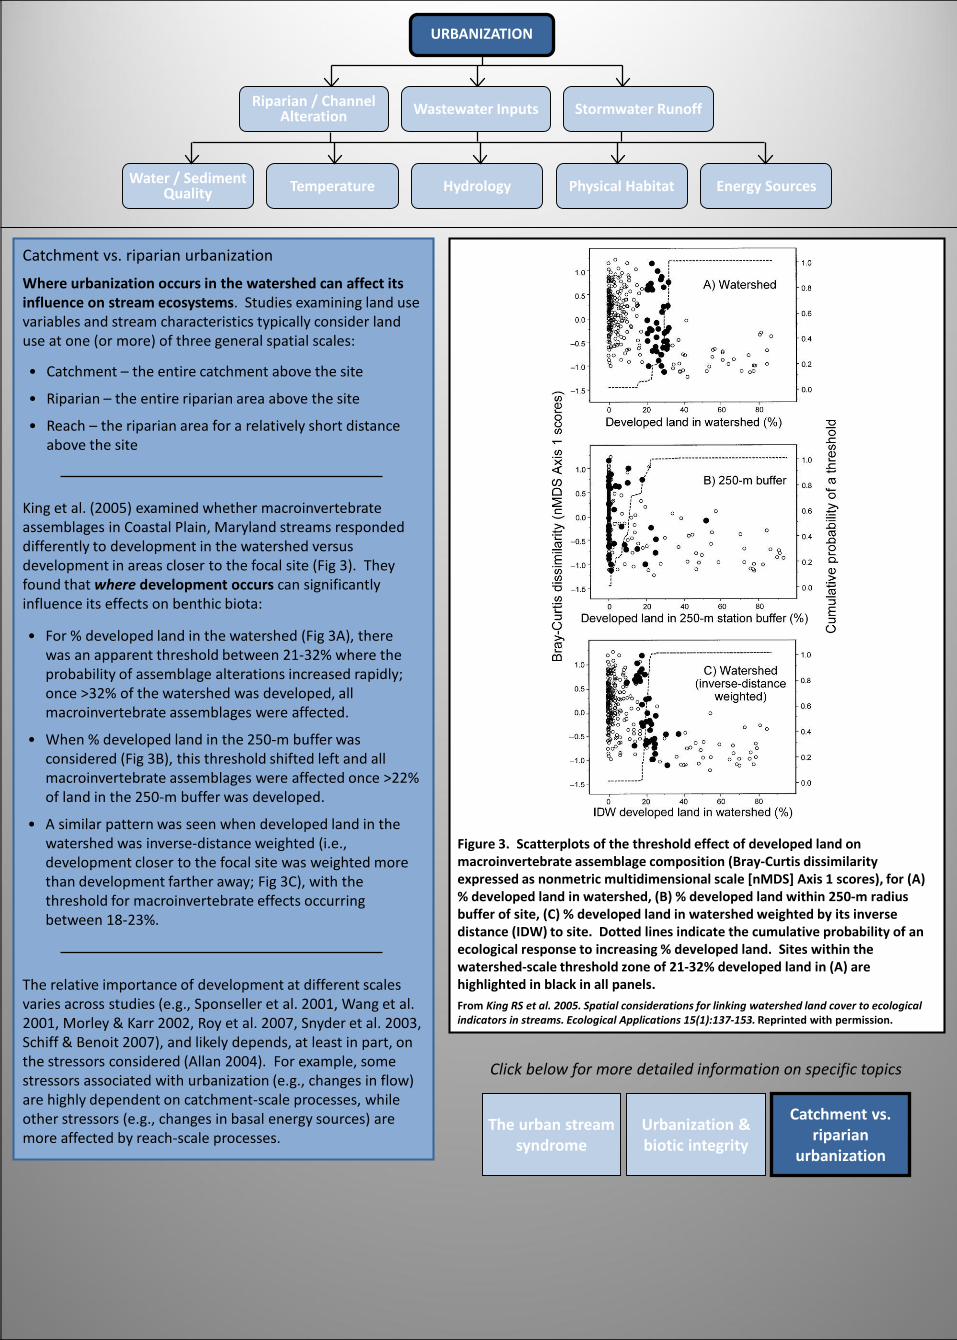
Figure 3. Scatterplots of the threshold effect of developed land on macroinvertebrate assemblage composition (Bray-Curtis dissimilarity expressed as nonmetric multidimensional scale [nMDS] Axis 1 scores), for (A) % developed land in watershed, (B) % developed land within 250-m radius buffer of site, (C) % developed land in watershed weighted by its inverse distance (IDW) to site. Dotted lines indicate the cumulative probability of an ecological response to increasing % developed land. Sites within the watershed-scale threshold zone of 21-32% developed land in (A) are highlighted in black in all panels. From King RS et al. 2005. Spatial considerations for linking watershed land cover to ecological indicators in streams. Ecological Applications 15(1):137-153. Reprinted with permission.
Catchment vs. riparian urbanization
Where urbanization occurs in the watershed can affect its influence on stream ecosystems. Studies examining land use variables and stream characteristics typically consider land use at one (or more) of three general spatial scales:
• For % developed land in the watershed (Fig 3A), there was an apparent threshold between 21-32% where the probability of assemblage alterations increased rapidly; once >32% of the watershed was developed, all macroinvertebrate assemblages were affected.
• When % developed land in the 250-m buffer was considered (Fig 3B), this threshold shifted left and all macroinvertebrate assemblages were affected once >22% of land in the 250-m buffer was developed.
• A similar pattern was seen when developed land in the watershed was inverse-distance weighted (i.e., development closer to the focal site was weighted more than development farther away; Fig 3C), with the threshold for macroinvertebrate effects occurring between 18-23%.
King et al. (2005) examined whether macroinvertebrate assemblages in Coastal Plain, Maryland streams responded differently to development in the watershed versus development in areas closer to the focal site (Fig 3). They found that where development occurs can significantly influence its effects on benthic biota:
• Catchment – the entire catchment above the site
• Riparian – the entire riparian area above the site
• Reach – the riparian area for a relatively short distance above the site
The relative importance of development at different scales varies across studies (e.g., Sponseller et al. 2001, Wang et al. 2001, Morley & Karr 2002, Roy et al. 2007, Snyder et al. 2003, Schiff & Benoit 2007), and likely depends, at least in part, on the stressors considered (Allan 2004). For example, some stressors associated with urbanization (e.g., changes in flow) are highly dependent on catchment-scale processes, while other stressors (e.g., changes in basal energy sources) are more affected by reach-scale processes.
Click below for more detailed information on specific topics
The urban stream syndrome
Urbanization & biotic integrity
Catchment vs. riparian
urbanization
URBANIZATION
Water / Sediment Quality Temperature Hydrology Physical Habitat Energy Sources
Riparian / Channel Alteration Wastewater Inputs Stormwater Runoff
URBANIZATION
Water / Sediment Quality Temperature Hydrology Physical Habitat Energy Sources
Riparian / Channel Alteration Wastewater Inputs Stormwater Runoff
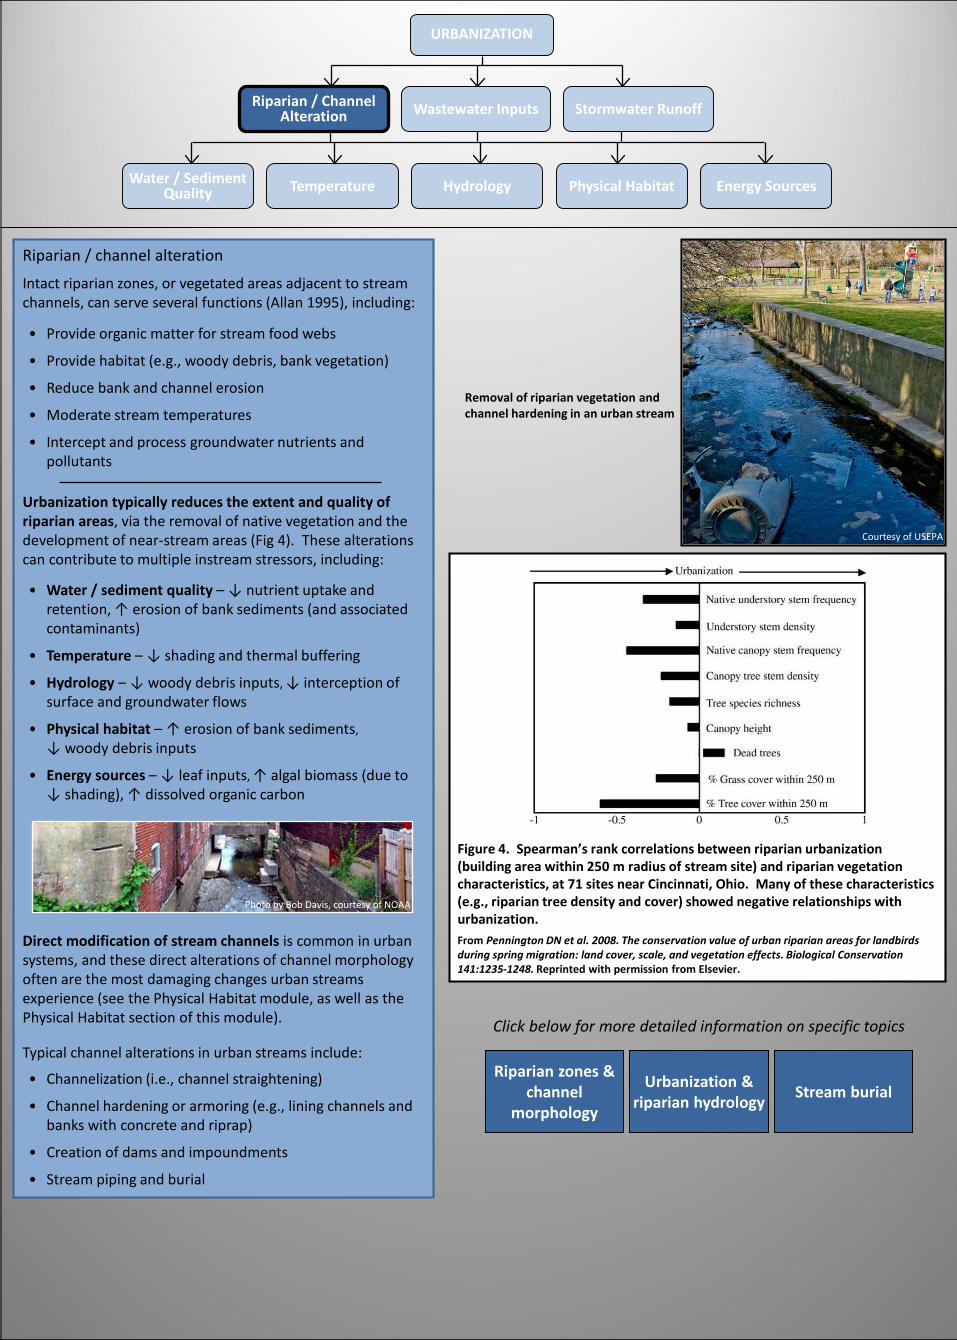
Figure 4. Spearman’s rank correlations between riparian urbanization (building area within 250 m radius of stream site) and riparian vegetation characteristics, at 71 sites near Cincinnati, Ohio. Many of these characteristics (e.g., riparian tree density and cover) showed negative relationships with urbanization. From Pennington DN et al. 2008. The conservation value of urban riparian areas for landbirds during spring migration: land cover, scale, and vegetation effects. Biological Conservation 141:1235-1248. Reprinted with permission from Elsevier.
Click below for more detailed information on specific topics
Riparian zones & channel
morphology
Urbanization & riparian hydrology Stream burial
Removal of riparian vegetation and channel hardening in an urban stream
Riparian / channel alteration
Intact riparian zones, or vegetated areas adjacent to stream channels, can serve several functions (Allan 1995), including:
• Provide organic matter for stream food webs
• Provide habitat (e.g., woody debris, bank vegetation)
• Reduce bank and channel erosion
• Moderate stream temperatures
• Intercept and process groundwater nutrients and pollutants
• Water / sediment quality – ↓ nutrient uptake and retention, ↑ erosion of bank sediments (and associated contaminants)
• Temperature – ↓ shading and thermal buffering
• Hydrology – ↓ woody debris inputs, ↓ interception of surface and groundwater flows
• Physical habitat – ↑ erosion of bank sediments, ↓ woody debris inputs
• Energy sources – ↓ leaf inputs, ↑ algal biomass (due to ↓ shading), ↑ dissolved organic carbon
Urbanization typically reduces the extent and quality of riparian areas, via the removal of native vegetation and the development of near-stream areas (Fig 4). These alterations can contribute to multiple instream stressors, including:
• Channelization (i.e., channel straightening)
• Channel hardening or armoring (e.g., lining channels and banks with concrete and riprap)
• Creation of dams and impoundments
• Stream piping and burial
Direct modification of stream channels is common in urban systems, and these direct alterations of channel morphology often are the most damaging changes urban streams experience (see the Physical Habitat module, as well as the Physical Habitat section of this module).
Typical channel alterations in urban streams include:
Courtesy of USEPA
Photo by Bob Davis, courtesy of NOAA
URBANIZATION
Water / Sediment Quality Temperature Hydrology Physical Habitat Energy Sources
Riparian / Channel Alteration Wastewater Inputs Stormwater Runoff
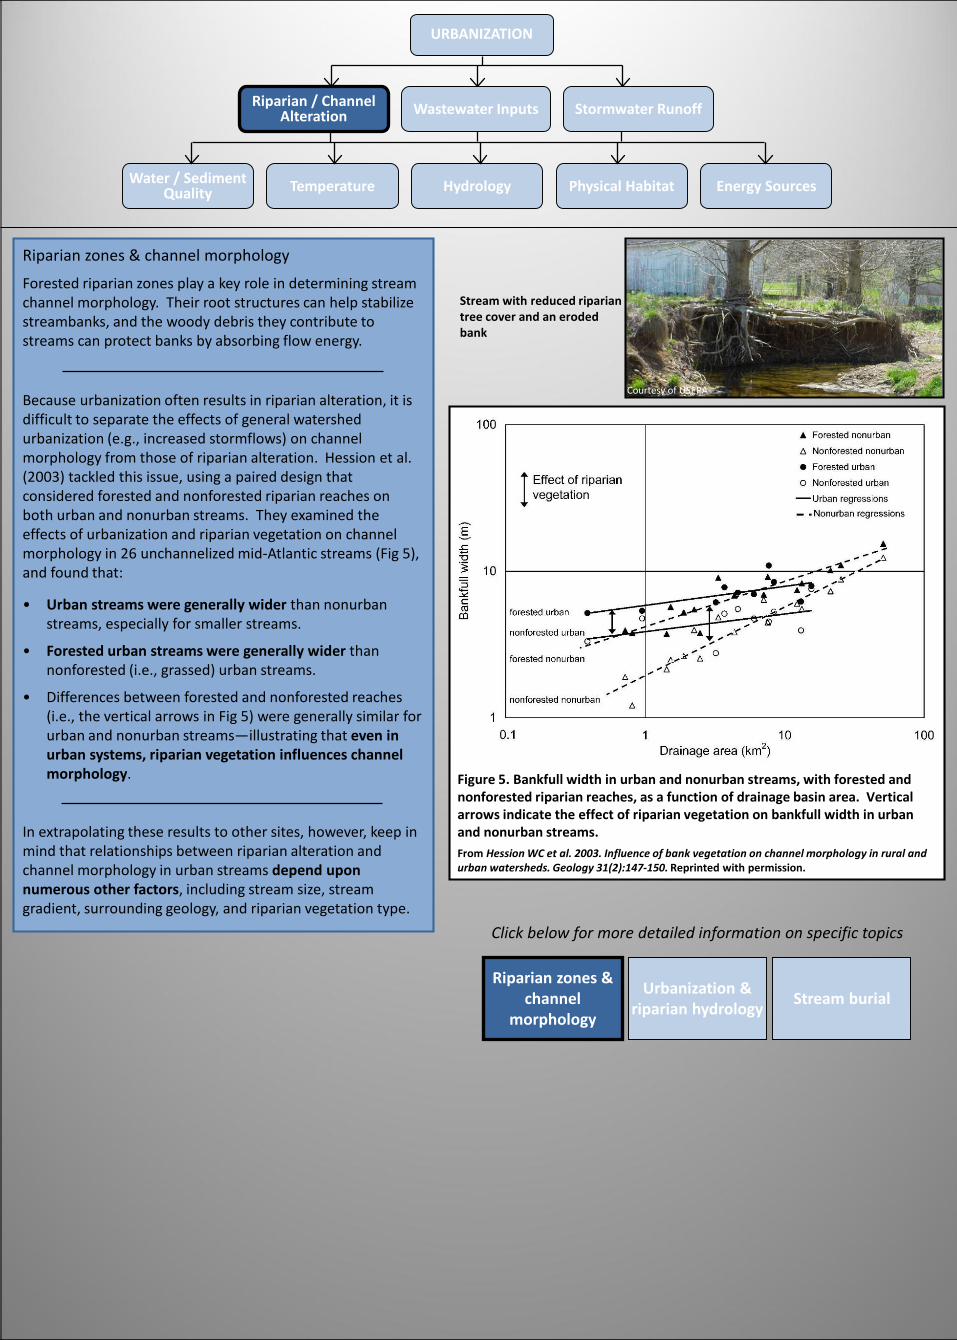
Figure 5. Bankfull width in urban and nonurban streams, with forested and nonforested riparian reaches, as a function of drainage basin area. Vertical arrows indicate the effect of riparian vegetation on bankfull width in urban and nonurban streams.From Hession WC et al. 2003. Influence of bank vegetation on channel morphology in rural and urban watersheds. Geology 31(2):147-150. Reprinted with permission.
Click below for more detailed information on specific topics
Riparian zones & channel
morphology
Urbanization & riparian hydrology Stream burial
Riparian zones & channel morphology
Forested riparian zones play a key role in determining stream channel morphology. Their root structures can help stabilize streambanks, and the woody debris they contribute to streams can protect banks by absorbing flow energy.
• Urban streams were generally wider than nonurban streams, especially for smaller streams.
• Forested urban streams were generally wider than nonforested (i.e., grassed) urban streams.
• Differences between forested and nonforested reaches (i.e., the vertical arrows in Fig 5) were generally similar for urban and nonurban streams—illustrating that even in urban systems, riparian vegetation influences channel morphology.
Because urbanization often results in riparian alteration, it is difficult to separate the effects of general watershed urbanization (e.g., increased stormflows) on channel morphology from those of riparian alteration. Hession et al. (2003) tackled this issue, using a paired design that considered forested and nonforested riparian reaches on both urban and nonurban streams. They examined the effects of urbanization and riparian vegetation on channel morphology in 26 unchannelized mid-Atlantic streams (Fig 5), and found that:
In extrapolating these results to other sites, however, keep in mind that relationships between riparian alteration and channel morphology in urban streams depend upon numerous other factors, including stream size, stream gradient, surrounding geology, and riparian vegetation type.
Stream with reduced riparian tree cover and an eroded bank
Courtesy of USEPA
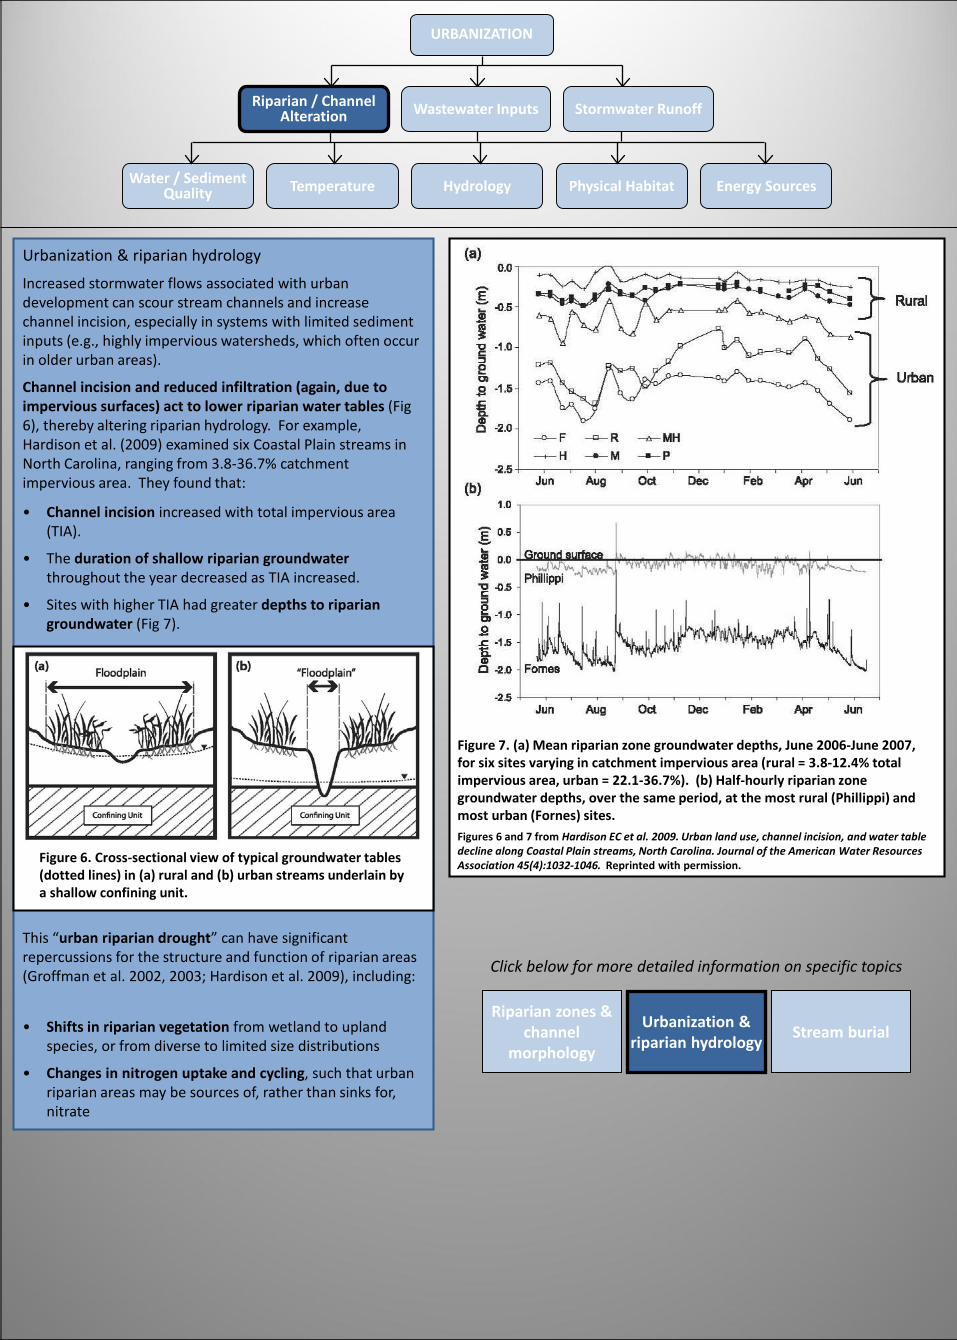
Figure 7. (a) Mean riparian zone groundwater depths, June 2006-June 2007, for six sites varying in catchment impervious area (rural = 3.8-12.4% total impervious area, urban = 22.1-36.7%). (b) Half-hourly riparian zone groundwater depths, over the same period, at the most rural (Phillippi) and most urban (Fornes) sites. Figures 6 and 7 from Hardison EC et al. 2009. Urban land use, channel incision, and water table decline along Coastal Plain streams, North Carolina. Journal of the American Water Resources Association 45(4):1032-1046. Reprinted with permission.
This “urban riparian drought” can have significant repercussions for the structure and function of riparian areas (Groffman et al. 2002, 2003; Hardison et al. 2009), including:
• Shifts in riparian vegetation from wetland to upland species, or from diverse to limited size distributions
• Changes in nitrogen uptake and cycling, such that urban riparian areas may be sources of, rather than sinks for, nitrate
Figure 6. Cross-sectional view of typical groundwater tables (dotted lines) in (a) rural and (b) urban streams underlain by a shallow confining unit.
Urbanization & riparian hydrology
Increased stormwater flows associated with urban development can scour stream channels and increase channel incision, especially in systems with limited sediment inputs (e.g., highly impervious watersheds, which often occur in older urban areas).
Channel incision and reduced infiltration (again, due to impervious surfaces) act to lower riparian water tables (Fig 6), thereby altering riparian hydrology. For example, Hardison et al. (2009) examined six Coastal Plain streams in North Carolina, ranging from 3.8-36.7% catchment impervious area. They found that:
• Channel incision increased with total impervious area (TIA).
• The duration of shallow riparian groundwaterthroughout the year decreased as TIA increased.
• Sites with higher TIA had greater depths to riparian groundwater (Fig 7).
Click below for more detailed information on specific topics
Riparian zones & channel
morphology
Urbanization & riparian hydrology Stream burial
URBANIZATION
Water / Sediment Quality Temperature Hydrology Physical Habitat Energy Sources
Riparian / Channel Alteration Wastewater Inputs Stormwater Runoff

Figure 8. Total ephemeral, intermittent and perennial channel length within Hamilton County, OH for forested vs. urban catchments. Ephemeral streams are channels with distinct stream beds and banks that carry water briefly during and after storms; intermittent streams are channels that carry water during the wet season; perennial streams are channels that carry flow all year. Numbers above bars indicate absolute and % different in channel length between forested and urban catchments.
Figure 9. Conceptual representation of how urbanization affects headwater streams in Hamilton County, OH. Dotted lines indicate ephemeral streams, dashed lines indicate intermittent streams, solid lines indicate perennial streams; shading indicates drainage area for each stream type. Figures 8 and 9 from Roy AH et al. 2009. Urbanization affects the extent and hydrologic permanence of headwater streams in a midwestern US metropolitan area. Journal of the North American Benthological Society 28(4):911-928. Reprinted with permission.
Stream burial
Headwater streams are key habitats in terms of aquatic ecosystem structure and function, and they comprise a significant portion of total stream miles. In urban watersheds, however, these small streams often are filled in or incorporated into storm sewer systems (i.e., piped), altering hydrologic connectivity and physical habitat within the buried streams, as well as urban drainage networks. For example:
• Drainage density of natural channels was approximately ⅓ less in urban and suburban vs. forested catchments in Atlanta, GA (Meyer & Wallace 2001).
• Approximately ⅔ of all streams were buried in Baltimore City, MD (Elmore & Kaushal 2008).
• 93% of ephemeral channel length and 46% of intermittent channel length were lost to burial and pipingassociated with urbanization in Hamilton County, OH (Roy et al. 2009, Figs 8 and 9). As a result, drainage areas for remaining ephemeral and intermittent channels were larger in urban areas.
Interestingly, Roy et al. (2009) found that perennial channel length actually increased with urbanization (Fig 8), although approximately 40% of perennial channels originated from pipes. This increase in perennial channel length was due at least in part to increased baseflow stemming from reductions in forest cover and evapotranspiration.
Click below for more detailed information on specific topics
Riparian zones & channel
morphology
Urbanization & riparian hydrology Stream burial
URBANIZATION
Water / Sediment Quality Temperature Hydrology Physical Habitat Energy Sources
Riparian / Channel Alteration Wastewater Inputs Stormwater Runoff
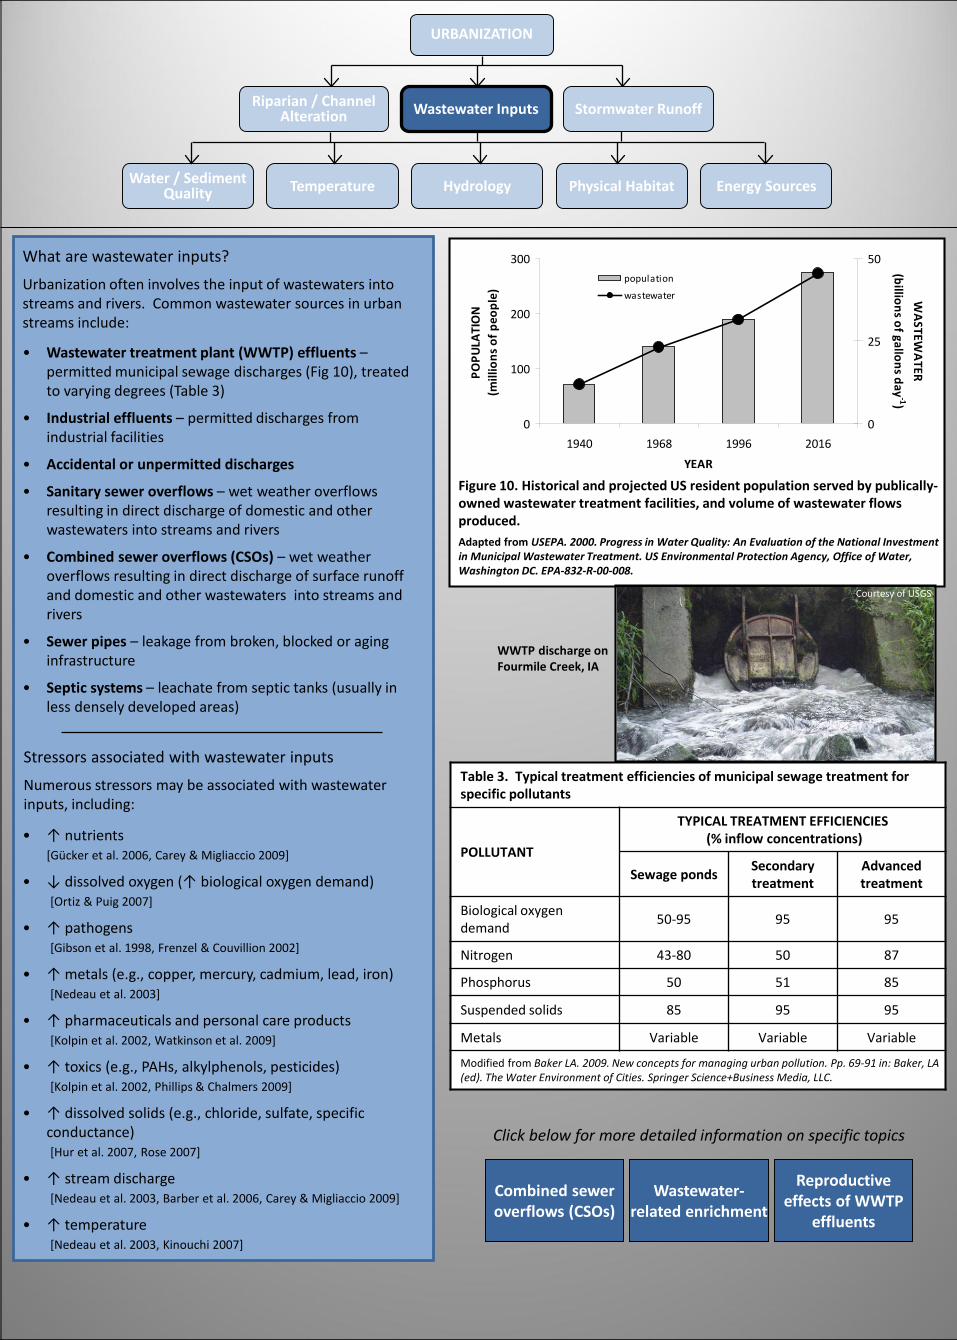
Table 3. Typical treatment efficiencies of municipal sewage treatment for specific pollutants
POLLUTANT
TYPICAL TREATMENT EFFICIENCIES (% inflow concentrations)
Sewage ponds Secondary treatment
Advanced treatment
Biological oxygen demand 50-95 95 95
Nitrogen 43-80 50 87
Phosphorus 50 51 85
Suspended solids 85 95 95
Metals Variable Variable Variable
Modified from Baker LA. 2009. New concepts for managing urban pollution. Pp. 69-91 in: Baker, LA (ed). The Water Environment of Cities. Springer Science+Business Media, LLC.
URBANIZATION
Water / Sediment Quality Temperature Hydrology Physical Habitat Energy Sources
Riparian / Channel Alteration Wastewater Inputs Stormwater Runoff
• Wastewater treatment plant (WWTP) effluents –permitted municipal sewage discharges (Fig 10), treated to varying degrees (Table 3)
• Industrial effluents – permitted discharges from industrial facilities
• Accidental or unpermitted discharges
• Sanitary sewer overflows – wet weather overflows resulting in direct discharge of domestic and other wastewaters into streams and rivers
• Combined sewer overflows (CSOs) – wet weather overflows resulting in direct discharge of surface runoff and domestic and other wastewaters into streams and rivers
• Sewer pipes – leakage from broken, blocked or aging infrastructure
• Septic systems – leachate from septic tanks (usually in less densely developed areas)
What are wastewater inputs?
Urbanization often involves the input of wastewaters into streams and rivers. Common wastewater sources in urban streams include:
• ↑ nutrients[Gücker et al. 2006, Carey & Migliaccio 2009]
• ↓ dissolved oxygen (↑ biological oxygen demand) [Ortiz & Puig 2007]
• ↑ pathogens[Gibson et al. 1998, Frenzel & Couvillion 2002]
• ↑ metals (e.g., copper, mercury, cadmium, lead, iron)[Nedeau et al. 2003]
• ↑ pharmaceuticals and personal care products[Kolpin et al. 2002, Watkinson et al. 2009]
• ↑ toxics (e.g., PAHs, alkylphenols, pesticides)[Kolpin et al. 2002, Phillips & Chalmers 2009]
• ↑ dissolved solids (e.g., chloride, sulfate, specific conductance)[Hur et al. 2007, Rose 2007]
• ↑ stream discharge[Nedeau et al. 2003, Barber et al. 2006, Carey & Migliaccio 2009]
• ↑ temperature[Nedeau et al. 2003, Kinouchi 2007]
Stressors associated with wastewater inputs
Numerous stressors may be associated with wastewater inputs, including:
Click below for more detailed information on specific topics
Combined sewer overflows (CSOs)
Wastewater-related enrichment
Reproductive effects of WWTP
effluents
Figure 10. Historical and projected US resident population served by publically-owned wastewater treatment facilities, and volume of wastewater flows produced. Adapted from USEPA. 2000. Progress in Water Quality: An Evaluation of the National Investment in Municipal Wastewater Treatment. US Environmental Protection Agency, Office of Water, Washington DC. EPA-832-R-00-008.
0
100
200
300
1940 1968 1996 2016YEAR
POPU
LATI
ON
(m
illio
ns o
f peo
ple)
0
25
50
WASTEW
ATER (billions of gallons day
-1)
population
wastewater
WWTP discharge on Fourmile Creek, IA
Courtesy of USGS
URBANIZATION
Water / Sediment Quality Temperature Hydrology Physical Habitat Energy Sources
Riparian / Channel Alteration Wastewater Inputs Stormwater Runoff
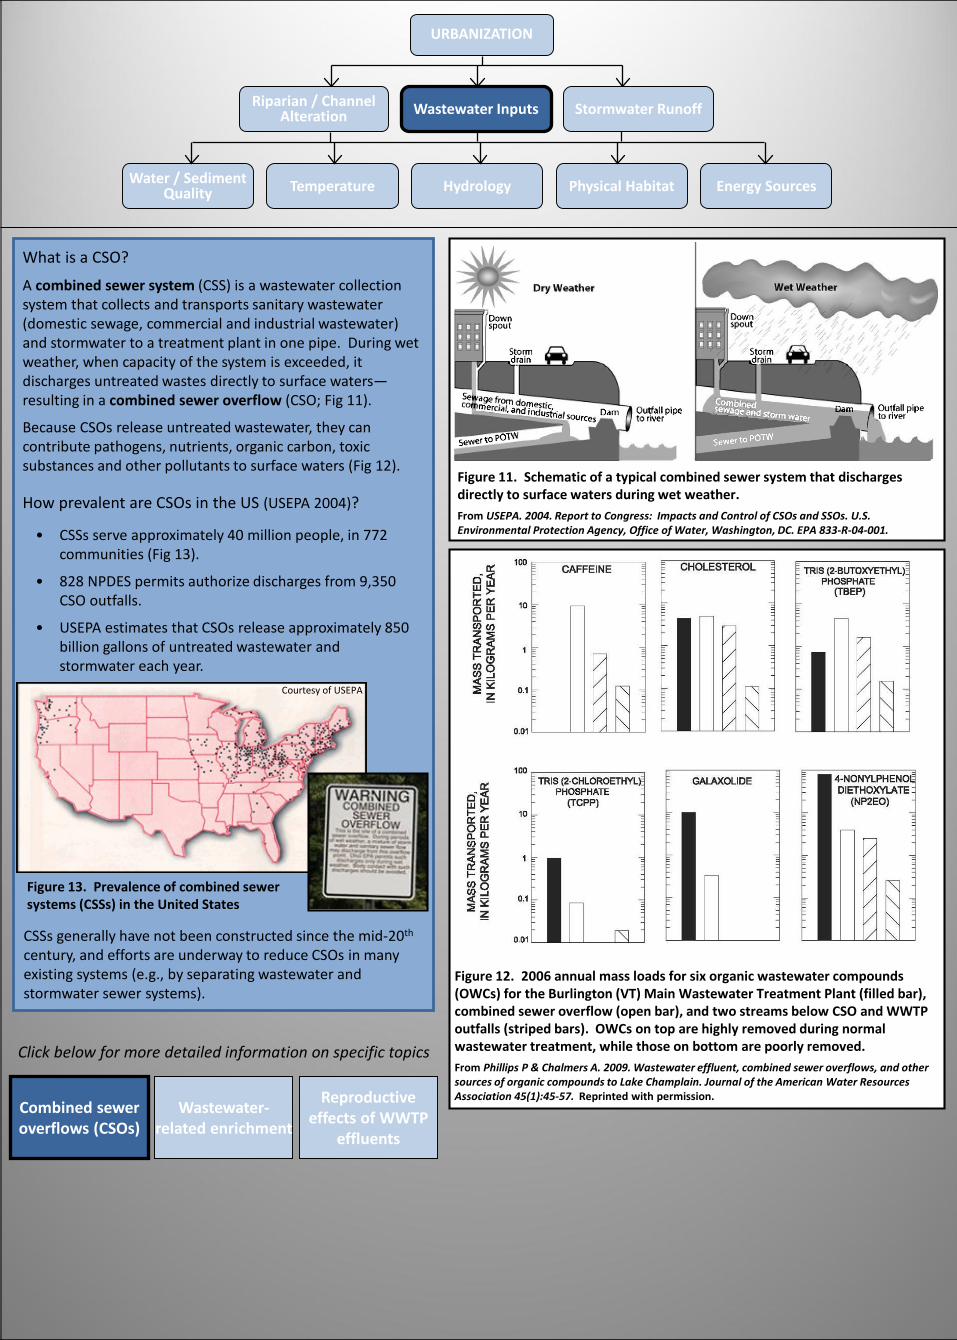
Figure 11. Schematic of a typical combined sewer system that discharges directly to surface waters during wet weather.From USEPA. 2004. Report to Congress: Impacts and Control of CSOs and SSOs. U.S. Environmental Protection Agency, Office of Water, Washington, DC. EPA 833-R-04-001.
Figure 12. 2006 annual mass loads for six organic wastewater compounds (OWCs) for the Burlington (VT) Main Wastewater Treatment Plant (filled bar), combined sewer overflow (open bar), and two streams below CSO and WWTP outfalls (striped bars). OWCs on top are highly removed during normal wastewater treatment, while those on bottom are poorly removed.From Phillips P & Chalmers A. 2009. Wastewater effluent, combined sewer overflows, and other sources of organic compounds to Lake Champlain. Journal of the American Water Resources Association 45(1):45-57. Reprinted with permission.
Click below for more detailed information on specific topics
Combined sewer overflows (CSOs)
Wastewater-related enrichment
Reproductive effects of WWTP
effluents
What is a CSO?
A combined sewer system (CSS) is a wastewater collection system that collects and transports sanitary wastewater (domestic sewage, commercial and industrial wastewater) and stormwater to a treatment plant in one pipe. During wet weather, when capacity of the system is exceeded, it discharges untreated wastes directly to surface waters—resulting in a combined sewer overflow (CSO; Fig 11).
Because CSOs release untreated wastewater, they can contribute pathogens, nutrients, organic carbon, toxic substances and other pollutants to surface waters (Fig 12).
Figure 13. Prevalence of combined sewer systems (CSSs) in the United States
• CSSs serve approximately 40 million people, in 772 communities (Fig 13).
• 828 NPDES permits authorize discharges from 9,350 CSO outfalls.
• USEPA estimates that CSOs release approximately 850 billion gallons of untreated wastewater and stormwater each year.
How prevalent are CSOs in the US (USEPA 2004)?
CSSs generally have not been constructed since the mid-20th
century, and efforts are underway to reduce CSOs in many existing systems (e.g., by separating wastewater and stormwater sewer systems).
Courtesy of USEPA
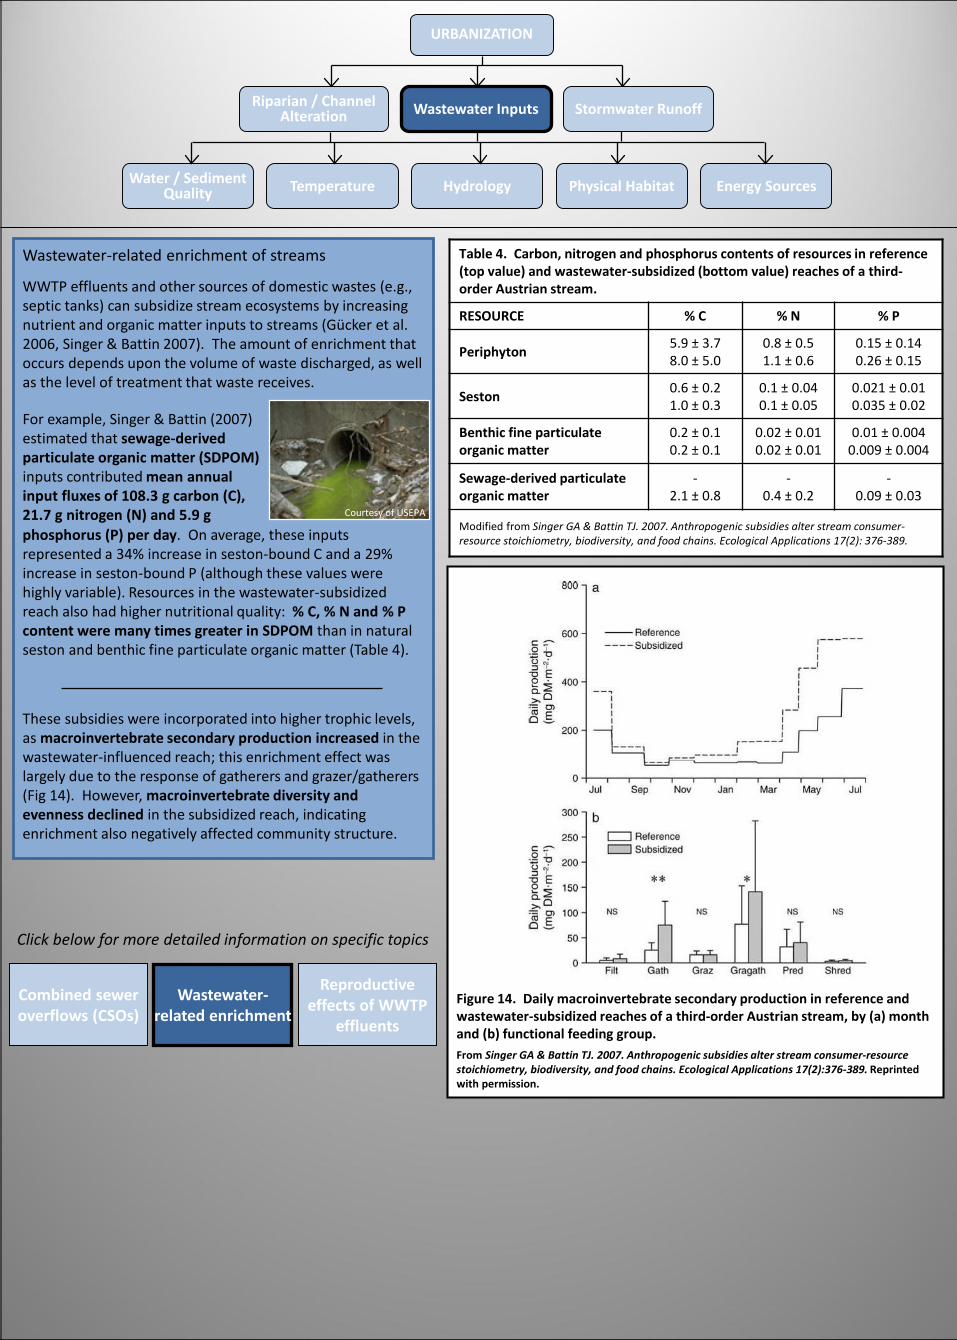
Table 4. Carbon, nitrogen and phosphorus contents of resources in reference (top value) and wastewater-subsidized (bottom value) reaches of a third-order Austrian stream.
RESOURCE % C % N % P
Periphyton 5.9 ± 3.78.0 ± 5.0
0.8 ± 0.51.1 ± 0.6
0.15 ± 0.140.26 ± 0.15
Seston 0.6 ± 0.21.0 ± 0.3
0.1 ± 0.040.1 ± 0.05
0.021 ± 0.010.035 ± 0.02
Benthic fine particulate organic matter
0.2 ± 0.10.2 ± 0.1
0.02 ± 0.010.02 ± 0.01
0.01 ± 0.0040.009 ± 0.004
Sewage-derived particulate organic matter
-2.1 ± 0.8
-0.4 ± 0.2
-0.09 ± 0.03
Modified from Singer GA & Battin TJ. 2007. Anthropogenic subsidies alter stream consumer-resource stoichiometry, biodiversity, and food chains. Ecological Applications 17(2): 376-389.
URBANIZATION
Water / Sediment Quality Temperature Hydrology Physical Habitat Energy Sources
Riparian / Channel Alteration Wastewater Inputs Stormwater Runoff
Figure 14. Daily macroinvertebrate secondary production in reference and wastewater-subsidized reaches of a third-order Austrian stream, by (a) month and (b) functional feeding group.From Singer GA & Battin TJ. 2007. Anthropogenic subsidies alter stream consumer-resource stoichiometry, biodiversity, and food chains. Ecological Applications 17(2):376-389. Reprinted with permission.
Click below for more detailed information on specific topics
Combined sewer overflows (CSOs)
Wastewater-related enrichment
Reproductive effects of WWTP
effluents
Wastewater-related enrichment of streams
phosphorus (P) per day. On average, these inputs represented a 34% increase in seston-bound C and a 29% increase in seston-bound P (although these values were highly variable). Resources in the wastewater-subsidized reach also had higher nutritional quality: % C, % N and % P content were many times greater in SDPOM than in natural seston and benthic fine particulate organic matter (Table 4).
WWTP effluents and other sources of domestic wastes (e.g., septic tanks) can subsidize stream ecosystems by increasing nutrient and organic matter inputs to streams (Gücker et al. 2006, Singer & Battin 2007). The amount of enrichment that occurs depends upon the volume of waste discharged, as well as the level of treatment that waste receives.
These subsidies were incorporated into higher trophic levels, as macroinvertebrate secondary production increased in the wastewater-influenced reach; this enrichment effect was largely due to the response of gatherers and grazer/gatherers (Fig 14). However, macroinvertebrate diversity and evenness declined in the subsidized reach, indicating enrichment also negatively affected community structure.
For example, Singer & Battin (2007) estimated that sewage-derived particulate organic matter (SDPOM)inputs contributed mean annual input fluxes of 108.3 g carbon (C), 21.7 g nitrogen (N) and 5.9 g Courtesy of USEPA
URBANIZATION
Water / Sediment Quality Temperature Hydrology Physical Habitat Energy Sources
Riparian / Channel Alteration Wastewater Inputs Stormwater Runoff
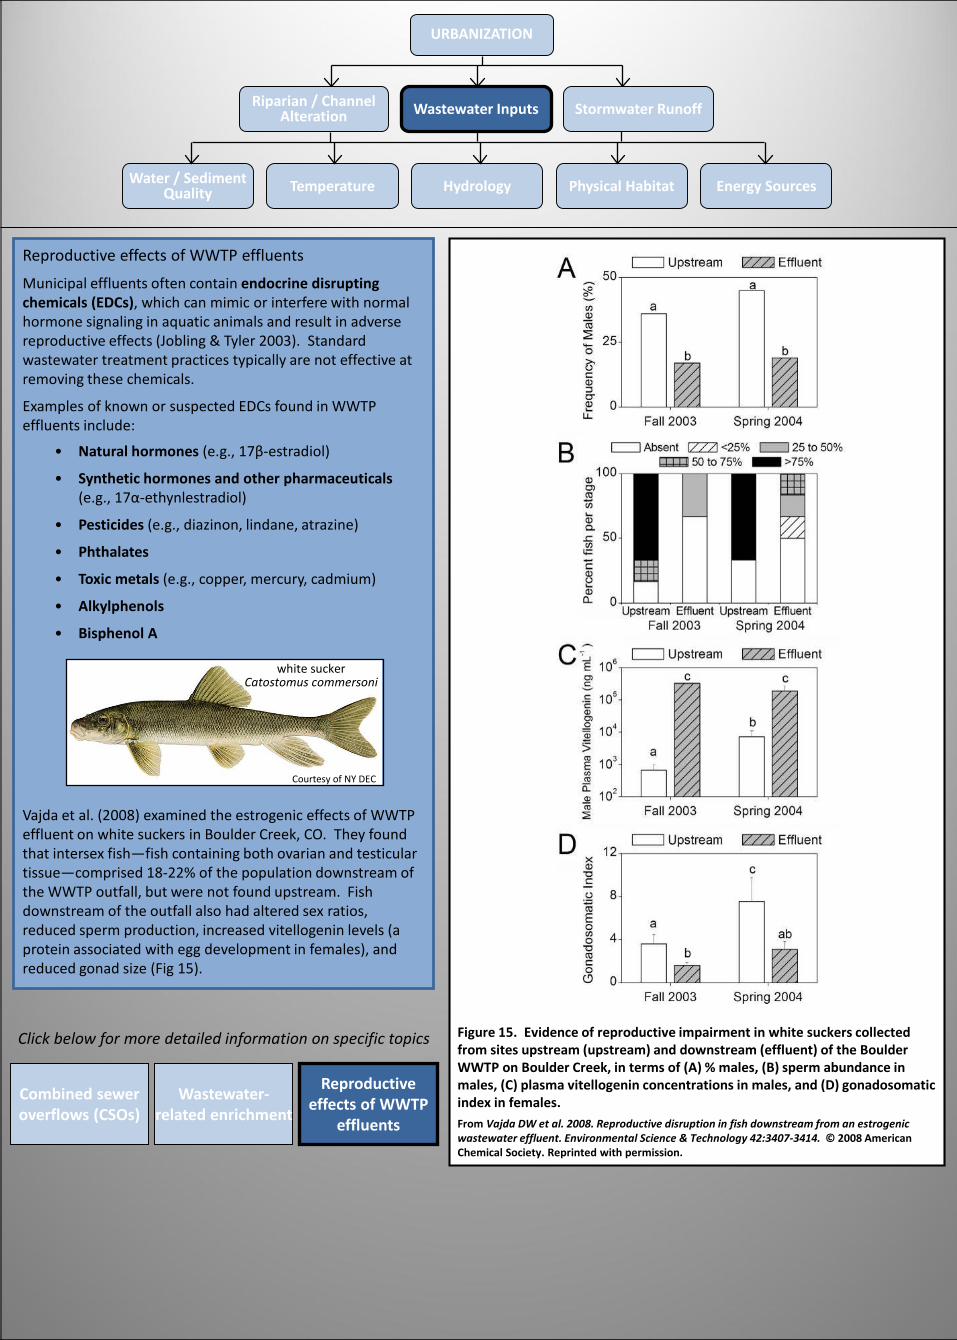
Figure 15. Evidence of reproductive impairment in white suckers collected from sites upstream (upstream) and downstream (effluent) of the Boulder WWTP on Boulder Creek, in terms of (A) % males, (B) sperm abundance in males, (C) plasma vitellogenin concentrations in males, and (D) gonadosomatic index in females.From Vajda DW et al. 2008. Reproductive disruption in fish downstream from an estrogenic wastewater effluent. Environmental Science & Technology 42:3407-3414. © 2008 American Chemical Society. Reprinted with permission.
Click below for more detailed information on specific topics
Combined sewer overflows (CSOs)
Wastewater-related enrichment
Reproductive effects of WWTP
effluents
Reproductive effects of WWTP effluents
Municipal effluents often contain endocrine disrupting chemicals (EDCs), which can mimic or interfere with normal hormone signaling in aquatic animals and result in adverse reproductive effects (Jobling & Tyler 2003). Standard wastewater treatment practices typically are not effective at removing these chemicals.
Examples of known or suspected EDCs found in WWTP effluents include:
Vajda et al. (2008) examined the estrogenic effects of WWTP effluent on white suckers in Boulder Creek, CO. They found that intersex fish—fish containing both ovarian and testicular tissue—comprised 18-22% of the population downstream of the WWTP outfall, but were not found upstream. Fish downstream of the outfall also had altered sex ratios, reduced sperm production, increased vitellogenin levels (a protein associated with egg development in females), and reduced gonad size (Fig 15).
• Natural hormones (e.g., 17β-estradiol)
• Synthetic hormones and other pharmaceuticals(e.g., 17α-ethynlestradiol)
• Pesticides (e.g., diazinon, lindane, atrazine)
• Phthalates
• Toxic metals (e.g., copper, mercury, cadmium)
• Alkylphenols
• Bisphenol A
white suckerCatostomus commersoni
Courtesy of NY DEC
URBANIZATION
Water / Sediment Quality Temperature Hydrology Physical Habitat Energy Sources
Riparian / Channel Alteration Wastewater Inputs Stormwater Runoff
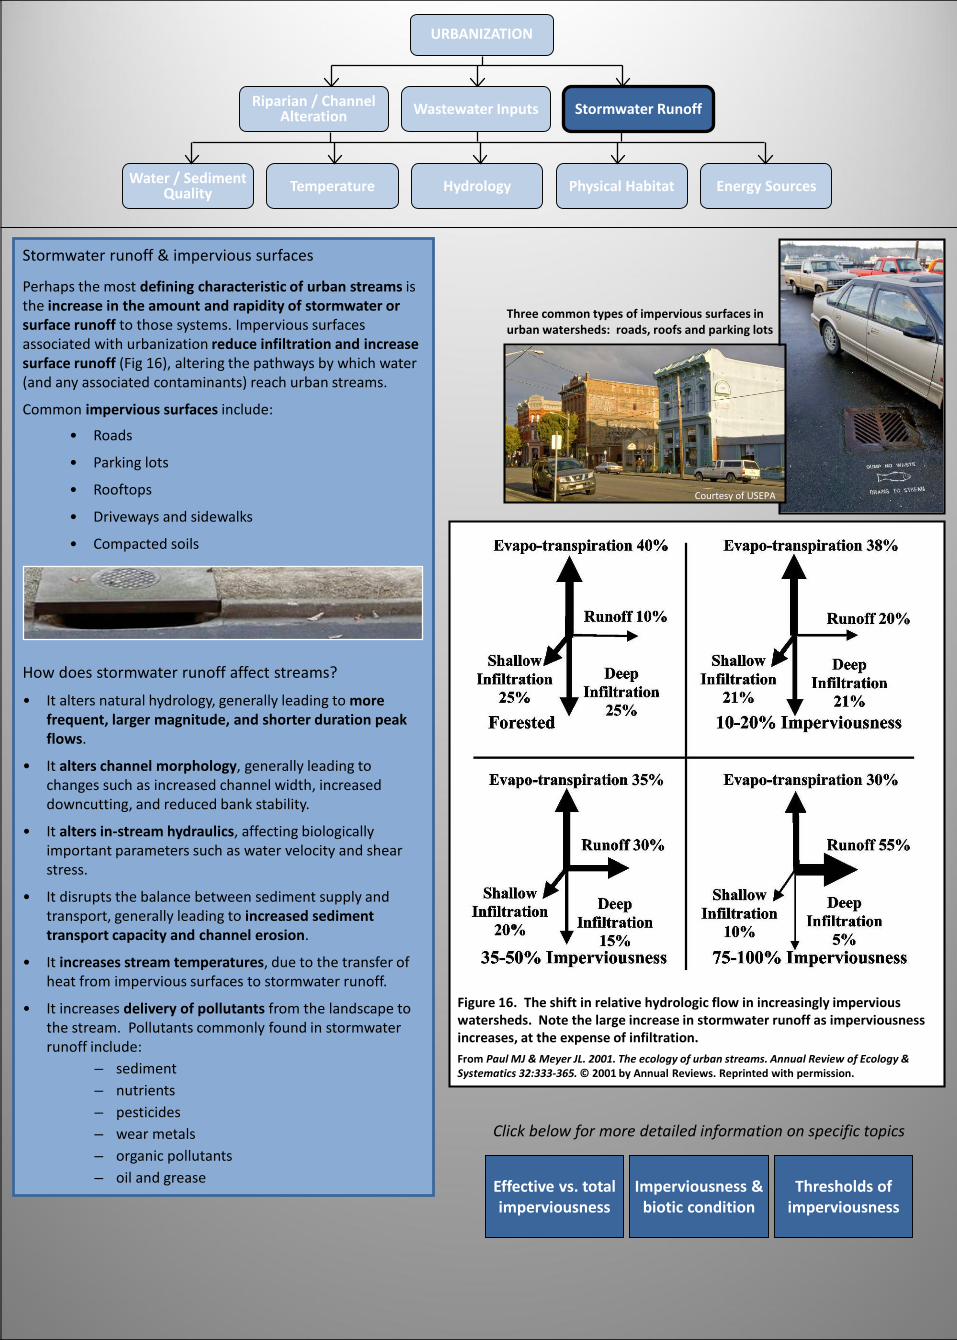
Figure 16. The shift in relative hydrologic flow in increasingly impervious watersheds. Note the large increase in stormwater runoff as imperviousness increases, at the expense of infiltration. From Paul MJ & Meyer JL. 2001. The ecology of urban streams. Annual Review of Ecology & Systematics 32:333-365. © 2001 by Annual Reviews. Reprinted with permission.
Click below for more detailed information on specific topics
Effective vs. total imperviousness
Imperviousness & biotic condition
Thresholds of imperviousness
Three common types of impervious surfaces in urban watersheds: roads, roofs and parking lots
Stormwater runoff & impervious surfaces
How does stormwater runoff affect streams?
• It alters natural hydrology, generally leading to more frequent, larger magnitude, and shorter duration peak flows.
• It alters channel morphology, generally leading to changes such as increased channel width, increased downcutting, and reduced bank stability.
• It alters in-stream hydraulics, affecting biologically important parameters such as water velocity and shear stress.
• It disrupts the balance between sediment supply and transport, generally leading to increased sediment transport capacity and channel erosion.
• It increases stream temperatures, due to the transfer of heat from impervious surfaces to stormwater runoff.
• It increases delivery of pollutants from the landscape to the stream. Pollutants commonly found in stormwater runoff include:
– sediment – nutrients– pesticides– wear metals– organic pollutants– oil and grease
Perhaps the most defining characteristic of urban streams is the increase in the amount and rapidity of stormwater or surface runoff to those systems. Impervious surfaces associated with urbanization reduce infiltration and increase surface runoff (Fig 16), altering the pathways by which water (and any associated contaminants) reach urban streams.
Common impervious surfaces include:
• Roads
• Parking lots
• Rooftops
• Driveways and sidewalks
• Compacted soils
Courtesy of USEPA
URBANIZATION
Water / Sediment Quality Temperature Hydrology Physical Habitat Energy Sources
Riparian / Channel Alteration Wastewater Inputs Stormwater Runoff
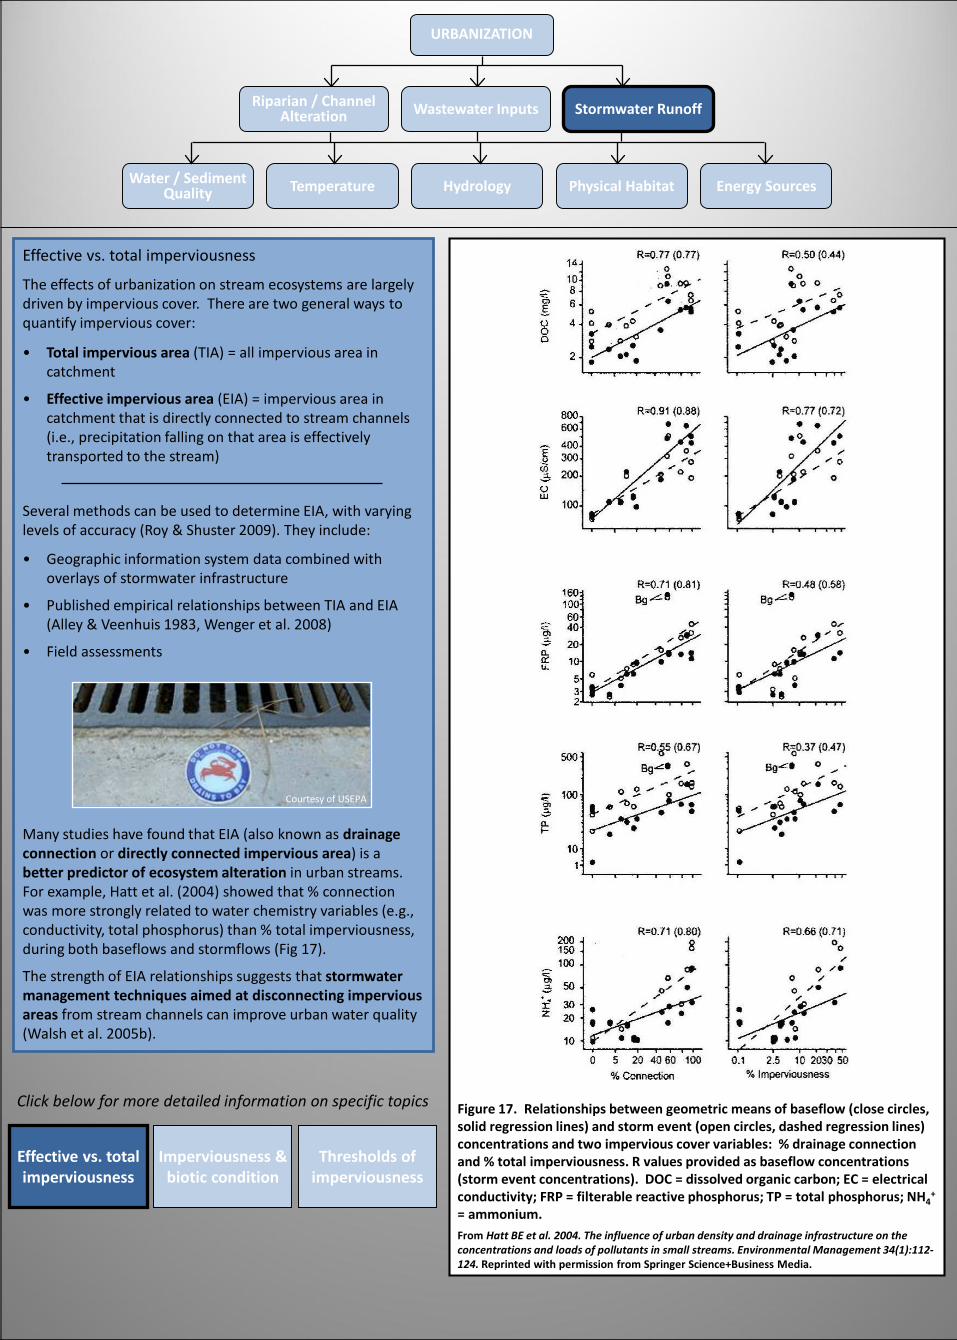
Figure 17. Relationships between geometric means of baseflow (close circles, solid regression lines) and storm event (open circles, dashed regression lines) concentrations and two impervious cover variables: % drainage connection and % total imperviousness. R values provided as baseflow concentrations (storm event concentrations). DOC = dissolved organic carbon; EC = electrical conductivity; FRP = filterable reactive phosphorus; TP = total phosphorus; NH4
+
= ammonium. From Hatt BE et al. 2004. The influence of urban density and drainage infrastructure on the concentrations and loads of pollutants in small streams. Environmental Management 34(1):112-124. Reprinted with permission from Springer Science+Business Media.
Click below for more detailed information on specific topics
Effective vs. total imperviousness
Imperviousness & biotic condition
Thresholds of imperviousness
Effective vs. total imperviousness
• Total impervious area (TIA) = all impervious area in catchment
• Effective impervious area (EIA) = impervious area in catchment that is directly connected to stream channels (i.e., precipitation falling on that area is effectively transported to the stream)
Many studies have found that EIA (also known as drainage connection or directly connected impervious area) is abetter predictor of ecosystem alteration in urban streams. For example, Hatt et al. (2004) showed that % connection was more strongly related to water chemistry variables (e.g., conductivity, total phosphorus) than % total imperviousness, during both baseflows and stormflows (Fig 17).
The strength of EIA relationships suggests that stormwater management techniques aimed at disconnecting impervious areas from stream channels can improve urban water quality (Walsh et al. 2005b).
Several methods can be used to determine EIA, with varying levels of accuracy (Roy & Shuster 2009). They include:
• Geographic information system data combined with overlays of stormwater infrastructure
• Published empirical relationships between TIA and EIA (Alley & Veenhuis 1983, Wenger et al. 2008)
• Field assessments
The effects of urbanization on stream ecosystems are largely driven by impervious cover. There are two general ways to quantify impervious cover:
Courtesy of USEPA
URBANIZATION
Water / Sediment Quality Temperature Hydrology Physical Habitat Energy Sources
Riparian / Channel Alteration Wastewater Inputs Stormwater Runoff
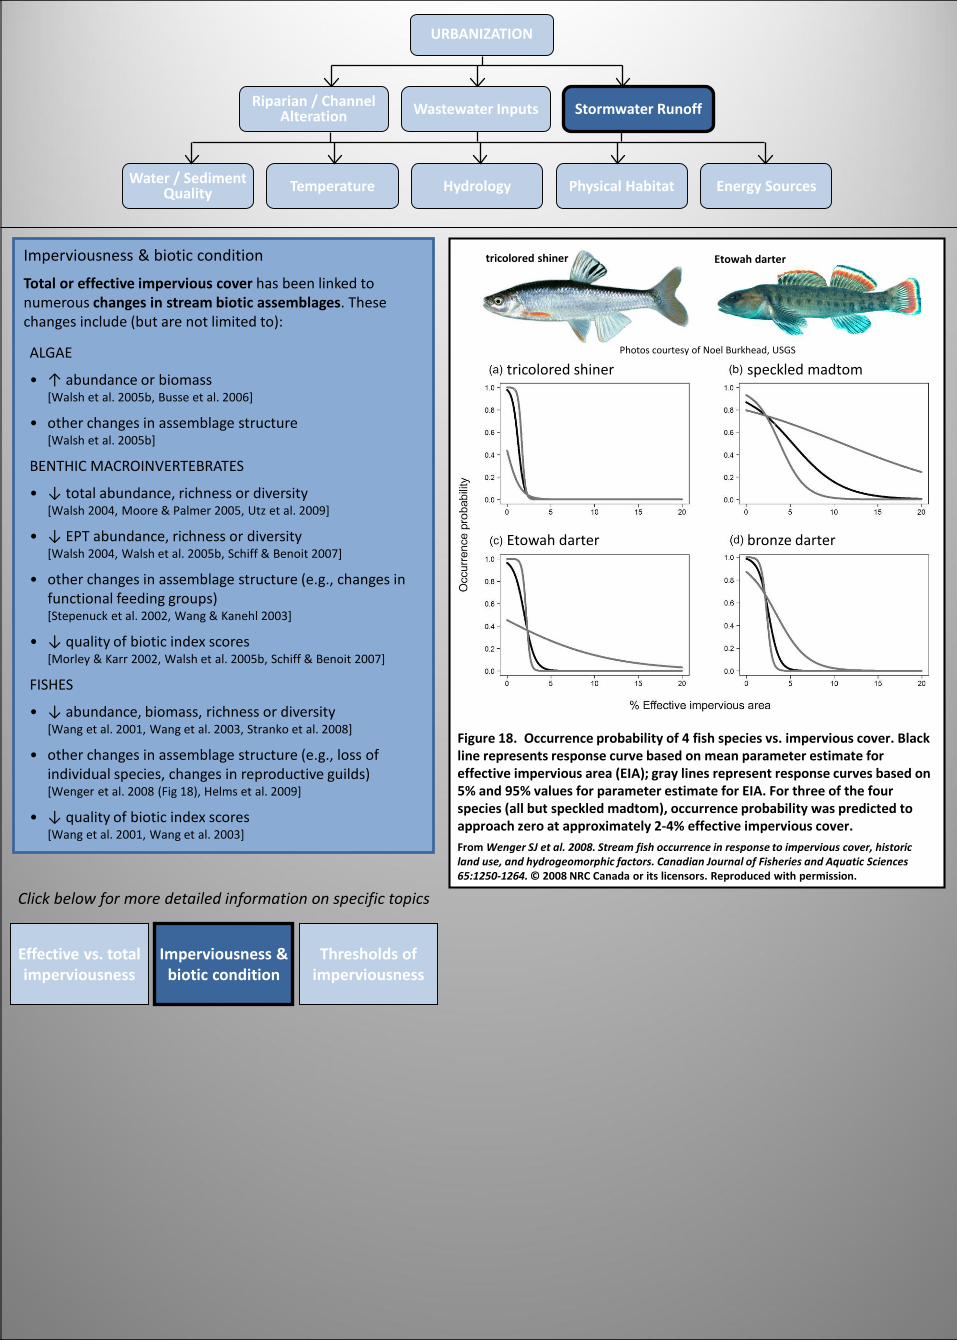
Imperviousness & biotic condition
Total or effective impervious cover has been linked to numerous changes in stream biotic assemblages. These changes include (but are not limited to):
ALGAE
• ↑ abundance or biomass[Walsh et al. 2005b, Busse et al. 2006]
• other changes in assemblage structure[Walsh et al. 2005b]
BENTHIC MACROINVERTEBRATES
• ↓ total abundance, richness or diversity[Walsh 2004, Moore & Palmer 2005, Utz et al. 2009]
• ↓ EPT abundance, richness or diversity [Walsh 2004, Walsh et al. 2005b, Schiff & Benoit 2007]
• other changes in assemblage structure (e.g., changes in functional feeding groups)[Stepenuck et al. 2002, Wang & Kanehl 2003]
• ↓ quality of biotic index scores[Morley & Karr 2002, Walsh et al. 2005b, Schiff & Benoit 2007]
FISHES
• ↓ abundance, biomass, richness or diversity [Wang et al. 2001, Wang et al. 2003, Stranko et al. 2008]
• other changes in assemblage structure (e.g., loss of individual species, changes in reproductive guilds)[Wenger et al. 2008 (Fig 18), Helms et al. 2009]
• ↓ quality of biotic index scores[Wang et al. 2001, Wang et al. 2003]
Click below for more detailed information on specific topics
Effective vs. total imperviousness
Imperviousness & biotic condition
Thresholds of imperviousness
Figure 18. Occurrence probability of 4 fish species vs. impervious cover. Black line represents response curve based on mean parameter estimate for effective impervious area (EIA); gray lines represent response curves based on 5% and 95% values for parameter estimate for EIA. For three of the four species (all but speckled madtom), occurrence probability was predicted to approach zero at approximately 2-4% effective impervious cover. From Wenger SJ et al. 2008. Stream fish occurrence in response to impervious cover, historic land use, and hydrogeomorphic factors. Canadian Journal of Fisheries and Aquatic Sciences 65:1250-1264. © 2008 NRC Canada or its licensors. Reproduced with permission.
tricolored shiner
Etowah darter
speckled madtom
bronze darter
tricolored shiner
Photos courtesy of Noel Burkhead, USGS
Etowah darter
URBANIZATION
Water / Sediment Quality Temperature Hydrology Physical Habitat Energy Sources
Riparian / Channel Alteration Wastewater Inputs Stormwater Runoff
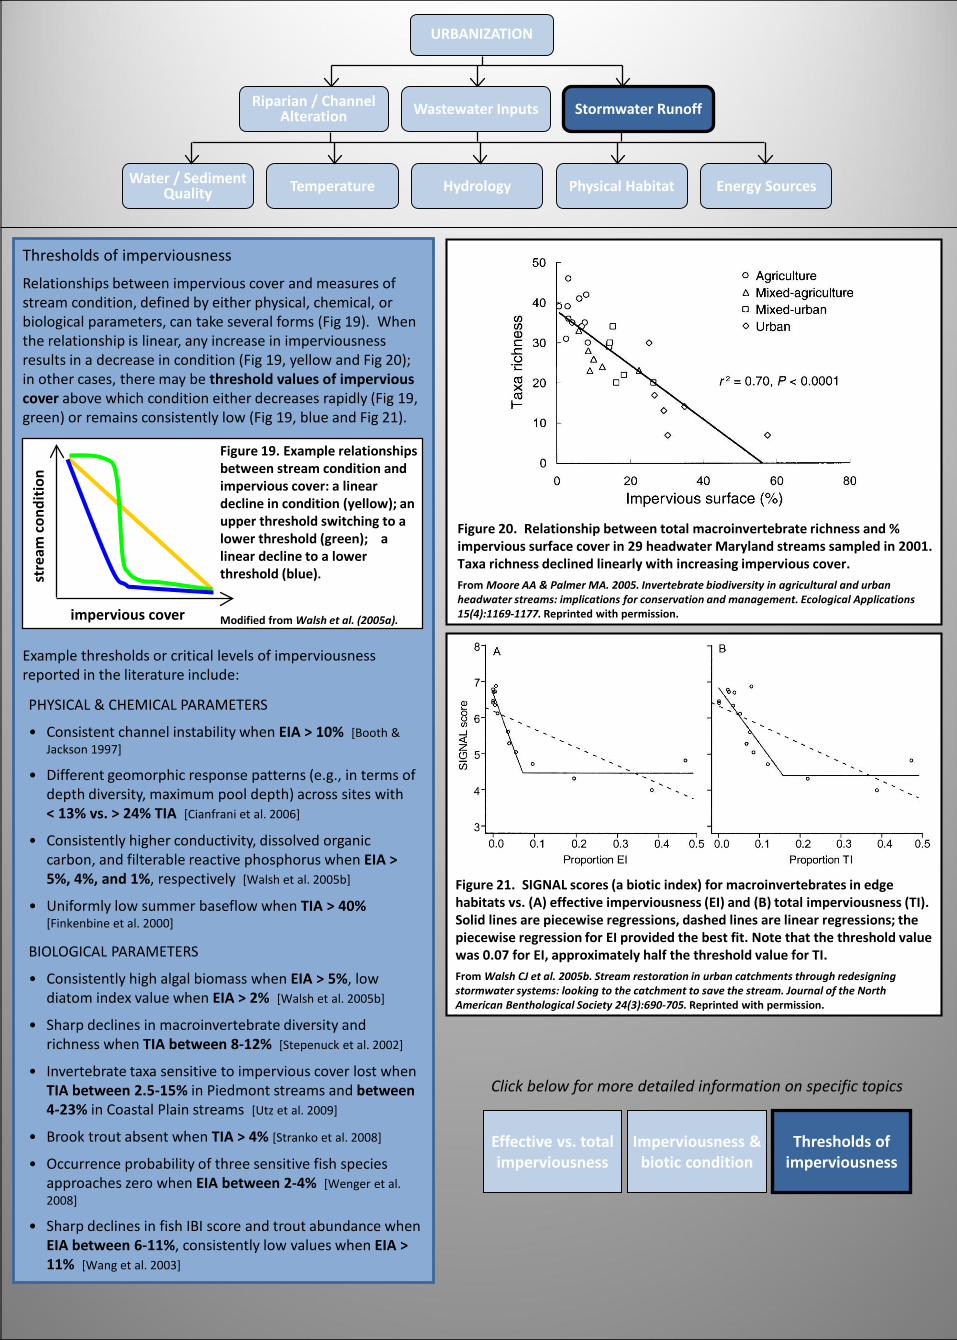
Figure 20. Relationship between total macroinvertebrate richness and % impervious surface cover in 29 headwater Maryland streams sampled in 2001. Taxa richness declined linearly with increasing impervious cover. From Moore AA & Palmer MA. 2005. Invertebrate biodiversity in agricultural and urban headwater streams: implications for conservation and management. Ecological Applications 15(4):1169-1177. Reprinted with permission.
Figure 21. SIGNAL scores (a biotic index) for macroinvertebrates in edge habitats vs. (A) effective imperviousness (EI) and (B) total imperviousness (TI). Solid lines are piecewise regressions, dashed lines are linear regressions; the piecewise regression for EI provided the best fit. Note that the threshold value was 0.07 for EI, approximately half the threshold value for TI. From Walsh CJ et al. 2005b. Stream restoration in urban catchments through redesigning stormwater systems: looking to the catchment to save the stream. Journal of the North American Benthological Society 24(3):690-705. Reprinted with permission.
Thresholds of imperviousness
Relationships between impervious cover and measures of stream condition, defined by either physical, chemical, or biological parameters, can take several forms (Fig 19). When the relationship is linear, any increase in imperviousness results in a decrease in condition (Fig 19, yellow and Fig 20); in other cases, there may be threshold values of impervious cover above which condition either decreases rapidly (Fig 19, green) or remains consistently low (Fig 19, blue and Fig 21).
Example thresholds or critical levels of imperviousness reported in the literature include:
Figure 19. Example relationships between stream condition and impervious cover: a linear decline in condition (yellow); an upper threshold switching to a lower threshold (green); a linear decline to a lower threshold (blue).
Modified from Walsh et al. (2005a).impervious cover
stre
am co
nditi
on
PHYSICAL & CHEMICAL PARAMETERS
• Consistent channel instability when EIA > 10% [Booth & Jackson 1997]
• Different geomorphic response patterns (e.g., in terms of depth diversity, maximum pool depth) across sites with < 13% vs. > 24% TIA [Cianfrani et al. 2006]
• Consistently higher conductivity, dissolved organic carbon, and filterable reactive phosphorus when EIA > 5%, 4%, and 1%, respectively [Walsh et al. 2005b]
• Uniformly low summer baseflow when TIA > 40%[Finkenbine et al. 2000]
BIOLOGICAL PARAMETERS
• Consistently high algal biomass when EIA > 5%, low diatom index value when EIA > 2% [Walsh et al. 2005b]
• Sharp declines in macroinvertebrate diversity and richness when TIA between 8-12% [Stepenuck et al. 2002]
• Invertebrate taxa sensitive to impervious cover lost when TIA between 2.5-15% in Piedmont streams and between 4-23% in Coastal Plain streams [Utz et al. 2009]
• Brook trout absent when TIA > 4% [Stranko et al. 2008]
• Occurrence probability of three sensitive fish species approaches zero when EIA between 2-4% [Wenger et al. 2008]
• Sharp declines in fish IBI score and trout abundance when EIA between 6-11%, consistently low values when EIA > 11% [Wang et al. 2003]
Click below for more detailed information on specific topics
Effective vs. total imperviousness
Imperviousness & biotic condition
Thresholds of imperviousness
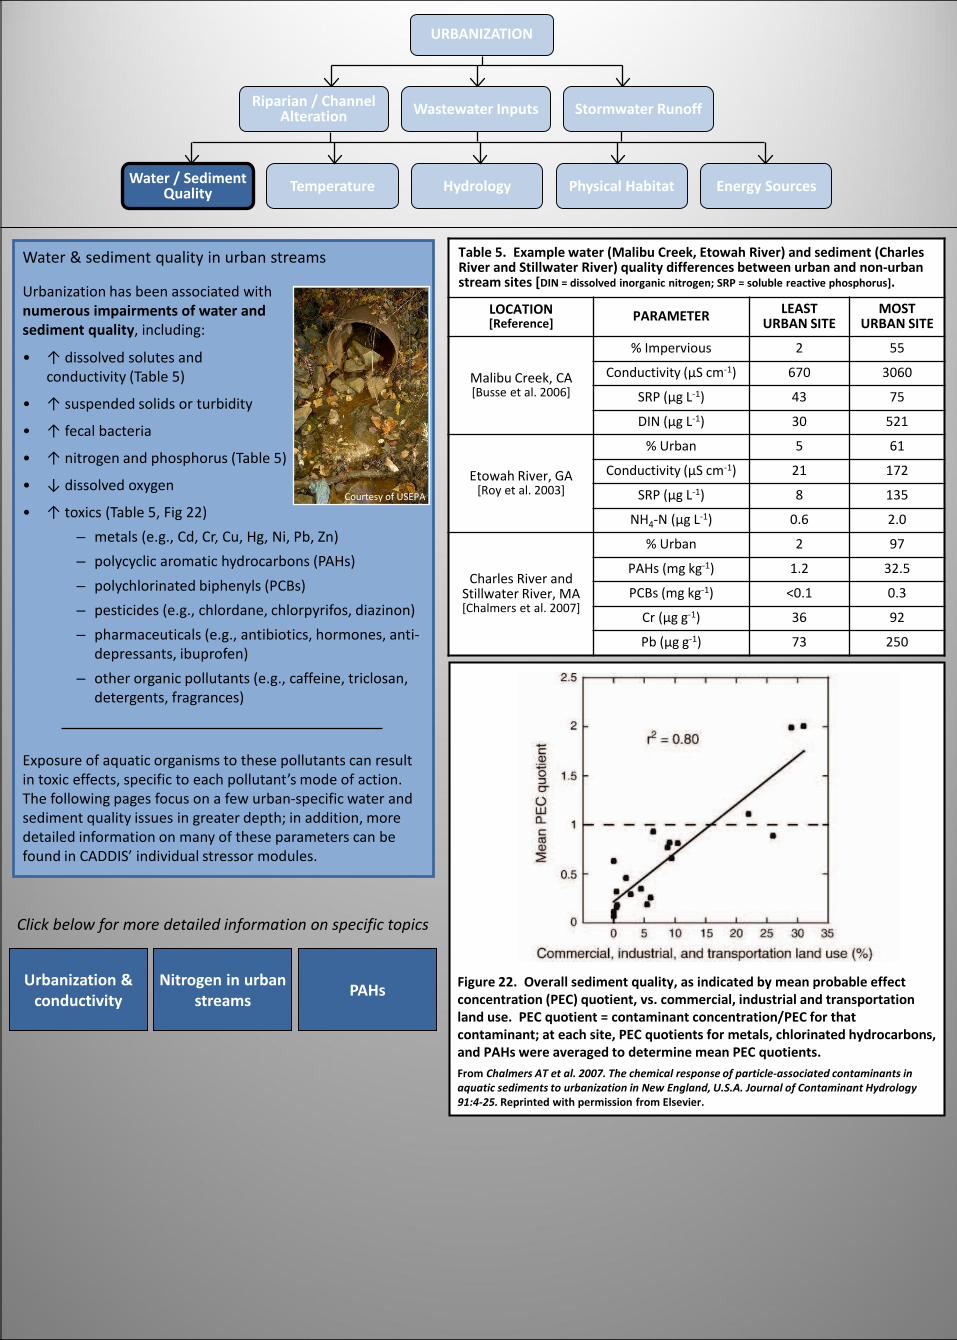
Table 5. Example water (Malibu Creek, Etowah River) and sediment (Charles River and Stillwater River) quality differences between urban and non-urban stream sites [DIN = dissolved inorganic nitrogen; SRP = soluble reactive phosphorus].
LOCATION[Reference] PARAMETER LEAST
URBAN SITEMOST
URBAN SITE
Malibu Creek, CA [Busse et al. 2006]
% Impervious 2 55
Conductivity (μS cm-1) 670 3060
SRP (μg L-1) 43 75
DIN (μg L-1) 30 521
Etowah River, GA[Roy et al. 2003]
% Urban 5 61
Conductivity (μS cm-1) 21 172
SRP (μg L-1) 8 135
NH4-N (μg L-1) 0.6 2.0
Charles River and Stillwater River, MA[Chalmers et al. 2007]
% Urban 2 97
PAHs (mg kg-1) 1.2 32.5
PCBs (mg kg-1) <0.1 0.3
Cr (μg g-1) 36 92
Pb (μg g-1) 73 250
URBANIZATION
Water / Sediment Quality Temperature Hydrology Physical Habitat Energy Sources
Riparian / Channel Alteration Wastewater Inputs Stormwater Runoff
Figure 22. Overall sediment quality, as indicated by mean probable effect concentration (PEC) quotient, vs. commercial, industrial and transportation land use. PEC quotient = contaminant concentration/PEC for that contaminant; at each site, PEC quotients for metals, chlorinated hydrocarbons, and PAHs were averaged to determine mean PEC quotients. From Chalmers AT et al. 2007. The chemical response of particle-associated contaminants in aquatic sediments to urbanization in New England, U.S.A. Journal of Contaminant Hydrology 91:4-25. Reprinted with permission from Elsevier.
Click below for more detailed information on specific topics
Urbanization & conductivity
Nitrogen in urban streams PAHs
Water & sediment quality in urban streams
Exposure of aquatic organisms to these pollutants can result in toxic effects, specific to each pollutant’s mode of action. The following pages focus on a few urban-specific water and sediment quality issues in greater depth; in addition, more detailed information on many of these parameters can be found in CADDIS’ individual stressor modules.
• ↑ dissolved solutes and conductivity (Table 5)
• ↑ suspended solids or turbidity
• ↑ fecal bacteria
• ↑ nitrogen and phosphorus (Table 5)
• ↓ dissolved oxygen
• ↑ toxics (Table 5, Fig 22)– metals (e.g., Cd, Cr, Cu, Hg, Ni, Pb, Zn)– polycyclic aromatic hydrocarbons (PAHs)– polychlorinated biphenyls (PCBs) – pesticides (e.g., chlordane, chlorpyrifos, diazinon)– pharmaceuticals (e.g., antibiotics, hormones, anti-
depressants, ibuprofen) – other organic pollutants (e.g., caffeine, triclosan,
detergents, fragrances)
Urbanization has been associated with numerous impairments of water and sediment quality, including:
Courtesy of USEPA
URBANIZATION
Water / Sediment Quality Temperature Hydrology Physical Habitat Energy Sources
Riparian / Channel Alteration Wastewater Inputs Stormwater Runoff
Click below for more detailed information on specific topics
Urbanization & conductivity
Nitrogen in urban streams PAHs
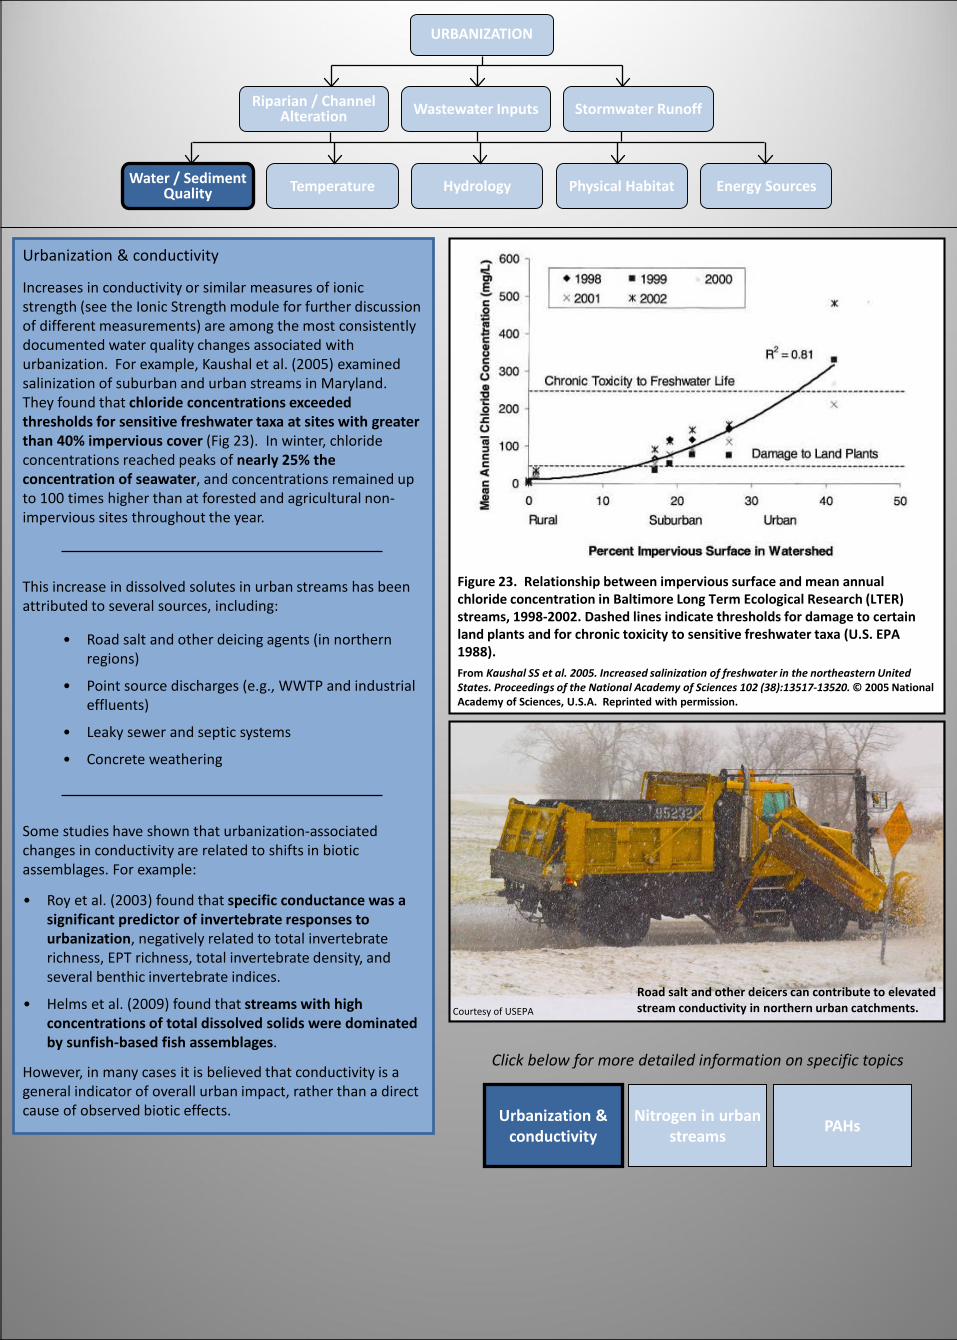
Increases in conductivity or similar measures of ionic strength (see the Ionic Strength module for further discussion of different measurements) are among the most consistently documented water quality changes associated with urbanization. For example, Kaushal et al. (2005) examined salinization of suburban and urban streams in Maryland. They found that chloride concentrations exceeded thresholds for sensitive freshwater taxa at sites with greater than 40% impervious cover (Fig 23). In winter, chloride concentrations reached peaks of nearly 25% the concentration of seawater, and concentrations remained up to 100 times higher than at forested and agricultural non-impervious sites throughout the year.
Urbanization & conductivity
This increase in dissolved solutes in urban streams has been attributed to several sources, including:
• Road salt and other deicing agents (in northern regions)
• Point source discharges (e.g., WWTP and industrial effluents)
• Leaky sewer and septic systems
• Concrete weathering
Some studies have shown that urbanization-associated changes in conductivity are related to shifts in biotic assemblages. For example:
• Roy et al. (2003) found that specific conductance was a significant predictor of invertebrate responses to urbanization, negatively related to total invertebrate richness, EPT richness, total invertebrate density, and several benthic invertebrate indices.
• Helms et al. (2009) found that streams with high concentrations of total dissolved solids were dominated by sunfish-based fish assemblages.
However, in many cases it is believed that conductivity is a general indicator of overall urban impact, rather than a direct cause of observed biotic effects.
Figure 23. Relationship between impervious surface and mean annual chloride concentration in Baltimore Long Term Ecological Research (LTER) streams, 1998-2002. Dashed lines indicate thresholds for damage to certain land plants and for chronic toxicity to sensitive freshwater taxa (U.S. EPA 1988). From Kaushal SS et al. 2005. Increased salinization of freshwater in the northeastern United States. Proceedings of the National Academy of Sciences 102 (38):13517-13520. © 2005 National Academy of Sciences, U.S.A. Reprinted with permission.
Road salt and other deicers can contribute to elevated stream conductivity in northern urban catchments.Courtesy of USEPA
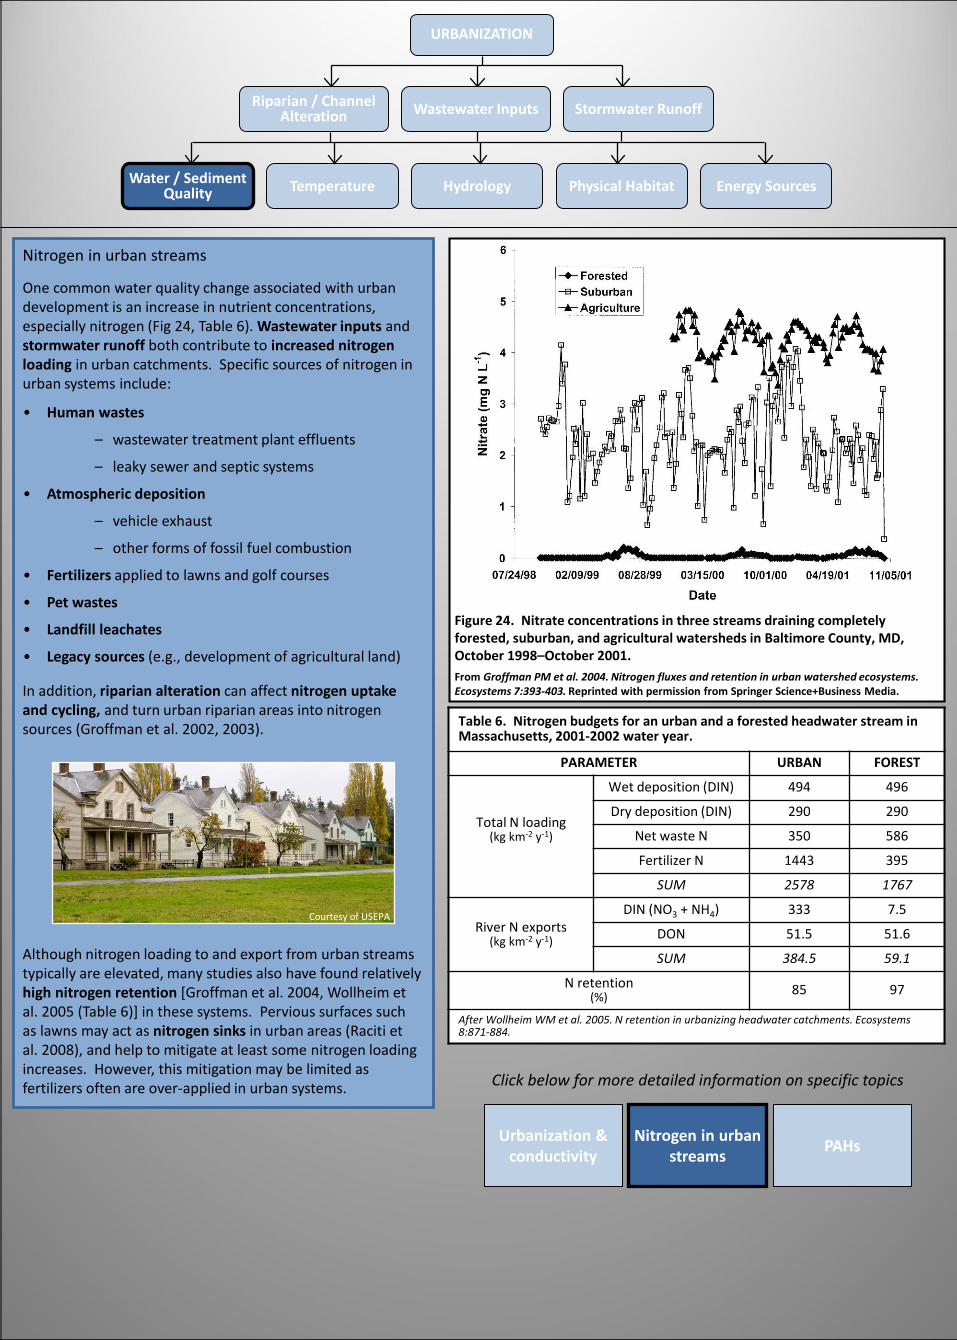
Table 6. Nitrogen budgets for an urban and a forested headwater stream in Massachusetts, 2001-2002 water year.
PARAMETER URBAN FOREST
Total N loading (kg km-2 y-1)
Wet deposition (DIN) 494 496
Dry deposition (DIN) 290 290
Net waste N 350 586
Fertilizer N 1443 395
SUM 2578 1767
River N exports (kg km-2 y-1)
DIN (NO3 + NH4) 333 7.5
DON 51.5 51.6
SUM 384.5 59.1
N retention (%) 85 97
After Wollheim WM et al. 2005. N retention in urbanizing headwater catchments. Ecosystems 8:871-884.
URBANIZATION
Water / Sediment Quality Temperature Hydrology Physical Habitat Energy Sources
Riparian / Channel Alteration Wastewater Inputs Stormwater Runoff
Figure 24. Nitrate concentrations in three streams draining completely forested, suburban, and agricultural watersheds in Baltimore County, MD, October 1998–October 2001. From Groffman PM et al. 2004. Nitrogen fluxes and retention in urban watershed ecosystems. Ecosystems 7:393-403. Reprinted with permission from Springer Science+Business Media.
Click below for more detailed information on specific topics
Urbanization & conductivity
Nitrogen in urban streams PAHs
Nitrogen in urban streams
Although nitrogen loading to and export from urban streams typically are elevated, many studies also have found relatively high nitrogen retention [Groffman et al. 2004, Wollheim et al. 2005 (Table 6)] in these systems. Pervious surfaces such as lawns may act as nitrogen sinks in urban areas (Raciti et al. 2008), and help to mitigate at least some nitrogen loading increases. However, this mitigation may be limited as fertilizers often are over-applied in urban systems.
• Human wastes
– wastewater treatment plant effluents
– leaky sewer and septic systems
• Atmospheric deposition
– vehicle exhaust
– other forms of fossil fuel combustion
• Fertilizers applied to lawns and golf courses
• Pet wastes
• Landfill leachates
• Legacy sources (e.g., development of agricultural land)
One common water quality change associated with urban development is an increase in nutrient concentrations, especially nitrogen (Fig 24, Table 6). Wastewater inputs and stormwater runoff both contribute to increased nitrogen loading in urban catchments. Specific sources of nitrogen in urban systems include:
In addition, riparian alteration can affect nitrogen uptake and cycling, and turn urban riparian areas into nitrogen sources (Groffman et al. 2002, 2003).
Courtesy of USEPA
URBANIZATION
Water / Sediment Quality Temperature Hydrology Physical Habitat Energy Sources
Riparian / Channel Alteration Wastewater Inputs Stormwater Runoff
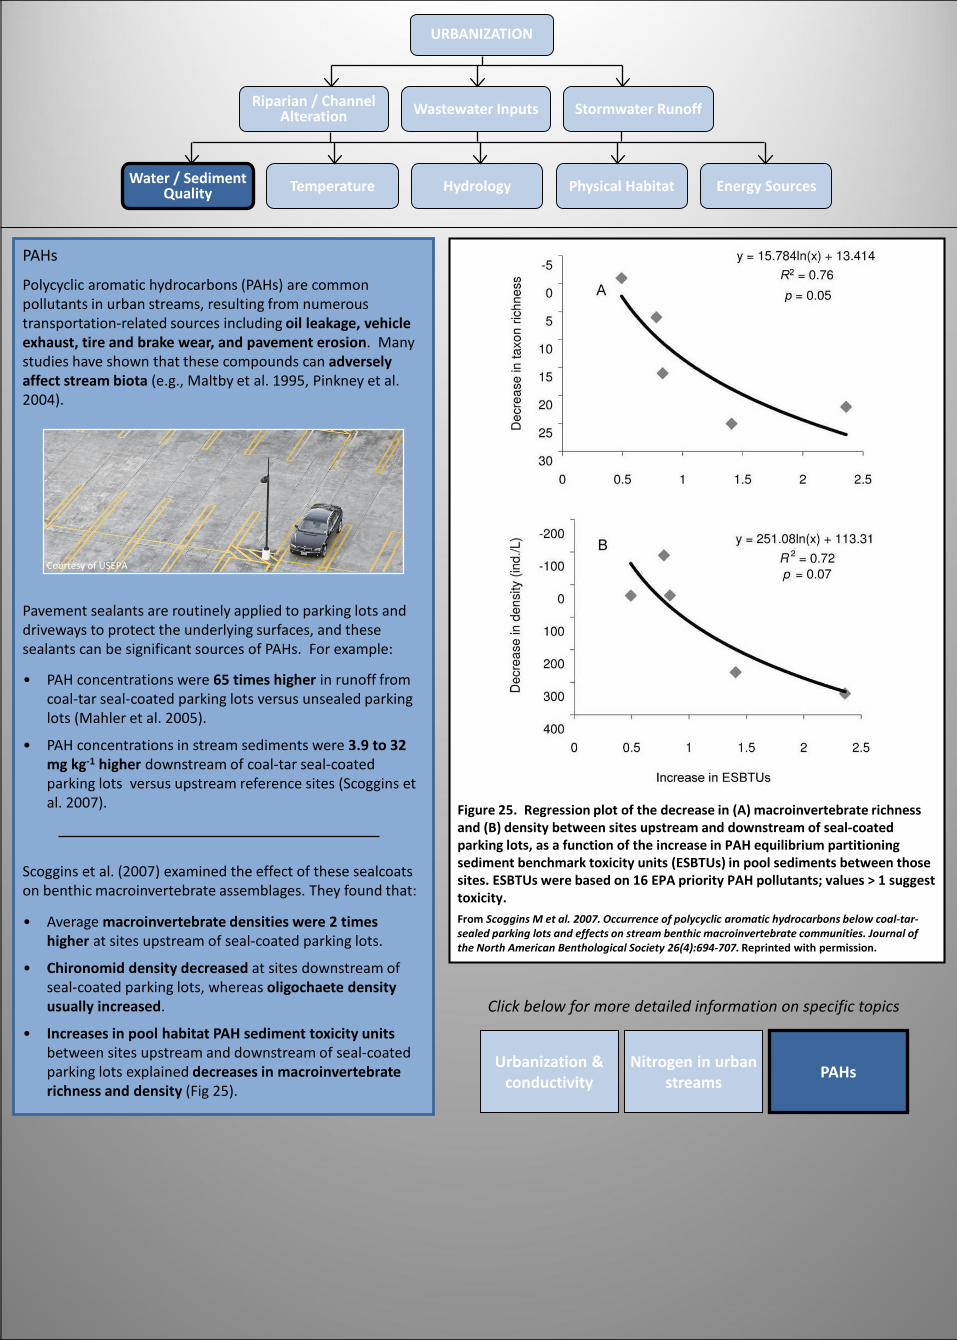
Figure 25. Regression plot of the decrease in (A) macroinvertebrate richness and (B) density between sites upstream and downstream of seal-coated parking lots, as a function of the increase in PAH equilibrium partitioning sediment benchmark toxicity units (ESBTUs) in pool sediments between those sites. ESBTUs were based on 16 EPA priority PAH pollutants; values > 1 suggest toxicity.From Scoggins M et al. 2007. Occurrence of polycyclic aromatic hydrocarbons below coal-tar-sealed parking lots and effects on stream benthic macroinvertebrate communities. Journal of the North American Benthological Society 26(4):694-707. Reprinted with permission.
Click below for more detailed information on specific topics
Urbanization & conductivity
Nitrogen in urban streams PAHs
Polycyclic aromatic hydrocarbons (PAHs) are common pollutants in urban streams, resulting from numerous transportation-related sources including oil leakage, vehicle exhaust, tire and brake wear, and pavement erosion. Many studies have shown that these compounds can adversely affect stream biota (e.g., Maltby et al. 1995, Pinkney et al. 2004).
PAHs
• PAH concentrations were 65 times higher in runoff from coal-tar seal-coated parking lots versus unsealed parking lots (Mahler et al. 2005).
• PAH concentrations in stream sediments were 3.9 to 32 mg kg-1 higher downstream of coal-tar seal-coated parking lots versus upstream reference sites (Scoggins et al. 2007).
Pavement sealants are routinely applied to parking lots and driveways to protect the underlying surfaces, and these sealants can be significant sources of PAHs. For example:
Scoggins et al. (2007) examined the effect of these sealcoats on benthic macroinvertebrate assemblages. They found that:
• Average macroinvertebrate densities were 2 times higher at sites upstream of seal-coated parking lots.
• Chironomid density decreased at sites downstream of seal-coated parking lots, whereas oligochaete density usually increased.
• Increases in pool habitat PAH sediment toxicity unitsbetween sites upstream and downstream of seal-coated parking lots explained decreases in macroinvertebrate richness and density (Fig 25).
Courtesy of USEPA
URBANIZATION
Water / Sediment Quality Temperature Hydrology Physical Habitat Energy Sources
Riparian / Channel Alteration Wastewater Inputs Stormwater Runoff
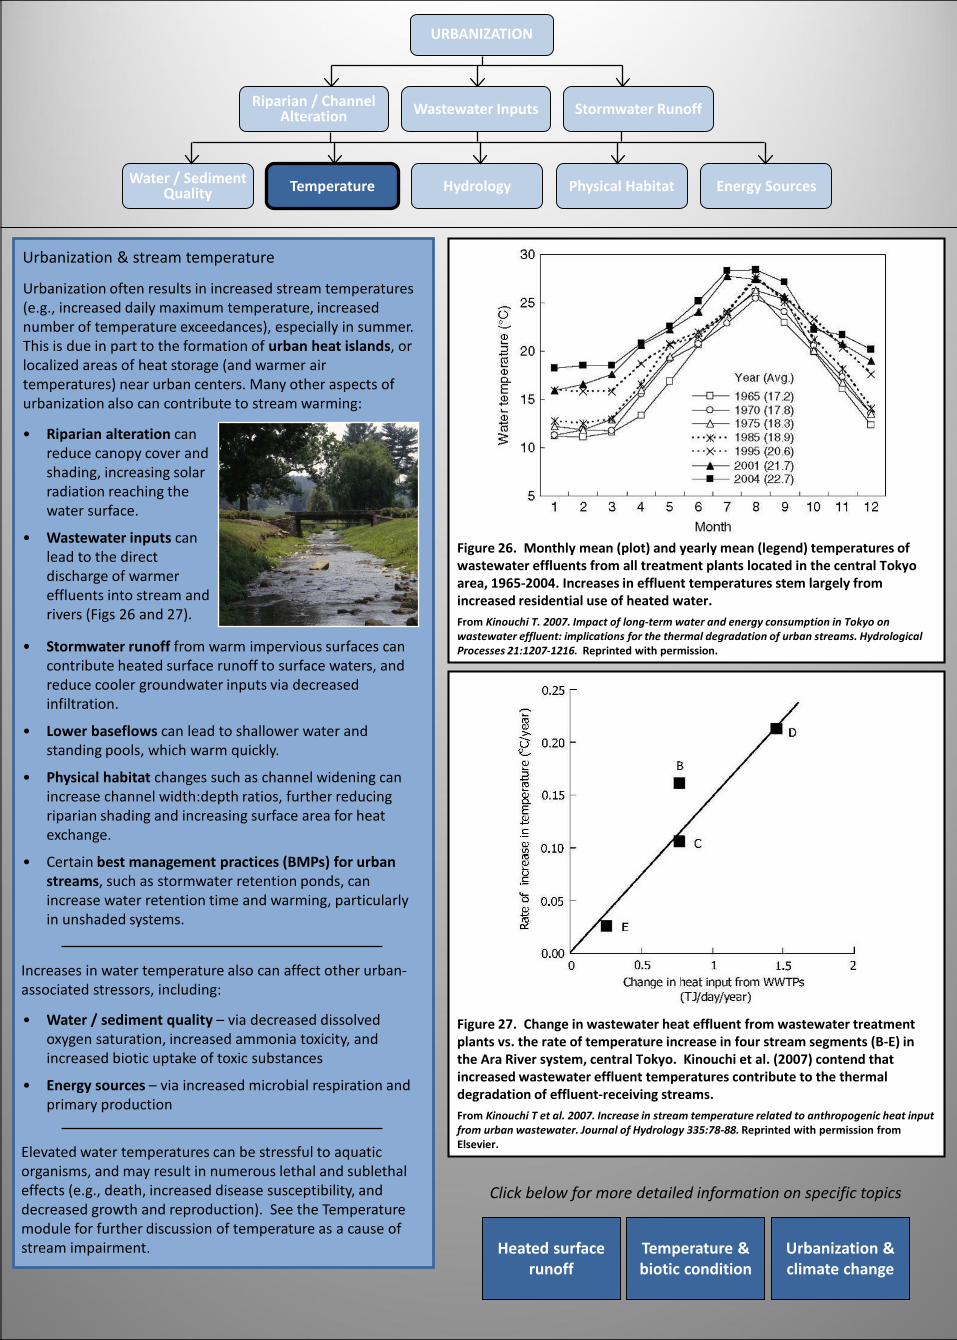
Figure 26. Monthly mean (plot) and yearly mean (legend) temperatures of wastewater effluents from all treatment plants located in the central Tokyo area, 1965-2004. Increases in effluent temperatures stem largely from increased residential use of heated water. From Kinouchi T. 2007. Impact of long-term water and energy consumption in Tokyo on wastewater effluent: implications for the thermal degradation of urban streams. Hydrological Processes 21:1207-1216. Reprinted with permission.
Figure 27. Change in wastewater heat effluent from wastewater treatment plants vs. the rate of temperature increase in four stream segments (B-E) in the Ara River system, central Tokyo. Kinouchi et al. (2007) contend that increased wastewater effluent temperatures contribute to the thermal degradation of effluent-receiving streams.From Kinouchi T et al. 2007. Increase in stream temperature related to anthropogenic heat input from urban wastewater. Journal of Hydrology 335:78-88. Reprinted with permission from Elsevier.
Urbanization & stream temperature
• Stormwater runoff from warm impervious surfaces can contribute heated surface runoff to surface waters, and reduce cooler groundwater inputs via decreased infiltration.
• Lower baseflows can lead to shallower water and standing pools, which warm quickly.
• Physical habitat changes such as channel widening can increase channel width:depth ratios, further reducing riparian shading and increasing surface area for heat exchange.
• Certain best management practices (BMPs) for urban streams, such as stormwater retention ponds, can increase water retention time and warming, particularly in unshaded systems.
Urbanization often results in increased stream temperatures (e.g., increased daily maximum temperature, increased number of temperature exceedances), especially in summer. This is due in part to the formation of urban heat islands, or localized areas of heat storage (and warmer air temperatures) near urban centers. Many other aspects of urbanization also can contribute to stream warming:
• Riparian alteration can reduce canopy cover and shading, increasing solar radiation reaching the water surface.
• Wastewater inputs can lead to the direct discharge of warmer effluents into stream and rivers (Figs 26 and 27).
Click below for more detailed information on specific topics
Heated surface runoff
Temperature & biotic condition
Urbanization & climate change
• Water / sediment quality – via decreased dissolved oxygen saturation, increased ammonia toxicity, and increased biotic uptake of toxic substances
• Energy sources – via increased microbial respiration and primary production
Increases in water temperature also can affect other urban-associated stressors, including:
Elevated water temperatures can be stressful to aquatic organisms, and may result in numerous lethal and sublethal effects (e.g., death, increased disease susceptibility, and decreased growth and reproduction). See the Temperature module for further discussion of temperature as a cause of stream impairment.
URBANIZATION
Water / Sediment Quality Temperature Hydrology Physical Habitat Energy Sources
Riparian / Channel Alteration Wastewater Inputs Stormwater Runoff
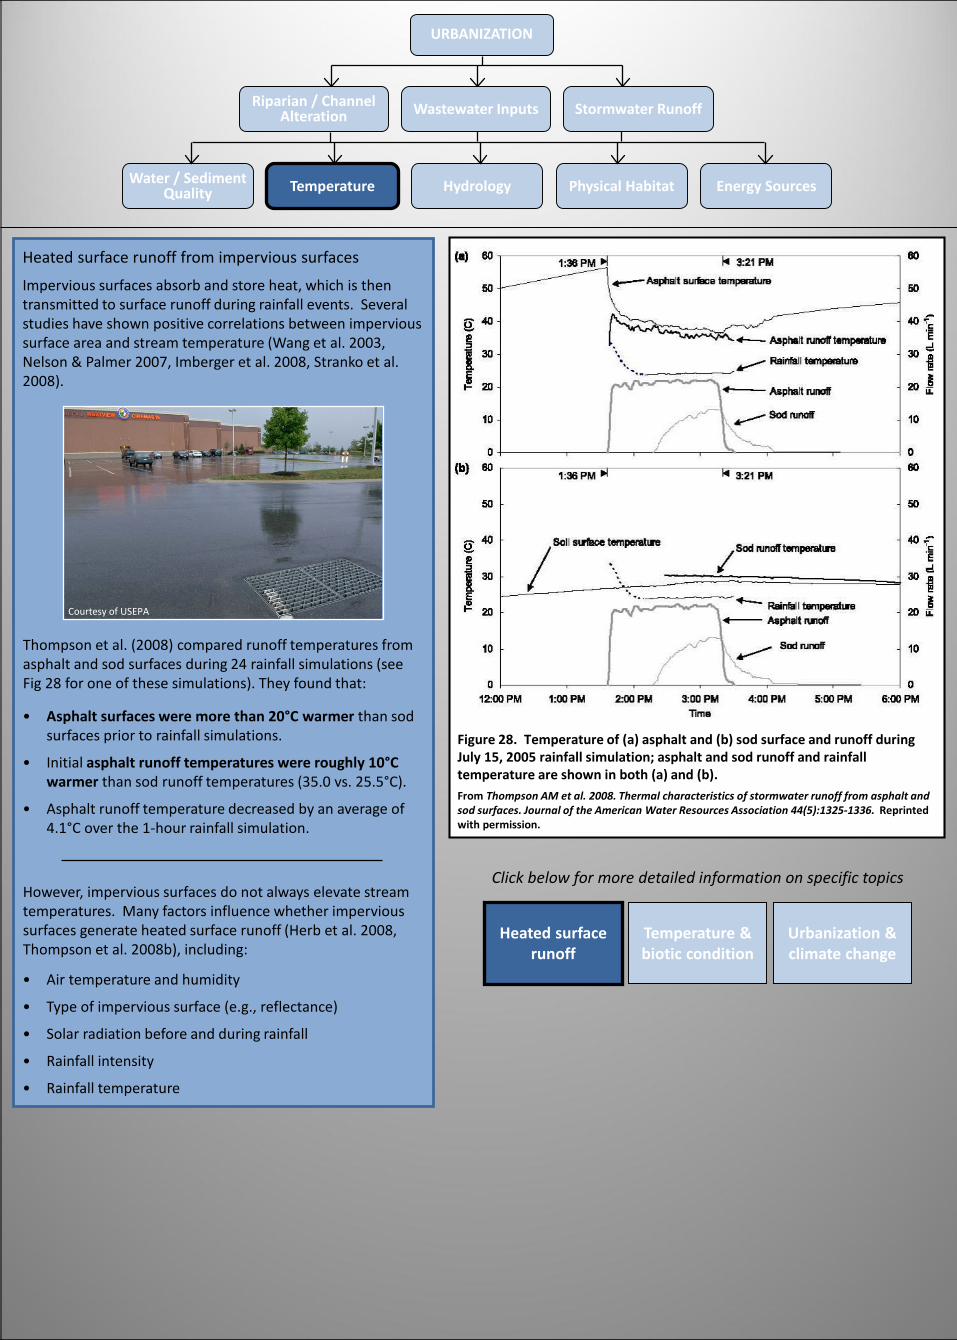
Figure 28. Temperature of (a) asphalt and (b) sod surface and runoff during July 15, 2005 rainfall simulation; asphalt and sod runoff and rainfall temperature are shown in both (a) and (b). From Thompson AM et al. 2008. Thermal characteristics of stormwater runoff from asphalt and sod surfaces. Journal of the American Water Resources Association 44(5):1325-1336. Reprinted with permission.
Click below for more detailed information on specific topics
Heated surface runoff
Temperature & biotic condition
Urbanization & climate change
Heated surface runoff from impervious surfaces
Impervious surfaces absorb and store heat, which is then transmitted to surface runoff during rainfall events. Several studies have shown positive correlations between impervious surface area and stream temperature (Wang et al. 2003, Nelson & Palmer 2007, Imberger et al. 2008, Stranko et al. 2008).
• Air temperature and humidity
• Type of impervious surface (e.g., reflectance)
• Solar radiation before and during rainfall
• Rainfall intensity
• Rainfall temperature
However, impervious surfaces do not always elevate stream temperatures. Many factors influence whether impervious surfaces generate heated surface runoff (Herb et al. 2008, Thompson et al. 2008b), including:
Thompson et al. (2008) compared runoff temperatures from asphalt and sod surfaces during 24 rainfall simulations (see Fig 28 for one of these simulations). They found that:
• Asphalt surfaces were more than 20°C warmer than sod surfaces prior to rainfall simulations.
• Initial asphalt runoff temperatures were roughly 10°C warmer than sod runoff temperatures (35.0 vs. 25.5°C).
• Asphalt runoff temperature decreased by an average of 4.1°C over the 1-hour rainfall simulation.
Courtesy of USEPA
URBANIZATION
Water / Sediment Quality Temperature Hydrology Physical Habitat Energy Sources
Riparian / Channel Alteration Wastewater Inputs Stormwater Runoff
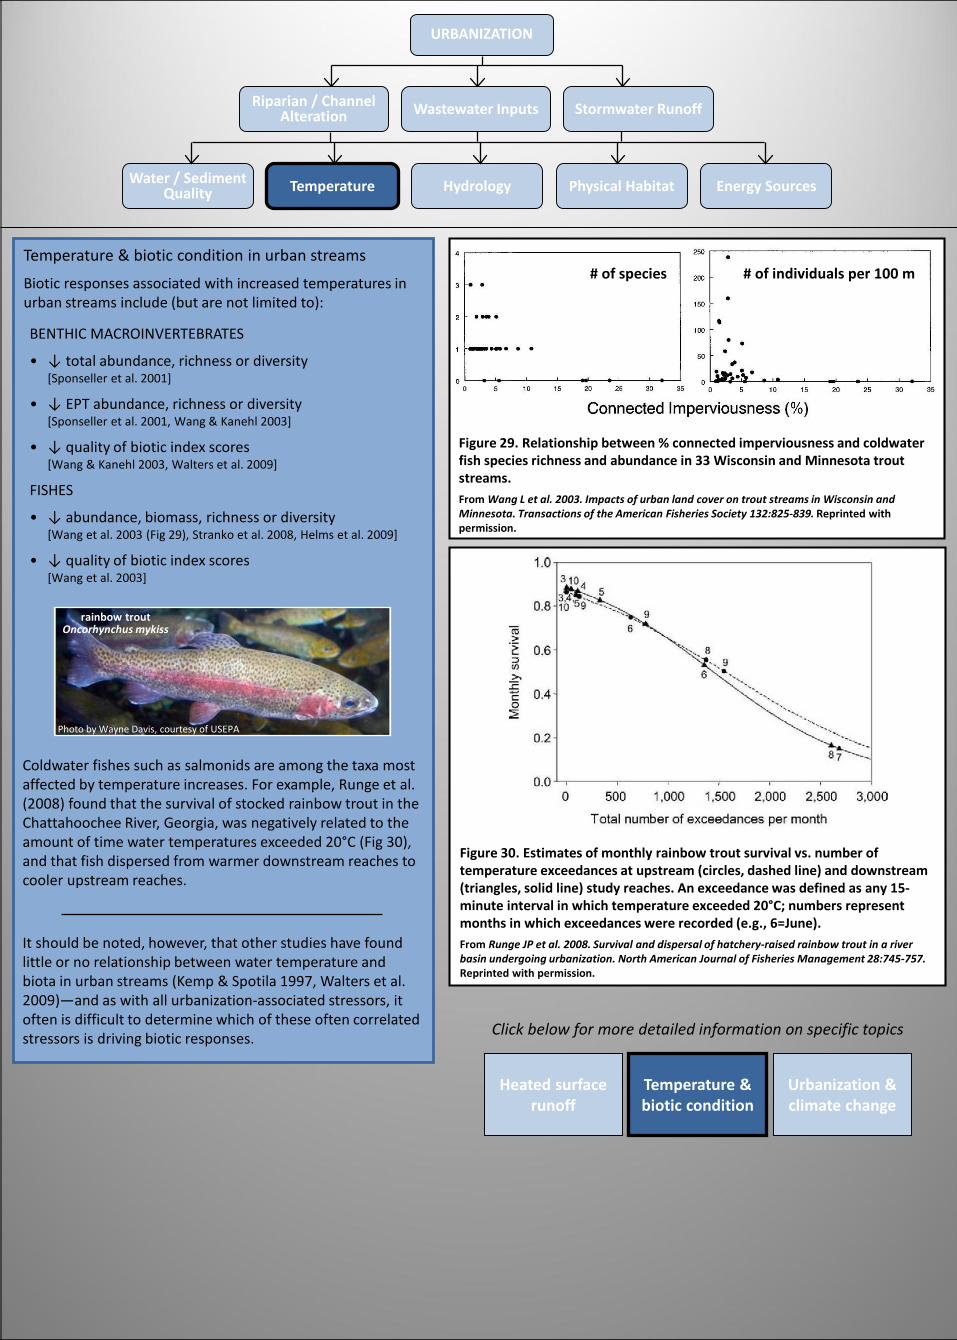
Figure 30. Estimates of monthly rainbow trout survival vs. number of temperature exceedances at upstream (circles, dashed line) and downstream (triangles, solid line) study reaches. An exceedance was defined as any 15-minute interval in which temperature exceeded 20°C; numbers represent months in which exceedances were recorded (e.g., 6=June). From Runge JP et al. 2008. Survival and dispersal of hatchery-raised rainbow trout in a river basin undergoing urbanization. North American Journal of Fisheries Management 28:745-757. Reprinted with permission.
# of species # of individuals per 100 m
Figure 29. Relationship between % connected imperviousness and coldwater fish species richness and abundance in 33 Wisconsin and Minnesota trout streams. From Wang L et al. 2003. Impacts of urban land cover on trout streams in Wisconsin and Minnesota. Transactions of the American Fisheries Society 132:825-839. Reprinted with permission.
Click below for more detailed information on specific topics
Heated surface runoff
Temperature & biotic condition
Urbanization & climate change
Temperature & biotic condition in urban streams
Biotic responses associated with increased temperatures in urban streams include (but are not limited to):
BENTHIC MACROINVERTEBRATES
• ↓ total abundance, richness or diversity[Sponseller et al. 2001]
• ↓ EPT abundance, richness or diversity [Sponseller et al. 2001, Wang & Kanehl 2003]
• ↓ quality of biotic index scores[Wang & Kanehl 2003, Walters et al. 2009]
FISHES
• ↓ abundance, biomass, richness or diversity[Wang et al. 2003 (Fig 29), Stranko et al. 2008, Helms et al. 2009]
• ↓ quality of biotic index scores[Wang et al. 2003]
It should be noted, however, that other studies have found little or no relationship between water temperature and biota in urban streams (Kemp & Spotila 1997, Walters et al. 2009)—and as with all urbanization-associated stressors, it often is difficult to determine which of these often correlated stressors is driving biotic responses.
Coldwater fishes such as salmonids are among the taxa most affected by temperature increases. For example, Runge et al. (2008) found that the survival of stocked rainbow trout in the Chattahoochee River, Georgia, was negatively related to the amount of time water temperatures exceeded 20°C (Fig 30), and that fish dispersed from warmer downstream reaches to cooler upstream reaches.
rainbow troutOncorhynchus mykiss
Photo by Wayne Davis, courtesy of USEPA
URBANIZATION
Water / Sediment Quality Temperature Hydrology Physical Habitat Energy Sources
Riparian / Channel Alteration Wastewater Inputs Stormwater Runoff
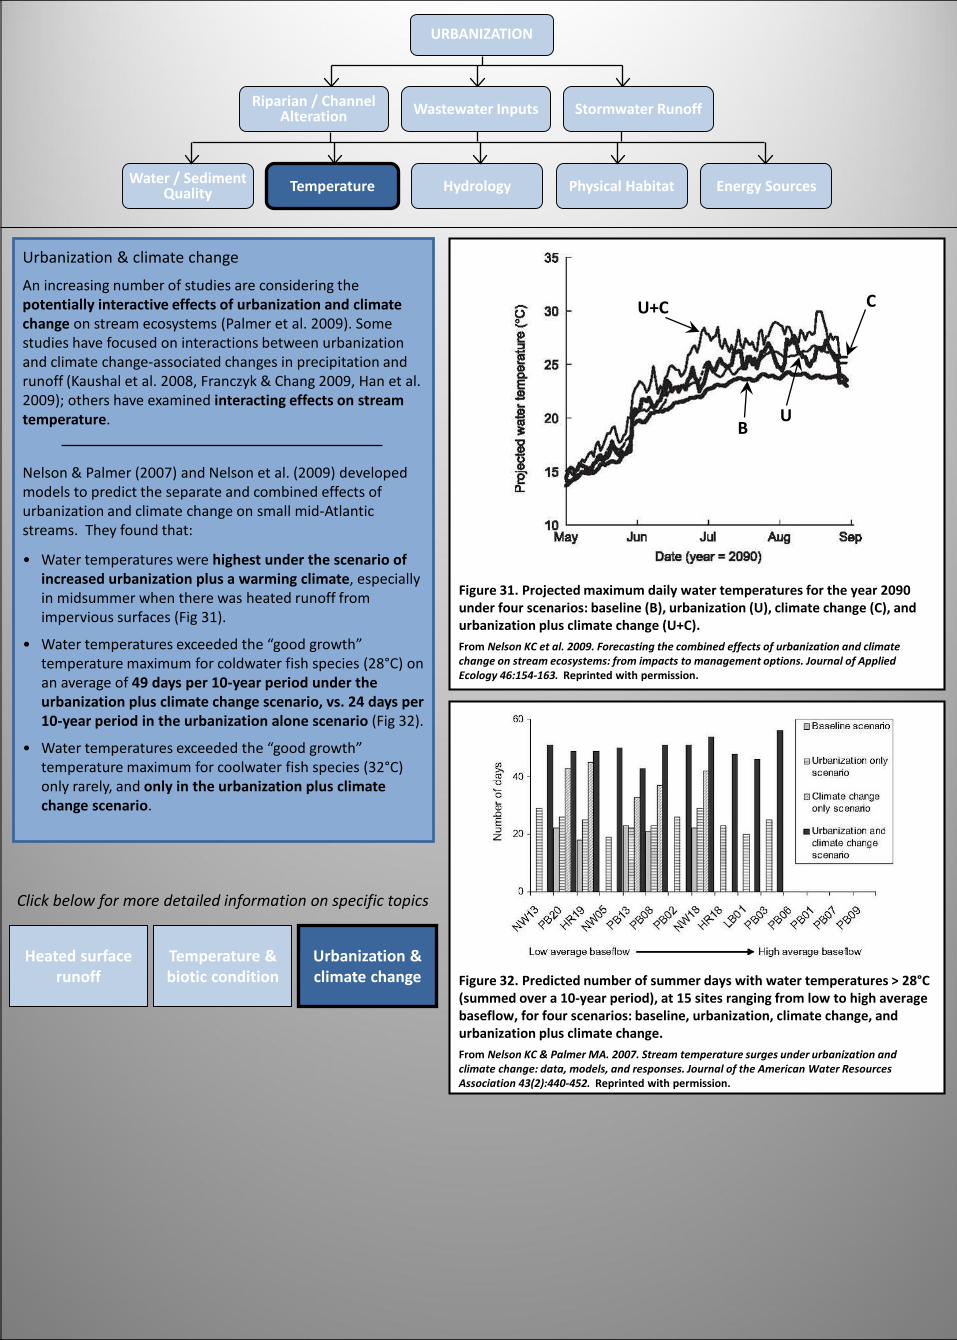
Figure 31. Projected maximum daily water temperatures for the year 2090 under four scenarios: baseline (B), urbanization (U), climate change (C), and urbanization plus climate change (U+C). From Nelson KC et al. 2009. Forecasting the combined effects of urbanization and climate change on stream ecosystems: from impacts to management options. Journal of Applied Ecology 46:154-163. Reprinted with permission.
B
U+C
U
C
Figure 32. Predicted number of summer days with water temperatures > 28°C (summed over a 10-year period), at 15 sites ranging from low to high average baseflow, for four scenarios: baseline, urbanization, climate change, and urbanization plus climate change. From Nelson KC & Palmer MA. 2007. Stream temperature surges under urbanization and climate change: data, models, and responses. Journal of the American Water Resources Association 43(2):440-452. Reprinted with permission.
Urbanization & climate change
An increasing number of studies are considering the potentially interactive effects of urbanization and climate change on stream ecosystems (Palmer et al. 2009). Some studies have focused on interactions between urbanization and climate change-associated changes in precipitation and runoff (Kaushal et al. 2008, Franczyk & Chang 2009, Han et al. 2009); others have examined interacting effects on stream temperature.
Nelson & Palmer (2007) and Nelson et al. (2009) developed models to predict the separate and combined effects of urbanization and climate change on small mid-Atlantic streams. They found that:
• Water temperatures were highest under the scenario of increased urbanization plus a warming climate, especially in midsummer when there was heated runoff from impervious surfaces (Fig 31).
• Water temperatures exceeded the “good growth” temperature maximum for coldwater fish species (28°C) on an average of 49 days per 10-year period under the urbanization plus climate change scenario, vs. 24 days per 10-year period in the urbanization alone scenario (Fig 32).
• Water temperatures exceeded the “good growth” temperature maximum for coolwater fish species (32°C) only rarely, and only in the urbanization plus climate change scenario.
Click below for more detailed information on specific topics
Heated surface runoff
Temperature & biotic condition
Urbanization & climate change
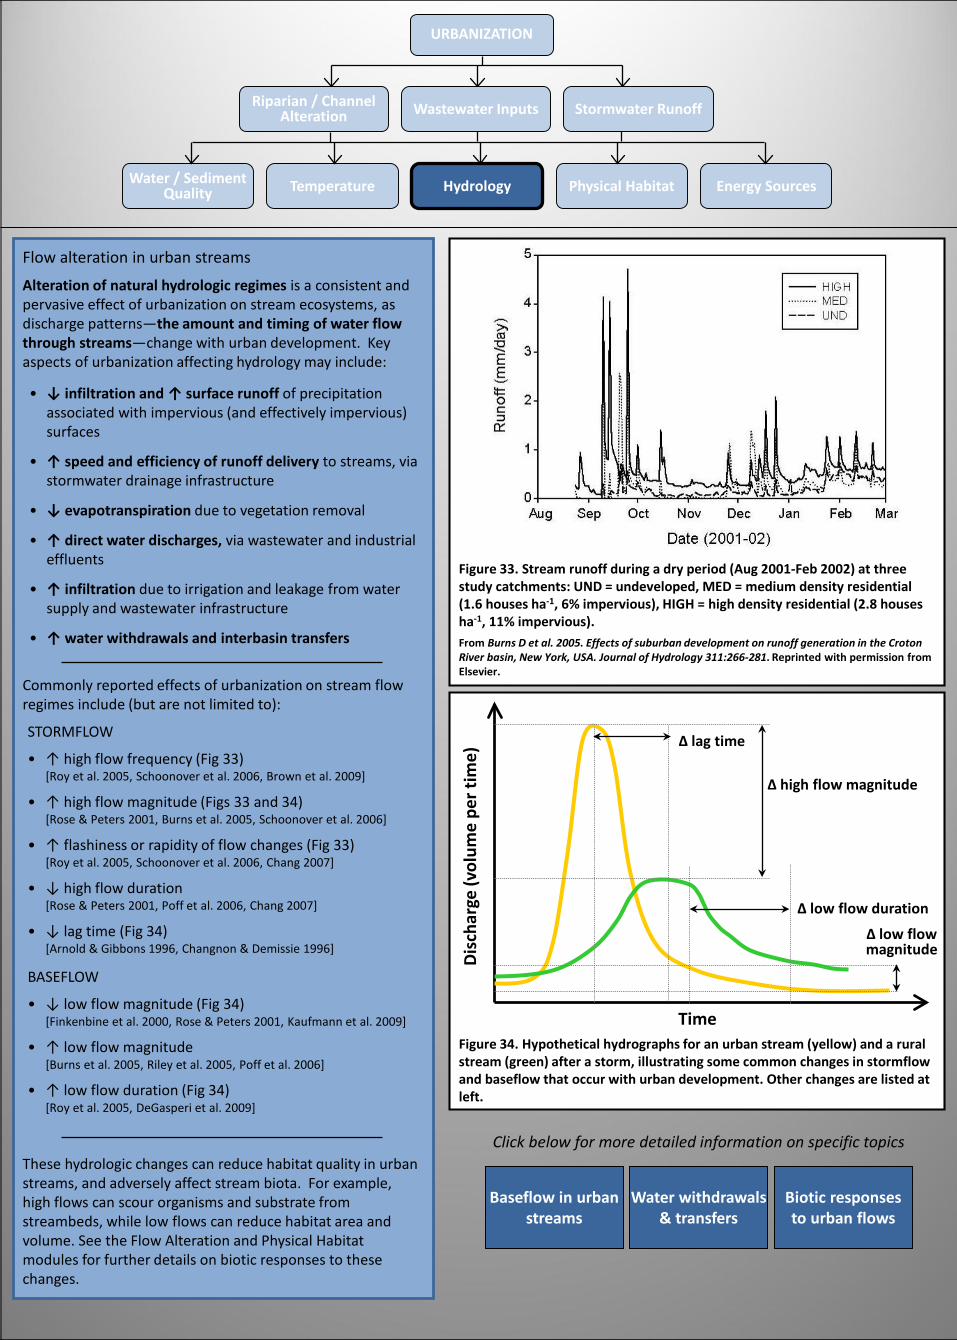
Figure 34. Hypothetical hydrographs for an urban stream (yellow) and a rural stream (green) after a storm, illustrating some common changes in stormflow and baseflow that occur with urban development. Other changes are listed at left.
Disc
harg
e (v
olum
e pe
r tim
e)
Time
Δ high flow magnitude
Δ low flow magnitude
Δ lag time
Δ low flow duration
Figure 33. Stream runoff during a dry period (Aug 2001-Feb 2002) at three study catchments: UND = undeveloped, MED = medium density residential (1.6 houses ha-1, 6% impervious), HIGH = high density residential (2.8 houses ha-1, 11% impervious). From Burns D et al. 2005. Effects of suburban development on runoff generation in the Croton River basin, New York, USA. Journal of Hydrology 311:266-281. Reprinted with permission from Elsevier.
Click below for more detailed information on specific topics
Baseflow in urban streams
Water withdrawals & transfers
Biotic responses to urban flows
URBANIZATION
Water / Sediment Quality Temperature Hydrology Physical Habitat Energy Sources
Riparian / Channel Alteration Wastewater Inputs Stormwater Runoff
Flow alteration in urban streams
Alteration of natural hydrologic regimes is a consistent and pervasive effect of urbanization on stream ecosystems, as discharge patterns—the amount and timing of water flowthrough streams—change with urban development. Key aspects of urbanization affecting hydrology may include:
Commonly reported effects of urbanization on stream flow regimes include (but are not limited to):
STORMFLOW
• ↑ high flow frequency (Fig 33)[Roy et al. 2005, Schoonover et al. 2006, Brown et al. 2009]
• ↑ high flow magnitude (Figs 33 and 34)[Rose & Peters 2001, Burns et al. 2005, Schoonover et al. 2006]
• ↑ flashiness or rapidity of flow changes (Fig 33)[Roy et al. 2005, Schoonover et al. 2006, Chang 2007]
• ↓ high flow duration[Rose & Peters 2001, Poff et al. 2006, Chang 2007]
• ↓ lag time (Fig 34)[Arnold & Gibbons 1996, Changnon & Demissie 1996]
BASEFLOW
• ↓ low flow magnitude (Fig 34)[Finkenbine et al. 2000, Rose & Peters 2001, Kaufmann et al. 2009]
• ↑ low flow magnitude [Burns et al. 2005, Riley et al. 2005, Poff et al. 2006]
• ↑ low flow duration (Fig 34)[Roy et al. 2005, DeGasperi et al. 2009]
• ↓ infiltration and ↑ surface runoff of precipitation associated with impervious (and effectively impervious) surfaces
• ↑ speed and efficiency of runoff delivery to streams, via stormwater drainage infrastructure
• ↓ evapotranspiration due to vegetation removal
• ↑ direct water discharges, via wastewater and industrial effluents
• ↑ infiltration due to irrigation and leakage from water supply and wastewater infrastructure
• ↑ water withdrawals and interbasin transfers
These hydrologic changes can reduce habitat quality in urban streams, and adversely affect stream biota. For example, high flows can scour organisms and substrate from streambeds, while low flows can reduce habitat area and volume. See the Flow Alteration and Physical Habitat modules for further details on biotic responses to these changes.
URBANIZATION
Water / Sediment Quality Temperature Hydrology Physical Habitat Energy Sources
Riparian / Channel Alteration Wastewater Inputs Stormwater Runoff
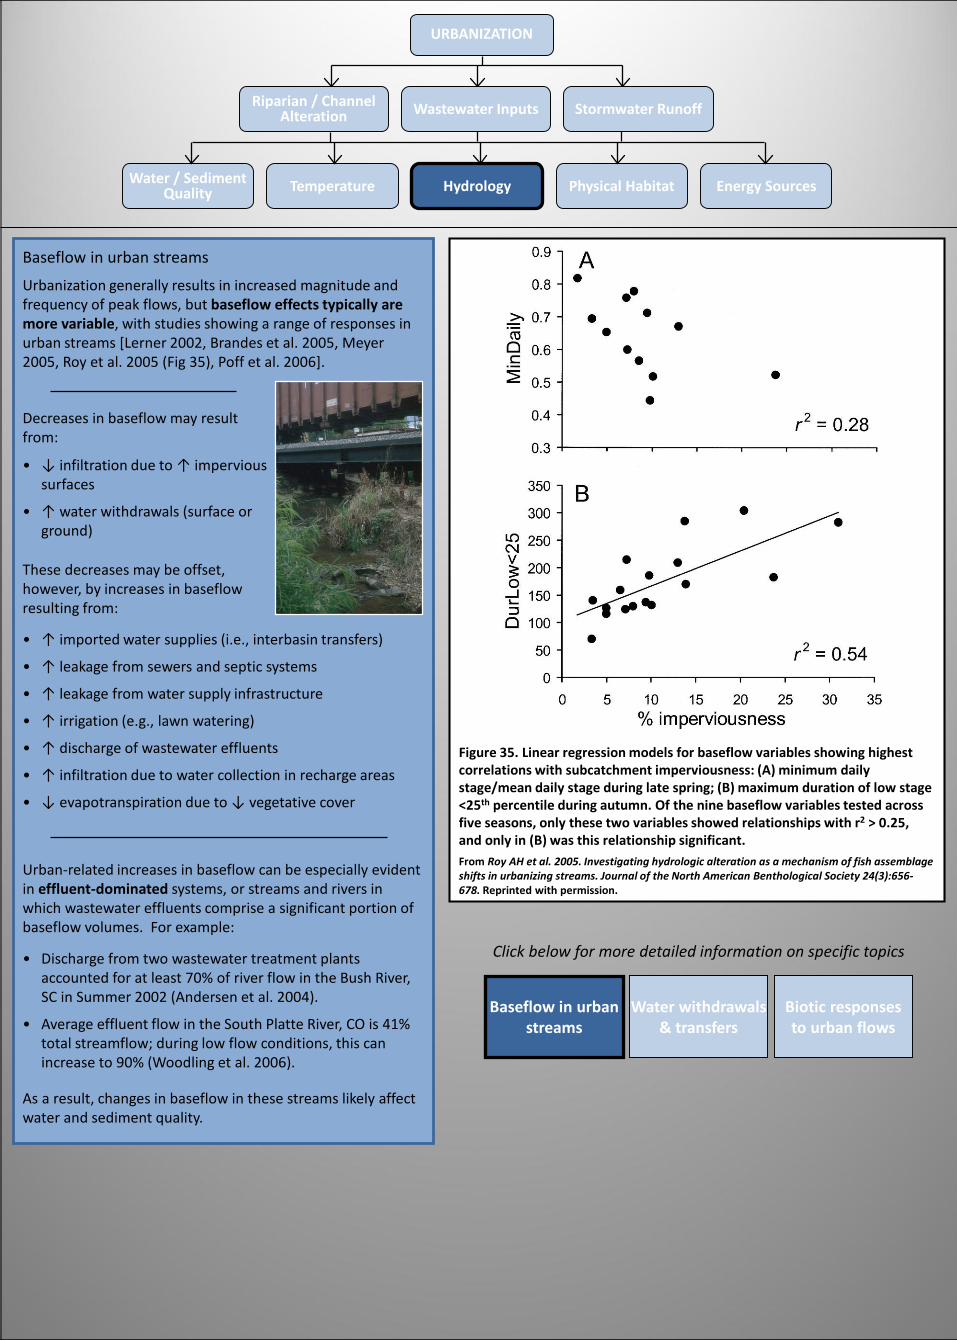
Figure 35. Linear regression models for baseflow variables showing highest correlations with subcatchment imperviousness: (A) minimum daily stage/mean daily stage during late spring; (B) maximum duration of low stage <25th percentile during autumn. Of the nine baseflow variables tested across five seasons, only these two variables showed relationships with r2 > 0.25, and only in (B) was this relationship significant.From Roy AH et al. 2005. Investigating hydrologic alteration as a mechanism of fish assemblage shifts in urbanizing streams. Journal of the North American Benthological Society 24(3):656-678. Reprinted with permission.
Baseflow in urban streams
Urbanization generally results in increased magnitude and frequency of peak flows, but baseflow effects typically are more variable, with studies showing a range of responses in urban streams [Lerner 2002, Brandes et al. 2005, Meyer 2005, Roy et al. 2005 (Fig 35), Poff et al. 2006].
• ↑ imported water supplies (i.e., interbasin transfers)
• ↑ leakage from sewers and septic systems
• ↑ leakage from water supply infrastructure
• ↑ irrigation (e.g., lawn watering)
• ↑ discharge of wastewater effluents
• ↑ infiltration due to water collection in recharge areas
• ↓ evapotranspiration due to ↓ vegetative cover
These decreases may be offset, however, by increases in baseflow resulting from:
• ↓ infiltration due to ↑ impervious surfaces
• ↑ water withdrawals (surface or ground)
Decreases in baseflow may result from:
Urban-related increases in baseflow can be especially evident in effluent-dominated systems, or streams and rivers in which wastewater effluents comprise a significant portion of baseflow volumes. For example:
• Discharge from two wastewater treatment plants accounted for at least 70% of river flow in the Bush River, SC in Summer 2002 (Andersen et al. 2004).
• Average effluent flow in the South Platte River, CO is 41% total streamflow; during low flow conditions, this can increase to 90% (Woodling et al. 2006).
As a result, changes in baseflow in these streams likely affect water and sediment quality.
Click below for more detailed information on specific topics
Baseflow in urban streams
Water withdrawals & transfers
Biotic responses to urban flows
URBANIZATION
Water / Sediment Quality Temperature Hydrology Physical Habitat Energy Sources
Riparian / Channel Alteration Wastewater Inputs Stormwater Runoff
Water withdrawals & transfers
Water withdrawals and transfers associated with meeting urban water demand can have significant repercussions for stream systems. Their effects depend upon many factors, including:
Click below for more detailed information on specific topics
Baseflow in urban streams
Water withdrawals & transfers
Biotic responses to urban flows
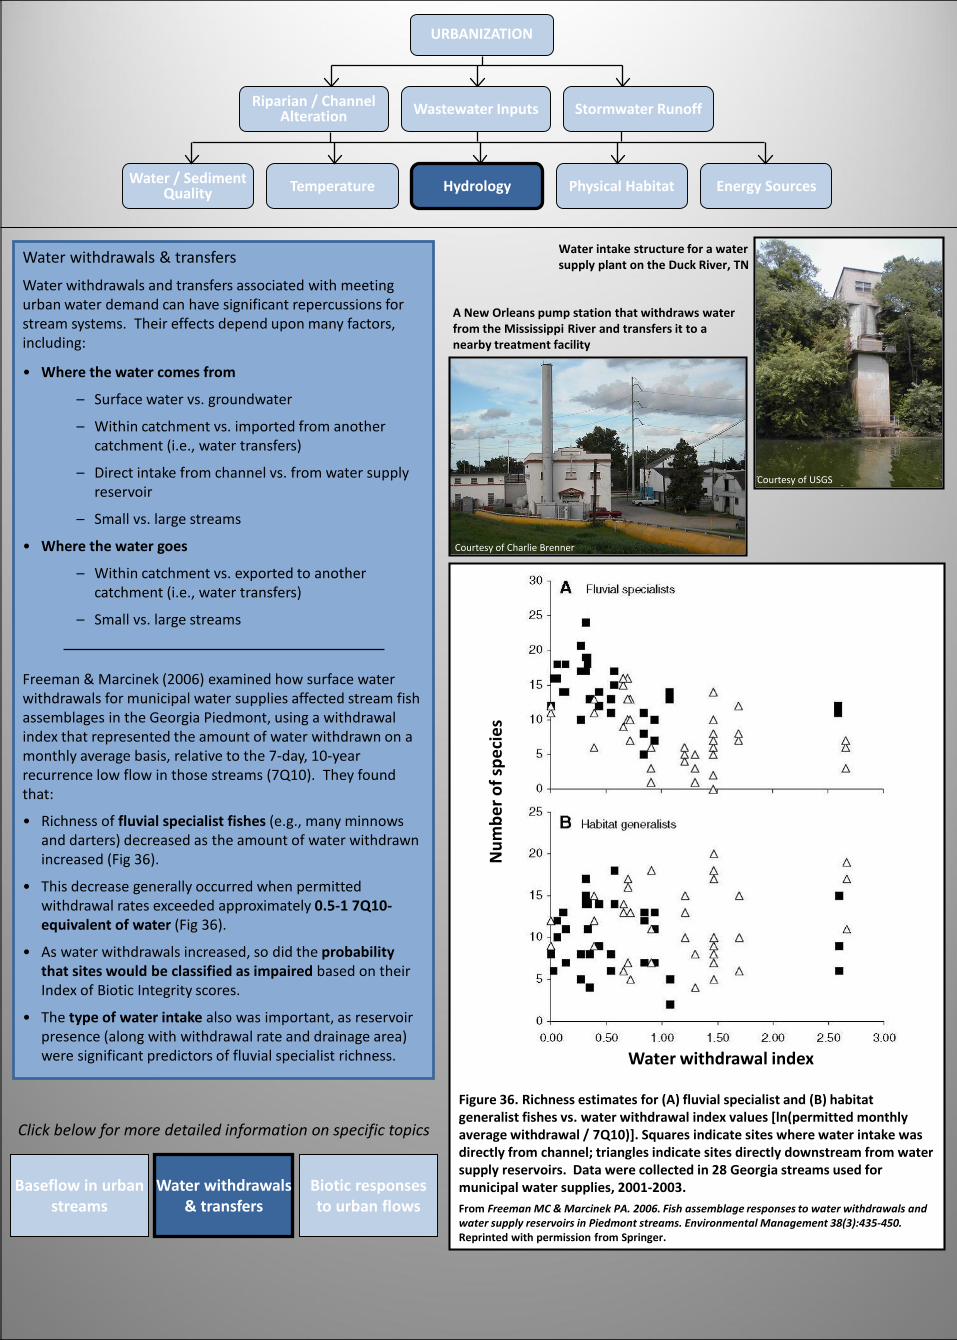
Figure 36. Richness estimates for (A) fluvial specialist and (B) habitat generalist fishes vs. water withdrawal index values [ln(permitted monthly average withdrawal / 7Q10)]. Squares indicate sites where water intake was directly from channel; triangles indicate sites directly downstream from water supply reservoirs. Data were collected in 28 Georgia streams used for municipal water supplies, 2001-2003. From Freeman MC & Marcinek PA. 2006. Fish assemblage responses to water withdrawals and water supply reservoirs in Piedmont streams. Environmental Management 38(3):435-450. Reprinted with permission from Springer.
Num
ber o
f spe
cies
Water withdrawal index
• Richness of fluvial specialist fishes (e.g., many minnows and darters) decreased as the amount of water withdrawn increased (Fig 36).
• This decrease generally occurred when permitted withdrawal rates exceeded approximately 0.5-1 7Q10-equivalent of water (Fig 36).
• As water withdrawals increased, so did the probability that sites would be classified as impaired based on their Index of Biotic Integrity scores.
• The type of water intake also was important, as reservoir presence (along with withdrawal rate and drainage area) were significant predictors of fluvial specialist richness.
Freeman & Marcinek (2006) examined how surface water withdrawals for municipal water supplies affected stream fish assemblages in the Georgia Piedmont, using a withdrawal index that represented the amount of water withdrawn on a monthly average basis, relative to the 7-day, 10-year recurrence low flow in those streams (7Q10). They found that:
• Where the water comes from
– Surface water vs. groundwater
– Within catchment vs. imported from another catchment (i.e., water transfers)
– Direct intake from channel vs. from water supply reservoir
– Small vs. large streams
• Where the water goes
– Within catchment vs. exported to another catchment (i.e., water transfers)
– Small vs. large streams
A New Orleans pump station that withdraws water from the Mississippi River and transfers it to a nearby treatment facility
Courtesy of Charlie Brenner
Water intake structure for a water supply plant on the Duck River, TN
Courtesy of USGS
URBANIZATION
Water / Sediment Quality Temperature Hydrology Physical Habitat Energy Sources
Riparian / Channel Alteration Wastewater Inputs Stormwater Runoff
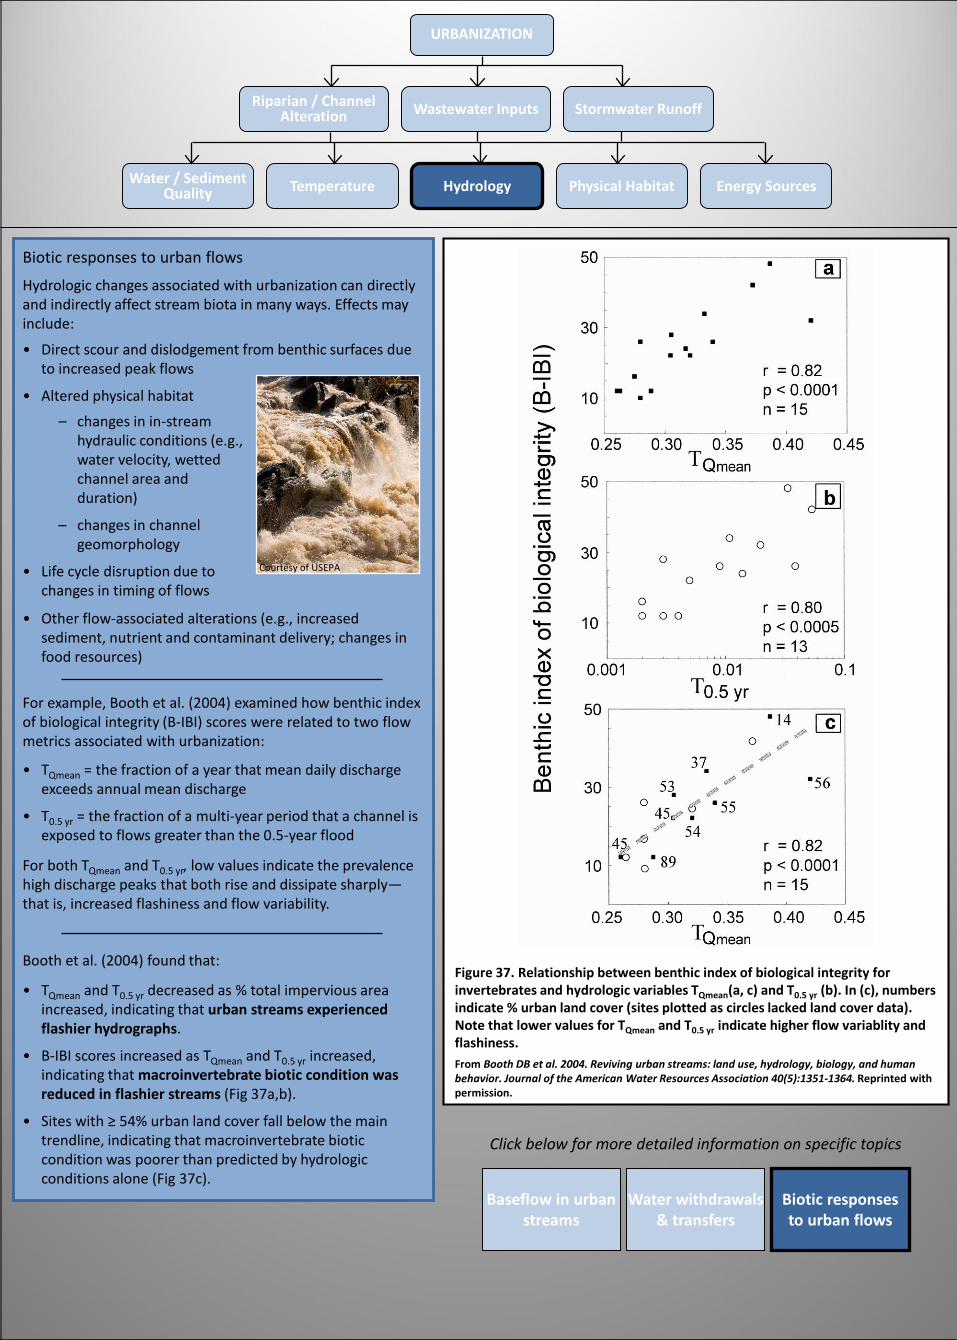
Figure 37. Relationship between benthic index of biological integrity for invertebrates and hydrologic variables TQmean(a, c) and T0.5 yr (b). In (c), numbers indicate % urban land cover (sites plotted as circles lacked land cover data). Note that lower values for TQmean and T0.5 yr indicate higher flow variablity and flashiness.From Booth DB et al. 2004. Reviving urban streams: land use, hydrology, biology, and human behavior. Journal of the American Water Resources Association 40(5):1351-1364. Reprinted with permission.
Biotic responses to urban flows
Hydrologic changes associated with urbanization can directly and indirectly affect stream biota in many ways. Effects may include:
Booth et al. (2004) found that:
• TQmean and T0.5 yr decreased as % total impervious area increased, indicating that urban streams experienced flashier hydrographs.
• B-IBI scores increased as TQmean and T0.5 yr increased, indicating that macroinvertebrate biotic condition was reduced in flashier streams (Fig 37a,b).
• Sites with ≥ 54% urban land cover fall below the main trendline, indicating that macroinvertebrate biotic condition was poorer than predicted by hydrologic conditions alone (Fig 37c).
• Other flow-associated alterations (e.g., increased sediment, nutrient and contaminant delivery; changes in food resources)
• Direct scour and dislodgement from benthic surfaces due to increased peak flows
• Altered physical habitat
– changes in in-stream hydraulic conditions (e.g., water velocity, wetted channel area and duration)
– changes in channel geomorphology
• Life cycle disruption due to changes in timing of flows
Click below for more detailed information on specific topics
Baseflow in urban streams
Water withdrawals & transfers
Biotic responses to urban flows
Courtesy of USEPA
For example, Booth et al. (2004) examined how benthic index of biological integrity (B-IBI) scores were related to two flow metrics associated with urbanization:
• TQmean = the fraction of a year that mean daily discharge exceeds annual mean discharge
• T0.5 yr = the fraction of a multi-year period that a channel is exposed to flows greater than the 0.5-year flood
For both TQmean and T0.5 yr, low values indicate the prevalence high discharge peaks that both rise and dissipate sharply—that is, increased flashiness and flow variability.
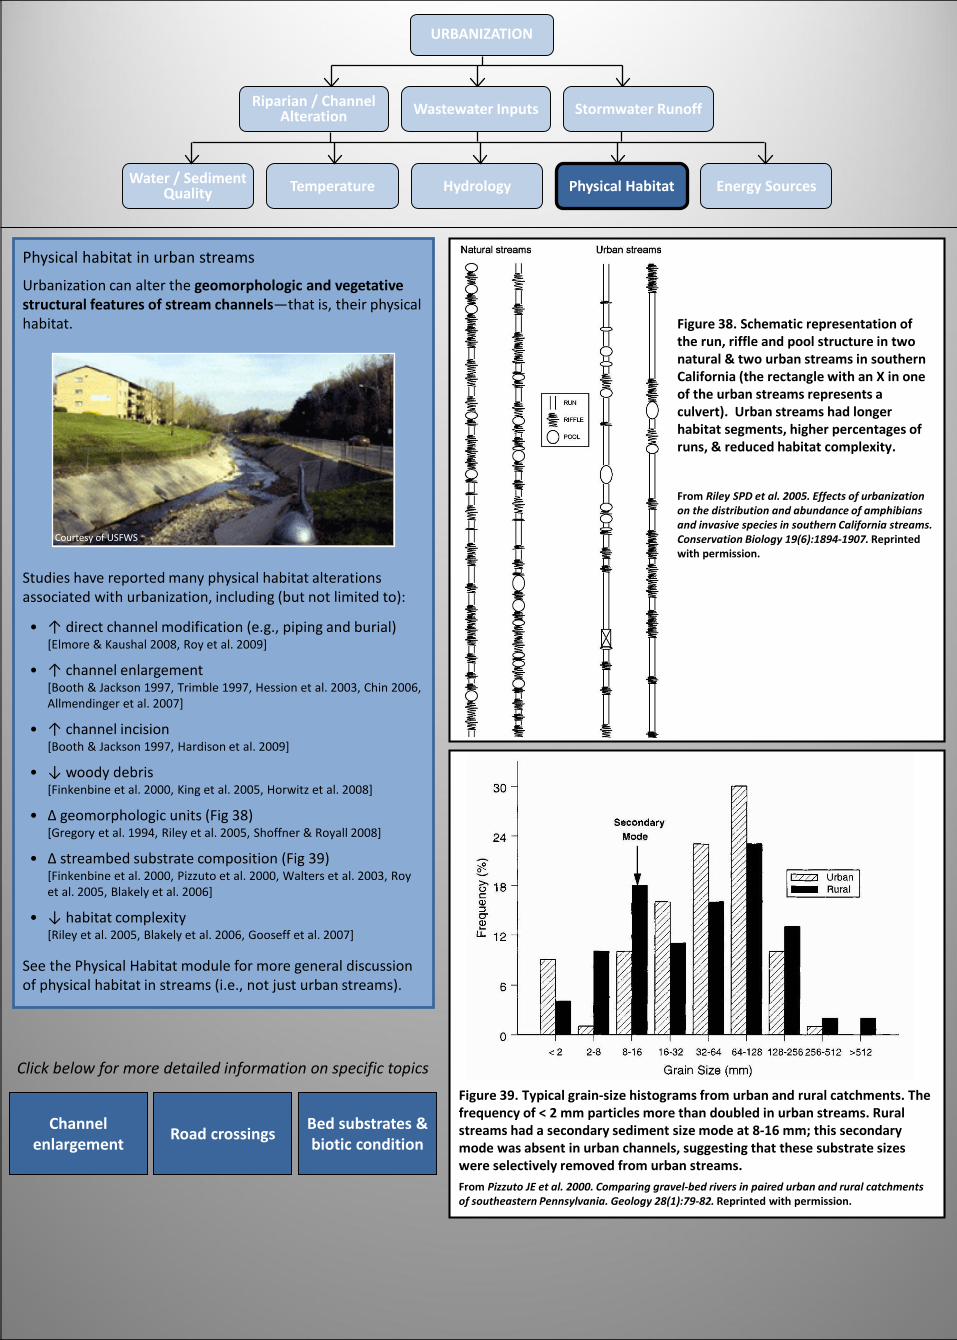
URBANIZATION
Water / Sediment Quality Temperature Hydrology Physical Habitat Energy Sources
Riparian / Channel Alteration Wastewater Inputs Stormwater Runoff
Figure 38. Schematic representation of the run, riffle and pool structure in two natural & two urban streams in southern California (the rectangle with an X in one of the urban streams represents a culvert). Urban streams had longer habitat segments, higher percentages of runs, & reduced habitat complexity.
From Riley SPD et al. 2005. Effects of urbanization on the distribution and abundance of amphibians and invasive species in southern California streams. Conservation Biology 19(6):1894-1907. Reprinted with permission.
Figure 39. Typical grain-size histograms from urban and rural catchments. The frequency of < 2 mm particles more than doubled in urban streams. Rural streams had a secondary sediment size mode at 8-16 mm; this secondary mode was absent in urban channels, suggesting that these substrate sizes were selectively removed from urban streams.From Pizzuto JE et al. 2000. Comparing gravel-bed rivers in paired urban and rural catchments of southeastern Pennsylvania. Geology 28(1):79-82. Reprinted with permission.
Click below for more detailed information on specific topics
Channel enlargement Road crossings Bed substrates &
biotic condition
Physical habitat in urban streams
Urbanization can alter the geomorphologic and vegetative structural features of stream channels—that is, their physical habitat.
See the Physical Habitat module for more general discussion of physical habitat in streams (i.e., not just urban streams).
• ↑ direct channel modification (e.g., piping and burial)[Elmore & Kaushal 2008, Roy et al. 2009]
• ↑ channel enlargement[Booth & Jackson 1997, Trimble 1997, Hession et al. 2003, Chin 2006, Allmendinger et al. 2007]
• ↑ channel incision[Booth & Jackson 1997, Hardison et al. 2009]
• ↓ woody debris[Finkenbine et al. 2000, King et al. 2005, Horwitz et al. 2008]
• Δ geomorphologic units (Fig 38)[Gregory et al. 1994, Riley et al. 2005, Shoffner & Royall 2008]
• Δ streambed substrate composition (Fig 39)[Finkenbine et al. 2000, Pizzuto et al. 2000, Walters et al. 2003, Roy et al. 2005, Blakely et al. 2006]
• ↓ habitat complexity[Riley et al. 2005, Blakely et al. 2006, Gooseff et al. 2007]
Studies have reported many physical habitat alterations associated with urbanization, including (but not limited to):
Courtesy of USFWS
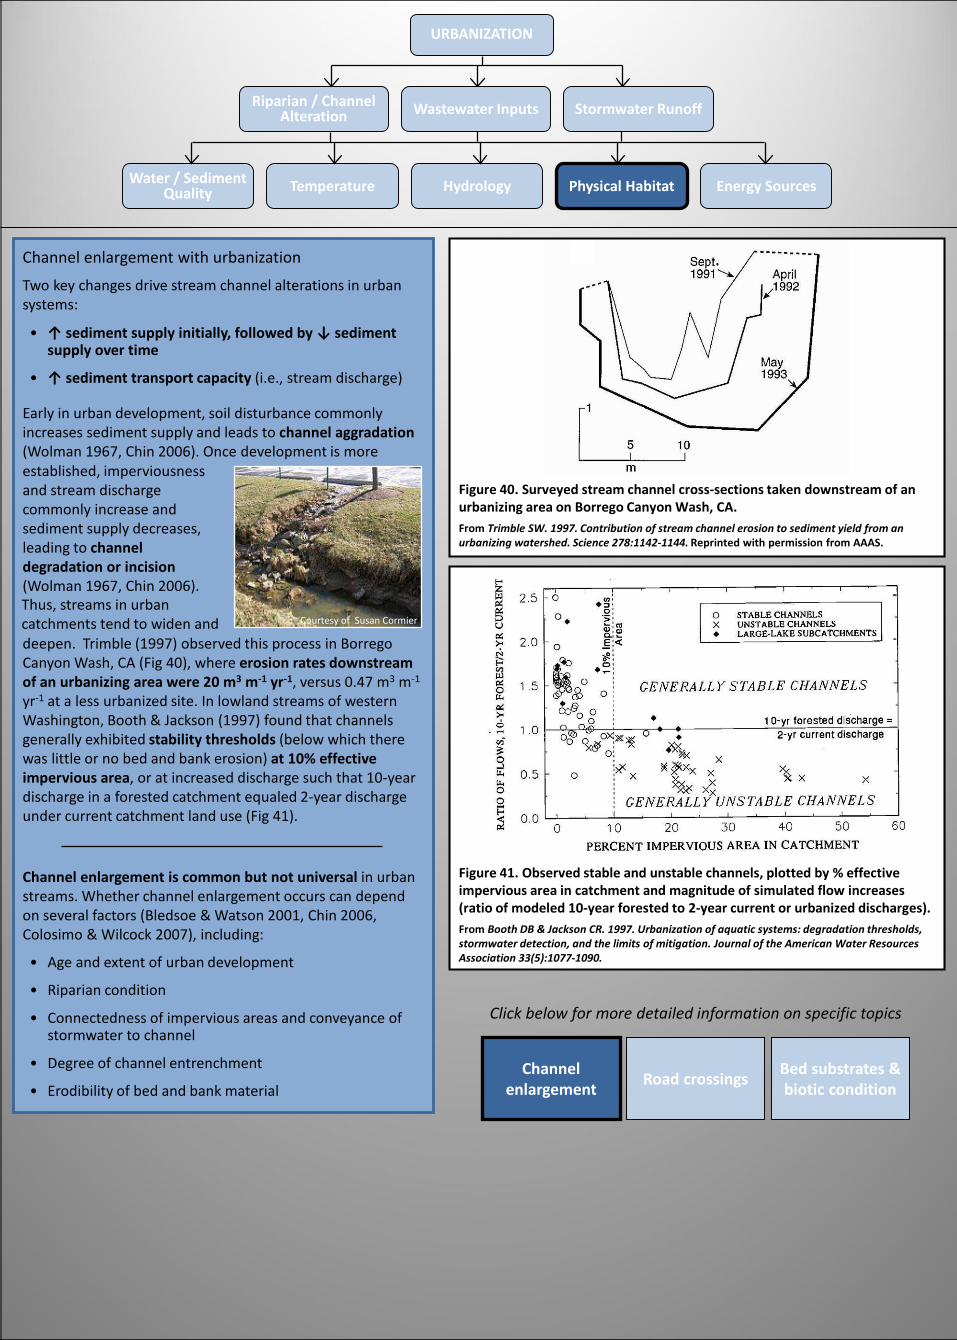
URBANIZATION
Water / Sediment Quality Temperature Hydrology Physical Habitat Energy Sources
Riparian / Channel Alteration Wastewater Inputs Stormwater Runoff
Figure 41. Observed stable and unstable channels, plotted by % effective impervious area in catchment and magnitude of simulated flow increases (ratio of modeled 10-year forested to 2-year current or urbanized discharges). From Booth DB & Jackson CR. 1997. Urbanization of aquatic systems: degradation thresholds, stormwater detection, and the limits of mitigation. Journal of the American Water Resources Association 33(5):1077-1090.
Figure 40. Surveyed stream channel cross-sections taken downstream of an urbanizing area on Borrego Canyon Wash, CA.From Trimble SW. 1997. Contribution of stream channel erosion to sediment yield from an urbanizing watershed. Science 278:1142-1144. Reprinted with permission from AAAS.
Channel enlargement with urbanization
Two key changes drive stream channel alterations in urban systems:
• ↑ sediment supply initially, followed by ↓ sediment supply over time
• ↑ sediment transport capacity (i.e., stream discharge)
Channel enlargement is common but not universal in urban streams. Whether channel enlargement occurs can depend on several factors (Bledsoe & Watson 2001, Chin 2006, Colosimo & Wilcock 2007), including:
• Age and extent of urban development
• Riparian condition
• Connectedness of impervious areas and conveyance of stormwater to channel
• Degree of channel entrenchment
• Erodibility of bed and bank material
Early in urban development, soil disturbance commonly increases sediment supply and leads to channel aggradation(Wolman 1967, Chin 2006). Once development is moreestablished, imperviousness and stream discharge commonly increase and sediment supply decreases, leading to channel degradation or incision (Wolman 1967, Chin 2006).
deepen. Trimble (1997) observed this process in Borrego Canyon Wash, CA (Fig 40), where erosion rates downstream of an urbanizing area were 20 m3 m-1 yr-1, versus 0.47 m3 m-1
yr-1 at a less urbanized site. In lowland streams of western Washington, Booth & Jackson (1997) found that channels generally exhibited stability thresholds (below which there was little or no bed and bank erosion) at 10% effective impervious area, or at increased discharge such that 10-year discharge in a forested catchment equaled 2-year discharge under current catchment land use (Fig 41).
Thus, streams in urban catchments tend to widen and
Click below for more detailed information on specific topics
Channel enlargement Road crossings Bed substrates &
biotic condition
Courtesy of Susan Cormier
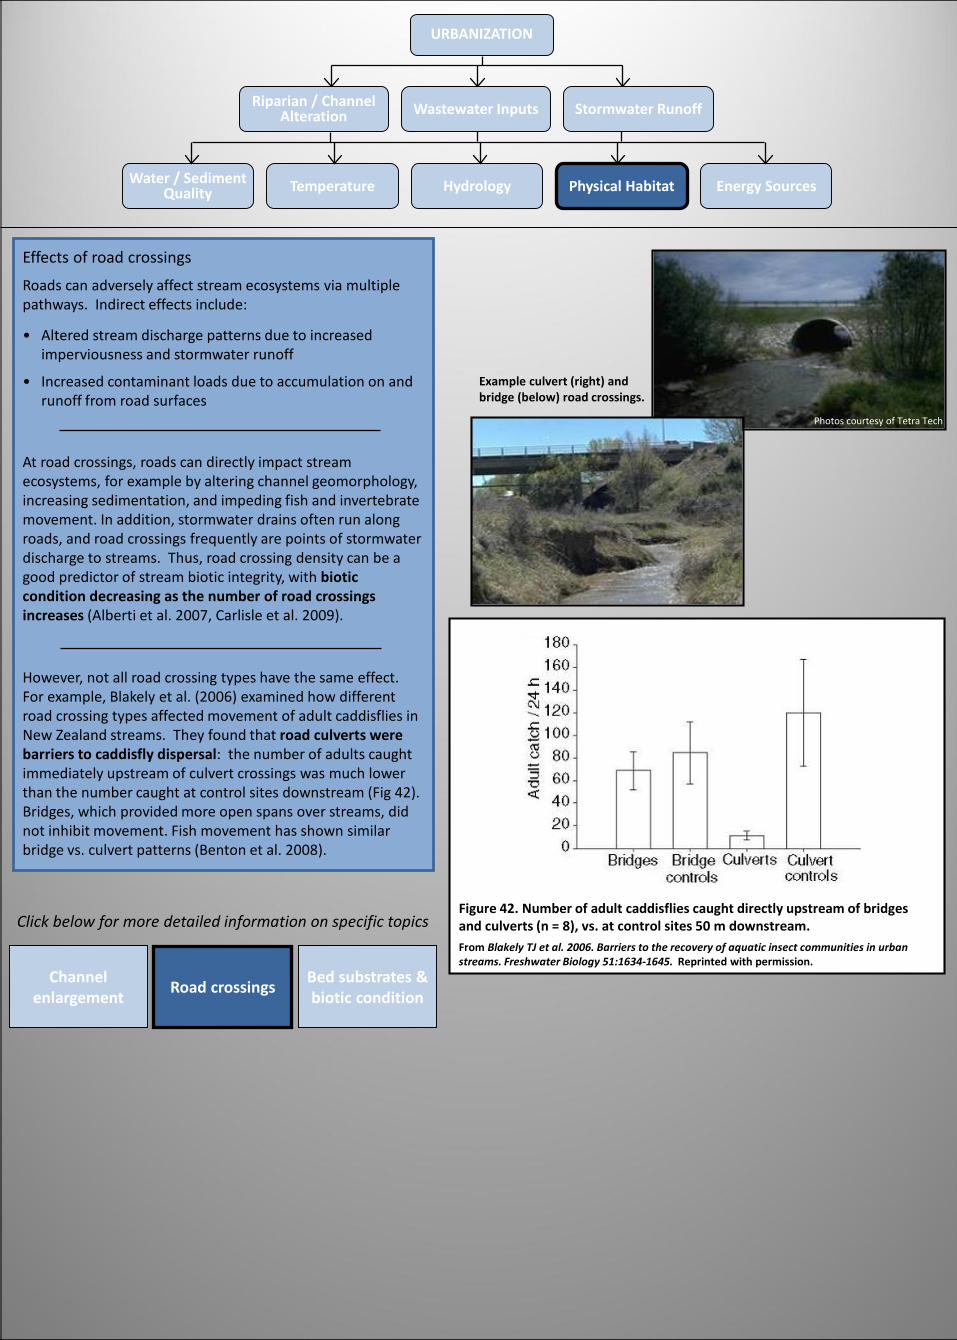
URBANIZATION
Water / Sediment Quality Temperature Hydrology Physical Habitat Energy Sources
Riparian / Channel Alteration Wastewater Inputs Stormwater Runoff
Figure 42. Number of adult caddisflies caught directly upstream of bridges and culverts (n = 8), vs. at control sites 50 m downstream. From Blakely TJ et al. 2006. Barriers to the recovery of aquatic insect communities in urban streams. Freshwater Biology 51:1634-1645. Reprinted with permission.
Effects of road crossings
Roads can adversely affect stream ecosystems via multiple pathways. Indirect effects include:
• Altered stream discharge patterns due to increased imperviousness and stormwater runoff
• Increased contaminant loads due to accumulation on and runoff from road surfaces
At road crossings, roads can directly impact stream ecosystems, for example by altering channel geomorphology, increasing sedimentation, and impeding fish and invertebrate movement. In addition, stormwater drains often run along roads, and road crossings frequently are points of stormwater discharge to streams. Thus, road crossing density can be a good predictor of stream biotic integrity, with biotic condition decreasing as the number of road crossings increases (Alberti et al. 2007, Carlisle et al. 2009).
However, not all road crossing types have the same effect. For example, Blakely et al. (2006) examined how different road crossing types affected movement of adult caddisflies in New Zealand streams. They found that road culverts were barriers to caddisfly dispersal: the number of adults caught immediately upstream of culvert crossings was much lower than the number caught at control sites downstream (Fig 42). Bridges, which provided more open spans over streams, did not inhibit movement. Fish movement has shown similar bridge vs. culvert patterns (Benton et al. 2008).
Click below for more detailed information on specific topics
Channel enlargement Road crossings Bed substrates &
biotic condition
Example culvert (right) and bridge (below) road crossings.
Photos courtesy of Tetra Tech
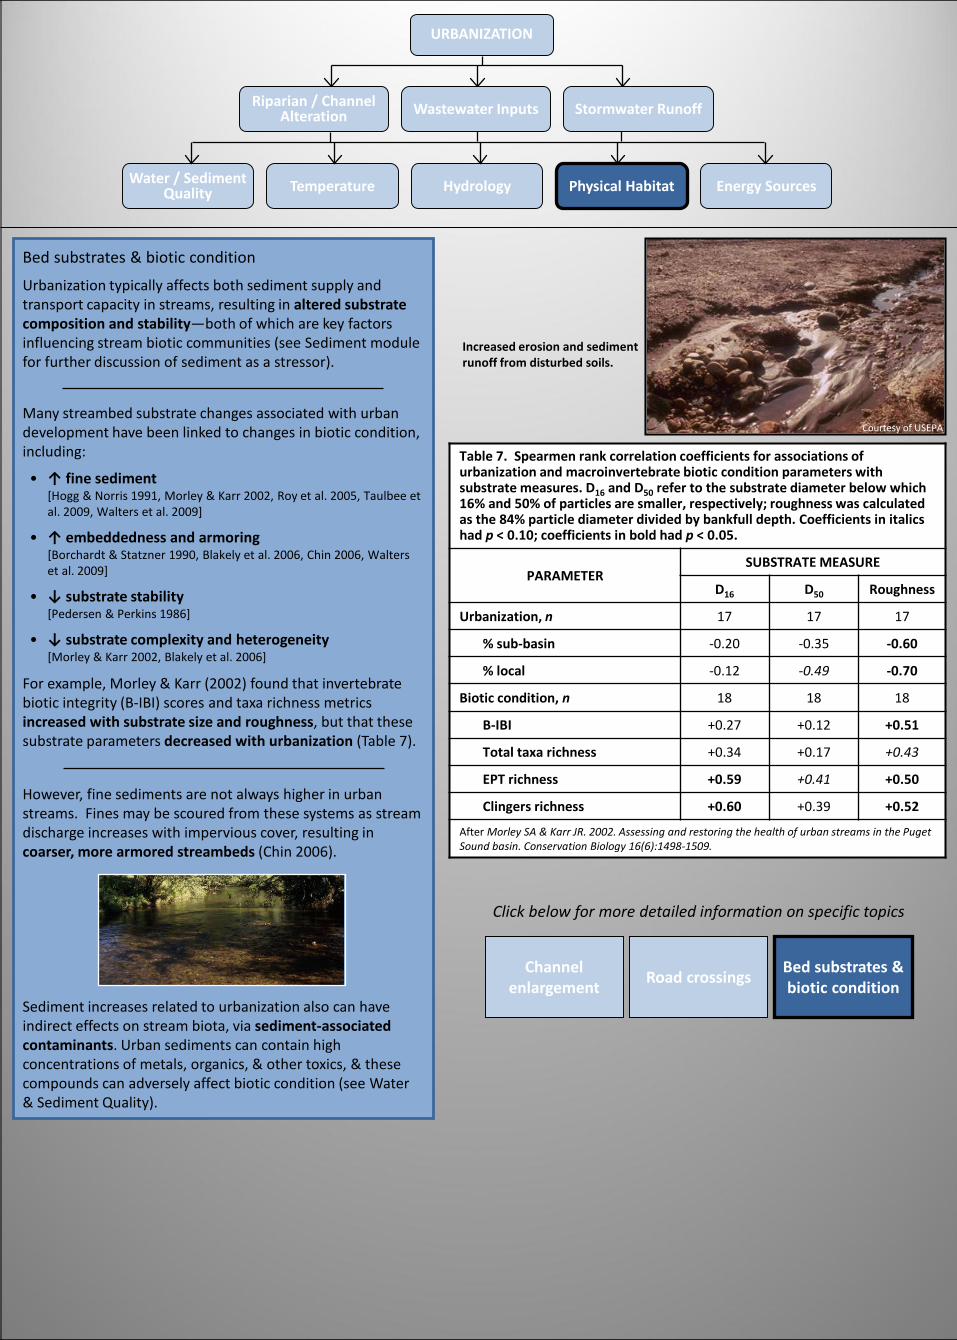
Table 7. Spearmen rank correlation coefficients for associations of urbanization and macroinvertebrate biotic condition parameters with substrate measures. D16 and D50 refer to the substrate diameter below which 16% and 50% of particles are smaller, respectively; roughness was calculated as the 84% particle diameter divided by bankfull depth. Coefficients in italics had p < 0.10; coefficients in bold had p < 0.05.
PARAMETERSUBSTRATE MEASURE
D16 D50 Roughness
Urbanization, n 17 17 17
% sub-basin -0.20 -0.35 -0.60
% local -0.12 -0.49 -0.70
Biotic condition, n 18 18 18
B-IBI +0.27 +0.12 +0.51
Total taxa richness +0.34 +0.17 +0.43
EPT richness +0.59 +0.41 +0.50
Clingers richness +0.60 +0.39 +0.52
After Morley SA & Karr JR. 2002. Assessing and restoring the health of urban streams in the Puget Sound basin. Conservation Biology 16(6):1498-1509.
URBANIZATION
Water / Sediment Quality Temperature Hydrology Physical Habitat Energy Sources
Riparian / Channel Alteration Wastewater Inputs Stormwater Runoff
Bed substrates & biotic condition
Urbanization typically affects both sediment supply and transport capacity in streams, resulting in altered substrate composition and stability—both of which are key factors influencing stream biotic communities (see Sediment module for further discussion of sediment as a stressor).
Sediment increases related to urbanization also can have indirect effects on stream biota, via sediment-associated contaminants. Urban sediments can contain high concentrations of metals, organics, & other toxics, & these compounds can adversely affect biotic condition (see Water & Sediment Quality).
• ↑ fine sediment[Hogg & Norris 1991, Morley & Karr 2002, Roy et al. 2005, Taulbee et al. 2009, Walters et al. 2009]
• ↑ embeddedness and armoring[Borchardt & Statzner 1990, Blakely et al. 2006, Chin 2006, Walters et al. 2009]
• ↓ substrate stability[Pedersen & Perkins 1986]
• ↓ substrate complexity and heterogeneity[Morley & Karr 2002, Blakely et al. 2006]
Many streambed substrate changes associated with urban development have been linked to changes in biotic condition, including:
For example, Morley & Karr (2002) found that invertebrate biotic integrity (B-IBI) scores and taxa richness metrics increased with substrate size and roughness, but that these substrate parameters decreased with urbanization (Table 7).
However, fine sediments are not always higher in urban streams. Fines may be scoured from these systems as stream discharge increases with impervious cover, resulting in coarser, more armored streambeds (Chin 2006).
Click below for more detailed information on specific topics
Channel enlargement Road crossings Bed substrates &
biotic condition
Increased erosion and sediment runoff from disturbed soils.
Courtesy of USEPA
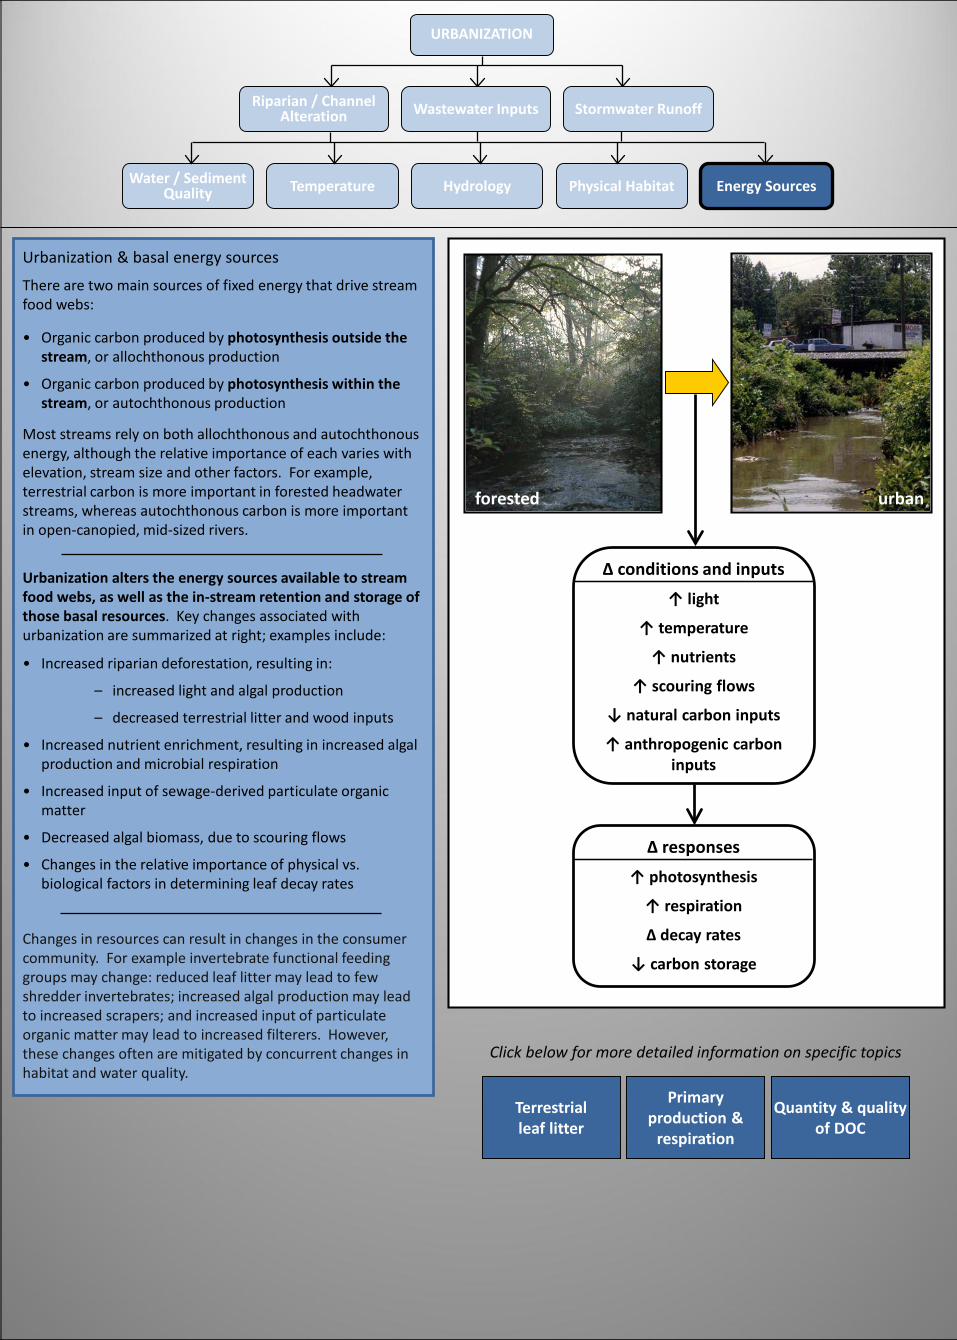
URBANIZATION
Water / Sediment Quality Temperature Hydrology Physical Habitat Energy Sources
Riparian / Channel Alteration Wastewater Inputs Stormwater Runoff
forested urban
Δ conditions and inputs↑ light
↑ temperature
↑ nutrients
↑ scouring flows
↓ natural carbon inputs
↑ anthropogenic carbon inputs
Δ responses↑ photosynthesis
↑ respiration
Δ decay rates
↓ carbon storage
Urbanization & basal energy sources
There are two main sources of fixed energy that drive stream food webs:
Most streams rely on both allochthonous and autochthonous energy, although the relative importance of each varies with elevation, stream size and other factors. For example, terrestrial carbon is more important in forested headwater streams, whereas autochthonous carbon is more important in open-canopied, mid-sized rivers.
• Organic carbon produced by photosynthesis outside the stream, or allochthonous production
• Organic carbon produced by photosynthesis within the stream, or autochthonous production
Urbanization alters the energy sources available to stream food webs, as well as the in-stream retention and storage of those basal resources. Key changes associated with urbanization are summarized at right; examples include:
• Increased riparian deforestation, resulting in:
– increased light and algal production
– decreased terrestrial litter and wood inputs
• Increased nutrient enrichment, resulting in increased algal production and microbial respiration
• Increased input of sewage-derived particulate organic matter
• Decreased algal biomass, due to scouring flows
• Changes in the relative importance of physical vs. biological factors in determining leaf decay rates
Click below for more detailed information on specific topics
Terrestrial leaf litter
Primary production &
respiration
Quantity & quality of DOC
Changes in resources can result in changes in the consumer community. For example invertebrate functional feeding groups may change: reduced leaf litter may lead to few shredder invertebrates; increased algal production may lead to increased scrapers; and increased input of particulate organic matter may lead to increased filterers. However, these changes often are mitigated by concurrent changes in habitat and water quality.
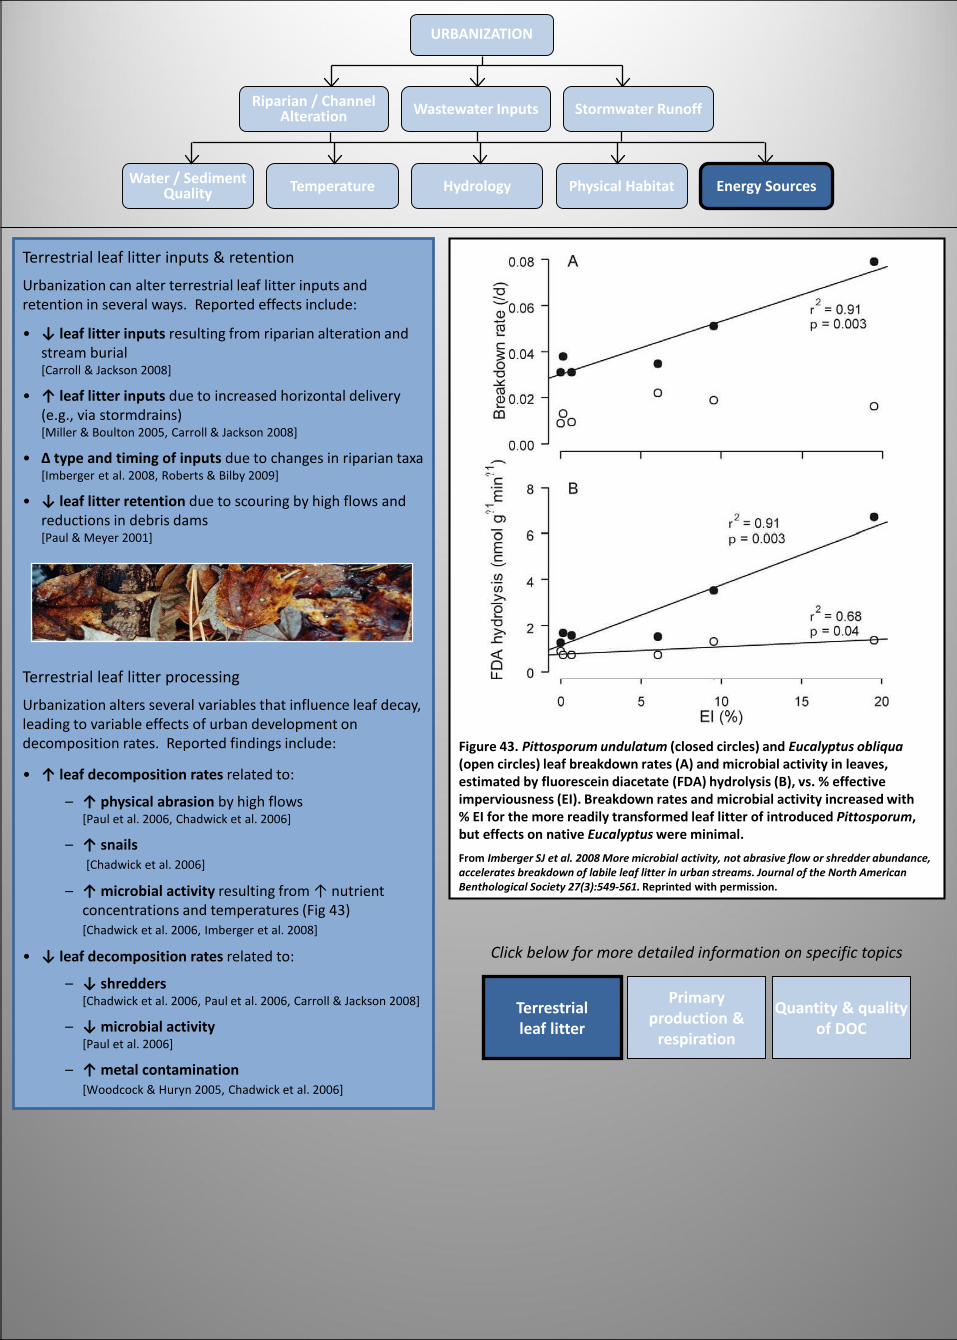
URBANIZATION
Water / Sediment Quality Temperature Hydrology Physical Habitat Energy Sources
Riparian / Channel Alteration Wastewater Inputs Stormwater Runoff
Figure 43. Pittosporum undulatum (closed circles) and Eucalyptus obliqua(open circles) leaf breakdown rates (A) and microbial activity in leaves, estimated by fluorescein diacetate (FDA) hydrolysis (B), vs. % effective imperviousness (EI). Breakdown rates and microbial activity increased with % EI for the more readily transformed leaf litter of introduced Pittosporum, but effects on native Eucalyptus were minimal. From Imberger SJ et al. 2008 More microbial activity, not abrasive flow or shredder abundance, accelerates breakdown of labile leaf litter in urban streams. Journal of the North American Benthological Society 27(3):549-561. Reprinted with permission.
Terrestrial leaf litter inputs & retention
Urbanization can alter terrestrial leaf litter inputs and retention in several ways. Reported effects include:
• ↑ leaf decomposition rates related to:
– ↑ physical abrasion by high flows [Paul et al. 2006, Chadwick et al. 2006]
– ↑ snails[Chadwick et al. 2006]
– ↑ microbial activity resulting from ↑ nutrient concentrations and temperatures (Fig 43)[Chadwick et al. 2006, Imberger et al. 2008]
• ↓ leaf decomposition rates related to:
– ↓ shredders[Chadwick et al. 2006, Paul et al. 2006, Carroll & Jackson 2008]
– ↓ microbial activity[Paul et al. 2006]
– ↑ metal contamination[Woodcock & Huryn 2005, Chadwick et al. 2006]
Terrestrial leaf litter processing
Urbanization alters several variables that influence leaf decay, leading to variable effects of urban development on decomposition rates. Reported findings include:
• ↓ leaf litter inputs resulting from riparian alteration and stream burial[Carroll & Jackson 2008]
• ↑ leaf litter inputs due to increased horizontal delivery (e.g., via stormdrains)[Miller & Boulton 2005, Carroll & Jackson 2008]
• Δ type and timing of inputs due to changes in riparian taxa[Imberger et al. 2008, Roberts & Bilby 2009]
• ↓ leaf litter retention due to scouring by high flows and reductions in debris dams[Paul & Meyer 2001]
Click below for more detailed information on specific topics
Terrestrial leaf litter
Primary production &
respiration
Quantity & quality of DOC

Table 8. Gross primary production (GPP) and community respiration (CR24), both measured in g O2 m-2 d-1, at an upstream reference site and a downstream wastewater-impacted site on a lowland stream in Germany.
SEASON PARAMETER UPSTREAM DOWNSTREAM
SPRING
GPP 2 2
CR24 11 24
GPP:CR24 0.15 0.10
SUMMER
GPP 32 47
CR24 32 59
GPP:CR24 1.0 0.8
WINTER
GPP 0.1 < 0.1
CR24 6 18
GPP:CR24 0.01 < 0.01Modified from Gücker B et al. 2006. Effects of wastewater treatment plant discharge on ecosystem structure and function of lowland streams. Journal of the North American Benthological Society 25(2):313-329.
URBANIZATION
Water / Sediment Quality Temperature Hydrology Physical Habitat Energy Sources
Riparian / Channel Alteration Wastewater Inputs Stormwater Runoff
Figure 44. Median chlorophyll a at 16 Australian streams on 2 sampling dates, vs. % drainage connection and % imperviousness; % connection (but not % imperviousness) explained a significant amount of variation in chlorophyll ain both sampling periods. From Taylor SL et al. 2004. Catchment urbanisation and increased benthic algal biomass in streams: linking mechanisms to management. Freshwater Biology 49:835-851. Reprinted with permission.
Click below for more detailed information on specific topics
Terrestrial leaf litter
Primary production &
respiration
Quantity & quality of DOC
Primary production & respiration
Primary production, or the fixation of inorganic carbon into organic carbon (e.g., plant biomass), provides most of the autochthonous carbon produced in streams. Algae are usually the dominant stream primary producers, although other plants (e.g., macrophytes, mosses) also may be important in certain systems.
Effects of urbanization on algal biomass and primary production may include:
• ↑ primary production or algal biomass(Fig 44, Table 8) resulting from:
– ↑ nutrients
– ↑ light and temperature
– ↓ grazers
• ↓ primary production or algal biomassresulting from:
– ↑ scouring due to high flows
– ↑ fine sediment and ↓ sediment stability
– ↑ toxic pollutants
– ↑ grazers
• Δ assemblage structure
Many of the factors influencing primary production in urban streams also affect respiration. Respiration does not always show a clear pattern with urbanization, but often is elevated in streams receiving wastewater discharges(Gücker et al. 2006 [Table 8], Wenger et al. 2009). These increases in respiration can lead to large oxygen fluctuations and oxygen deficits in urban streams (Faulkner et al. 2000, Ometo et al. 2000, Gücker et al. 2006 [Table 8]).
Courtesy of Tetra Tech
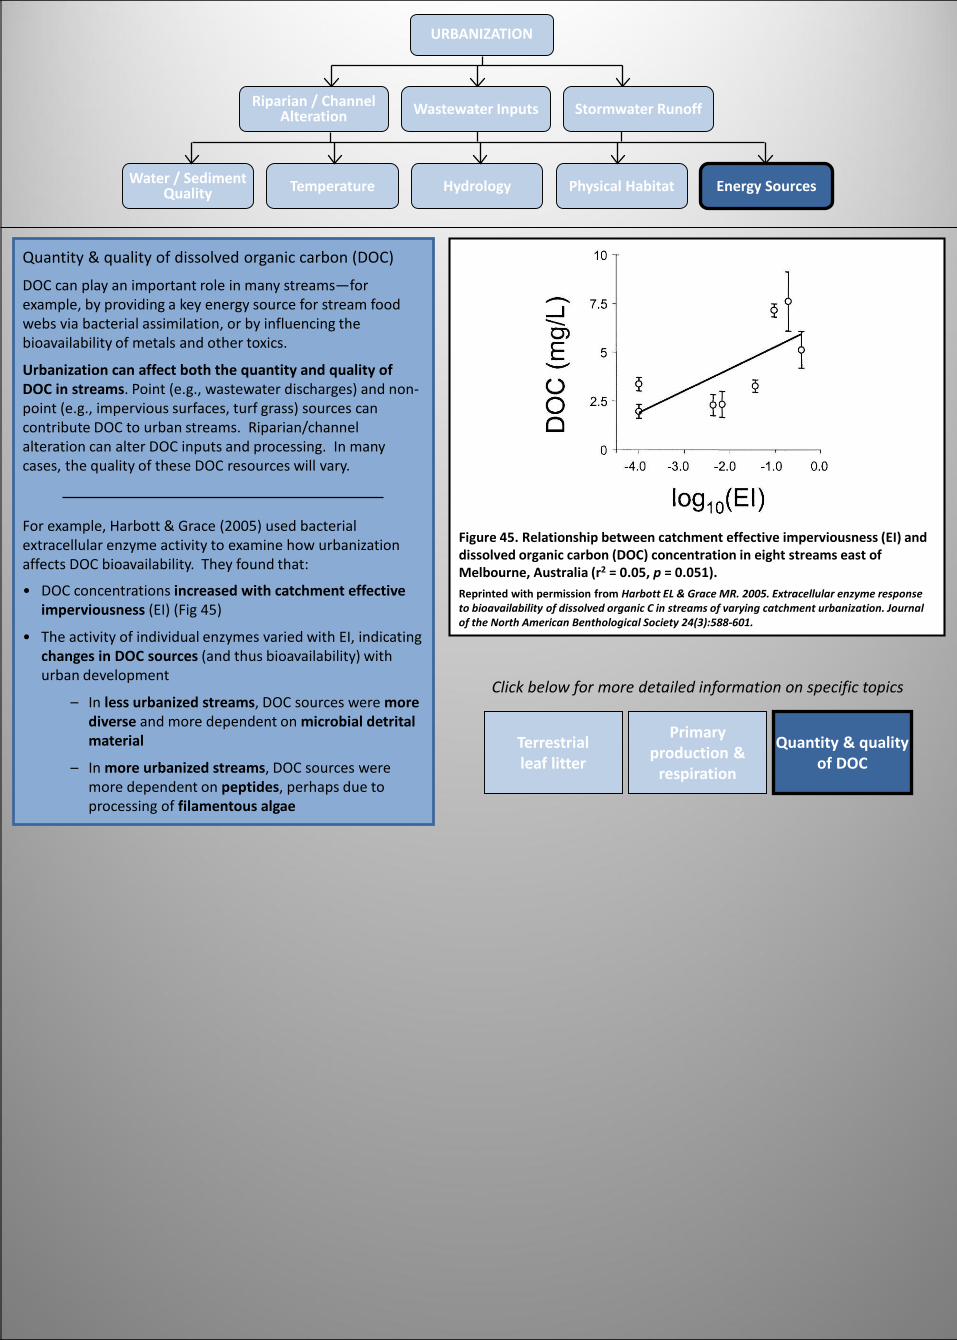
URBANIZATION
Water / Sediment Quality Temperature Hydrology Physical Habitat Energy Sources
Riparian / Channel Alteration Wastewater Inputs Stormwater Runoff
Figure 45. Relationship between catchment effective imperviousness (EI) and dissolved organic carbon (DOC) concentration in eight streams east of Melbourne, Australia (r2 = 0.05, p = 0.051).Reprinted with permission from Harbott EL & Grace MR. 2005. Extracellular enzyme response to bioavailability of dissolved organic C in streams of varying catchment urbanization. Journal of the North American Benthological Society 24(3):588-601.
Quantity & quality of dissolved organic carbon (DOC)
DOC can play an important role in many streams—for example, by providing a key energy source for stream food webs via bacterial assimilation, or by influencing the bioavailability of metals and other toxics.
Urbanization can affect both the quantity and quality of DOC in streams. Point (e.g., wastewater discharges) and non-point (e.g., impervious surfaces, turf grass) sources can contribute DOC to urban streams. Riparian/channel alteration can alter DOC inputs and processing. In many cases, the quality of these DOC resources will vary.
• DOC concentrations increased with catchment effective imperviousness (EI) (Fig 45)
• The activity of individual enzymes varied with EI, indicating changes in DOC sources (and thus bioavailability) with urban development
– In less urbanized streams, DOC sources were more diverse and more dependent on microbial detrital material
– In more urbanized streams, DOC sources were more dependent on peptides, perhaps due to processing of filamentous algae
For example, Harbott & Grace (2005) used bacterial extracellular enzyme activity to examine how urbanization affects DOC bioavailability. They found that:
Click below for more detailed information on specific topics
Terrestrial leaf litter
Primary production &
respiration
Quantity & quality of DOC
REFERENCES
Alberti M, Booth D, Hill K, Coburn B, Avolio C, Coe S, and Spirandelli D. 2007. The impact of urban patterns on aquatic ecosystems: An empirical analysis in Puget lowland sub-basins. Landscape and Urban Planning 80:345-361.
Alig RJ, Kline JD, and Lichtenstein M. 2004. Urbanization on the US landscape: looking ahead in the 21st century. Landscape and Urban Planning 69:219-234.
Allan JD. 1995. Stream Ecology: Structure and Function of Running Waters. Chapman & Hall, London, UK.
Allan JD. 2004. Landscapes and riverscapes: the influence of land use on stream ecosystems. Annual Review of Ecology Evolution and Systematics 35:257-284.
Alley WM and Veenhuis JE. 1983. Effective impervious area in urban runoff modeling. Journal of Hydraulic Engineering 109:313-319.
Allmendinger NE, Pizzuto JE, Moglen GE, and Lewicki M. 2007. A sediment budget for an urbanizing watershed, 1951-1996, Montgomery County, Maryland, U.S.A. Journal of the American Water Resources Association 43:1483-1498.
Andersen CB, Lewis GP, and Sargent KA. 2004. Influence of wastewater-treatment effluent on concentrations and fluxes of solutes in the Bush River, South Carolina, during extreme drought conditions. Environmental Geosciences 11:28-41.
Arnold CL and Gibbons CJ. 1996. Impervious surface coverage - The emergence of a key environmental indicator. Journal of the American Planning Association 62:243-258.
Baker LA. 2009. New concepts for managing urban pollution. In The Water Environment of Cities. Edited by LA Baker. Springer Science+Business Media, LLC, pp. 69-91.
Barber LB, Murphy SF, Verplanck PL, Sandstrom MW, Taylor HE, and Furlong ET. 2006. Chemical loading into surface water along a hydrological, biogeochemical, and land use gradient: A holistic watershed approach. Environmental Science & Technology 40:475-486.
Benton PD, Ensign WE, and Freeman BJ. 2008. The effect of road crossings on fish movements in small Etowah basin streams. Southeastern Naturalist 7:301-310.
Bilby RE and Mollot LA. 2008. Effect of changing land use patterns on the distribution of coho salmon (Oncorhynchus kisutch) in the Puget Sound region. Canadian Journal of Fisheries and Aquatic Sciences 65:2138-2148.
Blakely TJ, Harding JS, McIntosh AR, and Winterbourn MJ. 2006. Barriers to the recovery of aquatic insect communities in urban streams. Freshwater Biology 51:1634-1645.
Bledsoe BP and Watson CC. 2001. Effects of urbanization on channel instability. Journal of the American Water Resources Association 37:255-270.
Booth DB and Jackson CR. 1997. Urbanization of aquatic systems: Degradation thresholds, stormwater detection, and the limits of mitigation. Journal of the American Water Resources Association 33:1077-1090.
Booth DB, Karr JR, Schauman S, Konrad CP, Morley SA, Larson MG, and Burger SJ. 2004. Reviving urban streams: Land use, hydrology, biology, and human behavior. Journal of the American Water Resources Association 40:1351-1364.
Borchardt D and Statzner B. 1990. Ecological impact of urban stormwater runoff studied in experimental flumes - population loss by drift and availability of refugial space. Aquatic Sciences 52:299-314.
Brandes D, Cavallo GJ, and Nilson ML. 2005. Base flow trends in urbanizing watersheds of the Delaware River basin. Journal of the American Water Resources Association 41:1377-1391.
Brown LR, Cuffney TF, Coles JF, Fitzpatrick F, McMahon G, Steuer J, Bell AH, and May JT. 2009. Urban streams across the USA: lessons learned from studies in 9 metropolitan areas. Journal of the North American Benthological Society 28:1051-1069.
Burns D, Vitvar T, McDonnell J, Hassett J, Duncan J, and Kendall C. 2005. Effects of suburban development on runoff generation in the Croton River basin, New York, USA. Journal of Hydrology 311:266-281.
Busse LB, Simpson JC, and Cooper SD. 2006. Relationships among nutrients, algae, and land use in urbanized southern California streams. Canadian Journal of Fisheries and Aquatic Sciences 63:2621-2638.
Carey RO and Migliaccio KW. 2009. Contribution of wastewater treatment plant effluents to nutrient dynamics in aquatic systems: a review. Environmental Management 44:205-217.
REFERENCES
Carlisle DM, Falcone J, and Meador MR. 2009. Predicting the biological condition of streams: use of geospatial indicators of natural and anthropogenic characteristics of watersheds. Environmental Monitoring and Assessment 151: 143-160.
Carroll GD and Jackson CR. 2008. Observed relationships between urbanization and riparian cover, shredder abundance, and stream leaf litter standing crops. Fundamental and Applied Limnology 173:213-225.
Chadwick MA, Dobberfuhl DR, Benke AC, Huryn AD, Suberkropp K, and Thiele JE. 2006. Urbanization affects stream ecosystem function by altering hydrology, chemistry, and biotic richness. Ecological Applications 16:1796-1807.
Chalmers AT, Van Metre PC, and Callender E. 2007. The chemical response of particle-associated contaminants in aquatic sediments to urbanization in New England, USA. Journal of Contaminant Hydrology 91:4-25.
Chang HJ. 2007. Comparative streamflow characteristics in urbanizing basins in the Portland Metropolitan Area, Oregon, USA. Hydrological Processes 21:211-222.
Changnon SA and Demissie M. 1996. Detection of changes in streamflow and floods resulting from climate fluctuations and land use-drainage changes. Climatic Change 32:411-421.
Chin A. 2006. Urban transformation of river landscapes in a global context. Geomorphology 79:460-487.
Cianfrani CM, Hession WC, and Rizzo DM. 2006. Watershed imperviousness impacts on stream channel condition in southeastern Pennsylvania. Journal of the American Water Resources Association 42:941-956.
Colosimo MF and Wilcock PR. 2007. Alluvial sedimentation and erosion in an urbanizing watershed, Gwynns Falls, Maryland. Journal of the American Water Resources Association 43:499-521.
DeGasperi CL, Berge HB, Whiting KR, Burkey JJ, Cassin JL, and Fuerstenberg RR. 2009. Linking hydrologic alteration to biological impairment in urbanizing streams of the Puget Lowland, Washington, USA. Journal of the American Water Resources Association 45:512-533.
Elmore AJ and Kaushal SS. 2008. Disappearing headwaters: patterns of stream burial due to urbanization. Frontiers in Ecology and the Environment 6:308-312.
Faulkner H, Edmonds-Brown V, and Green A. 2000. Problems of quality designation in diffusely polluted urban streams - the case of Pymme's Brook, North London. Environmental Pollution 109:91-107.
Finkenbine JK, Atwater JW, and Mavinic DS. 2000. Stream health after urbanization. Journal of the American Water Resources Association 36:1149-1160.
Franczyk J and Chang H. 2009. The effects of climate change and urbanization on the runoff of the Rock Creek basin in the Portland metropolitan area, Oregon, USA. Hydrological Processes 23:805-815.
Freeman MC and Marcinek PA. 2006. Fish assemblage responses to water withdrawals and water supply reservoirs in Piedmont streams. Environmental Management 38:435-450.
Frenzel SA and Couvillion CS. 2002. Fecal-indicator bacteria in streams along a gradient of residential development. Journal of the American Water Resources Association 38:265-273.
Gibson CJ, Stadterman KL, States S, and Sykora J. 1998. Combined sewer overflows: a source of Cryptosporidium and Giardia? Water Science and Technology 38:67-72.
Gooseff MN, Hall RO, and Tank JL. 2007. Relating transient storage to channel complexity in streams of varying land use in Jackson Hole, Wyoming. Water Resources Research 43:1-10.
Gregory KJ, Gurnell AM, Hill CT, Tooth S. 1994. Stability of the pool-riffle sequence in changing river channels. Regulated Rivers: Research & Management 9:35-43.
Groffman PM, Boulware NJ, Zipperer WC, Pouyat RV, Band LE, and Colosimo MF. 2002. Soil nitrogen cycle processes in urban riparian zones. Environmental Science & Technology 36:4547-4552.
Groffman PM, Bain DJ, Band LE, Belt KT, Brush GS, Grove JM, Pouyat RV, Yesilonis IC, and ZippererWC. 2003. Down by the riverside: urban riparian ecology. Frontiers in Ecology and the Environment 1:315-321.
Groffman PM, Law NL, Belt KT, Band LE, and Fisher GT. 2004. Nitrogen fluxes and retention in urban watershed ecosystems. Ecosystems 7:393-403.
REFERENCES
Gücker B, Brauns M, and Pusch MT. 2006. Effects of wastewater treatment plant discharge on ecosystem structure and function of lowland streams. Journal of the North American Benthological Society 25:313-329.
Han HJ, Allan JD, and Scavia D. 2009. Influence of climate and human activities on the relationship between watershed nitrogen input and river export. Environmental Science & Technology 43:1916-1922.
Harbott EL and Grace MR. 2005. Extracellular enzyme response to bioavailability of dissolved organic C in streams of varying catchment urbanization. Journal of the North American Benthological Society 24:588-601.
Hardison EC, O'Driscoll MA, DeLoatch JP, Howard RJ, and Brinson MM. 2009. Urban land use, channel incision, and water table decline along Coastal Plain streams, North Carolina. Journal of the American Water Resources Association 45:1032-1046.
Hatt BE, Fletcher TD, Walsh CJ, and Taylor SL. 2004. The influence of urban density and drainage infrastructure on the concentrations and loads of pollutants in small streams. Environmental Management 34:112-124.
Helms BS, Schoonover JE, and Feminella JW. 2009. Assessing influences of hydrology, physicochemistry, and habitat on stream fishassemblages across a changing landscape. Journal of the American Water Resources Association 45:157-169.
Herb WR, Janke B, Mohseni O, and Stefan HG. 2008. Thermal pollution of streams by runoff from paved surfaces. Hydrological Processes 22:987-999.
Hession WC, Pizzuto JE, Johnson TE, and Horwitz RJ. 2003. Influence of bank vegetation on channel morphology in rural and urban watersheds. Geology 31:147-150.
Hogg ID and Norris RH. 1991. Effects of runoff from land clearing and urban development on the distribution and abundance of macroinvertebrates in pool areas of a river. Australian Journal of Marine and Freshwater Research 42:507-518.
Horwitz RJ, Johnson TE, Overbeck PF, O'Donnell TK, Hession WC, and Sweeney BW. 2008. Effects of riparian vegetation and watershed urbanization on fishes in streams of the mid-Atlantic piedmont (USA). Journal of the American Water Resources Association 44:724-741.
Hur J, Schlautman MA, Karanfil T, Smink J, Song H, Klaine SJ, and Hayes JC. 2007. Influence of drought and municipal sewage effluents on the baseflow water chemistry of an upper Piedmont river. Environmental Monitoring and Assessment 132:171-187.
Imberger SJ, Walsh CJ, and Grace MR. 2008. More microbial activity, not abrasive flow or shredder abundance, accelerates breakdown of labile leaf litter in urban streams. Journal of the North American Benthological Society 27:549-561.
Jobling S and Tyler CR. 2003. Endocrine disruption, parasites and pollutants in wild freshwater fish. Parasitology 126:S103-S108.
Jones RC and Clark CC. 1987. Impact of watershed urbanization on stream insect communities. Water Resources Bulletin 23:1047-1055.
Kaufmann PR, Larsen DP, and Faustini JM. 2009. Bed stability and sedimentation associated with human disturbances in Pacific Northwest streams. Journal of the American Water Resources Association 45:434-459.
Kaushal SS, Groffman PM, Likens GE, Belt KT, Stack WP, Kelly VR, Band LE, and Fisher GT. 2005. Increased salinization of fresh water in the northeastern United States. Proceedings of the National Academy of Sciences of the United States of America 102:13517-13520.
Kaushal SS, Groffman PM, Band LE, Shields CA, Morgan RP, Palmer MA, Belt KT, Swan CM, Findlay SEG, and Fisher GT. 2008. Interaction between urbanization and climate variability amplifies watershed nitrate export in Maryland. Environmental Science & Technology 42:5872-5878.
Kemp SJ and Spotila JR. 1997. Effects of urbanization on brown trout Salmo trutta, other fishes and macroinvertebrates in Valley Creek, Valley Forge, Pennsylvania. American Midland Naturalist 138:55-68.
Kennen JG. 1999. Relation of macroinvertebrate community impairment to catchment characteristics in New Jersey streams. Journal of the American Water Resources Association 35:939-955.
King RS, Baker ME, Whigham DF, Weller DE, Jordan TE, Kazyak PF, and Hurd MK. 2005. Spatial considerations for linking watershed land cover to ecological indicators in streams. Ecological Applications 15:137-153.
Kinouchi T. 2007. Impact of long-term water and energy consumption in Tokyo on wastewater effluent: implications for the thermaldegradation of urban streams. Hydrological Processes 21:1207-1216.
Kinouchi T, Yagi H, and Miyamoto M. 2007. Increase in stream temperature related to anthropogenic heat input from urban wastewater. Journal of Hydrology 335:78-88.
REFERENCES
Kolpin DW, Furlong ET, Meyer MT, Thurman EM, Zaugg SD, Barber LB, and Buxton HT. 2002. Pharmaceuticals, hormones, and other organic wastewater contaminants in US streams, 1999-2000: A national reconnaissance. Environmental Science & Technology 36:1202-1211.
Lerner DN. 2002. Identifying and quantifying urban recharge: a review. Hydrogeology Journal 10:143-152.
Mahler BJ, Van Metre PC, Bashara TJ, Wilson JT, and Johns DA. 2005. Parking lot sealcoat: An unrecognized source of urban polycyclic aromatic hydrocarbons. Environmental Science & Technology 39:5560-5566.
Maltby L, Boxall ABA, Forrow DM, Calow P, and Betton CI. 1995. The effects of motorway runoff on freshwater ecosystems. 2. Identifying major toxicants. Environmental Toxicology and Chemistry 14:1093-1101.
Meyer JL and Wallace JB. 2001. Lost linkages and lotic ecology: rediscovering small streams. In Ecology: Achievement and Challenge. Edited by MC Press, NJ Huntly, and S Levin. Blackwell Science, Oxford, UK pp. 295-317.
Meyer SC. 2005. Analysis of base flow trends in urban streams, northeastern Illinois, USA. Hydrogeology Journal 13:871-885.
Miller W and Boulton A. 2005. Managing and rehabilitating ecosystem processes in regional urban streams in Australia. Hydrobiologia 552:121-133.
Miltner RJ, White D, and Yoder C. 2004. The biotic integrity of streams in urban and suburbanizing landscapes. Landscape and Urban Planning 69:87-100.
Moore AA and Palmer MA. 2005. Invertebrate biodiversity in agricultural and urban headwater streams: Implications for conservation and management. Ecological Applications 15:1169-1177.
Morgan RP and Cushman SE. 2005. Urbanization effects on stream fish assemblages in Maryland, USA. Journal of the North American Benthological Society 24:643-655.
Morley SA and Karr JR. 2002. Assessing and restoring the health of urban streams in the Puget Sound basin. Conservation Biology 16:1498-1509.
Nedeau EJ, Merritt RW, and Kaufman MG. 2003. The effect of an industrial effluent on an urban stream benthic community: water quality vs. habitat quality. Environmental Pollution 123:1-13.
Nelson KC and Palmer MA. 2007. Stream temperature surges under urbanization and climate change: Data, models, and responses. Journal of the American Water Resources Association 43:440-452.
Nelson KC, Palmer MA, Pizzuto JE, Moglen GE, Angermeier PL, Hilderbrand RH, Dettinger M, and Hayhoe K. 2009. Forecasting the combined effects of urbanization and climate change on stream ecosystems: from impacts to management options. Journal of AppliedEcology 46:154-163.
Newall P and Walsh CJ. 2005. Response of epilithic diatom assemblages to urbanization influences. Hydrobiologia 532:53-67.
Ometo JPHB, Martinelli LA, Ballester MV, Gessner A, Krusche AV, Victoria RL, and Williams M. 2000. Effects of land use on water chemistry and macroinvertebrates rates in two streams of the Piracicaba river basin, south-east Brazil. Freshwater Biology 44:327-337.
Ortiz JD and Puig MA. 2007. Point source effects on density, biomass and diversity of benthic macroinvertebrates in a mediterranean stream. River Research and Applications 23:155-170.
Palmer MA, Lettenmaier DP, Poff NL, Postel SL, Richter B, Warner R. 2009. Climate change and river ecosystems: protection and adaptation options. Environmental Management 44:1053-1068.
Paul MJ and Meyer JL. 2001. Streams in the urban landscape. Annual Review of Ecology and Systematics 32:333-365.
Paul MJ, Meyer JL, and Couch CA. 2006. Leaf breakdown in streams differing in catchment land use. Freshwater Biology 51:1684-1695.
Pedersen ER and Perkins MA. 1986. The use of benthic invertebrate data for evaluating impacts of urban runoff. Hydrobiologia 139:13-22.
Pennington DN, Hansel J, and Blair RB. 2008. The conservation value of urban riparian areas for landbirds during spring migration: Land cover, scale, and vegetation effects. Biological Conservation 141:1235-1248.
Phillips P and Chalmers A. 2009. Wastewater effluent, combined sewer overflows, and other sources of organic compounds to Lake Champlain. Journal of the American Water Resources Association 45:45-57.
REFERENCES
Pinkney AE, Harshbarger JC, May EB, and Reichert WL. 2004. Tumor prevalence and biomarkers of exposure and response in brown bullhead (Ameiurus nebulosus) from the Anacostia River, Washington, DC and Tuckahoe River, Maryland, USA. Environmental Toxicology and Chemistry 23:638-647.
Pizzuto JE, Hession WC, and McBride M. 2000. Comparing gravel-bed rivers in paired urban and rural catchments of southeastern Pennsylvania. Geology 28:79-82.
Poff NL, Bledsoe BP, and Cuhaciyan CO. 2006. Hydrologic variation with land use across the contiguous United States: Geomorphic and ecological consequences for stream ecosystems. Geomorphology 79:264-285.
Raciti SM, Groffman PM, and Fahey TJ. 2008. Nitrogen retention in urban lawns and forests. Ecological Applications 18:1615-1626.
Riley SPD, Busteed GT, Kats LB, Vandergon TL, Lee LFS, Dagit RG, Kerby JL, Fisher RN, and Sauvajot RM. 2005. Effects of urbanization on the distribution and abundance of amphibians and invasive species in southern California streams. Conservation Biology 19:1894-1907.
Roberts ML and Bilby RE. 2009. Urbanization alters litterfall rates and nutrient inputs to small Puget Lowland streams. Journal of the North American Benthological Society 28:941-954.
Rose S and Peters NE. 2001. Effects of urbanization on streamflow in the Atlanta area (Georgia, USA): a comparative hydrological approach. Hydrological Processes 15:1441-1457.
Rose S. 2007. The effects of urbanization on the hydrochemistry of base flow within the Chattahoochee River Basin (Georgia, USA). Journal of Hydrology 341:42-54.
Roy AH and Shuster WD. 2009. Assessing impervious surface connectivity and applications for watershed management. Journal of theAmerican Water Resources Association 45:198-209.
Roy AH, Rosemond AD, Paul MJ, Leigh DS, and Wallace JB. 2003. Stream macroinvertebrate response to catchment urbanisation (Georgia, USA). Freshwater Biology 48:329-346.
Roy AH, Freeman MC, Freeman BJ, Wenger SJ, Ensign WE, and Meyer JL. 2005. Investigating hydrologic alteration as a mechanism of fish assemblage shifts in urbanizing streams. Journal of the North American Benthological Society 24:656-678.
Roy AH, Freeman BJ, and Freeman MC. 2007. Riparian influences on stream fish assemblage structure in urbanizing streams. Landscape Ecology 22:385-402.
Roy AH, Dybas AL, Fritz KM, and Lubbers HR. 2009. Urbanization affects the extent and hydrologic permanence of headwater streams in a midwestern US metropolitan area. Journal of the North American Benthological Society 28:911-928.
Runge JP, Peterson JT, and Martin CR. 2008. Survival and dispersal of hatchery-raised rainbow trout in a river basin undergoing urbanization. North American Journal of Fisheries Management 28:745-757.
Schiff R and Benoit G. 2007. Effects of impervious cover at multiple spatial scales on coastal watershed streams. Journal of the American Water Resources Association 43:712-730.
Schoonover JE, Lockaby BG, and Helms BS. 2006. Impacts of land cover on stream hydrology in the west Georgia piedmont, USA. Journal of Environmental Quality 35:2123-2131.
Scoggins M, McClintock NL, Gosselink L, and Bryer P. 2007. Occurrence of polycyclic aromatic hydrocarbons below coal-tar-sealed parking lots and effects on stream benthic macroinvertebrate communities. Journal of the North American Benthological Society 26:694-707.
Scott MC. 2006. Winners and losers among stream fishes in relation to land use legacies and urban development in the southeastern US. Biological Conservation 127:301-309.
Shoffner D and Royall D. 2008. Hydraulic habitat composition and diversity in rural and urban stream reaches of the North Carolina Piedmont (USA). River Research and Applications 24:1082-1103.
Singer GA and Battin TJ. 2007. Anthropogenic subsidies alter stream consumer-resource stoichiometry, biodiversity, and food chains. Ecological Applications 17:376-389.
Smith RF and Lamp WO. 2008. Comparison of insect communities between adjacent headwater and main-stem streams in urban and ruralwatersheds. Journal of the North American Benthological Society 27:161-175.
Snyder CD, Young JA, Villella R, and Lemarie DP. 2003. Influences of upland and riparian land use patterns on stream biotic integrity. Landscape Ecology 18:647-664.
REFERENCES
Sonneman JA, Walsh CJ, Breen PF, and Sharpe AK. 2001. Effects of urbanization on streams of the Melbourne region, Victoria, Australia. II. Benthic diatom communities. Freshwater Biology 46:553-565.
Sponseller RA, Benfield EF, and Valett HM. 2001. Relationships between land use, spatial scale and stream macroinvertebrate communities. Freshwater Biology 46:1409-1424.
Stepenuck KF, Crunkilton RL, and Wang LZ. 2002. Impacts of urban landuse on macroinvertebrate communities in southeastern Wisconsin streams. Journal of the American Water Resources Association 38:1041-1051.
Stranko SA, Hilderbrand RH, Morgan RP, Staley MW, Becker AJ, Roseberry-Lincoln A, Perry ES, and Jacobson PT. 2008. Brook trout declines with land cover and temperature changes in Maryland. North American Journal of Fisheries Management 28:1223-1232.
Taulbee WK, Nietch CT, Brown D, Ramakrishnan B, and Tompkins MJ. 2009. Ecosystem consequences of contrasting flow regimes in an urban effects stream mesocosm study. Journal of the American Water Resources Association 45:907-927.
Taylor SL, Roberts SC, Walsh CJ, and Hatt BE. 2004. Catchment urbanisation and increased benthic algal biomass in streams: linking mechanisms to management. Freshwater Biology 49:835-851.
Thompson AM, Kim K, and Vandermuss AJ. 2008a. Thermal characteristics of stormwater runoff from asphalt and sod surfaces. Journal of the American Water Resources Association 44:1325-1336.
Thompson A, Wilson T, Norman J, Gemechu AL, and Roa-Espinosa A. 2008b. Modeling the effect of summertime heating on urban runofftemperature. Journal of the American Water Resources Association 44:1548-1563.
Trimble SW. 1997. Contribution of stream channel erosion to sediment yield from an urbanizing watershed. Science 278:1442-1444.
U.S. EPA. 1988. Ambient Water U.S. EPA (1988) Ambient Water Quality Criteria for Chloride. U.S. Environmental Protection Agency,Washington DC. EPA 440/5-88-001.
U.S. EPA. 2000. Progress in Water Quality: An Evaluation of the National Investment in Municipal Wastewater Treatment. U.S. Environmental Protection Agency, Washington DC. EPA 832-R-00-008.
U.S. EPA. 2004. Report to Congress: Impacts and Control of CSOs and SSOs. U.S. Environmental Protection Agency, Washington DC. EPA 833-R-04-001.
Utz RM, Hilderbrand RH, and Boward DM. 2009. Identifying regional differences in threshold responses of aquatic invertebrates to land cover gradients. Ecological Indicators 9:556-567.
Vajda AM, Barber LB, Gray JL, Lopez EM, Woodling JD, and Norris DO. 2008. Reproductive disruption in fish downstream from an estrogenic wastewater effluent. Environmental Science & Technology 42:3407-3414.
Walsh CJ. 2004. Protection of in-stream biota from urban impacts: minimise catchment imperviousness or improve drainage design? Marine and Freshwater Research 55:317-326.
Walsh CJ. 2006. Biological indicators of stream health using macroinvertebrate assemblage composition: a comparison of sensitivity to an urban gradient. Marine and Freshwater Research 57:37-47.
Walsh CJ, Roy AH, Feminella JW, Cottingham PD, Groffman PM, and Morgan RP. 2005a. The urban stream syndrome: current knowledge and the search for a cure. Journal of the North American Benthological Society 24:706-723.
Walsh CJ, Fletcher TD, and Ladson AR. 2005b. Stream restoration in urban catchments through redesigning stormwater systems: looking to the catchment to save the stream. Journal of the North American Benthological Society 24:690-705.
Walsh CJ, Waller KA, Gehling J, and MacNally R. 2007. Riverine invertebrate assemblages are degraded more by catchment urbanisation than by riparian deforestation. Freshwater Biology 52:574-587.
Walters DM, Leigh DS, Freeman MC, Freeman BJ, and Pringle CM. 2003. Geomorphology and fish assemblages in a Piedmont river basin, USA. Freshwater Biology 48:1950-1970.
Walters DM, Roy AH, and Leigh DS. 2009. Environmental indicators of macroinvertebrate and fish assemblage integrity in urbanizing watersheds. Ecological Indicators 9:1222-1233.
Wang LH and Kanehl P. 2003. Influences of watershed urbanization and instream habitat on macroinvertebrates in cold water streams. Journal of the American Water Resources Association 39:1181-1196.
REFERENCES
Wang LZ, Lyons J, and Kanehl P. 2001. Impacts of urbanization on stream habitat and fish across multiple spatial scales. Environmental Management 28:255-266.
Wang LZ, Lyons J, and Kanehl P. 2003. Impacts of urban land cover on trout streams in Wisconsin and Minnesota. Transactions of the American Fisheries Society 132:825-839.
Watkinson AJ, Murby EJ, Kolpin DW, and Costanzo SD. 2009. The occurrence of antibiotics in an urban watershed: From wastewater to drinking water. Science of the Total Environment 407:2711-2723.
Wenger SJ, Peterson JT, Freeman MC, Freeman BJ, and Homans DD. 2008. Stream fish occurrence in response to impervious cover, historic land use, and hydrogeomorphic factors. Canadian Journal of Fisheries and Aquatic Sciences 65:1250-1264.
Wenger SJ, Roy AH, Jackson CR, Bernhardt ES, Carter TL, Filoso S, Gibson CA, Hession WC, Kaushal SS, Marti E, Meyer JL, Palmer MA, Paul MJ, Purcell AH, Ramirez A, Rosemond AD, Schofield KA, Sudduth EB, and Walsh CJ. 2009. Twenty-six key research questions in urbanstream ecology: an assessment of the state of the science. Journal of the North American Benthological Society 28:1080-1098.
Winter JG and Duthie HC. 2000. Epilithic diatoms as indicators of stream total N and total P concentration. Journal of the North American Benthological Society 19:32-49.
Wollheim WM, Pellerin BA, Vorosmarty CJ, and Hopkinson CS. 2005. N retention in urbanizing headwater catchments. Ecosystems 8:871-884.
Wolman MG. 1967. A cycle of sedimentation and erosion in urban river channels. Geografiska Annaler 49A:385-395.
Woodcock TS and Huryn AD. 2005. Leaf litter processing and invertebrate assemblages along a pollution gradient in a Maine (USA) headwater stream. Environmental Pollution 134:363-375.
Woodling JD, Lopez EM, Maldonado TA, Norris DO, and Vajda AM. 2006. Intersex and other reproductive disruption of fish in wastewater effluent dominated Colorado streams. Comparative Biochemistry and Physiology C-Toxicology & Pharmacology 144:10-15.