Embed Size (px)
Citation preview

THE CALIBRATION AND DATA PRODUCTS OF GALEX
Patrick Morrissey,1Tim Conrow,
1Tom A. Barlow,
1Todd Small,
1Mark Seibert,
2Ted K. Wyder,
1
Tamas Budavari,3Stephane Arnouts,
4Peter G. Friedman,
1Karl Forster,
1D. Christopher Martin,
1
Susan G. Neff,5David Schiminovich,
6Luciana Bianchi,
7Jose Donas,
4Timothy M. Heckman,
3
Young-Wook Lee,8Barry F. Madore,
2Bruno Milliard,
4R. Michael Rich,
9
Alex S. Szalay,3Barry Y. Welsh,
10and Sukyoung K. Yi
8
Received 2006 December 8; accepted 2007 May 16
ABSTRACT
We describe the calibration status and data products pertaining to the GR2 and GR3 data releases of the GalaxyEvolution Explorer (GALEX ). These releases have identical pipeline calibrations that are significantly improved overthe GR1 data release.GALEX continues to survey the sky in the far-ultraviolet (FUV,�154 nm) and near-ultraviolet(NUV,�232 nm) bands, providing simultaneous imaging with a pair of photon-counting, microchannel plate, delayline readout detectors. These 1.25� field of view detectors are well suited to ultraviolet observations because oftheir excellent red rejection and negligible background. A dithered mode of observing and photon list output posecomplex requirements on the data processing pipeline, entangling detector calibrations, and aspect reconstructionalgorithms. Recent improvements have achieved photometric repeatability of 0.05 and 0.03 mAB in the FUVandNUV, respectively. We have detected a long-term drift of order 1% FUVand 6% NUVover the mission. Astrometricprecision is of order 0.500 rms in both bands. In this paper we provide the GALEX user with a broad overview of thecalibration issues likely to be confronted in the current release. Improvements are likely as the GALEX missioncontinues into an extended phase with a healthy instrument, no consumables, and increased opportunities for guestinvestigations.
Subject headinggs: space vehicles — surveys — telescopes — ultraviolet: general
Online material: color figures
1. INTRODUCTION
We describe the calibration status and data products pertainingto the combined GR2 and GR3 data releases of the GalaxyEvolution Explorer (GALEX ).GALEX is a NASASmall Explorermission performing an all-sky ultraviolet (UV) survey in the far-UV (FUV � 154 nm) and near-UV (NUV � 232 nm) bands with4Y600 resolution and �50 cm2 effective area. At the time of thiswriting, over 13,500 deg2 of this survey are available to the publicvia the Internet from theMultimissionArchive at Space TelescopeScience Institute (MAST).11
The GR2 and GR3 releases have identical pipeline calibrationsthat are significantly improved over the previous GR1 release.Photometric precision at a given epoch is 0.05 and 0.03 mAB inthe FUV and NUV, respectively. We have detected a long-term
drift of order 1% FUV and 6% NUV over the mission. The as-trometric precision has been improved to 0.500 rms.The path from raw telemetry to corrected catalogs, images, and
spectra is a complicated one for the GALEX pipeline. This factis illustrated by Figure 1, which shows a GALEX image in de-tector and sky coordinates,which are representative of the pre- andpostpipeline images. This overview highlights the data quality,errors, and peculiarities that are likely to confront astronomers.As is true for any large data set, knowledge of these basic char-acteristics is essential to avoid confusion.The GALEX mission continues into an extended phase with a
healthy instrument, no consumables, and increased opportunitiesfor guest investigations. While the survey is ongoing, it is likelythat we will make improvements to the calibration and discoveradditional sources of error. We expect to provide updates to thispaper on the Web,12 as well as in the literature.This paper is organized as follows. In x 2 we summarize the
design of the mission and instrument. In x 3 we describe howGALEX data are reconstructed and what the key pipeline prod-ucts are. In x 4 we describe the photometric calibration of thedata, including a discussion of saturation effects and drift. In x 5we describe the instrument resolution across the field of view andas a function of detector gain. In x 6 we describe the astrometricperformance of the instrument. In x 7 we describe the spectros-copy calibration and present an example extraction. Finally, inx 8 we summarize the key points of the paper.
2. MISSION AND INSTRUMENT OVERVIEW
GALEX was launched on an Orbital Sciences Corporation(Orbital) Pegasus rocket on 2003 April 28 at 12 : 00 UT from the
A
1 California Institute of Technology, MC 405-47, 1200 East California Bou-levard, Pasadena, CA 91125.
2 Observatories of the Carnegie Institution ofWashington, 813 Santa BarbaraStreet, Pasadena, CA 91101.
3 Department of Physics and Astronomy, The Johns Hopkins University,Homewood Campus, Baltimore, MD 21218.
4 Laboratoire d’Astrophysique de Marseille, BP 8, Traverse du Siphon, 13376Marseille Cedex 12, France.
5 Laboratory for Astronomy and Solar Physics, NASAGoddard Space FlightCenter, Greenbelt, MD 20771.
6 Department of Astronomy, Columbia University, New York, NY 10027.7 Center for Astrophysical Sciences, The Johns Hopkins University, 3400
North Charles Street, Baltimore, MD 21218.8 Center for Space Astrophysics, Yonsei University, Seoul 120-749, Korea.9 Department of Physics andAstronomy,University of California, LosAngeles,
CA 90095.10 Space Sciences Laboratory, University of California at Berkeley, 601
Campbell Hall, Berkeley, CA 94720.11 See http://galex.stsci.edu. 12 See http://www.galex.caltech.edu.
682
The Astrophysical Journal Supplement Series, 173:682Y697, 2007 December
# 2007. The American Astronomical Society. All rights reserved. Printed in U.S.A.

Kennedy Space Center into a circular, 700 km, 29� inclinationorbit. This 0.5 m diameter instrument has a very wide 1.25
�field
of view sensitive to mAB � 21 in the All Sky Imaging Survey(AIS), and tomAB � 25 in the Deep Imaging Survey (DIS). Theinstrument provides simultaneous FUVandNUVimaging with apair of photon-counting, microchannel plate, delay line readoutdetectors. These detectors arewell suited to ultraviolet observationsbecause of their excellent red rejection and negligible background.An objective grism mode is also available for low-resolutionspectroscopy. The last comparable survey in thiswavelength range,which extended to mAB � 9, was performed by the Belgian/UKUltraviolet Sky Survey Telescope on the TD1 satellite launchedin 1972 and described by Boksenberg et al. (1973).
GALEX makes science observations on the night side of eachorbit (to keep sky background to a minimum) during ‘‘eclipses’’that are typically in the range 1500Y1800 s. In the AIS, as manyas 12 targets are observed during an eclipse, while the MediumImaging Survey (MIS) has one target per eclipse and the DIS re-turns to the same target for 30 or more eclipses. As of this writing,we have observed over 19,000 deg2 of sky and accumulated over4 terabytes of science telemetry. An overview of key performanceparameters is presented in Table 1.
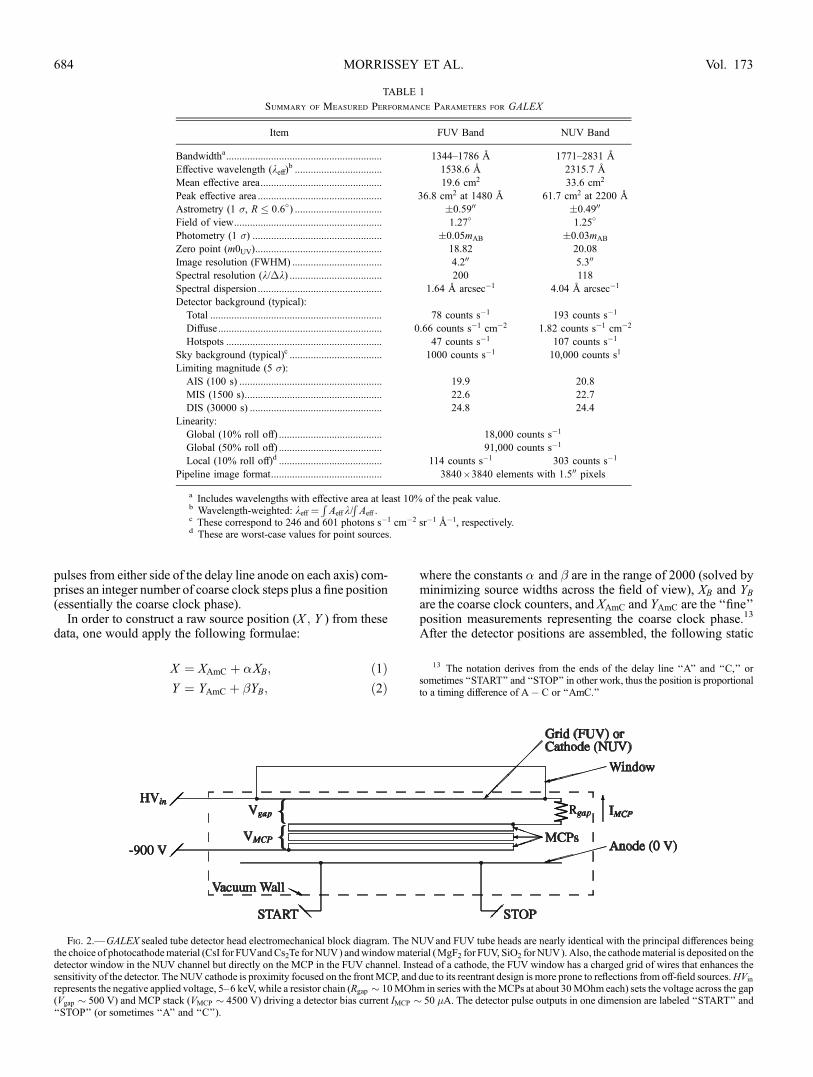
A GALEX detector head is shown schematically in Figure 2.Individual photons incident at the cathode set off an isolated ava-lanche of current inside parallel 10Y12�mdiametermicrochannelplate (MCP) pores as they accelerate through a few keV field. Theresulting charge cloud at the rear of theMCP stack, approximately107 electrons in size, is deposited on a double-layer anode, di-vided, and finally measured at each of four outputs. The layers ofthe anode form a pair of orthogonal delay lines. Timing differ-ences measured for the charge pulses at each corner of the anodeare proportional to the position of the initiating photon event. Forfaint UVobservations, the combination of low background (zeroread noise) and high red rejection that these detectors possess rep-resents a favorable trade-off against the superior QE and fieldflatness of more conventional CCD detectors. Furthermore, MCPdetectors do not require cooling, an important consideration in thecontamination-sensitiveUVband. In order to improve photometricperformance, observations are dithered in a spiral pattern approx-imately 10 in diameter (at a rate of approximately 0.5 revolutions
per minute) that smooth out small-scale variations in the flat fieldand reduce bright source fatigue on the MCPs.
Amore detailed instrument overview is provided inMorrisseyet al. (2005)while themission design is described byMartin et al.(2005). Further details of our mission operations experience aredescribed in Forster et al. (2006) and Morrissey (2006).
3. IMAGE RECONSTRUCTION OVERVIEW
The GALEX detector output is a list of time-ordered 40 bitphoton positions and pulse heights. These data are delivered to theinstrument Data Processing Unit (DPU), which adds a timingstamp every 5 ms (or every 20 �s in uncompressed mode). Thetime stamp is derived from the spacecraft clock, which has a driftof the order of 1 s eachweek that is correctedwith ground updates.Data are stored in the 2.8 GB ring buffer of a Solid State Recorder(SSR), which is downlinked to a ground station approximatelyfour times each day.
The ground pipeline reconstructs a list of photon positions andarrival times into an image. Broadly speaking, the photon lists arecorrected for detector effects and imagemotion, projected into skycoordinates, binned into images, flat-fielded, and finally back-ground-subtracted. These final image products are then scannedby the open-source SExtractor program (Bertin &Arnouts 1996)to produce catalogs of source positions and fluxes. The steps alongthis path are described in more detail in the following sections.
3.1. Static Calibration
The static calibrations are those used to assemble raw detectorevent positions into accurate locations in theGALEX focal plane.They also flag events that are not photon generated, such as theperiodic ‘‘STIM’’ pulses that are always electronically super-imposed (in parallel with real photon events) on the detector an-odes, and regions on the MCPs that are dominated by hotspots.
Each photon event in theGALEX science telemetry is a heavilyencoded group of fields that, when decoded and assembled,produces key values listed in Table 2. In the GALEX design(Jelinsky et al. 2003), a free-running coarse clock subdividesthe large detector areas into an 8 ; 8 grid. Detector event pulsesare measured asynchronously while this clock runs, so that eachposition (proportional to the measured arrival time difference of
Fig. 1.—Left panel: AGALEXNUV ‘‘dose’’ image ofM101 in spacecraft coordinates clearly showing the 10 dither pattern, which is used for all observations to smoothout the effects of the detector flat field and reduce MCP fatigue. Right panel: The fully processed, background-subtracted NUV image of M101 in sky coordinates, whichprovides the basis for the source catalog data.
GALEX: CALIBRATION AND DATA PRODUCTS 683
pulses from either side of the delay line anode on each axis) com-prises an integer number of coarse clock steps plus a fine position(essentially the coarse clock phase).
In order to construct a raw source position (X ; Y ) from thesedata, one would apply the following formulae:
X ¼ XAmC þ �XB; ð1ÞY ¼ YAmC þ �YB; ð2Þ
where the constants � and � are in the range of 2000 (solved byminimizing source widths across the field of view), XB and YBare the coarse clock counters, and XAmC and YAmC are the ‘‘fine’’position measurements representing the coarse clock phase.13
After the detector positions are assembled, the following static
TABLE 1
Summary of Measured Performance Parameters for GALEX
Item FUV Band NUV Band
Bandwidtha........................................................... 1344Y1786 8 1771Y2831 8Effective wavelength (keff)
b ................................. 1538.6 8 2315.7 8Mean effective area.............................................. 19.6 cm2 33.6 cm2
Peak effective area ............................................... 36.8 cm2 at 1480 8 61.7 cm2 at 2200 8Astrometry (1 �, R � 0:6�) ................................. �0.5900 �0.4900
Field of view........................................................ 1.27� 1.25�
Photometry (1 �) ................................................. �0.05mAB �0.03mAB
Zero point (m0UV)................................................ 18.82 20.08
Image resolution (FWHM) .................................. 4.200 5.300
Spectral resolution (k/�k) ................................... 200 118
Spectral dispersion ............................................... 1.64 8 arcsec�1 4.04 8 arcsec�1
Detector background (typical):
Total ................................................................. 78 counts s�1 193 counts s�1
Diffuse.............................................................. 0.66 counts s�1 cm�2 1.82 counts s�1 cm�2
Hotspots ........................................................... 47 counts s�1 107 counts s�1
Sky background (typical)c ................................... 1000 counts s�1 10,000 counts s1
Limiting magnitude (5 �):
AIS (100 s) ...................................................... 19.9 20.8
MIS (1500 s).................................................... 22.6 22.7
DIS (30000 s) .................................................. 24.8 24.4
Linearity:
Global (10% roll off) ....................................... 18,000 counts s�1
Global (50% roll off) ....................................... 91,000 counts s�1
Local (10% roll off)d ....................................... 114 counts s�1 303 counts s�1
Pipeline image format.......................................... 3840 ; 3840 elements with 1.500 pixels
a Includes wavelengths with effective area at least 10% of the peak value.b Wavelength-weighted: keA¼
RAeAk/
RAeA.
c These correspond to 246 and 601 photons s�1 cm�2 sr�1 8�1, respectively.d These are worst-case values for point sources.
Fig. 2.—GALEX sealed tube detector head electromechanical block diagram. The NUVand FUV tube heads are nearly identical with the principal differences beingthe choice of photocathodematerial (CsI for FUVandCs2Te forNUV) andwindowmaterial (MgF2 for FUV, SiO2 forNUV). Also, the cathodematerial is deposited on thedetector window in the NUV channel but directly on the MCP in the FUV channel. Instead of a cathode, the FUV window has a charged grid of wires that enhances thesensitivity of the detector. The NUV cathode is proximity focused on the frontMCP, and due to its reentrant design is more prone to reflections from off-field sources.HVin
represents the negative applied voltage, 5Y6 keV, while a resistor chain (Rgap � 10MOhm in series with theMCPs at about 30MOhm each) sets the voltage across the gap(Vgap � 500 V) and MCP stack (VMCP � 4500 V) driving a detector bias current IMCP � 50 �A. The detector pulse outputs in one dimension are labeled ‘‘START’’ and‘‘STOP’’ (or sometimes ‘‘A’’ and ‘‘C’’).
13 The notation derives from the ends of the delay line ‘‘A’’ and ‘‘C,’’ orsometimes ‘‘START’’ and ‘‘STOP’’ in other work, thus the position is proportionalto a timing difference of A� C or ‘‘AmC.’’
MORRISSEY ET AL.684 Vol. 173

corrections are applied (in order) to correct the raw positions to alinear representation of the actual source position in the focal plane:
Centering and scaling.—Coarsely scales the raw positionsfrom bins tomicrons. The scale factors are different for each axis.
Wiggle.—TheGALEX coarse-bit subarray approach allows de-generate combinations of coarse and fine components for a givendetector location. Each of thesemay have a slightly different elec-tronic nonlinearity correction owing to the differing phases of thetime-to-amplitude converter (TAC) for each event. The image ofa single point source on the detector is thus blurred by the super-position of all of the TAC data, an effect referred to as wiggle.This contrasts with smaller, more conventional time-to-amplitudeconversion systems. These do not utilize a coarse counter bit andtranslate all electronic nonlinearities into source position errorsrather than source widths. With careful part selection, ‘‘wiggle’’in the flight units has been minimized considerably. In order toeliminate it completely, each detected event includes a 5 bit valueXA, which represents where in the TAC range each measurementwas made. Residual electronic nonlinearities are then removedusing lookup tables for combinations of (X ; XA) and (Y ; XA).Both axes use the sameXA data because theX and Ypulses are cor-related in time for a given detector position.
Walk.—This transformation corrects position versus pulseheight (Q) errors. A lookup table correction applied in a similarmanner as wiggle, reflective of the fact that the electronics cannotperfectly compensate for pulse sizes that vary by a factor of 10across the detector.
Spatial nonlinearity (distortion).—A lookup table correctshigh-voltage detector edge effects, which cause electrons to bendfrom their optimal path, distorting the image especially near theedge of the field.
Hotspot masking.—Each detector has numerous small, highcount rate features resulting from a combination of microscopicMCP debris and channel defects that combined generate abouthalf of the intrinsic detector background. These spots come andgo and are best handled by direct masking, which eliminates onlyabout a percent of the detector area. New masks are generatedroughly annually; hotspots are generally easy to pick out of imagesbecause they ‘‘reverse dither’’ (since they are fixed in detectorspace) and create �10 circular artifacts in GALEX sky-spaceimages. In the data pipeline, the hot spot masks create localizedregions of zero effective sensitivity in detector space, one reasonwhy dithered observations are preferred for these detectors. De-pending on pointing accuracy in a given observation, the dithertypically maps these regions into ‘‘donuts’’ of reduced (but notzero) response on the sky.
3.2. Dynamic Aspect Correction
The fully corrected event positions in spacecraft coordinatesaccurately record where each photon landed in the GALEX focalplane. The next step is to reconstruct the spacecraft pointing onthe sky as a function of time in order to remove the dither patternfrom the observed data. This is the three-parameter ‘‘aspect,’’whichincludes the right ascension, declination, and roll of the telescopeboresight. For imaging mode data, a precise estimate is arrived atby refining the spacecraft Attitude Control System (ACS) point-ing estimate with NUV data14 binned into 1 s slices. These snap-shot images are each matched to the ACT catalog (Urban et al.1998) of known stars,15 and the average error vector from thematches to the catalog stars are used to establish a correction toapply to the ACS estimate. The source positions are then trans-formed to sky coordinates (J2000.0) using a Gnomonic projec-tion based on the pointing at the interpolated time.
Grism data undergoes a similar process, but the software cannotmatch spectra to known stars at this stage of processing. A relativeaspect solution is performed based solely on the instantaneousspectral image positions, and astrometric refinement is added at alater stage.
Once sky coordinates have been assigned to each photon, an‘‘extended photon list’’ is computed for internal use by the pipe-line in forming the final data products. In cases where detailed,time-dependent behavior of one ormore objects over the course ofan exposure is of interest, the extended photon list can be writtenout to a so called ‘‘x-file’’ by special request.
3.3. Pipeline Products
Images and catalogs from various stages of pipeline processingreveal many characteristics of the complex, multidimensionalGALEX data set and are included with each data release as pipe-line products. A description of key products is provided here forreference.
The corrected photon data are binned into images and fluxcalibrated in order to form the basis for theGALEX catalogs. Countimages (-cnt), which contain aspect-corrected detector counts persky pixel are scaled by the effective area and exposure time to formthe flux-calibrated intensity (-int ) images. This step is accom-plished with the relative response (-rr) image, which contains theeffective exposure for each pixel:
rr(X ; Y ) ¼ �Tt¼0Cat X (t); Y (t)½ � ; 1� fdead(t)½ � ; dt(t);
where Cat X (t); Y (t)½ � is the detector flat field16 shifted to prop-erly align with the dithered image time slice, fdead is the globalelectronic dead time based on the measured STIM pulser rateduring each time slice,17 and dt(t) is the fraction of each 1 s time
TABLE 2
Key Data Contained in the GALEX RAW6 Format Photon Lists
Column Bits Description
t ..................................... 40 Event detection timea
XAmC .............................. 12 Raw X detector position in FEE pixels
YAmC .............................. 12 Raw Y detector position in FEE pixels
XA .................................. 5 Wiggle (the phase of the TAC)
XB .................................. 3 X-axis coarse clock
YB .................................. 3 Y-axis coarse clock
Q.................................... 5 Detected pulse height
Note.—Photons from the detector itself are not time stamped but rather timeordered, and the time stamp is added by the DPU before being written to theSSR.
a In high-resolution mode, the timing precision uses 40 bits to attain 20 �sresolution; however, this mode is rarely used. For most data, only 32 bits are sig-nificant, attaining 5 ms resolution.
14 The process will run with FUV-only data, although owing to the generallydecreased numbers and brightnesses of stars in FUV data, some parameters suchas the interpolation interval need to be adjusted.
15 Occasionally, matches to known stars cannot be found, usually due topointing errors. In these rare cases, a good point spread function (PSF) is achievedby performing the aspect refinement relative to any sources of emission detectedin the field that are reasonably compact. This is called relative aspect refinementmode and results in images with good PSFs but poor absolute astrometry. Roll isnot refined in relative mode.
16 The flat field has a value of 1 in regions for which a zero-point-magnitudesource generates exactly 1 deadtime-corrected photon s�1.
17 Since the electronic STIM pulses occur at a precisely known rate, thefraction that are missing from the event list over a given interval will be known.This is the fractional dead time, which corrects the global rates only and does notaccount for local MCP saturation.
GALEX: CALIBRATION AND DATA PRODUCTS 685No. 2, 2007

slice during which data were collected (i.e., HV was on and thedetector was otherwise in a nominal observing mode). Buildingthe effective exposure time in this way properly handles the factthat the edges of the image receive less exposure than the middleand that the sources each sample a 10 region on the flat field. Thehigh-resolution relative response image (-rrhr), which properlymatches the count and intensity map pixel scales, is up-sampledfrom the 600 relative response array. The intensity image is simply thecount image divided by the high-resolution relative response image.
As a final step, the background in each intensity imagemust beestimated and removed. Since the GALEX detectors have neg-ligible intrinsic background and the UV sky is dark, estimationof the true background is not properly handled by the codewithinSExtractor. Instead, we create a custom threshold image forSExtractor that allows a bypass of the normal process for dis-tinguishing low rate sources from background. The typical skybackground count rates in high Galactic latitude GALEX point-ings are�10�4 (�10�3) photons s�1 arcsec�2 in the FUV (NUV),thus it is necessary to use the full Poisson distribution. The back-ground is determined in a set of large bins, 19200 on a side. Inimages with exposure times greater than 10,000 s, the bins are9600 on a side. For the Poisson distribution, the probability ofobserving greater than or equal to k events for a mean rate x isgiven by the incomplete gamma function Pk(x) (Press et al. 1992,p. 216). The average is computed iteratively within each back-ground bin by clipping out high pixels where Pk(x) < 1:35 ;10�3, a probability equivalent to 3 � for a Gaussian distribution.Even after clipping, bright or extended sources can still bias thebackground determination, therefore, a 5 ; 5 median filter is ap-plied to the background bins. The resulting background values arelinearly interpolated to the full resolution of the images. We havedetermined that the background may be biased by a few percentdue to contamination from the wings of objects. To address this
problem, background estimation and source extraction softwareis run twice on each GALEX image. The second run uses sourceposition data from the first iteration to mask out source pixelsand recompute the sky background and background-subtractedintensity images. The resulting background image (-skybg) issubtracted from the intensity image to form the background-subtracted intensity image (-intbgsub), which is the image scannedby SExtractor.There remain issues with the background at the 5% level that
affect the MIS survey at the faint end. Furthermore, there are nu-merous artifacts not removed by the current pipeline that the usershould be alert for. These include bright star glints in the NUVimages near the edge of the detector window; large out-of-focuspupil images resulting from reflections in the imaging windowand dichroic beam splitter; a 10 diameter skirt around bright NUVsources (at the few percent level in total energy) resulting fromthe proximity-focused photocathode; and photoemission and dif-fraction from the quantum-efficiency (QE) enhancing grid wireson the FUV detector window that appear as linear features aroundbright sources. Work is being done to flag and remove these fea-tures automatically in the pipeline software, but at present theyamount to a small fraction of the survey coverage area (�1%).The primary pipeline image products and descriptions are listed
in Table 3, while catalog products are listed in Table 4. All of thecatalog output products are generated by SExtractor, with theexception of the very useful merged catalog (-mcat), which com-bines FUVand NUV data in one table and adds derived columnsincluding the detector coordinates of a source, detector intrinsicpulse height, number and brightness of nearby neighbors to asource, and many more. Matches between the bands are made byassigning a match probability to each pair of sources using thesource separations and positional uncertainties. Sources withsignal-to-noise (S/N) ratio of less than 2 or a separation greater
TABLE 3
A Summary of GALEX Pipeline Product Array Content and Format
Product Extension Format Units Scale Description
Artifact flags ....................................... -flags 480 ; 480 1200 pixel�1 Artifact flags for each pixel
Background-subtracted intensity......... -intbgsub 3840 ; 3840 counts s�1 1.500 pixel�1 Intensity-sky background
Count................................................... -cnt 3840 ; 3840 counts 1.500 pixel�1 Aspect-corrected image, no flat field
Dose .................................................... -scdose 2250 ; 2250 counts 300 pixel�1 Detector space, corrected for walk, wiggle, and distortion
Exposure.............................................. -exp 960 ; 960 s 600 pixel�1 Exposure, uncorrected for flat field or dead time
Intensity............................................... -int 3840 ; 3840 counts s�1 1.500 pixel�1 Count image divided by relative response image
Movie .................................................. -movie 480 ; 480 counts 1200 pixel�1 Count map slices at 16 s intervals
Object mask ........................................ -objmask 3840 ; 3840 1.500 pixel�1 Areas masked during sky background estimation
Pulse height......................................... -scq 2250 ; 2250 bins 300 pixel�1 Average pulse height per pixel
Relative response ................................ -rrhr 3840 ; 3840 s 1.500 pixel�1 Effective exposure, corrected for dither, flat field, and dead time
Relative response ................................ -rr 960 ; 960 s 600 pixel�1 Effective exposure, corrected for dither, flat field, and dead time
Sky background .................................. -skybg 3840 ; 3840 counts s�1 1.500 pixel�1 Sky background estimate
Threshold ............................................ -wt 3840 ; 3840 1.500 pixel�1 Background-subtracted intensity map divided by
estimated Poisson noise
TABLE 4
Binary Tables and Related Products Generated by the GALEX Pipeline
Extension Description
-cat.............................. Primary SExtractor source catalogs for each band
-fcat ............................ SExtractor catalog of NUV extractions based on FUV coordinates
-gauss ......................... Listing of the Gaussian filter elements used by SExtractor for image convolution
-mcat........................... Merged catalog for both NUV and FUV extractions
-ncat............................ SExtractor catalog of FUV extractions based on NUV coordinates
-sexcols....................... Listing of SExtractor catalog column names
-sexparams ................. Listing of SExtractor parameters used
MORRISSEY ET AL.686 Vol. 173

than 300 are notmatched across bands (but do appear in themergedcatalog).GALEX fields are uncrowded enough that the probabilityof a mismatch is very small; however, a multiple-candidate chaintechnique is used to assure that candidates are always matchedthe sameway regardless of the order inwhich the process is started.
The GALEX data products are made available to the generalpublic through the GALEX Science Database at MAST. A dedi-cated Web site provides access to the pipeline output files via aWeb-based browser, as well as other derived products, such asJPEG images. The catalog data are also stored in a commercialSQL Server database engine fine-tuned for astronomy applica-tions, which provides sophisticated query interfaces supporting,for example, efficient spatial and color searches. The GALEXMASTdatabase also contains enhancements over the photometricpipeline outputs, e.g., spatial cross-matching to the Sloan DigitalSky Survey (SDSS) catalog. Also, since adjacent GALEX fieldsoverlap slightly, a primary resolution algorithm deals with theproblem of unique sample selection. The formalGALEX footprintdefinitions of the GALEX surveys are published in the NationalVirtual Observatory’s online Footprint Service (Budavari et al.2007). On this site,18 one can not only search and visualize theGALEX sky coverage, but also compute the exact area in squaredegrees or intersect it with other surveys.
4. PHOTOMETRY
4.1. GALEX Magnitude Reference System
The GALEX photometric calibration is tied to the HubbleSpace Telescope (HST ) through reference spectra supplied inthe CALSPEC database and described by Bohlin et al. (2001).Almost all of the white dwarfs in this database are too bright fora photon-counting instrument such as GALEX in direct imag-ing mode. As such, we are restricted to the dimmest sources inthe catalog, which are all ultimately based on the InternationalUltraviolet Observer (IUE ) calibration. All of these data havebeen reprocessed for the HST calibration program, as detailed inBohlin (1996). The GALEX calibration is thus traceable to a hy-drogen white dwarf model scaled using the ground-based pho-tometry of Landolt (1992) in combinationwith severalwhite dwarftransfer standards measured with the HST Faint Object Spectro-graph. The combination of models and measurements was usedto define corrections to the IUE calibration, thus transferring theHST calibration and allowing a fairly large group of standardsfrom the IUE library to enter the CALSPEC database. Of these,we have observed 18 as detailed in Table 5; however, we use oneof the dimmest, LDS749b, as our primary standard for direct im-aging. For the most part this white dwarf is in the linear range ofthe GALEX detectors—bright enough for high S/N measurementsin just a few minutes, but dim enough not to saturate the micro-channel plates. At the edge of the field in the NUV, where the de-tector gain is lowest, we apply a �20% correction for local satu-ration. This effect was discovered relatively recently as our databaseof white dwarf observations has expanded to include a much finersampling of the detectors in regions where the gain is an issue.19
At the time of this writing we are planning observations of the(dimmest) CALSPEC white dwarf, LB227, in order to improveour confidence in the NUV zero point. Unfortunately, this sourceis not much dimmer than LDS749b, but since we believe the sat-uration of LDS749b is mild it should provide very useful veri-fication of our saturation correction.
4.2. Magnitude Zero Point
GALEX uses the ABmagnitude system of Oke &Gunn (1983)with the FUVand NUV magnitudes defined as follows:
mUV ¼ m0UV � 2:5 log fUV:
Here fUV is the dead-timeYcorrected count rate for a given sourcedivided by the flat-field map, which has a median value of order0.85, and m0UV is the zero point that corresponds to the ABmagnitude of a 1 count s�1 flat-fieldYcorrected detection. Thereare independent relative response functions, and the zero pointsare
m0FUV ¼ 18:82; ð3Þm0NUV ¼ 20:08: ð4Þ
The GALEX project has maintained these zero points constant;they are based on the imaging-mode bandpass determined duringground calibration. Improvements in calibration have been in-corporated by adjusting the flat field, which is a stacked skybackground imagemodified by an interpolated grid ofwhite dwarfmeasurements. Since GALEX has a large field of view, this hasthe effect of moving the positions in the field of view for whichsourceswith zero-pointmagnitudes correspond to a true 1 count s�1
at the detector. For the most part this is not a major consequence
TABLE 5
HST White Dwarf Standards Observed by GALEX
Star mFUVa mNUV
a � (J2000.0)b � (J2000.0)b
GD50.......................... 11.98 12.57 3 48 50.4 �1 1 26.8
HZ4 ............................ 14.53 14.50 3 55 22.0 9 47 18.2
HZ2 ............................ 12.86 13.25 4 12 43.6 11 51 49.9
G191B2B ................... . . . 10.17 5 5 30.7 52 49 49.3
GD108........................ 12.39 12.77 10 0 47.3 �8 26 28.5
HZ21 .......................... 12.55 13.13 12 13 56.3 32 56 30.8
GD153........................ 11.33 11.91 12 57 2.4 22 1 53.6
HZ43 .......................... 10.75 11.36 13 16 21.8 29 5 57.8
HZ44 .......................... 10.02 10.27 13 23 35.0 36 7 58.8
GRWp70d5824 .......... 12.14 12.75 13 38 49.2 70 17 4.6
SAP041C.................... . . . 16.69 14 51 58 71 43 17.4
BD +33�2642............. 10.51 10.47 15 51 59.9 32 56 54.8
SAP177D ................... . . . 18.35 15 59 13.5 47 36 41.4
SAP330E.................... . . . 17.84 16 31 33.8 30 8 46.3
LDS749Bc .................. 15.57 14.71 21 32 16.4 0 15 15.0
G93-48....................... 12.14 12.39 21 52 25.2 2 23 17.9
NGC7293 ................... 10.93 11.70 22 29 38.5 �21 9 47.9
LTT9491..................... 16.09 14.58 23 19 35.4 �18 54 32.0
a Magnitudes shown are predictions based on the GALEX bandpass and pub-licly available reference spectra from theHSTCALSPEC database at http://www.stsci.edu /instruments/observatory/cds/calspec.html.
b Coordinates areGALEX-measured in theNUV.One exception isBD+33�2642,which was only observed in grism mode; the coordinate provided is from Bohlinet al. (2001). Units of right ascension are hours, minutes, and seconds, and unitsof declination are degrees, arcminutes, and arcseconds.
c This white dwarf is the primary GALEX standard.
18 See http://voservices.net / footprint.19 Since the detectorMCPs are clamped at the edges, there is less chance for a
charge packet at the edge of the field to spread laterally while traversing the stack.At the detector center, where there are small gaps between the plates, charge canspread across the pores. Thus, the edges of the detectors tend to saturatemore quicklythan the centers. This effect can be seen for bright objects with multiple measure-ments by plotting the observed magnitude against the unsaturated detector pulseheight, #uv_q, tabulated in the merged catalog for each source. This quantity isthe normal unsaturated pulse height of the detector at the location the source wasmeasured. Note that the effect is minimized for largemeasuring apertures becausethe core of the PSF is primarily affected.
GALEX: CALIBRATION AND DATA PRODUCTS 687No. 2, 2007

since the flat-field peak-to-valley variations for most of the use-ful field amount to about a factor of 2 even in FUV, and just 15%in NUV. There is thus only a modest effect on the estimation ofthe true expected noise for a given source with field position. Inorder to estimate any systematics resulting from application of thenew flat field, a large sample of sources common to both the GR1and GR2/GR3 releases have been compared. We find that onaverage sources in GR2/GR3 are shifted 0.04 and 0.01 mAB
fainter in FUVandNUV, respectively, compared toGR1.Onemustof course be careful applying these figures to any individual mea-surement because the flat has changed shape as well as its averagevalue.
We have measured a drift in GR2/GR3 photometry of 0:003�0:001 mag yr�1 FUV and 0:016 � 0:0005 mag yr�1 NUV. Thiswas identified with two independent means. In the first method(yielding the quoted results), we compared the GR2/GR3 pho-tometry of 197 FUV and 547 NUV deep field sources betweenmagnitudes 15 and 20 measured at approximately yearly inter-vals over the course of the mission. We have checked this resultagainst the LDS749b white dwarf data; however, this secondresult required considerable reprocessing. By design, theGR2/GR3sample ofwhite dwarfmeasurements through2005 shows no drift.Eachmeasurementwas given equal footing in order to improve thespatial sampling, which only included 20 measurements per yearearly in the mission. In 2005, we identified the NUVwhite dwarfsaturation effect in low gain areas and also recovered the FUVdetector from a major anomaly. In light of these circumstances,we implemented an extensive recalibration campaign. Over1500 NUV measurements were added, but only 137 in the FUVbecause the detector was still completing its recovery. Thus,the GR2/GR3 flat, generated with all of the white dwarf samplesfrom the mission through 2005, is biased to 2005 in both bandsand very strongly so in NUV. However, areas of the flat field sam-pled only in, say, 2003, will reflect the proper calibration for thatepoch, which means that there is an additional systematic builtinto the flats for isolated areas. To address the drift, we repro-cessed all of theGALEX LDS749b white dwarf data using a newflat field based on a grid of 165LDS749bfieldmeasurementsmadeover 2 days in 2006. We used a nearby field star of moderateNUV count rate rather than the bright LDS749b to generate theNUV flat (for FUV we used the white dwarf ), mitigating con-cerns about theNUV saturation. The results of thewhite dwarf anddeep field analyses are consistent with each other and are pre-sented together in Figure 3.
The data are consistent with a linear drift (although less certainin the FUV band). We define the time of zero correction to be ateclipse 12,000 based on the weight of that epoch in generatingthe GR2/GR3 flats.
We have not included an FUVLDS749b data point for 2005 inFigure 3. This is because of a second issue we discovered duringthis analysis, which is that the 2005 FUV white dwarf data readbright by about 5%when reprocessed with the 2006 single-epochflat field. This is a result of the way the measurements were madein 2005 while the FUV detector was completing its recovery froman anomaly. During that period (approximately a month), the de-tector was being cycled on and off for only very short observationperiods (�minutes) while its stability was being tested. Since thedetector was ramped to high voltage literally minutes before theobservation began, it was still warming up during the observa-tions, offsetting the calibration slightly. This means that there isa field-dependent systematic built into the GR2/GR3 FUV flatfield of approximately 5% in the sense that most (about 77%)objects are actually brighter in the FUV than they appear. NUVisunaffected.
We have not determined if the observed drift is due to con-tamination or a global MCP fatigue. Since the performance ofeachMCP pore is sensitive to its total exposure, We would expectfatigue to affect NUV more since it typically detects photons atabout 10 times the FUV rate. Furthermore, contamination wouldnormally be expected to preferentially affect the FUV band. Onthe other hand, the effect we observe appears to affect bright anddim objects the same. Whichever effect is at play, we expect toapply a correction automatically in the pipeline during a futurecalibration update; however, it is not accounted for in GR2/GR3.
4.3. Relative Precision
For accurate and repeatable measurements of unresolved sour-ces, aperture magnitudes are usually best since they are fixed frommeasurement to measurement. One needs to take care to choosean appropriate aperture for the task at hand. Smaller apertures aremore useful for unresolved sources, but larger ones become de-sirable, even for point sources, when comparing the photometryof objects measured at the center and edge of the field (where thePSF is degraded), or for bright objects that have saturated cores.For the purposes of this paper, the SExtractor mag_aper_4mag-nitude is used unless otherwise noted. This 1200 diameter apertureis a good compromise between the very large apertures requiredto gather almost all of theGALEX flux in the extended PSF (as isdone for the white dwarf calibration) and the small ones that areoptimal for minimizing the contribution of background. The rela-tionship between the various standard SExtractor aperture mag-nitudes and the large tailor-made apertures used for white dwarfcalibration are presented in Figure 4.In the GR2/GR3 release, the scatter in white dwarf measure-
ments has been reduced to about 0.02 mag rms in NUV and0.045mag rms in FUV. This compares to a scatter of order 0.1magin both bands for the GR1 release. We attribute the improvementin precision to the way the flat field has been generated, usingwhite dwarf measurements to modify the flat locally rather thanusing the average to scale a sky background field. As with any in-strument, care should be taken when interpreting the magnitudesof objects expected to have significantly biased spectral content
Fig. 3.—Measured photometric drift for deep field sources between magni-tudes 15 and 20 over the course of the GALEX mission. FUV data are shown inblue: diamonds for the deep field sources and circles for LDS749b. NUV data areshown in red: triangles for the deep field sources and circles for LDS749b. Thedeep field data shown represent the mean binned in 1000 eclipse segments.
The drift is defined to be zero at eclipse 12,000, which occurred in summer2005 during the extensive white dwarf observing campaign on which the currentcalibration ismostly based. It is not clear if the trend is due to contamination in theinstrument, or due to a mild global gain decrease (fatigue) in the detector micro-channel plates.
MORRISSEY ET AL.688 Vol. 173

compared to the white dwarf. These may have more scatter dueto optical effects across the field of view.
We have also verified the performance of the flat field bymeansindependent of the partially saturated (in the NUV) white dwarfstandard. For this purpose, we have examined the sample of datafrom the DIS described in x 4.2. This comprises a series of fieldswith several dozen full-eclipse-length observations, many at dif-ferent roll angles (thus sampling multiple detector locations withthe same source). By matching compact (�1000 FWHM) sourceswith no neighbors closer than 1200 in the co-added catalogs to theindividual visit catalogs, a visit database of sources and magni-tude errors (with the co-added catalog considered to be the truthcatalog) has been generated. A comparison of high- and low-gaindetector measurements for a given source reveals the count raterequired to cause local saturation. For both detectors, the onsetof saturation is at approximately mAB � 15 (corresponding to34 counts s�1 FUVand 108 counts s�1 NUV) in the lowest-gainregions of the detector. We thus restrict further analysis in thissection to the range 15 � mAB � 17.
With the unsaturated magnitude range determined over thewhole field, we can proceed to compute the photometric repeat-ability, as shown in Figure 5. Here we present histograms of the1200 diameter aperturemagnitude errors in each band. The Poissonerror associated with each detection is of order 0.5%Y1.5%, whilethe total scatter we measure in the bright deep field sources is�0:05mAB rms in FUVand �0:03mAB rms in NUV. These fig-ures agree well with the white dwarf results, thus concerns aboutthe (mild) LDS749bNUVsaturation correction are reduced. If thewhite dwarf saturation had not been properly accounted for, theflat field would have been adversely affected in the NUV low-gain areas, which would in turn increase the photometric scatterof dimmer (definitely unsaturated) deep field sources in those sameregions, and thus we would not expect good agreement in thescatter between the white dwarf and deep field samples.
The deep field visit magnitude errors are also presented as afunction of the co-added ‘‘truth’’ magnitude in Figure 6, whichserves to illustrate an interesting bias effect on the faint end of the1500 s depth MIS. Here the predicted 3 � errors (including theflat-fieldYlimited values derived for bright sources) are overplotted,showing good agreement with most of the observed distributionbut failing on the faint end. This effect is similar inmagnitude but
opposite in direction for each detector. In the FUV, sources aredetected in the co-added image that are not detected in the visitimages except when the Poisson errors tilt the detection to thebright side (the Eddington bias); thus, faint FUV detections arebiased bright by about 0.1 mAB compared to the ‘‘truth’’ catalog.Similarly in the NUV, more sources are detected in the co-addedimage; however, the effect of the undetected sources is to forcean overestimate of the NUV background of about 5% (with largescatter). In this case, faint NUV detections are biased dimmerby about 0.1mAB compared to the ‘‘truth’’ catalog. In each panel,solid overplotted lines show the median of the magnitude errorsin each magnitude bin, while dot-dashed lines show the samequantity after the visit magnitudes have been recomputed usingthe co-add background estimation. This correction is indistin-guishable from the solid line median in the FUV panel becausethe background is negligible, but completely cancels the faintend bias in the NUV. Since the effects of these two biases are inopposite directions for each band, they have a more significanteffect on the UV color, about 0.2 mAB at the faint end of thedistribution.
For completeness, we present a similar analysis of the photo-metric errors in the 100 s AIS sample relative to cross-matchedsources in overlapping MIS fields. As illustrated in Figure 7, wefind that the AIS magnitudes are biased bright at the faint endrelative to the MIS for both detectors and that corrections to theAIS magnitudes using MIS backgrounds have no effect at all.This result stems from the shallower depth of the AIS survey,which is source-limited rather than background-limited.
4.4. Linearity
There are two sources of photometric nonlinearity in the in-strument: global nonlinearity resulting from the finite period re-quired for the electronics to assemble photon lists (during whichtime new events are locked out) and local nonlinearity resulting
Fig. 4.—GALEX photometric ‘‘curve of growth,’’ which shows the medianmagnitude offsets relative to the largest aperture used for the white dwarf LDS749b.NUVmeasurements have been restricted to high pulse height areas of the detectorto minimize any effect due to saturation.
Fig. 5.—GALEX photometric precision as determined by repeated measure-ments of bright but unsaturated sources in the GALEX deep fields. These meas-urements are in good agreement with the results determined directly from repeatmeasurements of the white dwarf calibrators.
GALEX: CALIBRATION AND DATA PRODUCTS 689No. 2, 2007

from the MCP-limited current supply to small regions around abright sources. The local effect complicates the NUVwhite dwarfcalibration measurements.
Global effects are easily measured using the on-board ‘‘STIM’’pulser, which electronically stimulates each detector anode with asteady, low rate stream of electronic pulses. These are resolved aspoint sources in the corners of the dose (-scdose ) images. Sincethe real rate of STIM pulses is accurately known, the measuredrate is used by the pipeline to scale the effective exposure. Thecount rates for all sources in the field are simultaneously corrected.This effect is typically about 10% in NUV and a few percent inFUV; however, it can become quite significant (�50%) for thebrightest fields.
Local nonlinearity cannot be corrected well with the existingcalibration. It affects not only the measured count rate of an in-
dividual bright source but also the source shape and position. Fur-thermore, the effects vary around the field of viewwith the gain ofthe detector (as exemplified by the white dwarf saturation cor-rection described in x 4.1). We have used standard stars to esti-mate the local nonlinearity in each band, as shown in Figure 8.These data may be used to approximately correct bright sourcesthat are within the measured range. Note that the measurementspresented in the figure are for 34.500 (aper_7) and 30 diameterapertures; the effect will be muchworsewhen small apertures areused. The NUV detector is more robust to bright sources becauseits photoelectrons are proximity-focused and thus present a largersource image (with lower count density) to the MCP. Local pho-tometric nonlinearity is strongly source-size dependent. The satu-ration shown in Figure 8 is a worst-case scenario (using stars).Wide scatter in measurements of bright sources is an indication
Fig. 6.—GALEX photometric repeatability as a function of magnitude as determined by repeated measurements of sources in the GALEX deep fields (with individualmeasurements of order 1000 s). In each panel, heavy dashed lines are the 3 � values that would be expected given the flat field precision and Poisson counting statistics,while the crosses show the actual value for each magnitude bin. Solid overplotted lines show the median of the magnitude errors in each magnitude bin, while dot-dashedlines show the same quantity after the visit magnitudes have been recomputed using the co-add background estimation. [See the electronic edition of the Supplement for acolor version of this figure.]
Fig. 7.—GALEXAIS photometric repeatability as a function ofmagnitude as determined by repeatedmeasurements of sources in overlappingMISfields. In each panel,heavy dashed lines are the 3 � values that would be expected given the flat field precision and Poisson counting statistics, while the crosses show the actual value for eachmagnitude bin. Solid overplotted lines show the median of the magnitude errors in each magnitude bin, while dot-dashed lines show the same quantity after the visitmagnitudes have been recomputed using the co-add background estimation (in the AIS this correction does not have a significant effect). At the very faint end, there is anapparent bias toward visit magnitudes brighter than co-addedmagnitudes due to Eddington bias in the source-limited sample. [See the electronic edition of the Supplementfor a color version of this figure.]
MORRISSEY ET AL.690 Vol. 173

of the variation of the onset of saturation at different detectorlocations.
We have increased the local count rate limit to 30,000 counts s�1
per source in NUV, which corresponds to approximately 9th mag-nitude. This new limit allowsmost of the sky to be observed. TheFUV local limit ismaintained at 5000 counts s�1, which is not cur-rently a survey constraint. Global detector limits are set in hard-ware (rather than the planning system) to 100,000 counts s�1, alimitation based largely on the boundaries of ground testing andengineering judgment about safe rates of gas generation insidethe sealed detector tubes. Areas such as the Galactic plane and theMagellanic Clouds are still restricted by the 100,000 counts s�1
global limit.
4.5. The GALEX Deep Fields
The specific case of faint DIS photometry presents its ownspecial challenges. The relatively large GALEX PSF affects thephotometry of faint sources, mostly due to source confusion (Xuet al. 2005). As an alternative to the GALEX pipeline for faintsource extraction, a Bayesian approach has been attempted byothers (Guillaume et al. 2006) to estimate the UV flux using priorinformation from external, well-resolved images (mostly fromvisible wavelengths). The basic idea is to generate an image withprior sources convolved with the GALEX PSF and to estimatewhat scaling factors to apply that will best fit the UV image. Theimplemented method is based on a maximum likelihood para-metric optimization in the presence of Poisson noise. Scaling fac-tors were extracted via an iterative procedure to solve the set ofnonlinear equations based on the expectation-maximization (EM)method. In order to test the reliability of the photometry extractedusing this method, simulated objects (with a large range of UVflux) were added to the GALEX DIS images. For an NUV DISimage with 60 ks exposure, it was possible to recover the photo-metry of simulated sourceswith an accuracy of 0.3mAB toNUV�
25.5, extending the faint-end limit of the survey by about amagnitude.
5. RESOLUTION
There are numerous contributors to the width of the GALEXPSF, including the optics, detectors, and ground pipeline. The re-construction algorithms for GR2/GR3 have improved to the pointthat the instrumental contributions are now the largest share, par-ticularly in the proximity-focusedNUVchannel.Aswewill show,the GALEX detectors dominate in this area and have significantlyposition-dependent performance.
To verify the fundamental instrument performance from on-orbit data, some bright stars were analyzed individually, outsidethe pipeline. These results show performance that is consistentwith or better than what was measured during ground tests. Wehave also verified the end-to-end performance including the pipe-line by stacking images of stars from the MIS survey that wereobserved at different locations on the detector. The results of thesecomposites are shown in Figures 9 and 10. Performance is rea-sonably uniform except at the edge of the field, where it is signif-icantly degraded. Some remaining degraded areas of the imagesmay yet be improved with updates to the static calibration. Notethat DIS surveys co-add data with many roll angles, so the DISPSF is considerably more symmetrical across the field of view.
Many of the regions with degraded resolution correlate withlow detector gain, an effect illustrated in Figure 11. The relativedetector gain (or charge, ‘‘Q’’) in the region of measurement foreach source is tabulated in themerged catalog. This gainmeasure-ment is obtained from a lookup table that represents the detectorin an unsaturated condition. The actual gain measured duringthe observation is available in the pulse height (-scq) image dataproduct.
It is also evident that theGALEX PSF has structure a significantdistance from the center. We have characterized this by building a
Fig. 8.—Measured count rate versus predicted count rate for the white dwarf standards measured to date by GALEX using 34.500 (aper_7) and 30 diameter apertures.Thesemeasurements represent aworst case because they are for point sources. The nonlinearitywill bemuchworsewhenmeasuring fluxes using small apertures, since thiseffect is concentrated at the core of each image.
GALEX: CALIBRATION AND DATA PRODUCTS 691No. 2, 2007

composite PSF of the white dwarf calibrator LDS749b, as shownin Figure 12. The effects of local nonlinearity are also illustratedhere by the highly saturated white dwarf HZ 44, the brightest wehave observed with GALEX in imaging mode. The effect of thesaturation is strongest in the core of the PSF, causing the wings tobe strongly emphasized.
6. ASTROMETRY
The GALEX GR2/GR3 astrometric precision represents animprovement of order 20% over GR1 (andmuchmore compared
to the Early Data Release). The dynamic pipeline transformationis generally not a limiting factor as it had been in earlier releases.The static transformation (primarily the distortion map) is alsoperforming very well for most of the field of view. Improvementscould still be made that would not only improve the global as-trometric precision but also the point spread function (PSF) atthe edge of the field.The distortion maps for the GR2/GR3 calibration are the re-
sult of several flight-based iterations on the preflight calibration.The first, which was implemented for the GR1 data release, used
Fig. 9.—Composite PSFs for the GALEX FUV channel in detector coordinates. The individual images are exaggerated for clarity. Upper data values in the formatN@(X, Y ), whereN is the number of stacked images and (X, Y) is the position inminutes of arc from the field center. The FWHM is specified in arcsec for each detector axis.Q is the typical pulse height at the specified detector location, in bins. The pulse height scale is not extremelywell calibrated, but it is linearwith 10 bins�1 ; 107 electrons).[See the electronic edition of the Supplement for a color version of this figure.]
MORRISSEY ET AL.692 Vol. 173

Tycho-2 catalog (Hog et al. 2000) reference stars to refine thedistortion map for each detector independently. An iterative tech-nique was used until the measured GALEX positions convergedwith the reference positions, a technique that relied on the as-sumption that the distortion across a �10 (�1 mm) region of thedetector (the footprint of the dither pattern) is reasonably rep-resented by a single average value. This technique worked well;however, there were relatively few FUV stars available to per-form the analysis (a few thousand). The FUV-NUV relative as-
trometry retained some noticeable (�100) misalignments. We haveaddressed this issue with cross-matched SDSS data. Since theSDSS astrometry is better than 0.100 rms (Pier et al. 2003), it canbe regarded as essentially perfect for our purposes. The samplewe gathered contains 69642 objects spectroscopically classifiedas quasars (SDSS specClass ¼ 3, a convenient point source sam-ple compiled for other applications). Objects were consideredmatches if they fell within 2.500 of each other. There was nodiscrimination based on location in theGALEX field of view.We
Fig. 10.—Composite PSFs for the GALEX NUV channel in detector coordinates. The individual images are exaggerated for clarity. Upper data values are N@(X, Y ),whereN is the number of stacked images and (X, Y ) is the position in minutes of arc from the field center. The FWHM is specified in arcsec for each detector axis.Q is thetypical pulse height at the specified detector location, in bins. The pulse height scale is not extremely well calibrated, but it is linear with 10 bins�1 ; 107 electrons). [Seethe electronic edition of the Supplement for a color version of this figure.]
GALEX: CALIBRATION AND DATA PRODUCTS 693No. 2, 2007

binned these results into a relatively coarse grid (�10), the intentof which was to ‘‘stretch’’ the existing plate solution to removelow spatial frequency errors. The result of this improvement is thatthe GR2/GR3 absolute astrometric precision achieved by theGALEX MIS within 0.6� of the field center for bright (signal-to-noise ratio �10) point sources is 0.4900 rms in the NUVand0.5900 rms in the FUV, with similar relative precision between thetwo bands.
In Figure 13 we present histograms of the position errors forhigh S/N SDSS quasars detected by GALEX. The most notice-able image defect resulting from the current astrometric solu-tion is the degraded PSF at the edge of the field. As shown inFigures 14 and 15, the astrometric precision in the outer 50 ofthe detector, while degraded, still performs nearly at the level ofthe central 30 0. Generally speaking, matches between GALEXand other surveys can be safely performed with a 200 window, asindicated by Figure 16.
Themost promising future improvement to the astrometric cal-ibration probably involves a new pipeline module that wouldscale the amplitude of the distortion maps by a factor determinedfrom measurements of the STIM pulses at the corners of eachimage. Much of the necessary data to eliminate this ‘‘breathing’’mode is already available. Another more complex possibility in-volves reprocessing the reference star data in �20 s intervals toreduce the footprint of each source sample on the detector andthus more finely sample the detector grid. Such an analysis wouldbe most useful near the edge of the detector where the distortionmap is changing rapidly.
7. SPECTROSCOPY
The spectroscopic mode utilizes a CaF2 grism (a prism with aruled surface) that can be moved into the converging beam of thetelescope to form simultaneous (slitless) spectra of all sources inthe field in both bands. Many spectra will normally overlap, aproblem addressed by rotating the grism on its axis to differentposition angles during repeat observations of the same field. Eachspectrum has an ‘‘undeviated wavelength point’’ around which itwill rotate as the grism position angle is changed (thus, any given
Fig. 11.—Fullwidth at half-maximumof theGALEX PSF based on compositeimages for each detector as a function of intrinsic detector pulse height. In gen-eral, low pulse height regions are near the edge of the detector.
Fig. 12.—GALEX FUVand NUV composite encircled energy curves for twowhite dwarf standards. A composite of LDS749b measurements forms the un-saturated (solid ) curve, while the brightest standard that we have observed, HZ 44,defines the saturated curve. The reference count rates for the saturated curves are thepredicted values; measured rates are much lower, as indicated by the low encircledenergy values.
Fig. 13.—Distribution of absolute astrometric errors in theGALEXGR2/GR3survey data for quasars with S/N � 10 in each band matched against the SDSS.
Fig. 14.—FUVGR2/GR3MIS absolute astrometric performance for field cen-ter and field edge distributions of SDSS quasars with GALEX S/N � 10. [See theelectronic edition of the Supplement for a color version of this figure.]
MORRISSEY ET AL.694 Vol. 173

spectrum will have an optimal set of grism position angles de-pending on the location of nearby sources). As the position anglechanges, the undeviated wavelength point remains fixed in thefield as illustrated by Figure 17. The resulting spectra can be com-bined to eliminate confusion.
The standardGALEX spectroscopy pipeline is designed for iso-lated point sources, which are detected in theGALEX direct imageobservations. Extended or overlapping sources, or sources that donot appear in the direct image catalog, require a special pipelinereduction with modified parameters.
A relative position correction as a function of time is appliedto the spectral image data using a technique very similar to thatused for direct image photons. Using the brightest sources fromthe catalog, an aspect correction is applied to the entire exposureby fitting four parameters: shift in dispersion direction, shift inspatial direction, spacecraft roll angle, and grism position angle.A spectrum points north (blue to red) when the grism positionangle is 0
�and toward the east when it is 90
�.
Bright sources may show grism orders ranging from�4 to +5across the field; however, only two orders in each band are typ-
ically extracted. ForNUV, the highest response is in first orderwitha total system peak response of 40 cm2. For FUV, the strongest or-der is secondwith a peak response of 20 cm2. The dispersion angles�FUV and �NUV in arcseconds from the undeviated wavelengthpoint for FUV second order and NUV first order are given by
�FUV ¼�4530:7þ 7:3859k� 3:9254 ; 10�3k2
þ 7:4750 ; 10�7k3;
�NUV ¼�882:1þ 7:936 ; 10�1k� 2:038 ; 10�4k2
þ 2:456 ; 10�8k3;
where k is the wavelength in 8, accurate to a few tenths of anarcsecond.
Using the catalog positions, image strips (aligned to the disper-sion direction) are created for each source using the correctedphoton positions. Figure 18 shows how a portion of the field imagetranslates into a dispersion-aligned image strip for each band. Thefigure shows image strips covering 170000 in the dispersion di-rection to illustrate the weaker orders. Only 90000 (from�10000 to+80000 relative to the undeviated point) covering the two strongestorders in each band are stored during actual data reductions. Thewidth of each image strip is 7800.
Figure 18 also shows the undeviated point in each image strip(marked with a cross) that occurs at about 17008 in first order inboth bands. This is the point where the spectral images for allposition angles intersect.
The spectral shape, strength, and position of neighboring sourcesare estimated from the direct image catalog and are masked fromeach image strip. Additional masking is done on each strip whenthe exposures are co-added to eliminate other artifacts not pre-dicted by known neighboring sources,whichmay be due to reflec-tions, ghosts, hot spots, or unidentified sources near the edge of
Fig. 17.—Composite image of GALEX grism spectra collected with multiplegrism position angles. As the grism is rotated in its mount, each spectrum spinsaround its own undeviated wavelength point to form a ‘‘pinwheel’’ in the com-posite, illustrating the optimal grism angle (producing an unconfused spectrum)for each source.
Fig. 15.—NUVGR2/GR3MIS absolute astrometric performance for field cen-ter and field edge distributions of SDSS quasars with GALEX S/N � 10. [See theelectronic edition of the Supplement for a color version of this figure.]
Fig. 16.—Percentage of GALEX-SDSS matches as a function of matchingradius. AnMIS sample with S/N � 10 and field radius less than 0.6� was used forthis analysis. Note that the matched sample is limited to 2.500 maximum error,although based on the shape of the distribution this does not appear to be an issue.
GALEX: CALIBRATION AND DATA PRODUCTS 695No. 2, 2007
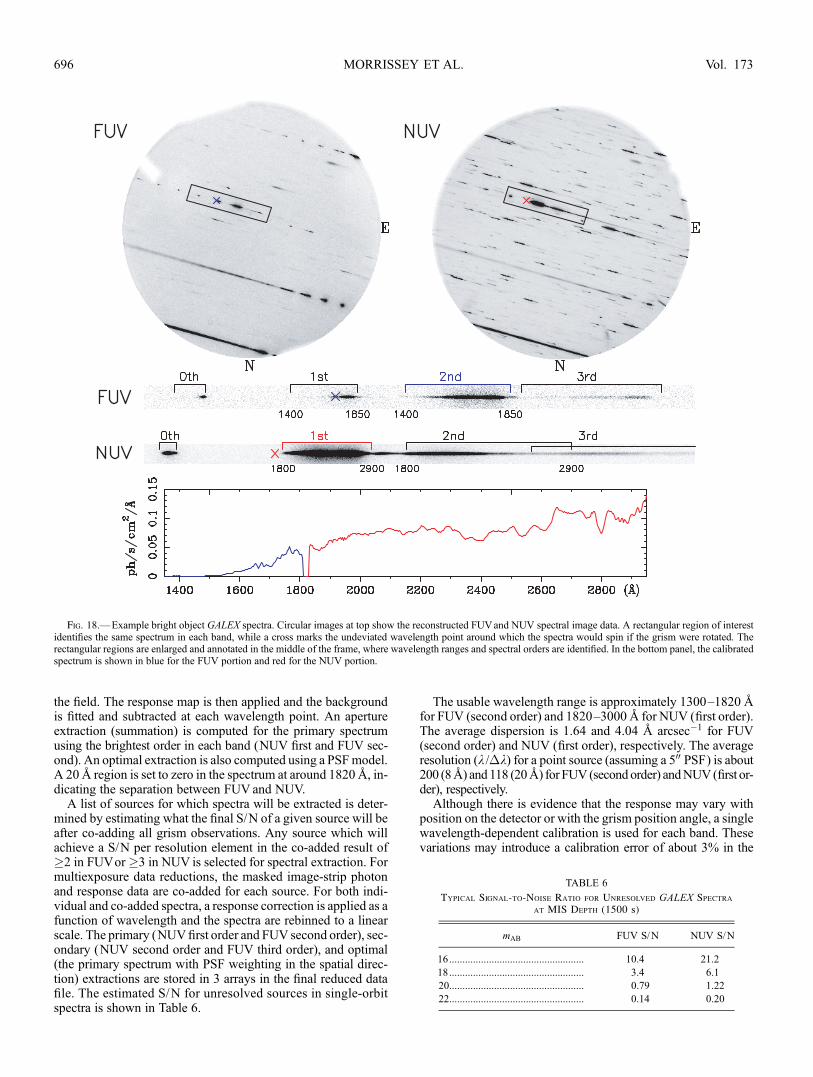
the field. The response map is then applied and the backgroundis fitted and subtracted at each wavelength point. An apertureextraction (summation) is computed for the primary spectrumusing the brightest order in each band (NUV first and FUV sec-ond). An optimal extraction is also computed using a PSFmodel.A 208 region is set to zero in the spectrum at around 18208, in-dicating the separation between FUV and NUV.
A list of sources for which spectra will be extracted is deter-mined by estimating what the final S/N of a given source will beafter co-adding all grism observations. Any source which willachieve a S/N per resolution element in the co-added result of�2 in FUVor�3 in NUV is selected for spectral extraction. Formultiexposure data reductions, the masked image-strip photonand response data are co-added for each source. For both indi-vidual and co-added spectra, a response correction is applied as afunction of wavelength and the spectra are rebinned to a linearscale. The primary (NUVfirst order and FUV second order), sec-ondary (NUV second order and FUV third order), and optimal(the primary spectrum with PSF weighting in the spatial direc-tion) extractions are stored in 3 arrays in the final reduced datafile. The estimated S/N for unresolved sources in single-orbitspectra is shown in Table 6.
The usable wavelength range is approximately 1300Y1820 8for FUV (second order) and 1820Y30008 for NUV (first order).The average dispersion is 1.64 and 4.04 8 arcsec�1 for FUV(second order) and NUV (first order), respectively. The averageresolution (k /�k) for a point source (assuming a 500 PSF) is about200 (88) and118 (208) for FUV (secondorder) andNUV(first or-der), respectively.Although there is evidence that the response may vary with
position on the detector or with the grism position angle, a singlewavelength-dependent calibration is used for each band. Thesevariations may introduce a calibration error of about 3% in the
Fig. 18.—Example bright object GALEX spectra. Circular images at top show the reconstructed FUVand NUV spectral image data. A rectangular region of interestidentifies the same spectrum in each band, while a cross marks the undeviated wavelength point around which the spectra would spin if the grism were rotated. Therectangular regions are enlarged and annotated in the middle of the frame, where wavelength ranges and spectral orders are identified. In the bottom panel, the calibratedspectrum is shown in blue for the FUV portion and red for the NUV portion.
TABLE 6
Typical Signal-to-Noise Ratio for Unresolved GALEX Spectra
at MIS Depth (1500 s)
mAB FUV S/N NUV S/N
16................................................... 10.4 21.2
18................................................... 3.4 6.1
20................................................... 0.79 1.22
22................................................... 0.14 0.20
MORRISSEY ET AL.696 Vol. 173

body of each spectral order and about 10% near the edges of eachorder.
8. CONCLUSIONS
We have described the GALEX performance and calibrationresults for the GR2 and GR3 data releases. These releases haveidentical pipeline calibrations that are significantly improved overthe previous GR1 release. The analysis we have presented pro-vides an overview of the data quality, errors, and peculiaritiesthat are likely to confront astronomers.
The relative photometric precision is 0.05 and 0.03mAB in theFUV and NUV, respectively. We have identified several pho-tometry issues that will be improved in future calibrations. Thefirst is a systematic drift with time of order 1% in FUVand 6% inNUV, total, over the period of the released data (�4 yr). Thesense of the drift is that objects appear to be growing fainter withtime. The second issue is that the current FUV calibration relieson data collected in a nonstandard mode during the 2005 FUVrecovery, and these data appear bright by 5% compared to othermeasurements of the same objects collected in the standard mode.The effect of this is to make GR2/GR3 objects systematicallyfainter in the FUV than they actually are. The third issue is thatthe NUV zero point is defined by a white dwarf calibrator thatis at least partially saturated. While we have evidence that thesaturation is mild and correctable, we are planning confidence-building observations of an additional white dwarf, the dimmestin the CALSPEC catalog, to help resolve the issue.
The astrometric precision has been improved, by about 20%,to 0.500 rms. There is evidence that it may be improved further byaccounting for the detector ‘‘breathing’’ mode already measuredwith existing data from an external pulser that runs in parallelduring all detector operations.
All of our performance parameters continue to meet flightrequirements. As the mission continues, we naturally expect thecalibration to evolve. The instrument itself continues to functionnominally in spite of a series of flight anomalies especially withthe FUV detector. We have modified operations and flight soft-ware over the mission to respond to these issues. While some ofthem have significantly affected the FUVobservation efficiency,none give any indication of affecting the instrument performance.We believe there is room to increase the count rate limits for bothdetectors (especially FUV), and to the extent possible we plan toexplore higher rate fields closer to the Galactic plane after theprimary surveys are completed.
GALEX (Galaxy Evolution Explorer) is a NASA Small Ex-plorer, launched in 2003April.Wegratefully acknowledgeNASA’ssupport for construction, operation, and science analysis for theGALEX mission, developed in cooperation with the Centre Na-tional d’Etudes Spatiales of France and the Korean Ministry ofScience and Technology.
Facilities: GALEX
REFERENCES
Bertin, E., & Arnouts, S. 1996, A&AS, 117, 393Bohlin, R. C. 1996, AJ, 111, 1743Bohlin, R. C., et al. 2001, AJ, 122, 2118Boksenberg, A., et al. 1973, MNRAS, 163, 291Budavari, T., et al. 2007, in ASP Conf. Ser. 376, Astronomical Data AnalysisSoftware and Systems XVI, ed. R. A. Shaw, F. Hill, & D. J. Bell (San Francisco:ASP), in press
Forster, K., et al. 2006, Proc. SPIE, 6270, 627004Guillaume, M., et al. 2006, Proc. SPIE, 6064, 606332Hog, E., et al. 2000, A&A, 355, L27Jelinsky, P., et al. 2003, Proc. SPIE, 4854, 233
Landolt, A. 1992, AJ, 104, 340Martin, D. C., et al. 2005, ApJ, 619, L1Morrissey, P. 2006, Proc. SPIE, 6266, 62660Y (see update at http://www.galex.caltech.edu /DATA/gr2_docs/Lessons_learned_SPIE_update_Morrissey.pdf )
Morrissey, P., et al. 2005, ApJ, 619, L7Oke, J. B., & Gunn, J. E. 1983, ApJ, 266, 713Pier, J. R., et al. 2003, AJ, 125, 1559Press, W., Teukolsky, S. A., Vetterling, W. T., & Flannery, B. P. 1992, NumericalRecipes in C (2nd ed.; Cambridge: Cambridge Univ. Press)
Urban, S. E., et al. 1998, AJ, 115, 2161Xu, C. K., et al. 2005, ApJ, 619, L11
GALEX: CALIBRATION AND DATA PRODUCTS 697No. 2, 2007