Embed Size (px)
Citation preview
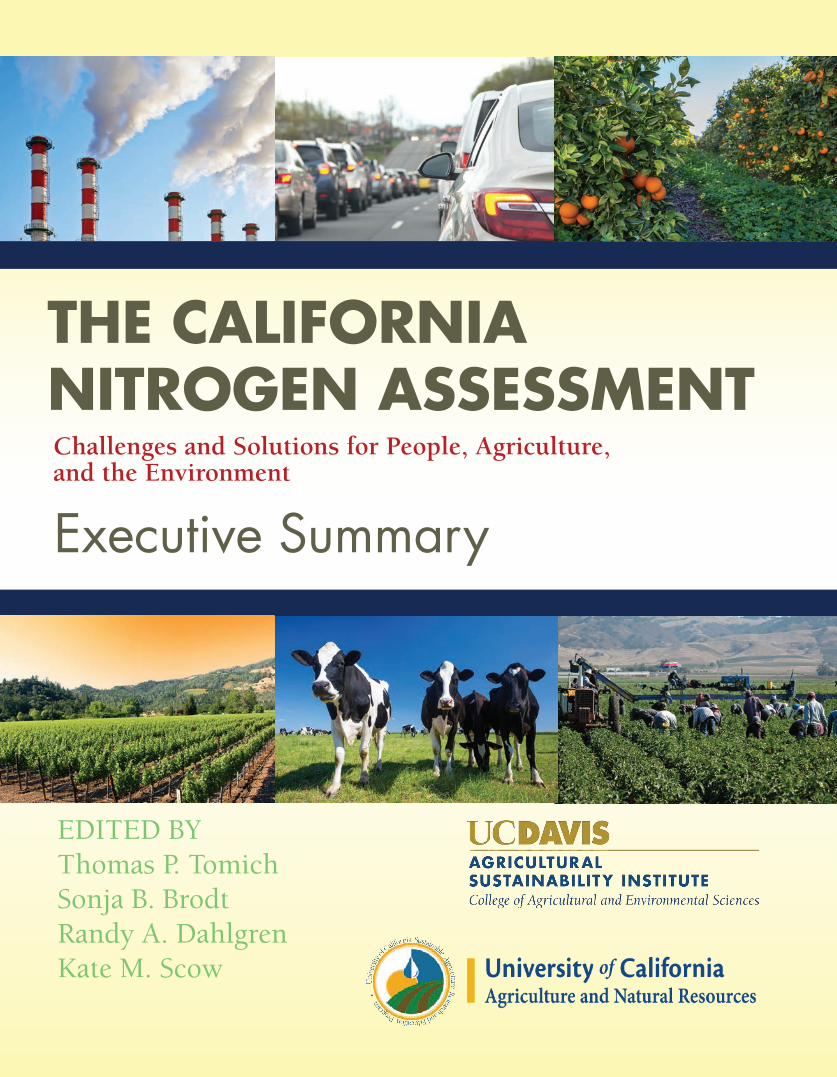
THE CALIFORNIA NITROGEN ASSESSMENTChallenges and Solutions for People, Agriculture, and the Environment
EDITED BYThomas P. Tomich Sonja B. Brodt Randy A. Dahlgren Kate M. Scow
Executive Summary

Californians’ quality of life depends on our abundant food and vibrant agricultural landscapes. All Californians have a stake in a thriving agricultural sector and agricultural communities in our state, both now and for future generations.
Nitrogen, in various reactive forms, is indispensable to the productivity of California agriculture. And yet, only about half the nitrogen applied ends up where we intend; the balance leaks, polluting our air and water, with detrimental effects on our environment and human health.
Agriculture in California and around the world has seen huge success in the 20th and 21st centuries in large part because of nitrogen. The invention of the Haber–Bosch process over a century ago, which enabled cheap nitrogen synthesis on an industrial scale, has been a cornerstone of modern agriculture.
Yet there are significant costs associated with this human intervention in the nitrogen cycle: water and air pollution, climate change, and detrimental effects for human health, biodiversity, and natural habitat. Not enough nitrogen can limit plant growth and inhibit our food supply, while too much transforms our ecosystems profoundly, with adverse consequences for human well-being.
California can lead the way for the world in seeking a better balance between managing nitrogen as an essential agricultural input and minimizing its negative impacts on communities and the environment.
Getting California’s nitrogen balance right—increasing benefits while reducing costly side effects—requires broad collaboration over the coming years, with farmers and ranchers leading the way to produce solutions.
The California Nitrogen Assessment | Executive Summary
1
A Resource for Growers: The Solution Center for Nutrient Management
The Solution Center for Nutrient Management was created alongside the California Nitrogen Assessment to increase access to California agricultural nutrient management resources and serve as a platform for conversation on important nutrient management issues. Content includes:
• Searchable database of research on nutrient management in a range of California crops• Guidance on key decision factors to identify best management practices• Environmental implications of different management practices• Farm management implications of alternative management practices
Visit the Solution Center for Nutrient Management online: ucanr.edu/sites/Nutrient_Management_Solutions

1 Reactive nitrogen refers to all forms of nitrogen that support growth and are capable of cascading through the environment and includes nitrate (NO3
_), nitrite (NO3_), ammonia (NH3), ammonium (NH4
+), nitrous oxide (N2O), and nitrogen oxides (NOx). Non-reactive nitrogen, N2, makes up 80% of earth’s atmosphere and does not contribute to environmental impacts. Throughout this summary, nitrogen (N) refers to reactive nitrogen.
The California Nitrogen Assessment | Executive Summary
The California Nitrogen Assessment (CNA) is the first comprehensive accounting of nitrogen at a state level for California. Nitrogen is essential to all life on Earth. In its reactive forms, nitrogen helps plants grow, helps cars run, and helps industries create everyday household products. However, reactive nitrogen1 can also be harmful to communities and the environment. Thus, we need to find a balance in its use that can provide the benefits we currently enjoy while preventing harm from leakages into the environment.
The goals of the CNA are to: • Provide useful insights for stakeholders into the balance between the benefits of nitrogen in various aspects of
our modern economy, including agriculture, and the effects of surplus nitrogen in the environment • Compare options, including practices and policies, for improving the management of nitrogen and mitigating
the negative impacts of surplus nitrogen in the environment
• Effectively link science with action and to produce information that informs both policy and field-level practice
The CNA is a synthesis of existing research to answer the questions:
• What is driving nitrogen use? We look at both global and local scales to examine what influences the statewide mass balance of nitrogen in all its major forms (how much enters the state, where it is used, and its eventual fate).
• How much nitrogen enters the state through new sources?
• What are the ways that nitrogen ultimately enters and affects the environment?
• What are nitrogen’s impacts on the environment and human well-being?
• What are the technological and policy options to minimize nitrogen’s negative effects while sustaining the vitality of agriculture?
What an assessment is, and what it is not: An assessment is a critical evaluation of information for purposes of guiding decisions on a complex issue in the public interest. Stakeholders provide the questions that guide the assessment (see list of questions below).
An assessment is not a research project. Most sources and data should already be collected, peer-reviewed, and in the public domain. Gap-filling and new calculations using existing data are permissible.
An assessment is not an advocacy piece; it must be balanced and evidence-based. Assessments strive to be policy-relevant without being policy prescriptive. Assessments frame and weigh policy options rather than making policy recommendations.
CNA Goals and Process
2

The CNA is time bounded. The CNA was launched in 2009 and the text for the final publication was finalized in July, 2015. Assessments rely primarily on peer-reviewed publications, for which the time period from the initial research activities to final publication commonly extends to two years or more.
Thus, though there are many relevant recent and ongoing policy initiatives (e.g., the Irrigated Lands Regulatory Program, Dairy General Order, Sustainable Groundwater Management Act, changes in the federal ozone standard), the assessment is not a review of the current policy arena in California.
The California Nitrogen Assessment | Executive Summary
Synthesized Stakeholder QuestionsThis is a list synthesized from over a hundred questions our stakeholders asked during our initial design stage. The questions were used as a guide for how to prioritize and organize topics in the assessment.
Economics and PolicyTo what extent would policies designed to reflect the public health and environmental costs of nitrogen pollution affect food prices and farm revenues?
How can policies account for the trade-offs between costs and benefits of nitrogen use?
How might policy be used more effectively to both monitor and address non-point source ag pollution?
What are the hurdles to having a coordinated and cohesive nitrogen policy across regulatory jurisdictions?
Biogeochemistry What are the relative contributions of different sectors to nitrogen cycling in California?
What are the relative amounts of different forms of reactive nitrogen in air and water?
Are measurements of gaseous losses and water contamination accurate?
HealthWhat is the state of knowledge on how nitrogen influences air and water quality and impacts human health?
Management Practices What are the current nitrogen rate recommendations?
Are current nitrogen application guidelines appropriate for present-day cropping conditions?
How is nitrogen use efficiency determined and what are the most efficient and inefficient production systems?
From a systems perspective, where are the control points for better management of nitrogen?
Are there trade-offs between reduced nitrogen application and other cropping considerations? Will deviating from current nitrogen applications affect product quality, increase pest pressure, etc?
Are there current management practices that would increase nitrogen use efficiency and reduce nitrogen pollution?
CommunicationsHow do we communicate the complexity of the nitrogen cycle and nitrogen-related problems to the public?
What nitrogen outreach tools can be created to aid decision making at the field and policy level and educate the public?
3
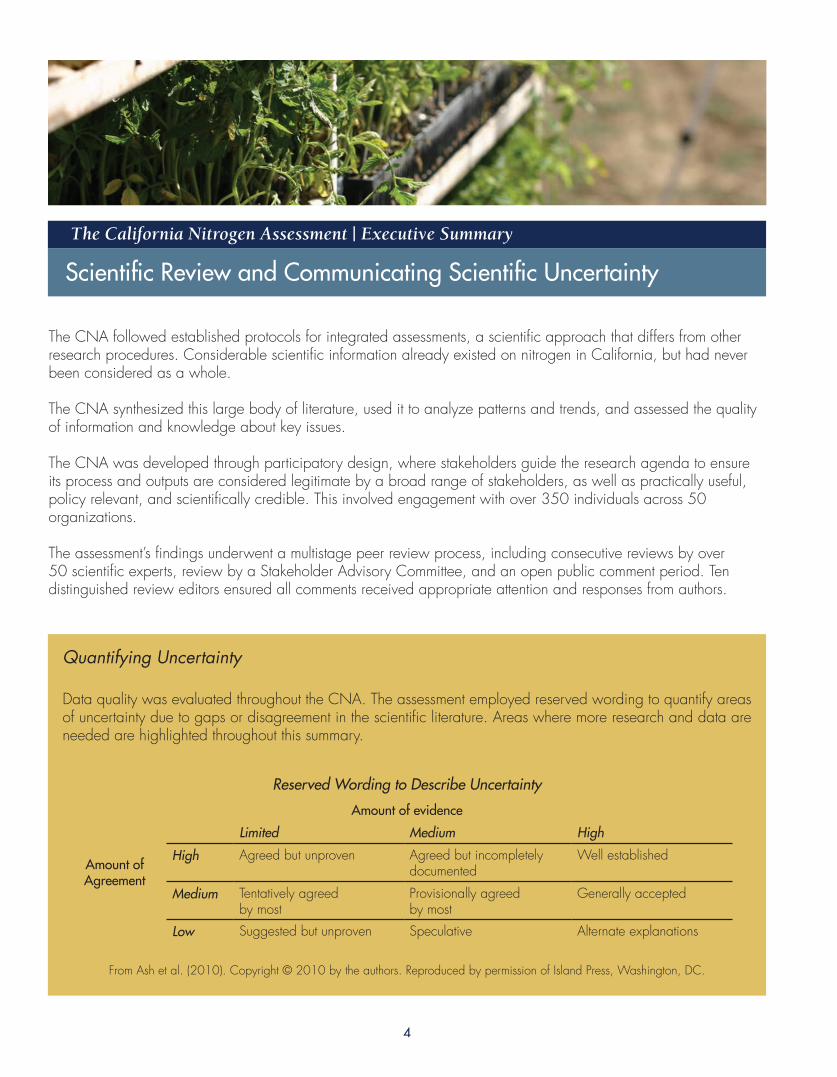
Quantifying Uncertainty
Data quality was evaluated throughout the CNA. The assessment employed reserved wording to quantify areas of uncertainty due to gaps or disagreement in the scientific literature. Areas where more research and data are needed are highlighted throughout this summary.
Reserved Wording to Describe Uncertainty
Amount of evidence
Amount of Agreement
Limited Medium High
High Agreed but unproven Agreed but incompletely documented
Well established
Medium Tentatively agreed by most
Provisionally agreed by most
Generally accepted
Low Suggested but unproven Speculative Alternate explanations
From Ash et al. (2010). Copyright © 2010 by the authors. Reproduced by permission of Island Press, Washington, DC.
The California Nitrogen Assessment | Executive Summary
The CNA followed established protocols for integrated assessments, a scientific approach that differs from other research procedures. Considerable scientific information already existed on nitrogen in California, but had never been considered as a whole.
The CNA synthesized this large body of literature, used it to analyze patterns and trends, and assessed the quality of information and knowledge about key issues.
The CNA was developed through participatory design, where stakeholders guide the research agenda to ensure its process and outputs are considered legitimate by a broad range of stakeholders, as well as practically useful, policy relevant, and scientifically credible. This involved engagement with over 350 individuals across 50 organizations.
The assessment’s findings underwent a multistage peer review process, including consecutive reviews by over 50 scientific experts, review by a Stakeholder Advisory Committee, and an open public comment period. Ten distinguished review editors ensured all comments received appropriate attention and responses from authors.
Scientific Review and Communicating Scientific Uncertainty
4

Global Drivers of Nitrogen Cycling
Many global factors influence nitrogen in California. These drivers include: • Human population and economic growth• Market opportunities for California commodities• Agricultural production costs and technological
change• Policies targeting nitrogen in California
The future balance of costs and benefits of nitrogen flows in California agriculture are dependent on trade and exchange rates determined in national and international policy arenas as well as environmental and public health policies shaped within California and nationally.
Over the last 50 years, world population doubled and global income quadrupled. This growth has led to an increased global demand for food, and has been a fundamental driver of expansion of agricultural production in California. California ships a large share of its agricultural products to other states and regions of the world. California produces more than half of the nation’s fruits, nuts and vegetables and 21% of the dairy commodities. For 2009, almost 50% of food produced in the state went to Europe and Canada, and another 27% to Mexico, China, and Japan. Transportation costs have gone down and international trade barriers have been reduced, which in turn allows consumers worldwide access to California-grown food. The growth of California’s population and economy has also resulted in a growth of transport and industrial activities that generate nitrogen emissions, including fossil fuel combustion from cars, trucks and buses, power generation, and wastewater creation. Population and economic growth in California increased demand for land and water resources.
California Drivers of Nitrogen Cycling Along with global factors that affect nitrogen, everyday actions of Californians radically alter the nitrogen cycle. Activities such as eating, driving, and disposing of waste affect nitrogen movement and influence nitrogen dynamics beyond California’s border.
Six actions fundamentally change nitrogen cycling in the state. Each of these drivers has intensified since 1980:• Nitrogen fertilizer use (both synthetic & organic sources)• Manure management2 • Fossil fuel combustion • Industrial processes • Wastewater management• Changes in land use
Nitrogen Fertilizer UseNitrogen fertilizer use—synthetic and organic—represents the largest use of nitrogen in the state. Synthetic nitrogen fertilizer application rates per acre increased an average of 25% between 1973 and 2005, in parallel with an increase in food production and a shift from field crops to perennials and vegetable crops. Data show that California crops recover, on average, less than half of applied synthetic nitrogen, with some crops capturing as little as 30%. Similar or even lower nitrogen recovery rates are found when organic nitrogen sources are used, but some evidence suggests that organic nitrogen sources typically have other benefits such as improved soil health, and the added organic matter from organic nitrogen improves soil structure, hydraulic conductivity, water holding capacity, biotic activity, and nutrient retention.
2 Unless specified, manure management in this summary refers to dairy manure management. Dairy manure accounts for nearly 75% of the nitrogen in manure produced in California, with no other individual category accounting for more than 8% (horses).
The California Nitrogen Assessment | Executive Summary
Summary of Findings
5
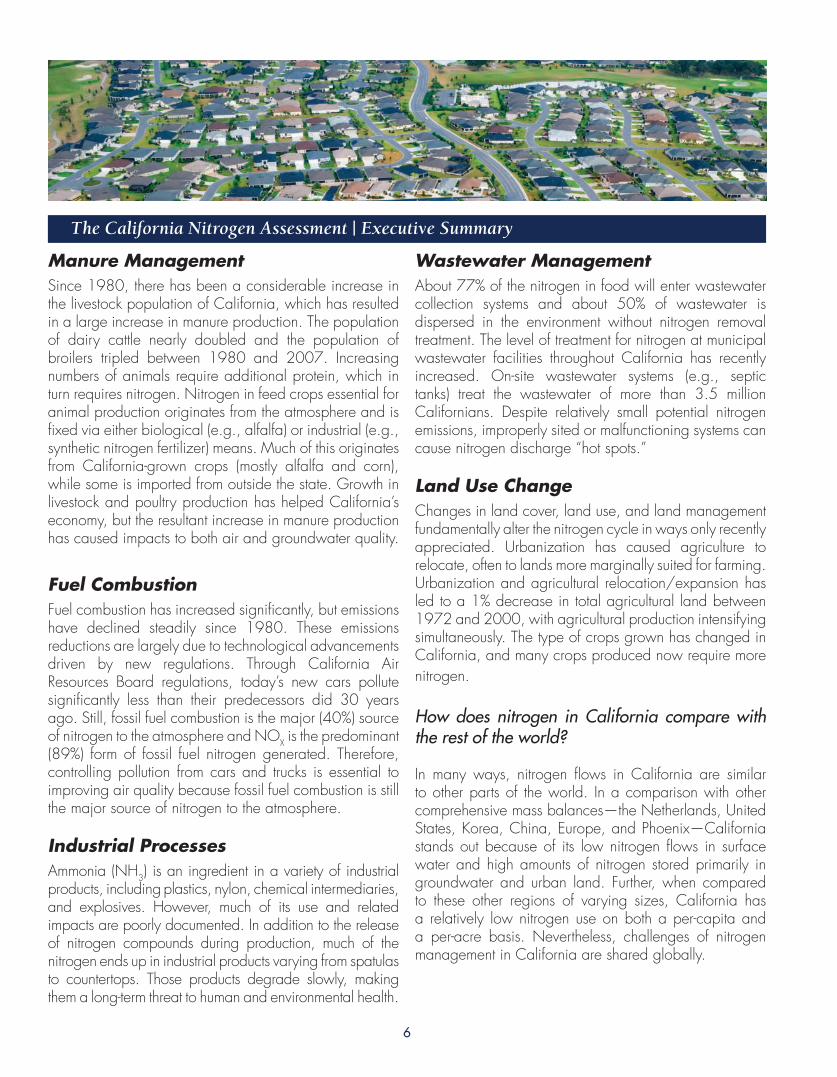
Manure Management Since 1980, there has been a considerable increase in the livestock population of California, which has resulted in a large increase in manure production. The population of dairy cattle nearly doubled and the population of broilers tripled between 1980 and 2007. Increasing numbers of animals require additional protein, which in turn requires nitrogen. Nitrogen in feed crops essential for animal production originates from the atmosphere and is fixed via either biological (e.g., alfalfa) or industrial (e.g., synthetic nitrogen fertilizer) means. Much of this originates from California-grown crops (mostly alfalfa and corn), while some is imported from outside the state. Growth in livestock and poultry production has helped California’s economy, but the resultant increase in manure production has caused impacts to both air and groundwater quality.
Fuel CombustionFuel combustion has increased significantly, but emissions have declined steadily since 1980. These emissions reductions are largely due to technological advancements driven by new regulations. Through California Air Resources Board regulations, today’s new cars pollute significantly less than their predecessors did 30 years ago. Still, fossil fuel combustion is the major (40%) source of nitrogen to the atmosphere and NOX is the predominant (89%) form of fossil fuel nitrogen generated. Therefore, controlling pollution from cars and trucks is essential to improving air quality because fossil fuel combustion is still the major source of nitrogen to the atmosphere.
Industrial ProcessesAmmonia (NH3) is an ingredient in a variety of industrial products, including plastics, nylon, chemical intermediaries, and explosives. However, much of its use and related impacts are poorly documented. In addition to the release of nitrogen compounds during production, much of the nitrogen ends up in industrial products varying from spatulas to countertops. Those products degrade slowly, making them a long-term threat to human and environmental health.
Wastewater Management About 77% of the nitrogen in food will enter wastewater collection systems and about 50% of wastewater is dispersed in the environment without nitrogen removal treatment. The level of treatment for nitrogen at municipal wastewater facilities throughout California has recently increased. On-site wastewater systems (e.g., septic tanks) treat the wastewater of more than 3.5 million Californians. Despite relatively small potential nitrogen emissions, improperly sited or malfunctioning systems can cause nitrogen discharge “hot spots.”
Land Use ChangeChanges in land cover, land use, and land management fundamentally alter the nitrogen cycle in ways only recently appreciated. Urbanization has caused agriculture to relocate, often to lands more marginally suited for farming. Urbanization and agricultural relocation/expansion has led to a 1% decrease in total agricultural land between 1972 and 2000, with agricultural production intensifying simultaneously. The type of crops grown has changed in California, and many crops produced now require more nitrogen.
How does nitrogen in California compare with the rest of the world?
In many ways, nitrogen flows in California are similar to other parts of the world. In a comparison with other comprehensive mass balances—the Netherlands, United States, Korea, China, Europe, and Phoenix—California stands out because of its low nitrogen flows in surface water and high amounts of nitrogen stored primarily in groundwater and urban land. Further, when compared to these other regions of varying sizes, California has a relatively low nitrogen use on both a per-capita and a per-acre basis. Nevertheless, challenges of nitrogen management in California are shared globally.
The California Nitrogen Assessment | Executive Summary
6
UncertaintyThe amount of evidence and level of agreement varies between nitrogen flows. The most important sources of uncertainty in the mass balance calculations are for major flows with either limited evidence or low agreement or both. Based on these criteria, biological nitrogen fixation on cropland and undeveloped land, the fate of manure, denitrification in groundwater, and the storage terms are the most important sources of uncertainty.
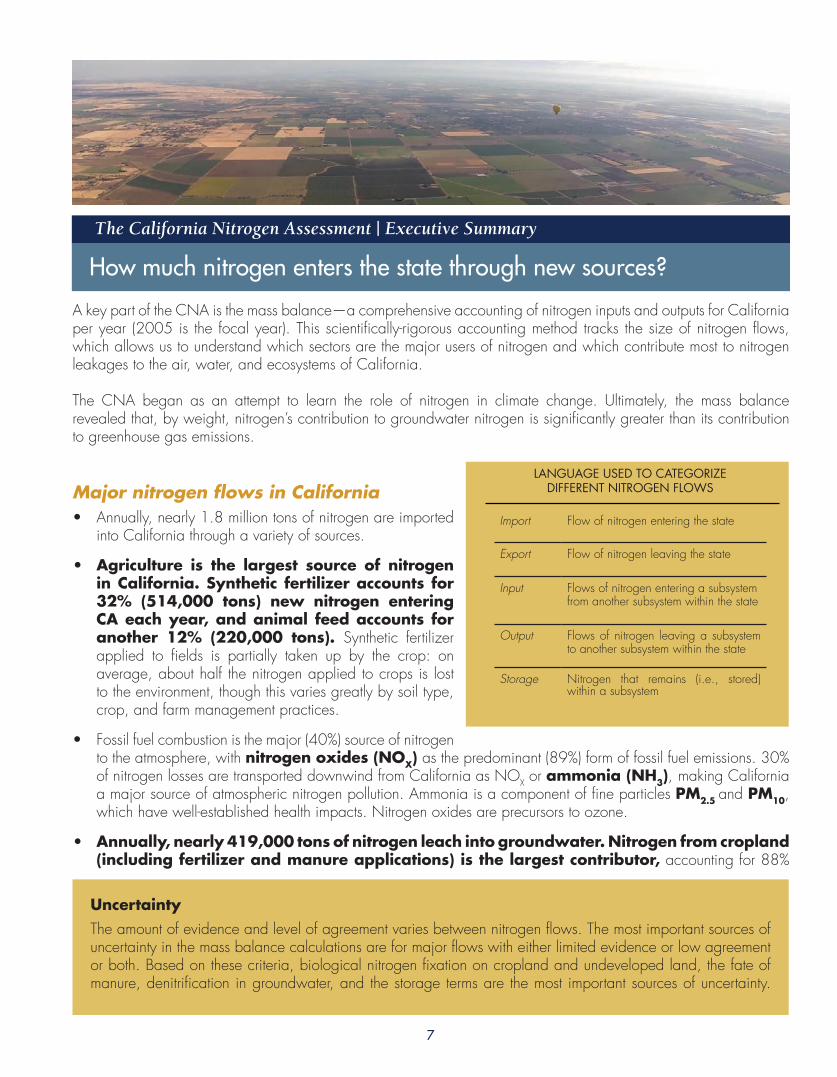
A key part of the CNA is the mass balance—a comprehensive accounting of nitrogen inputs and outputs for California per year (2005 is the focal year). This scientifically-rigorous accounting method tracks the size of nitrogen flows, which allows us to understand which sectors are the major users of nitrogen and which contribute most to nitrogen leakages to the air, water, and ecosystems of California.
The CNA began as an attempt to learn the role of nitrogen in climate change. Ultimately, the mass balance revealed that, by weight, nitrogen’s contribution to groundwater nitrogen is significantly greater than its contribution to greenhouse gas emissions.
Major nitrogen flows in California• Annually, nearly 1.8 million tons of nitrogen are imported
into California through a variety of sources.
• Agriculture is the largest source of nitrogen in California. Synthetic fertilizer accounts for 32% (514,000 tons) new nitrogen entering CA each year, and animal feed accounts for another 12% (220,000 tons). Synthetic fertilizer applied to fields is partially taken up by the crop: on average, about half the nitrogen applied to crops is lost to the environment, though this varies greatly by soil type, crop, and farm management practices.
• Fossil fuel combustion is the major (40%) source of nitrogen to the atmosphere, with nitrogen oxides (NOX) as the predominant (89%) form of fossil fuel emissions. 30% of nitrogen losses are transported downwind from California as NOX or ammonia (NH3), making California a major source of atmospheric nitrogen pollution. Ammonia is a component of fine particles PM2.5 and PM10, which have well-established health impacts. Nitrogen oxides are precursors to ozone.
• Annually, nearly 419,000 tons of nitrogen leach into groundwater. Nitrogen from cropland (including fertilizer and manure applications) is the largest contributor, accounting for 88%
LANGUAGE USED TO CATEGORIZEDIFFERENT NITROGEN FLOWS
Import Flow of nitrogen entering the state
Export Flow of nitrogen leaving the state
Input Flows of nitrogen entering a subsystem from another subsystem within the state
Output Flows of nitrogen leaving a subsystem to another subsystem within the state
Storage Nitrogen that remains (i.e., stored) within a subsystem
The California Nitrogen Assessment | Executive Summary
How much nitrogen enters the state through new sources?
7

(367,000 tons) of nitrogen leaching to groundwater. Only a little over a third of the net annual nitrogen inputs to groundwater are extracted from wells for irrigation and drinking water or removed by denitrification in the aquifer, leaving two thirds of the additions each year to accumulate in groundwater. However, it can take years to millennia for excess nitrogen in soil to reach groundwater.
• Livestock consume 614,000 tons of nitrogen each year in their feed. Only 25% of that becomes meat or milk for our consumption; the rest is excreted in manure. Much of that manure is reapplied to cropland, where its nitrogen has the potential to leach into groundwater. Some of the nitrogen in manure is released into the air or water or stored in soils.
• Nitrous oxide (N2O, a potent greenhouse gas) accounts for 4% of greenhouse gas emissions in California. Agriculture, by way of cropland soils and manure management, accounts for 32% of those N2O emissions (1.3% of total statewide GHG emissions). However, these estimates are based on California’s Greenhouse Gas Emissions Inventory methodology, which uses general global emissions factors that do not account for California-specific conditions.
• 61% of wastewater is discharged into the Pacific Ocean (about 90,000 tons of nitrogen). Only a small amount (about 13,000 tons) of wastewater nitrogen was discharged into surface water bodies of California. Discharge of treated wastewater to land (about 12,000 tons) that subsequently leaches to groundwater was a small (9%) fraction of wastewater. About 24,000 tons of biosolids are applied to cropland and placed in landfills. Very small amounts of N2O are released during wastewater treatment processes.
California statewide nitrogen mass balance for the year 2005: Imports, exports and storage. Numbers indicated on the chart are in thousands of tons of nitrogen.
NO298
Groundwater Storage
283
N 225
NH 227
Other Urban Storage136
Natural Land Storage100
Sewage Discharge90
Food87
Urban Land Storage79
Land�ll Storage
78
Cropland Storage74River
Discharge43
N O42
Reservoir Storage
22
Synthetic Fixation650
Fossil Fuel NO396
Feed Imports 220
Cropland Fixation
216
Natural Lands
Fixation 153
Fiber Imports44
Atmospheric Import44
Fossil Fuel NH40
Fossil Fuel N O10
Delta WaterImports
9
x
3
2
x
2
3
2
IMPORTS EXPORTS &
STORAGE1.78 milliontons
1.78 milliontons
8

The California Nitrogen Assessment | Executive Summary
What are nitrogen’s impacts on the environment and human health? Air Nitrogen is a component of, or aids in the formation of, five known air pollutants including nitrogen oxides (NOX, which includes NO2, nitrogen dioxide), ammonia (NH3), ozone (O3), and particulate matter (PM2.5 and PM10). Major emissions sources include the combustion of fossil fuels in the transportation, energy generation, and industrial sectors, as well as agricultural fertilizers and livestock.
Since the 1960s, hundreds of studies have linked exposure to NO2, ozone, and particulate matter to health issues. It is well established that ozone and particulate matter adversely impact respiratory health, and that particulate matter has adverse effects on cardiovascular health and increases early mortality. It is provisionally agreed by most that particulate matter is associated with increased cancer risk and adverse birth outcomes. It is provisionally agreed by most that nitrogen oxides have adverse effects on respiratory and cardiovascular health.
Despite significant declines in nitrogen oxides, ozone, and particulate matter over the past four decades, much of the state’s air quality still fails to meet one or more state recommendations set to protect human health. This comes at great health and economic cost:
• The California Air Resources Board estimates that annual exposure to PM2.5 results in 7,300 excess deaths from cardiopulmonary diseases and 5,500 from heart disease.
• Health costs attributed to ozone levels that exceed California’s recommendation include an estimated 630 deaths, 4,200 hospital admissions for respiratory disease, 660 ER visits for asthma, and 4.7 million days of missed school among children.
• Attaining the state and national Ambient Air Quality Standards could save California $4.5 and $2.8 billion per year, respectively.
• Residential segregation by race in some parts of the state has been shown to result in disproportionately higher rates of exposure to ozone and PM2.5 of Hispanic and Black residents compared to White residents.
WaterHigh levels of nitrate in drinking water can harm human health. Relatively low concentrations of nitrite and nitrate are found in drinking water from the state’s surface water. In contrast, nitrate levels in groundwater have increased over the past several decades, and some parts of the state now exceed federal standards for safe drinking water.
Concerns about the health impacts of nitrate led to the establishment of drinking water standards in 1962 to control nitrate levels (10 mg nitrate-nitrogen per liter). Despite its long regulatory history, some uncertainty around the health impact of human nitrate and nitrite consumption from drinking water still exists and warrants more studies. Associated health problems include: • Nitrate ingestion among infants (from water often mixed with baby formula) can decrease the capacity of an
infant’s blood to carry oxygen (known as methemoglobinemia or “blue baby syndrome”), which can cause lethargy, dizziness, coma, and even death. While this health impact is generally accepted, due to the complexity
9

Additional Impacts In addition to potential effects on human health, excess nitrogen in the environment can have detrimental impacts on native species, biodiversity, and natural and working landscapes, thus diminishing their natural heritage value to all of us.
Air pollution, particularly ozone, has adverse effects on crop growth. Yield losses can range from 1% to 33%, depending on the sensitivity of the crop and level of exposure. The overall economic impact of ozone on agricultural production in California is estimated to be on the order of hundreds of millions of dollars per year. High levels of ozone are also widely considered to have the most severe impacts on plant growth in natural ecosystems relative to other air pollutants.
Air pollution increases nitrogen deposition and drives long-term changes in plant species diversity across many global and local ecosystems. The process of nitrification, which converts ammonium to nitrate can also lead to long-term soil acidification and increased concentrations of potentially toxic metals (e.g., aluminum), both of which can degrade soil quality and limit plant growth. Additional nitrogen encourages invasive plants, retarding native nitrogen-fixing species and natural ecosystems.
of physiological processes involved, there is ambiguity about the drinking water concentrations of nitrate required to cause this condition.
• Consuming nitrate and nitrite from drinking water and food sources has been linked with multiple cancers and the International Agency for Research on Cancer concluded that consumed nitrate and nitrite are “probably carcinogenic to humans.” Most adults consume more nitrate and nitrite through food than through drinking water, except individuals whose domestic drinking water contains nitrate in excess of the federal standard—in these cases, nitrate consumption from drinking water is the larger (50%–70%) source.
• It is suggested but unproven that maternal exposure to nitrate is a risk factor for pre-term birth, low birth weight, fetal distress, premature labor, and other adverse birth outcomes, and more research is needed to explore the impact of nitrate exposure on birth outcomes and birth defects.
People in agricultural areas, particularly those with domestic wells, are more likely to be exposed to high levels of nitrate in their drinking water than those in urban and suburban areas. Groundwater from some wells in the Tulare Lake Basin and Salinas Valley regularly exceed state and federal standards. Between 212,000 and 250,000 people in these areas, or approximately 8.0%–9.4% of residents, are highly susceptible to exposure to nitrate in the drinking water that exceeds the state maximum level. A disproportionate number of these residents are of Latino ethnicity and are considered low-income.
That elevated nitrate consumption can have significant impacts on human health is clear; however, further research is needed to clarify uncertainties about the exact physiological impacts of different levels and types of nitrate exposure. It can take from several years to millennia for nitrogen leached from the soil surface to enter groundwater, meaning that groundwater contamination will likely continue to mount for the foreseeable future. The potential impacts of nitrogen on the health of California communities, combined with increasing rates of nitrogen in groundwater and the difficulty of remediating groundwater contamination, create an urgent challenge to protect California’s vulnerable communities today and strive for a better understanding of nitrate’s health impacts.
The California Nitrogen Assessment | Executive Summary
10

The California Nitrogen Assessment | Executive Summary
What are the technological and policy options to minimize nitrogen’s negative effects while sustaining the vitality of agricultural and natural ecosystems?
Moving forward, Californians can work together to adapt systems to maintain productivity, minimize exposure, and relieve further pressure on the environment. Adaptation will be especially important as populations, and concentrations of reactive nitrogen in the environment, grow.
Improvement of agricultural, industrial, and transportation nitrogen efficiency offers a rare win-win opportunity to advance economic and environmental goals.
Though the nitrogen cycle is complex, we have identified nine control points where changes could improve nitrogen efficiency and reduce nitrogen losses, and identified the priority areas that could bring about the greatest reductions. The nine control points are listed in the graphic below.
surface waterquality
human health andenvironmental
effects
air quality
air quality
consumerproducts
groundwaterquality
food
climate regulation
groundwaterquality
AmmoniaProduction
Concentrated AnimalFeeding Operations
RangelandCropland Irrigation and Drinking Water
Drinking Water
SewageTreatment
Groundwater Groundwater
URBAN LAND
CROPLAND
NATURALLAND
ATMOSPHERE
OCEAN
sewagedischarge
oceandischarge
riverdischarge
gaseouslosses
deposition
croplandfixation
syntheticfixation natural land
fixationdeposition
fertilizerapplication
manureapplication
animalfeed
groundwaterpumping
leaching
agriculturalrunoff
biosolids
leaching groundwaterpumping
agriculturalproduction
chemicalproduction
fiber
urbanrunoff
deposition
flow
gaseouslosses
44
8
8
3
6
7
9
15
6
32
# critical control point
1 Agricultural N use efficiency
2 Consumer food choices
3 Food waste
4 Energy and transportationsector efficiency
5 Ammonia volatilization from manure
6 Nitrate leaching from croplands
7 Greenhouse gas emissions from fertilizer use
8 Nitrogen oxides from fuel combustion
9 Wastewater management
11

The California Nitrogen Assessment | Executive Summary
Agricultural Nitrogen Use Efficiency and Cropland ManagementOur estimates suggest that gains in efficiency could result in nearly 40,000 tons less fertilizer nitrogen use per year and 90,000 tons less feed nitrogen demand per year with greater adoption of soil management practices.
Using the mass balance developed for the CNA, we determined that stopping groundwater nitrate accumulation would require a 67% decrease in current leaching (283,000 tons), a significantly larger decrease than appears to be feasible just by using current technology to improve nitrogen use efficiency.
For 23 major California crops examined in the assessment, plot- and field-scale research trials consistently achieve greater nitrogen use efficiencies than the statewide averages. In addition to further research refining nitrogen use guidelines for many crops, future efforts to increase nitrogen use efficiency will have to go beyond the development of new technological innovations to address socio-economic drivers of technology adoption and use.
Energy and Transportation Sector EfficiencyCalifornia has led the nation in combatting emissions, primarily of nitrogen oxides, but decreasing emissions further remains critical. It is generally accepted that decreasing total fuel combustion will be key to major reductions in GHG emissions and other nitrogen-based pollutants. Alternative fuel and alternative vehicles offer promising pathways to improvement, but are complicated by upstream emissions from power generation.
Manure Management In Central Valley dairies, 25%–50% of nitrogen in excreted manure is lost as ammonia emissions. That wide range indicates room for improvement for operators with the highest emission rates. Reducing ammonia emission requires a whole farm approach, since decreasing pollutants in one point of the manure management train serves to conserve nitrogen in the manure, which may then result in increasing emissions at a later point.
Wastewater ManagementWastewater nitrogen management could be transformed to expand nitrogen removal where appropriate and stimulate recycling whenever possible. Technologies for wastewater nitrogen management include creating conditions to support microbial nitrification and denitrification (with nitrogen released harmlessly into the atmosphere as non-reactive N2) and separation of solid and liquid portions of the waste stream for reuse as fertilizers. A conservative increase in nitrogen treatment at wastewater treatment plants would reduce nitrogen discharged into the environment by 17,000 tons/year. And depending on the extent of retrofits and operations, nitrogen discharged could be reduced by an additional 1,400–12,000 tons/year.
Consumer Choices and Food WasteDemand by U.S. and global consumers shapes farmers’ decisions on what crops to produce and how to produce them. Because foods differ in their nitrogen content and in the amount of nitrogen required to produce them, consumer preferences for specific commodities can have a large influence on local, statewide, national, and global nitrogen cycling. In California, food waste accounts for 24% of landfilled materials. Finding ways to reduce waste would reduce the nitrogen load in landfills and recycle food-nitrogen to the soil.
12

Anticipated effects of dairy manure management technologies on the fate of nitrogen, with associated scientific uncertainty.*
$$
$
$$$$$
Incorporation below surface
Solid–liquid separation
Split applications
Precision feeding
NH to
atm
ospher
e
3
N O o
r NO
to at
mos
phere
2
x
Barriers
Supplements & hormones
Anaerobic digestion of wastewater
Well established
Measured applications & �ow meters
Frequent manure collection
Provisionally agreed by most
Storage cover for wastewater ponds
Composting manure solids
Agreed but incompletely documented
Speculative
Yield
>
= positive mitigative e�ect = negative e�ect = uncertain n = no e�ect
Agreed butunproven
> = minimal impact
$= cost = logistics = information science & technology= = regulation = labor
NO to
gro
undwat
er
3
NO to
surfa
ce w
ater
3
The California Nitrogen Assessment | Executive Summary
13
* Some of these management practices are already being implemented by dairy producers in California under the Dairy General Order and similar regulatory programs.

Increasing soil drainage
Genetic improvement
Switching irrigation technology
Edge of �eld
NH to
atm
ospher
e
3
N O
to at
mos
phere
2
Yield Barriers
$
Reducing N rate
Changing N placement & timing
n
n n
$$
$$
Conservation tillage
Agricultural residue
n $
Diversify crop rotations
Manage fallow periods
$$
n
n
n
Switching N source n
= positive mitigative e�ect = negative mitigative e�ect = uncertain n = no e�ect
Well established
Generallyaccepted
Provisionallyagreed bymost
Tentatively agreed by mostAgreed but incompletely documented
Organic amendments & practices
Agreed butunproven
Speculative
NO to
gro
undwat
er
3
NO to
surfa
ce w
ater
3
$= cost = logistics = information science & technology= = regulation = labor
$
The mitigative effects of cropland management practices on the fate of nitrogen, with associated scientific uncertainty.
The California Nitrogen Assessment | Executive Summary
14

Trade-offs of Nitrogen Reduction EffortsDue to the complexity of the nitrogen cycle and the many different forms nitrogen can take, strategies and practices to control nitrogen can have significant side-effects. Some actions will cause positive, synergistic responses in the cycle, while others will induce trade-offs, where the reduction of nitrogen emissions at one location may elevate emissions at another location. The primary trade-offs to consider are presented in the table below.
The California Nitrogen Assessment | Executive Summary
Trade-off Initial Nitrogen Reduction Secondary Nitrogen IncreaseMinimization of ammonia volatilization from manure can increase nitrate leaching and nitrous oxide emissions.
Avoiding ammonia volatilization will decrease particulate matter downwind in certain locations.
That manure will maintain a greater nitrogen load without volatilization, which is likely transferred to cropland as fertilizer. Increased nitrogen load requires a larger application area or increases the risk of over-application.
Reducing nitrate leaching from cropland can increase nitrous oxide emissions.
Fertilizer synchronized with crop demand and irrigation timing gives plants more time to take up nitrogen. Microbes denitrify nitrate into inert N2.
The efficacy of denitrifying bacteria is dependent on soil conditions. In the absence of appropriate conditions, intermediary products of NO and N2O are produced instead of the inert N2. Differences in soil conditions across a field make it difficult to maintain denitrifying conditions throughout.
Reducing nitrogen oxide emissions from fuel combustion can increase ammonia emissions.
Certain technologies use post-combustion catalysts to transform nitrogen oxides to inert N2.
Vehicle engines using three-way catalytic converters can produce ammonia instead of N2. Congestion and slow driving speeds promote greater ammonia production.
Decreasing ammonium and nitrate from wastewater can increase nitrous oxide emissions.
Microbial nitrification and denitrification processes tend to lower concentration of ammonium and nitrate to soils, rivers, and the ocean.
A larger amount of nitrogen can be released to the atmosphere as nitrous oxide due to incomplete denitrification.
Decreasing leaching inhibits flushing of salts.
Decreased leaching reduces nitrate leakage to groundwater.
Without leaching, plant-toxic salts accumulate in the rootzone and decrease production.
15

Assessment of Policy Instruments
The California Nitrogen Assessment | Executive Summary
Any successful strategy to reduce nitrogen emissions from agriculture must take a comprehensive approach to the most important forms of nitrogen leakage into the environment—particularly ammonia and nitrate, but also including nitrous oxide—to avoid “solving” one nitrogen problem while worsening others.
Additionally, instead of following a one-size-fits-all approach, design of policies should consider relationships between nitrogen sources and their specific impacts and how these may be both spatially and temporally distributed. A suite of policies may be needed to achieve both adequate source control and mitigation of the existing stock of nitrogen, at the appropriate local to regional spatial scale and within reasonable timeframes.
From among the categories of education, standards, and economic incentives, potential policy instruments were assessed for two high-priority nitrogen issues: nitrate emissions to groundwater and ammonia emissions to the atmosphere. For each, six criteria were systematically applied to assess potential policy instruments based on available evidence. The six criteria are:
• Adaptability: Flexibility to accommodate changing conditions
• Institutional compatibility: Implementation does not conflict with larger institutional frameworks
• Distributional effects: How both costs and benefits are distributed across stakeholder groups
• Cost effectiveness: Total economic cost of implementation compared across policy alternatives
• Technological feasibility: Are currently available technologies and practices suitable?
• Environmental effectiveness: A likelihood of achieving the desired environmental goal, without major side effects.
The assessment is informed and supplemented by review of 12 case studies encompassing experience (as published and available prior to early 2015) with these policy instruments in practice in controlling nitrogen pollution: five California programs, five nutrient-impaired waterbodies in other states, an overview of European nitrogen policies, and a review of state-level nutrient programs.
The policy instruments that rated highly across all six criteria for these pollutants fall within the categories of standards and economic incentives. Although they are not typically effective alone, education-based instruments can play a supporting role to other policy mechanisms.
Emission standards specify that emissions must not exceed a specified limit. The main advantage to standards may be their simplicity and intuitive appeal: when faced with too much of a bad thing, we are inclined to set a limit and enforce it with a penalty. Emission standards, in contrast to input standards, allow producers the flexibility to select the most cost-effective set of production practices that meets the standard, rather than prescribing the practices or technologies the producer must use to meet the standard. However, the regulator must be able to accurately monitor emissions in order to enforce the standard; new technologies and methods may be needed to ensure cost-effectiveness and appropriate accuracy of data collection, analysis, and management. Additionally, small producers may be disproportionally impacted by fixed costs.
Emission charges or abatement subsidies provide financial incentives for emitting less, or achieving greater abatement of the pollutant, by setting a price on emissions or abatement. Among advantages of these economic incentives, producers are encouraged to innovate, seeking cheaper ways to effectively cut pollution over time. Charges also provide revenue that can be used to offset costs of administering environmental policies,
16

among other things. Subsidies can be especially useful when producers have property rights to the polluted medium, and/or the polluting industry produces other uncompensated external benefits. These instruments also have drawbacks. Different producers will select different abatement levels, potentially producing undesirable local or regional differences in ambient pollution levels. Subsidies can encourage additional entrants into the industry, which can offset pollution reductions at the individual level. Emission charges entail higher costs for producers who must pay for abatement and/or emissions.
Tradable emission permits offer a quantity-based alternative to the price-based economic incentives of charges and abatement subsidies. While charge and subsidy instruments set prices directly, tradable permits fix the supply of a desirable good (the right to release emissions) and allow the price to be set through market transactions among producers. General advantages of tradable permits are similar to those of charges. However, tradable permits may be less suited to addressing groundwater nitrate than they are to addressing ammonia emissions: most air quality issues, including those relevant to ammonia, are regional in scale, whereas only a small number of producers may be responsible for nitrate contamination of a groundwater well. A small number of players can lead to concentrations of market power and undermine the potential benefits of trade.
Auction-based abatement contracts are implemented with a reverse-auction format in which the producers are the sellers and the regulator is the buyer. The producers submit bids (an abatement plan and corresponding compensation) to the regulator, who selects the combination of bids that achieves the environmental goal at least cost. The regulator is able
to deliberately select bids to coordinate abatement efforts across producers and to minimize efforts that are duplicative or even countervailing. However, this coordinating effort may entail higher administrative costs than alternative instruments.
Controlling nitrogen pollution is particularly challenging in California. It is both a point- and a non-point source pollutant, and in agriculture it varies by region, crop, soil type, management practices, and other factors. Because non-point source emissions are difficult for regulators to verify, policies that are otherwise most promising for addressing nitrogen issues in California must rely on modeled or estimated emissions. Thus, the development of technologies and tools to improve the sensitivity of models or the feasibility of monitoring is especially important for the creation of sound policy.
With current technology, certain practices and technologies could reduce the amount of reactive nitrogen in the environment. Producers are increasingly able to implement the 4 Rs of nutrient stewardship in crop production: right amount, right time, right place, and right form. Overall, however, voluntary implementation is low because technologies and practices that can reduce nitrogen pollution typically are costly for farmers and ranchers and potentially involve other factors such as lower yields, perceived risks to production, and lack of adequate scientific information to support the many specialty crops in California.
A full discussion of trade-offs of the above instruments, as well as additional policy instruments that rated lower in the assessment, is available in Chapter 8 of the CNA.
The California Nitrogen Assessment | Executive Summary
Assessment of Policy Instruments, continued
17

Challenges to Promising Policies The general lack of evidence, rigorous experimentation, comparative study, or integrated assessment of the impact of alternative policy instruments for controlling nitrogen pollution from agriculture is a major barrier to development of sound policy.
A comprehensive monitoring network and information system is needed to understand and shape California’s nitrogen cycle. Fortunately, California has the makings of a monitoring network already in place, at least for aspects of air quality and groundwater quality. For air quality, regulatory agencies operate monitoring stations, with the capacity to detect nitrous oxide and particulate matter. Deposition of ammonia and nitrogen oxides, however, is less well observed. For groundwater quality, the Irrigated Lands Regulatory Program and Central Valley Dairies Representative Monitoring Program are beginning to collect information on nitrate groundwater pollution, which will provide data needed to better understand nitrogen cycling. Additionally, implementation of the Sustainable Groundwater Management Act will require monitoring wells to track quality and quantity concerns within basins. These were developed after the CNA was written and are not evaluated in the assessment. Nitrogen input information collected at the regional and state level should be synthesized and made publically available.
Metrics are fundamental to any nitrogen response strategy. Smart nitrogen metrics capable of documenting the conditions of California’s nitrogen cascade (at an appropriate scale and reasonable cost) are central to the development and evaluation of effectiveness of response strategies.
Metrics that aggregate across different compounds are available for some environmental impacts. Perhaps the most well-known metric of this type is used for greenhouse gas emissions. Methane, nitrous oxide, and carbon dioxide emissions can all be expressed in terms of their radiative forcing over a fixed timeframe (100 years) in a common unit, ‘carbon dioxide equivalents.’ Unifying the metric allows management practices that affect various impact pathways to be compared.
What Could the Future Look Like?Much of the nitrogen lost from cropland accumulates in groundwater. While, overall, groundwater is still relatively clean, there are many drinking water wells in California with nitrate concentrations above federal limits (10 mg nitrate-nitrogen per liter). It can take several years to millennia before excess nitrogen reaches groundwater after synthetic fertilizer or manure is applied to a crop. This time lag means nitrogen contamination in groundwater will likely continue increasing in the future. Even if we dramatically decreased nitrogen leaching to groundwater today, California residents are still susceptible to the negative health impacts caused by high nitrate levels, and this will persist well into the future.
The CNA process developed stakeholder-driven scenarios for the future of nitrogen management in California over the next 20 years. Insights from these scenarios suggest that the biggest uncertainties in the future of nitrogen management hinge on shifts in public policy around nitrogen and changes in farm profitability.
The manner in which regulatory policies are implemented may be as important to successful nitrogen management as the sheer extent of regulations. Policies that allow for flexible responses across the state, and that are implemented with advance notice and in collaboration with the agricultural community, are more likely to allow producers to maintain profitability while adapting their practices. Continued farm profitability, in turn, enables producer innovation in addressing nitrogen issues.
The scenarios, thus, suggest the presence of multiple feedback loops between policies, farm profitability, environmental quality, and nitrogen management. They also illustrate important roles for public and private investment in research, development, and extension. Overall, the scenarios offer multiple pathways toward more effective nitrogen management in California.
Even if policies somehow could perfectly control nitrate leakages from farms and dairies starting immediately, California will be living with the consequences of past nitrate leakages for decades to come.
Thus, for communities where drinking water supplies are unsafe because of high nitrate concentrations, point-of-use treatment or other short-term solutions are needed in combination with lasting safe drinking water solutions.
18

The California Nitrogen Assessment book is available for online order: The California Nitrogen Assessment: Challenges and Solutions for People, Agriculture, and the Environment is available from University of California Press at www.ucpress.edu.
Additional resources can be found at the Agricultural Sustainability Institute website:
More information about the California Nitrogen Assessment, including scientific and stakeholder review processes and appendices to the book, is available at asi.ucdavis.edu/nitrogen.
Contact Information:
Agricultural Sustainability InstituteUniversity of California DavisOne Shields AvenueDavis, CA [email protected]
California Nitrogen Assessment team: [email protected]
Dr. Tom Tomich, Principal Investigator: [email protected]
Major funding for the California Nitrogen Assessment was provided by a grant to the Agricultural Sustainability Institute from the David and Lucile Packard Foundation. Further financial support provided by:
• UC Division of Agriculture and Natural Resources (UC ANR)
• UC Sustainable Agriculture Research and Education Program (UC SAREP) (a statewide program of UC ANR)
• UC ANR Kearney Foundation of Soil Science• USDA Hatch project CA-D-XXX-7766-H funds for
the project “California Agroecosystem Assessment”• WK Kellogg Endowed Chair in Sustainable Food
Systems at UC Davis