Embed Size (px)
Citation preview
eResearch Corporation 78 Cameron Crescent, Suite 202 Toronto, Ontario M4G 2A3
www.eresearch.ca
The Carlucci Indicator
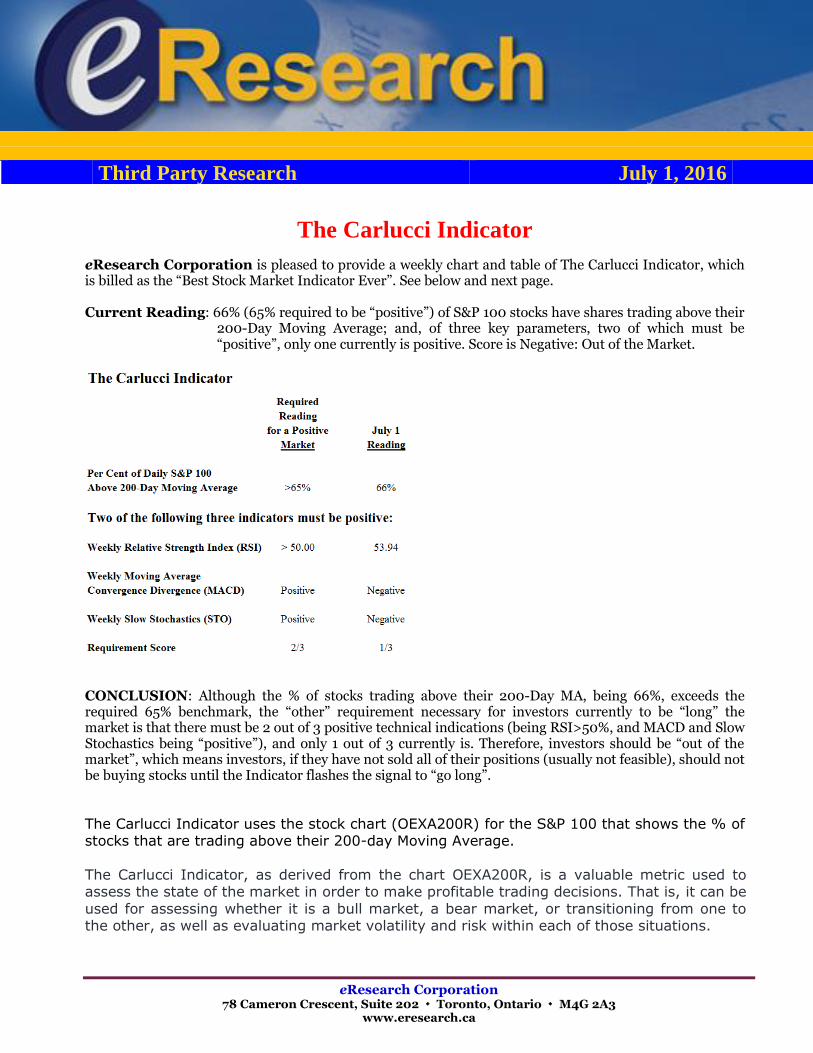
eResearch Corporation is pleased to provide a weekly chart and table of The Carlucci Indicator, which is billed as the “Best Stock Market Indicator Ever”. See below and next page. Current Reading: 66% (65% required to be “positive”) of S&P 100 stocks have shares trading above their
200-Day Moving Average; and, of three key parameters, two of which must be “positive”, only one currently is positive. Score is Negative: Out of the Market.
CONCLUSION: Although the % of stocks trading above their 200-Day MA, being 66%, exceeds the required 65% benchmark, the “other” requirement necessary for investors currently to be “long” the market is that there must be 2 out of 3 positive technical indications (being RSI>50%, and MACD and Slow Stochastics being “positive”), and only 1 out of 3 currently is. Therefore, investors should be “out of the market”, which means investors, if they have not sold all of their positions (usually not feasible), should not be buying stocks until the Indicator flashes the signal to “go long”.
The Carlucci Indicator uses the stock chart (OEXA200R) for the S&P 100 that shows the % of stocks that are trading above their 200-day Moving Average.
The Carlucci Indicator, as derived from the chart OEXA200R, is a valuable metric used to assess the state of the market in order to make profitable trading decisions. That is, it can be
used for assessing whether it is a bull market, a bear market, or transitioning from one to the other, as well as evaluating market volatility and risk within each of those situations.
Third Party Research July 1, 2016
The Carlucci Indicator
eResearch Corporation www.eresearch.ca 2
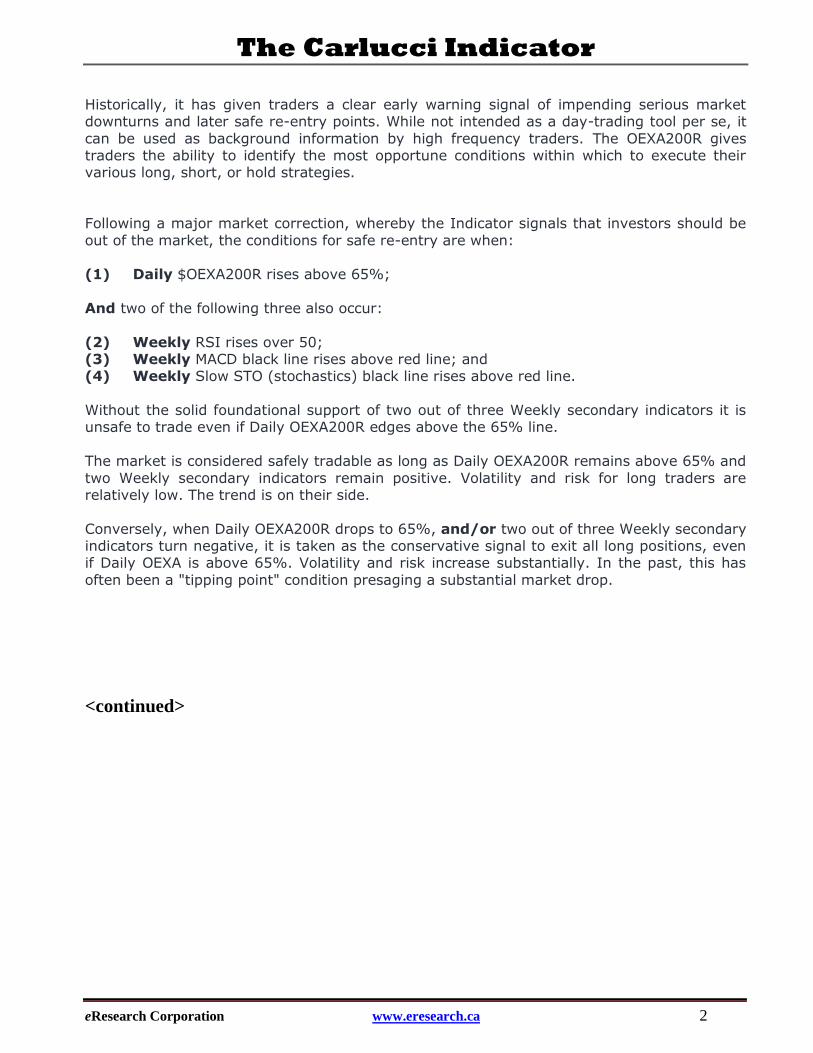
Historically, it has given traders a clear early warning signal of impending serious market downturns and later safe re-entry points. While not intended as a day-trading tool per se, it
can be used as background information by high frequency traders. The OEXA200R gives traders the ability to identify the most opportune conditions within which to execute their various long, short, or hold strategies.
Following a major market correction, whereby the Indicator signals that investors should be
out of the market, the conditions for safe re-entry are when: (1) Daily $OEXA200R rises above 65%;
And two of the following three also occur:
(2) Weekly RSI rises over 50; (3) Weekly MACD black line rises above red line; and (4) Weekly Slow STO (stochastics) black line rises above red line.
Without the solid foundational support of two out of three Weekly secondary indicators it is unsafe to trade even if Daily OEXA200R edges above the 65% line.
The market is considered safely tradable as long as Daily OEXA200R remains above 65% and
two Weekly secondary indicators remain positive. Volatility and risk for long traders are relatively low. The trend is on their side.
Conversely, when Daily OEXA200R drops to 65%, and/or two out of three Weekly secondary indicators turn negative, it is taken as the conservative signal to exit all long positions, even if Daily OEXA is above 65%. Volatility and risk increase substantially. In the past, this has
often been a "tipping point" condition presaging a substantial market drop.
<continued>
The Carlucci Indicator
eResearch Corporation ~ 3 ~ www.eresearch.ca
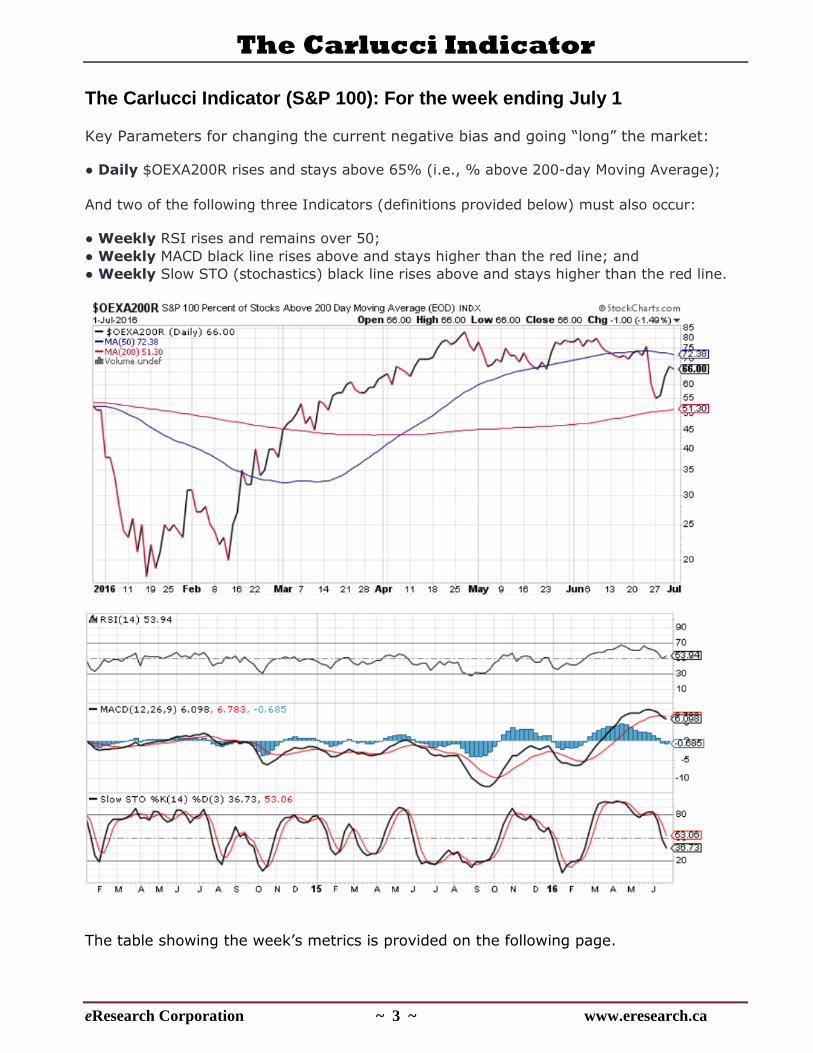
The Carlucci Indicator (S&P 100): For the week ending July 1
Key Parameters for changing the current negative bias and going “long” the market:
● Daily $OEXA200R rises and stays above 65% (i.e., % above 200-day Moving Average);
And two of the following three Indicators (definitions provided below) must also occur: ● Weekly RSI rises and remains over 50;
● Weekly MACD black line rises above and stays higher than the red line; and
● Weekly Slow STO (stochastics) black line rises above and stays higher than the red line.
The table showing the week’s metrics is provided on the following page.
The Carlucci Indicator
eResearch Corporation ~ 4 ~ www.eresearch.ca
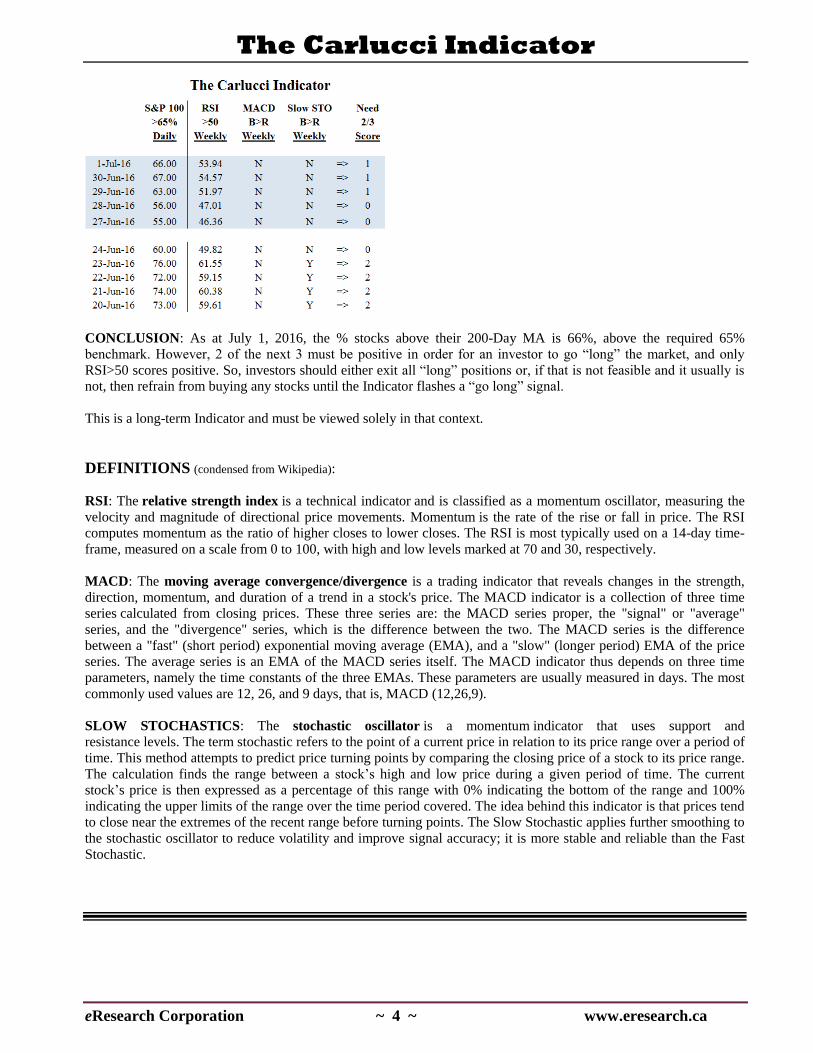
CONCLUSION: As at July 1, 2016, the % stocks above their 200-Day MA is 66%, above the required 65%
benchmark. However, 2 of the next 3 must be positive in order for an investor to go “long” the market, and only
RSI>50 scores positive. So, investors should either exit all “long” positions or, if that is not feasible and it usually is
not, then refrain from buying any stocks until the Indicator flashes a “go long” signal.
This is a long-term Indicator and must be viewed solely in that context.
DEFINITIONS (condensed from Wikipedia):
RSI: The relative strength index is a technical indicator and is classified as a momentum oscillator, measuring the
velocity and magnitude of directional price movements. Momentum is the rate of the rise or fall in price. The RSI
computes momentum as the ratio of higher closes to lower closes. The RSI is most typically used on a 14-day time-
frame, measured on a scale from 0 to 100, with high and low levels marked at 70 and 30, respectively.
MACD: The moving average convergence/divergence is a trading indicator that reveals changes in the strength,
direction, momentum, and duration of a trend in a stock's price. The MACD indicator is a collection of three time
series calculated from closing prices. These three series are: the MACD series proper, the "signal" or "average"
series, and the "divergence" series, which is the difference between the two. The MACD series is the difference
between a "fast" (short period) exponential moving average (EMA), and a "slow" (longer period) EMA of the price
series. The average series is an EMA of the MACD series itself. The MACD indicator thus depends on three time
parameters, namely the time constants of the three EMAs. These parameters are usually measured in days. The most
commonly used values are 12, 26, and 9 days, that is, MACD (12,26,9).
SLOW STOCHASTICS: The stochastic oscillator is a momentum indicator that uses support and
resistance levels. The term stochastic refers to the point of a current price in relation to its price range over a period of
time. This method attempts to predict price turning points by comparing the closing price of a stock to its price range.
The calculation finds the range between a stock’s high and low price during a given period of time. The current
stock’s price is then expressed as a percentage of this range with 0% indicating the bottom of the range and 100%
indicating the upper limits of the range over the time period covered. The idea behind this indicator is that prices tend
to close near the extremes of the recent range before turning points. The Slow Stochastic applies further smoothing to
the stochastic oscillator to reduce volatility and improve signal accuracy; it is more stable and reliable than the Fast
Stochastic.
The Carlucci Indicator
eResearch Corporation ~ 5 ~ www.eresearch.ca
The Carlucci Indicator #2
For comparative purposes, we have adapted The Carlucci Indicator by using the same criteria but applying it to the
S&P 500 Index, rather than the S&P 100 Index.
It will be interesting to observe whether the broader index moves in lock-step with its smaller-based brethren, or
whether it has a “mind of its own”.
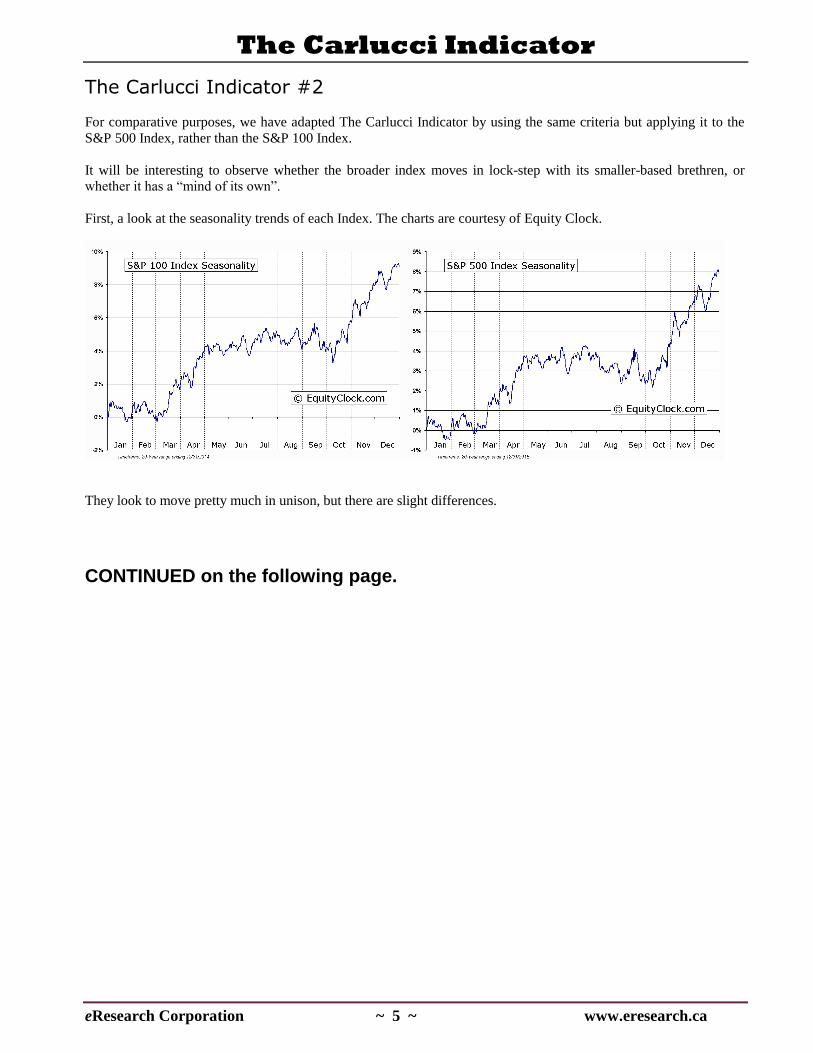
First, a look at the seasonality trends of each Index. The charts are courtesy of Equity Clock.
They look to move pretty much in unison, but there are slight differences.
CONTINUED on the following page.
The Carlucci Indicator
eResearch Corporation ~ 6 ~ www.eresearch.ca
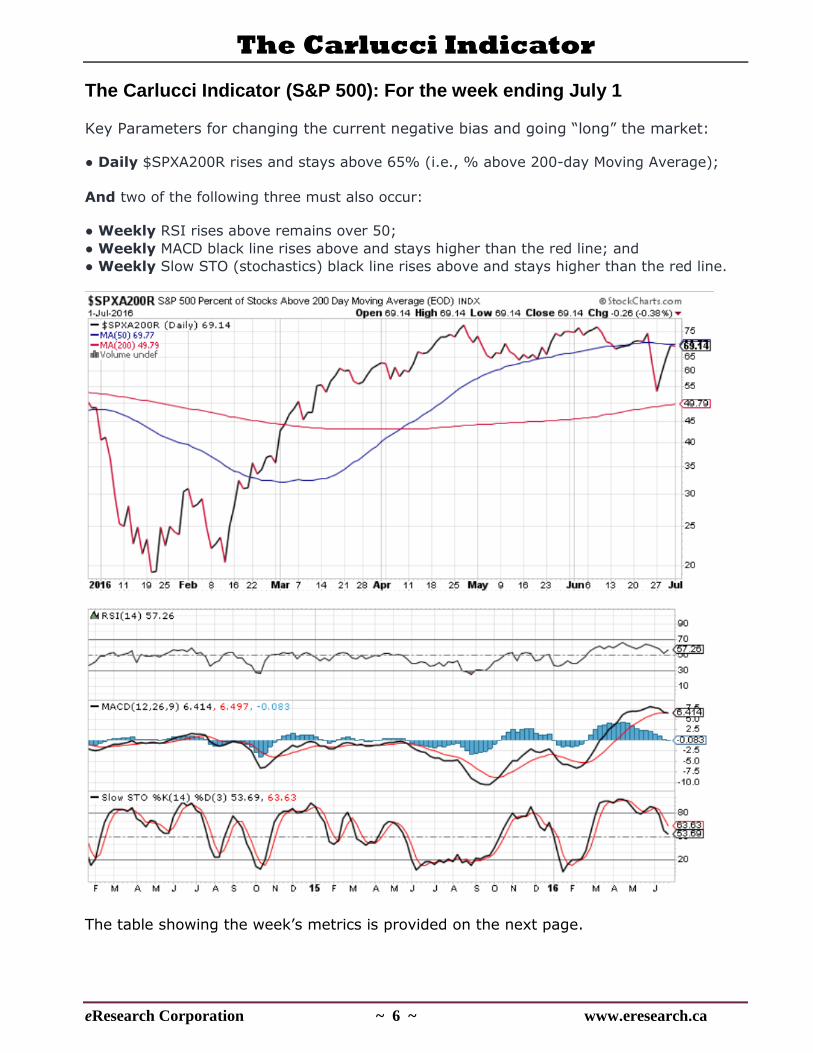
The Carlucci Indicator (S&P 500): For the week ending July 1
Key Parameters for changing the current negative bias and going “long” the market:
● Daily $SPXA200R rises and stays above 65% (i.e., % above 200-day Moving Average);
And two of the following three must also occur: ● Weekly RSI rises above remains over 50;
● Weekly MACD black line rises above and stays higher than the red line; and
● Weekly Slow STO (stochastics) black line rises above and stays higher than the red line.
The table showing the week’s metrics is provided on the next page.
The Carlucci Indicator
eResearch Corporation ~ 7 ~ www.eresearch.ca
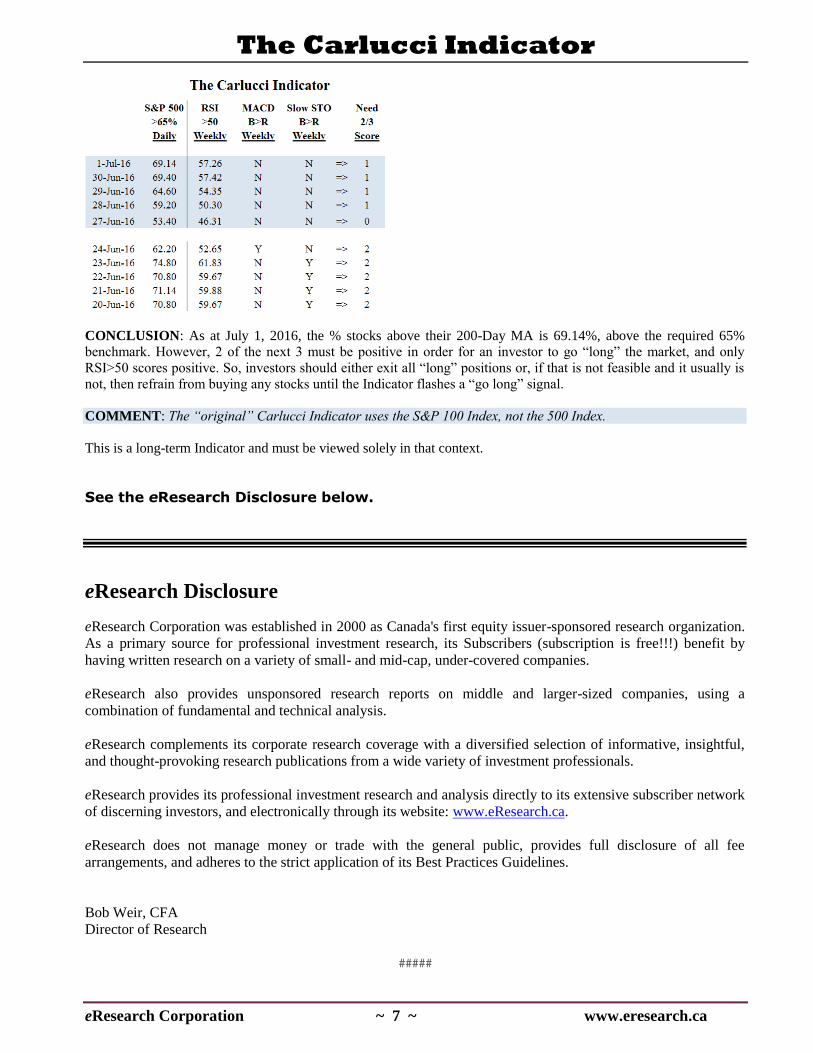
CONCLUSION: As at July 1, 2016, the % stocks above their 200-Day MA is 69.14%, above the required 65%
benchmark. However, 2 of the next 3 must be positive in order for an investor to go “long” the market, and only
RSI>50 scores positive. So, investors should either exit all “long” positions or, if that is not feasible and it usually is
not, then refrain from buying any stocks until the Indicator flashes a “go long” signal.
COMMENT: The “original” Carlucci Indicator uses the S&P 100 Index, not the 500 Index.
This is a long-term Indicator and must be viewed solely in that context.
See the eResearch Disclosure below.
eResearch Disclosure
eResearch Corporation was established in 2000 as Canada's first equity issuer-sponsored research organization.
As a primary source for professional investment research, its Subscribers (subscription is free!!!) benefit by
having written research on a variety of small- and mid-cap, under-covered companies.
eResearch also provides unsponsored research reports on middle and larger-sized companies, using a
combination of fundamental and technical analysis.
eResearch complements its corporate research coverage with a diversified selection of informative, insightful,
and thought-provoking research publications from a wide variety of investment professionals.
eResearch provides its professional investment research and analysis directly to its extensive subscriber network
of discerning investors, and electronically through its website: www.eResearch.ca.
eResearch does not manage money or trade with the general public, provides full disclosure of all fee
arrangements, and adheres to the strict application of its Best Practices Guidelines.
Bob Weir, CFA
Director of Research
#####