Embed Size (px)
Citation preview
The Case for Custom TMYs: Examples Using the NSRDB
Presenter: Aron HabteManajit Sengupta, Aron Habte, and Janine FreemanNational Renewable Energy Laboratory, Golden, CO
IEEE PVSC-46th JUNE 16–21, 2019, Chicago, IL
NREL | 2
Outline
• Overview• Developing typical meteorological year (TMY)
data sets• Proposed method for developing custom TMYs• Results of custom TMY comparison • Conclusions and future work.
NREL | 3
Overview of TMYs
TMY data sets are widely used in industry for:• Building design and performance• Solar heating and cooling systems• Photovoltaic and concentrating solar power
system performance• Energy systems analysis.
NREL | 4
Overview of TMYs
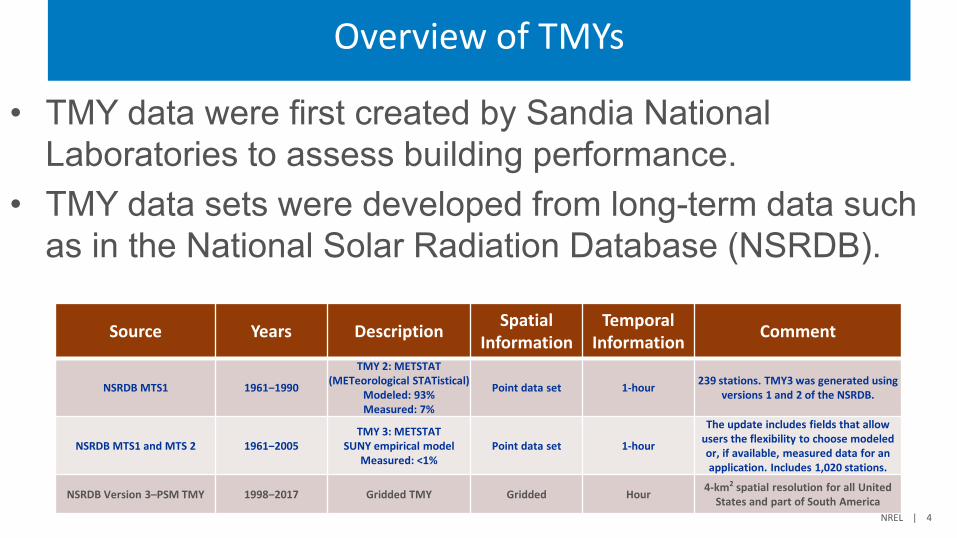
• TMY data were first created by Sandia National Laboratories to assess building performance.
• TMY data sets were developed from long-term data such as in the National Solar Radiation Database (NSRDB).
Source Years Description Spatial Information
TemporalInformation Comment
NSRDB MTS1 1961‒1990
TMY 2: METSTAT (METeorological STATistical)
Modeled: 93% Measured: 7%
Point data set 1-hour 239 stations. TMY3 was generated using versions 1 and 2 of the NSRDB.
NSRDB MTS1 and MTS 2 1961‒2005TMY 3: METSTAT
SUNY empirical modelMeasured: <1%
Point data set 1-hour
The update includes fields that allow users the flexibility to choose modeled or, if available, measured data for an application. Includes 1,020 stations.
NSRDB Version 3–PSM TMY 1998‒2017 Gridded TMY Gridded Hour 4-km2 spatial resolution for all United States and part of South America
NREL | 6
Developing TMY Data Sets
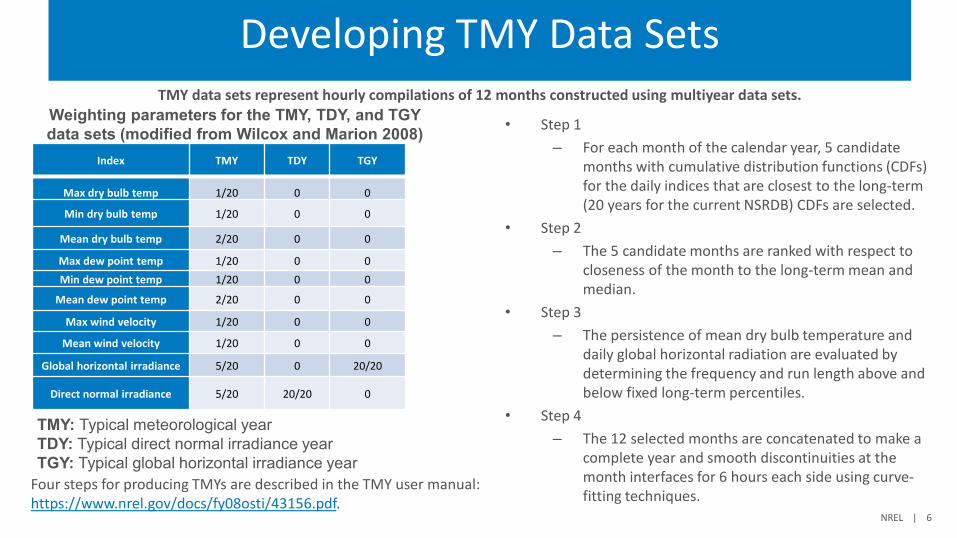
Weighting parameters for the TMY, TDY, and TGY data sets (modified from Wilcox and Marion 2008)
TMY: Typical meteorological yearTDY: Typical direct normal irradiance yearTGY: Typical global horizontal irradiance year
Index TMY TDY TGY
Max dry bulb temp 1/20 0 0
Min dry bulb temp 1/20 0 0
Mean dry bulb temp 2/20 0 0
Max dew point temp 1/20 0 0Min dew point temp 1/20 0 0
Mean dew point temp 2/20 0 0
Max wind velocity 1/20 0 0
Mean wind velocity 1/20 0 0
Global horizontal irradiance 5/20 0 20/20
Direct normal irradiance 5/20 20/20 0
TMY data sets represent hourly compilations of 12 months constructed using multiyear data sets.
Four steps for producing TMYs are described in the TMY user manual: https://www.nrel.gov/docs/fy08osti/43156.pdf.
• Step 1– For each month of the calendar year, 5 candidate
months with cumulative distribution functions (CDFs) for the daily indices that are closest to the long-term (20 years for the current NSRDB) CDFs are selected.
• Step 2– The 5 candidate months are ranked with respect to
closeness of the month to the long-term mean and median.
• Step 3– The persistence of mean dry bulb temperature and
daily global horizontal radiation are evaluated by determining the frequency and run length above and below fixed long-term percentiles.
• Step 4– The 12 selected months are concatenated to make a
complete year and smooth discontinuities at the month interfaces for 6 hours each side using curve-fitting techniques.
NREL | 7
Developing TMYs Using NSRDB Data
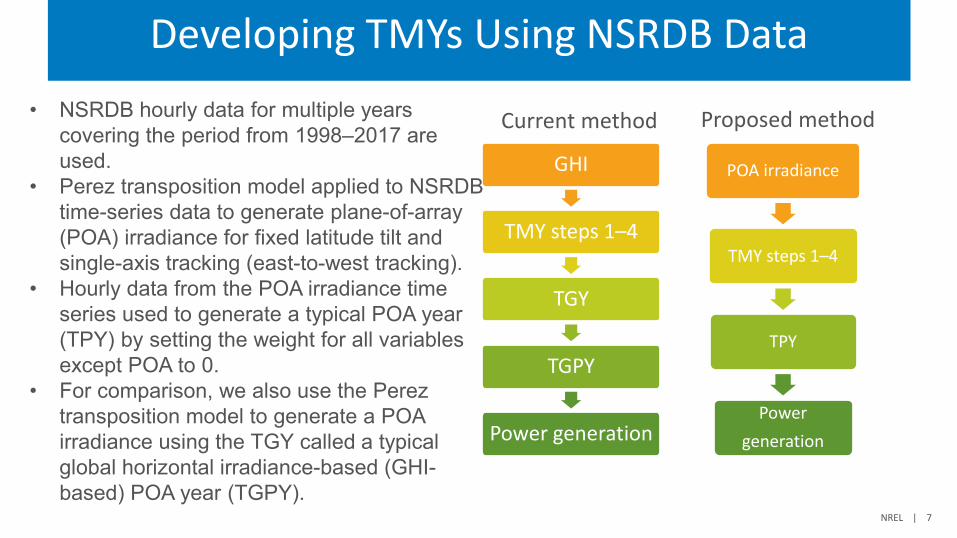
GHI
TMY steps 1–4
TGY
TGPY
Power generation
POA irradiance
TMY steps 1–4
TPY
Power generation
Current method Proposed method• NSRDB hourly data for multiple years covering the period from 1998–2017 are used.
• Perez transposition model applied to NSRDB time-series data to generate plane-of-array (POA) irradiance for fixed latitude tilt and single-axis tracking (east-to-west tracking).
• Hourly data from the POA irradiance time series used to generate a typical POA year (TPY) by setting the weight for all variables except POA to 0.
• For comparison, we also use the Perez transposition model to generate a POA irradiance using the TGY called a typical global horizontal irradiance-based (GHI-based) POA year (TGPY).
NREL | 8
Selected Locations and Comparison Method
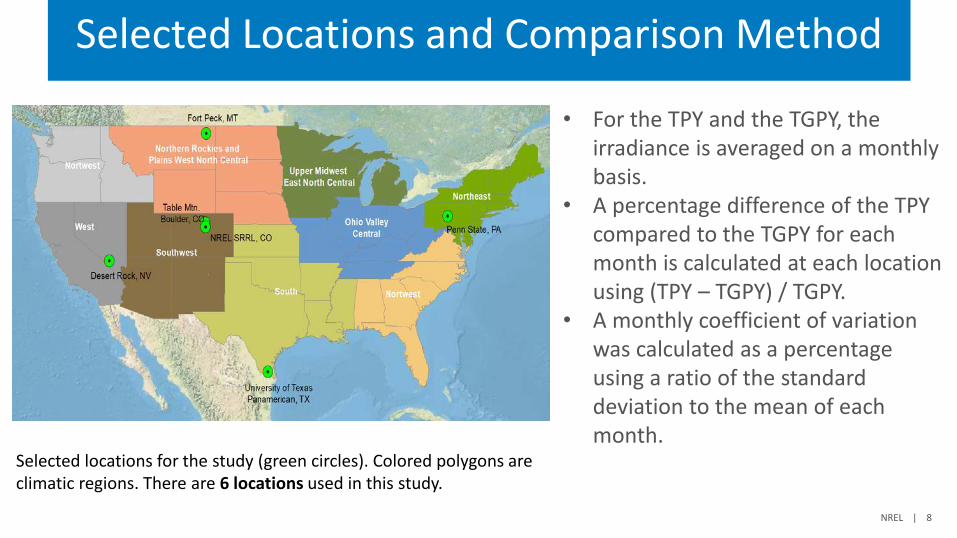
Selected locations for the study (green circles). Colored polygons are climatic regions. There are 6 locations used in this study.
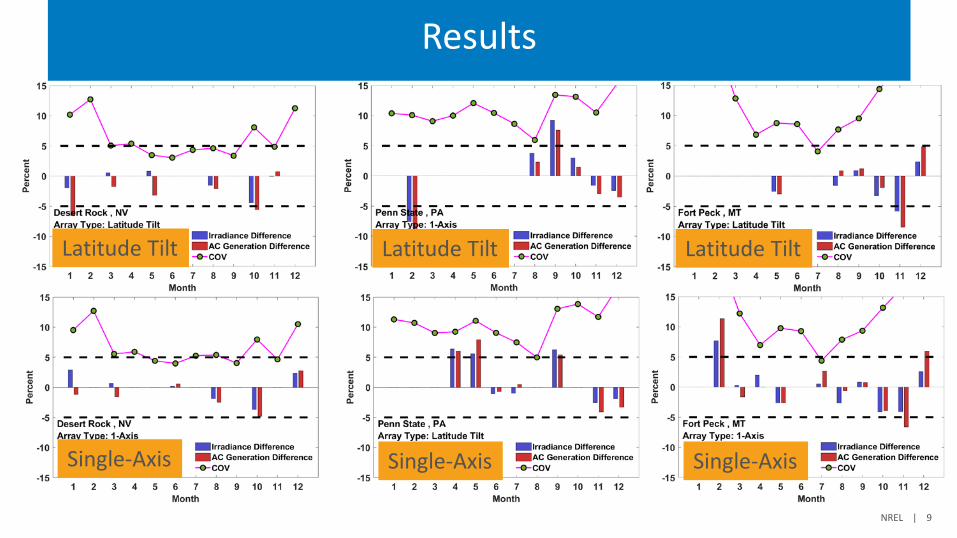
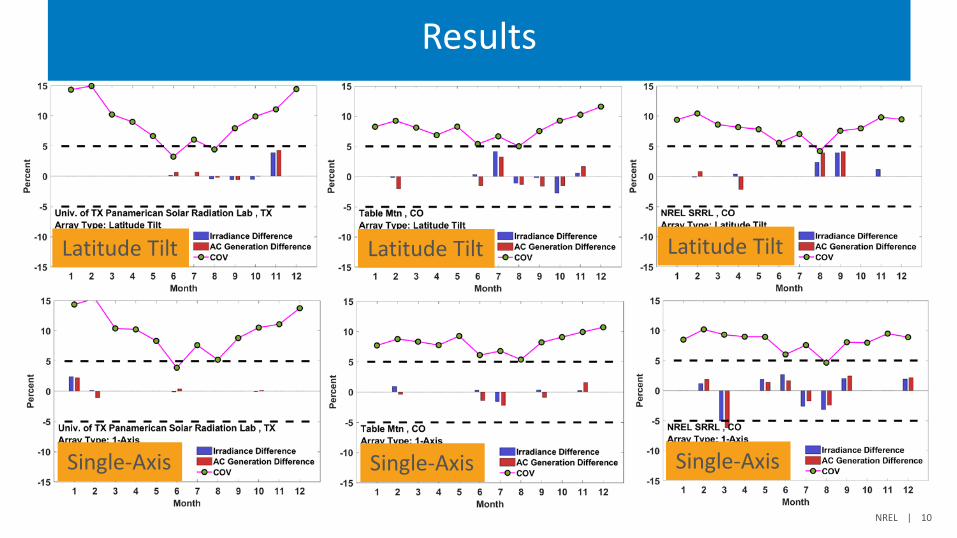
• For the TPY and the TGPY, the irradiance is averaged on a monthly basis.
• A percentage difference of the TPY compared to the TGPY for each month is calculated at each location using (TPY – TGPY) / TGPY.
• A monthly coefficient of variation was calculated as a percentage using a ratio of the standard deviation to the mean of each month.
NREL | 9
Results
Latitude Tilt Latitude Tilt Latitude Tilt
Single-Axis Single-Axis Single-Axis
NREL | 10
Results
Latitude Tilt Latitude Tilt Latitude Tilt
Single-Axis Single-Axis Single-Axis
NREL | 11
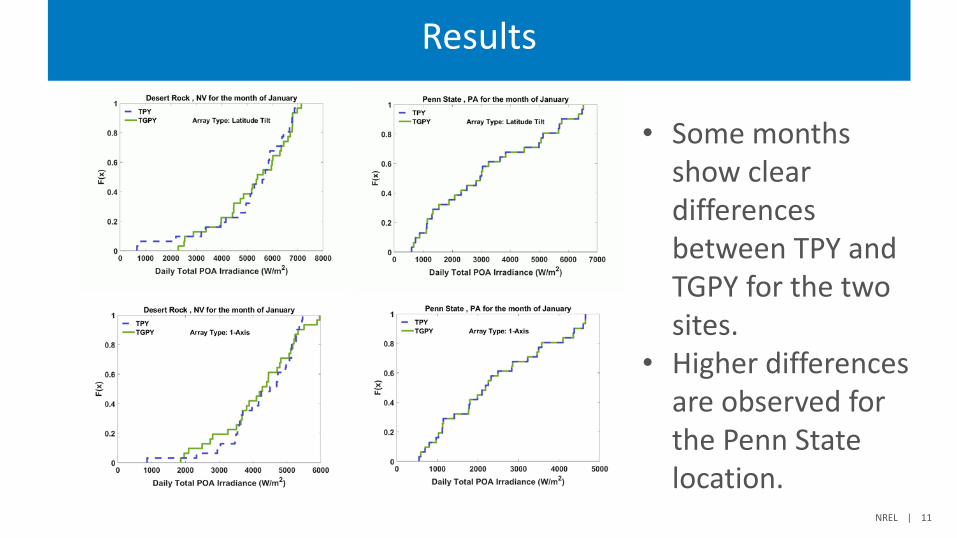
Results
• Some months show clear differences between TPY and TGPY for the two sites.
• Higher differences are observed for the Penn State location.
NREL | 12
Results
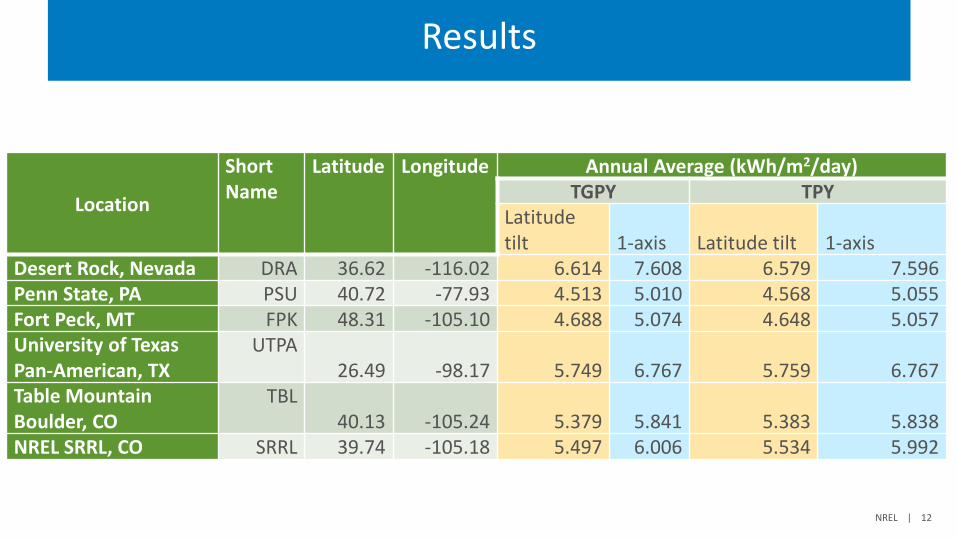
Location
Short Name
Latitude Longitude Annual Average (kWh/m2/day)TGPY TPY
Latitude tilt 1-axis Latitude tilt 1-axis
Desert Rock, Nevada DRA 36.62 -116.02 6.614 7.608 6.579 7.596Penn State, PA PSU 40.72 -77.93 4.513 5.010 4.568 5.055Fort Peck, MT FPK 48.31 -105.10 4.688 5.074 4.648 5.057University of Texas Pan-American, TX
UTPA26.49 -98.17 5.749 6.767 5.759 6.767
Table Mountain Boulder, CO
TBL40.13 -105.24 5.379 5.841 5.383 5.838
NREL SRRL, CO SRRL 39.74 -105.18 5.497 6.006 5.534 5.992
NREL | 13
Conclusions and Future Work
• Currently, the TGPY is widely used by the industry to estimate annual production, but this study demonstrated that this will lead to significant errors.
• Monthly differences between TPY and TGPY in average irradiance can range up to -8% to +9% and -9% to 11% for energy yield.
• In some cases, the two methodologies select different months from the historical time series as being most representative, implying the possibility of significant errors in potential energy yield prediction at a site.
• The Penn State and Fort Peck sites clearly demonstrate large differences in monthly irradiance and energy yield prediction if the TGPY is used instead of the TPY.
• With variable pricing of power, these differences will become more important.• Custom TMYs can provide more accurate results and could be useful to the solar energy
community.• Currently exploring the possibility of on-demand TMYs.
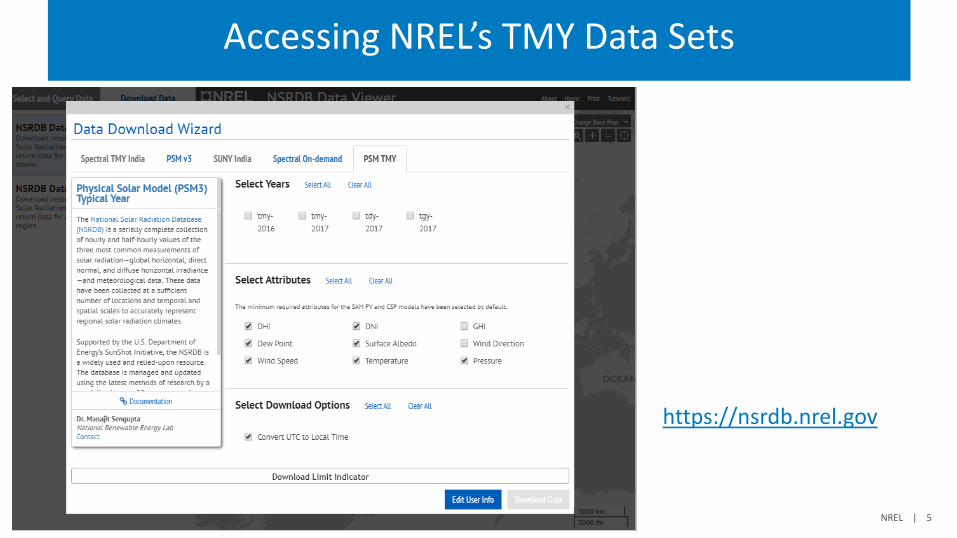
https://nsrdb.nrel.gov
This work was authored by the National Renewable Energy Laboratory, operated by Alliance for Sustainable Energy, LLC, for the U.S. Department of Energy (DOE) under Contract No. DE-AC36-08GO28308. Funding provided by U.S. Department of Energy Office of Energy Efficiency and Renewable Energy Solar Energy Technologies Office. The views expressed in the article do not necessarily represent the views of the DOE or the U.S. Government. The U.S. Government retains and the publisher, by accepting the article for publication, acknowledges that the U.S. Government retains a nonexclusive, paid-up, irrevocable, worldwide license to publish or reproduce the published form of this work, or allow others to do so, for U.S. Government purposes.
NREL/PR-5D00-74201