Embed Size (px)
Citation preview

The Case for Investing in Highway Maintenance
UKRLG Asset Management Board
Final Version for Issue; Date 09/09/2021
Produced by the UKRLG Asset Management Board to
provide evidence for DfT’s consideration. The content
within does not necessarily reflect the views of DfT.

Produced by the UKRLG Asset Management Board to provide evidence for DfT’s consideration. The content within does not necessarily reflect the views of DfT
Contents
September 2021The Case For Investing In Highway Maintenance 2
1. Background and Context
2. Investment Scenarios
3. Public Value Framework
4. Case Studies
5. References
6. Analysis

Background and context

Produced by the UKRLG Asset Management Board to provide evidence for DfT’s consideration. The content within does not necessarily reflect the views of DfT
Introduction
September 2021The Case For Investing In Highway Maintenance 4
The local road network is fundamental to life in England – both today and for our future. It is the biggest physical asset the public sector
owns, and it is valued at almost half a trillion pounds (estimated gross replacement cost of £400bn in 2012) [1].
Other transport infrastructure such as the strategic road network, the rail network, or our airport systems all play key roles in national
socio-economic activity, however, none of these are as indispensable at the local road network – virtually every journey begins and ends
on a local road, and without it, the English economy (2019 GDP of approx. £1.3 trillion) would collapse to near zero [2].
It is a huge and complex system that includes the inspection, maintenance and renewal of roads, footways, cycle routes, bridges,
tunnels, retaining walls, lighting, drainage, traffic signals, trees, land and much more – filling potholes is just the tip of the iceberg.
This pack describes the investment needed for the English local road network (excluding London), both now and in the future, along with
the significant benefits that are aligned to all Government’s core policy objectives.
Funding for local road maintenance provides good to very good return on investment, with much lower risk than major projects to
construct new infrastructure, and the ability to quickly gear up to spend money and generate benefits via “shovel ready” schemes [3].
Longer term certainty of funding will also help maximise the proven benefits provided by good quality local roads.
The local road sector has prepared a comprehensive response structured around the Public Value Framework (as developed by HMT).
This includes an overview and outline of the approach, followed by a summary of each of the four Pillars, and is further supported by
detail on each of the 13 Areas within the Public Value Framework [4][5].
This is complemented by an extensive set of case studies in the Appendix – these are examples of good practice that reflect wider
practice across the sector rather than isolated “one-offs”.
The DfT incentive fund self-assessment results provide evidence of widespread maturity within the sector and continuing improvement in
the adoption of good practices for asset management, resilience, customer focus, benchmarking, efficiency and operational delivery [6].

Produced by the UKRLG Asset Management Board to provide evidence for DfT’s consideration. The content within does not necessarily reflect the views of DfT
CarriagewaysFootways &
CyclewaysBridges Lighting points Junctions & Crossings
c. 280,000 km
10% A road
7% B Road
23% C Road
60% U Road
c. 265,000km
88% Bituminous
8% Flagged
4% Other
c. 50,000 bridges (incl. road, foot and aqueducts)
c. 5,000,00054% LED Lamps
24% Sodium Lamps
9% Mercury Lamps
8% Cosmopolis Lamps
5% HID Lamps
c. 45,00022% Pedestrian Crossings
78% Junction Signals
Service lifeA Road – c. 20 years
B Roads – c. 25 years
C Roads – c. 30 years
U Roads – c. 50 years
Drainage – c. 60 years
Service lifeBituminous – c. 30 years
Block pave – c. 40 years
Concrete – c. 60 years
Slabs – c. 40 years
Service life (years)Waterproofing – c. 20
Expansion joints – c. 20
Bearing renewal – c. 30
General repairs – c. 30
Parapet maintenance – c. 20
Drainage cleaning – c. 5
Service lifeColumn life – c. 40 years
LED Lamp – c. 20 years
Other Lamps – c. 5 years
Service lifeTraffic signs – c. 25 years
Fact Sheet – Inventory*
The Case For Investing In Highway Maintenance
* Based on information provided by DfT and Highway Authorities
** Based on England figures in State of the Nation – 2020 Streetlighting Survey
September 2021 5

Produced by the UKRLG Asset Management Board to provide evidence for DfT’s consideration. The content within does not necessarily reflect the views of DfT
Linking Investment to Benefits
The Case For Investing In Highway Maintenance
ECONOMIC RETURN [61-63]
• For every additional £1 invested, an absolute minimum
return of £2.20, with analyses identifying typical returns of up
to £9.10 at national level. Further socio-economic benefits
are estimated to provide up to a further £5+, work underway
by sector to quantify this more closely. BCRs for specific
schemes such as critical structures / bridges may reach
three figures
STRATEGIC RETURN• Levelling up – benefits spread across all English local
authorities
• Green recovery – improved management of built assets and
green estate
• Global Britain – domestic growth of sector to open up access
to trillion dollar global market
• Health & wellbeing – enabling healthy travel choices (walking,
cycling, e-scooters and public transport)
• Climate change – keeping Britain moving by making the
network resilient to severe weather
DELIVERABILITY• Sector and schemes “ready to go”, constraint is current
investment
• Mature asset management processes to ensure value and
efficiency
• Low risk than infrastructure megaprojects of similar value
• Creating and sustaining jobs & careers
September 2021 6
Build Back Better [7-9, 12, 17, 18, 32, 38, 39]
• Local, Regional, National
Economic Growth
• Sector Employment
• Financial Performance
• Future Funding Sources
• Social Value
• Public Satisfaction
Build Back Healthier [9, 13, 15, 19, 28,
37, 42, 46, 48-60]
• Active Travel
• Air Quality
• Wellbeing
• NHS and Social Care
Build Back Fairer [8, 13, 28,
40-47]
• Levelling Up
• Pride of Place
• Accessibility and
Inclusion
• Regeneration
Build Back Stronger[8, 18, 20-25 ]
• Climate Change
Adaptation
• Network Resilience
• Global Britain
Exports
Build Back Safer [7, 8, 18, 26-37]
• Road Safety
• Reduced Road User Costs
• Personal Security & Safety
• Worker Safety
Invest in
Highway
Maintenance
Build Back Greener [7-19]
• Net Zero
• Circular Economy
• Energy
• Biodiversity
• Pollution

Produced by the UKRLG Asset Management Board to provide evidence for DfT’s consideration. The content within does not necessarily reflect the views of DfT
£-
£500.00
£1,000.00
£1,500.00
£2,000.00
£2,500.00
Mill
ions
(£)
DfT Funding History for Local Roads [66-70]
Highways Maintenance Needs HMT Block Incentive Challenge Fund (competitive)
Pothole Action Fund Flood Resilience Fund Additional funding 2018/19
Historical Expenditure and Funding
September 2021The Case For Investing In Highway Maintenance
7
Highway capital (renewal) works are currently funded through a combination of central government allocation through DfT and
contributions from other sources such as local authority raised funds including borrowing, use of capital reserves and monies from
parking fines and other fees (the latter is currently approx. 50% of the total capital spend on English local road renewals).[64]
Maintenance expenditure in the past 10 years was c.£2bn per annum at present value
DfT funding for local roads in the past 10 years was c. £1bn per annum at present value, combining need-based allocations with
incentive funding, challenge funds and pothole funds
£-
£500.00
£1,000.00
£1,500.00
£2,000.00
£2,500.00
Mill
ions
(£)
Maintenance Expenditure by Road Class [65]
Major roads ('A') Minor roads ('B', 'C' and 'U')
All prices are in 2020/21 value

Produced by the UKRLG Asset Management Board to provide evidence for DfT’s consideration. The content within does not necessarily reflect the views of DfT
50% 51% 51%
66%
49%52%
40%
50%
60%
70%
2014 2015 2016 2017 2018 2019 2020 2021
Motorists Believe Local Roads are Getting
Worse [71-76]
Said local rodsare gettingworse
Linear (Saidlocal rods aregetting worse)
Impact of Historical Investment Levels – Motorists
The condition of the roads are
increasing motorist operating
costs.
Over 6 years, the RAC reports
that motorists believe that the
condition of local roads are
getting worse.
Drivers state the Road Surface
Condition is a top
priority/concern.
30%
38%
33%
42%
33%
38%
10%
14%
10%
17%
10%
14%
0%
10%
20%
30%
40%
50%
2014 2015 2016 2017 2018 2019 2020 2021
% o
f M
oto
rist
s
Priority Concerns for the Motorists [71-76]
Listed conditionas a priority
Listed conditionas the TOPpriority
Linear (Listedcondition as apriority)
Linear (Listedcondition as theTOP priority)
97%
46%
35%
34%
13%
10%
9%
3%
Road surface (e.g. potholes)
Signage visibility (obscured by trees/poor…
Amount of litter by the road
Lack of grass/folliage maintenance
Lack or (or inaccurate) signage
Street or carriageway lighting not working
Safety barriers damages or in poor condition
Other
Reasons given by drivers who feel the condition of
local roads has worsened[76]
September 2021The Case For Investing In Highway Maintenance 8
0
300
600
900
1200
1500
2013 2016 2018 2019 2020 2021
Mill
ions
(£)
Total cost of repairs for all GB drivers by
year [33]

Produced by the UKRLG Asset Management Board to provide evidence for DfT’s consideration. The content within does not necessarily reflect the views of DfT
Impact of Historical Investment Levels – Road condition
September 2021The Case For Investing In Highway Maintenance 9
DfT data indicates a decline in maintenance undertaken across the local road
network, with the Minor Roads taking the biggest hit.
DfT data highlights the reduction of Strengthening works, with local
authorities adopting short-termer term fixes to spread their budget across the
aging asset.
Recent ALARM surveys indicates circa. 1% (2,800km) of the local road
network degrades into poor condition per year
0.0
5.0
10.0
15.0
% o
f R
oad
Netw
ork
Major Road Receiving Maintenance
Treatments[19]
Strengthening Resurfacing Surface dressing
Total Linear (Total)
0.0
4.0
8.0
12.0
% o
f R
oad
Netw
ork
Minor Road Receiving Maintenance
Treatments[19]
Strengthening Resurfacing Surface dressing
Total Linear (Total)
0
10
20
30
40
50
0
20
40
60
80
100
2016 2017 2018 2019 2020 2021
% N
etw
ork
in p
oo
r co
nditio
n (
requir
ing
Stru
ctura
l m
ainte
nan
ce)
% N
etw
ork
in g
oo
d o
r ad
equat
e
conditio
n
Reported Structural Road Condition[66,78]
Good and adequate condition Poor condition
Good and adequate condition trend Poor condition trend

Produced by the UKRLG Asset Management Board to provide evidence for DfT’s consideration. The content within does not necessarily reflect the views of DfT
Impact of Historical Investment Levels – Structures condition
September 2021The Case For Investing In Highway Maintenance 10
Highway Structures cover a range of different sub-assets; the most visible are Bridges, but there are other structures such as tunnels, culverts, retaining walls, High Mast Lighting and Sign Gantries.
Structures are vital for connecting communities across bodies of water, through or along the side of a mountain; failures in structures can be catastrophic in impacting local communities, such as the Northside bridge (Workington, Cumbria) collapse[85] or retaining wall failure such as A62 Huddersfield Road junction causing a 12-mile diversion for six months [86].
National surveys such as RAC indicates a decline in the condition of the bridge stock, which is mirrored in the Suffolk CC Bridge Condition data.
0.0%
0.5%
1.0%
1.5%
2.0%
2.5%
3.0%
3.5%
4.0%
4.5%
5.0%
0
500
1,000
1,500
2,000
2,500
3,000
3,500
4,000
2014/15 2015/16 2016/17 2017/18 2018/19 2019/20
% o
f su
bst
andar
d b
ridge
s
Num
ber
of su
bst
andar
d b
ridge
s
Substandard Bridges in GB[79-83]
Number of substandard bridges % of substandard bridges
Suffolk CC Bridge Condition Trends[84]

Produced by the UKRLG Asset Management Board to provide evidence for DfT’s consideration. The content within does not necessarily reflect the views of DfT
Impact of Historical Investment Levels – Cyclists
September 2021The Case For Investing In Highway Maintenance 11
Nearly one in three (31%) older adults (aged 65+) are prevented from walking more or at all on their local streets because of cracked
and uneven pavements, equating to over 3.5million people in the UK. The new research found that half of older adults (48%) would
walk more if their pavements were well-maintained [46].
National statistics indicates a declining trend in motorist KSI’s due to safety improvement in vehicles, the same trend has not been
observed with cyclists due to the increase in cyclist traffic and the decline in road condition.
Cyclists satisfaction vs.
importance of most common
defects in cycleways[87]
17 18
30 31
45 44
39
56
46
64
0
10
20
30
40
50
60
70
2004 2006 2008 2010 2012 2014 2016 2018
Num
ber
of K
SI
Reported Cyclist KSI in GB where defective
road surface was reported as contributory
factor[88]

Produced by the UKRLG Asset Management Board to provide evidence for DfT’s consideration. The content within does not necessarily reflect the views of DfT
Impact of Climate Change and Network Resilience
September 2021The Case For Investing In Highway Maintenance 12
Retaining walls in Derbyshire required major
interventions due to increased flow levels of
rivers, causing closure of the A6/A38 junction,
leading to 22km diversion costing the local
economy c.£90,000 per day [105].
In 2021, the Met Office issued an amber extreme
heat warning as temperatures soared to 32.2C in
some parts of England, with roads melting as the
asphalt surface absorbed heat and reached
50°C [106].
Drought conditions in Cambridgeshire and
Peterborough impacted on soil conditions
leading to carriageway damage, that without
major maintenance will lead to network
restrictions/ closures or incur unsustainable
additional costs >£0.5 million per annum on
short term repairs [110].
Consequence to Local Roads
In 2009, the Cumbria floods resulted in £100s of
millions of damage, including the loss of 20 road
bridges and long-term disruption for local
communities [102].
On average, damage due to surface water
flooding exceeds £300 million every year, and
Defra estimates this could increase by approx.
40% by 2050 if current management approaches
continue [103].
Direct impacts to local road networks lead to
cascading failures and long-lasting effects on
society such as damage to other infrastructure
such as energy and communications, economic
impacts of delays and diversions, disruption to
schools and isolation of communities [104].
Climate change impacts on the local network include pressure on drainage and risk of flooding, scour damage to bridges and risk of
collapse, and damage to road surfaces and other asset types via extreme heat, cold and wet conditions [101].

Produced by the UKRLG Asset Management Board to provide evidence for DfT’s consideration. The content within does not necessarily reflect the views of DfT
Impact of Climate Change and Network Resilience
September 2021The Case For Investing In Highway Maintenance 13
The Transport Resilience Review recommended that Local Highway Authorities identify a 'resilient
network' to which they will give priority, in order to maintain economic activity and access to key
services during extreme weather, and that DfT, MHCLG, ORR and HMT should ensure that funding
decisions are informed by asset management plans and do not unduly restrict maintenance [107].
The HIRAM decision support tool (case study C9) enables local highways teams to identify locations
most at risk from severe weather across the network and estimate the economic and social costs of
disruption if no preventative action was taken (£m / £bn impacts if that risk was realised) [108].
Preventative maintenance schemes have demonstrated very high returns and value for money, e.g.,
work in Norfolk to upgrade key drainage infrastructure to address long standing flooding issues across a
wide residential and economic growth area provided a BCR of 6.6 [92].
Industry groups such as the Midlands Highway Alliance have developed guidance for local authorities inadapting to climate change, which includes selection of materials, and maintenance of drainage assets,bridges / other structures, and green infrastructure /soft estate [109].
Proactive Mitigation

Produced by the UKRLG Asset Management Board to provide evidence for DfT’s consideration. The content within does not necessarily reflect the views of DfT
Incentive Fund and Self-assessment Scores
September 2021The Case For Investing In Highway Maintenance 14
Each local highway authority in England (excluding London) completes a self-
assessment questionnaire, to establish the share of the Incentive fund they will be
eligible for.
Each authority will score themselves against 22 questions and place themselves into
one of 3 Bands based on the available evidence. Assurance of the self-assessment
process is provided by validation of returns by Section 151 officers.
The incentive funding awarded to each local highway authority will be based on their
score in this questionnaire and will be relative to the amount received through the
needs-based funding formula.
The self-assessment bands are based on the maturity of the authority in key areas,
which are described in each question. The levels of maturity are described below:
Band 1 – Basic understanding of key areas and in the process of taking it forward.
Band 2 – Can demonstrate that outputs have been produced that support the
implementation of key areas that will lead towards improvement.
Band 3 – Can demonstrate that outcomes have been achieved in key areas as
part of a continuous improvement process.
The results demonstrate significant improvement in maturity across virtually all
English Local Highway Authorities. This provides confidence in the efficiency of their
management of local roads within current financial constraints and reinforces that
additional investment will be allocated effectively to provide strong value for
money.
24
4 5 1
89
72
2721
22
39
83
94
112
0
20
40
60
80
100
120
2016/17 2017/18 2018/19 2019/20 2020/21
Number of English LAs in each Band [89]
Band 1 Band 2 Band 3
1
1.5
2
2.5
3
30
40
50
60
70
2016/17 2017/18 2018/19 2019/20 2020/21
Average Band and Score in England [89]
Average Band Average Score

Investment Scenarios

Produced by the UKRLG Asset Management Board to provide evidence for DfT’s consideration. The content within does not necessarily reflect the views of DfT
Investment Scenarios
Summary of Impacts and Benefits
The Case For Investing In Highway Maintenance September 2021 16
Investment Scenario
DfT
funding
required
(pa)
Other
funding*
(pa)
Description
1. Decline: Investment
levels remain at 2021/22
levels
£1.125 bn £0.6 bn
▪ Backlog – unsustainable and growing by c.£375m per annum
▪ Network condition will decline, will be evident through bridge
restrictions, flooding, more footway and carriageway defects;
and a reactive management strategy
2. Managed decline:
Investment below required
level to maintain the current
levels of service
£1.3 bn £0.6 bn
▪ Backlog – unsustainable and growing by c.£200m per annum
▪ Network condition will slowly decline leading to a reactive
management strategy
3. Maintain: Investment
required to maintain a basic
highway service
£1.5 bn £0.6 bn
▪ Backlog – holding at current level and prevents increase
▪ Condition generally remains as is (B, C and Unclassified roads
in poor condition), large backlog of bridge and structure works,
and substandard drainage
4. Gradual improvement:
Start to address backlog
and gradually improve
network
£1.7 bn £0.6 bn
▪ Backlog – reduce by c.£200m per annum, backlog removed in
20yr
▪ Address risks and start to move to a planned/proactive
management strategy
5. Accelerated
improvement: Accelerate
backlog reduction and
condition improvement
£1.9 bn £0.6 bn
▪ Backlog – reduce by c.£400m per annum, backlog removed in
10yr
▪ Evident improvement to all asset condition and network
performance
Time (0 to 20 years)
Leve
l of se
rvic
e
Scenario 5
Scenario 4
Scenario 3
Scenario 1
Improved
Maintained
Diminished
Enhanced
Scenario 2
English local roads backlog – in 2019, the backlog
was estimated to be between £6bn and £9bn
(UKRLG Asset Management Board ‘State of the
Nation’ report). Since 2019, it is anticipated that the
backlog has increased by c. £1 billion due to
subsequent investment levels, inflation, deterioration
and short-term funding strategies. Increase in backlog
based on ‘Annual Need’ Calculations (see Appendix)
* Assumption: this funding will be sustained under all scenarios
Current status – slow deterioration for now, however
this will accelerate in future years if current levels of
underinvestment are not addressed imminently.

Produced by the UKRLG Asset Management Board to provide evidence for DfT’s consideration. The content within does not necessarily reflect the views of DfT
Investment Scenarios
Summary of Impacts and Benefits
The Case For Investing In Highway Maintenance
Build Back Scenario 1 Scenario 2 Scenario 3 Scenario 4 Scenario 5
Better
Healthier
Fairer
Safer
Stronger
Greener
Contribution of the local road network towards national Government
Policy objectives and socio-economic growth
September 2021 17
▪ Improved contribution to UK Government’s ‘Build Back’ Objectives
▪ Adequate and acceptable service that is focused on safety, resilience and reliability,
with risks being managed through mixture of planned and reactive works
▪ A broadly acceptable customer experience; reducing complaints and claims
▪ Increased level of investment in resources, to provide greater capability and
capacity
▪ Maintained contribution to UK Government’s ‘Build Back’ Objectives
▪ The service risks are managed through robust and defensible practices
▪ Reduced service resilience and reliability, with a focus on assets that support the
economy such as carriageways and structures; less funding for assets such as
footways, cycleways and street lighting
▪ Lower levels of customer satisfaction with limited focus on customer priorities
▪ Diminished contribution to UK Government’s ‘Build Back’ Objectives
▪ Significant unplanned service impacts and low level of network resilience
▪ Low levels of safety and customer satisfaction, causing increased injuries and
claims
▪ Building a large renewals debt/backlog that will take years (5, 10 or more) to
address
▪ Loss of experienced people and increase in the skills gap across the industry
▪ Enhanced contribution to UK Government’s ‘Build Back’ Objectives
▪ A good/high-quality service that delivers parity across the regions
▪ High levels of safety, network service, sustainability and customer satisfaction
▪ Increased level of investment in people and equipment across the sector,
supporting the development and adoption of innovations for future network usage,
such as mass modal shifts to active travel, electric vehicles and Connected /
Autonomous Vehicles
Produced by the UKRLG Asset Management Board to provide evidence for DfT’s consideration. The content within does not necessarily reflect the views of DfT
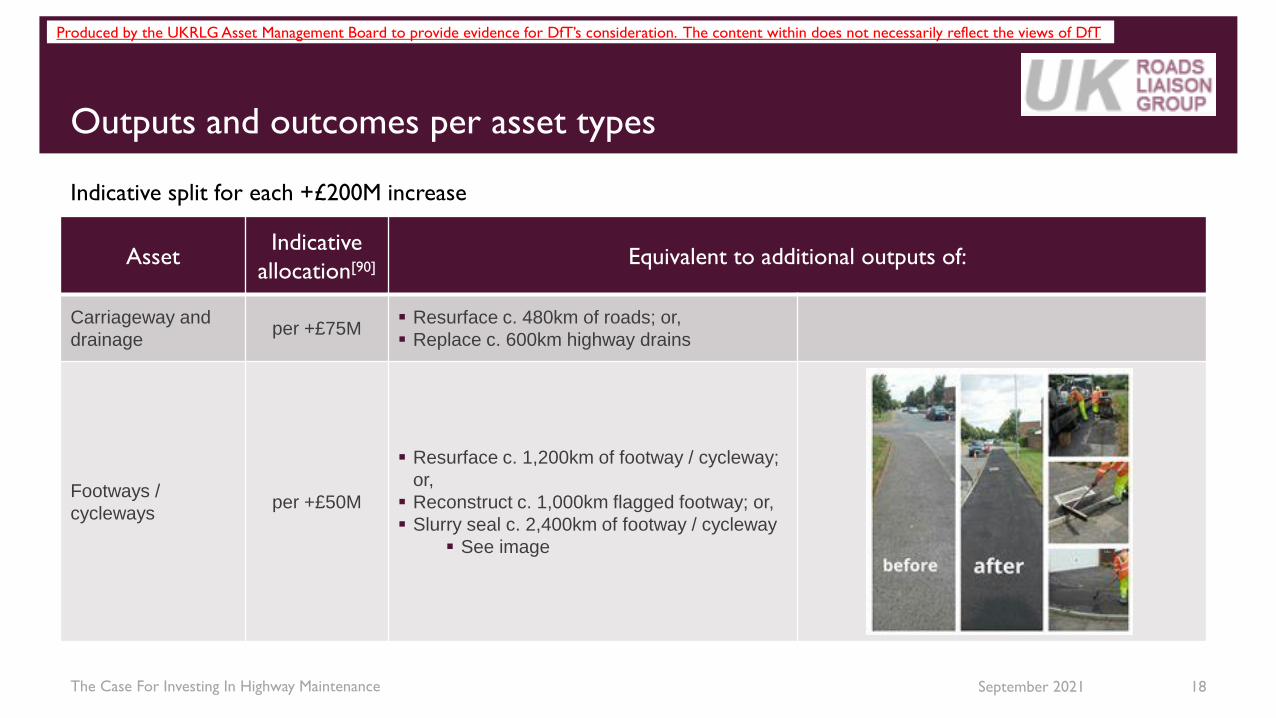
Outputs and outcomes per asset types
September 2021The Case For Investing In Highway Maintenance 18
AssetIndicative
allocation[90]Equivalent to additional outputs of:
Carriageway and
drainageper +£75M
▪ Resurface c. 480km of roads; or,
▪ Replace c. 600km highway drains
Footways /
cyclewaysper +£50M
▪ Resurface c. 1,200km of footway / cycleway;
or,
▪ Reconstruct c. 1,000km flagged footway; or,
▪ Slurry seal c. 2,400km of footway / cycleway
▪ See image
Indicative split for each +£200M increase

Produced by the UKRLG Asset Management Board to provide evidence for DfT’s consideration. The content within does not necessarily reflect the views of DfT
Outputs and outcomes per asset types (continued)
September 2021The Case For Investing In Highway Maintenance 19
AssetIndicative
allocation[90]Equivalent to additional outputs of:
Structures per +£50M
▪ Build c. 160 new single span vehicle bridges;
or,
▪ Replace c. 270km of 2m high retaining wall.
A7 Longtown, Cumbria – collapsed Retaining Wall
Lighting/ ITS per +£25M
▪ Replace and LED c. 10,600 units; or,
▪ Convert c. 500 Pedestrian crossings into
Toucan crossings; or,
▪ Replace c. 250 traffic signal junctions
Indicative split for each +£200M increase

Produced by the UKRLG Asset Management Board to provide evidence for DfT’s consideration. The content within does not necessarily reflect the views of DfT
Outputs and outcomes per asset types (continued)
September 2021The Case For Investing In Highway Maintenance 20
AssetIndicative
allocation[90] What do we get (output) Example
Carriageway
and drainageper +£75M
▪ Reduction in Potholes
▪ Reduction in Injuries/Claims
▪ Reduction in CO2
▪ Quieter Road Surface
▪ Improved Safety
▪ Reduce reactive maintenance
▪ Improved Drainage
▪ Improved Road Markings
▪ Improve Aesthetics
▪ Reduction in Backlog
▪ Improve network resilience
▪ Improved coordination of works
▪ West Midlands: £45m invested in
carriageways with BCR of 6.51 [91]
▪ Norfolk: £10m invested in drainage with
BCR of 6.6 [92]
Footway/
cyclewaysper +£50M
▪ Improved condition
▪ Improved Aesthetics
▪ Reduction in Backlog
▪ Reduction in Injuries/Claims
▪ Commons Library Briefing estimates
BCR of active travel investment of
5.62[13]
Structures per +£50M
▪ Reduction in unexpected structural
failures
▪ Reduction in Backlog
▪ Reduction in diversions and journey
times
▪ Reduction in Restrictions
▪ Portsmouth: £12m invested in bridge
replacement with BCR of 114 [93]
Lighting/ ITS per +£25M
▪ Reduction in unexpected structural
failures
▪ Increase EV Charging Infrastructure
▪ Increase Active Travel Infrastructure
▪ Improved safety and security
▪ Increase in LED’s / Reduction in
OpEX and CO2
▪ Connected Intelligent Traffic Systems
(ITS)
▪ Lancashire: £20m invested in LED street
lighting with BCR of 4.91 [94]
Indicative split for each +£200M increase

Produced by the UKRLG Asset Management Board to provide evidence for DfT’s consideration. The content within does not necessarily reflect the views of DfT
Benefit of Local Road Maintenance – Potential socio-economic
contributions
September 2021The Case For Investing In Highway Maintenance 21
Improved maintenance of the local road network will create benefits across the following themes, to be determined
by level of investment and targeting of maintenance interventions:
Reduction in current costs associated with claims – £12.5m [66, 78]
Reduction in congestion costing UK £7.9bn in 2019 [9]
Reduction in damage to vehicles, annual estimates ranging from £1.25bn [95] to £4.09bn [53]
Reduction in costs associated with physical inactivity of £7.4bn per annum [42]
Reduction in annual costs to society of transport-induced poor air quality, ill health and road accidents of £40bn, and traffic
accidents costing around £9bn [53]
Reduction in cost of health impact of air quality associated with transport of £4.5bn to £10.6bn at 2009 prices = £5.6bn to £13.3bn
today [55]
Minimise impacts of severe weather that have cost up to £280m per day of disruption [24]
Reduction in absenteeism costs to business of £5bn per annum due to physical inactivity [58]
Reduction in NHS costs of £17bn over 20 years due to active travel replacing short motor vehicles, plus potentially additional £2bn
per annum due to reduced obesity levels [59]
Reduction in costs to SMEs in wasted staff time, fuel costs, vehicle repair costs and production of £5bn per annum [32]
Generate savings of £6.8bn in electricity costs over 25 years from £755m investment in LED upgrades [96]
Potential share of $900bn global market in highway maintenance [20]

Produced by the UKRLG Asset Management Board to provide evidence for DfT’s consideration. The content within does not necessarily reflect the views of DfT
Short term increase in funding supports
improvement but does not sustain private
sector investment in the Sector.
Gains are positive but limited compared to
potential benefits
Increased capital investment and longer-
term settlement provides virtuous circle,
maximizing benefits of asset management,
creating economies of scale and
encouraging investment in people, skills,
technology.
Long term certainty of “bad news” allows
the sector to cut cloth accordingly and
make limited investments to slow down
increase in disbenefits over time
Short term funding below steady state
involves significant impacts and risks
Local roads fail to support key government
policy targets and has broader socio-
economic disbenefits for all
Investment Certainty [97-100]
The Case For Investing In Highway Maintenance September 2021 22
Short-term Long-term
+B
enefits
+D
isbenefits

Public Value Framework

Produced by the UKRLG Asset Management Board to provide evidence for DfT’s consideration. The content within does not necessarily reflect the views of DfT
Pillar 1: Pursuing Goals – Summary
September 2021The Case For Investing In Highway Maintenance 24
Local roads make up 98% of the network and are used in almost every journey. The local road network is estimated to be worth £400
billion – of the UK’s most valuable public assets.
Well-maintained local roads allow for faster and more reliable journeys, boosting local businesses and serving all road users. High
quality local roads are also central to the future of transport, playing an important role in the take-up of autonomous vehicles and
greener forms of transport such as cycling and buses. If we are to meet the aims of the National Infrastructure Strategy and deliver in
a way that is fairer, faster and greener, then we must invest in the condition of our local roads.
Local roads are the arteries that truly unite our countries they are the ties that bind communities together. If we are to unleash the full
productive power of every corner of England and bring hope and opportunity for each part of the UK, then we must ensure that the life
blood of our economy is ‘pumping’ through these veins.
For decades, local roads have been the poor relation, underinvestment has led to a decline in the underlying condition of all
components of the asset, a plague of potholes, and widespread public dissatisfaction. Over the last decade the Department for
Transport (DfT) working with Local Highway Authorities (LHAs) has focused on embedding the efficient and effective highway asset
management practices that have helped arrest the rate of decline and ensured that every pound invested in the condition of our Local
Roads can generate maximum return for the economy. The highway sector now has the tools to deliver well, but it is clear decades of
neglect cannot be halted through efficiency alone, substantial and sustained investment is required to halt the decline and stabilise the
overall health of our nation’s infrastructure, all of which depends on our Local Roads.
Case Studies C1, C2, C3, C4, C5

Produced by the UKRLG Asset Management Board to provide evidence for DfT’s consideration. The content within does not necessarily reflect the views of DfT
The local road sector has universally adopted asset management as a means to
delivering highway maintenance to the best possible effect within financial constraints.
Line of sight is provided from high levels objectives through to operational activities,
and a data-led process supports decision making and financial planning.
National level analysis has been undertaken by the UK Roads Liaison Group and DfT,
as part of the State of the Nation work that has informed this overall submission.
Local level analysis is done through Asset Management Strategies and Lifecycle
Plans, based around local levels of service, scrutiny of members and engagement
with stakeholders.
Funding is currently uncertain from year to year, with multiple streams that are not
ringfenced. As such, highways teams use asst management principles to make the
case and optimising spend that is allocated.
Benchmarking across local highway authorities is common via regional groups,
industry organisations and peer reviews. Value for money is also promoted via
competitive tendering for contractors to deliver highway maintenance services, and
the promotion of innovation across the sector.
Managing risk is at the heart of asset management, and authorities generally adopt
the UKRLG Code of Practice (Well-managed Highway Infrastructure), which promotes
the use of a risk-based approach to managing local road networks.
Pillar 2: Managing Inputs – Summary
The Case For Investing In Highway Maintenance September 2021 25
Case Studies C6, C7, C8, C9, C10, C11, C12, C13, C14
OPERATIONAL: Implementation
of works programmes, contract
delivery and performance
management
TACTICAL: Using data and
knowledge combined with the right
systems and tolls to make informed
decisions
STRATEGIC: Creation of Asset
Management Policy and adaptation of
Asset Management framework to
manage the highway assets

Produced by the UKRLG Asset Management Board to provide evidence for DfT’s consideration. The content within does not necessarily reflect the views of DfT
Pillar 2: Managing Inputs
September 2021The Case For Investing In Highway Maintenance 26
The right intervention at the right time = enhanced value for money and improved service
Lev
el of se
rvic
e
Good
Managed
Action Required
Unacceptable
40% drop in
quality
Time
75% of life
Maintenance Reconstruction/
Rehabilitation
40% drop in
quality
12% of life
Every £1 spent in
renovation here
Will cost
£4 here

Produced by the UKRLG Asset Management Board to provide evidence for DfT’s consideration. The content within does not necessarily reflect the views of DfT
Pillar 3: User and Citizen Engagement – Summary
September 2021The Case For Investing In Highway Maintenance 27
The National Highway and Transport Public Satisfaction Survey (NHT Survey) collects the public's views on different aspects of
Highway and Transport in local authority areas annually. Local highway authorities are using insights from the NHT Survey to inform
their asset management strategies.
The Public value better quality roads; and they appear to value roads in their locality most. Consequently, The Public value
interventions on the road network in their locality, they value seeing improvements to "their" roads.
Demographic factors and car ownership also impact expected satisfaction with highways, car dependency increases the level of
dissatisfaction with the condition of roads. The Public value local roads highly and the taxpayer will welcome substantial investment in
their local roads. Such investment will enhance public satisfaction.
Potholes are most visible issue, but all aspects of network have potential impacts on users and their lives
The NHT Survey informs the link between user and client experience and better outcomes, DfT has worked with the highway sector to
establish a comprehensive performance management framework (PMF). Using a framework is fundamental to support the
implementation of an asset management strategy and can be used to measure performance and continuous improvement in general.
Value for money for the taxpayer is linked through a measurement hierarchy to allow aggregation of performance at any level and an
overall assessment of performance at each level and all is underpinned by a standard set of national measures across the nine main
components of the asset that form our Local Roads: Carriageways, Footways, Cycleways, Rights of Way, Drainage, Green
Infrastructures, ITS Infrastructures, Street lighting and Structures.
Plans to improve participation and drive change through understanding the user experience well are being encouraged through the
DfT's incentive fund and a well-developed network of best practice improvement groups and highway alliances. The highway sector
can deliver but can only do so if given the resources to do so.
Case Studies C14, C15, C16, C17, C18, C19, C20, C21, C22, C23

Produced by the UKRLG Asset Management Board to provide evidence for DfT’s consideration. The content within does not necessarily reflect the views of DfT
Pillar 4: System Capacity – Summary
August 2021The Case For Investing In Highway Maintenance 28
Case Studies C24, C25, C26, C27, C28, C29, C30, C31, C32, C33, C34, C35, C36, C37, C38, C39
The highways supply chain is well established and used to reacting to large and short notice changes to work
programmes as a result of national and local changes in budget allocations. Although this has become almost
customary, it nevertheless results in inefficiencies and certainty of funding over a medium to longer period would allow
both local authorities and the supply chain to realise the full efficiencies of planning capacity in terms of their
procurement and operations, economies of scale and well-trained clients, supervisors and operatives.
Well-established, skilled and professional industry combining public and private sector – wide ranging supply chain, including SMEs
Supported by regional / national groups, professional institutions, and engagement with stakeholders throughout BAU
Collaborative behaviours / sharing of good practice and innovation, benchmarking as previous
Contracting models for delivery
Ongoing development of staff and leadership, competence frameworks
Significant growth potential (jobs, technology) if certainty of funding is provided, sustainable over long term
Can ramp up and spend investment wisely, quickly, nationally and at lower risk than megaprojects

The 13 areas to consider under the
Public Value Framework

Produced by the UKRLG Asset Management Board to provide evidence for DfT’s consideration. The content within does not necessarily reflect the views of DfT
Pillar 1: Pursuing Goals
September 2021The Case For Investing In Highway Maintenance 30
The vision for local roads across England – ‘Delivering value, prosperity and a heathier society through
highway maintenance’
Desired outcome – ‘A safe, cost effective and well maintained highway network that supports economic
growth, social mobility, healthy travel choices and a shift to greener lower carbon materials and solutions’
Investing in local highways will deliver benefits for other sectors within each LA
Through good and cost effective maintenance, LAs aim to maximise the contribution they make to the local and
national economies, health and wellbeing, and the environment.
DfT and LAs working together using established, monitor the value of their highways assets and aim to invest enough
to maintain those assets at the same value
Interdependencies with virtually all other big gov policies
Constraints via level and certainty of investment, capacity and capability within sector (linked to previous)
1. Understanding vision and goals
Produced by the UKRLG Asset Management Board to provide evidence for DfT’s consideration. The content within does not necessarily reflect the views of DfT
Pillar 1: Pursuing Goals
September 2021The Case For Investing In Highway Maintenance 31
Our objectives, and those of each LAs, are aligned with national guidance, strategies and commitments.
National guidance developed through improvement and update of existing material with gov policy and lessons
learnt, plus extensive collaboration within and outside DfT / LA (e.g., professional institutions, user groups etc.)
We know what we should we doing, but LAs simply don’t have enough budget so they end up just focusing on filling
potholes and not delivering other benefits and services to their communities
Long term budgets (5-10yr) will allow LAs to coordinate with other government initiatives (e.g., broadband rollout via
utilities, weight of EVs, charging infrastructure) that often have an impact on the condition of highways assets. This
will allow for more efficient AM and increased value for UK PLC across virtually all public and private activity.
2. Degree of ambition

Produced by the UKRLG Asset Management Board to provide evidence for DfT’s consideration. The content within does not necessarily reflect the views of DfT
Pillar 1: Pursuing Goals
September 2021The Case For Investing In Highway Maintenance 32
Asset management strategies and plans are reviewed regularly to ensure senior ‘buy-in’ and scrutiny of approach
There are processes in place to review and monitor the delivery of AM objectives
Standard reporting from LAs to DfT and government
Encouraging and facilitating AM processes to gather asset data.
We want to manage and monitor other assets (not just carriageways) but we need comparable data across asset
types to do be able to do so.
3. Implementing planning and monitoring progress

Produced by the UKRLG Asset Management Board to provide evidence for DfT’s consideration. The content within does not necessarily reflect the views of DfT
Pillar 2: Managing Inputs
September 2021The Case For Investing In Highway Maintenance 33
Local highway authorities have implemented asset management strategies for many years, linking the use of resources to the delivery objectives. These provide line of sight from Government policy, through the Department for Transport, to local authorities and then ultimately supply chain.
Asset management strategies and plans are reviewed on a regular basis to ensure senior ‘buy-in’ and scrutiny of approach, with continual improvement and refinement. Management information is regularly provided to senior leadership to provide scrutiny and sign-off of asset management plans, using a combination of high-level information with more granular data available where necessary.
Highway professionals have been facing historic and recent challenges well, however there is a limit to how much can be achieved with current resources. Major challenges relate to increasing demand on the network, increasing levels of customer expectation, increasing levels of maintenance backlog and increasing pressure on maintenance funding.
There are processes in place to review the management of resources driven by the approach of the incentive fund, with local highway authorities demonstrating significant progress over recent years and now operating in a mature state.
It is also critical that highways maintenance practitioners communicate with internal stakeholders across services, to align with needs / activities across different highway departments and public service.
4. Managing financial resources
Net
Pre
sent V
alue (
NPV
) (£
)
Planning Period (years)15 20 30
Maintenance
Strategy B
Maintenance
Strategy A
Maintenance
Strategy CSelect
Maintenance
Strategy CSelect
Maintenance
Strategy ASelect
Maintenance
Strategy B

Produced by the UKRLG Asset Management Board to provide evidence for DfT’s consideration. The content within does not necessarily reflect the views of DfT
Pillar 2: Managing Inputs
The Case For Investing In Highway Maintenance
Local highway authorities received a mixture of funding from DfT, MHCLG and
other sources. However, government policy is that this funding is not
ringfenced, so authorities allocate this across services as per local requirements
/ local decisions. Some variability is experienced due to different levels of local
taxation across authorities.
Highways teams display strong competence in making the case for funding
allocations and then optimising the expenditure of what is allocated (as this is
currently well under the required levels of investment for maintaining the full
asset portfolio).
Within authorities, there is accountability and clear audit trails of how budgets
are spent and what was achieved, via sign off by finance officers plus
commercial arrangements with supply chain in the delivery of highway
maintenance services.
All local highway authorities undertake lifecycle planning, which utilises
scenarios to forecast required levels of investment to achieve a certain level of
performance or to understand the impact on performance of constrained
budgets. This is commonly used to inform senior decision makers when making
the case internally for funding, and also as a basis for external funding bids.
Value for money is ensured by using asset management principles to provide a
clear link between spend / input and delivering the objectives.
5. Quality of data and forecasts
September 2021 34
Select Asset Group
Scenario Analysis
Maintenance Budget
Maintenance Strategy
Lifecycle Plan
Investment Strategy
Costs
Hierarchy
Asset Group
Current Condition
Performance Targets
Treatment Options
Service Life/
Deterioration Profile

Produced by the UKRLG Asset Management Board to provide evidence for DfT’s consideration. The content within does not necessarily reflect the views of DfT
Pillar 2: Managing Inputs
The Case For Investing In Highway Maintenance
Benchmarking has been adopted by the highways sector as a means of improving efficiency and performance, and
this has been reinforced by its inclusion as a requirement in the self-assessment questionnaire for the DfT incentive
fund.
A range of methods exist, ranging from specialist organisations such as CQC, and APSE, to peer reviews, though to
internal reviews providing scrutiny by members and sharing business intelligence within authorities.
Knowledge sharing is active, via industry bodies such as the Road Surface Treatment Association (RSTA),
collaboration groups such as the Local Council Roads Innovation Group (LCRIG) and professional institutions such
as the Chartered Institution for Highways and Transportation (CIHT) or Institute of Highways Engineers
(IHE). These networks are used to share lessons learned and good practices.
As part of the asset management process, historical trends are routinely monitored to understand and project future
pressures on costs. Competitive tendering and commercial / technical innovation is used to ensure that the
expenditure of public funds provides the best value possible.
6. Benchmarking and cost control
September 2021 35

Produced by the UKRLG Asset Management Board to provide evidence for DfT’s consideration. The content within does not necessarily reflect the views of DfT
Pillar 2: Managing Inputs
The Case For Investing In Highway Maintenance
Highways professionals within local highway authorities are well aware of the negative impacts of deferring maintenance spend, which
include but are not limited to:
Reduced value for money and increased spend required over the long term (ref scenario modelling).
Reduced levels of service and progress towards Government targets, including safety, active travel, carbon etc. (ref benefits).
Impacts on the private individuals and businesses in terms of vehicle damage, delays etc. (ref user group reports).
Impacts on the wider public sector such as increased social care and health care costs (ref NICE).
Studies that demonstrate that for every £1 cut on local roads, there is a wider economic cost of £1.67. (ref TRL study).
There are direct impacts on the local road network that may also stem from other Government initiatives e.g., the £5bn broadband
rollout plus the large-scale installation of EV chargers will involve interventions on the carriageway and footway networks, which, it not
properly managed / scheduled, may cause significant deterioration. For EV chargers, depending on the commercial arrangement
used, this may also increase future maintenance liabilities.
Managing risk is a fundamental of part of asset management, with risks to assets and service constantly being identified and
mitigated. The sector delivers extremely effectively with the budgets available, but it is not currently possible to mitigate every risk with
the budgets available. As such, authorities apply a risk-based approach to miminise impact and focus on areas of investment that will
provide greatest benefits (ref CoP).
7. Cost shifting
September 2021 36

Produced by the UKRLG Asset Management Board to provide evidence for DfT’s consideration. The content within does not necessarily reflect the views of DfT
Pillar 3: User and Citizen Engagement
September 2021The Case For Investing In Highway Maintenance 37
The National Highway and Transport Public Satisfaction Survey (NHT Survey) collects the public's views on different
aspects of Highway and Transport in local authority areas annually. The survey started in 2008 and over its lifetime
140 authorities have participated in total, surveys have been sent to over 4.8 million households, with over 1 million
responses. In the past year 109 Authorities took part, surveys were sent to 404,094 households, 95,704 responses
were received, an average response rate of 23.8%
8. Public and taxpayer legitimacy

Produced by the UKRLG Asset Management Board to provide evidence for DfT’s consideration. The content within does not necessarily reflect the views of DfT
Pillar 3: User and Citizen Engagement
September 2021The Case For Investing In Highway Maintenance 38
The NHT Survey informs the link between user and client experience and better outcomes, The DfT has worked with
the highway sector to establish a comprehensive performance management framework (PMF). Using a framework is
fundamental to support the implementation of an asset management strategy and can be used to measure
performance and continuous improvement in general. Value for money for the taxpayer is linked through a
measurement hierarchy to allow aggregation of performance at any level and an overall assessment of performance
at each level and all is underpinned by a standard set of national measures across the nine main components of the
asset that form our Local Roads: Carriageways, Footways, Cycleways, Rights of Way, Drainage, Green
Infrastructures, ITS Infrastructures, Street lighting and Structures.
Consequently, the impact of investment in any one asset group is linked through the PMF to the vision we held for all
local road users. Further, LHA case studies evidence that this link between user participation and improved
outcomes is robust. Plans to improve participation and drive change through understanding the user experience well
are being encouraged through the DfT's incentive fund and a well-developed network of best practice improvement
groups and highway alliances. The highway sector can deliver but can only do so if given the resources to do so.
9. User and client experience and participation

Produced by the UKRLG Asset Management Board to provide evidence for DfT’s consideration. The content within does not necessarily reflect the views of DfT
Pillar 4: Developing System Capacity
August 2021The Case For Investing In Highway Maintenance 39
The DfT Self-assessment incentive fund process and improvements over the past 5-6 years can be used to demonstrate this as can
the value of ‘best value’ working groups including the Local Council Roads Innovation Group (LCRIG), Midlands Highways Alliance+
(MHA+) and other regional groups and alliances. Sharing best practice and procurement through alliance frameworks and more
importantly the efficiencies these have brought can be demonstrated through their annual reports etc. Procurement guidance and
policy notes could be cited and efficiencies from local authority reports where they have formal partnership contracts, particularly over
longer periods.
To show the responsiveness and resilience of the supply chain, examples of delivery of challenge fund schemes within tight deadlines
could be used, along with examples from adverse weather events. Investment in improved and innovative plant and machinery along
with development and reviews of standards can be used for evidence.
Local authority partnership success reporting, the National Highways and transportation survey trend reporting and CQC reports can
also be used to demonstrate effective consistent commercial delivery throughout the organisation.
The awareness of new technology requirements, its development and deployment to improve outcomes should be demonstrated with
ADEPT live lab examples, the past and future programmes of conferences and exhibitions and the LCRIG Infrastructure Innovations
Board (IIB).
10. Capacity to manage the delivery chain

Produced by the UKRLG Asset Management Board to provide evidence for DfT’s consideration. The content within does not necessarily reflect the views of DfT
Pillar 4: Developing System Capacity
August 2021The Case For Investing In Highway Maintenance 40
Examples of Skills gap analysis, planning and implementation of apprenticeships and supported professional training
e.g., EngTech, IEng, CEng, NVQ, HNC, BSc, MSC can be evidenced along with LHA business continuity plans,
examples of partnership working with universities and colleges to show they are running the required courses and
closing the skills gap.
Competency frameworks and accreditations e.g., the Asset Management Competency Framework and Highway
Inspector Competency Framework, along with the National Highway Sector Scheme 13 Silver Certificate
requirements can be demonstrated.
Leadership capability development can be shown with LA Skills gap analysis, investment in professional
qualifications and other training e.g., MBA. Local authority succession plans, year on year professionally qualified
leaders reports and recruiting from the private sector.
11. Workforce capacity

Produced by the UKRLG Asset Management Board to provide evidence for DfT’s consideration. The content within does not necessarily reflect the views of DfT
Pillar 4: Developing System Capacity
August 2021The Case For Investing In Highway Maintenance 41
To demonstrate how well the public body understands the position of its key interest or stakeholder groups, it is necessary to show the
link with Ministers and local authority elected members. Involvement in and attendance at sector conferences and exhibitions. Working
with sector groups / Associations such as the Road Surface Treatments Association (RSTA), membership of their asset management
group and their membership of the UK / ADEPT Asset Management Board, the Asphalt Industry Alliance (AIA) and the Mineral
Products Association (MPA). The RAC Foundation, Automobile Association and Transport Focus. Use of published reports and
feedback.
Evidence of what the public body is doing to improve the support from key interest groups for the policy or programme could be
provided by referring to consultation and involvement with key reviews and policy development e.g., the Self-assessment incentivised
funding review, the development of the Well managed highways Infrastructure Code of Practice, Transport Asset Management
Guidance and the CIPFA Transport Infrastructure Assets Code of Practice (Valuation).
Local authority ‘best value’ national and regional groups operate throughout the country, with the LCRIG being the best national
example and the Midlands Highway Alliance Plus (MHA+) a regional example. These groups are made up of local highway authority
professional engineers and supply chain members, working together to help all local authorities achieve desired outcomes and
improvements in their highway asset management. They develop and review guidance documents and other industry papers to
ensure knowledge and best practice is shared and implemented throughout the authorities.
13. Stakeholder management

Produced by the UKRLG Asset Management Board to provide evidence for DfT’s consideration. The content within does not necessarily reflect the views of DfT
Pillar 4: Developing System Capacity
September 2021The Case For Investing In Highway Maintenance 42
The DfT Self-assessment incentive fund process and improvements over the past 5-6 years can be used to demonstrate this as can the value of ‘best value’ working groups including the Local Council Roads Innovation Group (LCRIG), Midlands Highways Alliance+(MHA+) and other regional groups and alliances. Sharing best practice and procurement through alliance frameworks and more importantly the efficiencies these have brought can be demonstrated through their annual reports etc. Procurement guidance and policy notes could be cited and efficiencies from local authority reports where they have formal partnership contracts, particularly over longer periods.
To show the responsiveness and resilience of the supply chain, examples of delivery of challenge fund schemes within tight deadlines could be used, along with examples from adverse weather events. Investment in improved and innovative plant and machinery along with development and reviews of standards can be used for evidence.
Local authority partnership success reporting, the National Highways and transportation survey trend reporting and CQC reports can also be used to demonstrate effective consistent commercial delivery throughout the organisation.
The awareness of new technology requirements, their development and deployment to improve outcomes should be demonstrated with ADEPT live lab examples, the past and future programmes of conferences and exhibitions and the LCRIG Infrastructure Innovations Board (IIB).
A more robust and consistent forward commitment to investment in highway maintenance would support contractors in developing a more resilient supply chain and investing in innovation.
10. Capacity to manage the delivery chain
Public Value Framework
Case Studies

Produced by the UKRLG Asset Management Board to provide evidence for DfT’s consideration. The content within does not necessarily reflect the views of DfT
C1 Strategic Alignment & Long-term Benefits of AMSelf assessment/challenge fund alignment: Incentive Fund SAQ Q1
Local Authority/Organisation: Hertfordshire Council
Why
▪ ‘Best Value’ review in 1999 showed residents wanted a better
service
▪ Members were keen to offer improvements
▪ Funding was limited, so a ‘step change’ was required
▪ International expertise drew in global good practice
▪ Delivering change takes time and commitment
▪ Hertfordshire published UK’s first highway AM plan in
2001
Hertfordshire AM Policy and Strategy
What and how
▪ Engaging elected Members & senior decision makers was key
▪ Tools developed* to optimise value, give Members real options
and set out likely consequences of choices
▪ Long term strategies were agreed and linked to budgets
▪ Members felt engaged and empowered and have continued to
support the strategy
▪ Policy developed in 2012 to support good Asset Management
▪ Policy, strategy and plan regularly reviewed
▪ Annual updates** proved to members to show progress and
engage them, as community leaders, on future direction(*see case study 11 **see case study 42)
Benefits and outcomes
▪ Programmes, strategies & budgets have remained reasonably
stable, even during financial challenges; this has enabled:
▪ Better advance planning and coordination, further improving
outcomes and value for money
▪ Created confidence in forecasts by delivering on commitments
▪ Road condition maintained or improved in line with agreed
targets
▪ Number of reactive pothole repairs has gone down as focus on
preventative maintenance bears fruit
Supports
Build Back:
Healthier
Fairer
Safer
Stronger
Greener
Better
Road
condition
improved
Pothole
numbers
down
Produced by the UKRLG Asset Management Board to provide evidence for DfT’s consideration. The content within does not necessarily reflect the views of DfT
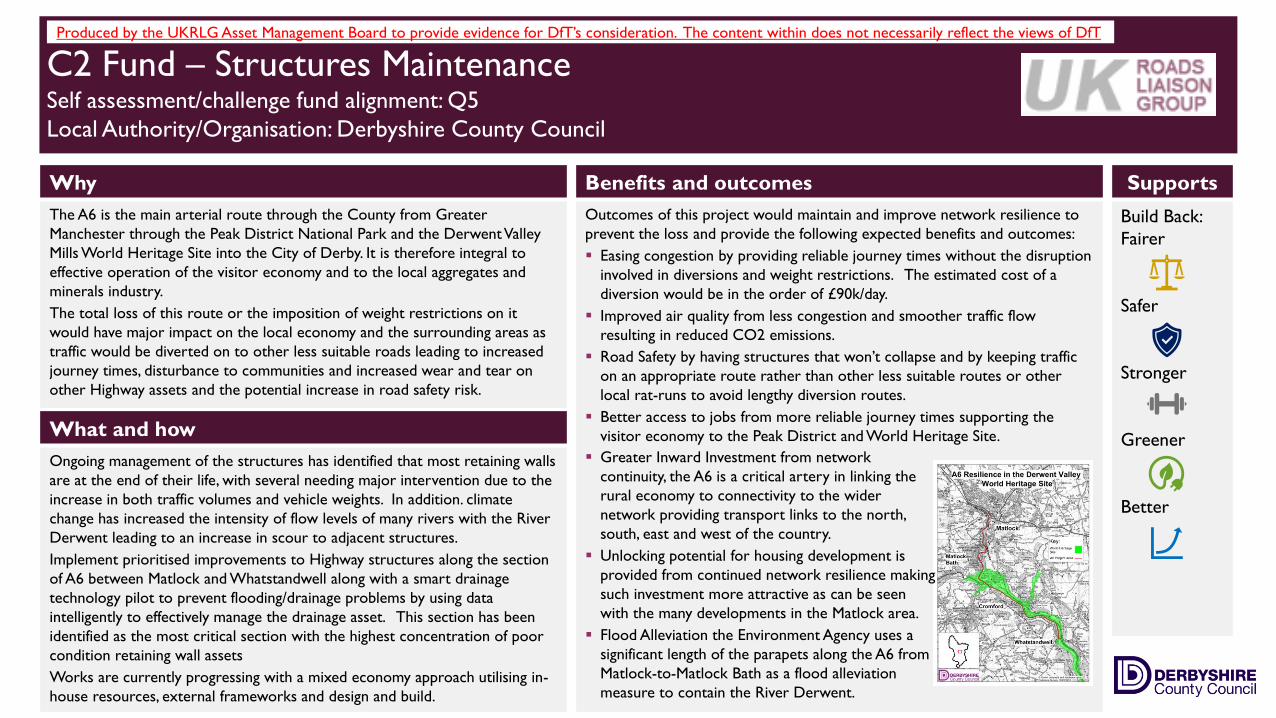
C2 Fund – Structures MaintenanceSelf assessment/challenge fund alignment: Q5
Local Authority/Organisation: Derbyshire County Council
Why
The A6 is the main arterial route through the County from Greater
Manchester through the Peak District National Park and the Derwent Valley
Mills World Heritage Site into the City of Derby. It is therefore integral to
effective operation of the visitor economy and to the local aggregates and
minerals industry.
The total loss of this route or the imposition of weight restrictions on it
would have major impact on the local economy and the surrounding areas as
traffic would be diverted on to other less suitable roads leading to increased
journey times, disturbance to communities and increased wear and tear on
other Highway assets and the potential increase in road safety risk.
What and how
Ongoing management of the structures has identified that most retaining walls
are at the end of their life, with several needing major intervention due to the
increase in both traffic volumes and vehicle weights. In addition. climate
change has increased the intensity of flow levels of many rivers with the River
Derwent leading to an increase in scour to adjacent structures.
Implement prioritised improvements to Highway structures along the section
of A6 between Matlock and Whatstandwell along with a smart drainage
technology pilot to prevent flooding/drainage problems by using data
intelligently to effectively manage the drainage asset. This section has been
identified as the most critical section with the highest concentration of poor
condition retaining wall assets
Works are currently progressing with a mixed economy approach utilising in-
house resources, external frameworks and design and build.
Benefits and outcomes
Outcomes of this project would maintain and improve network resilience to
prevent the loss and provide the following expected benefits and outcomes:
▪ Easing congestion by providing reliable journey times without the disruption
involved in diversions and weight restrictions. The estimated cost of a
diversion would be in the order of £90k/day.
▪ Improved air quality from less congestion and smoother traffic flow
resulting in reduced CO2 emissions.
▪ Road Safety by having structures that won’t collapse and by keeping traffic
on an appropriate route rather than other less suitable routes or other
local rat-runs to avoid lengthy diversion routes.
▪ Better access to jobs from more reliable journey times supporting the
visitor economy to the Peak District and World Heritage Site.
Supports
Build Back:
Fairer
Safer
Stronger
Greener
Better
▪ Greater Inward Investment from network
continuity, the A6 is a critical artery in linking the
rural economy to connectivity to the wider
network providing transport links to the north,
south, east and west of the country.
▪ Unlocking potential for housing development is
provided from continued network resilience making
such investment more attractive as can be seen
with the many developments in the Matlock area.
▪ Flood Alleviation the Environment Agency uses a
significant length of the parapets along the A6 from
Matlock-to-Matlock Bath as a flood alleviation
measure to contain the River Derwent.

Produced by the UKRLG Asset Management Board to provide evidence for DfT’s consideration. The content within does not necessarily reflect the views of DfT
C3 HMAT – Quantifying Economic ImpactSelf assessment/challenge fund alignment: Q5 and Q8
Local Authority/Organisation: Herefordshire Council
Why
▪ Quantify the economic impact of investment in the condition of
the Local Road network in Herefordshire;
▪ Provide Herefordshire Council with quantitative analysis to
demonstrate to stakeholders the impacts of applying different
maintenance budgets to the network of road they manage; and
▪ As a consequence, secure the investment in works that would
secure these benefits over the 30-year analysis period.
Comparing Investment Scenarios
What and how
Using local data representative of the road network in this county
the Transport Research Laboratory (TRL), Herefordshire Council
and their provider Partner, Balfour Beatty Living Places modelled
four investment scenarios (baseline £1.6m p.a. on carriageways,
+£10m, over two years, +£10m adjusted rates, +£10m adjusted
rates and profile).
The HMAT model was used. HMAT was developed by TRL on
behalf of the DfT. The model predicts the quantifiable impacts of
levels of road maintenance, and thus demonstrates how the
condition of the local road network evolves over time under
different spending trajectories and how this impacts both
maintenance and costs to road users and society.
Benefits and outcomes
This analysis demonstrated that an additional investment in road
maintenance has significant benefits throughout the analysis period.
Across all the modelled scenarios compared to the base scenario,
for every additional £1 spent on maintenance it led to a saving (or
benefit) of over £8!
Supports
Build Back
Safer
Stronger
Better

Produced by the UKRLG Asset Management Board to provide evidence for DfT’s consideration. The content within does not necessarily reflect the views of DfT
C4 Challenge Fund BidSelf assessment/challenge fund alignment: Q5 and Q9
Local Authority/Organisation: Herefordshire Council
Why
▪ Economic growth through the maintenance of routes to
Herefordshire’s Enterprise Zone.
▪ These cross-county routes connect Hereford via the A465 to
South-Wales; the A438 to Mid-Wales; and A4103 to
Worcestershire and onto the West Midlands.
▪ The Enterprise Zone and all routes are Midlands Connect
Strategic Economic Hubs and Corridors.
Maintain Links Between Enterprise and Markets
What and how
▪ Improvements secured through 25.5 miles of carriageway
resurfacing and 13.4 miles of surface dressing works in 2017/18.
▪ Benefits realised through route specific lifecycle planning to
reduce the whole life cost.
▪ Herefordshire committed £3m to support growth and efficiency
from its own capital programme along with £5m by DfT through
the Local Highways Maintenance Challenge Fund.
Benefits and outcomes
Benefits to the nation’s economy £146.6 Million as a consequence
of 38.9 miles of key routes being put into good condition
throughout.
Supports
Build Back:
Safer
Stronger
Greener
Better

Produced by the UKRLG Asset Management Board to provide evidence for DfT’s consideration. The content within does not necessarily reflect the views of DfT
C5 Value for Money AssessmentsSelf assessment/challenge fund alignment: Q15 and Q16
Local Authority/Organisation: ADEPT – FHRG
Why
Value for money (VfM) assessments are undertaken as a benchmarking
assessment of the performance of highways authorities that are
members of the Future Highways research Group (FHRG). The FHRG
consists of a round 36 English highway authorities with the aim of
developing and sharing best practice in the sector.
What and how
FHRG members include authorities with directly delivered services; a
contracted integrated provider; separate, contracted, design and
construction providers; or mixed economy services (including alliances).
Each VfM assessment considers performance in five dimensions briefly
summarised below:
▪ Economy – scale of funding/financial management/income generation
▪ Efficiency – productivity/service resilience/flexibility
Benefits and outcomes
As economy scores decline, efficiency initiatives seek to do more with
less. An increase in efficiency drives a small, short-term improvement in
effectiveness. These effectiveness gains are quickly undermined by short-
term, cost-driven decisions. The consequences of these decisions result
in a significant and rapid decline in services resilience, agility and in
effectiveness.
Stakeholders (citizens and members) typically experience a small
improvement in services performance, probably based on the visibility of
increased activity on the network combined with a greater focus on
short-term measures (patching and surface dressing). These positive
perceptions are rapidly superseded by experiences of failed repairs and
poor-quality surfaces.
Early efficiency improvements are not sufficient (in delivering cashable
benefits) to compensate for reduced budgets, short-term interventions
and a growing works backlog. Efficiency scores rapidly decline. Strategic
performance scores decline with economy scores. Major business
improvement initiatives and flagship programmes are typically postponed
or cancelled as budgets are reduced. Some spikes in strategic
performance (as in AP5) can be attributed to additional, ringfenced
funding for services innovation (as in Live Labs). Political stakeholders
become increasingly frustrated with the network condition and
highways services and often intervene to try to improve services
funding in an effort to improve public satisfaction.
Supports
Build Back:
Fairer
Safer
Stronger
Better
▪ Effectiveness – performance
of services/asset condition
▪ Strategic Value – alignment
and scale of contribution to
strategic drivers
▪ Stakeholder Value – public/
executive/members/ national
agencies/ ’neighbours’

Produced by the UKRLG Asset Management Board to provide evidence for DfT’s consideration. The content within does not necessarily reflect the views of DfT
C6 Asset Management Strategies and EfficienciesSelf assessment/challenge fund alignment: Q1 and Q6
Local Authority/Organisation: Kent County Council
Why
The incentive fund requires us to have an Asset Management Policy and
Strategy in place and for senior decision makers to be consulted and
involved in developing our approach to asset management.
Over the initial 3 years of the incentive fund, as we developed and
embedded good asset management practice across our organisation, we
adopted and published three successive strategy documents.
In late 2020, we reviewed the existing strategy documents and
concluded that they should all be updated to reflect our now well
established approach to asset management.
Asset Management Strategy Review Process
What and how
We thoroughly reviewed our Asset Management Policy and Strategy,
combining the three documents into one Highways Asset Management
Plan (HAMP).
This included a strategic analysis of our asset management approach and
a detailed breakdown of how we will manage different asset groups over
the coming 5 years.
Senior decision makers were consulted and able to influence the
strategy during its development and then members were then able to
formally review and adopt it through a cabinet committee and the key
decision process.
Benefits and outcomes
The process of consultation and then review/adoption has clearly shown
members and other senior decision makers the value of good asset
management practice.
It has also shown them how the condition of our road assets and the
size of our maintenance backlog is likely to change in response to the
decisions they are making, especially around funding levels.
This process of regular strategy reviews is critical to ensure decision
makers are properly informed about the choices they are making and
that the information they are given is current.
This review process/cycle is shown above.
Senior decision makers set
funding and service levels
The result is reflected in
measured asset condition
Current condition is used
to model future condition
based on likely scenarios
Current and modelled
future condition informs
senior decision makers
Supports
Build Back:
Fairer
Safer
Stronger
Greener
Better

Produced by the UKRLG Asset Management Board to provide evidence for DfT’s consideration. The content within does not necessarily reflect the views of DfT
C7 Lifecycle Planning for Roads & the Value of AMSelf assessment/challenge fund alignment: Incentive Fund SAQ Q5
Local Authority/Organisation: Hertfordshire Council
Why
For Hertfordshire, like most authorities, carriageways are a very
valuable asset group
▪ GRC/Spend
▪ Value to users (all modes, not just cars)
Preventative maintenance extends the life of road surfaces
▪ Usually cheaper so lower cost than renewal
▪ Less material and transport involved = Lower carbon footprint
Better service at lower cost!
BUT needs to be planned ahead - ‘right treatment, right time’
Lifecycle planning supports this and allows benefits to be unlocked
Hertfordshire Lifecycle Planning
What and how
▪ Regular condition surveys to ensure robust data
▪ Use of innovative model to predict future performance and help
optimise programmes
▪ Focus on best long term outcomes for customers (better
condition, fewer defects)
▪ Experienced team of engineers in service to validate, challenge
and refine schemes and deliver them as countywide programmes
to maximise efficiency
Benefits and outcomes
▪ Range of maintenance strategies considered for all roads
▪ Lifecycle planning helps identify those that offer best benefits
▪ Optimised programmes mean schemes offering greatest long
term benefits for customers are chosen
▪ Preventative maintenance opportunities are not missed
▪ Fully optimised approach delivers value for money
▪ Same LoS based fixing assets when they fail would cost 50%
more
▪ Hertfordshire has been able to afford to maintain its
roads more easily
‘Right treatment,
right time’ can
reduce costs and
improve average
condition
Supports
Build Back:
Safer
Greener
Better

Produced by the UKRLG Asset Management Board to provide evidence for DfT’s consideration. The content within does not necessarily reflect the views of DfT
C8 Structures Asset Valuation and Investment (SAVI) toolSelf assessment/challenge fund alignment: Q5
Local Authority/Organisation: Hertfordshire Council, ADEPT, Bridges Board
The Case For Investing In Highway Maintenance
Why
The Structures Asset Valuation and Investment (SAVI) tool allows
bridge managers to:
▪ Make informed decisions on maintenance prioritisation
▪ Calculate stock value in accordance with CIPFA guidance
▪ Understand long-term funding needs and risk profile
Condition data is readily available but what was needed were
processes for prioritisation of maintenance works based on cost
and risk.
Improving safety, reducing risk
Optimisation of spend against risk
What and how
SAVI was developed through collaboration between UK Bridges
Board, ADEPT and Hertfordshire County Council with UKRLG
research funding. It builds on earlier work on the Structures Asset
Management and Planning (SAMPT) tool.
The tool is made freely available through the OGL licence. It is
anticipated that Asset Management software providers will adopt
the methodology.
Further work will allow carbon calculation alongside cost
information
Benefits and outcomes
▪ Wise investment - informed decision making
▪ Safer roads - reduced risk to road users from problems with
structures
▪ Improved long-term forward planning
Supports
Build Back:
Safer
Better
Greener

Produced by the UKRLG Asset Management Board to provide evidence for DfT’s consideration. The content within does not necessarily reflect the views of DfT
C9 Highways Resilience Toolkit (HIRAM)Self assessment/challenge fund alignment: Q9 and Q11
Local Authority/Organisation: Dorset Council
Why
Member authorities of the South West Highways Alliance (SWHA)
identified a need to develop a toolkit to help them respond to
changing demands arising from the effects of climate change.
Highway authorities wanted the ability to manage resilient sites and
report on high risk areas to focus on future maintenance.
The intention was that such a toolkit would help inform and
support the case for increased future funding (Challenge Fund).
The toolkit was intended to be managed within the SWHA, but
made available to other highway authorities in the UK
HIRAM Resilience Toolkit
What and how
The toolkit was built through collaboration within the south west
authorities and WPM, to build the software / toolkit, which
included a number of workshops.
This project evolved into a resilience toolkit, enabling authorities
to record and evaluate network resilience issues linked to roads,
drainage, landslips, vulnerable bridges etc.
Possible resilience sites would be recorded by highways community
teams / Inspectors, asset group leads, Flood Risk Management
colleagues, operational workforce (e.g., gully emptying crews)
Benefits and outcomes
▪ The toolkit is used to evaluate priority resilience sites, to inform
programmes of work, or priority schemes for bidding (e.g., to the
DfT Challenge Fund).
▪ Evaluates sites based on Total resilient risk, Economic risk, Local
Community Risk, Community Risk, Carbon risk, Value for money
schemes (cost vs benefit)
▪ HIRAM formed the basis of South Gloucestershire and Bristol
City Council’s successful Challenge Fund bid.
LOCAL AUTHORITY MAJOR SCHEME DECISIONS (southglos.gov.uk)
Supports
Build Back:
Fairer
Safer
Stronger
Greener
Better

Produced by the UKRLG Asset Management Board to provide evidence for DfT’s consideration. The content within does not necessarily reflect the views of DfT
C10 Pavement Asset Data ManagementSelf assessment/challenge fund alignment: Q4, Q5 and Q6
Local Authority/Organisation: Kent County Council
Why
We were using an older pavement asset data system supplied by an
external provider. It met the minimum requirements of such a system its
functionality was compared to some other solutions.
With the natural end of the contract with this provider the opportunity
was taken to review this service and a new provider was commissioned.
They provide a more advanced data management system.
With the implementation of this new system,(Horizons) significant time
had to be spent upskilling users, bringing data into the system and
developing the asset lifecycle models.
Heat Map - Condition on Classified Roads
What and how
We were able to bring our existing asset data into the system to display
it in clear manner. This allows users to easily access data on our
network, its condition and past/future works.
The powerful modelling tools allow us to analyse how our pavement
assets deteriorate and how we should treat them to renew and
preserve them.
We have been able to use these models to predict the future condition
of our assets with different funding scenarios and maintenance
strategies.
These are shared with senior decision makers to inform them about the
condition of our network. We are able to show them he consequences
of the choices they make and influence their decisions.
Benefits and outcomes
Robust modelling, combined with regular engagement with senior
decision makers has allowed us to build their confidence in the data we
present.
Effective presentation has allowed us to better inform decision makers
by demonstrating clear and concise information that is tailored to their
skill and knowledge level.
An example of this data presentation is the heat map shown above
which clearly shows area of poor condition.
Through this we have been able to ensure senior decision makers fully
understand the funding and condition challenges our highway network is
facing, and secure additional funding and investment.
Supports
Build Back:
Fairer
Safer
Stronger
Greener
Better

Produced by the UKRLG Asset Management Board to provide evidence for DfT’s consideration. The content within does not necessarily reflect the views of DfT
What and how
CIPFA’s Highways and Transportation Actuals Statistics Dashboard
for England and Wales will provide an array of interactive tools,
detailing authorities’ estimated revenue and capital expenditure.
Users will be able to access information regarding the cost of
routine maintenance, street lighting, winter service, road safety,
public transport (including revenue support and concessionary
fares), co-ordination costs of transport support, park and ride
schemes and car parking.
Supplementary data will include details of gross income from car
parking changes, the number of car parking spaces and the number
of penalty/excess charge tickets issued. Information on road lengths
will also be available with a detailed analysis of road maintenance
per kilometre.
C11 Highways and Transport CIPFAstats+ Datasets Self assessment/challenge fund alignment: Q15 and Q16
Local Authority/Organisation: CIPFA
Why
Highways and Transport CIPFAstats+ Datasets provide a
comprehensive overview of how a local authority manages their
highway and transport services, expenditure and income and how
effective it is compared to similar authorities.
Keeping the UK moving is key for businesses and residents residing
in your borough. Having interactive comparative data at your
fingertips allows you to do just that.
CIPFA Power BI Dashboard Supports
Build Back:
Healthier
Fairer
Safer
Stronger
Greener
Better

Produced by the UKRLG Asset Management Board to provide evidence for DfT’s consideration. The content within does not necessarily reflect the views of DfT
What and how
NHT CQC has focused on comparing expenditure on road
maintenance on a like for like basis to quantify improvements and
efficiency savings.
To achieve this the Network uses state of the art statistical
techniques to provide better like-for-like cost comparisons
between authorities than has been possible using traditional
benchmarking. It does this by adjusting for differences in size, traffic
volume, wages and road condition to derive a Normalised Cost for
each highway authority.This £/Km cost can be used to compare
with any other authorities and evaluate the overall improvement in
efficiency across the Highway Sector.
Through this analysis new opportunities for improvement have
been identified for authorities through improving procurement;
programming; and investing in optimising the condition of roads.
C12 NHT CQC – Highway Cost EfficiencySelf assessment/challenge fund alignment: Q15 and Q16
Local Authority/Organisation: NHT
Why
The National Highways and Transport (NHT) Cost Quality
Customer (CQC) Efficiency Network was formed in 2015 to help
drive efficiency across the Highway Sector.
NHT CQC – Driving Sector Efficiency
Benefits and outcomes
The Efficiency Improvement is 13.5%, , a Total Realised Efficiency
Savings of £47.7m in 2019/20 and a cumulative savings of £568.9m
since 2013/14.The potential saving opportunities total £55m p.a.
through procurement of road treatments, £65m p.a.. through
programming and £45m p.a. through a shift towards optimal road
condition.The overall opportunity is £165m p.a. or 17% of annual
expenditure.
This potential can only be realised through a substantial,
predictable and sustained investment in the condition of roads.
Supports
Build Back:
Stronger
Better£568m
To Date
£165m p.a.
Opportunity

Produced by the UKRLG Asset Management Board to provide evidence for DfT’s consideration. The content within does not necessarily reflect the views of DfT
What and how
Each authority will score themselves against 22 questions and place
themselves into one of 3 Bands on the basis of the available evidence.
The questions are designed to enable authorities to assess their
progress on the journey to the implementation of good practice, which
will create an environment for effective and efficient delivery and enable
capital funding to maximise its return. Underpinning this are the needs
of stakeholders and the communication of the importance of the
highway service and the needs for well-maintained highways.
The incentive funding awarded to each local highway authority will be
based on their score in this questionnaire and will be relative to the
amount received through the needs-based funding formula.
C13 Incentive Fund MaturitySelf assessment/challenge fund alignment: All
Local Authority/Organisation: DfT
Why
The Government announced that £6 billion was being made available
between 2015/16 and 2020/21 for local highways maintenance capital
funding. From that funding, £578 million has been set aside for an
Incentive Fund scheme, to reward councils who demonstrate they are
delivering value for money in carrying out cost effective improvements.
Each local highway authority in England (excluding London) is invited to
complete a self-assessment questionnaire, in order to establish the share
of the Incentive fund they will be eligible for.
Incentive Fund Scores
Benefits and outcomes
Over the last four years, the Highways Maintenance Efficiency
Programme (HMEP) has developed a selection of products and services
that promote efficient and effective working practices. These resources
are founded on the good practice that many authorities are already
adopting. In producing this self-assessment questionnaire, an objective
has been to build on this good work and to support authorities who are
on the journey towards improving their working practices.
Local authorities are not competing for funding but are demonstrating
that efficiency measures are being pursued in order to receive their full
share of the funding.
Supports
Build Back:
Healthier
Fairer
Safer
Stronger
Greener
Better
1
1.5
2
2.5
3
30
40
50
60
70
2016/17 2017/18 2018/19 2019/20 2020/21
Average Band and Score in England
Average Band Average Score

Produced by the UKRLG Asset Management Board to provide evidence for DfT’s consideration. The content within does not necessarily reflect the views of DfT
What and how
A whole lifecycle asset management approach sits at the heart of the
new Code, which makes clear recommendations on treating the highway
asset in its entirety and not as separate components. Emphasis is given
on addressing the issues that enable authorities to implement an
efficient lifecycle approach, including data collection and management,
engagement with stakeholders, a risk-based approach to routine
maintenance activities and focus on improving the resilience of the
highway network.
The risk-based approach empowers authorities to set their own policy
on all aspects of the highway service. The Code recommends that in
setting such policies, authorities should consider safety, local needs and
priorities, expectations and requirements of communities, businesses
and other stakeholders as well as affordability. This enables the delivery
of a highway service that is not based on national standards but is fit for
purpose at local level.
C14 Risk Based Approach – Highways Code of PracticeSelf assessment/challenge fund alignment: Q8
Local Authority/Organisation: DfT – UKRLG
Why
Over the last 15 years the UK highway sector has been working
consistently towards the implementation of good asset management.
The latest addition to this collection is the Code of Practice Well-
managed Highway Infrastructure which builds on the previous Codes
whilst reflecting the developments in asset management and today’s
challenges in managing highway infrastructure.
Asset Management Guidance Hierarchy
Benefits and outcomes
The biggest change in the new Code is the emphasis on the risk-based
approach. This approach recommends that all risks associated with
highway service activities are assessed, including safety, reputational and
financial risks. All decisions in developing and implementing policies and
prioritising activities should be made based on the authorities’ approach
to managing these risks.
This enables authorities to remove any “gold plated” standards from the
way they manage assets and prioritise activities that deliver value for
money over the long term, without compromising safety. The Code
recommends that any policies developed take into consideration
stakeholder requirements, so the service delivered is fit for purpose.
Supports
Build Back:
Healthier
Fairer
Safer
Stronger
Greener
Better

Produced by the UKRLG Asset Management Board to provide evidence for DfT’s consideration. The content within does not necessarily reflect the views of DfT
C15 Community Engagement: Maintenance for Active Travel StrategySelf assessment/challenge fund alignment: SAQ Q13
Local Authority/Organisation: Hertfordshire Council
The Case For Investing In Highway Maintenance
Why
Hertfordshire identified the need for a specific strategy for how
maintenance works could better support active travel and thus
make more focussed contributions to modal shift and tackling
climate change – MATS or ‘Maintenance for Active Travel Strategy’.
Looking for quick, simple ‘wins’ that could be delivered through
routine maintenance work to complement larger strategic
projects.
Needed to be inclusive and consider the needs of all users,
especially those with particular mobility challenges.
Subway Refurbishments – Driven by MATS
What and how
▪ National guidance and good practice played a key role, but also
held specific workshops with key local user groups during
development, including representatives of:
▪ ‘Modal’ focussed groups (e.g cyclists)
▪ Disabled people (e.g. wheelchair users, visually impaired
users)
▪ Subject matter experts to support discussions
▪ Workshop outputs fed into MATS development
▪ Directly influenced final strategy and tools
Benefits and outcomes
▪ MATS formally adopted in 2019
▪ Directly supports both HIAMP and LTP objectives
▪ Workshop information ensured experts considered issues and
did not ‘assume’ users challenges and priorities
▪ Led to creation of a simple ‘checklist’ for scheme designers to
identify and solve minor issues acting as Active Travel blockers as
part of bigger schemes
▪ Helped development of other programmes to tackle issues
identified as ‘blockers’ but not always considered technical
priorities (e.g. subway refurbishments)
Supports
Build Back:
Healthier
Fairer
Safer
Greener
Better

Produced by the UKRLG Asset Management Board to provide evidence for DfT’s consideration. The content within does not necessarily reflect the views of DfT
C16 NHT SurveySelf assessment/challenge fund alignment: Q12
Local Authority/Organisation: NHT
Why
To understand the public’s satisfaction with highway and transport
services ,the National Highway and Transport Public Satisfaction
Survey (NHT Survey) collects the public's views on different
aspects of Highway and Transport in local authority areas.
The NHT Survey covers; Pavements, Cycle Routes/Lanes, Local Bus
Services, Local Taxi (or mini cab) Services, Community Transport,
Demand Responsive Transport, Safety on Roads, Traffic Congestion,
Levels of Traffic Pollution, Street Lighting, the Condition of Roads
and the local Rights of Way Network.
Example of NHT Survey Output
What and how
In 2020 109 Authorities took part. A total of 140 Authorities have
taken part in the survey since 2008.
The Survey has been sent to over 4.8 million households since it
was first launched in 2008 and over 1 million members of the
public have made their views known.
The NHT Survey has become an unrivalled resource of public
perception on Highways and Transport services in local authority
areas going back thirteen years.
Benefits and outcomes
Results are reported using 156 individual performance indicators.
The highest recorded satisfaction score was 84% for ‘Number of
Bus Stops’ and lowest 18% for ‘Speed of Repair to Damaged
Roads’.
The main changes in satisfaction by Themes are summarised below:
▪ ‘Overall Satisfaction’ is up,
▪ All ‘Communication’ indicators are up,
▪ Some ‘Public Transport’ indicators are up, and some are down,
▪ All ‘Walking & Cycling’ indicators are down except two Key
Business Indicators (KBIs),
▪ The majority of ‘Tackling Congestion’ indicators are down,
▪ All but one ‘Road Safety’ Indicators are down and
▪ All ‘Highway Maintenance’ indicators are down except two KBIs.
Supports
Build Back:
Healthier
Fairer
Safer
Stronger
Greener
Better

Produced by the UKRLG Asset Management Board to provide evidence for DfT’s consideration. The content within does not necessarily reflect the views of DfT
C17 What improves public satisfaction?Self assessment/challenge fund alignment: Q12
Local Authority/Organisation: West Yorkshire Combined Authority and U. of Leeds
Advanced Ordered Choice Modelling
What and how
This study used the rich data available through spatial modelling
from the National Highway and Transport (NHT) public satisfaction
survey, together with demographic and social data and asset
management data.
The data was mapped to spatial coordinates to tailor it for each
survey respondent in terms of demographic and asset data for
their locality.
This was then analysed through advanced ordered choice
modelling to isolate which attributes imply that respondents are
more or less likely to answer “Satisfied”. An extensive set of
possible attributes of the highway network were then tested to
determine what roads individuals tend to consider when making
their satisfaction response to the NHT survey.
Benefits and outcomes
Why
To understand what improves public satisfaction with respect to
highway maintenance and managementThe Institute for Transport
Studies at the University of Leeds undertook an investigation to
identify and quantify the key drivers of public satisfaction with
Highway maintenance.This used analysis of spatial data for the
West Yorkshire Combined Authority.
Supports
Build Back:
Fairer
Better

Produced by the UKRLG Asset Management Board to provide evidence for DfT’s consideration. The content within does not necessarily reflect the views of DfT
C18 LGA Polling on Resident SatisfactionSelf assessment/challenge fund alignment: Q12
Local Authority/Organisation: Local Government Association (LGA)
Why
The Local Government Association (LGA) measures resident
satisfaction with councils.
Levels of satisfaction with Key Council Services
What and how
Six key indicators are used to measure residents’ views of their
local council. Respondents are also asked to indicate their level of
satisfaction with nine council services.
Other questions focus on perceptions of safety, trust in
politicians/government and media coverage of councils. Additional
questions are occasionally asked.
Between 10 February and 14 February 2021, a representative
random sample of 1,004 British adults (aged 18 or over) was polled
by telephone. Respondents were invited to indicate how satisfied
or dissatisfied they were with waste collection; street cleaning;
road maintenance; pavement maintenance; library services; sport
and leisure services; services and support for older people; and
services and support for children and young people. And also parks
and green spaces.
Benefits and outcomes
Of the nine services presented, there were two significant
decreases in satisfaction since October 2020: road maintenance (a
drop from 43 per cent to 35 per cent) and services and support
for children and young people (a drop from 46 per cent to 41 per
cent).
Overall, road maintenance continues to have the highest level of
dissatisfaction of all services.
Supports
Build Back:
Fairer
Stronger
Better

Produced by the UKRLG Asset Management Board to provide evidence for DfT’s consideration. The content within does not necessarily reflect the views of DfT
C19 Global Infrastructure IndexSelf assessment/challenge fund alignment: Q12
Local Authority/Organisation: Ipsos MORI
Why
To understand how public satisfaction and priorities for
infrastructure compare on a global basis.
Local Roads – Maintain Existing vs Build New
What and how
The fourth Global Infrastructure Index conducted via Ipsos’ Global
@dvisor between 26 July –9 August 2019 in 28 countries via the
Ipsos Online Panel system and involving 19,516 participants.
Benefits and outcomes
Globally, the majority would prioritise maintaining and repairing
existing infrastructure before spending on new infrastructure.
In G8 nations, the Local road network is a relatively high priority
for future investment compared to the global average.
Supports
Build Back:
Fairer
Stronger
Better

Produced by the UKRLG Asset Management Board to provide evidence for DfT’s consideration. The content within does not necessarily reflect the views of DfT
C20 The Condition of England’s Local Roads and how they are FundedSelf assessment/challenge fund alignment: Q1
Local Authority/Organisation: RAC Foundation
Why
The RAC Foundation commissioned this study in 2015 as the
condition of local roads in England is a matter of concern to the
public, local politicians and highway engineers. The report brings
together what is known about the condition of these important
assets, how they are funded.
Frequency of Road Surfacing and Backlog
What and how
Rarely has there been such a focus on transport infrastructure as
we are experiencing today. The Government is making large sums
available for investment in our railways and roads. Much of the
debate is about adding capacity, which is undoubtedly needed as
both the economy and the population grow. But what about the
roads we already have? Maintenance of the existing network might
not conjure up the same excitement as brand-new projects, but it
is arguably more important.
Because this is the network, we already rely on to get to work, to
the shops, to school: the network that commerce relies on to do
business. So, it must be in good order.
The report casts a forensic eye over the ways that local roads get
funded. It paints a picture of complexity and uncertainty, two of the
biggest enemies of good infrastructure management.
Benefits and outcomes
A critical factor in maintaining roads to a good standard is the
availability of sufficient, consistent and reliable funding.
Local authorities in England rely heavily on grants from central
government to fund their roads maintenance.
With growing demands for other local services some, such as child
and adult social care, are very difficult to control, highways
maintenance budgets are being squeezed between funding for
these and reductions in overall revenue spending. As a result, LHA
maintenance spending has reduced. Consequently, DfT capital grant
regime will be in jeopardy as the lack of routine maintenance will
accelerate the deterioration of local authority highway assets with
a consequent expansion of the structural maintenance backlog –
which the DfT grant regime is designed to prevent.
Supports
Build Back:
Healthier
Fairer
Safer
Stronger
Greener
Better

Produced by the UKRLG Asset Management Board to provide evidence for DfT’s consideration. The content within does not necessarily reflect the views of DfT
C21 Communications - Surface Dressing Self assessment/challenge fund alignment: Q2 and Q14
Local Authority/Organisation: Dorset Council
Why
We work very closely with dedicated officers in our
Communications Team to ensure our stakeholders are well
informed about our Highways Service.
We receive many enquiries and complaints every year about
surface dressing, with some members of the public seeing it as a
sub-standard treatment, and failing to understand why we apply it.
We wanted to communicate to our stakeholders why we do early
life surface treatments such as surface dressing, in non-engineering
terms, especially as treated roads may have seemed in good to fair
condition, and to explain the process, and what to expect.
Surface dressing animated graphic
www.dorsetcouncil.gov.uk/surface-dressing
What and how
We produced a web page that included an animated graphic,
communicating key messages about surface dressing.
This animated video is now being used by other highway
authorities to deliver stakeholder information about surface
dressing.
The video has an illustration of road construction layers
represented as layers in a latte, which made it relatable (and
prompted much discussion among engineers).
That year we released weekly updates, supported by the film.
Benefits and outcomes
The video and supporting web page provided information about
what the public could expect, what might affect such operations,
and what they could do to assist our crews on the day of the
works.
The video was widely viewed across various media platforms
What we found that year was a drop in enquiries / complaints
about surface dressing.
There was a better understanding from some stakeholders as to
why we use surface treatments, such as surface dressing.
Supports
Build Back:
Fairer
Safer
Stronger
Greener
Better

Produced by the UKRLG Asset Management Board to provide evidence for DfT’s consideration. The content within does not necessarily reflect the views of DfT
C22 Demonstrating benefits of appropriate intervention optionsSelf assessment/challenge fund alignment: Q5
Local Authority/Organisation: Hull City Council
Why
Repairs to these sections were urgent and to fund them through the
annual maintenance programme would take 15 years + to complete.
Challenges:
Existing network constructed in aging concrete. Existing poor ground
conditions including voids below the existing concrete. Thermal
movement of the existing concrete. Asphalt overlays suffering from
reflective cracking or total failure. Increase in reactive maintenance
work causing delays for road users. Increase in claims against the
authority due to the defects caused. Higher levels of vibrations felt by
road users, residents and property owners.
Concrete Failures and Repairs
What and how
Removed existing Asphalt overlays. Reconstructed areas of failed concrete.
Sealed existing joints/surface cracks in concrete with materials with high
expansion/compression capabilities. Overlayed the concrete with a layer of
asphalt (SAMI) designed to absorb vibrations/movement, reducing stress levels
on the surface asphalts. Used polymer modified Asphalts containing a high
binder content which give higher levels of flexibility and strength for surface
layers, enhancing resistance to reflective cracking and surface deformation. All
brief and tender work done in house. Work tendered on procurement
framework managed by neighbouring authority. Onsite work carried out by
local contractors. Project managed on site inhouse. Design – delivery approx.
9 months. Short delivery times set by DFT achieved despite tight constraints.
Benefits and outcomes
Increased carriageway life span. Reduced noise and vibration and increased
skid resistance. Smoother, safer surfaces for all road users, encouraging
sustainable transport trips. Improved cycling network (part funded by active
travel fund) only achievable after improved surfacing works . Greener travel
benefitting the local environment. Carriageway now capable of standing up to
higher levels of stress. Reduction in future reactive maintenance / delays for
road users. Reduction in claims against the authority and risk of personal
injuries. Benefit to city in reduced user costs representing good value for
money. Other failing parts of the network especially residential areas can now
be targeted meaning other residents/business in the city will indirectly benefit
from this work being carried out. Cost savings due to works undertaken in 3
large contracts.
Supports
Build Back:
Healthier
Fairer
Safer
Stronger
Greener
Better

Produced by the UKRLG Asset Management Board to provide evidence for DfT’s consideration. The content within does not necessarily reflect the views of DfT
C23 East Sussex Highways – Guide to HighwaysSelf assessment/challenge fund alignment: Q2, Q6, Q13 and Q14
Local Authority/Organisation: East Sussex County Council
Why
The Guide to Highways was created to respond to those frequently
asked questions received by the highways Customer Centre, Councilors
and Officers.
The aim was to provide the public and Councilors with a simple
understanding of the service East Sussex Highways delivers, whilst
alleviating the need for Customer Service Advisors to create responses
to those questions on an individual basis.
As Highways is a technical service, it was important to use
uncomplicated terminology to ensure the document was accessible to
all.
East Sussex Guide to Highways
What and how
In 2019 we created two documents, a public facing and a Councilor's only
document. To begin we focused on the areas we received most contact
around, such as potholes, how money is spent and the asset management
approach.
Information was then gathered from various teams, collated and formatted
into the guide. It was key that the document included images and color to
enable it to be interesting. The initial draft took 6 months to pull all the
information together working around other projects. Since 2019 we have been
reviewing, adapting and adding information to ensure it keeps serving its
purpose. This year we combined both documents into one Guide to
Highways, as we found there was no need for two separate documents.
The challenges are to constantly maintain an up-to-date document and get the
relevant information from teams.
Benefits and outcomes
The Guide to Highways has benefitted Customer Centre staff in allowing
them to be confident responding to queries, using the information within the
guide. Which has in turn reduced the need to search for answers from various
teams, helping efficiency.
The Guide has allowed us to become more transparent to the public, allowing
them to understand the reasons behind why we deliver the service as we do.
It is also a useful reference document for Councilors, used to increase their
knowledge, whilst also being able to direct their constituents to it when they
receive highways related questions.
We are therefore keen to continue developing and improving the guide.
Supports
Build Back:
Safer
Stronger
Greener
Better

Produced by the UKRLG Asset Management Board to provide evidence for DfT’s consideration. The content within does not necessarily reflect the views of DfT
C24 Young ProfessionalsSelf assessment/challenge fund alignment: Incentive Fund SAQ Q7
Local Authority/Organisation: Hertfordshire Council
Why
Like many local authorities, Hertfordshire has struggled to recruit
and retain staff who have both the right technical skills and an
understanding of how a local authority is required to operate; we
also have the challenge of an ageing workforce.
Modern apprenticeship programmes offered the opportunity to
address both issues by allowing us to ‘grow our own’ staff with the
right mix of skills while developing the next generation and
The Benefits of Apprenticeships
What and how
▪ Working with a local college, we established a four year
programme to take school leavers through NVQ levels 3 & 4
▪ Employed the apprentices as part of our maintenance team to
allow them experience of a range of programmes & techniques
▪ Used Asset Management Competency Framework amongst
other tools to identify key skills for development as part of ‘on
the job’ training to complement college work
▪ Supported membership of professional bodies to help future
career development
Benefits and outcomes
New intake of staff
▪ Both apprentices taken on in 2015 are still within the service,
achieved promotion on merit after completing the programme
and are working as Engineering Project Managers, each
responsible for their own programme worth c£5m p.a.
▪ The model continues to operate with three apprentices
completing NVQ level 3 this summer
▪ One has joined the programme from an administrative role,
rather than as a school leaver, further widening the opportunities
for career progression within the service
Our first (2015) intake of engineering
apprentices were shortlisted for a CIHT award
Supports
Build Back:
Healthier
Fairer
Safer
Stronger
Greener
Better

Produced by the UKRLG Asset Management Board to provide evidence for DfT’s consideration. The content within does not necessarily reflect the views of DfT
C25 Annual Asset Performance ReportSelf assessment/challenge fund alignment: Q1, Q2, Q3, Q4, Q5, Q6, Q7 and Q8
Local Authority/Organisation: Hertfordshire Council
Why
The development and publication of the revised 2008 Transport
Asset Management Plan gave Hertfordshire increased opportunity
to engage with elected Members and increase their understanding
of AM.
To continue this good work between major revisions to the AMP, it
was decided to produce an Annual Report, modelled on those used
for other key strategy documents like the LTP this would cover
updates on delivery, challenges and opportunities and future plans
for programmes of work or strategy development.
Annual Report – Keeping the Topic Fresh
What and how
The Annual Asset Performance Report (APR) takes the form of a
regular report taken to the appropriate Cabinet Panel including:
▪ Reporting (delivery of works, performance against targets,
performance against the Incentive Fund questionnaire etc.)
▪ Update on emerging strategic challenges and opportunities
▪ Setting or revising plans, targets and programmes for the future
▪ A regular opportunity to discuss strategies and priorities to keep
Members engaged and informed
▪ The chance to discuss new proposals with Members and secure
their input and support
Benefits and outcomes
An AMP APR has been delivered every year since 2009
This keeps the topic fresh in the minds of Members and means that
key targets such as condition of assets and performance against the
DfT Incentive Fund remain in their minds
It gives the opportunity to make minor updates to the AMP and
add additional strategies to it with full Member support without
making major changes to the larger document
Over the years it has also helped us discuss and respond effectively
to emerging challenges from Climate Change to Covid19
Supports
Build Back:
Healthier
Fairer
Safer
Stronger
Greener
Better

Produced by the UKRLG Asset Management Board to provide evidence for DfT’s consideration. The content within does not necessarily reflect the views of DfT
C26 Private Sector Strategic Partnership Self assessment/challenge fund alignment: Q17
Local Authority/Organisation: Dorset Council
Why
Dorset Council has a mixed economy delivery model for its
structural maintenance and highway improvements construction
programmes.
The strategic partnership contract is our third generation with
Hanson Contracting, therefore we have been able to build on the
excellent working relationships forged since we first begun
working together in 2002.
Our Service delivery model is under continued scrutiny with
evidence provided to Councillors that it offers value for money
when compared to alternative delivery models.
Dorset Council / Hanson Annual Summary Report
What and how
In 2017, effective procurement of our non-in house element of
service delivery was provided by competitively tendering the
Dorset Highway Works Term Service Contract using the HMEP
Standard Form of Contract for Highway Maintenance.
This tender evaluated potential partners based on quality and
price.
The performance of the contract is reported monthly and
reviewed quarterly by an Operational and Strategic Board.
An annual joint review meeting is held with Hanson Contracting to
ensure that the partnership is still effective and has value.
Benefits and outcomes
▪ Going into 10th year with zero reportable RIDDOR incidents
▪ Certificate maintained for collaborative working ISO 44001
▪ Cost savings when compared to other frameworks
▪ Review of performance at quarterly Operational and Strategic
Board meetings
▪ Shared involvement in local community projects
▪ Shared vision, values and behaviours
▪ Joint sustainable ventures (e.g., recycling, low energy asphalts)
▪ Access to our partner’s supply chain
▪ Enabling stakeholder engagement / feedback
Supports
Build Back:
Healthier
Fairer
Safer
Stronger
Greener
Better

Produced by the UKRLG Asset Management Board to provide evidence for DfT’s consideration. The content within does not necessarily reflect the views of DfT
C27 Midlands Highway Alliance+ Contracting AllianceSelf assessment/challenge fund alignment: Q21
Local Authority/Organisation: Midlands Highway Alliance
Why
▪ Local highways authorities often require top up capacity to assist
them with engineering design and other professional services,
particularly when they have a large number of projects to deliver
in a relatively short space of time
▪ They also require to procure contracts for the delivery of larger,
particularly one off construction schemes e.g. the delivery of a
new bypass
▪ The tender documentation, legal agreements and competency
checks for procuring the required top up capacity are both
expensive and time consuming to put together
MHA+ Medium Schemes Framework 3
What and how
▪ The Midlands Highway Alliance Plus (MHA+) has membership
from over 40 local highway authorities
▪ The MHA+ consulted with members and as a result developed,
tendered and let professional services and contracting services
framework contracts for use by their membership
▪ The Professional Services Partnership framework contract has
now been let for the third time (PSP3) for 5 years and following
reviews, contract improvements are made each time
▪ The Medium Schemes Framework contract has similarly been let
3 times with the 4th (MSF4) already being developed
Benefits and outcomes
▪ MHA+ member authorities have been able to top up and /or
procure professional and contracting services to deliver
hundreds of projects efficiently and economically
▪ Procurement costs have been slashed for local highway
authorities as all they pay is 0.25% (minimum £2,500 and
maximum £50,000), based on the value of the project for use of
the Medium Schemes Framework for construction delivery
▪ The fee for the use of the Professional Services Framework is
just 1% of the value of work undertaken by each supplier, with all
fees reinvested back into the running costs for the alliance
Supports
Build Back:
Healthier
Fairer
Safer
Stronger
Greener
Better

Produced by the UKRLG Asset Management Board to provide evidence for DfT’s consideration. The content within does not necessarily reflect the views of DfT
What and how
The Asset Management Competence Framework (AMCF) has been
developed as a free to use digitally enabled product that allows UK
Highway Authorities to identify and address competence gaps to
support better asset management practices. The Highway Inspector
Competence Framework (HICF) complements the AMCF providing
specific competence guidance for the highway inspectors, aligned to a
risk-based approach advocated in the latest release of the sector’s code
of practice.
The development of both frameworks has involved extensive
consultation with professional bodies and allows the development of
appropriate qualifications/training for practitioners, helping to
professionalise the role and support career progression. They are both
publicly available to the highways sector enabling good practice to be
shared across over 200 authorities in a cost effective and accessible
manner.
C28 AM Competence Framework for Highway AuthoritiesSelf assessment/challenge fund alignment: SAQ7
Local Authority/Organisation: DfT – UKRLG
Why
UKRLG has a dedicated Asset Management Board which has been
supporting the development of capacity and capability within the sector.
As part of their ongoing work and in response to practitioner feedback
they commissioned the development of an Asset Management
Competence Framework (AMCF) for Highway Authorities and a
Highway Inspector Competence Framework (HICF) in the UK.
AMCF and HICF
Benefits and outcomes
The AMCF has been developed to address the varying needs and
organisational structures across the full range of UK Highway
Authorities, from national road operators to small local authorities. It
also covers the full scope of roles within a highway authority which
contribute to asset management – not just specialist roles. This includes
senior decision makers, on-the-ground operatives and risk/ legal/
insurance colleagues, and thus supports true embedding of asset
management principles and a joined-up approach to delivery throughout
each organisation.
The HICF enables LAs to undertake quick and consistent evaluation of
staff competences and training needs and address gaps, better defend
against compensation claims for network defects and use risk-based
inspections to make efficient use of funds.
Supports
Build Back:
Healthier
Fairer
Safer
Stronger
Greener
Better

Produced by the UKRLG Asset Management Board to provide evidence for DfT’s consideration. The content within does not necessarily reflect the views of DfT
C29 Investment and Re-investment in Improved Plant and MachinerySelf assessment/challenge fund alignment: SAQ Q18
Local Authority/Organisation: RSTA
Why
▪ Improved plant and machinery requires less risk exposure for
operatives
▪ Older plant and machinery is unreliable, can be inefficient and
expensive to run and generates more carbon that is detrimental
to the environment
▪ Newer plant and machinery has improved quality control built in
for longer lasting roads
▪ More plant and equipment is required to give the capacity to
deliver increased client requirements
Deep Road Recycling Machine
What and how
▪ Contractors are taking risks investing large sums into improved
plant and equipment, taking those risks in readiness for potential
required increases in funding for highway asset management
▪ Although contractors are engaging with clients, unfortunately
clients have no certainty of funding and are therefore unable to
effectively plan medium and long term forward programmes
▪ Larger specialised plant and machinery has to be ordered many
months and sometimes years in advance of when it is required
for use
Benefits and outcomes
▪ Improved health and safety
▪ Improved sustainability and efficiency
▪ Improved quality control for finished products or treatments
▪ Improved capacity to deliver increased client requirements
▪ Greater use of preventative and service life extending treatments
▪ Reduction in the number of potholes and unplanned expensive
maintenance
Supports
Build Back:
Healthier
Fairer
Safer
Stronger
Greener
Better

Produced by the UKRLG Asset Management Board to provide evidence for DfT’s consideration. The content within does not necessarily reflect the views of DfT
C30 Innovations, Standards and Sector SchemesSelf assessment/challenge fund alignment: SAQ Q18
Local Authority/Organisation: RSTA
Why
▪ Existing highway products and treatments all began as inventions
or what is more generally termed innovations
▪ When an innovation has been tested and proved to be successful
a ‘Standard’ for the treatment is created and this is applied in
accordance with National Highway Sector Scheme (NHSS)
requirements
▪ The publishing of a standard and the laying of a treatment in
accordance with that standard and by a company registered with
the appropriate NHSS gives an assurance of quality and
completed works that will reach their intended life
British Standards and Sector Schemes
What and how
▪ BSI is the British Standards Institute and is the national body
responsible for managing and maintaining British standards
▪ British Standards (BS) are developed and maintained by drawing
experts in the industry together and agreeing the standards and /
or updates to them
▪ National Highway Sector Schemes (NHSS) cover all types of
highway maintenance. They are a requirement for working on the
Highways England network and also used by local highway
authorities
▪ Registered contractors are audited by Certification Bodies
Benefits and outcomes
▪ Products and treatments are manufactured in accordance with
the agreed and published British Standards (BS)
▪ Products and treatments are laid or used on the highway in
accordance with the requirements of the appropriate Sector
Scheme
▪ Using products that conform to the relevant BS and using
contractors registered with the appropriate National Highway
Sector Scheme ensures the highest quality and efficient products
and treatments that will last for their intended life
Supports
Build Back:
Healthier
Fairer
Safer
Stronger
Greener
Better

Produced by the UKRLG Asset Management Board to provide evidence for DfT’s consideration. The content within does not necessarily reflect the views of DfT
C31 Product Quality Management Systems and Control Self assessment/challenge fund alignment: SAQ Q8 and Q18
Local Authority/Organisation: RSTA
Why
▪ Highway processes and treatments need to be delivered in a
controlled manner to ensure they do not fail early and not reach
there intended life
▪ Whilst road and other maintenance treatments may look fine
and perform well for a number of years, if not correctly stored
and laid on suitable surfaces at the right temperatures and
humidity, their useful life can be shortened substantially making
them inefficient and leading to the requirement for unplanned
reactive maintenance as a result of their premature failure
Product Assurance Schemes
What and how
▪ To ensure products are correctly stored and treatments applied
in the correct manner and at the right temperatures, Product
Assurance Schemes (PAS) schemes are approved by Highways
England and other client organisations
▪ Contractors are required to have approved processes for laying
each type of treatment and these must be in accordance with the
authorised PAS
▪ The PAS organisations regularly audit works to ensure they are
being completed in accordance with the relevant PAS
▪ Companies have their PAS certification removed if they fail
Benefits and outcomes
▪ Highway authorities have the confidence in the product and
treatment they are investing into their highway networks
▪ The completed maintenance treatments will reach their intended
life and therefore be cost effective and efficient for the highway
authority
▪ Highway authorities are able to plan their forward works and
finance requirements with a greater degree of certainty
▪ Contractors who use inferior products and treatments or who
do not apply them in accordance with the PAS are not able to
undertake works that would likely fail prematurely
Supports
Build Back:
Healthier
Fairer
Safer
Stronger
Greener
Better

Produced by the UKRLG Asset Management Board to provide evidence for DfT’s consideration. The content within does not necessarily reflect the views of DfT
C32 Filling the Gap – Consultation & Stakeholder SupportSelf assessment/challenge fund alignment: SAQ 13
Local Authority/Organisation: House of Commons: Transport Committee
Why
The consequences of a deteriorating local road network are
significant. It undermines local economic performance and affects
all road users – motorists, cyclists, passengers and pedestrians. The
Local roads funding and maintenance: filling the gap report looked at
these issues in detail and made recommendations to address the
problems and put them right.
The report concludes that the current short-term approach to
funding local road maintenance is not fit for purpose.
Road user compensation claims England, 2018/19
What and how
Local government revenue funding has fallen by about 25% since
2010. This lack of funding certainty has caused many councils to
take short-term, reactive decisions on road maintenance, which is
more expensive and less effective than proactive maintenance that
can be planned well in advance and the cost spread out over a
number of years.
To tackle this problem DfT should propose a front-loaded, long-
term funding settlement to HMT so that local authorities can
address the historic road maintenance backlog and plan confidently
for the future.
Benefits and outcomes
This report is a good example of widespread support for increased
levels of investment in local highway maintenance.
The Committee received over 90 sources of written evidences
that were used in the report from organisations such as:
▪ Asphalt Industry Alliance (AIA)
▪ Automobile Association
▪ Cycling UK
▪ Department for Transport and other Local Authorities
▪ Federation of Small Businesses
▪ Freight Transport Association
▪ Living Streets
Supports
Build Back:
Healthier
Fairer
Safer
Stronger
Greener
Better
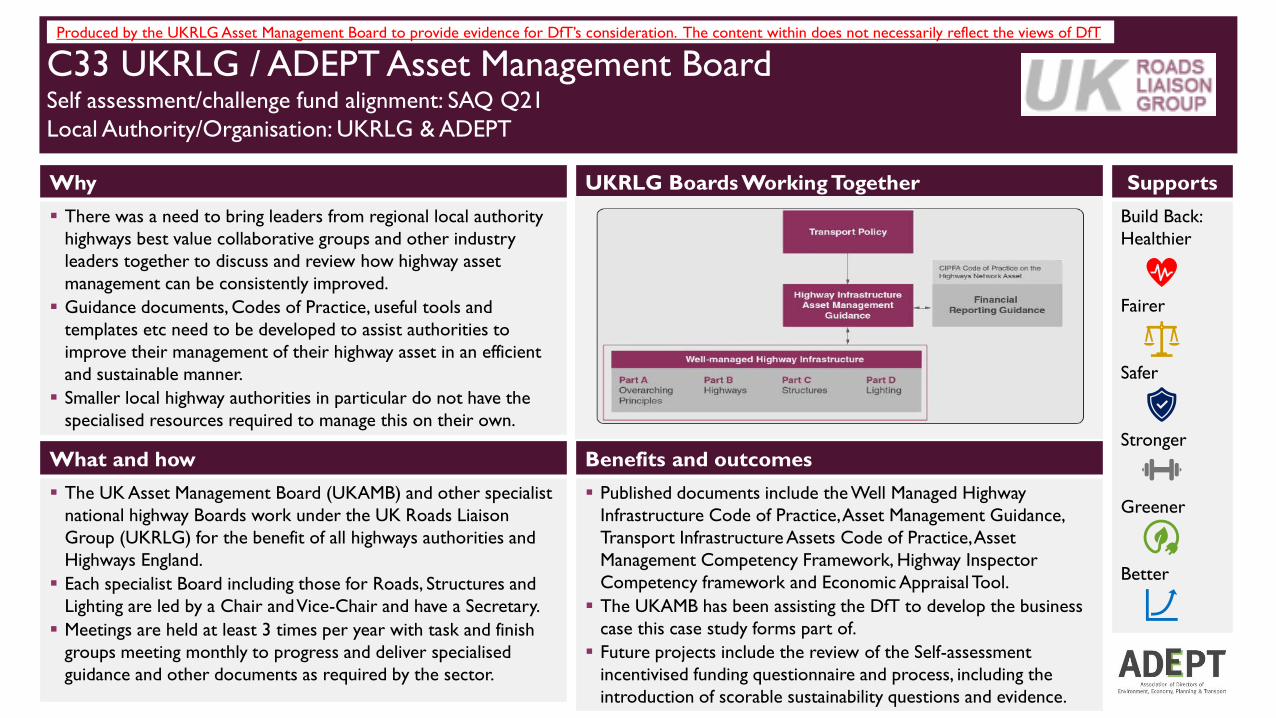
Produced by the UKRLG Asset Management Board to provide evidence for DfT’s consideration. The content within does not necessarily reflect the views of DfT
C33 UKRLG / ADEPT Asset Management BoardSelf assessment/challenge fund alignment: SAQ Q21
Local Authority/Organisation: UKRLG & ADEPT
Why
▪ There was a need to bring leaders from regional local authority
highways best value collaborative groups and other industry
leaders together to discuss and review how highway asset
management can be consistently improved.
▪ Guidance documents, Codes of Practice, useful tools and
templates etc need to be developed to assist authorities to
improve their management of their highway asset in an efficient
and sustainable manner.
▪ Smaller local highway authorities in particular do not have the
specialised resources required to manage this on their own.
UKRLG Boards Working Together
What and how
▪ The UK Asset Management Board (UKAMB) and other specialist
national highway Boards work under the UK Roads Liaison
Group (UKRLG) for the benefit of all highways authorities and
Highways England.
▪ Each specialist Board including those for Roads, Structures and
Lighting are led by a Chair and Vice-Chair and have a Secretary.
▪ Meetings are held at least 3 times per year with task and finish
groups meeting monthly to progress and deliver specialised
guidance and other documents as required by the sector.
Benefits and outcomes
▪ Published documents include the Well Managed Highway
Infrastructure Code of Practice, Asset Management Guidance,
Transport Infrastructure Assets Code of Practice, Asset
Management Competency Framework, Highway Inspector
Competency framework and Economic Appraisal Tool.
▪ The UKAMB has been assisting the DfT to develop the business
case this case study forms part of.
▪ Future projects include the review of the Self-assessment
incentivised funding questionnaire and process, including the
introduction of scorable sustainability questions and evidence.
Supports
Build Back:
Healthier
Fairer
Safer
Stronger
Greener
Better
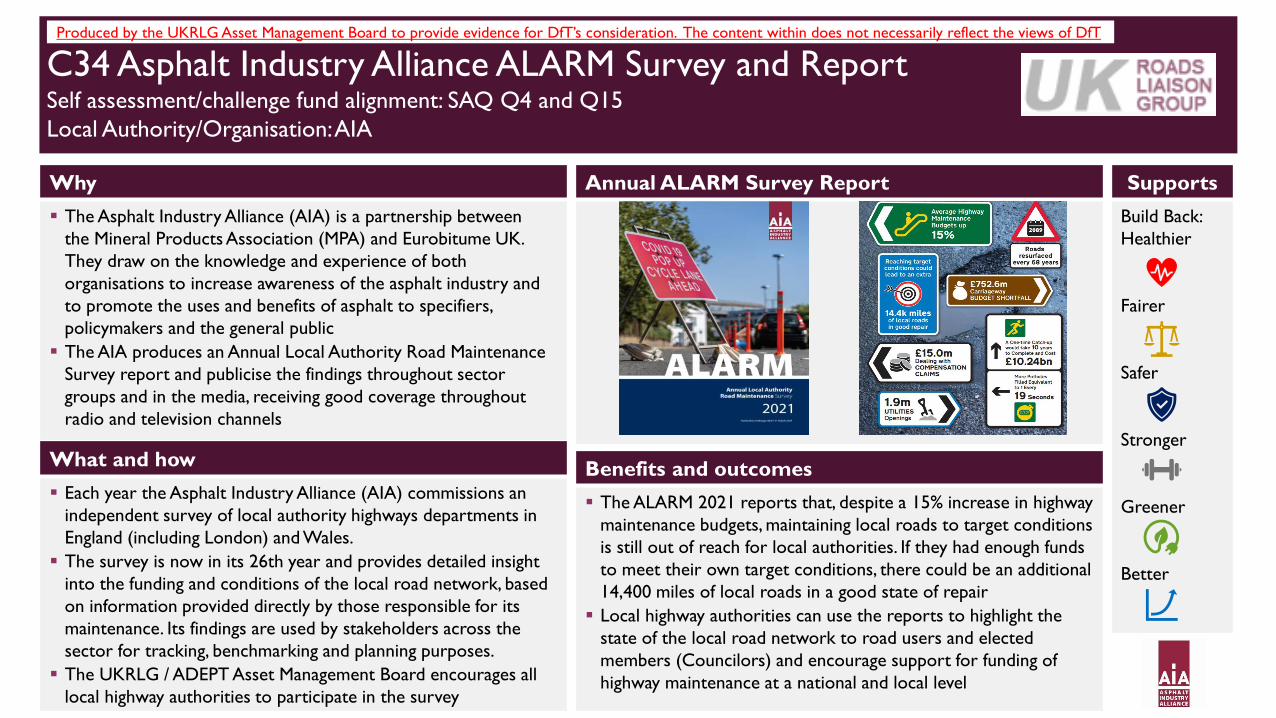
Produced by the UKRLG Asset Management Board to provide evidence for DfT’s consideration. The content within does not necessarily reflect the views of DfT
C34 Asphalt Industry Alliance ALARM Survey and ReportSelf assessment/challenge fund alignment: SAQ Q4 and Q15
Local Authority/Organisation: AIA
Why
▪ The Asphalt Industry Alliance (AIA) is a partnership between
the Mineral Products Association (MPA) and Eurobitume UK.
They draw on the knowledge and experience of both
organisations to increase awareness of the asphalt industry and
to promote the uses and benefits of asphalt to specifiers,
policymakers and the general public
▪ The AIA produces an Annual Local Authority Road Maintenance
Survey report and publicise the findings throughout sector
groups and in the media, receiving good coverage throughout
radio and television channels
Annual ALARM Survey Report
What and how
▪ Each year the Asphalt Industry Alliance (AIA) commissions an
independent survey of local authority highways departments in
England (including London) and Wales.
▪ The survey is now in its 26th year and provides detailed insight
into the funding and conditions of the local road network, based
on information provided directly by those responsible for its
maintenance. Its findings are used by stakeholders across the
sector for tracking, benchmarking and planning purposes.
▪ The UKRLG / ADEPT Asset Management Board encourages all
local highway authorities to participate in the survey
Benefits and outcomes
▪ The ALARM 2021 reports that, despite a 15% increase in highway
maintenance budgets, maintaining local roads to target conditions
is still out of reach for local authorities. If they had enough funds
to meet their own target conditions, there could be an additional
14,400 miles of local roads in a good state of repair
▪ Local highway authorities can use the reports to highlight the
state of the local road network to road users and elected
members (Councilors) and encourage support for funding of
highway maintenance at a national and local level
Supports
Build Back:
Healthier
Fairer
Safer
Stronger
Greener
Better

Produced by the UKRLG Asset Management Board to provide evidence for DfT’s consideration. The content within does not necessarily reflect the views of DfT
C35 Regional Best Value Collaboration Self assessment/challenge fund alignment: SAQ Q15 and Q21
Local Authority/Organisation: Midlands Highway Alliance
Why
▪ Local highway authorities all have the same challenges to safely
maintain their roads and other highway assets
▪ They do not have the capacity to tackle the issues alone
▪ Different local authorities have strengths in certain areas and
weaknesses in others
▪ There is a need to demonstrate good practice and achieve
required outcomes for reporting internally to Councillors and
the public, and to the Department for Transport
▪ Additional ‘Incentive’ funding is linked to evidencing good and
excellent management of the highway asset at a local level
Midlands Highways Alliance
What and how
▪ Authorities meet together on a regional basis to discuss their
challenges and benchmark their respective performances
▪ Guidance documents and tools to assist all authorities are
developed by those with the strengths in certain areas to assist
those who have weaknesses and vice versa
▪ Everything needed is held on the regional groups respective
websites
▪ There are best value collaboration groups all over the country,
including the Midlands Highway Alliance who also let contracts
that can be used by all their members
Benefits and outcomes
▪ All local highway authorities benefit from the exchange of
information and guidance documents and are able to deliver
good or excellent highway asset management in their
geographical area
▪ Guidance documents and tools developed by the regional groups
are usually shared nationally for the benefit of all local highway
authorities throughout the country
▪ Millions of hours and pounds are saved by local highway
authorities being members of regional groups and collaborating
in this way
Supports
Build Back:
Healthier
Fairer
Safer
Stronger
Greener
Better

Produced by the UKRLG Asset Management Board to provide evidence for DfT’s consideration. The content within does not necessarily reflect the views of DfT
C36 ADEPT Live Labs – Transforming Local PlacesSelf assessment/challenge fund alignment: SAQ Q17, Q18 and Q21
Local Authority/Organisation: ADEPT
Why
The advances made in digital technology have transformed how we live
and work and will continue to have far-reaching impacts for some time
to come. As Place Directors, ADEPT members need to be at the
forefront of this rapid change: supporting communities, business and
innovation in their areas.
In 2017, ADEPT created the SMART Places Research Programme to
examine the opportunities and challenges facing the adoption of digital
technology across the local highway network.
Examples of Live Labs
Buckinghamshire Council
▪ 10 e-bikes installed and in service; 20 gulley sensors now installed to provide
real time drainage data; 2400 sensors, 170 composite modular lampposts, 10
wind and solar turbines and 20 energy harvesters being manufactured; in-
depth business and use cases being developed; last mile service solutions
desk study underway
Central Bedfordshire Council
▪ Five geothermal probes extending 150m into the ground are being designed
to deliver a de-icing and heating solution; 216 modules of solar carriageway
surfacing will deliver an annual production estimated at a maximum of
17,400kWh/year; two kinetic walkway arrays will be used to deliver power
to two smart benches and a digital advertising and information screen
Cumbria County Council
▪ Five highways surfacing trials and three quarry trials are planned; the team is
working with several testing companies and laboratories to assess the
performance of materials; a total area of 3000m2 of surfacing laid; 940L of
binder and 1019m2 surface course containing the MacRebur additive was
laid with figures suggesting that the equivalent of 238,958 single use plastic
bags were used in the scheme alone
Kent County Council
▪ 86 innovation opportunities identified and explored, resulting in 30 projects
across all workstreams; 11 data integration innovations have deployed on
HADMS digital platform; 20 asset detection sensors have been installed to
date with four gully sensor manufacturers pitted against each other to drive
innovation; over £600k+ of further funding drawn into Kent’s Live Lab
What and how
Collaboration was a central tenant of the Live Labs programme, and we
are now positively encouraging our cohort to be open to
sharing and asking for help. With emerging innovation, our Live Lab
leaders are now collaborating and sharing knowledge thus reducing
effort, eliminating repeated work and streamlining approaches.
At the heart of Live Labs is accelerating the adoption of new solutions
and technologies to deliver improved outcomes for the local roads
sector, both here in the UK and further afield. We expect Live Lab
partners and their suppliers to focus not only on delivery and associated
benefits, but also on the underlying commercial factors that enable
success – vital for achieving a wider step change. We expect our Live
Labs to be collecting the technical, commercial and other supporting
data to allow others to construct future business cases for their
geographies.
Supports
Build Back:
Healthier
Fairer
Safer
Stronger
Greener
Better

Produced by the UKRLG Asset Management Board to provide evidence for DfT’s consideration. The content within does not necessarily reflect the views of DfT
C37 AI Based Carriageway Condition SurveysSelf assessment/challenge fund alignment: SAQ Q4 and Q10
Local Authority/Organisation: North Yorkshire Council
Supports
Build Back:
Fairer
Safer
Greener
Better
Why
▪ Extensive minor road network (in excess of 6000km)
▪ Completing manual Coarse Visual Inspections (CVIs) was a
significant task each year
▪ CVIs accounted for up to 75% of workload for surveying
team.
▪ Need to reallocate surveyor time to other asset types
▪ Require accurate and up to date information on carriageway
network condition to assist with investment decisions.
Road AI User Interface
What and how
▪ Road AI – automated carriageway condition surveys.
▪ Mobile phone in windscreen collects video data
▪ Data uploaded to central system where AI technology is
used to identify carriageway defects and condition
▪ Data available to view on secure web platform within 4hrs of
upload:
▪ Captured video data
▪ Carriageway Condition data
Benefits and outcomes
▪ Full network can be surveyed in 4 months instead of 9months.
▪ Broader range of information on carriageway condition including
associated video footage
▪ Video can be used to assist in scheme design
▪ Annual data collection assist in asset management and life cycle
planning.
▪ System also collects traffic sign inventory and road lining and
marking location and condition data.
▪ Surveying resources can be deployed elsewhere
▪ Reduction in vehicle mileage and associated emissions

Produced by the UKRLG Asset Management Board to provide evidence for DfT’s consideration. The content within does not necessarily reflect the views of DfT
What and how
Delivering a low-cost project to test the Digital Intelligent
Brokerage (DIB) concept. The technology at the heart of the Hub
is highly automated and specifically designed to lower the barriers
to entry for SMEs across a wide range of industries, using
sophisticated problem re-definition and an innovative online
gateway.
We launched the initiative, introducing a new and innovative
approach to accelerate research and development by encouraging
SME involvement in the highways sector. Its design successfully
delivered the outcomes as predicted and would also be highly
resilient during the pandemic lockdowns.
C38 Digital Intelligent BrokerageSelf assessment/challenge fund alignment: Q18 and Q21
Local Authority/Organisation: DfT / Wiltshire Council
Why
The primary aim of the Digital Innovation Hub is to encourage
technological and product innovation, and especially from SMEs to
help define and address the most complex challenges in any sector.
It develops on an approach previously proven in the Water
industry.
The Digital Intelligent Brokerage is at the core of the Digital
Innovation Hub.
Benefits and outcomes
▪Accessing innovation from across the UK, supporting the levelling
up agenda. Providing an efficient engagement for participants to
access all aspects of the pothole challenge.
▪Demonstrating access to UKPLC innovation, bringing cross-
sector experience and efficiencies, and increasing the value of
cross-sector investment.
▪ Inspired engagement by SMEs and organisations that traditionally
find it difficult to access the market. Respondent organisations
also presented a diversity of solutions.
▪ SME support and collaboration.
▪Outputs accessible and adaptable to support local authorities to
select the most appropriate solutions.
▪ Sector support and strengthening
▪ Interdepartmental efficiencies: The Hub has created interest and
efficiencies across departments, supporting the communication
and promotion of the Hub.
Supports
Build Back:
Healthier
Fairer
Safer
Stronger
Greener
Better

Produced by the UKRLG Asset Management Board to provide evidence for DfT’s consideration. The content within does not necessarily reflect the views of DfT
C39 Markyate Footbridge RefurbishmentSelf assessment/challenge fund alignment: Q5 and Q21
Local Authority/Organisation: Hertfordshire Council
Why
Markyate Footbridge, on the de-trunked A5 in Hertfordshire, is a
concrete footbridge built in the 1950s. It was in very poor
condition, a danger to pedestrian traffic and at risk of impact from
vehicles. Preliminary plan was for demolition and replacement with
an at-grade crossing.
Consultation identified local interest in the history and heritage,
and a strong desire to keep the footbridge. On this basis a
refurbishment and safety improvement scheme was adopted
Before and after – Heritage Maintained
What and how
Initial consultation by Hertfordshire County Council with the
community identified the priorities – bridge refurbishment,
improved footway approaches – and opportunities such as a
community planting scheme.
Design of a refurbishment solution, and a management plan, to
protect the asset for years to come. Construction through a
framework Contractor who maintained the collaborative approach
with the community and the local elected members
Benefits and outcomes
▪Extended the life of a valuable heritage asset
▪Community benefits, strong community involvement and support
▪Collaboration and Early Contractor Involvement (ECI)
▪Design improvements in durability, water management, risk
management, pedestrian and road user safety
▪Collaboration during construction, innovative in materials
▪Environmental improvements in local connectivity, and visually
through bulb planting
▪ Low carbon sustainable solution
Supports
Build Back:
Healthier
Fairer
Safer
Better

Produced by the UKRLG Asset Management Board to provide evidence for DfT’s consideration. The content within does not necessarily reflect the views of DfT
C40 Scheme: Benefits of capital maintenance - Street LightingSelf assessment/challenge fund alignment: Q5
Local Authority/Organisation: Lancashire County Council
Scope
The scheme involves upgrading 67,000 energy inefficient street
lighting lanterns with modern LED equivalents, replacing up to
4,000 lighting columns that have reached the end of their service
life and the provision of approximately 150 charging points to
encourage a greater uptake of Ultra Low Emission Vehicles (ULEV)
in Lancashire.
The scheme will enable LCC to complete its energy efficiency
programme, which started in 2009 but was terminated in 2012 due
to the challenging budgetary conditions.
Return on Investment
The scheme will enable LCC to reduce its revenue expenditure
annually by £3.1M through:
▪ Energy savings: £ 2.7M
▪ Carbon Reduction Commitment Energy Efficiency savings: £191,000
▪ Reduced maintenance costs: £ 210,000
The savings will provide LCC with an opportunity to reinvest some of
these money into other asset related issues.
Solution
Several alternatives were considered previously to tackle this issue
– including a ‘do nothing’ scenario which was rejected as the
proportion of the stock over 40 years old would continue to
increase making catastrophic failure more likely.
A large-scale lantern and column replacement was the preferred
option to enable LCC to achieve economies of scale with regards
the purchasing and fitting lanterns. It also enabled LCC to make
real progress with the removal of most of its highest risk columns.
This scheme will enable LCC to develop a two-phase approach
towards maintaining its street lighting stock over the foreseeable
future.
Other benefits and outcomes
The scheme will also enable LCC to replace up to 4,000 of its
columns which are currently greater than 40 years old and install 150
electricity charging points suitable for use by ULEV. The charging
points will be installed in strategic locations across Lancashire in
consultation with district council partners.
The scheme:
▪ Contributes towards the authority's wider carbon reduction
measures
▪ Supports the 15-year Transport Asset Management Plan (TAMP)
▪ Enables energy consumption to be reduced by 21,834,000 kWhs
per annum
▪ Saves the region 12,000 tonnes of CO2 per annum
Other
Funding
na
BCR
3.79
DfT
Funding
£ 14,800
LA
Funding
£ 5,000
Total
Cost
£ 19,800

Produced by the UKRLG Asset Management Board to provide evidence for DfT’s consideration. The content within does not necessarily reflect the views of DfT
C41 Scheme: Addressing Greater Norwich Flooding IssuesSelf assessment/challenge fund alignment: Q9 and Q11
Local Authority/Organisation: Norfolk County Council
Scope
The scheme upgrades key drainage infrastructure, addressing long
standing flooding issues across a wide residential and growth area.
The works will complement and support economic growth
proposals for north Norwich as set out in the Greater Norwich
Joint Core Strategy & New Anglia LEP Strategic Economic Plan.
Impact of the scheme
The expected benefits would be an effective surface water drainage
system with estimated benefits from a reduction in flood risk to
residential and commercial/public buildings is outlined below:
▪ 51 residential properties: £4.3 million
▪ 28 commercial/public buildings: £89.2 million
Solution
The existing surface water drainage systems are reaching the end
of their useful lives and require improving and replacement. The
systems cannot cope with surface water flows during heavy rainfall
events, with problems occurring typically in the road gullies and
catch pits.
The issues and solutions were identified as major housing schemes
were built. However, fluctuations in capital funding and the need to
prioritise Integrated Transport schemes resulted in delay to further
implementation of the required improvements.
There is a do-nothing option, but with the expected long-term
trend to be for more frequent heavy rainfall events, more regular
flooding would be expected. Therefore, the costs in terms of
economic loss and disruption to the highway network would
increase.
Other benefits and outcomes
An effective surface water drainage system will:
▪ Offer enhanced resilience and bring a far improved level of
protection to a large number of properties and the highway
network.
▪ Reduce disruption and damage and the health and safety issues
associated with flood events.
▪ Minimise the longer-term detrimental health and economic effects
of flooding. Studies have shown the incidence of physical and
mental health, this puts further strain on public health services and
a knock-on negative effect on the economy.
▪ In addition to the direct financial costs and socio-economic costs of
flooding the potential health risks which arise from floodwater
affecting the local sewage network and the associated clear-up
costs from flood events also should be considered.
Other
Funding
na
BCR
6.6
DfT
Funding
£ 9,123
LA
Funding
£ 1,200
Total
Cost
£ 10,323

Produced by the UKRLG Asset Management Board to provide evidence for DfT’s consideration. The content within does not necessarily reflect the views of DfT
Benefits & Return on Investment (scheme level examples)
The Case For Investing In Highway Maintenance
Challenge Fund bids
September 2021 85
Local Authority Asset Class DfT Funding LA Funding Other Funding TotalBenefit/Cost
Ratio
Lancashire Lighting £ 14,800 £5,000 - £ 19,800 3.79 to 4.91
Norfolk Drainage £ 9,123 £ 1,200 - £ 10,323 6.6
South GloucestershireCarriageways, drainage
and structures£ 3,200 £ 150 £ 350 £ 3,700 242.5
Warwickshire Historic bridges £ 4,980 £ 1,320 - £ 6, 300 10-100+
West Midlands Carriageways £ 39,900 £ 4,935 - £ 44,835 6.21 to 6.51
Portsmouth Bridges £ 11,100 £ 1,500 - £ 12,600 Original 114

References

Produced by the UKRLG Asset Management Board to provide evidence for DfT’s consideration. The content within does not necessarily reflect the views of DfT
References
September 2021The Case For Investing In Highway Maintenance 87
1. [1] HAMFIG and CIPFA estimate, 2012
2. [2] ONS. (Gross Domestic Product (GDP) - Office for National Statistics (ons.gov.uk))
3. [3] GOV.UK - Build Back Better - our plan for growth (publishing.service.gov.uk)
4. [4] GOV.UK - Value for money framework (publishing.service.gov.uk)
5. [5] GOV.UK - Delivering better outcomes for citizens practical steps for unlocking public value
web.pdf (publishing.service.gov.uk)
6. [6] Local highways maintenance incentive fund. Guidance and a self-assessment questionnaire for
the local highways maintenance incentive fund. (DfT)
7. [7] CIHT Highways Maintenance Economic Assessment (HMEA | CIHT)
8. [8] RAC Foundation. (economics_of_road_maintenance-gould_et_al-june_2013.pdf
(racfoundation.org))
9. [9] Smart Transport. (health-benefits-of-active-travel-laura-laker.pdf (windows.net))
10. [10] CIHT Awards: Highway Schemes Carbon Assessment. (CIHT Awards 2020 – the winners
announced)
11. [11] CIHT Awards: Supporting the green recovery and accelerating Net Zero transport with e-
scooter trials. (CIHT Awards 2021 Shortlist Announced)
12. [12] CIHT Awards: M25 Reclaimed Asphalt. (CIHT Awards 2020 – the winners announced)
13. [13] House of Commons Library. Active travel: Trends, policy and funding - House of Commons
Library (parliament.uk)
14. [14] Plantlife. (Road_verge_guide_2021_WEB.pdf (plantlife.org.uk))
15. [15] IEMA. (Highway to health | Transform (iema.net))
16. [16] TDAG. Roads to places integrating green infrastructure for highways-workshop
notes_final_draft.pdf (tdag.org.uk)
17. [17] CIHT. (sotn-report.pdf (ciht.org.uk))
18. [18] CIHT. (Code of Practice | CIHT)
19. [19] Green Capital. (green_capital.pdf (london.gov.uk))
20. [20] McKinsey&Co. (a-better-road-to-the-future-web-final.pdf (mckinsey.com))
21. [21] Oxfordshire County Council. (ResilientNetworkDefinition (oxfordshire.gov.uk))
22. [22] DfT. (Department for Transport Innovation Programme - Case Studies (catapult.org.uk))
23. [23] Highways Magazine. (Highways Magazine - DfT calls for resilience update, after celebrating
COVID performance)
24. [24] Resilience Shift. (RP-Roads_Final_Pages.pdf (resilienceshift.org))
25. [25] Transport Network. (Heatwave causing roads to melt 'like chocolate' - The Transport Network
(transport-network.co.uk))
26. [26] Cycling UK. (Highway maintenance | Cycling UK)
27. [27] The AA. (Pothole damage - claim compensation with these steps | The AA)
28. [28] Age UK. (age-uks-pride-place-campa-fe3.pdf (local.gov.uk))
29. [29] Highways Magazine. (Highways Magazine - England's 700,000 potholes on Grand Canyon
scale)
30. [30] Cycling UK. (Potholes on minor roads cost economy £2bn says Cycling UK | Cycling UK
31. [31] Road Safety Foundation. (Building Back Safer | RoadSafetyFoundation.org)
32. [32] RAC Foundation. (Condition of England's local roads and how they are funded
David_Bayliss_November_2015_web_version.pdf (racfoundation.org))
33. [33] Kwik Fit. (Cost of Pothole Damage Rises Despite Huge Drop in Mileage | Kwik Fit (kwik-
fit.com))
34. [34] RAC Foundation. (Condition of England's local roads and how they are funded
David_Bayliss_November_2015_web_version.pdf (racfoundation.org))
35. [35] Cycling UK. (Why and how do roads need to be better maintained for cyclists? | Cycling UK)
36. [36] Independent. (UK drivers spend £4bn repairing car damage caused by potholes each year |
The Independent | The Independent)
37. [37] Evening Standard. (Dangerous conditions put more than half of people off cycling on UK roads,
new study finds | London Evening Standard | Evening Standard)
38. [38] LGA. (How do we maximise social value? | Local Government Association)
39. [39] FSB. (REVEALED: England’s pothole problem laid bare as 700,000 complaints reported across
the country | FSB, The Federation of Small Businesses)
40. [40] CIHT Awards: Princes Avenue STEP. (CIHT Awards 2021 Shortlist Announced)
41. [41] Cycling UK. (Six reasons to build cycle lanes | Cycling UK)
42. [42] Public Health England. (Working Together to Promote Active Travel A briefing for local
authorities (publishing.service.gov.uk))
43. [43] NICE - Living Streets. (Overview | Physical activity: encouraging activity in the community |
Quality standards | NICE)
44. [44] Kent County Council. (https://www.kent.gov.uk/__data/assets/pdf_file/0006/66741/Inclusive-
Mobility-Action-Plan.pdf)
45. [45] Legal and General Group. (rebuilding-britain-index-wave-2-060721.pdf
(legalandgeneralgroup.com))
46. [46] Cycling UK. (Cycle safety: make it simple | Cycling UK)
47. [47] Living Streets. (Potholes in pavements leaving over 65s stuck indoors | Living Streets)
48. [48] Smart Transport. (Proving the health benefits of active travel | Active Travel
(smarttransport.org.uk))
49. [49] Smart Transport. (https://smarttransportpub.blob.core.windows.net/web/1/root/insight-change-
of-gear-a-bold-vision-for-active-travel-low-res-pdf.pdf)

Produced by the UKRLG Asset Management Board to provide evidence for DfT’s consideration. The content within does not necessarily reflect the views of DfT
References
September 2021The Case For Investing In Highway Maintenance 88
50. [50] Cycling UK. (What insurance are we offering (cyclinguk.org))
51. [51] Cycling UK. (Pothole Watch: Roads investment should value local journeys | Cycling UK)
52. [52] Warrington Borough Council. (Microsoft Word - Resilient Network Proposal 2017-2019.docx
(warrington.gov.uk))
53. [53] The King’s Fund. (Active and safe travel | The King's Fund (kingsfund.org.uk))
54. [54] NICE. (Commuting by walking or cycling 'can boost mental wellbeing' | News and features |
News | NICE)
55. [55] RAC Foundation. (racf_ricardo_aea_air_quality_report_hitchcock_et_al_june_2014.pdf
(racfoundation.org))
56. [56] Air Quality News. (Why ‘green’ infrastructure is critical for improving air quality –
AirQualityNews)
57. [57] DfT. (Active Mode Appraisal Toolkit User Guide (publishing.service.gov.uk))
58. [58] Sustrans. (https://www.sustrans.org.uk/media/4471/4471.pdf)
59. [59] The Lancet. (Effect of increasing active travel in urban England and Wales on costs to the
National Health Service - The Lancet)
60. [60] DfT. (Gear change: a bold vision for cycling and walking (publishing.service.gov.uk))
61. [61] TRL. (Transport Research Laboratory: creating the future of transport
(publishing.service.gov.uk))
62. [62] DfT. (Valuing the benefits of road maintenance: summary (publishing.service.gov.uk))
63. [63] DfT. (Socio-economic model for highway maintenance (whatdotheyknow.com))
64. [64] CIHT. (ciht-improving-local-highways-the-route-to-a-better-future.pdf)
65. [65] DfT. (Road Condition Statistics - Table RDC0310 (TSGB0723)
66. [66] AIA. (ALARM-survey-2021-FINAL.pdf (asphaltuk.org))
67. [67] DfT. ([Withdrawn] Apply to the local highways maintenance challenge fund - GOV.UK
(www.gov.uk))
68. [68] DfT. (Roads funding information pack - GOV.UK (www.gov.uk))
69. [69] DfT. (Local highways maintenance incentive fund - GOV.UK (www.gov.uk))
70. [70] Street Works. (PowerPoint Presentation (streetworks.org.uk))
71. [71] RAC Foundation. (rac-rom-2015)
72. [72] RAC Foundation. (rac-report-on-motoring-2016.pdf)
73. [73] RAC Foundation. (rac_rom_2017.pdf)
74. [74] RAC Foundation. (rac10483_rom-2018_content_web)
75. [75] RAC Foundation. (RAC Report on Motoring 2019 | RAC Drive)
76. [76] RAC Foundation. (RAC Report on Motoring 2020 | RAC Drive)
77. [77] DfT. (Road Condition Statistics - Table RDC0320)
78. [78] AIA. (ALARM-survey-2020-FINAL.pdf (asphaltuk.org))
79. [79] RAC Foundation. (Council road bridge maintenance in Great Britain (racfoundation.org))
80. [80] RAC Foundation. (Number of substandard road bridges on the rise (racfoundation.org))
81. [81] RAC Foundation. (Bridge maintenance backlog grows (racfoundation.org))
82. [82] RAC Foundation. (Bridge maintenance backlog remains static (racfoundation.org))
83. [83] RAC Foundation. (Number of substandard road bridges on the rise again (racfoundation.org))
84. [84] Suffolk – MHCLG and CIHT 4th July 2019 presentation
85. [85] Visit Cumbria. (The flood in Workington, 19th-20th November 2009 | Visit Cumbria)
86. [86] Independent Saddleworth. (Driven up the wall by road closure? – Saddleworth Independent)
87. [87] CIHT. (task-3-cycle-service-levels-report-v13-final.pdf (ciht.org.uk))
88. [88] Cycling UK (390 cyclists killed or seriously injured since 2007 due to potholes | Cycling UK)
89. [89] Incentive fund/scores provided by DfT
90. [90] Zurich. (Outdated allocation of pothole funding threatens cyclists lives and the green recovery)
91. [91] West Midlands carriageway resurfacing scheme (Challenge fund bid)
92. [92] Greater Norwich Area Surface Water Drainage scheme (Challenge fund bid)
93. [93] Portsmouth Bridge Replacement scheme (Challenge fund bid)
94. [94] Lancashire Upgrading of Street Lighting scheme (Challenge fund bid)
95. [95] Cycling UK. (More than half of councils have less cash to spend on fixing potholes than five
years ago | Cycling UK)
96. [96] UK Lighting & Technology Board
97. [97] CIHT. (A possible model for future funding and governance of the local highway network)
98. [98] NIC. (170221-NIC-Annual-Monitoring-Report-2021-Final-Web-Vrsn.pdf)
99. [99] Better Transport. (Campaigns | Campaign For Better Transport)
100. [100] NAO. (Maintaining strategic infrastructure: roads - National Audit Office (NAO) Report)
101. [101] Defra. Climate change risk assessment – transport 2012
102. [102] Defra. Summary of the Key Findings from the UK Climate Change Risk Assessment 2012
103. [103] CCC. First the heat, then the rain: The problem of surface water flooding in England
104. [104] Zurich. Flooding after Storm Desmond
105. [105] Derbyshire County Council. Derbyshire DfT Highways Maintenance Challenge Fund form
106. [106] Highways Magazine. Highways Magazine - Heatwave causing roads to melt 'like chocolate’
107. [107] DfT. Transport Resilience Review: A review of the resilience of the transport network to
extreme weather events
108. [108] LGTAG. Building the business case for resilience – HIRAM at Highways UK – LGTAG
109. [109] MHA Plus. Climate change (mhaplus.org.uk)
110. [110] Peterborough City Council. Decision details, Department for Transport Challenge Fund Award
- SEPT17/CMDN/46

Analysis

Produced by the UKRLG Asset Management Board to provide evidence for DfT’s consideration. The content within does not necessarily reflect the views of DfT
Background - Condition Levels
September 2021The Case For Investing In Highway Maintenance 90
Very Good Good Fair
Poor Very Poor

Produced by the UKRLG Asset Management Board to provide evidence for DfT’s consideration. The content within does not necessarily reflect the views of DfT
Background - Good State of Repair
September 2021The Case For Investing In Highway Maintenance 91
Good State of Repair
▪ No structural issues
▪ Minor deterioration
▪ May require patching and/or surfacing
Fair
Minor deterioration
Very Good
As New
Good
Aesthetically Impaired

Produced by the UKRLG Asset Management Board to provide evidence for DfT’s consideration. The content within does not necessarily reflect the views of DfT
Backlog / Annual Need comparisons
September 2021The Case For Investing In Highway Maintenance 92
Not all Backlogs / Annual Needs are the same
Service Level
Others – ‘As New’ – Gold Standard
Large periodic investments
Higher 60-year projected maintenance costs (discounted)
Backlog calculated and provided by each individual Highway Authority
UKRLG – ‘State of Good repair’ – Bronze Standard
Slight sustained increase in annual funding
Lower 60-year projected maintenance costs (discounted)
Transparency of funding
Improved planning
Consistency of data, assumptions and analytical approach across England
Industry recognised tools and techniques

Produced by the UKRLG Asset Management Board to provide evidence for DfT’s consideration. The content within does not necessarily reflect the views of DfT
Backlog Calculation
September 2021The Case For Investing In Highway Maintenance 93
The investment required to achieve a network Service Level of ‘State of Good Repair’ (SoGR)
2019 UKRLG State of the Nation Report provides the calculation methodology
Utilises Nationally recognised tools developed by HMEP, UKRLG and the Highway Sector
HMEP/UKRLG Lifecycle Planning tools
Structures Lifecycle Toolkit
Approach and assumptions have been assessed, reviewed and approved by industry experts
(UKRLG AM Board)
Figures have not been inflated
Indicative 2021 analysis indicates the England (excl. London) backlog has increased by c. £1
billion since 2019 backlog calculation due to subsequent investment levels, inflation,
deterioration and short-term funding strategies
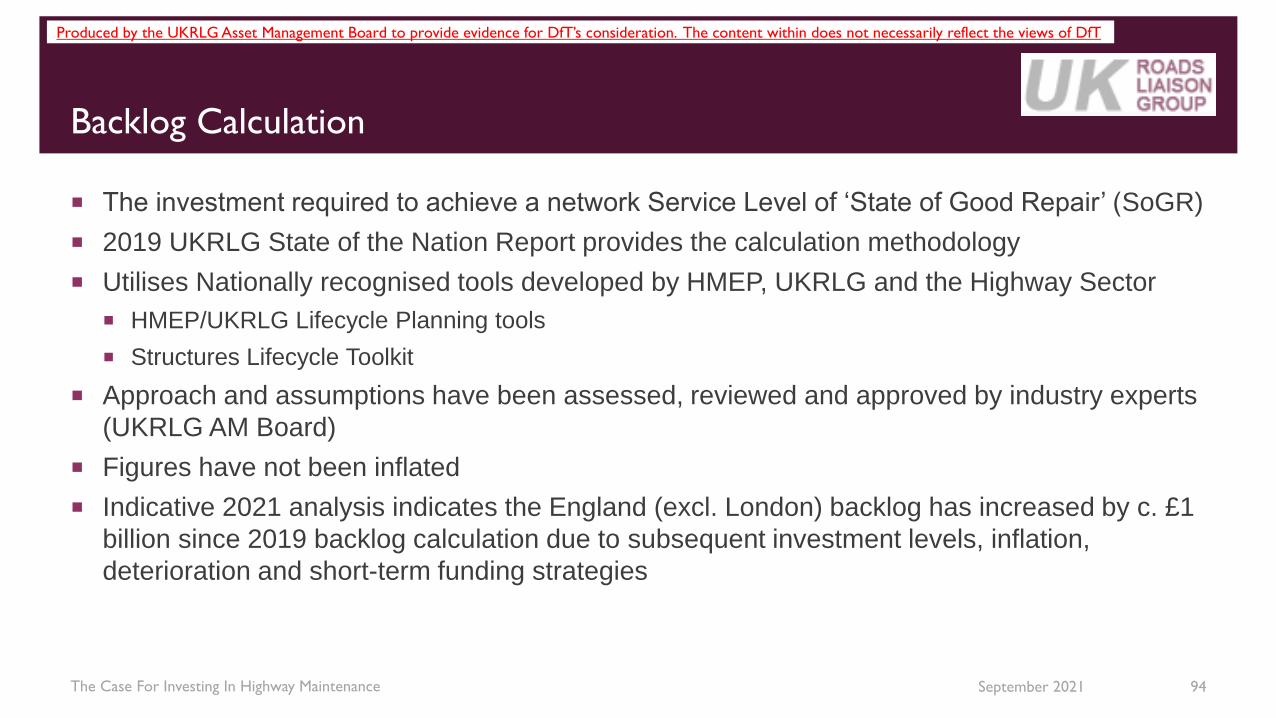
Produced by the UKRLG Asset Management Board to provide evidence for DfT’s consideration. The content within does not necessarily reflect the views of DfT
Backlog Calculation
September 2021The Case For Investing In Highway Maintenance 94
The investment required to achieve a network Service Level of ‘State of Good Repair’ (SoGR)
2019 UKRLG State of the Nation Report provides the calculation methodology
Utilises Nationally recognised tools developed by HMEP, UKRLG and the Highway Sector
HMEP/UKRLG Lifecycle Planning tools
Structures Lifecycle Toolkit
Approach and assumptions have been assessed, reviewed and approved by industry experts
(UKRLG AM Board)
Figures have not been inflated
Indicative 2021 analysis indicates the England (excl. London) backlog has increased by c. £1
billion since 2019 backlog calculation due to subsequent investment levels, inflation,
deterioration and short-term funding strategies
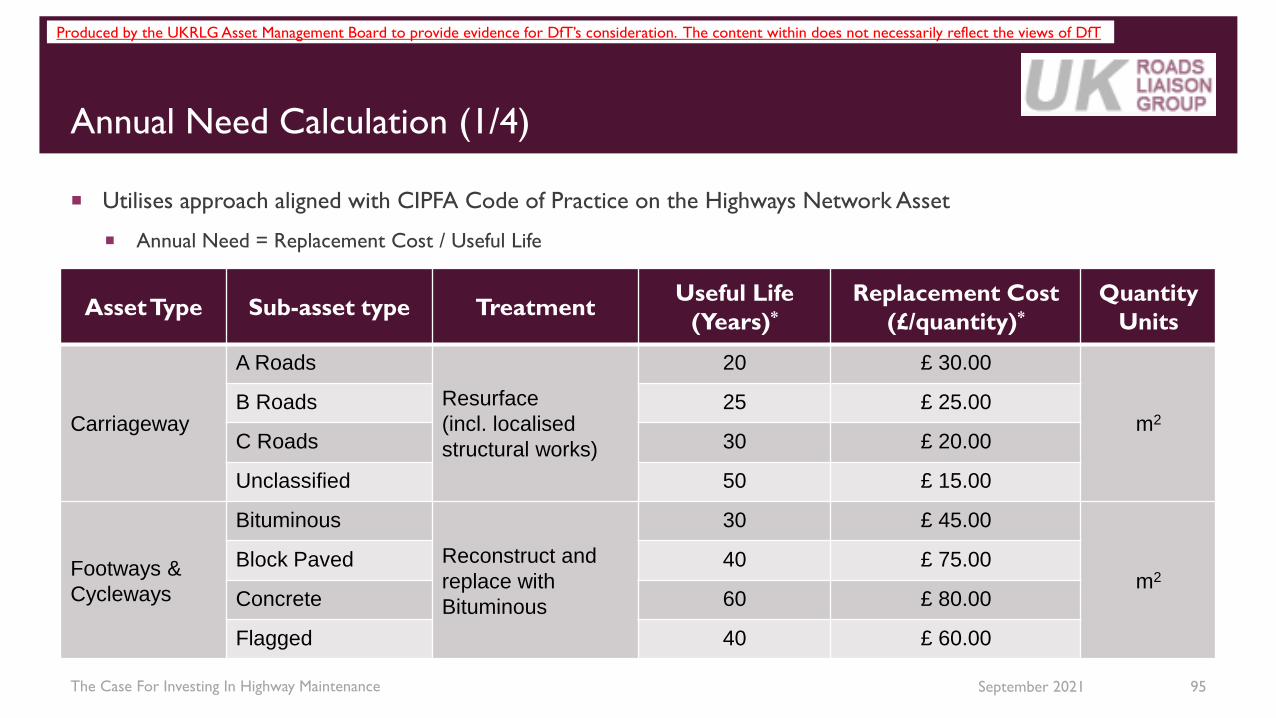
Produced by the UKRLG Asset Management Board to provide evidence for DfT’s consideration. The content within does not necessarily reflect the views of DfT
Annual Need Calculation (1/4)
September 2021The Case For Investing In Highway Maintenance 95
Utilises approach aligned with CIPFA Code of Practice on the Highways Network Asset
Annual Need = Replacement Cost / Useful Life
Asset Type Sub-asset type TreatmentUseful Life
(Years)*
Replacement Cost
(£/quantity)*
Quantity
Units
Carriageway
A Roads
Resurface
(incl. localised
structural works)
20 £ 30.00
m2B Roads 25 £ 25.00
C Roads 30 £ 20.00
Unclassified 50 £ 15.00
Footways &
Cycleways
Bituminous
Reconstruct and
replace with
Bituminous
30 £ 45.00
m2Block Paved 40 £ 75.00
Concrete 60 £ 80.00
Flagged 40 £ 60.00
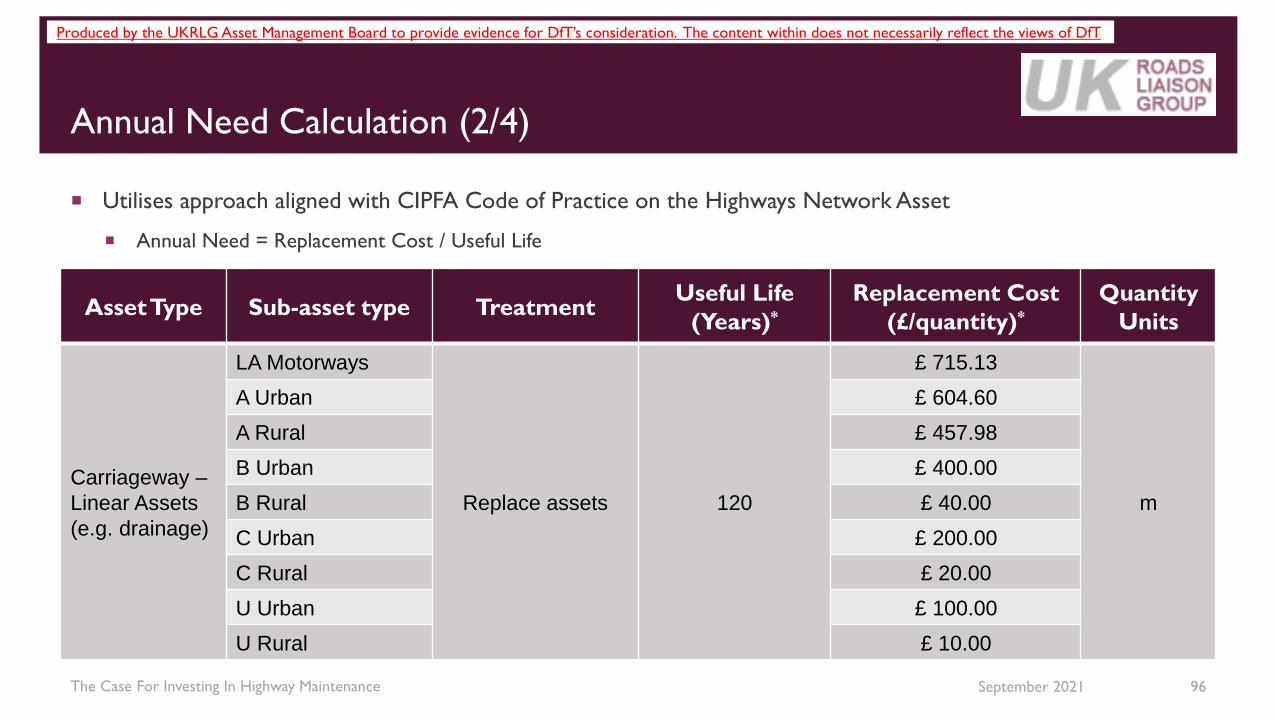
Produced by the UKRLG Asset Management Board to provide evidence for DfT’s consideration. The content within does not necessarily reflect the views of DfT
Annual Need Calculation (2/4)
September 2021The Case For Investing In Highway Maintenance 96
Utilises approach aligned with CIPFA Code of Practice on the Highways Network Asset
Annual Need = Replacement Cost / Useful Life
Asset Type Sub-asset type TreatmentUseful Life
(Years)*
Replacement Cost
(£/quantity)*
Quantity
Units
Carriageway –
Linear Assets
(e.g. drainage)
LA Motorways
Replace assets 120
£ 715.13
m
A Urban £ 604.60
A Rural £ 457.98
B Urban £ 400.00
B Rural £ 40.00
C Urban £ 200.00
C Rural £ 20.00
U Urban £ 100.00
U Rural £ 10.00

Produced by the UKRLG Asset Management Board to provide evidence for DfT’s consideration. The content within does not necessarily reflect the views of DfT
Annual Need Calculation (3/4)
September 2021The Case For Investing In Highway Maintenance 97
Utilises approach aligned with CIPFA Code of Practice on the Highways Network Asset
Annual Need = Replacement Cost / Useful Life
Asset Type Sub-asset type TreatmentUseful Life
(Years)*
Replacement Cost
(£/quantity)*
Quantity
Units
StructuresBridges
Waterproofing 20 £ 250.00
Bridge deck
area (m2)
Drainage / Bearing
Shelf Cleaning5 £ 1.50
Parapet
Maintenance15 £ 55.00
Expansion Joints 20 £ 200.00
Bearing renewals 30 £ 170.00
General repairs 30 £ 1,000.00
Other Structures Limited data – estimated to be an additional 50% of Bridges Annual need

Produced by the UKRLG Asset Management Board to provide evidence for DfT’s consideration. The content within does not necessarily reflect the views of DfT
Annual Need Calculation (4/4)
September 2021The Case For Investing In Highway Maintenance 98
Utilises approach aligned with CIPFA Code of Practice on the Highways Network Asset
Annual Need = Replacement Cost / Useful Life
Asset Type Sub-asset type TreatmentUseful Life
(Years)*
Replacement Cost
(£/quantity)*
Quantity
Units
Street Lighting Lighting ColumnReplace Lighting
point40 £ 1,308.29** Unit
Traffic Signals
JunctionReplace signals
and equipment25
£ 99,692.31**
UnitPedestrian
Crossing£ 51,938.10**
* Based on Engineering Experience
** Average costs extracted from data supplied in Asset Valuations provide by Local Authorities as part of the ‘State of the Nation’ report

Produced by the UKRLG Asset Management Board to provide evidence for DfT’s consideration. The content within does not necessarily reflect the views of DfT
Carriageway Scenario Analysis – Condition
September 2021The Case For Investing In Highway Maintenance 99
Scenario 1 - Decline Scenario 2 – Managed Decline Scenario 3 – Maintain
Scenario 4 – Gradual Improvement Scenario 5 – Accelerated Improvement
1% = c. 2,832km
or c. 1,760 miles
Scenarios
focused on
proactive works
Analysis
based on
indicative
allocations
(Slide 19)

Produced by the UKRLG Asset Management Board to provide evidence for DfT’s consideration. The content within does not necessarily reflect the views of DfT
Footway / Cycleway Scenario Analysis – Condition
September 2021The Case For Investing In Highway Maintenance 100
1% = c. 2,164km
or c. 1,345miles
Scenario 2 – Managed DeclineScenario 1 - Decline Scenario 3 – Maintain
Scenario 5 – Accelerated ImprovementScenario 4 – Gradual Improvement
Analysis
based on
indicative
allocations
(Slide 19)

Produced by the UKRLG Asset Management Board to provide evidence for DfT’s consideration. The content within does not necessarily reflect the views of DfT
Structures Scenario Analysis – Condition
September 2021The Case For Investing In Highway Maintenance 101
1% = c. 500
Bridges and an
estimated 250
retaining walls
Scenario 5 – Accelerated ImprovementScenario 4 – Gradual Improvement
Scenario 1 - Decline Scenario 2 – Managed Decline Scenario 3 – Maintain
Analysis
based on
indicative
allocations
(Slide 19)