Embed Size (px)
Citation preview
Heading towards commercialization? The case of live animal marketing in Ethiopia
Berhanu Gebremedhin,* Dirk Hoekstra and Samson Jemaneh
Improving Productivity and Market Success (IPMS) of Ethiopian farmers project,
International Livestock Research Institute (ILRI), Addis Ababa, Ethiopia
* Corresponding author: [email protected]
Authors’ affi liations
Berhanu Gebremedhin, Improving Productivity and Market Success (IPMS) of Ethiopian farmers project, International Livestock Research Institute (ILRI), Addis Ababa, Ethiopia
Dirk Hoekstra, IPMS Ethiopian farmers project, ILRI, Addis Ababa, Ethiopia
Samson Jemaneh, IPMS Ethiopian farmers project, ILRI, Addis Ababa, Ethiopia
© 2007 ILRI (International Livestock Research Institute)
All rights reserved. Parts of this publication may be reproduced for non-commercial use
provided that such reproduction shall be subject to acknowledgement of ILRI as holder of
copyright.
Correct citation: Berhanu Gebremedhin, Hoekstra D and Samson Jemaneh. 2007.
Heading towards commercialization? The case of live animal marketing in Ethiopia. Improving Productivity and Market Success (IPMS) of Ethiopian Farmers Project Working Paper 5. ILRI (International Livestock Research Institute), Nairobi, Kenya. 73 pp.
iii
Table of Contents
List of Figures v
List of Tables vi
Abstract vii
1 Introduction 1
2 Study methodology 3
3 Description of the case study pilot learning woredas (PLWs) (districts) 6
4 Trends, growth rate and shares of regions in livestock population 9
4.1 Trends and growth rates of livestock population in Ethiopia (1997/98–2004/05) 9
4.2 Trends and growth rates of livestock population by region, and share of regions 10
4.3 Per capita cattle, sheep and goat population in the four regions 18
5 Mode of live animal production, feeds and livestock diseases 21
6 Livestock production support services 25
6.1 Input supply 25
6.2 Extension services 26
6.3 Veterinary services 27
6.4 Credit supply 27
7 Live animals market structure 29
7.1 Livestock market places 29
7.2 Distribution of livestock market places and market access 31
7.3 Livestock market actors 32
7.4 Livestock transportation 36
7.5 Availability of studies and data, and access to market information 37
7.6 Policy, regulatory and institutional aspects of livestock marketing 38
8 Household livestock marketing behaviour and price determination 40
8.1 Reasons for household selling decisions 40
8.2 Characteristics of animals offered for sale 41
8.3 Time and frequency of sale 42
8.4 Price determination 43
8.5 Major market related problems of producers, traders and exporters 43
9 Conclusion and implications 45
References 49

iv
Annex 1: Checklist used for rapid appraisal of livestock marketing 50
Annex 2: Livestock trade routes of the Tigray Region 54
Annex 3: Livestock trade routes of Amhara Region 57
Annex 4: Livestock trade routes, Oromia Region 60
Annex 5: Livestock trade routes, SNNPR 63

v
List of Figures
Figure 1. IPMS Pilot Learning Woredas 3
Figure 2. Trends in cattle, sheep and goats population in Ethiopia, 1997/98–2004/05 9
Figure 3. Growth rate of cattle, sheep and goats population in Ethiopia, 1998/99–2004/05 10
Figure 4. Trends in cattle population of the four regions, 1997/98–2004/05 11
Figure 5. Growth rate of cattle population in the four regions, 1998/99–2004/05 12
Figure 6. Trends in percentage shares of the four regions in the total cattle population of Ethiopia during 1997/98–2004/05 12
Figure 7. Trends in percentage share of the four regions in the total cattle population of Ethiopia during 1997/98–2004/05 13
Figure 8. Trends in sheep population of the four regions, 1997/98–2004/05 14
Figure 9. Growth rate of sheep population in the four regions, 1998/99–2004/05 14
Figure 10. Percentage shares of four regions in Ethiopia’s sheep population, 1997/98–2004/05 15
Figure 11. Growth rate in share of sheep population in the four regions, 1997/98–2004/05 15
Figure 12. Trends in goat population of the four regions, 1997/98–2004/05 16
Figure 13. Growth rate of goat population in the four regions, 1997/98–2004/05 17
Figure 14. Percentage shares of four regions in the total goat population of the four regions, 1997/98–2004/05 17
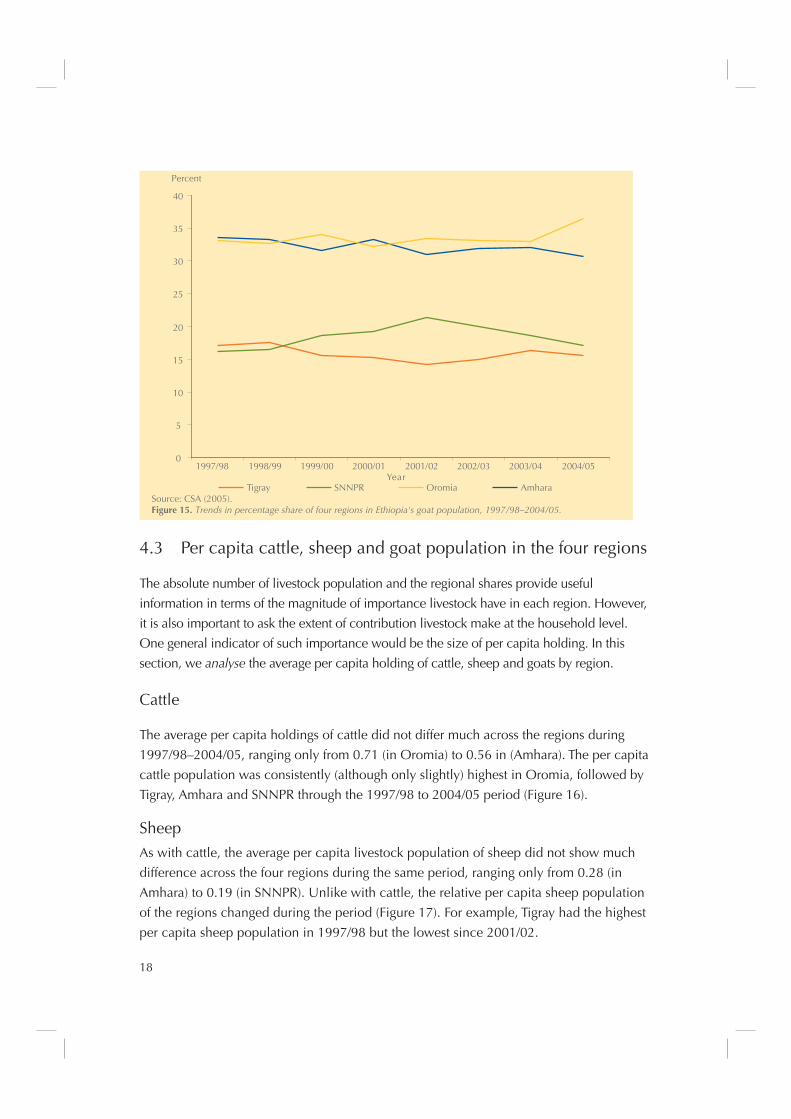
Figure 15. Trends in percentage share of four regions in Ethiopia’s goat population, 1997/98–2004/05 18
Figure 16. Trends in per capita cattle ownership in the four regions, 1997/98–2004/2005 19
Figure 17. Trends in per capita sheep ownership in the four regions, 1997/98–2004/05 19
Figure 18. Trends in per capita goat ownership in the four regions, 1997/98–2003/04 20
Figure 19. Livestock market places in Ada’a Liben, Mieso, Alaba and Dale PLWs 31
Figure 20. Livestock market places in Atsbi Wonberta, Alamata, Fogera and Metema PLWs 32
Figure 21. Export abattoirs in Ethiopia 34
vi
List of Tables
Table 1. Area and population data in surveyed pilot learning woredas 6
Table 2. Livestock population densities and per capita livestock holdings in the study woredas 7
Table 3. Important feed/fodder sources for live animal production in the study PLWs 22
Table 4. Main types of local animals as observed and/or reported by key informants 25
Table 5. Livestock markets in the PLWs 29

vii
Abstract
The current levels of contributions of the livestock subsector in Ethiopia, at either the
macro or micro level, is below potential. Policy, technological, organizational and
institutional interventions to improve the contributions of livestock to the national
economy need to be based on an understanding of the constraints and opportunities
available based on sound theoretical and empirical analysis. This rapid marketing
appraisal study is aimed at assessing the supply chains of live cattle and live shoats in
the four Ethiopian regional states of Tigray, Amhara, Oromia and the Southern Nations,
Nationalities and Peoples region (SNNPR). Livestock production in Ethiopia is based
on traditional technology and practices, and is subsistence oriented. Although efforts
are being made to introduce and promote market oriented livestock production, with
or without fattening, these efforts are miniscule compared with the size of the livestock
population and the number of household who rear them. Hence, it is important to
build on these efforts, evaluate them to learn lessons, and strengthen the extension
service to promote the market orientation among the wider farming population. In
most of the study areas, feed shortage was identifi ed as the most important constraint
to livestock production. In some of the study areas, livestock diseases were identifi ed
as most important constraint, followed by feed shortage. Potential solutions to the feed
problem vary depending on the resource bases of a particular intervention area. The
relative bias of the extension service in favour of crop production has left the livestock
extension service too limited. This calls for the need to invigorate the livestock extension
service throughout the country. Especially, the development of market oriented livestock
extension service deserves serious attention. Livestock credit supply falls short of demand
in many of the study areas and some farmers complained about the periodic repayment
schedule of the livestock credit. On average, there are four livestock market places per
woreda. The primary markets in some of the Pilot Learning Woredas (PLWs) are fenced
in which the respective municipalities charge buyers and sellers tax for sold animals
upon exit. Farmers and traders in all of the study sites reported no or very little access to
formal livestock marketing information. Farmers in all PLWs depend on actual market day
information for prices and selling decisions. Livestock traders are almost exclusively male.
Key informants indicated that there are no farmer associations or cooperatives involved
in livestock marketing in the woredas, except in some areas where export abattoirs have
established livestock marketing cooperatives and unions. The reasons for selling livestock,
as reported by farmers, include the need to cover incidental cash expenses to fi ll
household food defi cit gaps, buy clothing, cover school and medical fees, cover expenses
for social events, down payment for credit and credit repayments, payment for labour for
agricultural activities, buy other animals, and to purchase crop inputs. Forced sales due
viii
to shortage of feed and water during the dry period were also widely mentioned. The sale
of male shoats dominates the sale of females. The age of shoats supplied to the markets in
the eight PLWs ranges from 1 to 2 years. The most common weight of shoats offered for
sale ranges between 15 to 25 kg live weight. In almost all PLWs livestock are transported
mainly by trekking. Farmers and traders indicated a number of problems affecting
marketing of shoats and cattle. The major ones include inadequate market places, lack of
adequate supply of good condition animals, lack of holding (concentration) places, feed
shortage, shortage of stock supply for fattening/reproduction, lack of market information
and low price due to poor body conditions.

1
1 Introduction
Ethiopia ranks fi rst in Africa and tenth in the world with respect to livestock population.
Livestock are integral components of the Ethiopian farming systems, and perform multiple
functions at different levels of aggregation. At individual smallholders’ level, livestock are
important source of food (meat and milk), cash income, services (transport and traction)
and manure (for soil fertility management and fuel). Livestock have also social and
cultural values among producers, particularly pastoralists.
The livestock subsector also provides wide and year-round employment opportunities
for surplus family labour in rural Ethiopia (MEDaC 1999). Cash income from livestock
production is especially important for the poor and landless Ethiopian households,
particularly women, as is also true in many other developing countries (Delgado et al.
1999; Thornton et al. 2002). Income from livestock production is also used for income
diversifi cation investment activities (Little et al. 2001). For the average rural farm
household with limited investment alternatives, livestock are used as store of wealth and
hedge against infl ation.
The current levels of contributions of the livestock subsector in Ethiopia, at either the
macro or micro level, is below potential. The levels of foreign exchange earnings from
livestock and livestock products is also much lower than would be expected, given the
size of the livestock population. A number of fundamental constraints underlie these
outcomes, including traditional technologies, limited supply of inputs (feed, breeding
stock, artifi cial insemination and water), poor or non-existent extension service, high
disease prevalence, poor marketing infrastructure, lack of marketing support services and
market information, limited credit services, absence of effective producers’ organizations
at the grass roots levels, and natural resources degradation.
On the other hand, Ethiopia has a suitable environment for livestock production. Its
vast grazing land area, if properly developed and managed, such as by introducing
improved forage species and cut and carry systems, could contribute signifi cantly to the
alleviation of the feed shortage problem. Its indigenous livestock breeds which have good
meat quality could increase marketable surplus if improved management practices are
used. The growing domestic demand which results from increased urbanization, higher
incomes due to economic growth, and rising population, offers signifi cant incentive for
increased market oriented livestock production. The increasing export demand for meat
and live animals in the Middle East also offers Ethiopia an opportunity to expand its
export earnings.
2
Policy, technological, organizational and institutional interventions to improve the
performance of livestock supply chains need to be based on an understanding of the
constraints and opportunities available based on sound theoretical and empirical
analysis. An assessment of the technical factors affecting livestock productivity and
production; the effectiveness of input supply, credit and extension services; producers’
sales behaviour; livestock market participants, and marketing routes and channels;
animal prices, marketing costs and margins; and marketing support services is required
to gain a comprehensive understanding of the livestock supply and marketing system. In
other words, investigation of livestock supply chains is essential to provide information
on the current operation of the chains and identify potential constraints that need to be
alleviated and opportunities that need to be utilized.
This rapid marketing appraisal study is aimed at assessing the supply chains of live
cattle and live shoats in the four Ethiopian regional states of Tigray, Amhara, Oromia
and the Southern Nations, Nationalities and Peoples region (SNNPR). This study is
part of the livestock and livestock products marketing research study initiated by the
Improving Productivity and Market Success (IPMS) of Ethiopian farmers project, a project
implemented by the International Livestock Research Institute (ILRI) on behalf of the
Ethiopian Ministry of Agriculture and Rural Development (MoARD).1
The study is aimed at generating a qualitative understanding of the livestock supply and
marketing situations in the four regions in general and in the eight Pilot Learning Woredas
(PLWs) of the IPMS project (two in each region) in particular, including identifi cation
of major actors, trade routes, market outlets, and major problems of cattle and shoats
production and marketing. This research study specifi cally attempts to identify leverage
points of intervention in the supply chain in order to realize improvements that could
benefi t smallholders. The research, it is hoped, will contribute to fi lling the knowledge
gap on marketing of live animals in Ethiopia.
The paper is organized as follows. Section two describes the method of study. Section
three presents brief descriptions of the PLWs, while section four presents analysis of the
trends in livestock population in Ethiopia. Section fi ve deals with live animals production
conditions. Section six deals with live animal production support services. Section seven
deals with market structure, while section eight presents household marketing behaviour
and price determination. Section nine concludes the paper and presents implications.
1. For more information about the IPMS Project, visit the project website: www.ipms-ethiopia.org.

3
2 Study methodology
The study was conducted in 2005/06 production year and all data and information
pertain to the same year. The research follows the rapid appraisal of value chains
approach (Holtzman 1995; Morris 1995). The study was conducted in the four Ethiopian
regional states of Tigray, Amhara, Oromia and the SNNPR, with particular focus on the
eight Pilot Learning Woredas (PLWs) (districts) of the Improving Productivity and Market
Success (IPMS) of Ethiopian farmers project (two PLWs in each region) (Figure 1).
Figure 1. IPMS Pilot Learning Woredas.
Information was collected through discussions with key informants (producers, traders
and agricultural experts) and key observants, and review of secondary literature and
analysis of available secondary data. Discussions were held with experts of the respective
woreda Offi ces of Agriculture and Rural Development (OoARD) and development agents
(DAs); staff of the woreda Offi ces of Small and Micro Enterprises, Trade and Industry
(OoSMTI) in the regions of Amhara and Tigray.
Discussions were also held at the regional level with offi cials and experts of the Bureaus
of Agriculture and Rural Development (BoARD); directors and researchers of the four
regional agricultural research institutes, namely Tigray Agricultural Research Institute
Tigray
SouthernNations
SomaliOromiya
Harari
Gambella
DireDawa
Benishangul-Gumuz
Amhara
Affar
AddisAbaba
LegendLakes
Regional States
AMHARA PLW
OROMIYA PLW
SNNPRS PLW
TIGRAY PLW
Elevationmeters ASL
High : 4517
Low : -236
0 160 320 480 64080
Kilometers
Atsbi Wenberta
Alamata
Fogera
Metema
Adaa LibenMieso
Bure
Alaba
Dale
Goma
©

4
(TARI), Amhara Region Agricultural Research Institute (ARARI), South Agricultural
Research Institute (SARI) and Oromia Agricultural Research Institute (OARI). Deliberations
were also made with offi cials of the regional Bureaus of Trade, Transport and Industry
(BoTTI), and offi cials of the regional Bureaus of Finance and Economic Development
(BoFED).
Each of the regions is constituting an agricultural marketing agency either as an
autonomous body or affi liated with the regional BoARD. Hence, discussions were made
with experts of the Tigray Agricultural Marketing Promotion Agency (TAMPA), the SNNPR
Export Products Promotion Agency (EPPA) (now renamed as South Agricultural Marketing
Agency), offi cials of the Awassa and Tigray Chambers of Commerce and Sectoral
Associations; and experts of the SNNPR and Tigray branch offi ces of the Central Statistical
Authority (CSA). Municipality employees who collect tax at market places in SNNPR
and Tigray regions provided useful information on marketing and sales conditions in the
market places.
Managers and/or staff of livestock export and meat processing businesses were useful
sources of information and ideas on the supply sources, constraints and opportunities
these businesses were facing. Accordingly, discussions and exchange of ideas were
made with managers and/or staff of the Modjo Modern Export Abattoir, Luna Export
Slaughterhouse, and Modjo Organic Export Abattoir (all located at Modjo town, Oromia
region); Helmex Export Abattoir and Elfora Debre Zeit Export Abattoir (both located at
Debre Zeit town, Oromia region); Elfora Metehara Export Abattoir (located at Metehara,
Afar Region); Elfora Melge Wondo Meat Plant Agro-industrial PLC (located in Wondo,
SNNPR); Elfora Gonder Food Processing Plant (located at Gonder, Amhara region); and
Abergelle International Livestock Development PLC (located at Mekelle, Tigray region).
Discussions with key informants were supplemented with personal observations of
livestock market places. Secondary data were collected from regional and woreda
level sources, as well as from the statistical abstracts of the Ethiopian Central Statistical
Authority (CSA).
Following the framework of supply chains and associated business development services,
the rapid appraisal study attempted to collect and analyse information on mode of
production (production technology) and production orientation (subsistence or market
oriented); livestock production support services (input supply, extension and credit);
market environment, actors and channels (market places, market access, access to
market information, livestock transportation, policy and regulatory issues, traders and
brokers, meat processors and live animal exporters, and market channels); household
live animal marketing and price determination (farmer decisions to participate in market

5
as sellers, time and frequency of sale, characteristics of animals offered for sale, price
determination), among others. Triangulation techniques were used to verify the validity
of the data and information. This report synthesizes the fi ndings of the rapid livestock
marketing appraisal in the four regions. Checklists used for the rapid appraisal study are
given in Annex 1.
6
3 Description of the case study pilot learning woredas (PLWs) (districts)
Results are based on data and information collected through rapid market appraisal
(RMA) method on live animals value chains in eight woredas (two woredas in each of the
four regions where IPMS is operational): Atsbi Wonberta and Alamata (in Tigray); Fogera
and Metema (in Amhara); Ada’a-Liben and Mieso (in Oromia) and Alaba and Dale (in
SNNPR) (see Figure 1 for distribution of the woredas). Below, we give a brief description
of each woreda with special emphasis on livestock production.
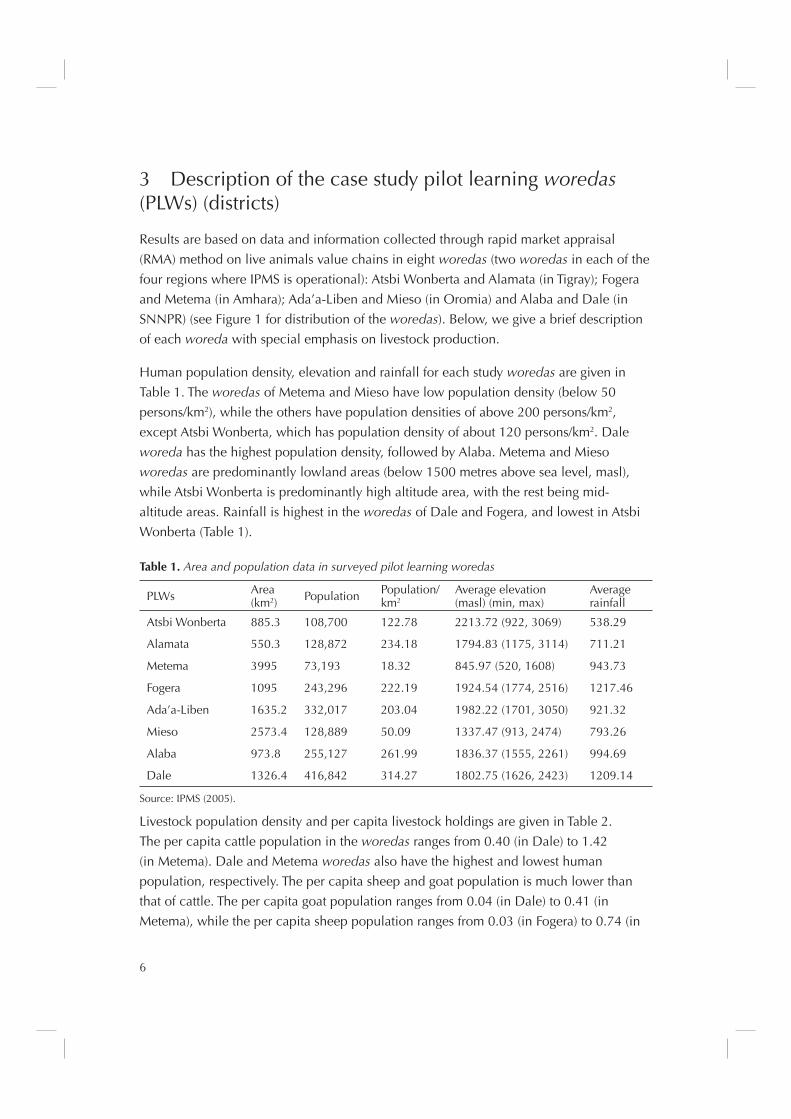
Human population density, elevation and rainfall for each study woredas are given in
Table 1. The woredas of Metema and Mieso have low population density (below 50
persons/km2), while the others have population densities of above 200 persons/km2,
except Atsbi Wonberta, which has population density of about 120 persons/km2. Dale
woreda has the highest population density, followed by Alaba. Metema and Mieso
woredas are predominantly lowland areas (below 1500 metres above sea level, masl),
while Atsbi Wonberta is predominantly high altitude area, with the rest being mid-
altitude areas. Rainfall is highest in the woredas of Dale and Fogera, and lowest in Atsbi
Wonberta (Table 1).
Table 1. Area and population data in surveyed pilot learning woredas
PLWs Area (km2) Population Population/
km2Average elevation (masl) (min, max)
Average rainfall
Atsbi Wonberta 885.3 108,700 122.78 2213.72 (922, 3069) 538.29
Alamata 550.3 128,872 234.18 1794.83 (1175, 3114) 711.21
Metema 3995 73,193 18.32 845.97 (520, 1608) 943.73
Fogera 1095 243,296 222.19 1924.54 (1774, 2516) 1217.46
Ada’a-Liben 1635.2 332,017 203.04 1982.22 (1701, 3050) 921.32
Mieso 2573.4 128,889 50.09 1337.47 (913, 2474) 793.26
Alaba 973.8 255,127 261.99 1836.37 (1555, 2261) 994.69
Dale 1326.4 416,842 314.27 1802.75 (1626, 2423) 1209.14
Source: IPMS (2005).
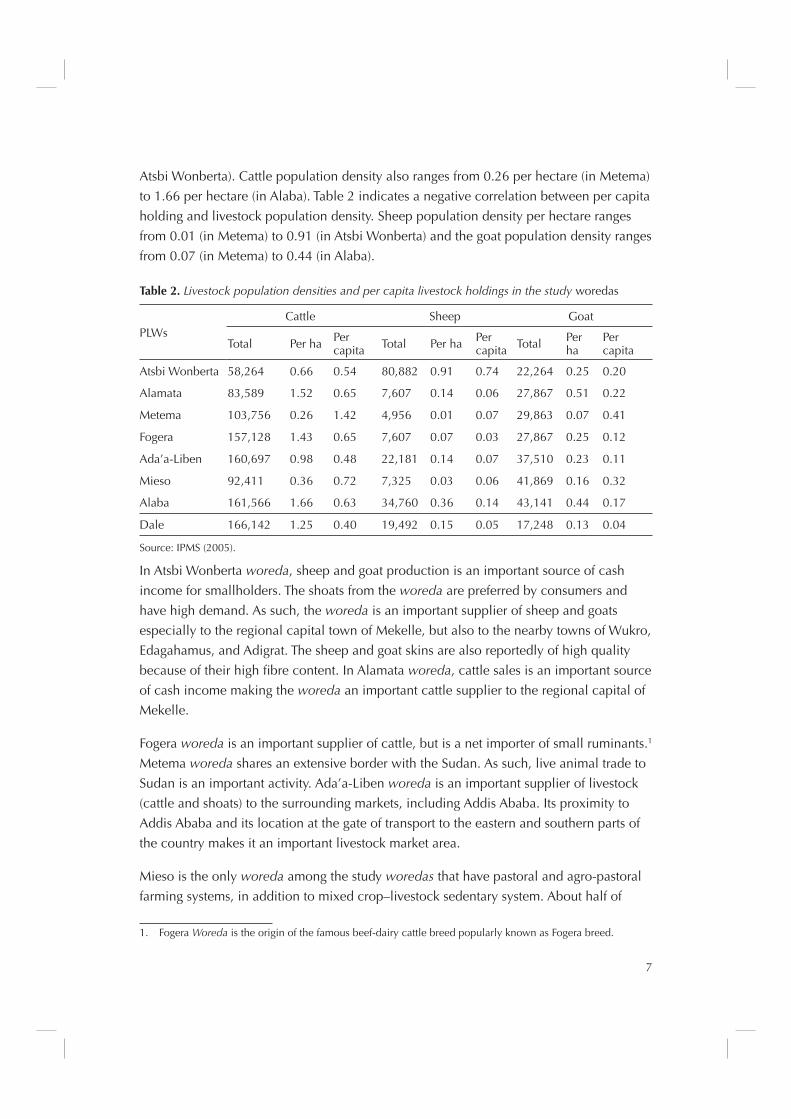
Livestock population density and per capita livestock holdings are given in Table 2.
The per capita cattle population in the woredas ranges from 0.40 (in Dale) to 1.42
(in Metema). Dale and Metema woredas also have the highest and lowest human
population, respectively. The per capita sheep and goat population is much lower than
that of cattle. The per capita goat population ranges from 0.04 (in Dale) to 0.41 (in
Metema), while the per capita sheep population ranges from 0.03 (in Fogera) to 0.74 (in
7
Atsbi Wonberta). Cattle population density also ranges from 0.26 per hectare (in Metema)
to 1.66 per hectare (in Alaba). Table 2 indicates a negative correlation between per capita
holding and livestock population density. Sheep population density per hectare ranges
from 0.01 (in Metema) to 0.91 (in Atsbi Wonberta) and the goat population density ranges
from 0.07 (in Metema) to 0.44 (in Alaba).
Table 2. Livestock population densities and per capita livestock holdings in the study woredas
PLWsCattle Sheep Goat
Total Per ha Per capita Total Per ha Per
capita Total Per ha
Per capita
Atsbi Wonberta 58,264 0.66 0.54 80,882 0.91 0.74 22,264 0.25 0.20
Alamata 83,589 1.52 0.65 7,607 0.14 0.06 27,867 0.51 0.22
Metema 103,756 0.26 1.42 4,956 0.01 0.07 29,863 0.07 0.41
Fogera 157,128 1.43 0.65 7,607 0.07 0.03 27,867 0.25 0.12
Ada’a-Liben 160,697 0.98 0.48 22,181 0.14 0.07 37,510 0.23 0.11
Mieso 92,411 0.36 0.72 7,325 0.03 0.06 41,869 0.16 0.32
Alaba 161,566 1.66 0.63 34,760 0.36 0.14 43,141 0.44 0.17
Dale 166,142 1.25 0.40 19,492 0.15 0.05 17,248 0.13 0.04
Source: IPMS (2005).
In Atsbi Wonberta woreda, sheep and goat production is an important source of cash
income for smallholders. The shoats from the woreda are preferred by consumers and
have high demand. As such, the woreda is an important supplier of sheep and goats
especially to the regional capital town of Mekelle, but also to the nearby towns of Wukro,
Edagahamus, and Adigrat. The sheep and goat skins are also reportedly of high quality
because of their high fi bre content. In Alamata woreda, cattle sales is an important source
of cash income making the woreda an important cattle supplier to the regional capital of
Mekelle.
Fogera woreda is an important supplier of cattle, but is a net importer of small ruminants.1
Metema woreda shares an extensive border with the Sudan. As such, live animal trade to
Sudan is an important activity. Ada’a-Liben woreda is an important supplier of livestock
(cattle and shoats) to the surrounding markets, including Addis Ababa. Its proximity to
Addis Ababa and its location at the gate of transport to the eastern and southern parts of
the country makes it an important livestock market area.
Mieso is the only woreda among the study woredas that have pastoral and agro-pastoral
farming systems, in addition to mixed crop–livestock sedentary system. About half of
1. Fogera Woreda is the origin of the famous beef-dairy cattle breed popularly known as Fogera breed.

8
the woreda is under pastoral and agro-pastoral system, accounting for the majority of
livestock population, while the sedentary mixed crop–livestock system accounts for
more than half of the woreda’s population. Households in this woreda derive substantial
income from the sale of live animals (shoats, cattle and camels), milk and milk products.
In terms of marketed volume, goats, cattle, sheep and camels are important in that order.
Given the low potential for crop production due to thin soils and low rainfall, livestock
production appears to have comparative advantage in the woreda. Dale woreda supplies
small ruminants to surrounding markets. Alaba woreda is an important supplier of small
ruminants to the surrounding markets and to Addis Ababa.
9
4 Trends, growth rate and shares of regions in livestock population
4.1 Trends and growth rates of livestock population in Ethiopia (1997/98–2004/05)
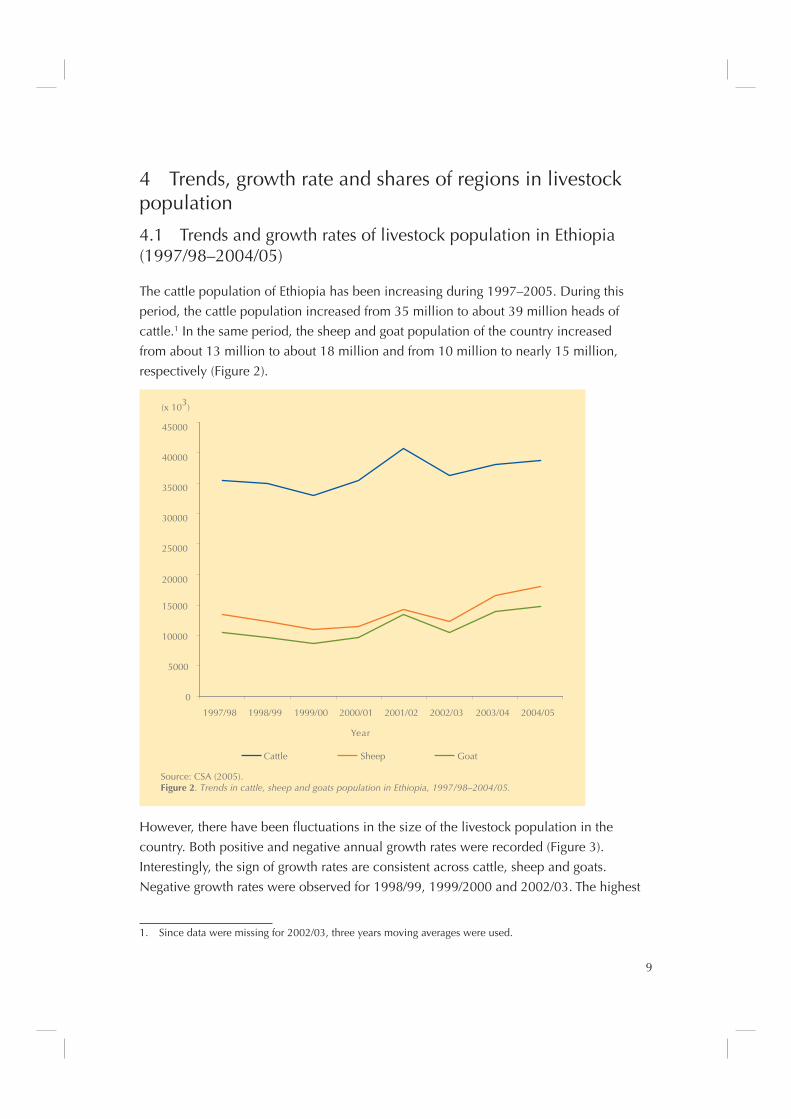
The cattle population of Ethiopia has been increasing during 1997–2005. During this
period, the cattle population increased from 35 million to about 39 million heads of
cattle.1 In the same period, the sheep and goat population of the country increased
from about 13 million to about 18 million and from 10 million to nearly 15 million,
respectively (Figure 2).
However, there have been fl uctuations in the size of the livestock population in the
country. Both positive and negative annual growth rates were recorded (Figure 3).
Interestingly, the sign of growth rates are consistent across cattle, sheep and goats.
Negative growth rates were observed for 1998/99, 1999/2000 and 2002/03. The highest
1. Since data were missing for 2002/03, three years moving averages were used.
0
5000
10000
15000
20000
25000
30000
35000
40000
45000
1997/98 1998/99 1999/00 2000/01 2001/02 2002/03 2003/04 2004/05
Year
(x 103)
Cattle Sheep Goat
Source: CSA (2005).Figure 2. Trends in cattle, sheep and goats population in Ethiopia, 1997/98–2004/05.

10
growth rate was observed for goats during 2001/02, which showed an annual growth
rate of nearly 40%, followed by sheep (25%) and cattle (15%). Rainfall was high during
2001/02. The average annual growth rates for the period were 1.6, 5.75, and 7.54% for
cattle, sheep and goats, respectively.
4.2 Trends and growth rates of livestock population by region, and share of regions
Cattle
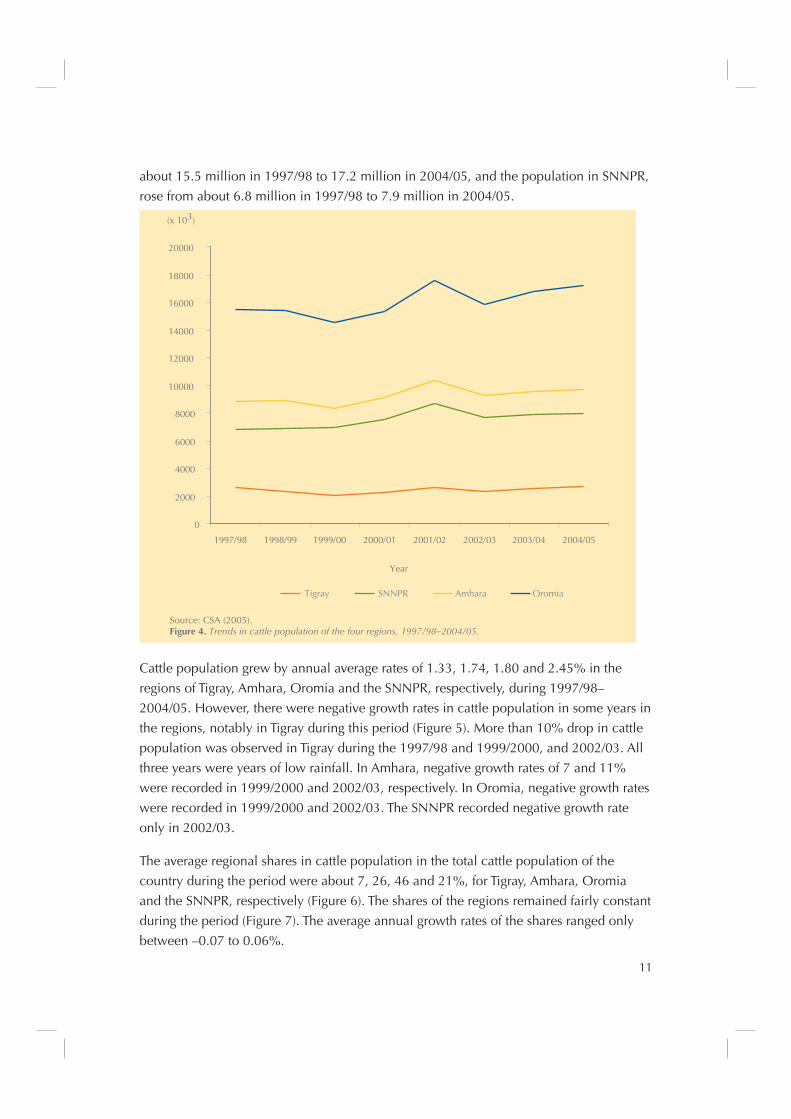
The average cattle populations for the 1997/98–2004/05 period were about 17.0 million,
9.6 million, 7.9 million and 2.6 million, for Oromia, Amhara, SNNPR and Tigray regions,
respectively. Cattle population showed an increasing trend in all regions during the
period (Figure 4). In Tigray, cattle population rose from about 2.6 million in 1997/98 to
2.7 million in 2004/05, while the population in Amhara rose from about 8.8 million in
1997/98 to 9.7 million in 2004/05. Similarly, in Oromia, the cattle population rose from
Goat Sheep Cattle
–30
–20
–10
0
10
20
30
40
50
1998/99 1999/00 2000/01 2001/02 2002/03 2003/04 2004/05
Percent
Source: CSA (2005).Figure 3. Growth rate of cattle, sheep and goats population in Ethiopia, 1998/99–2004/05.
Year
11
about 15.5 million in 1997/98 to 17.2 million in 2004/05, and the population in SNNPR,
rose from about 6.8 million in 1997/98 to 7.9 million in 2004/05.
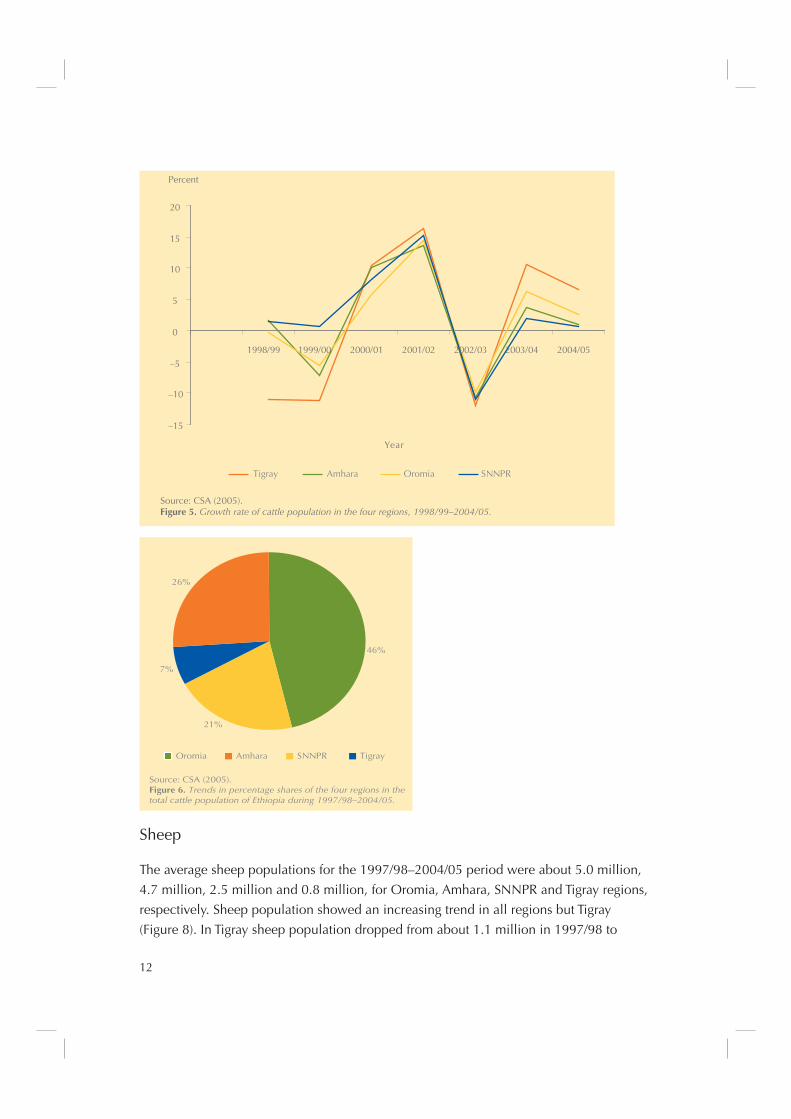
Cattle population grew by annual average rates of 1.33, 1.74, 1.80 and 2.45% in the
regions of Tigray, Amhara, Oromia and the SNNPR, respectively, during 1997/98–
2004/05. However, there were negative growth rates in cattle population in some years in
the regions, notably in Tigray during this period (Figure 5). More than 10% drop in cattle
population was observed in Tigray during the 1997/98 and 1999/2000, and 2002/03. All
three years were years of low rainfall. In Amhara, negative growth rates of 7 and 11%
were recorded in 1999/2000 and 2002/03, respectively. In Oromia, negative growth rates
were recorded in 1999/2000 and 2002/03. The SNNPR recorded negative growth rate
only in 2002/03.
The average regional shares in cattle population in the total cattle population of the
country during the period were about 7, 26, 46 and 21%, for Tigray, Amhara, Oromia
and the SNNPR, respectively (Figure 6). The shares of the regions remained fairly constant
during the period (Figure 7). The average annual growth rates of the shares ranged only
between –0.07 to 0.06%.
Source: CSA (2005).Figure 4. Trends in cattle population of the four regions, 1997/98–2004/05.
SNNPR OromiaTigray Amhara
0
2000
4000
6000
8000
10000
12000
14000
16000
18000
20000
1997/98 1998/99 1999/00 2000/01 2001/02 2002/03 2003/04 2004/05
Year
(x 103)
12
Sheep
The average sheep populations for the 1997/98–2004/05 period were about 5.0 million,
4.7 million, 2.5 million and 0.8 million, for Oromia, Amhara, SNNPR and Tigray regions,
respectively. Sheep population showed an increasing trend in all regions but Tigray
(Figure 8). In Tigray sheep population dropped from about 1.1 million in 1997/98 to
Amhara SNNPRTigray Oromia
–15
–10
–5
0
5
10
15
20
1998/99 1999/00 2000/01 2001/02 2002/03 2003/04 2004/05
Year
Percent
Source: CSA (2005).Figure 5. Growth rate of cattle population in the four regions, 1998/99–2004/05.
AmharaOromia SNNPR Tigray
46%
26%
7%
21%
Source: CSA (2005).Figure 6. Trends in percentage shares of the four regions in the total cattle population of Ethiopia during 1997/98–2004/05.

13
0.73 million in 2004/05, while in Amhara, the population rose from about 4.2 million in
1997/98 to 6.4 million in 2004/05. Similarly, sheep population rose from about 5.1 million
in 1997/98 to 6.4 million in Oromia, and from 2.1 million to 3.3 million in SNNPR.
Sheep population grew by annual average rates of –5.05, 8.46, 5.33 and 9.14% in Tigray,
Amhara, Oromia and SNNPR, respectively. Although all regions recorded negative
growth rates of sheep population in some years during the period, very high negative
growth rates were recorded in Tigray (Figure 9). Growth rates of about –18% and –33%
were recorded in Tigray in 1998/99, 1999/2000, respectively, while positive growth rates
of more than 11% were recorded in the years of 2000/01 and 2004/05, the years of high
rainfall. The fl uctuations in sheep population in Tigray is indicative of the need to look
very carefully at the reasons for the dropfall in population.
The average regional shares in sheep population in the total sheep population of the
country during the period were about 6, 36, 39 and 19% for Tigray, Amhara, Oromia
and the SNNPR, respectively (Figure 10). The share of Tigray in sheep population among
the regions dropped by an average annual growth rate of –9.11%, while the shares of
Amhara, Oromia and the SNNPR increased by annual average growth rates of 1.52, 0.13
and 2.74% (Figure 11).
SNNPR OromiaTigray Amhara
0
5
10
15
20
25
30
35
40
45
50
1997/98 1998/99 1999/00 2000/01 2001/02 2002/03 2003/04 2004/05
Year
Percent
Source: CSA (2005).Figure 7. Trends in percentage share of the four regions in the total cattle population of Ethiopia during 1997/98–2004/05.

14
Tigray Amhara OromiaSNNPRSource: CSA (2005).Figure 8. Trends in sheep population of the four regions, 1997/98–2004/05.
Year
(x 103)
0
1000
2000
3000
4000
5000
6000
7000
8000
1997/98 1998/99 1999/00 2000/01 2001/02 2002/03 2003/04 2004/05
Tigray Oromia SNNPRAmhara
Source: CSA (2005).Figure 9. Growth rate of sheep population in the four regions, 1998/99–2004/05.
1998/99 1999/00 2000/01 2001/02 2002/03 2003/04 2004/05
Year–40
–30
–20
–10
0
10
20
30
40
50
60Percent

15
Goats
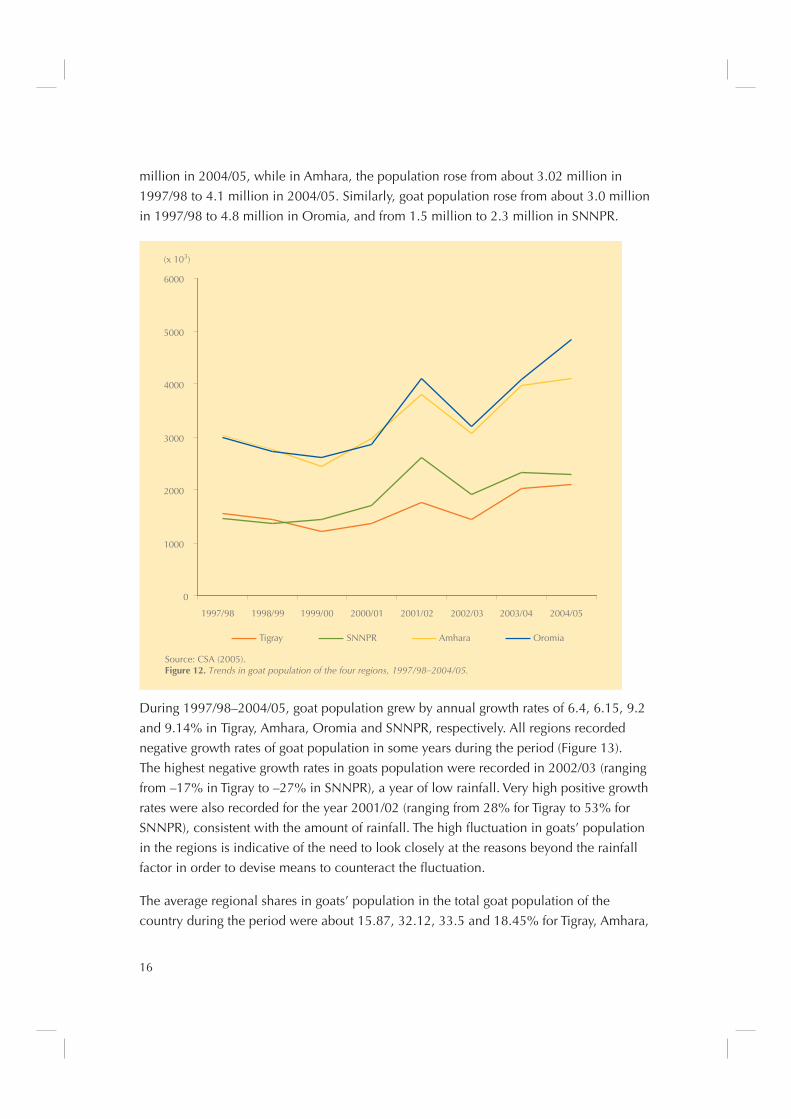
The average goat population for the 1997/98–2004/05 period were about 4.47 million,
4.04 million, 2.3 million and 2.06 million for Oromia, Amhara, SNNPR and Tigray
regions, respectively. Goat population showed an increasing trend in all regions (Figure
12). In Tigray goat population increased from about 1.54 million in 1997/98 to 2.1
2003/042002/03
Tigray Oromia SNNPRAmhara
Source: CSA (2005).Figure 11. Growth rate in share of sheep population in the four regions,1997/98–2004/05.
Percent
–40
–30
–20
–10
0
10
20
30
1998/99 1999/00 2000/01 2001/02 2004/05
Year
2004/03 2004/04
AmharaOromia SNNPR Tigray
39%
36%
6%
19%
Source: CSA (2005).Figure 10. Percentage shares of four regions in Ethiopia's sheep population, 1997/98–2004/05.
16
million in 2004/05, while in Amhara, the population rose from about 3.02 million in
1997/98 to 4.1 million in 2004/05. Similarly, goat population rose from about 3.0 million
in 1997/98 to 4.8 million in Oromia, and from 1.5 million to 2.3 million in SNNPR.
During 1997/98–2004/05, goat population grew by annual growth rates of 6.4, 6.15, 9.2
and 9.14% in Tigray, Amhara, Oromia and SNNPR, respectively. All regions recorded
negative growth rates of goat population in some years during the period (Figure 13).
The highest negative growth rates in goats population were recorded in 2002/03 (ranging
from –17% in Tigray to –27% in SNNPR), a year of low rainfall. Very high positive growth
rates were also recorded for the year 2001/02 (ranging from 28% for Tigray to 53% for
SNNPR), consistent with the amount of rainfall. The high fl uctuation in goats’ population
in the regions is indicative of the need to look closely at the reasons beyond the rainfall
factor in order to devise means to counteract the fl uctuation.
The average regional shares in goats’ population in the total goat population of the
country during the period were about 15.87, 32.12, 33.5 and 18.45% for Tigray, Amhara,
Tigray Amhara OromiaSNNPR
Source: CSA (2005).Figure 12. Trends in goat population of the four regions, 1997/98–2004/05.
0
1000
2000
3000
4000
5000
6000
1997/98 1998/99 1999/00 2000/01 2001/02 2002/03 2003/04 2004/05
(x 103)

17
Oromia and the SNNPR, respectively (Figure 14). Among cattle, sheep and goats, Tigray
has the highest share in goats’ population. In 1997/98 and 1998/99, Tigray’s share in
goats population was higher than that of the SNNPR, a condition which had been
reversed since 1999/2000. The share of Tigray and Amhara in the total goat population of
the four regions declined by an average annual rate of –1.83% and –2.0%, respectively,
during the period, while the share of Oromia and SNNPR grew by annual average rate of
2.52% and 2.06%, respectively (Figure 15).
Tigray Oromia SNNPRAmharaSource: CSA (2005).Figure 13. Growth rate of goat population in the four regions, 1997/98–2004/05.
-40
-30
-20
-10
0
10
20
30
40
50
60
1998/99 1999/00 2000/01 2001/02 2002/03 2003/04 2004/05
Year
Percent
32%
18%
34%
16%
Source: CSA (2005).Figure 14. Percentage shares of four regions in the total goat population of the four regions, 1997/98–2004/05.
Tigray Amhara Oromia SNNPR
18
4.3 Per capita cattle, sheep and goat population in the four regions
The absolute number of livestock population and the regional shares provide useful
information in terms of the magnitude of importance livestock have in each region. However,
it is also important to ask the extent of contribution livestock make at the household level.
One general indicator of such importance would be the size of per capita holding. In this
section, we analyse the average per capita holding of cattle, sheep and goats by region.
Cattle
The average per capita holdings of cattle did not differ much across the regions during
1997/98–2004/05, ranging only from 0.71 (in Oromia) to 0.56 in (Amhara). The per capita
cattle population was consistently (although only slightly) highest in Oromia, followed by
Tigray, Amhara and SNNPR through the 1997/98 to 2004/05 period (Figure 16).
SheepAs with cattle, the average per capita livestock population of sheep did not show much
difference across the four regions during the same period, ranging only from 0.28 (in
Amhara) to 0.19 (in SNNPR). Unlike with cattle, the relative per capita sheep population
of the regions changed during the period (Figure 17). For example, Tigray had the highest
per capita sheep population in 1997/98 but the lowest since 2001/02.
Tigray Oromia AmharaSNNPRSource: CSA (2005).Figure 15. Trends in percentage share of four regions in Ethiopia's goat population, 1997/98–2004/05.
0
5
10
15
20
25
30
35
40
1997/98 1998/99 1999/00 2000/01 2001/02 2002/03 2003/04 2004/05Year
Percent

19
Amhara Tigray OromiaSNNPRSource: CSA (2005).Figure 16. Trends in per capita cattle ownership in the four regions, 1997/98–2004/2005.
0
0.1
0.2
0.3
0.4
0.5
0.6
0.7
0.8
0.9
1997/98 1998/99 1999/00 2000/01 2001/02 2002/03 2003/04 2004/05Years
Number
Source: CSA (2005).Figure 17. Trends in per capita sheep ownership in the four regions, 1997/98–2004/05.
SNNPR Amhara TigrayOromia
0
0.05
0.1
0.15
0.2
0.25
0.3
0.35
0.4
1997/98 1998/99 1999/00 2000/01 2001/02 2002/03 2003/04 2004/05
Number
Years
20
Goats
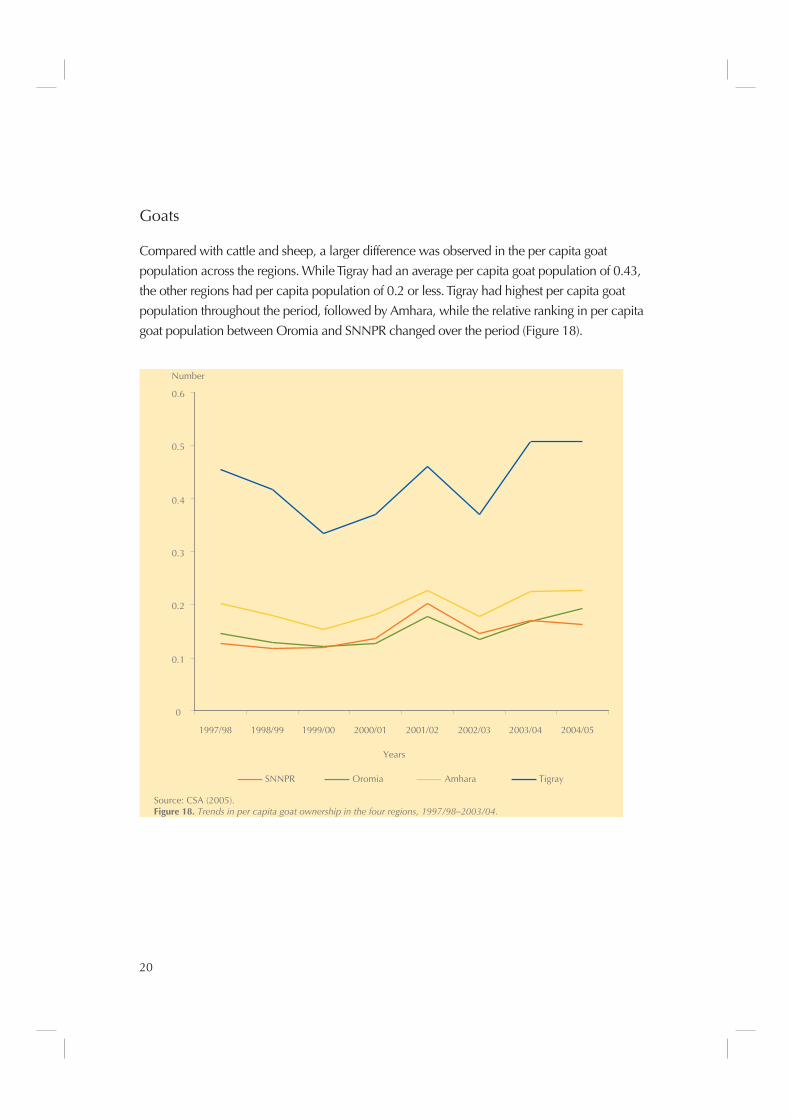
Compared with cattle and sheep, a larger difference was observed in the per capita goat
population across the regions. While Tigray had an average per capita goat population of 0.43,
the other regions had per capita population of 0.2 or less. Tigray had highest per capita goat
population throughout the period, followed by Amhara, while the relative ranking in per capita
goat population between Oromia and SNNPR changed over the period (Figure 18).
Source: CSA (2005).Figure 18. Trends in per capita goat ownership in the four regions, 1997/98–2003/04.
SNNPR Amhara TigrayOromia
0
0.1
0.2
0.3
0.4
0.5
0.6
1997/98 1998/99 1999/00 2000/01 2001/02 2002/03 2003/04 2004/05
Number
Years
21
5 Mode of live animal production, feeds and livestock diseases
The mode of live animal production in all the eight PLWs is traditional, with little or no
business orientation. Female animals are normally kept for reproduction, which also
yield some amount of dairy products. Male cattle are kept to provide draught power. Old
cattle and sterile cows are consumed or sold, usually ‘as is’, without making signifi cant
efforts to fatten them. In some areas, fattening of old bullocks and cows is traditionally
practised. Limited efforts to fatten shoats are also traditionally practised in certain areas.
In recent years efforts have been made by the various government services (OoARD,
women affairs) to promote fattening of small and large ruminants, usually in the form of
household or livestock extension packages. Most of these programs were supported by
training and credit.
Feed
Farmers in the PLWs identifi ed feed shortage as the most important production constraint,
except in Metema, Mieso, and Fogera where livestock diseases were identifi ed as the
most important constraint. For example, feed is the critical problem in Atsbi Wonberta
that hinders farmers from supplying the highly demanded sheep to the nearby markets,
including Mekelle. Similarly, in Alamata woreda, informants revealed that feed shortage
is a critical problem to increase the number of cattle offered for sale, although the
woreda is an important supplier of cattle to the Mekelle town. The feed supply problem is
not limited only to the shortage of own produced feed or naturally available feed such as
from grazing lands, but also the unavailability of feed supply for those who could afford
to buy.
Sources of animal feed supply in the PLWs include green fodder from communal and
private grazing lands; crop residues (straws, green and dry maize and sorghum stover);
aftermath grazing; grass hay and baled grass; fodder trees (e.g. Sesbania); commercial
feed supply from feed processing plants and cooperatives; and commercial by-products
such as rice bran, noug cake and molasses (Table 3). The use of feed from commercial
sources is, however, very limited.
There are differences in the availability and type of feeds used across the study woredas.
In Metema woreda, an extensive grazing land serves as feed source. As such, availability
of feed does not seem to be a critical problem. The problem, however, is lack of
proper management (utilization and conservation) of the existing feed. Due to the hot
temperature, grasses on grazing lands become too dry in the dry season and lose most of

22
their feed value. Moreover, wild fi re (sometimes fi re put on purposely) destroys a wide
area of the grazing lands. In the months of May and June, the fi rst showers induce quick
growth of grass feed with favourable infl uence on the availability of feed. Some farmers in
the woreda plant fodder trees like Sesbania using irrigation water.
Table 3. Important feed/fodder sources for live animal production in the study PLWs
PLWs Grazing areas Crop residues Commercial feed By-products
Atsbi Wonberta Communal grazing lands
Enclosure hillsides
Wheat, barley and teff
Limited Limited
Alamata Communal grazing areas Sorghum stover
Maize stover
Teff straw
Limited Limited
Metema Communal grazing lands
Uncultivated land used as grazing areas
Sorghum stover
Maize stover
Baled grass (emerg-ing in some areas)
Limited
Fogera Communal grazing lands Rice straw
Millet straw
Maize stover
Sorghum stover
Teff straw
Limited Rice bran
Noug cake
Ada’a-Liben Communal grazing lands Teff straw
Barley straw
Wheat straw
Maize stover
Baled hay
Noug cake
Feed from commercial feed producers and cooperatives
Wheat bran
Wheat shorts
Noug cake
Mieso Communal grazing lands Sorghum stover
Maize stover
Limited Limited
Alaba Communal grazing lands
Private pasture grazing
Teff straw
Wheat straw
Maize stover
Limited Limited
Dale Communal grazing lands
Backyard forage
Maize stover
Enset
Banana
Limited Limited
In Fogera, rice straw is becoming an important feed. Rice bran is also becoming an
important by-product feed.1 In Fogera woreda, an extensive grazing land is covered with
a pervasive thorny weed Asteracantha longifolia (locally known as amekela). The weed
1. The misconception by farmers that rice straw and bran reduce milk yield of cows and might lead to sterility of cows is fading away and rice production is now considered as an important source of feed. Some farmers mix the rice bran with local beer residue, commonly known as atella.

23
suppresses growth of grass forage species and prevents livestock from grazing due to its
stingy thorns. Efforts to control the weed would contribute signifi cantly to the alleviation
of the feed shortage, at least in some parts of the woreda.
Teff straw is an important feed resource in the Ada’a-Liben woreda. Ada’a-Liben woreda
also has a better commercial feed supply than any of the other study woredas. Moreover,
teff productivity is higher in the woreda which improves the availability of teff straw.
In Mieso, since the woreda is drought prone, feed shortage is an important problem
during the dry season. Interventions to promote sustainable feed supply would include an
integrated approach centred on the availability of irrigation water. Sorghum stover is an
important feed in Mieso. Interventions to improve the feed value of sorghum stover could
contribute to alleviation of the feed problem.
Communal and private pastures make substantial contribution to sheep and goat feeds in
Alaba (Tsedeke 2007). However, growing private pasture faces the problem of shortage
or lack of forage seed supply. Private forage seed supply has started recently. In addition,
tillers (tinned plants especially maize) and fi llers (crops intentionally planted on part of
crop lands or around homestead to be used as feed) are important feed sources in Alaba.
Long season sorghum is widely grown in Alamata woreda. Hence, sorghum stovers are
widely used as feed. However, farmers keep the stovers so dry that the stovers lose their
feed value signifi cantly. Interventions to improve the feed value of the sorghum stovers
could contribute signifi cantly to the alleviation of the feed problem.
Dale is a high population density woreda, and so land is very scarce. Dependence
on crop residues as feed sources does not appear to be promising. Hence, backyard
forage development integrated with the perennial crops production could offer a better
possibility. The difference in the types of feeds available, the extent of feed shortage, and
the ensuing differences in the potential solutions to alleviate feed shortage across the
study woredas is an important indication of the need for targeted and location specifi c
interventions in promoting feed development.
Livestock diseases
Livestock diseases were reported to be the most important constraints of livestock
production, followed by feed shortage, in Metema, Fogera, and Mieso PLWs.2 The
common livestock diseases identifi ed in the PLWs include sheep and goat pox, liver fl uke
2. A special study on the major livestock diseases in the PLWs has been completed and will be published separately.
24
(fasciolosis), Pasteurellosis, PPR (peste des petits ruminants), trypanosomosis, mastitis and
blood urine. In Fogera woreda, biting fl ies prevent animals from grazing during the day,
especially when temperature is high.
Trypanosomosis is identifi ed as important disease in Metema, Fogera and Dale woredas.
The Amhara BoARD has identifi ed Metema as one of the woredas in the region that are
affected by trypanosomosis. It was also reported that the biting fl ies in Fogera transmit
trypanosomosis mechanically making the disease economically important.
25
6 Livestock production support services
6.1 Input supply
Initial stock
The source of initial breeding stock for farmers in the PLWs include purchases from the
nearby markets, gifts from parents and relatives, farmer-to-farmer exchange through
bartering system, share holding, and limited supply of improved breeds from the woreda
OoARD as part of the household extension program. It is important to note that the
source of breeding stock from nearby markets also include animals brought from other
areas in particular from pastoralist areas. Examples of this can be seen in Miesso and
Alamata, where breeding animals from the Somali and Afar communities, respectively,
can be found.
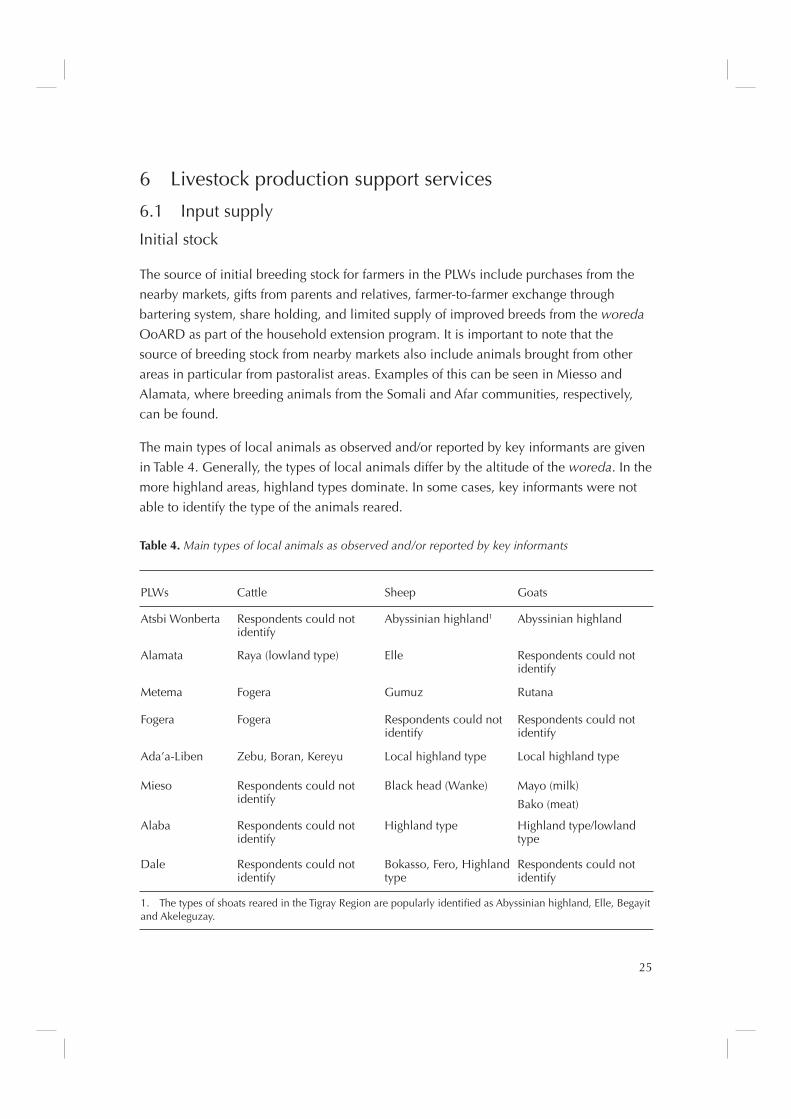
The main types of local animals as observed and/or reported by key informants are given
in Table 4. Generally, the types of local animals differ by the altitude of the woreda. In the
more highland areas, highland types dominate. In some cases, key informants were not
able to identify the type of the animals reared.
Table 4. Main types of local animals as observed and/or reported by key informants
PLWs Cattle Sheep Goats
Atsbi Wonberta Respondents could not identify
Abyssinian highland1 Abyssinian highland
Alamata Raya (lowland type) Elle Respondents could not identify
Metema Fogera Gumuz Rutana
Fogera Fogera Respondents could not identify
Respondents could not identify
Ada’a-Liben Zebu, Boran, Kereyu Local highland type Local highland type
Mieso Respondents could not identify
Black head (Wanke) Mayo (milk)
Bako (meat)
Alaba Respondents could not identify
Highland type Highland type/lowland type
Dale Respondents could not identify
Bokasso, Fero, Highland type
Respondents could not identify
1. The types of shoats reared in the Tigray Region are popularly identifi ed as Abyssinian highland, Elle, Begayit and Akeleguzay.

26
Feed supply1
Feed supply is limited in almost all the study woredas. Natural feed, commercial feed
and by-products are supplied in the PLWs in a very limited extent. Commercial feed
supply is essentially limited to the urban areas serving urban agriculture such as dairy
and fattening. Farmers sale straws, green grasses, hay, baled hay, green and dry stovers.
In some cases, traders are involved in feed market. However, there is a long way to go in
promoting and developing feed marketing in the study areas (see Table 3).
6.2 Extension services
The OoARD is the sole source of extension service in the PLWs.2 The OoARD extension
package in the woredas include animal fattening, promotion of improved forage
technologies, feed conservation practices, improved animal management (e.g. housing)
and veterinary services. It is important to note that, although there are signs of livestock
extension service in all PLWs, the coverage of the service is too limited relative to the need.
Improvements in forage development include promoting backyard forage development,
feed development on enclosures and grazing lands by planting grass and leguminous
species, and fodder trees. In addition, the extension service is involved in farmer training
on management and utilization of improved feed technologies, appropriate feeding
practices, and development of government and cooperative fodder nurseries that grow
variety of seedlings. It was reported that seedlings are distributed almost free to farmers in
some woredas, a practice that should change in order to avoid the dependency syndrome
that might arise as a result of free handout of seedlings. The extension service also
emphasizes the need to have pasture lands clean from weeds, improved animal housing
and health care.
The fattening extension program follows a similar approach in many of the PLWs.
Generally, the fattening extension package involves selection of benefi ciary farmers,
arrangement of credit supply and the provision of inputs. A peasant association (PA)
level committee, composed of woreda OoARD experts, DAs, chairperson of the PA, and
selected farmers from the PA, assists the selected farmers in purchasing animals (cattle
and shoats). Generally, the shoats fattening extension program was designed to enable
farmers to fatten and sell at least three times a year. However, we observed that in some
woredas, some farmers divert the credit to other purposes and some of them quit after
1. The IPMS project has conducted a separate study on feed marketing in the four regions of Tigray, Amhara, Oromia and SNNPR. A separate report will, therefore, be published on it.
2. In Metema, ILDP is involved in providing extension service in livestock development, especially in im-proved feed utilization and conservation, such as baling.

27
fattening only once. When asked why this was so, some farmers responded that keeping
livestock for production purposes is preferred by some households for prestige purposes.
Other problems observed with regard to the fattening extension program in the PLWs
include problems of input supply (both initial stock for fattening and feed), and lack of
livestock marketing extension services. Some farmers reported that the credit comes at a
time when there were no animals to buy for fattening.
It must be noted that although efforts are being made to introduce and promote market
oriented livestock production, these efforts are miniscule compared with the size of the
livestock population and the number of household who rear them. Hence, it is important
to build on these efforts, evaluate them to learn lessons, and strengthen the extension
service to promote the market orientation among the wider farming population.
6.3 Veterinary services
As with the extension service, veterinary services are also provided almost solely by the
woreda OoARD, and often far below the demand by farmers. For example, in Metema
PLW, where livestock diseases were mentioned as the most important constraint, only four
animal health posts staffed with animal health technicians provide veterinary services. It
was reported that the Metema woreda had plans to upgrade all animal health technicians
to animal health assistants at the diploma level through training at the agricultural technical
and vocational education and training colleges (ATVETs). Experts also indicated that
shortage of veterinary drugs is a major concern in the Metema woreda.
Similarly, the Fogera OoARD experts reported that there was serious shortage of animal
health workers to meet the demand of farmers for animal health services. In Ada’a-
Liben woreda, veterinary services are provided by woreda OoARD, the Ada’a-Liben
Dairy Cooperative and private individuals. In Mieso the Offi ce of Pastrolaists and Rural
Development (OoPRD) provides veterinary services, although the coverage is too limited.
There are only three veterinary posts in the woreda. Whenever there is livestock disease
outbreak, veterinarians positioned at the woreda capital are also called upon to provide
veterinary services in the infected areas. Some veterinary drugs are sold in the market,
a practice that might compromise the effectiveness and appropriateness of the drugs
(Fekadu 2006).
6.4 Credit supply
The sources of credit supply in the PLWs include the woredas’ OoARD and the
microfi nance institutions. It was indicated that farmers in the PLWs receive livestock
credit mainly for fattening purpose as part of livestock fattening extension program. In

28
limited cases, other sources of credit such as from projects, the women’s associations and
others were also available.
In some of the study woredas, livestock credit services were terminated or signifi cantly
reduced. For example, in Metema woreda, the OoARD used to provide credit to farmers
for fattening purpose. It was reported that the credit supply for fattening was reduced,
despite the apparent high need for credit for goat production and fattening in the woreda.
According to OoARD experts, the credit supply was terminated due to problems of
credit collection. Similarly, in Fogera woreda, although credit for fattening purposes
was provided by the OoARD, the supply was reduced. Some farmers also complained
about the repayment schedule which, according to them, does not fi t the requirements of
fattening activities, since the credit terms require periodic repayment that does not match
the fattening cycle.
Some of the PLWs require down payment for the livestock credit. For example, in Ada’a-
Liben and Alaba woredas a farmer had to contribute 25% of the purchase price as down
payment. According to the OoARD experts, down payment is required in order to implant
sense of ownership, facilitate repayment of the credit and reduce the benefi ciaries’
future repayment burden. However, farmers in the woredas complained that the amount
of credit supplied was below the purchase price of the animals and that the credit
money was released at a time when the livestock prices are higher. There seem to be
an increasing demand for credit for fattening purposes in all the study woredas. Some
farmers also reported the problem of fi nding the right animals to buy at the time when the
credit was provided.
29
7 Live animals market structure
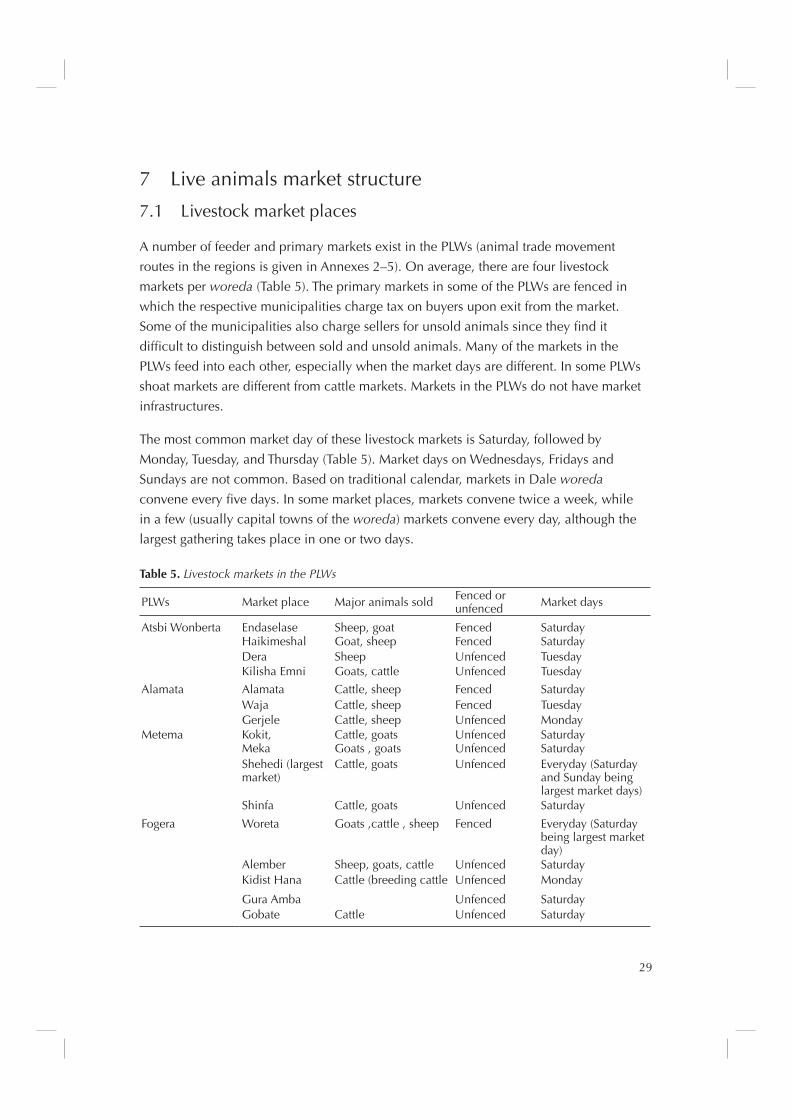
7.1 Livestock market places
A number of feeder and primary markets exist in the PLWs (animal trade movement
routes in the regions is given in Annexes 2–5). On average, there are four livestock
markets per woreda (Table 5). The primary markets in some of the PLWs are fenced in
which the respective municipalities charge tax on buyers upon exit from the market.
Some of the municipalities also charge sellers for unsold animals since they fi nd it
diffi cult to distinguish between sold and unsold animals. Many of the markets in the
PLWs feed into each other, especially when the market days are different. In some PLWs
shoat markets are different from cattle markets. Markets in the PLWs do not have market
infrastructures.
The most common market day of these livestock markets is Saturday, followed by
Monday, Tuesday, and Thursday (Table 5). Market days on Wednesdays, Fridays and
Sundays are not common. Based on traditional calendar, markets in Dale woreda
convene every fi ve days. In some market places, markets convene twice a week, while
in a few (usually capital towns of the woreda) markets convene every day, although the
largest gathering takes place in one or two days.
Table 5. Livestock markets in the PLWs
PLWs Market place Major animals sold Fenced or unfenced Market days
Atsbi Wonberta Endaselase Sheep, goat Fenced SaturdayHaikimeshal Goat, sheep Fenced SaturdayDera Sheep Unfenced TuesdayKilisha Emni Goats, cattle Unfenced Tuesday
Alamata Alamata Cattle, sheep Fenced SaturdayWaja Cattle, sheep Fenced TuesdayGerjele Cattle, sheep Unfenced Monday
Metema Kokit, Cattle, goats Unfenced SaturdayMeka Goats , goats Unfenced SaturdayShehedi (largest market)
Cattle, goats Unfenced Everyday (Saturday and Sunday being largest market days)
Shinfa Cattle, goats Unfenced Saturday
Fogera Woreta Goats ,cattle , sheep Fenced Everyday (Saturday being largest market day)
Alember Sheep, goats, cattle Unfenced SaturdayKidist Hana Cattle (breeding cattle Unfenced Monday
Gura Amba Unfenced SaturdayGobate Cattle Unfenced Saturday

30
PLWs Market place Major animals sold Fenced or unfenced Market days
Ada’a-Liben* Adulala Goats, sheep, cattle Unfenced FridayGodino Cattle, Sheep Unfenced MondayDire Cattle, goats Unfenced MondayDebre Zeit Sheep, goats Fenced Saturday
Mieso Mieso Goat ,sheep, cattle, camel
Tuesday market place is fenced. Monday market place is un-fenced
Monday and Tues-day
Asebot Cattle, goat, sheep, camel
Unfenced Thursday
Bordede Cattle, goat, sheep, camel
Unfenced Thursday
Kora Goats, sheep Unfenced MondayAlaba Kulito Sheep, goats, cattle Fenced Thursday
Kobo Goats, sheep Unfenced FridayGuba Sheep, goats Unfenced TuesdayBesheno Goats, sheep Unfenced Tuesday
Dale** Sasamodella Sheep, cattle Fenced Every fi fth dayAntete Goats, sheep Fenced Every fi fth dayBokasso Sheep, cattle, goats Fenced Every fi fth day Naramodela Sheep, cattle, goats Fenced Every fi fth day
* Ada’a-Liben woreda has been split into two. The data pertain to the situation before the split. ** Dale woreda has been split into three. The data relate to the situation before the split.
In Atsbi Wonberta, buyers in the livestock market places of Endaselase and Haikimeshal
are required to pay Ethiopian birr (ETB)1 1/shoat to the municipality upon exit from the
market place. Sellers also pay the same tax amount on unsold shoats upon exit from
the market mainly due to the problem the municipality was facing in identifying sellers
from buyers. Usually, the markets of Kilisha Emni and Haikimeshal feed into the market
at Endaselase, while sheep from Dera are directly transported to the nearby towns of
Adigrat, Wukro and Mekelle, since Dera is closer to the Mekelle–Adigrat main road
than Endaselase. Similarly, the Waja and Gerjele markets in Alamata woreda feed into
the Alamata market, although traders in the Waja and Gerjele markets also take cattle
directly to Mekelle. In Metema, a market fee of ETB) 1.5 per cattle is charged at the
Shehedi market, and the fee receipt remains valid for one month. Goats are not charged
market fees in this market. In Fogera woreda, although the Woreta livestock market is
fenced, sellers sell their animals outside of the fenced market place, apparently to avoid
paying marketing fees.
In Mieso woreda, interestingly the Monday and Tuesday market places in Mieso town are
different. While the Tuesday market place is fenced, the Monday market place is not. On
the Monday market, the Somalis are major sellers. On the Tuesday market, the Oromo
pastoralists and agro-pastoralists are the major sellers of animals. In this market, the
1 In November 2007 USD 1 = ETB 9.0864.

31
municipality collects taxes of ETB 2 per animal for shoats, ETB 10 per animal for cattle
and camel, and ETB 5 per donkey. In Alaba woreda, the Kulito town municipality collects
tax of ETB 1.5 per animal for shoats, and ETB 3 per animal for cattle or donkey. Sellers
pay the same amount of tax on unsold animals upon exit from the market place.
7.2 Distribution of livestock market places and market access
The livestock market places in each of the PLWs are distributed around the capital town
of the woreda, with the capital of the woreda serving as an important market place
(Figures 19–20). The market places are distributed in the 10–60 km radius from the
woreda capital. Some parts of a woreda are far from a market place. As such distance to
market places was reported as a major problem of market access by farmers.
Figure 19. Livestock market places in Ada’a-Liben, Mieso, Alaba and Dale PLWs.
The Ada’a-Liben PLW has good access to markets mainly due to its proximity to the Addis
Ababa market and the nature of the distribution of the market places. The good road
access in the woreda also contributes to better market access. As such, farmers in the
woreda perceived little problem of access to livestock market due to distance. Moreover,
there seems to be adequate and continuous demand for cattle and shoats in the woreda,
mainly because of the easy access of buyers to the market places. In Atsbi Wonberta
")")
")
")
")
")
")
")
")")
")
")
")
")
")
Meka
Dera
Kokit
Shenfa
Wereta
Shehedi
Alember
Guraamba
Gerijile
Kidste hana
Haik Meshal
Waja (Town)
Kilisha Emni
Endasillasie
Alamata (Town)
Legend") Market Places
Road typeAll-weather roads (asphalt)
All-weather roads (gravel)
Dry-weather roads
Motorable tracks (status uncertain)
Fogera wereda
Metema wereda
Atsbi wereda
Alamata wereda±0 50 100 150 20025
Kilometers
32
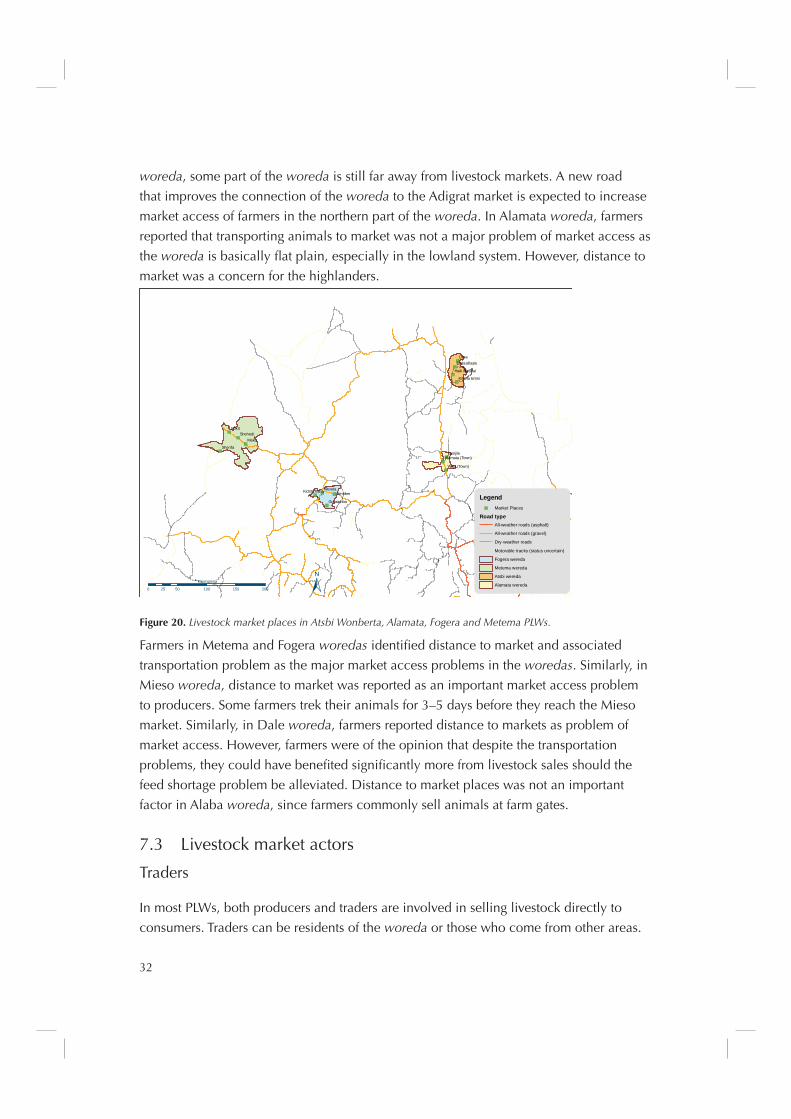
woreda, some part of the woreda is still far away from livestock markets. A new road
that improves the connection of the woreda to the Adigrat market is expected to increase
market access of farmers in the northern part of the woreda. In Alamata woreda, farmers
reported that transporting animals to market was not a major problem of market access as
the woreda is basically fl at plain, especially in the lowland system. However, distance to
market was a concern for the highlanders.
Figure 20. Livestock market places in Atsbi Wonberta, Alamata, Fogera and Metema PLWs.
Farmers in Metema and Fogera woredas identifi ed distance to market and associated
transportation problem as the major market access problems in the woredas. Similarly, in
Mieso woreda, distance to market was reported as an important market access problem
to producers. Some farmers trek their animals for 3–5 days before they reach the Mieso
market. Similarly, in Dale woreda, farmers reported distance to markets as problem of
market access. However, farmers were of the opinion that despite the transportation
problems, they could have benefi ted signifi cantly more from livestock sales should the
feed shortage problem be alleviated. Distance to market places was not an important
factor in Alaba woreda, since farmers commonly sell animals at farm gates.
7.3 Livestock market actors
Traders
In most PLWs, both producers and traders are involved in selling livestock directly to
consumers. Traders can be residents of the woreda or those who come from other areas.
")")
")
")
")
")
")
")
")")
")
")
")
")
")
Meka
Dera
Kokit
Shenfa
Wereta
Shehedi
Alember
Guraamba
Gerijile
Kidste hana
Haik Meshal
Waja (Town)
Kilisha Emni
Endasillasie
Alamata (Town)
Legend") Market Places
Road typeAll-weather roads (asphalt)
All-weather roads (gravel)
Dry-weather roads
Motorable tracks (status uncertain)
Fogera wereda
Metema wereda
Atsbi wereda
Alamata wereda±0 50 100 150 20025
Kilometers

33
Livestock traders may travel for as far as hundreds of kilometres for business. Informants
reported the involvement of brokers and commission agents in Ada’a-Liben and Mieso
PLWs. Livestock traders are almost exclusively male. Key informants indicated that
there are no farmer associations or cooperatives involved in livestock marketing in the
woredas. Every producer markets animals individually. There are no grades and standards
applied to livestock. There is little prior marketing arrangement and personalization of
exchange in the livestock market. Sellers usually sell animals to whoever offers higher
prices.
Some traders combine farming and trading while some act as both wholesalers and
retailers. As retailers, they sell directly to consumers in the nearby towns. As wholesalers,
they sell to retailers in the same towns or to those who come from outside the woredas.
Traders are usually not involved in fattening; they buy from the markets, transport the
animals and sell them in their destination market. Several traders complain about the lack
of appropriate livestock market places.
The involvement of brokers was reported to be signifi cant in Ada’a-Liben and Mieso, the
woredas where livestock purchase for export meat or live animal export purposes is also
very important. In the Ada’a-Liben markets, it was reported that brokers usually work
for the buyers, and tend to collude2 with each other in fi xing prices. The larger livestock
buyers may use several brokers in one market, the more likely they collude. Further
investigation is required to identify the positive and negative roles of brokers in the
livestock market in the woreda.
In Mieso woreda, most sales involve brokers, who usually assume the power of
negotiation on prices on behalf of producers. The brokers eliminate the direct contact
between producers and buyers. The producers usually hand over their animals to brokers
upon arrival at the market places, because producers believe that the brokers know
better about the market conditions. It appears that the brokers, especially Somali brokers,
usually have clan relationships with the producers who hand them over animals. The
brokers who have no clan relationships with producers do usually have some other
relationships with the producers. Brokers negotiate on prices with buyers and payment is
effected in cash on the spot. In the Ada’a-Liben and Mieso, the woreda OoARD experts
suggested that organizing farmers for collective marketing of cattle and small ruminants
can be an option to improve the marketing of livestock and increase benefi ts to farmers.
Normally, brokers are paid commission from sellers and buyers, amounting to ETB 2 per
animal for shoats, and ETB 10 per cattle and camels.
2. Locally, the practice of broker collusion to fi x prices is called ‘tying prices’.

34
Meat and/or live animal exporters
Six export abattoirs are currently operational in Ethiopia, viz. Elfora3 Bishoftu (located in
Bishoftu, Oromia), Elfora Melge Wondo (located in Wondo, SNNPR), Elfora Metehara
(located in Metehara, Oromia); Helmex (located in Bishoftu, Oromia); Modjo Modern
Export Abattoir (located in Modjo, Oromia); and Luna Export Abattoir (located in Modjo,
Oromia) (Figure 21 ). Three new export abattoirs are under establishment, viz. Modjo
Organic Export Abattoir (located in Modjo, Oromia); Abergelle International Livestock
Development PLC (located in Mekelle, Tigray); and Ashraf Industrial Group (located
in Bahir Dar, Amhara). The establishment of the Modjo Organic Export Abattoir is
completed, and the plant is ready for operation.
Figure 21. Export abattoirs in Ethiopia.
3. Elfora Agro-Industries PLC is a business owned by Dr Sheikh Mohamed Hussien Ali Al-Amoudi. In addition to the export abattoirs, the company has four plants that process meat for domestic sale, viz. Dire Dawa Meat Processing Plant, Gonder Food Processing Plant, Kombolcha Food Processing Plant, and Addis Meat Processing Plant. In addition to the meat and food processing plants, Elfora Agro-Industries PLC also has plants that process crop products which are located at areas known as Birr Sheleko and Chefa Robit.
!(
!(
!(
!(
!(
!(!(
!( !(
OromiyaSomali
Affar
Amhara
Tigray
Gambella
Southern Nations
Benishangul-Gumuz
Dire DawaHarari
Addis Ababa9876
5
4
3
2
1
0 170 340 510 68085
Kilometers³1 Bahir Dar ASHRAF INDUSTRIAL GROUP2 Bishoftu ELFORA3 Mekele DEJANA ENDOWMENT4 Melge Wondo ELFORA5 Metehara ELFORA6 Mojo MOJO MODERN ABATTOIR7 Mojo LUNA EXPORT ABATTOIR8 Bishoftu HELMEX9 Mojo ORGANIC

35
The export abattoirs export chilled and frozen beef, mutton and goats meat. Unlike
the other companies, Elfora is also involved in live animal export. The Elfora Bishoftu
abattoir slaughters sheep and goats for export, and cattle for domestic sale. The Elfora
Melge Wondo slaughters cattle, while the Elfora Metehara abattoir slaughters sheep,
camel and goats. The Modjo Modern Export Abattoir slaughters sheep and goat, while the
Luna Export Abattoir slaughters sheep and goat, and cattle based on demand. The newly
established export abattoirs plan to slaughter sheep, goats and cattle.
Elfora Melge Wondo has purchasing centres in the SNNPR region. Cattle (including calves)
and shoats are purchased from different areas of SNNPR, and Oromia regional state. It has
fi xed buying centres at Yabelo, Negele Borena, and Shakiso. These buying centres have a
team of buying personnel including veterinarians, and are equipped with weighing scales
since animals are purchased based on weight. Personnel of the buying centres purchase
animals brought to the buying centres by suppliers (traders, cooperatives or farmers) or
they travel to market areas (e.g. Bale, Moyale) to purchase animals on market days. It
was reported that there are four farmer cooperatives in Negele Borena area who supply
animals to the plant. The cooperatives purchase cattle and shoats and supply them to the
company’s purchasing centres. But their scale of operation is limited. Elfora Debre Zeit
Abattoir purchases animals through its own buyers or contracts with traders.
Helmex export abattoir has no fi xed purchasing centre. Suppliers collect yearlings, calves
and shoats from different areas in the country and bring them to the abattoir. The supply
of animals to Helmex comes from Oromia (Negele Borena, Yabelo, Arsi, Harar, Metehara,
Shewa, Gindebert, Ambo); Somali region; and Arbaminich and Sodo in the SNNP region.
Some animals are bought from Wello area in the Amhara region.
Luna Export Abattoir has its own purchasing centres in different places for different
types of animals. Bale and Ginir goats with good body condition were reported to be
most preferred by the abattoir, as the meat does not turn black in the process of storage.
Moreover, it was reported that shoats from Ogaden, Babile, Borena, Yabelo, Konso,
Wolayita, Afar, Wello, and Shaula are also preferred. With regard to camels, it was
reported that the Ginir type is most preferred. Generally, it was noted that meat from
goats with long horn is more liable for meat discoloration. Luna Export abattoir has
organized primary cooperatives and a union in Yabelo, which supply animals to the fi rm’s
purchasing points at negotiated prices.
According to key informants, the formation of cooperatives and union has the benefi ts
of reducing excessive price fl uctuations, and may increase benefi ts to farmers. It was
reported that there has so far been good working relationship between the abattoir and
the farmers cooperatives and the union. The abattoir arranges for the producers to visit

36
the abattoir to create appreciation of the process and thereby encourage them to increase
production and supply of animals. The cooperatives or union supply animals from their
own production and some times they also buy animals from others and supply to the
local purchasers. The shoats, especially goats, must be of weight between 14 and 25
kg and non-castrated. Any trader or producer can supply animals by bringing to the
slaughterhouse, as well.
The Abergele International Livestock Development PLC, located in Tigray region, is
a company intended to develop competence in processing and exporting meat, live
animals and other livestock products to the international market. It plans to be involved
in both live cattle and small ruminants export, and beef and small ruminant meat
processing and export. The company is working to establish a slaughter house in Tigray, to
be located near Mekelle, the regional capital.
7.4 Livestock transportation
In almost all PLWs livestock are transported mainly by trekking. The trekking cost per
head of cattle or shoat depends upon the distance travelled. In some PLWs, traders use
trucks to transport shoat to outside the woredas. In most cases, traders prefer trekking
their animals as it is cheaper than transporting with trucks.
For example, it takes about eight days to trek cattle from Alamata to Mekelle, at a cost of
ETB 16/head (about ETB 2/day per animal), while trucks charge about ETB 60–80/head.
Hence, traders prefer to trek their animals as it is cheaper than transporting with trucks. In
Metema woreda, it costs ETB 50/cattle for trucking from Shehedi (the capital town of the
woreda) to Metema Yohannes (the export port), a distance of only about 35 km, but only
ETB 5/cattle for trekking an animal the same distance.
ISUZU tracks are mostly used for trucking animals. Traders or producers prefer to truck
fattened animals, apparently to avoid weight loss and deterioration in body conditions
during transportation. An ISUZU truck could carry 6–10 cattle. In Ada’a-Liben woreda,
key informants estimated that about 40% of the purchased cattle in the woreda are
trucked. In Mieso woreda, shoats are trucked from Mieso to Modjo, Debre Zeit and Addis
Ababa. The cost of trucking shoats from Mieso to Addis Ababa is usually ETB 700–800
per full load of an ISUZU truck, which carries about 80–120 shoats, depending on the
size of the animal. Cattle are also trucked from Mieso to Addis Ababa, at a cost of ETB
800–900 per full load of ISUZU truck, which carries about 10 heads of cattle at once.
Animals purchased in Alaba are moved to Awassa Zuria woreda, Shashemene, Hosaena
and to Addis Ababa. Shoats are trucked from Alaba to Addis Ababa on ISUZU trucks. The

37
cost of trucking amounts to ETB 800–900 per full load of ISUZU. Likewise, traders use
trucks to transport cattle from Alaba to Addis Ababa. An ISUZU truck carrying about 12
cattle charges about ETB 1000.
7.5 Availability of studies and data, and access to market information
7.5.1 Availability of studies and data
Regional Bureaus of Agriculture and Rural Development (RBoARD)
In Tigray, Oromia and SNNPR, it was found out that there was no available livestock
market studies documented in the RBoARDs. In Amhara region, market chain studies of
dairy, beef, and small ruminants had been conducted by the RBoARD, reports of which
were available at the bureau. In Dale woreda, experts of the OoARD reported that
livestock marketing studies were conducted by the Fourth Livestock Development Project.
The Tigray RBoARD had developed a schematic sketch of livestock market trade routes
within the region, and routes of livestock infl ows and outfl ows from the region. There are
also secondary databases collected at woreda level and compiled at the RBoARD. These
secondary data include prices by category of animals and volume of transaction.
In all regions, various efforts have been made by the woreda OoARD to collect market
data during market days. There are variations across woredas in the formats with which
the secondary data were collected. In most of the woredas, market data was not collected
continuously throughout the year. The market data were never transmitted back to the
farmers in any of the regions. Rather, the data would be compiled at woreda level and
transmitted to the regional BoARD.
In some of the woredas, (e.g. Alaba, Atsbi Wonberta and Alamata), in case a buyer
needs warranty on the animal bought (e.g. to ensure that it is not stolen from others), the
municipality tax collectors register the seller’s address, the colour of the animal, price and
other information about the animal on the tax receipt upon payment of extra fee. This is
said to have minimized sale of stolen animals. Such tax receipts can be used as source
of market information, although there could be selection problem since information is
recorded only for sold animals whose buyers require warranty.
Regional Offi ce of Disaster Prevention and Preparedness Commission (DPPC)
Regional DPPC offi ces are also involved in gathering information on livestock supply
and price in the regions, as part of their disaster prevention and preparedness activities.
38
For example, the Tigray regional offi ce of the Disaster Prevention and Preparedness
Commission (DPPC) was collecting data on livestock prices and supply in woredas
throughout the region. Weekly prices were collected at woreda level, and aggregate
monthly price data were sent to the regional offi ce. In addition to collecting market
data, the offi ce conducts simple analysis of relative price movements and publishes brief
reports on market trends.
7.5.2 Access to market information
Farmers and traders in all the PLWs reported none or very little access to formal livestock
marketing information, although traders may be better informed about market conditions
and prices than farmers because of their networks. Farmers in all PLWs depend on actual
market day information, or on market information obtained from relatives, friends or
neighbours for prices and selling decisions. Hence, lack of market information was found
to be a serious problem in farmer negotiation power.
7.6 Policy, regulatory and institutional aspects of livestock marketing
There were no licensing requirements for involvement in livestock trading in the regions
of Tigray, SNNPR and Oromia. Licenses for livestock trading were required in Amhara.
According to the Amhara region trade law, any business with a capital of ETB 30004 or
more should be licensed and it is very likely that the livestock traders need at least ETB
3000 to operate as livestock traders, especially cattle.5
According to OoARD experts and offi cials of the regional Bureau of Trade, Transport and
Industry (BoTTI) in the regions of Tigray, Oromia and SNNPR, the reasons given for the
absence of license requirements include the diffi culty to control the trading business as
the traders are mobile from place to place and the lack of documentation of business
records by traders. It would be interesting and useful to fi nd out if license requirements
would improve the marketing of livestock in the region. In Alamata, although there was
no license requirement at the time of the study, it was reported that license requirements
were in effect until 2001. It was not clear why the requirement was terminated.
4. According to the head of the Fogera Woreda Desk of Small and Micro Enterprises, Trade and Industry, some trading businesses need to acquire license even if the operating capital is less than ETB 3000 (e.g. grain trade). Registration is permitted for subsectors such as consumer goods retail (shops), tailors, carpenters, welders etc.
5. According to the regional law, businesses with operating capital of less than ETB 3000, only have to register. Ethiopian law stipulates that traders with less than ETB 5000 capital can operate without being licensed (they only need to be registered), while businesses operating with above this capital should be licensed. .

39
Unlike in the other three regions, the Amhara region has woreda level offi ces of Small
and Micro Enterprises, Trade and Industry that issue trade licenses6 for domestic trade.
These offi ces were established in 2004. Traders involved in livestock export are licensed
only by the Ministry of Trade and Industry. Despite the strict requirement for license in the
Amhara region, many unlicensed traders are involved in livestock trading, signifying the
diffi culty encountered in enforcing trade laws in the livestock trading business. Staff of
the Small and Micro Enterprises, Trade and Industry commented that the livestock trade
licenses did not specify the species of animals the licensed is expected to be involved
in trading, thus creating problems of controlling the traders. It would be interesting to
investigate if specifi c licenses would improve the situation.
6. In the regions of Tigray, Oromia and SNNPR such offi ces are organized only at the regional and zonal levels.

40
8 Household livestock marketing behaviour and price determination
8.1 Reasons for household selling decisions
Reasons for sale
The reasons for selling livestock, as reported by farmers, include to cover cash needs to
fi ll household food gaps, clothing, school and medical fees, social events, down payment
for credit and credit repayments, payment for labour for agricultural activities, to buy
other animals, and to purchase crop inputs. Forced sales due to shortage of feed and
water during the dry period were also widely mentioned. In some woredas, especially
Metema, fear of theft was mentioned as an important reason for selling animals. The
importance of the different reasons for selling animals differs from place to place. Below,
we discuss the reasons for selling woreda by woreda in order to highlight the relative
importance of the reasons.
Farmers in Atsbi Wonberta and Alamata woredas, apart from those involved in fattening
activities, reported that the major reason for selling small ruminants is to cover incidental
cash expenses, including expenses for buying food for the household, social events, and
credit payment. Farmers in these woredas also indicated that they sell livestock due to
drought and feed shortages during the dry season (February–June).
In Metema woreda, a major commercial crop production area, the main reasons of
farmers to sell animals are to pay for labour for agricultural activities (especially land
preparation, weeding and harvesting) and fear of theft of oxen. Animal theft is becoming
a major concern of farmers in the woreda. Selling animals to buy food is not a reason in
Metema. In Fogera woreda, cash need to meet social obligations was mentioned as the
most important reason for selling animals, while the need to fi ll food gap was considered
unimportant. In Ada’a-Liben woreda, since crop productivity, especially teff, is relatively
high, the need to sell animals to fi ll food defi cits is not an important reason except in few
lowland PAs. Key informants also reported that sometimes producers sell livestock during
dry season due to shortage of feed. Under such situations, animals’ body conditions are
poor and prices tend to be low.
In Mieso woreda, since the area is drought prone, the main reasons for selling animals
is to cover cash needs to buy food grains and to cope up with seasonal feed and water
shortages. Households also reported that they sell animals in order to replace them with
younger stock. In Dale and Alaba woredas, fi lling food gap, loan repayment and forced
sales during dry period were mentioned as the most important reasons for selling.
41
8.2 Characteristics of animals offered for sale
The animals offered for sale in the PLWs are local breeds. Introduction of improved
breeds is rare. The sale of male cattle and shoats dominates the sale of females. Female
animals are sold mostly when they are old or infertile. According to farmers, an ox is
usually used for traction starting at the age of 5 and used for traction for 5–6 years, after
which it may be sold for beef, with slight difference from area to area in the duration
bullocks are used for traction. The age of shoats supplied to the markets in the eight
PLWs ranges from 1 to 2 years. The most common weight of shoats offered for sale ranges
between 15 to 25 kg live weight. The body condition of the animals offered for sale in
most of the PLWs is mostly good. Farmers and traders estimate the age of the animals by
checking their teeth. Shoat’s body weight is also assessed by gently holding the waistline
of the animals. The colours of shoats and cattle demanded differ from woreda to woreda.
Below, we give short descriptions of the characteristics of animals sold that are specifi c to
each woreda.
In Alamata, it was reported that about 80% of the cattle sold are bullocks. Cattle offered
for sale in Alamata are predominantly brown in colour. The sheep offered for sale are
mostly light yellow in colour, while the goats are basically black with several white spots.
Sheep from the highland system are mostly hairy, while those from the lowland system
have smooth hair, as are the goats.
In Metema woreda, goats offered for sale are predominantly white or grey in colour,
while the cattle are mostly brown. According to farmers, goats of black colour are not
demanded. In Fogera, average age of cattle offered for sale was estimated to be 8–12
years, while the age of cattle sold for reproductive purposes was estimated to be 3–5
years. The dominant colour of cattle sold in Fogera is black, with some having mixed
colour (black, white and brown), while that of shoats is white, with smooth hair.
In Mieso woreda, black head Somali sheep locally known as Wanke are the major sheep
type sold. An interesting phenomena occurring in the Mieso market was that the demand
for female sheep was increasing. These female are destined for the Addis Ababa market.
It should be interesting to fi nd out why this increase in demand for female sheep was
occurring. While goats’ colour sold in Mieso is mixed dominated by brown and grey, the
sheep are mostly white with black head. Better demanded sheep in Dale woreda are light
yellow or brown in colour.

42
8.3 Time and frequency of sale
Farmers in most PLWs sell animals mostly during the holiday seasons which usually
occurs between September and December, and the month of April. Sales during the dry
season (February–June) due to feed shortage is also common. In the woredas of Metema
and Mieso, livestock sales are made more or less regularly throughout the year. However,
the peak livestock sales in Metema is during the months of June (to fi nance agricultural
labour) and December (for loan repayment). With regard to frequency of sale, farmers in
most PLWs make animal sales once or twice a year.
September is a month of the two important Ethiopian holidays (New Year and The Finding
of the True Cross) and farmers are usually in need of cash at this time to cover school
expenses for children and to fi ll household food defi cit until harvest time. As a result,
farmers sell substantial number of shoats in September, a month when the body condition
of the animals is also good and the animals can fetch better prices. Bullocks are also sold
usually after the planting season, which is usually during September and October.
In Ada’a-Liben woreda, there is usually an increase in supply of animals from farmers
during September to November, since farmers have little other alternatives of cash
income. After harvest the supply of cattle and shoats tends to decline. During May to
June, price of cattle tend to increase due to increased demand from farmers for traction.
With regard to the frequency of sale in the woreda, the majority of producers sell
animals once a year, although the frequency of sales depends on a number of household,
socioeconomic and market factors.
In Mieso woreda, sedentary farmers, pastoralists and agro-pastoralists offer their animals
for sale throughout the year. Animal conditions are better during September to December
and prices are usually higher at this time. However, the period January to April exhibits
higher number of animals offered for sale due to shortage of feed. During this time,
the sellers are mainly pastoralists and agro-pastoralists. During the rainy season (June–
August), the number of animals offered for sale decreases because households (especially
the pastoralists and agro-pastoralists) have more milk for household consumption and
feed availability improves. Fattened cattle and better conditioned shoats are usually
sold during holidays. It was reported that an average farm household in the woreda is
expected to sell 2–3 times in a year which would involve different species of animals.
Households in Dale and Alaba woredas sale animals mostly once a year and the number
sold at a time would not usually be more than one per household.

43
8.4 Price determination
On the surface, and as reported by market participants, livestock markets appear
reasonably competitive, since market power concentration is not easily visible, except in
areas where brokers are involved. Sellers trek back their animals if prices are perceived
to be too low. Prices are determined based on negotiations between seller and buyer at
the market place, except in areas where brokers are involved. In all PLWs, payment is
effected in cash on spot at the market place. However, a more rigorous analysis is needed
to establish if indeed the livestock markets are competitive enough.
The role of brokers in affecting livestock prices was controversial. Most farmers
complained about brokers’ involvement in the livestock market. Brokers are involved in
transactions and transportations of animals and obtain commission of unfi xed amount
from sellers, buyers and transporters. The brokers operate informally. Key concerns
farmers reported about brokers include: high brokerage fees, misinformation on prices
paid by buyers, siding with buyers, and hindering transaction if they were not allowed to
be involved (Tsedeke 2007). On the other hand, traders who come from distant locations
reported that they require guarantee of local brokers for any problems that may arise after
sales (e.g. stolen animals, family members disagreeing on selling the animal etc.).
In general livestock prices are affected by several factors. These include period of sale
(festival vs. non-festival periods); age, weight, colour and body condition of animals
(as infl uenced by feed availability and diseases); value of hides and skins; urgency of
household cash needs (e.g. to fi ll food gaps); role of brokers; and distance producers
travel to sell animals and the ease of trekking animals back.
8.5 Major market related problems of producers, traders and exporters
Producers, traders, exporters and agricultural experts reported a number of problems
confronting the livestock marketing system in Ethiopia. Below, we give a brief account of
the major problems.
The major problems reported by producers include lack of market information and low
price due to poor body condition during the dry periods. Interestingly, farmers also
mentioned the supply side factors as having implications for their effort to respond to
market signals, the major once being feed shortage and diseases. Moreover, farmers also
reported that the unavailability of supply of stock for reproduction is a concern in their
effort to respond to market signals. Producers involved in fattening activities reported that
shortage of stock supply for fattening; especially at the time they receive the credit is a

44
problem that the extension service and the credit institutions should think of. In Metema
woreda, theft of animals was widely mentioned as a problem. In the woredas where
brokers are involved, farmers complained that brokers misinform about the actual prices
paid by buyers, collude with each other, and serve mainly the interests of buyers. Hence,
although the brokers may be serving an important function during the exchange process,
they might be profi teering at the expense of farmers.
The major problems reported by traders include lack of adequate supply of good
condition animals, inadequate market places, lack of holding (concentration) places, feed
supply, lack of market information, and multiple taxation at checkpoints (especially when
animals are trekked or trucked through towns). Lack of effi cient vaccination services for
export was reported as a problem in Metema.
Exporters also reported a number of problems in the livestock marketing system. The
major problems include lack of adequate supply of appropriate and good quality
animals, poor marketing infrastructure, livestock diseases, lack of adequate sanitary
and phytosanitary services to support exports, long market channels (usually 3–5 stages
between producer and the abattoirs), and problems with airfreight transport services.

45
9 Conclusion and implications
Livestock production in Ethiopia is based on traditional technology and practices, and
is subsistence oriented. The extension service is beginning to introduce and promote
market oriented livestock production, mostly as part of the household extension package
program. The extension program combines credit supply, training, and technical
assistance. However, it must be noted that although efforts are being made to introduce
and promote market oriented livestock production, with or without fattening, these efforts
are miniscule compared with the size of the livestock population and the number of
household who rear them. Hence, it is important to build on these efforts, evaluate them
to learn lessons, and strengthen the extension service to promote the market orientation
among the wider farming population.
The major feed sources include green fodder from grazing lands; grass hay; straws, green
and dry maize and sorghum stover, and aftermath grazing; enset and banana leaves; and
fodder trees (e.g. Sesbania). Baled grass, commercial feed supply from feed processing
plants and cooperatives, and commercial by-products such as rice bran, seed cakes and
molasses are also used as feed. Commercial feed supply is emerging in urban parts of the
PLWs. The use of feed from commercial sources is, however, very limited. These results
imply the need for interventions to develop feed markets in Ethiopia.
In most of the study areas, feed shortage was identifi ed as the most important constraint to
livestock production. In some of the study areas, livestock diseases were identifi ed as most
important constraint. The feed shortage problem is not limited only to the unavailability
of own produced feed or naturally available feed such as from grazing lands, but also the
lack of adequate supply of feed in the market for those who could afford to buy. Hence,
alleviating the feed shortage problem stands out as critical step in promoting market
oriented livestock production in Ethiopia. Livestock diseases, ranked the second most
important constraint in most of the study areas, also need due close attention.
Potential solutions to the feed problem could vary depending on the resource bases of a
particular intervention area. In the study sites, potential interventions could include better
utilization and conservation of available feed (e.g. Metema); controlling pervasive thorny
weed Asteracantha longifolia (locally known as amekela) (e.g. Fogera); treatment of
sorghum and maize stover to improve nutritive value (e.g. Alamata, Metema and Mieso);
improving forage seed supply (all PLWs); backyard forage development and integrating
forage with perennial crops (all PLWs); and promoting collective action for grazing land
management and feed development on enclosures (e.g. Atsbi Wonberta). A proper mix of
interventions is possible in many parts of the study areas.
46
The OoARD is the sole source of extension service throughout the country. The OoARD
extension services include promoting animal fattening; promoting improved forage
technologies and feed conservation practices; improved animal management (e.g.
housing) and provision of veterinary services. Although there are signs of livestock
extension service in all PLWs, the coverage of the service is too limited relative to the
need. The relative bias in favour of crop production has left the livestock extension
service too limited. This calls for the need to invigorate the livestock extension service
throughout the country. Especially, the development of market oriented livestock
extension service deserves serious attention.
The sources of livestock credit supply include the woredas OoARD and the microfi nance
institutions. It was indicated that farmers receive credit in all the PLWs mainly for
fattening purpose as part of livestock fattening extension program. However, credit
supply falls short of demand. Some farmers complained about the periodic repayment
schedule of livestock credit which, according to them, is not consistent with the fattening
cycle. The assessment of the livestock credit service indicates the need to increase credit
supply and adjust the terms and conditions of credit to the production characteristics of
livestock.
A number of feeder and primary markets exist in the PLWs. On average, there are four
livestock market places per woreda. The primary markets in some of the PLWs are fenced
in which the respective municipalities charge buyers and sellers tax for sold animals upon
exit. Some of the municipalities also charge sellers for unsold animals since they fi nd it
diffi cult to distinguish between sold and unsold animals. In some PLWs shoat markets
are different from cattle markets. Markets in the PLWs do not have market infrastructures.
Livestock marketing infrastructural development needs to be considered on a case by
case basis depending on the importance of livestock in each woreda.
There are no license requirements for involvement in livestock trading in Tigray, Oromia
and SNNPR. In Amhara region license is required to involve in livestock trading business,
although enforcement of the law has not been easy. Further investigation is needed to
determine whether licensing requirements will improve livestock marketing and to fi nd
means of better enforcement of license requirements.
Farmers and traders in all of the study sites reported no or very little access to formal
livestock marketing information, although traders may be better informed about market
conditions and prices than farmers. In most of the PLWs the OoARD collects livestock
market information which rarely gets disseminated to the producers or traders. Farmers
in all PLWs depend on actual market day information for prices and selling decisions.
Farmers identifi ed distance to market, transportation problem and feed shortage as major
47
problems of access to livestock markets. These results imply the need to develop an
appropriate livestock market information service which could serve the needs of farmers
and traders, and market place development or facilitation of linkages of farmers to
profi table markets.
Both producers and traders are involved in selling livestock directly to consumers. Traders
can be residents of the particular woreda or who come from other areas for business.
In some areas (e.g. Ada’a-Liben, Mieso and Alaba) brokers and commission agents are
involved in livestock marketing. The role of brokers and commission agents is becoming
controversial, with farmers complaining that brokers collude to fi x price and work in
favour of buyers. Further investigation is required to identify the positive and negative
roles of brokers in the livestock market in the woreda, and their links with traders and the
export abattoirs.
Livestock traders are almost exclusively male. Key informants indicated that there are
no farmer associations or cooperatives involved in livestock marketing in the woredas,
except in some areas where export abattoirs have established livestock marketing
cooperatives and unions. Every producer markets animals individually. There are no
grades and standards applied to livestock. There is little prior marketing arrangement.
There is no personalization of exchange in the livestock market; sellers usually sell
animals to whoever offers higher prices. In all PLWs, payment is effected in cash on
spot at the market place. These results imply the need to promote collective livestock
marketing by organizing cooperatives or marketing groups. Such organizations can
increase benefi ts from economies of scale and raise the bargaining position of producers.
The reasons for selling livestock, as reported by farmers, include the need to cover
incidental cash expenses to fi ll household food defi cit gaps, buy clothing, cover school
and medical fees, cover expenses for social events, down payment for credit and credit
repayments, payment for labour for agricultural activities, buy other animals, and to
purchase crop inputs. Forced sales due to shortage of feed and water during the dry
period were also widely mentioned. The relative importance of the reasons for sale vary
from place to place. In some woredas, especially Metema, fear of theft was mentioned
as an important reason for selling animals. Most of the reasons for selling do not indicate
market orientation objectives. Hence, promoting market oriented livestock production
systems deserves close attention.
The animals offered for sale in the PLWs are local breeds. The sale of male shoats
dominates the sale of females. The age of shoats supplied to the markets in the eight
PLWs ranges from 1 to 2 years. The most common weight of shoats offered for sale ranges
between 15 to 25 kg live weight. The body condition of the animals offered for sale in

48
most of the PLWs was generally good, except during the dry period. The colours of shoats
demanded differ from woreda to woreda. Farmers in most PLWs sell animals mostly
during the holiday seasons. In the PLWs of Metema and Mieso, livestock sales are made
more or less regularly continuously throughout the year. With regard to frequency of
sale, farmers in most PLWs make animal sales once or twice a year, and usually one or
two animals per household per year. These results imply provision of information on the
requirements of buyers in the markets that are important for the producers.
In almost all PLWs livestock are transported mainly by trekking. The trekking cost per
head of cattle or shoat depends upon the distance travelled. In some PLWs, traders use
trucks to transport shoat to outside the woredas. In most cases, traders prefer trekking
their animals as it is cheaper than tracking. Trucking is preferred for fattened animals in
order to reduce weight loss and deterioration in body conditions. Further investigation is
required to determine the costs of alternative livestock transportation methods, including
costs of body weight loss, death of animals and deterioration in body conditions.
Farmers and traders indicated a number of problems affecting marketing of shoats and
cattle. The major ones include inadequate market places, lack of adequate supply of
good condition animals, lack of holding (concentration) places, feed shortage, shortage
of stock supply for fattening/reproduction, lack of market information and low price
due to poor body condition in some of the woredas. Informants also indicated theft of
animals; multiple taxations at checkpoints; disease; and lack of vaccination services affect
livestock marketing in the PLWs. All processors and exporters reported that shortage of
appropriate animals is the most important problem they are facing in their business. This
situation strongly indicates the need for the extension service to aggressively intervene on
the production side to increase off-take.
49
ReferencesCSA (Central Statistical Authority). 2005. Statistical Abstract 2005. CSA, Addis Ababa, Ethiopia.
Delgado C, Rosegrant M, Steinfeld H, Ehui S and Courbois C. 1999. Livestock to 2020: The next food revolution. Discussion Paper 28. IFPRI (International Food Policy Research Institute), Washington, DC, USA; FAO (Food and Agricultural Organization of the United Nations), Rome, Italy; and ILRI (International Livestock Research Institute), Nairobi, Kenya. 83 pp. Accessed online at http://www.ifpri.org/2020/dp/dp28.pdf.
Fekadu Wolde. 2006. Brief summary of the rapid livestock marketing survey at Meisso woreda. Haromaya University, Haromaya, Ethiopia.
Holtzman J. 1995. Rapid appraisal of commodity subsectors: The guide to developing agricultural markets and agro-enterprises. Abt Associates Inc., Bethesda, Maryland, USA.
IPMS (Improving Productivity and Market Success). 2005. IPMS PLWs diagnosis and program design. IPMS, ILRI (International Livestock Research Institute), Addis Ababa, Ethiopia. Accessed online at http://www.ipms-ethiopia.org/Pilot-Learning-Sites.
Little PD, Tegegne Teka and Alemayehu Azeze. 2001. Cross border livestock trade and food security in the Horn of Africa: An overview. A research report of the Broadening Access to Markets and Input Systems-Collaborative Research Support Program (BASIS-CRSP) and OSSREA project on cross border trade and food security in the Horn of Africa. Land Tenure Center, University of Wisconsin, Madison, Wisconsin, USA. 33 pp. Accessed online at http://www.ies.wisc.edu/ltc/live/bashorn0109a.pdf.
MEDaC (Ministry of Economic Development and Cooperation). 1999. Survey of the Ethiopian economy: A review of post-reform developments. MEDaC, Addis Ababa, Ethiopia.
Morris M. 1995. Rapid reconnaissance methods for diagnosis of sub-sector limitations: Maize in Paraguay. In: Scott G (ed), Prices, products and people: Analyzing agricultural markets in developing countries. Lynn Rienner Publishers, Boulder, USA.
Thornton PK, Kruska RL, Henninger N, Kristjanson PM, Reid RS, Atieno F, Odero AN and Ndegwa T. 2002. Mapping poverty and livestock in the developing world. ILRI (International Livestock Research Institute), Nairobi, Kenya. 124 pp. Accessed online at http://www.ilri.cgiar.org/InfoServ/Webpub/fulldocs/mappingPLDW/index.htm.
Tsedeke Kotcho Ketema. 2007. Production and marketing systems of sheep and goats in Alaba, southern Ethiopia. Msc thesis. University of Hawasa, Awasa, Ethiopia.

50
Annex 1: Checklist used for rapid appraisal of livestock marketing
1. Producers
1.1 Production orientation (subsistence, size of stock; market oriented, size of stock;
types of species marketed (sheep, goats, cattle))
1.2 Mode of production (traditional, modern)
1.3 Input supply (source, availability, quality, timing, price etc.) (source of initial stock,
breeding stock supply, fattening stock supply, feed supply, veterinary service, problems
with input supply)
1.4 Decision to sell (since when involved in selling, reasons for sale, time of sale,
frequency of sale and size of sale, place(s) of sale and why those places, types of buyers
(consumers, retailers, wholesalers, processors etc.), selection of buyers, relationship with
buyers, price determination, any prior arrangement with buyers, payment (cash or credit,
time after sale etc.), problems during exchange, market access (ease of access, problems
of access), opportunities for improved marketing and market access)
1.5 Characteristics of animals offered for sale (breed type, age, condition, sex, weight,
colour, hair, type of better demanded animals in the market (age, weight, colour,
condition, sex, hair etc.)
1.6 If market oriented (time business started, capital (other than value of animals), labour
involved (full time and casual))
1.7 Access to market information (availability, source, type of information, cost of
information, timeliness)
1.8 Credit service (need for credit, purpose(s) credit needed, availability, source,
adequacy, terms, interest, problems encountered with service, opportunities for improved
credit access)
1.9 Extension service on livestock production and marketing (source, availability,
purpose of service, quality of service, problems encountered with service, opportunities
for improved service)
1.10 Estimated cost of production
1.11 Policy and regulatory issues (taxation, regulations, other)

51
2. Assembly trading/wholesaling/retailing
2.1 Business and capital (type of business, time business started, capital (fi xed, operating),
labour employed (fulltime, casual), type of animals traded (sheep, goat, cattle))
2.2 Purchasing (place(s) of purchase, why these places; volume of purchase/year;
transportation of animals to waiting place and sale point; relationship with sellers;
characteristics of animals purchased; breed type; age; condition; sex; weight; colour;
hair; type of better demanded animals in the market (age, weight, colour etc.); prior
arrangement with sellers (e.g. contract farming, out-growers scheme etc.); purchase
price determination; payment to sellers; mode of payment (cash, credit, other); time of
payment; problems with purchasing; supply; price; regulations etc.)
2.3 Selling (place(s) of sale, why these places; volume of sale/quarter, year or other time
units; relationship with buyers; sales price determination; mode of payment from buyers
(cash, credit, other), time of payment after sale)
2.4 Market information (availability, type, cost, quality, timing)
2.5 Entry and exit conditions (entry, exit)
2.6 Characteristics of better demanded animals (breed type, age, condition, sex, weight,
colour, hair)
2.7 Problems with selling (buyers, prices, market access, regulations, other)
3. Woreda offi ce of agriculture livestock experts
3.1 Mode of production in woreda (subsistence, market oriented, if both, relative size)
3.2 Market channels
3.3 Type of animals offered for sale in woreda (cattle, sheep, goat)
3.4 Characteristics of animals offered for sale (breed type, age, condition, sex, weight,
colour, hair, type of better demanded animals in the market (age, weight, colour etc.))
3.5 Destination(s) of fi nal sale and means of transportation of animal
3.6 Any studies on livestock marketing and databases (studies, databases (price, volume
traded by type of species and category of animals))
3.7 Key traders in woreda (names, residence places, capital, address and telephone
numbers)
52
3.8 Livestock markets in woreda (name(s) of market(s); size of markets, market
infrastructure)
3.9 Livestock market regulations (license requirements and who issues licenses, taxation
and duties, other regulations)
3.10 Farmers’ selling behaviour (reason for selling, time of selling, frequency of sale)
3.11 Livestock trade route (within woreda livestock trade fl ows, infl ow of livestock to
woreda, outfl ow of livestock from woreda)
3.12 Problems of market access
3.13 Problems during exchange
3.14 Extension service to farmers (source, availability, purpose of service, problems
encountered with service, opportunities for improved service)
3.15 Credit service to farmers/traders (need for credit, purpose(s) credit needed,
availability, source, adequacy, terms, interest, problems encountered with service,
opportunities for improved credit access)
3.16 Input supply service to farmers/traders (improved breed, feed, veterinary service,
other)
3.17 Market information in woreda (availability, type, cost, quality, timing)
3.18 Market institutions in woreda (grades and standards, farmer cooperatives and
marketing groups, exchange mechanisms (e.g. auctions etc.), traders associations)
3.19 Opportunities to expand market (existing markets, new markets)
3.20 Other views related to livestock marketing
4. Regional marketing support/export agencies etc.
4.1 Willingness to be involved in the livestock market study
4.2 Previous studies on livestock marketing and data (previous studies on livestock
marketing, availability and accessibility of data (on prices, volume of transaction,
livestock population by zone or woreda etc.), key areas of study needed, other issues)

53
5. Regional Offi ce of Statistics (availability of data (on prices, volume of transaction,
livestock population etc.), accessibility of data, other issues)
6. Regional Chamber of Commerce (names and addresses of licensed livestock traders,
licensing requirements and who issues licenses, data (availability of data on prices,
volume of transaction etc.), accessibility of data)
7. Regional Bureau of Trade and Industry
7.1 Licensing requirements for livestock trade (who issues licenses, licensed traders’
names and addresses)
7.2 Data (availability, accessibility)
8. Regional Bureau of Agriculture experts
8.1 Willingness to be involved in the livestock market study
8.2 Previous studies and data (previous studies, data (on prices, volume of transaction,
livestock population etc.), availability, accessibility)
8.3 Livestock trade routes in region (livestock trade fl ows within region, infl ow of
livestock to region, outfl ow of livestock from region)
9. Regional Agricultural Research Institute
9.1 Involvement in the livestock market research
9.2 Previous studies and secondary data (previous studies, data availability and
accessibility)
10. Specialized agencies, companies, businesses in region (processors (meat factories
etc.), exporters (live animal exporters, meat exporters etc.), others)
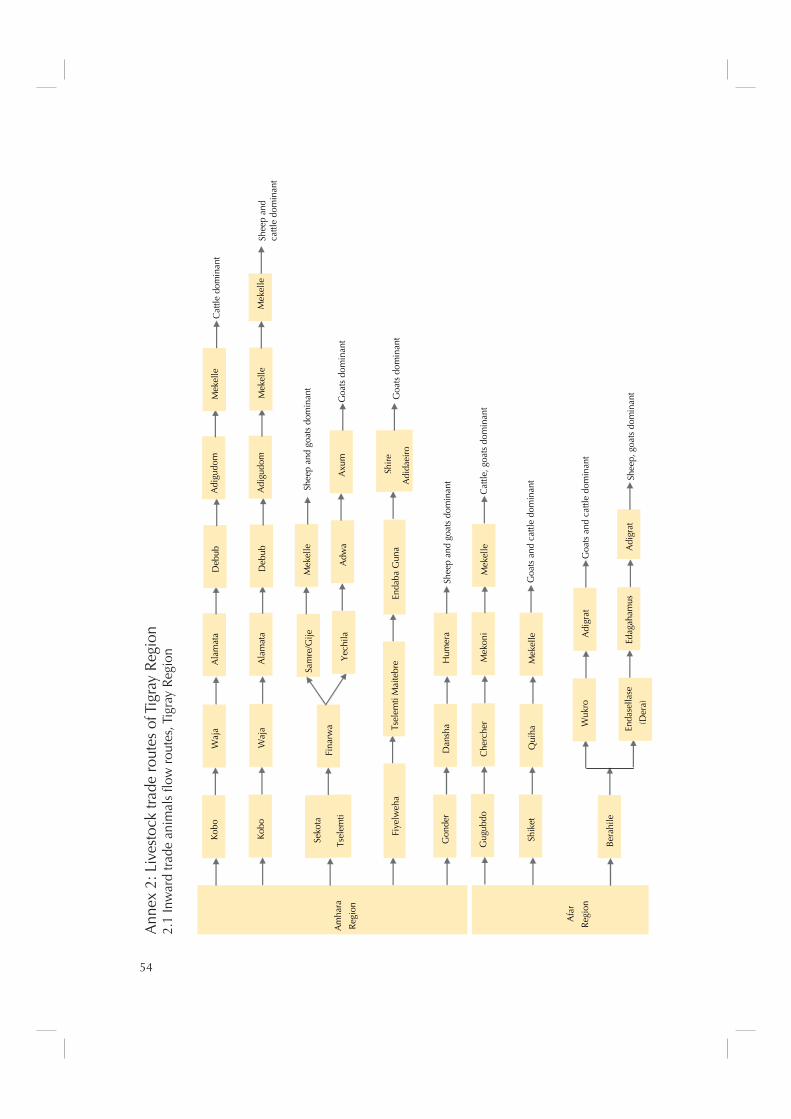
54
A
mha
ra
Regi
on
Kobo
W
aja
A
lam
ata
D
ebub
A
digu
dom
C
attle
dom
inan
t
Kobo
W
aja
A
lam
ata
D
ebub
A
digu
dom
M
ekel
le
Mek
elle
Tsel
emti
Seko
ta
Fina
rwa
Sam
re/G
ije
Yech
ila
Mek
elle
Adw
a
Axu
m
Goa
ts d
omin
ant
Fiye
lweh
a Ts
elem
ti M
aite
bre
En
daba
Gun
a
Shire
Adi
daei
roG
oats
dom
inan
t
Gon
der
D
ansh
a
Hum
era
Shee
p an
d ca
ttle
dom
inan
t
Mek
elle
Shee
p an
d go
ats
dom
inan
t
Shee
p an
d go
ats
dom
inan
t
Afa
r
Regi
on
Gug
ubdo
C
herc
her
M
ekon
i
Mek
elle
C
attle
, goa
ts d
omin
ant
Shik
et
Qui
ha
Mek
elle
Bera
hile
Wuk
ro
Adi
grat
Enda
sella
se
(Der
a)
Edag
aham
usA
digr
at
Shee
p, g
oats
dom
inan
t
Goa
ts a
nd c
attle
dom
inan
t
Goa
ts a
nd c
attle
dom
inan
t
Ann
ex 2
: Liv
esto
ck tr
ade
rout
es o
f Tig
ray
Regi
on2.
1 In
war
d tra
de a
nim
als
flow
rout
es, T
igra
y Re
gion
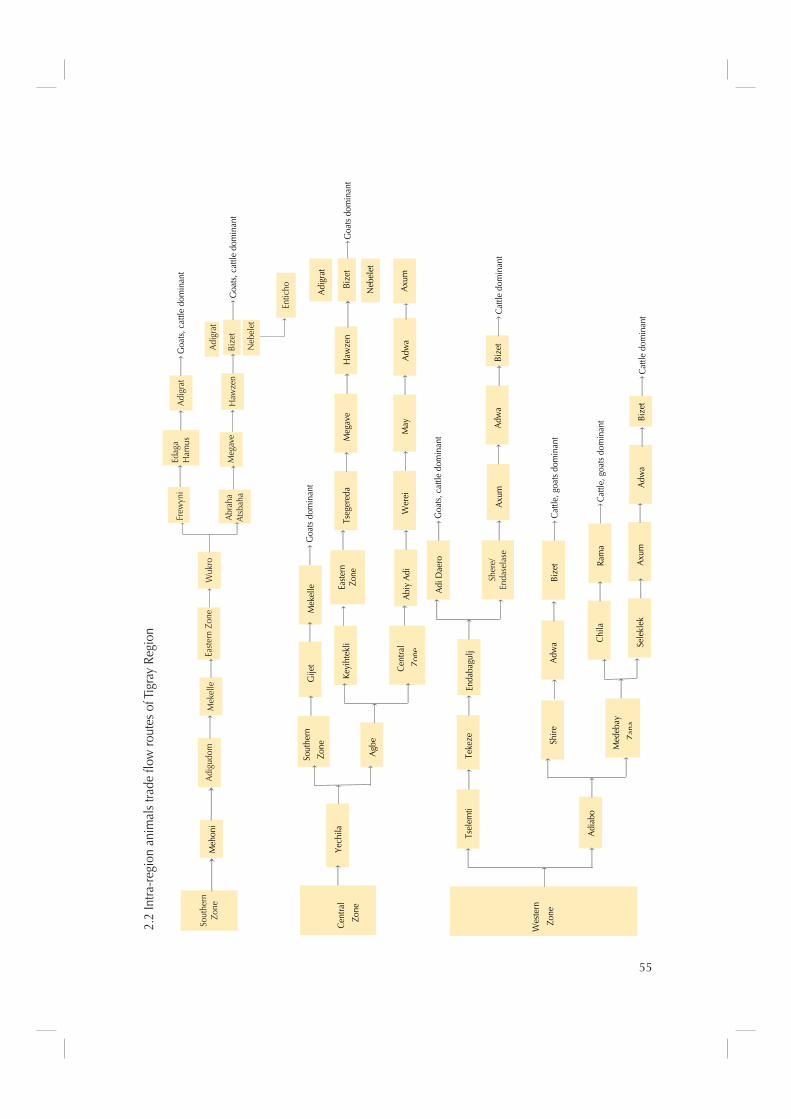
55
Cen
tral
Zone
Yech
ila
Sout
hern
Zone
Agb
e
Keyi
htek
li
Cen
tral
Zone
Abi
y A
di
Tseg
ered
a
Wer
ei
Meg
ave
May
Haw
zen
Adw
a
Bize
t
Axu
m
Neb
elet
Adi
grat
Gije
t
Mek
elle
G
oats
dom
inan
t
Goa
ts d
omin
ant
Easte
rnZo
ne
W
este
rn
Zo
ne
Tsel
emti
Te
keze
En
daba
gulj
Adi
Dae
ro
Axu
m
Adw
a
Bize
tC
attle
dom
inan
t
Goa
ts, c
attle
dom
inan
t
Adi
abo
Shire
A
dwa
Bize
t
Chi
la
Ram
a
Sele
klek
Axu
mA
dwa
Bi
zet
Cat
tle, g
oats
dom
inan
t
Cat
tle, g
oats
dom
inan
t
Med
ebay
Zana
Cat
tle d
omin
ant
Sher
e/En
dase
lase
Meh
oni
A
digr
at
Goa
ts, c
attle
dom
inan
t
Sout
hern
Zone
Abr
aha
Ats
baha
Adi
gudo
mM
ekel
leEa
ster
n Zo
neW
ukro
Frew
yni
Edag
a H
amus
Meg
ave
Adi
grat
Haw
zen
Neb
elet
Bize
t
Entic
ho
Goa
ts, c
attle
dom
inan
t
2.2
Intra
-reg
ion
anim
als
trade
flow
rout
es o
f Tig
ray
Regi
on
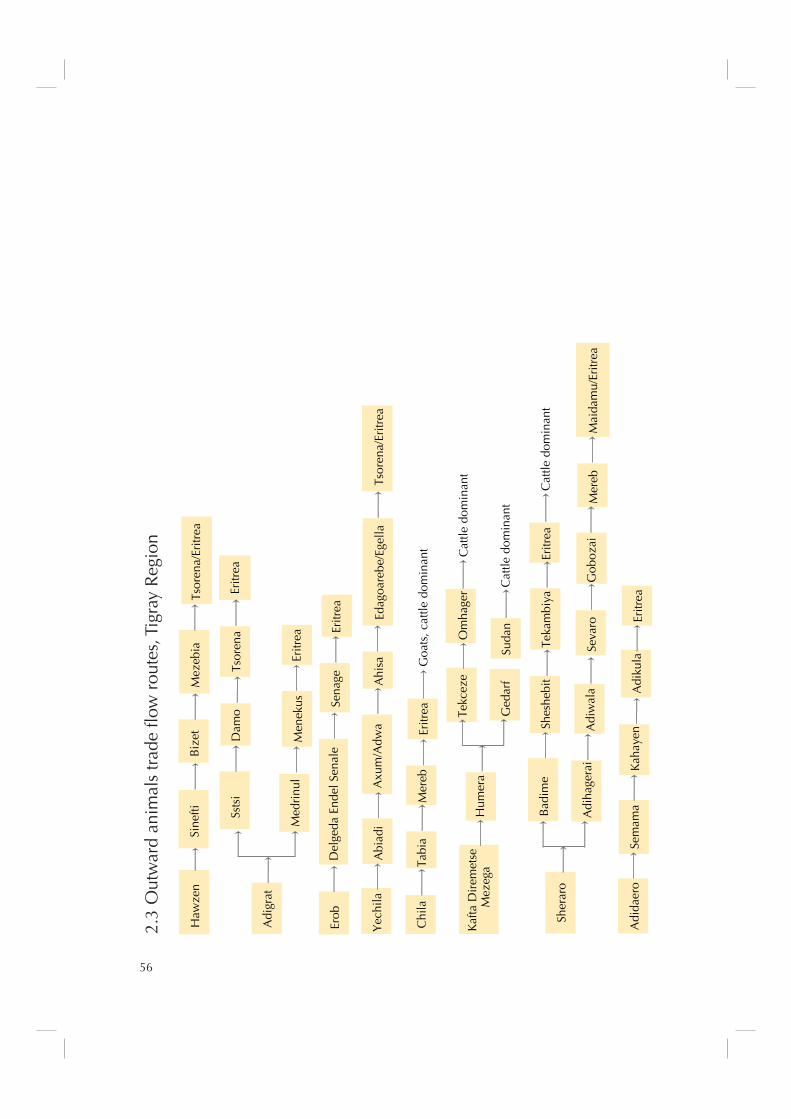
56
Adi
grat
Ssts
i
Dam
o
Tsor
ena
Med
rinu
l
Men
ekus
Er
itrea
Eritr
ea
Erob
D
elge
da E
ndel
Sen
ale
Se
nage
Er
itrea
Adi
daer
o
Sem
ama
K
ahay
en
Adi
kula
Er
itrea
Haw
zen
Si
nefti
B
izet
M
ezeb
ia
Tsor
ena/
Eritr
ea
Yec
hila
A
biad
i
Axu
m/A
dwa
Ahi
sa
Edag
oare
be/E
gella
Tsor
ena/
Eritr
ea
Chi
la
Tabi
a M
ereb
Er
itrea
Goa
ts, c
attle
dom
inan
t
K
afta
Dir
emet
se
Mez
ega
Tekc
eze
Om
hage
r
Ged
arf
Su
dan
Hum
era
C
attle
dom
inan
t
Cat
tle d
omin
ant
Sher
aro
B
adim
e
Shes
hebi
t
Teka
mbi
ya
Adi
hage
rai
A
diw
ala
Se
varo
Eritr
ea
Gob
ozai
M
ereb
M
aida
mu/
Eritr
ea
Cat
tle d
omin
ant
2.3
Out
war
d an
imal
s tr
ade
flow
rou
tes,
Tig
ray
Reg
ion

57
Wel
lega
Bur
e
Afa
rK
obo
Afa
rB
ati
Cat
tle, s
heep
Cat
tle, s
heep
Cat
tle, s
heep
Ann
ex 3
: Liv
esto
ck tr
ade
rout
es o
f Am
hara
Reg
ion
3.1
Inw
ard
anim
als
trad
e flo
w r
oute
s, A
mha
ra R
egio
n
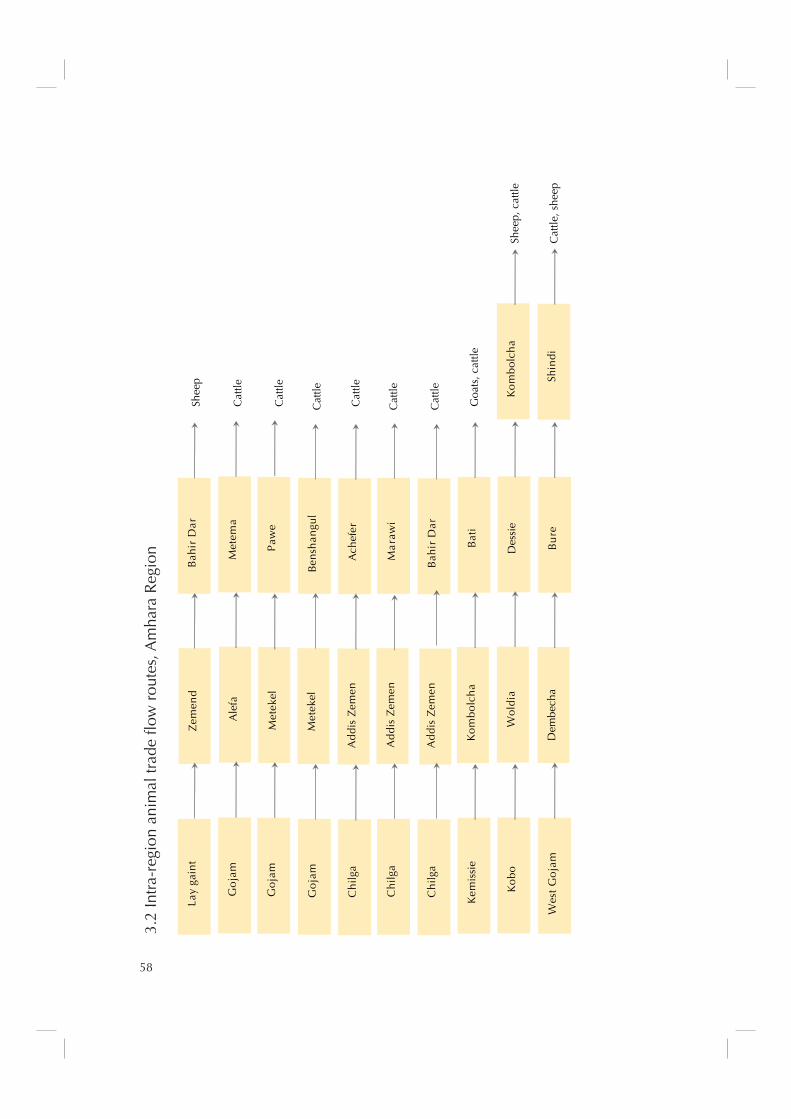
58
Go
jam
M
etek
el
Paw
e
Go
jam
M
etek
el
Ben
shan
gul
Chi
lga
A
ddi
s Z
emen
A
chef
er
Cat
tle
Cat
tle
Lay
gain
t
Zem
end
Sh
eep
Bah
ir D
ar
Go
jam
A
lefa
M
etem
a
Cat
tle
Chi
lga
A
ddi
s Z
emen
M
araw
i
Cat
tle
Chi
lga
A
ddi
s Z
emen
B
ahir
Dar
C
attle
Kem
issi
e
Ko
mbo
lch
a
Bat
i
Goa
ts, c
attle
Cat
tle
Ko
bo
Wol
dia
D
essi
e
Ko
mbo
lch
a
Shee
p, c
attle
Wes
t G
oja
m
Dem
bech
a
Bu
re
Shin
di
Cat
tle, s
heep
3.2
Intr
a-re
gion
ani
mal
trad
e flo
w r
oute
s, A
mha
ra R
egio
n

59
Met
ema
Su
dan
C
attle
Aw
i
Met
ekel
Su
dan
C
attle
Aw
i M
etek
el
Ben
shan
gul
C
attle
Kom
bolc
ha
Bat
i
Djib
outi
Sh
oats
, cat
tle
Ale
fa
Wes
t Tse
gede
Tigr
ay (D
ansh
a)
Cat
tle
Ale
fa
Sanj
a
Tigr
ay (H
umer
a)
Cat
tle
Nor
th S
hew
a
Add
is A
baba
M
araw
i
Cat
tle
Sout
h G
onde
r
Sanj
a
Wes
t Tse
gede
C
attle
Suda
n
Nor
th S
hew
a
Lay
Arm
ache
ho
Deb
ark
C
attle
Tigr
ay (A
derk
ay)
Kob
o
Tigr
ay (R
aya)
C
attle
3.3
Out
war
d an
imal
s tr
ade
flow
rou
tes,
Am
hara
Reg
ion
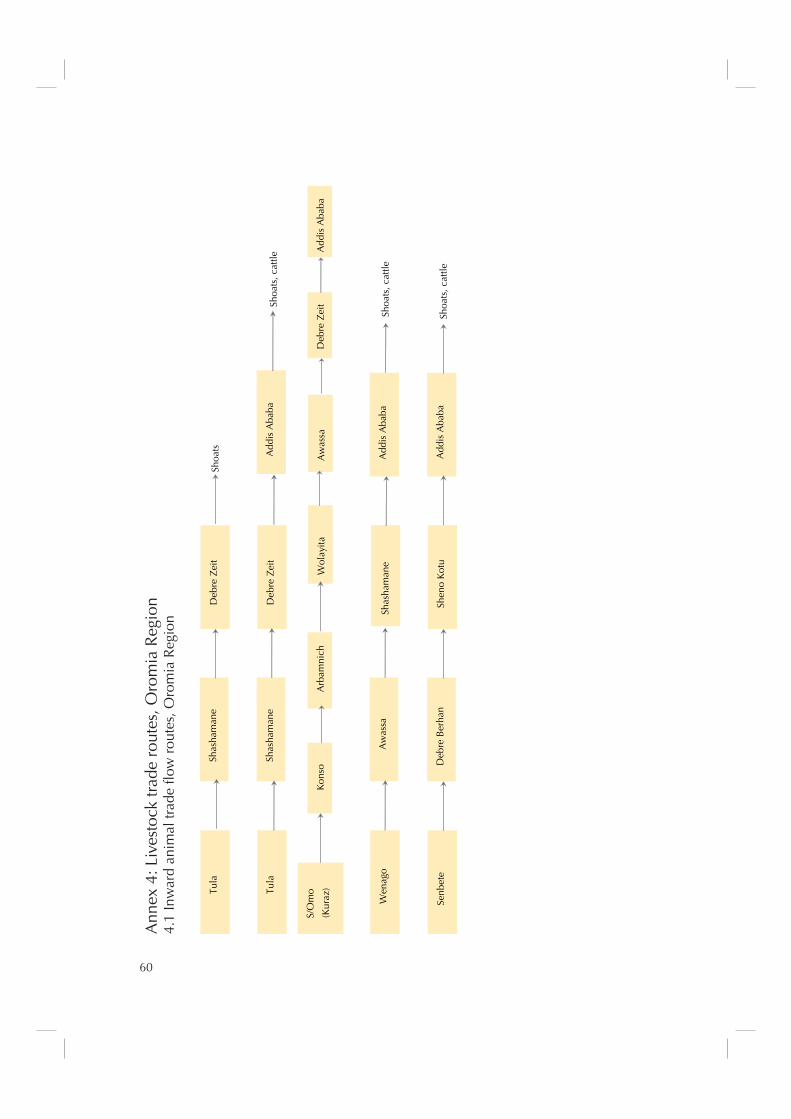
60
Tula
Sh
asha
man
e
Deb
re Z
eit
Sh
oats
Tula
Sh
asha
man
e
Deb
re Z
eit
A
ddis
Aba
ba
Shoa
ts, c
attle
Senb
ete
D
ebre
Ber
han
Sh
eno
Kot
u
Add
is A
baba
Sh
oats
, cat
tle
Wen
ago
A
was
sa
A
ddis
Aba
ba
Shoa
ts, c
attle
Shas
ham
ane
S/O
mo
(Kur
az)
A
rbam
nich
K
onso
A
was
sa
Wol
ayita
A
ddis
Aba
ba
Deb
re Z
eit
Ann
ex 4
: Liv
esto
ck tr
ade
rout
es, O
rom
ia R
egio
n4.
1 In
war
d an
imal
trad
e flo
w r
oute
s, O
rom
ia R
egio
n
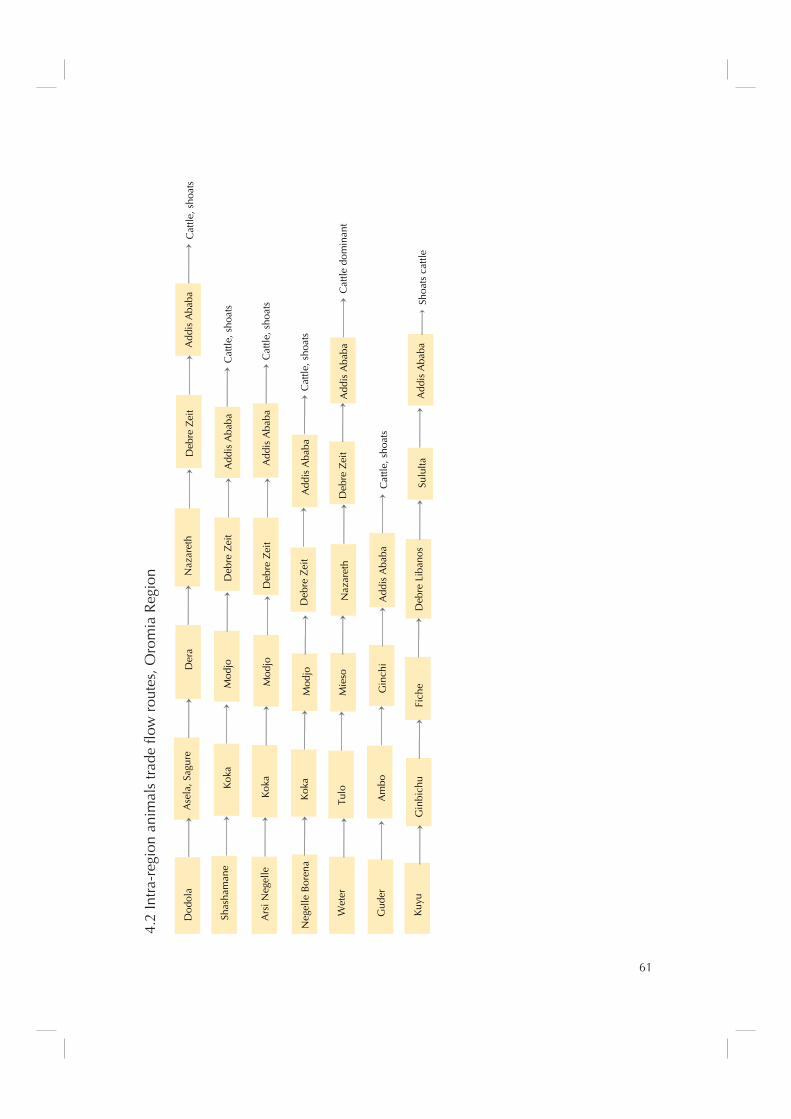
61
Shas
ham
ane
Kok
a
Mod
jo
Deb
re Z
eit
Add
is A
baba
C
attle
, sho
ats
Ars
i Neg
elle
Kok
a
Mod
jo
Deb
re Z
eit
A
ddis
Aba
ba
Cat
tle, s
hoat
s
Neg
elle
Bor
ena
Kok
a
Mod
jo
Add
is A
baba
C
attle
, sho
ats
Deb
re Z
eit
Gud
erA
mbo
G
inch
i
Add
is A
baba
Cat
tle, s
hoat
s
Kuy
u
Gin
bich
u
Fich
e
Deb
re L
iban
osSu
lulta
Add
is A
baba
Sh
oats
cat
tle
Dod
ola
D
era
D
ebre
Zei
t
Add
is A
baba
Cat
tle, s
hoat
sA
sela
, Sag
ure
Naz
aret
h
Wet
er
Tulo
M
ieso
Deb
re Z
eit
Add
is A
baba
C
attle
dom
inan
tN
azar
eth
4.2
Intr
a-re
gion
ani
mal
s tr
ade
flow
rou
tes,
Oro
mia
Reg
ion
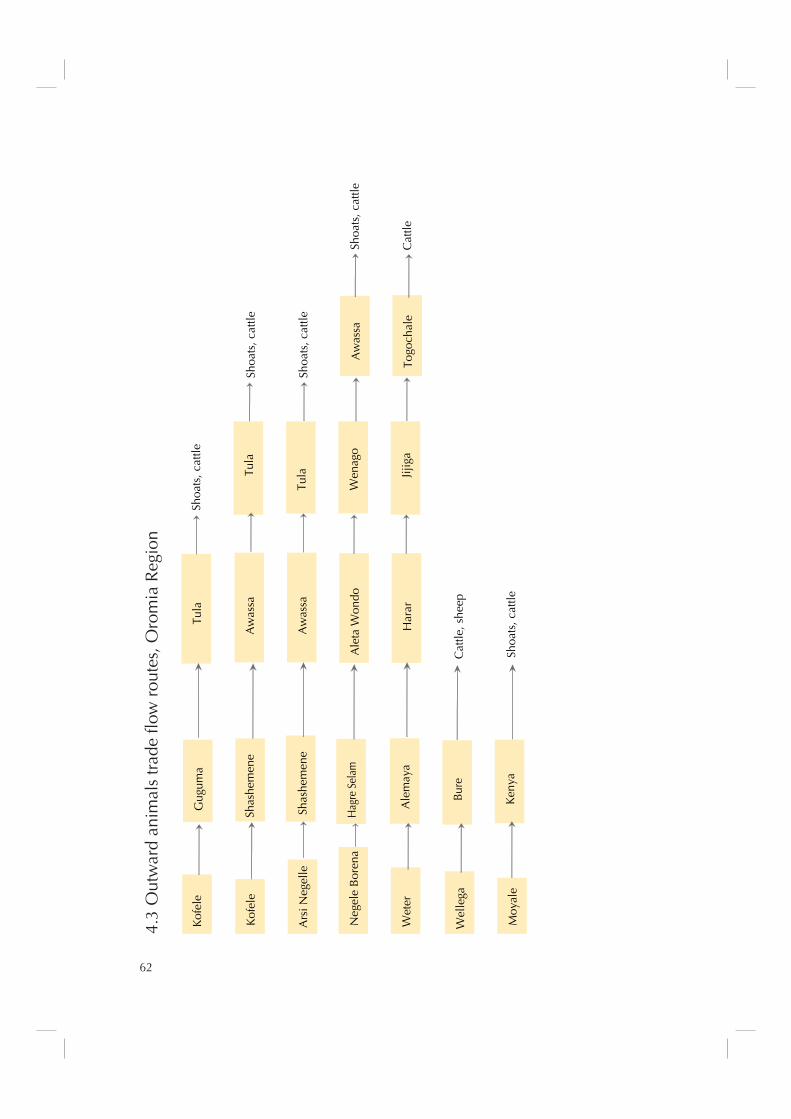
62
Wel
lega
Bu
re
Cat
tle, s
heep
Moy
ale
K
enya
Sh
oats
, cat
tle
Kof
ele
Gug
uma
Tula
Sh
oats
, cat
tle
Kof
ele
A
was
sa
Tula
Sh
oats
, cat
tleSh
ashe
men
e
Neg
ele
Bor
ena
H
agre
Sel
am
Ale
ta W
ondo
Wen
ago
A
was
sa
Shoa
ts, c
attle
Wet
erA
lem
aya
Har
ar
Jijig
a
Togo
chal
e
Cat
tle
Ars
i Neg
elle
Aw
assa
Tu
la
Shoa
ts, c
attle
Shas
hem
ene
4.3
Out
war
d an
imal
s tr
ade
flow
rou
tes,
Oro
mia
Reg
ion

63
Odo
Sha
kiso
Wen
ago
A
was
sa
Shoa
ts, c
attle
Kof
ele
G
ugum
aA
was
sa
Shoa
ts, c
attle
Tula
Ars
i Neg
ele
Sh
asha
man
e
Aw
assa
Tu
la
Shoa
ts, c
attle
Neg
ele
Bor
ena
W
enag
o
Ale
ta W
ondo
A
was
sa
Shoa
ts, c
attle
Moy
ale
Li
ben
W
enag
o
Aw
assa
Sh
oats
, cat
tle
Telte
le
Bur
ji
Arb
amin
ich
Aw
assa
Sh
oats
, cat
tle
Yab
elo
Hag
rem
aria
m
Yir
gach
efe
W
enag
oA
was
saSh
oats
, cat
tle
Ann
ex 5
: Liv
esto
ck tr
ade
rout
es, S
NN
PR5.
1 In
war
d an
imal
s tr
ade
flow
rou
tes,
SN
NPR

64
Dim
ituB
elel
aD
ale
Ale
ta W
ondo
Won
ago
Shoa
ts, c
attle
Dim
ituB
elel
aD
ale
Tula
Shoa
ts, c
attle
Dal
eA
leta
Wen
doW
enag
oSh
oats
, cat
tle
Shoa
ts A
laba
Ked
ida
Shoa
ts
Ala
baSi
rado
Shoa
ts
Ala
baSi
lte
Shoa
ts
Dal
e
Arb
egon
a
Shoa
ts, c
attle
Dal
eTu
la
Aw
assa
Shoa
ts, c
attle
Dim
itu
Bel
ela
Dal
eSh
oats
, cat
tle
Dim
ituB
elel
aSh
ebed
ino
Tula
Shoa
ts, c
attle
Dim
ituB
elel
aTu
laA
was
saSh
oats
, cat
tle
S/O
mo
(Kur
az)
Kon
soA
rbam
nich
Wol
ayita
A
was
saSh
oats
, cat
tle
Dim
ituB
elel
aD
ale
Won
ago
Shoa
ts, c
attle
Bon
esha
Ala
ba
5.2
Intr
a-re
gion
ani
mal
s tr
ade
flow
rou
tes,
SN
NPR
Shoa
ts
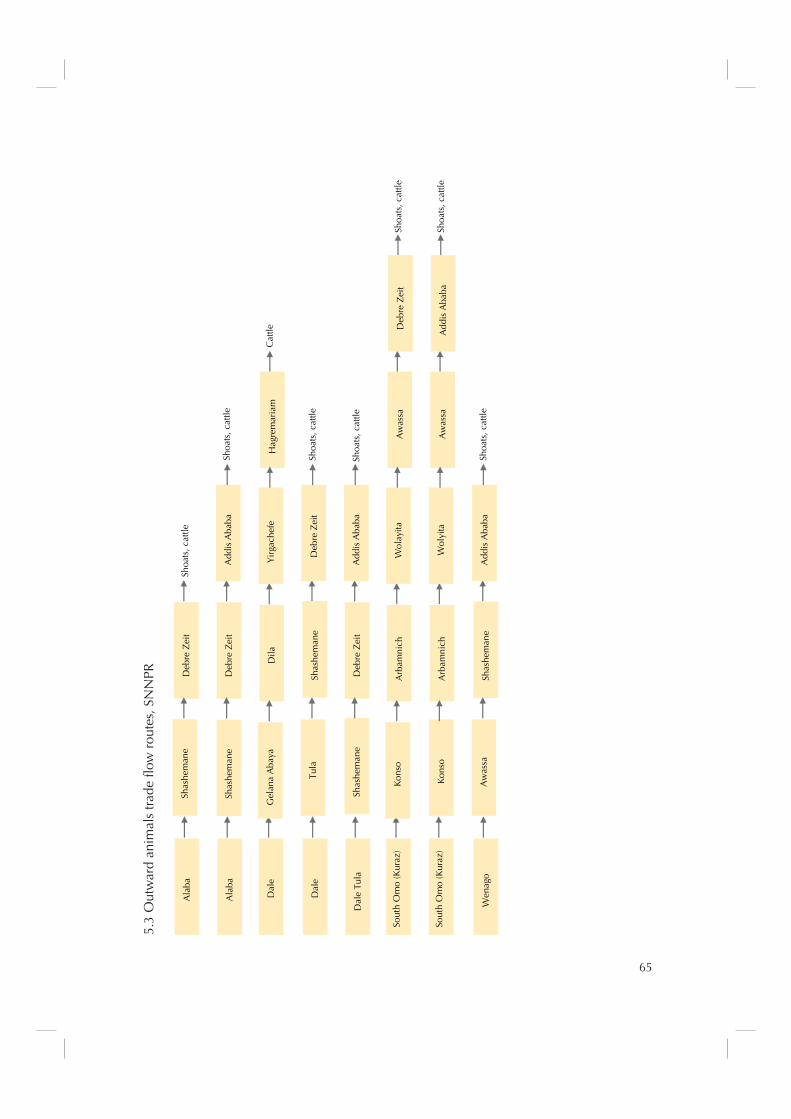
65
Dal
e
Gel
ana
Aba
ya
Dila
Y
irga
chef
e
Hag
rem
aria
m
Cat
tle
Ala
ba
Shas
hem
ane
D
ebre
Zei
t
Shoa
ts, c
attle
Sout
h O
mo
(Kur
az)
K
onso
A
rbam
nich
W
olay
ita
Aw
assa
Sh
oats
, cat
tleD
ebre
Zei
t
Ala
ba
Deb
re Z
eit
A
ddis
Aba
ba
Shoa
ts, c
attle
Shas
hem
ane
Dal
e Tu
la
Deb
re Z
eit
A
ddis
Aba
ba
Shoa
ts, c
attle
Shas
hem
ane
Sout
h O
mo
(Kur
az)
A
rbam
nich
W
olyi
ta
Aw
assa
Sh
oats
, cat
tleA
ddis
Aba
ba
Kon
so
Dal
e
Tula
Shoa
ts, c
attle
Deb
re Z
eit
Shas
hem
ane
Wen
ago
A
was
sa
Add
is A
baba
Sh
oats
, cat
tleSh
ashe
man
e
5.3
Out
war
d an
imal
s tr
ade
flow
rou
tes,
SN
NPR


![PDF - Cronicon · countries including Ethiopia [32]. The increased global population coupled with mass production of animal and human food could worsen the problem [14]. Ethiopia](https://img.pdfslide.net/doc/110x75/5f0b4a367e708231d42fc8b4/pdf-cronicon-countries-including-ethiopia-32-the-increased-global-population.jpg)