Embed Size (px)
Citation preview

THE CAUSAL RELATIONSHIP BETWEEN FINANCIAL
DEVELOPMENT AND ECONOMIC GROWTH: EVIDENCE
FROM EAST AFRICAN COUNTRIES
THE CAUSAL RELATIONSHIP BETWEEN FINANCIAL
DEVELOPMENT AND ECONOMIC GROWTH: EVIDENCE
FROM EAST AFRICAN COUNTRIES
By
Dorothy S.Haki
A Dissertation Submitted in Partial Fulfilment of requirements for the Degree of
Master of Science in Accounting and Finance (Msc. A&F) of Mzumbe University
2016
i
CERTIFICATION
I, as the supervisor to the researcher, do certify that I have read and hereby
recommend for acceptance by the Mzumbe University, a research report entitled
causal relationship between Financial Development and Economic Growth: Evidence
from East Africa Countries, in partial fulfillment of the requirements for award of the
Master of Science in Accounting and Finance (MSc. A&F) of Mzumbe University
________________________________
(Dr. Cosmas Mbogela) Major Supervisor
____________________
Internal Examiner
____________________
External Examiner
Accepted for the Board of ………………………
______________________________________________
CHAIRPERSON, FACUTY/DIRECTRORATE BOARD

ii
DECLARATION
I Dorothy Haki, declare that this research report entitled “The causal relationship
between Financial Development and Economic growth: Evidence from East Africa
Countries” is my original work and has never been produced by anyone else except
where otherwise identified by way of reference
Signature ………………………
Date ……………………………

iii
COPYRIGHT
©
This dissertation is a copyright material protected under the Berne Convention, the
Copyright Act 1999 and other international and national enactments, in that behalf,
on intellectual property. It may not be reproduced by any means in full or in part,
except for short extracts in fair dealings, for research or private study, critical
scholarly review or discourse with an acknowledgement, without the written
permission of Mzumbe University, on behalf of the author

iv
ACKNOWLEDGEMENT
All praises are to our Almighty God who enabled me to get the chance to finish this
research report. It could not be possible without his mercy.
I thank all people who have contributed either directly or indirectly towards the
successful completion of this research report. I would like express my genuine thanks
to my beloved sister for her boundless support and advice; it could have been
difficult to make without you. Thanks for being there always for me.
I acknowledge with great appreciation the contribution of my research supervisor Dr
Cosmas Mbogela for his guidance, suggestions, during the course of this study;I
could not have done it without you. I am grateful. May our almighty God give His
blessings upon you-Amen and Special recognition goes to Ansbert Kisham for his
supervision in seeing that this work is well done, God bless you.
I also wish to express a word of thanks to the Management of Sengerema District
Council for allowing me to pursue this course and their support
My appreciation also goes to my classmates and friends for everything they have
done to me throughout my course with Kwiyolecha John getting a special mention in
this category, may the Almighty God protect them all. Special thank also goes to all
staff members at Mzumbe University Mwanza Campus for their kindness and help.

v
DEDICATION
This research is dedicated to my sister Mrs. Asteria Mutolela whose guidance,
support and encouragement has made me what I am today. Also my sons Collins and
Paschal, my daughters Neema and Anisia, May mighty God be with you all

vi
ABBRIVIATONS
ADF - Augmented Dick Fuller
AGR - Annual Growth Rate
COEF - Coefficient
DC - Domestic credit to Private Sector
EG - Economic Growth
ERR - Standard error
FD - Financial Development
FI - Financial Institution
FM - Financial Markets
GCT - Granger causality test
FSD - Financial system deposits
GDP - Growth Domestic Product
GGM - Generalised Moment Method
IMF - International monetary Funds
LL - Liquidity Liabilities
PP - Phillip Perron
P-VALUE - Probability value
R2 - Coefficient of Determination
VAR - Vector Auto regressive
vii
ABSTRACT
This paper examines the causal relationship between financial development and
economic growth in three countries of east Africa (Tanzania, Kenya, and Uganda)
over the 1987-2013 periods
The study used annual growth rate as proxy of economic growth, thus dependant
variable. Financial development was determined by three proxies and therefore
independent variables, these proxies are; Domestic Credit to Private Sector, financial
system deposits as the ratio of total financial system deposits and Liquidity liabilities
that used to measure economic growth.
The research deployed quantitative research approach analyzing by using stata
program and the study used only secondary data .The causal relationship between
financial development (FD) and economic growth (EG) was examined by using
Vector autoregressive VAR model and Granger causality test. Phillips-Perron (PP)
tests and augmented Dick fuller test were used to test for unit root (non-stationary)
This study found that there is a bidirectional relationship between financial
development and economic growth for Tanzania, for Kenya the result revealed
unidirectional relationship running from economic growth to financial development
and for Uganda the causal relationship is only financial development which leads
Economic growth. The different results indicates that each east African country has
its own polices, regulations and laws that differ from another country. Therefore the
differences can be removed by making sure that laws, policies and regulations
formulated by Policy makers are the same in all east African countries

viii
TABLE OF CONTENTS
DECLARATION ......................................................................................................... II
COPYRIGHT ............................................................................................................. III
ACKNOWLEDGEMENT ......................................................................................... IV
DEDICATION ............................................................................................................ V
ABBRIVIATONS ...................................................................................................... VI
ABSTRACT .............................................................................................................. VII
LIST OF TABLES ..................................................................................................... XI
CHAPTER ONE .......................................................................................................... 1
1.1 BACKGROUND TO THE RESEARCH PROBLEM .............................................................. 1
1.2 STATEMENT OF THE PROBLEM ................................................................................................... 6
1.3 MAIN OBJECTIVE ....................................................................................................................... 7
1.4 SPECIFIC OBJECTIVES OF THE STUDY ......................................................................................... 7
1.5 RESEARCH QUESTIONS .............................................................................................................. 8
1.6 SIGNIFICANCE OF THE STUDY .................................................................................................... 8
1.7 SCOPE OF THE STUDY ................................................................................................................. 8
1.8 ORGANIZATION OF THE STUDY .................................................................................................. 8
CHAPTER TWO ....................................................................................................... 10
LITERATURE REVIEW ........................................................................................... 10
2.1 INTRODUCTION ........................................................................................................................ 10
2.2 THEORETICAL STUDY .............................................................................................................. 10
2.3 THE FIVE FUNCTIONS THROUGH WHICH FINANCE LEADS GROWTH ........................................... 12
2.3.1 Providing information for better allocation of capital 12
2.3.2 Monitoring of firms and make use of corporate governance 13
2.3.3 Reduction of risk 14
2.3.4 Mobilizing and pooling savings 15
2.3.5 Easing the exchange of goods and services 16
2.4 EMPIRICAL EVIDENCE .............................................................................................................. 18
2.5 VARIABLES OF THE STUDY AS USED BY OTHER RESEARCHERS ................................................. 26
CHAPTER THREE .................................................................................................... 28
METHODOLOGY ..................................................................................................... 28
3.1 INTRODUCTION ........................................................................................................................ 28
3.2 TYPES AND SOURCES OF DATA ................................................................................................. 28
ix
3.3 SAMPLE SIZE ........................................................................................................................... 29
3.4 VARIABLE DEFINITIONS, MEASUREMENT AND ARTICLES (REFERENCE) .................................. 29
3.5 VARIABLE DEFINITIONS: ......................................................................................................... 29
3.5.1 Economic growth 29
3.5.2 Financial development 30
3.6 THE ECONOMETRIC MODEL .................................................................................................... 31
3.7 DATA ANALYSIS METHODS ...................................................................................................... 33
CHAPTER FOUR ...................................................................................................... 35
PRESENTATION OF FINDINGS AND INTERPRETATION................................ 35
4.1 IINTRODUCTION ....................................................................................................................... 35
4.2 PRESENTATION OF FINDINGS ................................................................................................... 35
4.2.1 The nature of relationship between economic growth and financial
development 35
4.2.2 Causal relationship between financial development and economic growth
39
CHAPTER FIVE ........................................................................................................ 43
DISCUSSION OF THE FINDINGS .......................................................................... 43
5.1 INTRODUCTION ........................................................................................................................ 43
5.2 THE RELATIONSHIP BETWEEN FINANCIAL DEVELOPMENT AND ECONOMIC GROWTH ............... 43
5.3 CAUSAL RELATIONSHIP ........................................................................................................... 45
CHAPTER SIX .......................................................................................................... 51
SUMMARY, CONCLUSION AND RECOMMENDATIONS ................................ 51
6.1 SUMMARY ............................................................................................................................... 51
6.2 CONCLUSIONS ......................................................................................................................... 51
6.3 RECOMMENDATIONS ............................................................................................................... 53
REFERENCES ........................................................................................................... 55
A: ORIGINAL DATA ............................................................................................... 61
A1: Kenya 61
A2: Tanzania 62
B: ORIGINAL DATA UNIT ROOT TEST RESULTS ............................................ 64
BI: Kenya – original Data 64
BI: Tanzania– original Data 65
B3: Uganda –Original data 66

x
C: UNIT ROOT RESULTS AFTER DIFFERENCIATION ..................................... 67
C1: Kenya results 67
6.4 C2: TANZANIA RESULT ............................................................................................................ 68
C3: Uganda results 69
D:VECTOR AUTO REGRESSION (VAR) RESULTS............................................ 70
D1: Tanzania result 70
D2: Kenya result 70
D3: Uganda result 71
xi
LIST OF TABLES
Table.4.1 Vector auto regression (VAR) results – Tanzania ................................... 36
Table.4.2 Vector auto regression (VAR) results – Kenya ....................................... 37
Table.4.3 Vector auto regression (VAR) results – Uganda ..................................... 38
Table.4.4 Granger causality tests (GCT) results - Tanzania .................................... 40
Table.4.5 Granger causality tests (GCT) result - Kenya .......................................... 41
Table.4.6 Granger causality test (GCT) results - Uganda ........................................ 42
1
CHAPTER ONE
1.1 BACKGROUND TO THE RESEARCH PROBLEM
Financial development is viewed as one of the most important determinants of
economic growth. But also economic growth is seen to be important in financial
development. Financial development can take a leading role in economic growth or
can lead to expansion of economic needs. Economists and policy makers are more
concern with the relationship between financial development and economic growth
(Abubakar, 2011). This has lead to many researchers to examine the relationship
between financial development and economic growth.
Most of the economists suggest that financial development contributes to economic
growth in many ways. This can be agreed due to the reasons that most of the
functions performed by financial development such as financial institutions (FI)
support the growth of economy. For example Savers may have small amounts of
money required to lend to borrowers while borrowers wish to borrow large amounts
of money for their investment. This can be difficult for borrowers to achieve without
FIs. But through the FI that accept small amounts of deposits and organize them to
large amounts thereby providing large funding to borrowers substantial investment
projects get enhanced
In contrast, Lucas (1988) and Stern (1989) found that financial development does not
contribute to economic growth thus there is no relationship between these variables.
Lucas (1988) continued arguing that finance was overstated to be the main factor of
economic growth and any plans that intended at supporting the development of
financial system can misuse the available resources, Thus relationship between
financial development and economic growth has resulted in different views on how
to improve the economic growth through financial development and vice versa and
therefore no common agreement to how financial development affects or is being
affected by economic growth.. Therefore this study intend at contributing to these
arguments
2
On the other hand, some of researchers suggest that the development of financial
system depends on improved economic growth. Robinson (1952) continued saying
that when economy growth of the country improves leads to development of
financial sector. This finding was supported by (Jung, 1986, Boulika and Trabelisi,
2004 Goldsmith, 1969 and Kar and Pentecost 2000 but Islam, Habib and Khan 2004;
Guryay, Safkli and Tuzel 2007) confirmed one way direction running from economic
growth to finance. According to Padilla and Mayer (2002), Countries whose
economies grow faster, are required to invest more in order to improve the financial
system for steady economy
Financial development as defined by Levine (2004) that is a situation where
financial instruments, markets and intermediaries improve thereby reducing the
effects of information enforcement and transaction costs and therefore do a
corresponding better job at carrying out the financial functions which include
producing information; pooling savings; and easing exchange. Thus, financial
development helps the improvement of the financial system in carrying out various
functions. These functions lead to the influence of savings and investment decisions,
thereby contributing to the growth of economy. However, there are differences in
how well financial systems provide these functions.
Financial development leads to economic growth by motivating investment or
projects to perform efficiently. The efficiency effect suggested that laws and
regulations in financial sector make sure that there is transparency and appropriate
reporting in financial sectors. This ensures confidence to investors and therefore
catches the intention of foreign and domestic investors. Also financial sectors help to
allocate available financial resources to more profitable investments. This indicates
that financial development and economic growth have a positive relationship
(Onuonga 2014)
Graff (1999).defined financial development as the increase in the level of financial
services of financial institutions and other financial sectors as well as financial
transactions on capital markets which encourages development of economic growth.
3
According to Levine (2005), who described that economic growth can be influenced
by financial development due to the reason that financial development (financial
Institutions) perform several functions which are (i) easing the exchange of goods
and services through the provision of payment services, (ii) mobilising and pooling
savings from a large number of investors, (iii) acquiring and processing information
about enterprises and possible investment projects, thus allocating savings to their
most productive use, (iv) monitoring investment and carrying out corporate
governance, and (v) diversifying, increasing liquidity and reducing risk. Each of
these functions can influence saving and investment decisions and hence economic
growth. Since many market frictions exist and laws, regulations, and policies differ
markedly across economies and over time, improvements along any single dimension
may have different implications for resource allocation and welfare depending on
other frictions in the economy
The relationship between financial development and economic growth is the main
concern to both economists and policy makers. Previous researchers such as
Odhiambo (2010), Guryay (2007), Kar and Pentecost (2000), Pradha (2009), Sinha
and Macri (2001) and Vazakidis and adamopoules (2009) examined the relationship
and causal relationship between financial development and economic growth but
each got different result
The results obtained by King and Levine (1993) give evidence that economic growth
tends to grow faster in developed countries that have financial system advanced, In
their study found that the depth financial development contributes positively to the
growth of economy. Their examination done from 1960 to 1989 in 80 (eighty)
countries, revealed that the size of the financial sectors is positively related by
economic growth. The researchers continued arguing that the positive relationship
between the two variables can be due to the fact that developed countries have many
financial transactions due to larger financial institutions and therefore faster growing
of the related country.
Therefore, from King and Levine (1993) arguments, it can be seen that the outcome
of the study does not prove that it is financial development that contributes the
4
economic growth. This is because the increase of the size of financial development in
one year may be due to the improvement of economic growth in the previous year.
The relationship between financial development and economic growth also has been
suggested by Beck, Levine and Loyaza (2005) as well as Benhabib and Spiegel
(2000) that the effect of financial development to economic growth is stronger than
the effect of economic growth to financial development.
The earlier studies concerning the relationship between financial development and
economic growth have setbacks which can be seen in many ways. For instance the
positive relationship between financial development and economic growth can be
due to different reasons, for example, the increase in the output leads to the
requirement of financial services to increase also, and therefore positive
improvement on financial development. Other suggests that economic growth
contributes to financial development. Therefore the need of more study on the nature
of relationship and the causal direction between financial development and economic
growth
The causal direction between financial development and economic growth is
uncertainty. According Guryay, Sakli and Tuzel (2007) who suggested that, it is clear
to observe opposite relationship ether positive, negative or very weak relationship
between financial development and economic growth. Therefore, it is better to
determine the causal relationship between financial development and economic
growth because this helps policy makers to make decision for the future
improvement regarding the causality direction between these variables
Evidence of the researches conducted concerning the direction of causality
relationship of the two variables, the financial development and economic growth
found a mixture of findings. Most of their results of findings are conflicting, leaving
many questions among researchers and economists of what exactly the causal
relationship of these variables. For example, Odhiambo (2007)) found that financial
development leads to economic growth, Odhiambo (2011)) found that economic
growth leads to financial development and Odhiambo (2005) found a bidirectional
causal relationship between financial development and economic growth, therefore
5
more study need to be done to examine the causal relationship between financial
development and economic growth.
Although the examination of the relationship between financial development and
economic growth are concern to both countries either developing countries or
developed countries but in all cases the problem of causal relationship still exist, no
solution that have been achieved as a proof regarding the direction of causality. As
seen from different previous researchers concerning the topic, the direction of the
causality is still ambiguous of which variable causes the other. Different outcomes
from previous researchers have been observed. According to the conclusion done by
some of researcher such as Robinson (1952) and Goldsmith 1969 that improvement
of financial development is due to the development of economic growth
The earlier studies concerning this relationship experienced different limitations.
Some of researchers used the cross-sectional data to examine the relationship, but
these types of data did not address well the problem of the country and the other used
time series data and also some used panel data. Also methods of analysis differs
which leads to different outcomes thereby becoming difficult to make conclusion
regarding the nature and causal relationship between financial development and
economic growth in the country under study.
The causal relationship can differ in the same country when different proxies are
used. for example in Tanzania one results showed that the causal runs from
economic growth to financial system , but some of researchers result revealed that
there is a bidirectional relationship and other results revealed the unidirectional
relationship running from financial development to economic growth Odhiambo
(2011). Also the same results were observed from Botswana country where Eita and
Jordaan (2007) examined the causal relationship between financial development and
economic growth in Botswana from year 1977 to 2006, the researchers used Granger
causality test to determine the causal relationship through co integrated VAR
methods and found that financial
6
development causes economic growth in Botswana. But Akinboade (1998) for
Botswana found that there is bidirectional causality between financial development
and economic growth although used different proxies and different econometric
technique (cointegrated vector autoregression method)
Although many empirical studies were done by well-known economic researchers,
there has been no any agreement about how financial development affects economic
growth. This has caused different views on how financial development and economic
growth relates. This study is therefore, aimed at examining this relationship in order
to come up with the actual result which will contribute to the knowledge of how
financial development affects economic growth or vice versa.
1.2 Statement of the Problem
Financial development plays an important role in determining the condition of an
economic growth, stated by Abubakar Mohamed (2011). The experience from the
recent global financial crisis has shown that an economy with a weak financial
system is bound to fall, More efforts has been made by different countries to improve
the financial system but still the level of economic growth is low. For example in
Tanzania since 1990s, the government has implemented a number of policy and
institutional reforms in order to strengthen the development of financial institutions
but still the rate of economic growth is low,
Despite of the importance of financial system advances to economic growth still, the
results found by different researchers who examined this relationship were
contradicting. Some of the studies support the importance of financial development
to economic growth for example, Levine (2004), Odhiambo (2007), Gupta (1984),
Abu-Bader and Abu-qurn (2005), Ghali (1998). But the other study for example
conducted by Odhiambo (2011), Chimobi (2010) and Guryay (2007) found that
financial development is influenced by economic growth. Also Odhiambo (2005),
Akinboade (1998), Jung (1996), Pradhan (2009), Calderon and Liu (2003) found that
there is a bidirectional causal relationship between financial development and
economic growth.
7
Another difference is the use of different types of data, some of researchers
employed panel data and found positive effects of financial development on
economic growth. Respectively King and Levine (1993), Khan, S.M & Senhadji
(2000) , Benhabib and Spiegel (2000), and Levine (2000). But using time series data
the results were different. For example Demetriades and Hussein (1996) used time
series data the result did not confirm that financial development influences economic
growth. Calderon and Liu (2003) used cross sectional data but also the result were
different. Odedo (1996) in his study suggested that the relationship between the two
variables differs from country to country and over time and also Odhiambo (2011)
suggested that the relationship between financial development and economic growth
may be sensitive to the proxy variables used to represent financial development
From different studies that had been conducted regarding the relationship between
these variables do not show empirical agreement among the researcher’s outcomes
on the importance of financial development to economic growth and therefore giving
a good reason for more study to be conducted in this field. Therefore, this study aims
at satisfying these differences by examining the causality relationship between
financial development and economic growth in the east Africa countries.
1.3 Main objective
The main objective of this study was to examine the causal relationship between
financial development and economic growth in east African countries
1.4 Specific Objectives of the study
The report was guided by the following specific objectives
To examine the relationship between financial development and economic growth
To determine the causal relationship between of the selected proxies of financial
development and the proxies of economic growth
8
1.5 Research Questions
The major questions addressed in this report concerned the relationship between
financial development and economic growth in east Africa countries was follows:-
What is the relationship between financial development and economic growth?
Is there a causal relationship between financial development and economic
growth?
1.6 Significance of the Study
The findings prove to be applicable to knowledge after the study for the following
reasons:
The finding will help to provides appropriate information regarding on how financial
development and economic growth relates to each other
Through recommendations of the study policy makers will be able to find a suitable
way by formulating policies that will support the improvement of financial
development which will lead to economic growth
The finding also will give out the basic way of formulating a useful new idea or to be
used as a reference work by the future researchers.
1.7 Scope of the study
This study covers a period of 27 years (1987-2013). The study is limited to three east
African countries: Tanzania, Kenya and Uganda, The choice of data range was due to
the availability of data and the purpose for which the research report is intended.
Also the study used Time series data which are secondary data of each country from
different sources, such as World Bank, economic indicators records and IMF
1.8 Organization of the study
To achieve the objectives of the report, the work has been divided into six chapters
Chapter one gives the introduction of the this report which explains the background
of the study, statement of the problem, objectives of the report, questions of the
9
report, significance of the study, scope of the study, limitations of the study and
organization of the study itself.
Chapter two provides results of related literature of the relationship between financial
development and economic growth by providing research proof conducted by
various researchers from different countries and theoretical study concerning the
relationship between financial developments
Chapter three explains methodology of the study. It consists of introduction, Types
and sources of data, Sample, variable definitions, econometric model and data
analysis.
Chapter four is concerned with presentation of finding. Chapter five provides a
section for data analysis and interpretation of results, including discussion of findings
The final chapter which is chapter six presents conclusion of observations on the
research report. It provides sections for a summary of findings, conclusions and
recommendations.
10
CHAPTER TWO
LITERATURE REVIEW
2.1 Introduction
This chapter provides a review of previous works carried out by economic and
financial researchers in respect of the causal relationship between financial
development of a country and economic growth into two categories; theoretical and
empirical evidence
2.2 Theoretical study
The relationship between financial development and economic growth has been
examined widely by different researchers, but with conflicting results. There is a
growing body of theoretical linking financial sector development and economic
growth. The recognition of a significant and positive relationship between financial
development and economic growth dates back to Schumpeter (1912), who states that
financial markets play an important part in the growth of the real economy.
Also FI manage risk by making a large number of loans, most of which might be
good and only few might turn bad. FI can minimize risk by diversifying its lending
across different types of assets/ securities. Financial markets provide liquidity
thereby providing an opportunity for investors to quickly convert their claims into
cash without extensive loss of value or risk and well functioning financial markets
are key factors in producing high economic growth but poorly performing financial
markets are reason that many countries in the world remain desperately poor
According to Onuonga (2014), improved financial system can support or contribute
to the efficiency and effectiveness of financial development and also supports
financial improvement, thus contributing to the economic growth. Onuonga
continued suggesting that financial development is said to improve, when the
addition of financial institutions increases and when the strength of the financial
sectors increases, also when there is an increase of fund that that have been
11
transacted by financial institutions within the country and when there is an increase
in number of the services delivered and the increase of financial institution in a
country within a specified period and when financial development improves by
becoming more efficient
Meier (1991) suggested that even if the economy of a country improves, still there is
a need for financial institution to allow available savings to be used for investment
suitably and make sure that the available resources are directed to the most effective
purposes. It is important for the required sector in developing countries to collect the
savings from individuals and be able to invest within the country. It is easy for such
sector or agencies to allow the saved amount and be able to invest efficiently. If the
financial institution is improved, the task of monitoring can be assigned or delegated
to financial intermediaries .Delegation helps to speed up economic growth by
decreasing transaction costs and also more savings would be allocated to other
investment that creates technological improvement. Financial sector reduces
transaction cost that can hinder economic growth Andersen (2003)
According to Levine (2005), who described by proposing that economic growth can
be influenced by financial development due to the reason that financial
development(financial Institutions ) performs several functions which includes;
financial development enables the services rendered and exchange of goods to be
achieved at low cost and easily, Helps saving to be mobilized and be collected from
different investors that are being accumulated for borrowers need , also financial
development help Providing information for better allocation of capital and firms in
order to invest in profitable projects, through financial development ,the performance
of projects are being observed and appropriate practice of corporate governance are
being achieve thereby leading to achievement of efficiency outcomes , and Helps
investors to invest in more than one project which helps to reduce risk. The
researcher continued suggesting that when these functions are performed well many
savers will be attracted to deposit their money in different financial institution and
also the interested investors will be able to make reasonable decision. All these in
turn lead to economic growth
12
2.3 The five functions through which finance leads growth
The five channels as presented by Levine 2005 that finance influence economic
growth are explained in details below
2.3.1 Providing information for better allocation of capital
The intermediation of savings into investments depends on the quality and quantity
of information available to individual savers, but it is very costly for individuals to
get information required for their investment. Information collected by financial
intermediaries is more profitably and easily acquired than individuals. Financial
intermediaries help the allocation of the available resource efficiently to firms or
industries that are more productive.
The cost of acquiring information by individual savers for their project is very high
which can cause the project that has high return not to be financed. But through
financial intermediaries that acquire and assess information that enables allocation of
available resources to more profitable project. Andersen (2003) in his study indicated
that when allocations of savings are improved through different projects leads to
enhancement of growth.
Levine 2005 also suggested that before making investment decision it is better to
know costs that are connected with the assessment of firms, managers and the
condition that persist in the available markets, because sometimes these costs are
large enough to discourage investors. It is costly for individuals to have that
information required to make decision. Most of individual savers will not want to
invest in a project that they have or they do not have enough and consistent
information. Investor need to have reliable information about the project or the firm
that they intend to invest according to the available market. This helps to make
reasonable decision by putting large capital to the most profitable firms or projects.
Boyd and Prescott (1986) suggested that through financial institutions investors can
obtain reliable information at low cost and therefore proper allocation of the
available resources
13
Financial intermediaries are the very important for investors or individuals in making
positive decisions. Investor need to be aware of fixed costs that are connected with
assessing the value of the firm including the performance of managers according to
the situation of prevailing economic growth. According to Boyd and Prescott (1986),
financial intermediaries perform activities similar to Known Banks, for example it
accepts small amount from individual savers for making loans. According to Allen
(1990) who found that financial intermediaries are there to produce reliable
information regarding various firms which will be useful to individual savers at low
cost
Information produced concerning the project, the situation of current economy, and
the available financial institutions, also about the managers should be improved in
order to make contribution on rapid economic growth. Since the available resources
are scarce and the requirement of such resources are high, therefore financial
intermediaries can give reliable information concerning the firm or project by
considering funding those profitable project or firms thereby encourage efficient
allocation of funds as according to Greenwood and Jovanovic (1990). Financial
institution can produce better information, efficient allocations of available resource
and be able to contribute to economic growth at low cost. This encourages more
individual to support financial intermediaries by depositing their small amount that
are accumulated for large investment.
2.3.2 Monitoring of firms and make use of corporate governance
Due to the fact that shareholders can keep an eye on how managers in the firm use
the contributed fund thereby applying corporate governance. This encourages them
to provide more funds without any fear of loss. Effective corporate governance
encourages managers to use and allocate the available resources efficiently thereby
improving corporate governance, which leads the financial intermediaries to have a
positive outcome on economic growth.
Financial sectors uses corporate control and serves in observing of projects which
aim at lowering risk and reduce misuse of available resource .According to Andersen
14
who suggested that the established financial institutions can monitor investment for
investors thereby reducing repetition of cost for monitoring that could investors incur
when conducting their own individual monitoring
Corporate governance is essential for improvement of economic growth and it is very
important factor for development of financial institutions. Through corporate
governance providers of funds or resources to firms can observe the firms operation
effectively and being aware of how firms use those resources has implications on
savings as well as allocation of resources. The idea of the owners and creditors to
observe the operation of the firms and the encouragement of managers to work for
the benefit of firm helps the firm to improve allocation of the available resources
efficiently. This also encourages savers to be more willing to support production.
Levine (2005) described that there is no financial arrangements that encourages the
use of corporate governance in the firm can hinder the proper collection of savings
from different areas and which leads to poor maintenance of fund or resources from
flowing to profitable investments. Therefore, the effectiveness of corporate
governance system directly encourages the performance of firms with big results on
growth rates of the country.
The owner of the firm can use effective corporate governance on important matters
which mean they need appropriate information for decision making. According to
Levine 2005, when information is achieved at low costs enables the owners to make
appropriate decisions and choose accordingly. If there is no frictions of the market
and if the information given is accurate and reliable the managers will work with the
aim of achieving shareholders interest and thereby improving the allocation of the
available resources
2.3.3 Reduction of risk
Financial intermediaries make ease of hedging and risk pooling. It facilitates risk
diversification in different firms or financial systems thereby encouraging efficient
allocation of resources which leads to economic growth. Most of individuals are
reluctant to risk; they prefer high return at low risk. But financial intermediaries
15
redirect more resources to high risk to achieve high return which leads to the
improvement of productivity and therefore economic growth.
Andersen 2003) in his study suggested that diversifying risk occurs when the
financial sector gives insurance to individual savers due to individual risk that an
investment pays no return and Liquidity risk can be reduced and the possibility that
savers may wish to with draw their decision before achievement of expected return.
When economy improves, it indicates that there is an increase of savings thereby
improving and attracting economic growth of a country.
Patrick 1966 suggested that diversification of risk which is a function performed
efficiently by financial sectors helps to the contribution of economic growth in long
run by varying allocation of available resources and rate of savings. Most of
individual savers usually accept projects with high returns but with minimum risk
while in reality most of projects that give high returns are associated with high risk.
Therefore through available financial markets individuals get information easily on
making optimal portfolio by considering risk and returns of each investment or
projects.
2.3.4 Mobilizing and pooling savings
Savings from individuals are mobilized for large amount that can help to finance
large projects. The savings are pooled by financial systems that enhance savings
which in turn leads to higher cumulative for investments which in turn leads to
economic growth. If there is no accumulation of individual savings which are
achieved through financial institutions, this can lead the project or investment to
operate below of its expected operation (efficient operation). Improvement of
Technologies, investment and fund accumulation depends on financial institution
that mobilizes savings and these improves more financial sector. According to
Andersen (2003), a well developed financial sector will reduce constraints in an
economy which increases the rate of Investment and thereby economic growth
Sirri and Tufano (1995) suggested that individual savers for investment, that
accumulates savings through financial institutions considers the following (a) avoid

16
costs regarding truncations made that are connected with accumulation of savings
from individuals savers and (b) makes sure that there are symmetries information
available for every individual savers which in turn give confidence to those savers to
give up their savings to borrowers through financial institution. Financial
arrangements make easier regardless all costs that are associated to acquiring of
information and financial transaction. Financial systems that are more effective at
pooling the savings of individuals can make contribution to economic growth
development by encouraging savings and effective use of the scarce. By managing
the individual savings and be able to accumulate large fund for investment helps to
improve allocation of resource and technological innovation.
2.3.5 Easing the exchange of goods and services
Financial intermediaries reduce transaction costs of exchange of goods and services,
which enables individuals or firms to save. The saved money can be used to focus on
productive investment or to specialize in certain activities or to create new
technologies and innovations which lead to high productivity which in turn
contributes to economic growth
According to new growth theory that focus on the current technological change
which is the major factor of growth of technological development leads to continued
stable growth due to the increase in production which would be sufficient to make up
the decline in productivity that leads to accumulation of capital. Innovative and new
technologies if used effectively lead to growth which in turn contributes to the
growth of economy
According to Levine, 1997, the Country can attain improved economic growth by
being able to organize the available resources and make proper decision on making
allocation of these resources to more profitable projects or investments. As described
by different researchers, the functions performed by financial institutions such as
providing reliable information for investment decisions are the most important key
which contributes to economic growth. Therefore managers and shareholders should
work in their power to make sure that the objective of the firm are achieved
17
The impact of financial development on economic growth has been agreed by
Calderon and Liu, 2003 Jung, 1986 that financial development is a key to economic
growth. Financial development has a significant impact on economic growth and it is
basic to alleviation of poverty and improvement in income contribution (World
Bank, 2001).
The relationship between financial development and economic growth can be
appropriate reviewed at industry and firm level, this is due to the reason that it is
more expected that the size of financial development of a country influences the
performance of a specific industries or firms. In the study conducted by Rajan and
Zingales (1998) revealed that small new firms are likely to depend more on external
finance in advanced productivity. This is advantage to these firms as they benefit
from the lowest cost of financing in a better financial system than those recognized
firm. The findings reveals that a new firms that stands for the unit of production and
if effective technologies are formed, the financial development may increase
productivity and therefore economic growth.
Most of economists and Researchers have suggested that financial development is
most important factor for the growth of economy due to the following reasons; first
as was explained by Shen and Lee (2006) that financial system which is well
developed gives the way forward to better distribution of the available resources and
reduces information asymmetric .Economic growth can be contributed by financial
development through; Mobilizes savings; this increases the volume of resources
available to finance investment. Thus it screens and monitors investment projects
(lowering information acquisition costs); this contributes to the increase of the
efficiency of the projects carried out Greenwood,& Jovanovic (1990). But Levine
(1990) argued that the financial development is as a vital determinant of economic
growth, which increases savings and facilitates capital accumulation and thereby
boosts investment and growth.
Another reason is that financial institution reduces transaction costs that lenders and
borrower incurs. With specialization FI can obtain information regarding transaction
costs such as credit worthiness of borrowers, loan processing cost and others at low
18
cost compared to individual lenders thus increasing return to lenders and reducing
interest rates, all these leads to the growth of economy.
Also financial system helps the country to allocate resources efficiently as explained
by Demetriades and Andrianova (2004). A well developed financial institutions helps
foreigners industry to borrow for their activities in the host country and therefore the
increase of technology which benefits domestic industry thereby leading to the
growth of economy. According to Mapesa -Lecture notes (2015) who explained that
Well performing financial markets (FM) leads to producing high economic growth
because activities in Financial Markets contributes to welfare of a person, consumers,
business as well as economy at large and also FM helps to channel funds to
individuals or institutions that need more funds, all these in turn leads to economic
growth. Also Hermes and Lensink (2003) supported this idea that a well functioning
financial markets leads to the growth of economy.
Some researchers have pointed that effective and efficient financial system in terms
of financial institution and financial Markets are not more likely to be affected due to
risk and financial crisis that normally affects the economy of the country, but even if
the crisis occurs in the country that their financial system operates efficiently, it does
not suffer more as compared to those countries with no well functioning financial
system Beck (2000) and Bordo and Meissner (2006)
2.4 Empirical evidence
The relationship between financial development and economic growth has been
recognized by different researchers, but the direction of causality between financial
development and economic growth is a controversial issue. The question being does
financial development cause economic growth or does economic growth cause
financial development?
Gupta (1984) investigated the relationship between the financial development and
economic growth from different developing countries. The results of the Gupta
report indicates that causality runs from financial development to economic growth
19
which shows that the role of the financial development is more important in the
process of economic growth.
Empirical evidence from different researchers and economists suggests that those
countries having strong and well functioning financial system helps them to grow
faster. King and Levine (1993) in their study indicated that there is a positive
relationship that growth relates to financial development. In their study from year
1960 to 1989 indicated that financial system in some of the years under this study for
example year 1960 showed a positive relationship to economic growth. But this can
be argued that the positive relation in some years may be due to the increase of
financial transaction performed in those years. But also tried to check if there is a
reverse direction relationship between economic growth and financial development,
that means if also economic growth leads financial development
King and Levine continued arguing that the result found does not essentially show
if the financial development leads to economic growth, because the dimension of the
financial institutions in the year under study especially in the year of 1960 may
depend on the anticipation of the future economic growth. By using panel data
revealed that there is a strong relationship between financial development and
economic growth (For example, Levine, Loayza, and Beck 2000, Benhabib and
Spiegel 2000).
Eita and Jordaan (2007) analyzed the causal relationship between financial
development and economic growth in Botswana for the period 1977 to 2006, using
Granger causality through cointegrated Vector Autoregression methods. The results
showed that there is a stable long run relationship between financial development
and economic growth. This means that financial development causes economic
growth in Botswana. Also tested the causal relationship which revealed that the
causality run from financial development to economic growth. From this result the
researcher suggested that financial sector in Botswana is very important in the
economic growth and development of the country. Financial systems should be
enhanced in order to promote Botswana’s economic growth.
20
The result found by Eita and Jordaan (2007) was different from what was revealed
by Akinboade (1998) for the same country although used different proxies and
different econometric technique (cointegrated vector autoregression method).
Akinboade tested the causal relationship between financial development and
economic growth for the period 1976 to 1995 and found that there is bidirectional
causality between financial development and economic growth.
Apergis, Filippidis and Economidou (2007) summarized the views on the
relationship between financial development and economic growth. Their view based
on two main views on the financial development and economic growth relationship.
The first view argued that financial development has a positive impact on economic
growth, thus the effect of the relationship runs from financial development to
economic growth. This relationship can be caused either by an improvement in the
efficiency of capital accumulation or an increase in the rate of savings as well as the
rate of investment. The second view was that there is a long run relationship between
financial development and economic growth and the causal relationship was
bidirectional
In the study conducted on Northern Cyprus, Guryay,(2007), examined the link and
causal relationship between financial development and economic growth. The
research utilized time series data for 19 years, covering the periods of 1986-2004.
Their findings revealed an insignificant positive relationship between financial
development and economic growth. Also they examined the direction of the causality
between the two variables. Results from this study revealed that the causal
relationship runs from economic growth to financial development. Meaning that
financial development is influenced by economic growth
In a different way, Kar and Pentecost (2000) studied the causal relationship between
financial development and economic growth in Turkey using time series data from
1963 to1995. Contrary to the findings of Cyprus, Guryay, (2007), the researchers
found significant positive relationship. On the second issue of the direction of
causality, the researchers found that the causality runs from both directions. One
important finding is the fact that the strength of the causality running from economic
21
growth to financial development is higher. However, the researchers cautioned that
this variability may not be unconnected to the sensitivity of the estimated models to
the choice of proxies for financial development. Therefore, it cannot be fully
accepted that financial development leads to output growth or that finance follows
growth in Turkey.
Unlike the preceding argument in support of the demand-following hypothesis,
Choong, (2001) tried to make a difference by using Stock Market Development to
examine the causal relationship between financial development and economic
growth. Using time series data from the Malaysian economy for the period 1978-
2000, the causality results revealed that Stock Market Development does not cause
economic growth.
In his study on India, Pradhan (2009) examined the relationship between financial
development and economic growth using time series data over the period 1993-
2008.The researcher stated a positive relationship between financial development
and economic growth. The Granger causality test confirmed the interdependence
between financial development and economic growth in India. Considering this
bidirectional relationship, the researcher documented that the effect of financial
development must be considered as a policy variable necessary to stimulate
economic growth and vice versa.
Sinha and Macri (2001) examined the relationship between financial development
and economic growth using time series data from eight countries. Employing the
augmented production function approach and multivariate causality test as well, from
the research, many of discoveries were made and the conclusion was that, no
generalizations could be made about the effects of financial variables on economic
growth for the countries under study. This was because, while for some countries, the
financial variables seemed important, but for other countries were not.
In another study, Chimobi (2010)) examined the causal relationship among financial
development, Trade Openness and economic growth in Nigeria using the Johansen
multivariate approach to co integration and the vector auto regression (VAR)
22
approach for the Granger causality test over the period 1970 – 2005. The results
reveal a different situation for Nigeria distinct from the fore stated views that there
are no co integration relations among Growth, trade openness and the three measures
of financial development (i.e. direct credit, private credit and money supply). The
causality results reveal a unidirectional causality running from economic growth to
trade openness. This implies support for growth-led trade and that economic growth
causes financial development
Another related study was also conducted by Aziakpono 92005) who examined the
question of whether domestic financial Institutions will become irrelevant in
Promoting economic growth using the experience of the Southern African Customs
Union (SACU). The study applied the Zellner Seemingly Unrelated Regressions
Estimation method using panel data for the period 1980-2000. The empirical
evidence shows that domestic financial intermediation is still relevant in such
financially integrated markets. Within the SACU, South Africa demonstrated strong
evidence of the relevance of domestic financial intermediation in promoting
economic growth.
However, the evidence was weak for Botswana and Lesotho due to their weak
financial system as well as institutional and structural problems inherent in their
economies. The case of Swaziland was not good than in other countries as the role of
financial institutions in promoting economic growth became less important.
However, the researcher recommended that the depth of the financial system along
with addressing other institutional and structural problems in such economies will be
a necessary precondition for deriving maximum gains from financial intermediation.
Vazakidis and Adamopoulos (2009) had the objective of finding the causal
relationship between financial development and economic growth from 1978 to
2007. They used the vector error correction model (VECM), Johansen co integration
method and Granger causality tests. It was found that economic growth has a positive
effect on Stock and Credit Market Developments through Industrial Production
Growth in Greece. Therefore ,economic growth speed up financial market
23
development taking into account the positive effect of industrial production on
economic growth.
Using time series data for 41 years from 1960 to 2000 Abu-Bader and Abu-Qarn
(2005) explore the causal relationship between financial development and economic
growth in Egypt. Granger causality tests were carried out using the co-integration
and vector error correction (VEC) models after pre-testing for unit roots in all
variables (using the Augmented Dickey Fuller- ADF test). The null hypothesis of a
no co-integration relationship at 5% level of significance was rejected. In addition,
they found that the financial reforms put in place in 1990 were responsible for the
economic rebound of Egypt.
Levine (1998) explored the effect of the banking sector development, proxies by
credit allocated by deposit-taking banks to the private sector divided by GDP, on
economic growth, capital accumulation and productivity growth. His empirical
analysis was based on 42 developed and less developed countries during the 1976-
1993 period. By using a panel data, he found a positive relationship between the
components of banking development with economic growth.
Levine and Zervos (1998) stated the impact of the stock market and the banking
sector development on economic growth for a cross-section of 42 countries over the
period 1976-1993.They showed that stock market liquidity and bank development
can predict economic growth, capital accumulation and productivity growth.
Levine (2000) also evaluated the role of financial development in a pooled cross-
section setup using averaged data across the period 1960-1995. Using a GMM
estimator, the authors showed that financial intermediary variables, namely, liquid
liabilities and private credit, and economic variables (annual growth rate of real GDP
have a statistically significant and positive effect on economic growth on a panel of
71 countries.
Similarly, Cole, Moshirian and Wu (2008) examined the relationship between
banking sector and economic growth for 18 developed and 18 emerging markets over
the period 1973-2001. By using dynamic panel techniques, they found a positive and
24
significant relationship between bank stock returns and GDP growth Researchers
have used different measures and methodologies to examine the causal relationship
between financial developments and economic growth.
Positive relationship between financial development and economic growth was
supported by Greenwood and Smith (1997) and Levine (1997). In their study found
that in establishment of credit in financial sector leads to improvement of economic
growth. They continued arguing that the establishment of the credit should not be
controlled by providing deposits because of the existent of an idle balance in the
system and the risk of borrowing from the financial system. Also Ghali (1999) gave
views by arguing that the availability of money in the financial system transforms
into the establishment of credit for funding economic activity thereby leading to high
economic growth.
For causal relationship between financial development and economic growth was
also examined by Akinboade (1998), the period of examination was from 1976 to
2005.The outcome of the findings showed that the direction of the relationship
between them is bidirectional. Both Financial Development and economic growth
depend to each other, thereby concluding that financial development and economic
growth in Botswana seem to supplement each other
Choe and Moosa (1999) also check the relationship between financial development
and economic growth for the country of Korea. The study focused on the relation
between development of financial intermediaries and capital markets. Causality test
shows that financial development in general leads to economic growth
Ghali (1999) examined practically the relationship of financial development and
Economic Growth, the aim was to observe which one between the two leads to
another in Tunisia Country. The examination was done using Vector auto regression
(VAR) technique. The outcome of findings revealed that there is secure relationship
between financial development and economic growth. The direction of the
relationship flows from financial development to economic growth
25
The study done by Calderon and Liu (2003), examined the causal relationship
between financial development and economic growth from the period of 1960 to
1964. The findings proved that usually, financial development directs economic
growth. Also the report revealed that the causal relationship between financial
development and economic growth is bidirectional. The implication of the findings is
that the growth of economy is influenced by the development of financial system;
also financial system development depends on the growth of the economy of the
country.
Most of studies have suggested that financial development is the most important
factor in supporting the economic growth Hasan, Koetter and Wedow (2009) in their
study of 31 chinese provinces using panel data revealed that financial institution
sector and financial markets encourage the GDP growth rates, Bittencourt (2012)
examined the function of financial development in supporting economic growth. The
case study was from four Latin American countries from 1980 to 2007 using time
analysis. The result indicated that financial development is the most important role in
leading to economic growth
Hsueh, Hu and Tu (2013) found the causal relationship between financial
development and economic growth of ten Asian countries from the1980 to 2007
period that the direction of causal relationship runs from financial development
indicators to economic growth in most countries within the study. Narayan and
Narayan (2013) confirmed that financial sector contributes to economic growth but
for the Middle Eastern countries result revealed that financial sector and banking
sectors do not support the economic growth excluding Asia which revealed weak
relations on the importance of financial development to economic growth
Al-Avad and Harb (2005), examined the relationship between financial development
and economic growth for ten Middle east and North Africa countries from 1969 to
2000 period. The report revealed that in long run financial development and
economic growth have a relationship to some level and in short run the causal
relationship revealed very weak between the two variables
26
Ben Salem and Trabelsi (2012) investigated the relationship between financial
development and economic growth over 1970 to 2006 using panel co integration
method. The result indicated that there is a long run relationship between financial
development and economic growth. But in short run indicated a week proof that
finance is a leading sector to the economic growth
Jung (1986) examined the causal problem of the relationship; the finding was that
financial sector development has a bi-directional relationship with economic growth.
In his study of 56 countries found that the causal direction flowing from financial
development to economic growth is more repeatedly observed than the reverse when
he runs regressions between GDP per capita and the proxies of financial
development. Interesting, Jung found that less developed countries are characterized
by a causal direction running from financial development to economic growth, while
developed countries are often characterized by a reverse causal direction
2.5 Variables of the study as used by other researchers
King and Levine (1993) examined the relationship between economic growth and
financial development indicators (liquid liabilities over GDP, bank credit over bank
credit plus central bank domestic credit to private sector divided by GDP) using
cross-sectional data for 77 countries over the 1960-1989 period. They showed that a
country’s level of financial development can predict its level of economic growth.
Godfrey Ndlovu (2013), used real Gross Domestic Product (GDP) per capital as a
measure of economic growth also used Domestic Credit to Private Sector, Stock
Market Capitalization Ratio to GDP as a measure of financial development to
determine the relationship between financial development and economic growth.
Antzoulatos (2008) studied four categories to create financial development indices,
and these include banks, financial institutions, stock market and bond market
development indices. The proxies for banking sector development included deposit
money bank assets to GDP, and private credit issued by domestic money bank to
GDP. The development of stock market captured by the stock market capitalization
to GDP, stock market total value traded to GDP, and finally with turnover ratio of
27
stock market. The proxies for the bond market development include private bond
market capitalization to GDP and public bond market capitalization to GDP.
Zhang (2012) used credit, deposit, Savings, corporate and stock market capitalization
as financial development indicators to examine the relationship between financial
development and economic growth in China using panel data
Demetriades (1996) employed the ratio of deposit to GDP to measure the financial
development in sixteen countries. The recommendation is that the currency in
circulation should be eliminated from the broad money stock to measure the financial
development, because an increase in the ratio of broad money to GDP shows the
wide use of currency in circulation rather than an increase in the volume of bank
stocks
Saci, Giorgioni and Holden (2009) measured the financial development by using the
principal component analysis. To measure the development of financial
intermediaries ten proxies for the financial development included. To measure the
importance of banking sector, the ratio of commercial bank assets commercial plus
central bank assets, credit issued to private sector to liquid liabilities, domestic credit
to the private sector to GDP, the ratio of liquid liabilities to GDP, was included. To
capture the impact of stock market development, the stock market capitalization to
GDP, turnover ratio, value traded ratio, number of listed companies, are examined.
The ratio of broad money and narrow money is also employed to examine the
structure of the financial system and its importance
28
CHAPTER THREE
METHODOLOGY
2.6 IntroductionThis chapter explains the methodology of research report. It
begins with providing the types and source of data which are secondary data that
were obtained from different sources online such as International Monetary Fund,
World Bank and Economic indicator records .Sample size used in this report covers
the period 1987-2013 for the selected east African countries that is, Tanzania, Kenya
and Uganda. Two variables were used in this report which are financial development
represented by three proxies (Domestic credit to private sectors, financial system
deposits and Liquidity Liabilities) and Economic growth that was represented by
annual growth rate. The chapter also shows two models that used to examine the
relationship between financial development and economic growth and the study
applied Quantitative research design .The relationship between financial
development and Economic growth was analyzed using Vector auto regression
model also two techniques used to test the presence of unit root (ADF and PP).
2.7 Types and sources of data
The study used Time series data that are secondary data in order to obtain the quality
information that have the required integrity in determining the nature of relationship
and examining the causal relationship between financial Development and economic
growth. The secondary data obtained from different sources online which are
International Monetary Fund, World Bank and Economic indicator records
Ghauri and Gronhaug (2005) argued that information collected by expertise
organizations offer more information. They went on saying that secondary data are
useful not only to find the information to solve our research problem but also to
better understands and explain our research problem.
The secondary data are generally expected to give high quality and reliability as they
are already collected and compiled by experts using appropriate methods. However,
in reaching at the final conclusion on the relationship between financial development
29
and economic growth in east African countries, the study obtained data from
different sources. These sources are International Monetary Fund, World Bank and
Economic indicator records
2.8 Sample Size
The sample size used in a study was determined basing on the method of data
collection, the available data and also the need to have sufficient and accurate result
to enable the researcher to gate the useful result for positive decision making
Lenth (2011), says that the sample must be big enough that an effect of such
magnitude as to be of scientific significance and also be statistically significant.
Large sample sizes generally lead to increased accuracy when estimating unknown
parameters. However, Lenth goes on suggesting that the sample must not be too big
where an effect of little scientific importance is nevertheless statistically detectable
this idea was supported by Sekaran (2003). For the purpose of this study, the
researcher used the sample that covered the period 1987-2013 for the selected east
African countries that is. Tanzania, Kenya and Uganda which is appropriate to give a
reasonable result
2.9 Variable Definitions, Measurement and articles (reference)
This study used two variables, financial development that was represented by three
proxies (Domestic credit to private sectors, financial system deposits and Liquidity
Liabilities) and Economic growth that was represented by annual growth rate. These
proxies were used also by previous researchers such as Zhang 2012, ndlovu (2013),
Saci and Holden (2008), King and Levine (1993), to examine nature and the causal
relationship between financial development and economic growth.
2.10 Variable Definitions:
2.10.1 Economic growth
Economic growth is an increase in the amount of goods and services produced per
head of the population over a period of time It is conventionally measured as the
30
percent rate of increase in real GDP. This study used annual growth rate of real GDP
as proxy of economic growth which is dependant variable; Annual growth rate of
real GDP was used as a proxy of economic growth in most of studies, researchers
that used Annual growth rate include King and Levine (1993), Demetriades and
Hussein (1996), and Mohamed A (2011)
2.10.2 Financial development
Financial development is usually defined as a process that marks improvement in
quantity, quality, and efficiency of financial intermediary, financial institution and
financial markets services. This process involves the interaction of many activities
and institutions. Financial development as defined by (Levine 2004) is a situation
where financial instruments, markets and intermediaries improve. Therefore in this
study financial development means improvement in financial institutions, financial
intermediaries and financial markets.
Financial development was determined by three proxies and therefore independent
variables, these are;
Domestic Credit to Private Sector (in percentage): refers to financial resources
provided to the private sector by financial institutions, such as through loans,
purchases of nonequity securities, and trade credits and other accounts receivable,
that establish a claim for repayment. This is a proxy of financial development that
helps to determine annual growth rate of real GDP which represents economic
growth. This proxy was used by Jalil and Ma, (2008). According to De gregorio and
Guidotti (1995) who suggested that this proxy is a good pointer of fund allocation to
private sector and therefore good proxy of financial development. According to
Akinboade 1998), Domestic credit is more effectively in private sector for
productivity than in public sector because provision of credit to private sector shows
efficiency and productive project or investment Demetriades and Hussein (1996).
Domestic credit is more preferred proxy of financial development for measuring
economic growth in developing countries
31
Liquid Liabilities (in percentage): A measure of the extent to which a person or
organization has cash to meet immediate and short-term obligations,. This also used
as a proxy of financial development. Most of researchers used this proxy as the major
indicator of financial depth; the proxy indicates the ratio of the size of the financial
sector to economic growth as suggested by Johannes (2011). It is usually considered
as the main pointer of financial depth, It is wider measure of accumulated monetary
economy Islam, Habib and Khan (2004), and the increase of liquidity liability ratio
indicates the improvement of financial deepening in the economy (Boulila and
Trabelis, 2002)
Financial system deposits: Refers to the system that covers financial transactions and
the exchange of money and link depositors with investors, borrower and lenders.
The total financial system deposits, (in percentage) as used by Zhang, Wang and
Wang (2012), beck (2009) and Demetriades (1996). This proxy is a good measure of
the overall size of financial intermediaries
2.11 The Econometric Model
The causal relationship between financial development and economic growth was
determined using Vector auto regression and granger causality model, thereby
identifying if there is any differences that exist between the east African countries.
The granger causality model used to determine the relationship, however in running
the model in stata program these variable were represented by their proxies that is
Economic Growth was represented by Annual growth rate to real GDP and Financial
Development was represented by three proxies which are liquid liabilities, Domestic
credit to the private sector and Financial System Deposits where each proxy of
Financial development was used to determine the causal relationship.
The model chosen based on the assumption that there is a relationship between
financial development and economic growth, in order to detect existing differences
between the selected countries. Therefore the model involved independent variable
(Financial development) that can explain variations in the dependent variable
(economic growth). The following is the equation that was used to explain Annual
32
growth rate of real GDP (Dependent variables) using three independent variables
which are Domestic credit to private sector, Liquidity Liability and financial
development deposits that is obtained through regression analysis. ( All variable in
percentage)
AGR= co + b1DC +b2LL+b3FSD+ et
Where;
AGR= Annual growth rate of real GDP that represents economic growth
DC = Domestic credit to Private sector denotes financial development
LL= Liquidity liabilities denotes financial development
FSD= Financial system deposits denotes financial development
co is the value AGR predicted to have when all the value of independent variables
are equal to zero. b1, b2 and b3 are the coefficient that describes the size of the effect
of independent variables (financial development) on dependent variable (economic
growth) and et is standard error, which is an estimate of the standard deviation of the
coefficient,
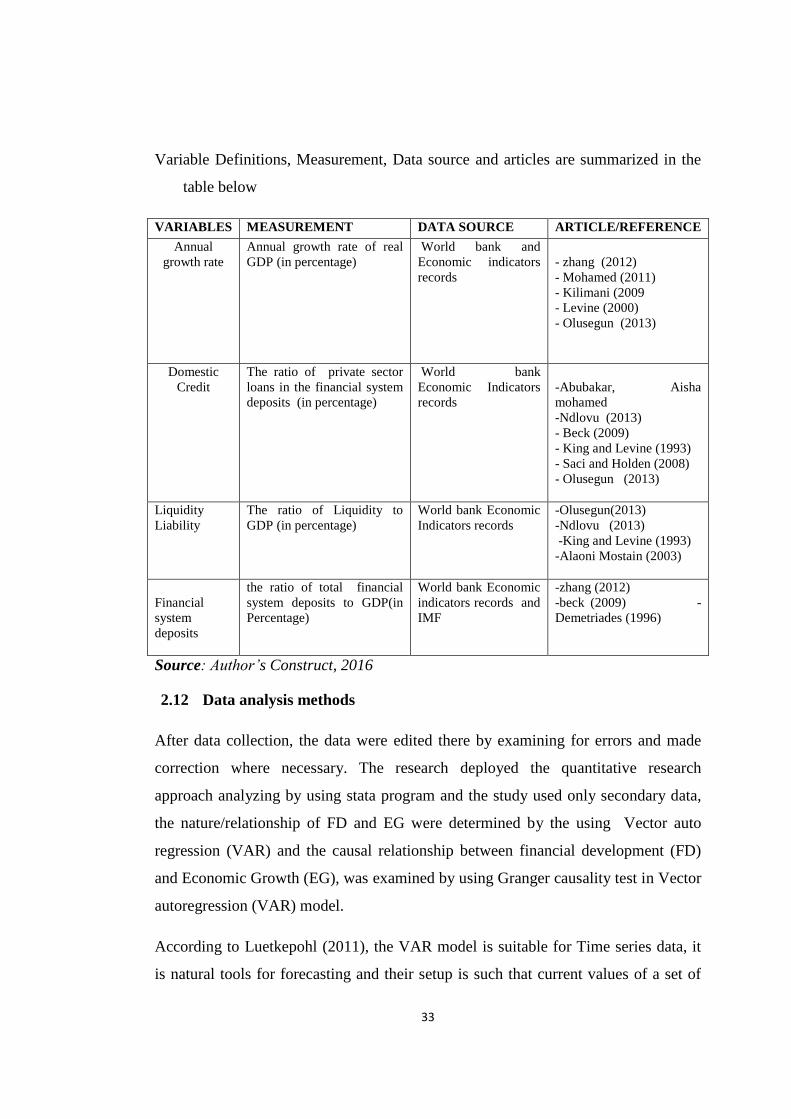
33
Variable Definitions, Measurement, Data source and articles are summarized in the
table below
VARIABLES MEASUREMENT DATA SOURCE ARTICLE/REFERENCE
Annual
growth rate
Annual growth rate of real
GDP (in percentage)
World bank and
Economic indicators
records
- zhang (2012)
- Mohamed (2011)
- Kilimani (2009
- Levine (2000)
- Olusegun (2013)
Domestic
Credit
The ratio of private sector
loans in the financial system
deposits (in percentage)
World bank
Economic Indicators
records
-Abubakar, Aisha
mohamed
-Ndlovu (2013)
- Beck (2009)
- King and Levine (1993)
- Saci and Holden (2008)
- Olusegun (2013)
Liquidity
Liability
The ratio of Liquidity to
GDP (in percentage)
World bank Economic
Indicators records
-Olusegun(2013)
-Ndlovu (2013)
-King and Levine (1993)
-Alaoni Mostain (2003)
Financial
system
deposits
the ratio of total financial
system deposits to GDP(in
Percentage)
World bank Economic
indicators records and
IMF
-zhang (2012)
-beck (2009) -
Demetriades (1996)
Source: Author’s Construct, 2016
2.12 Data analysis methods
After data collection, the data were edited there by examining for errors and made
correction where necessary. The research deployed the quantitative research
approach analyzing by using stata program and the study used only secondary data,
the nature/relationship of FD and EG were determined by the using Vector auto
regression (VAR) and the causal relationship between financial development (FD)
and Economic Growth (EG), was examined by using Granger causality test in Vector
autoregression (VAR) model.
According to Luetkepohl (2011), the VAR model is suitable for Time series data, it
is natural tools for forecasting and their setup is such that current values of a set of
34
variables are partly explained by past values of the variables involved. VARs provide
a flexible and tractable framework for analyzing economic time series. Granger-
causality is related to the well-known idea of Granger-non causality, but it accounts
better for the presence of multiple variables and is central to sufficiency results for
variable choice in VARs Jarociński and Maćkowiak (2013)
The Granger causality test establishes the causality between two or more variables
and shows that causal relationship is either bi - directional or uni - directional or
independent among the variables under study Olukayode (2013), this is relevant to
this study as it examined the causal relationship between financial development and
economic growth using granger causality test.
Many macroeconomic time series contain unit roots dominated by stochastic trends
as developed by Nelson and Plosser (1982). In a time series test, the first thing to do
is to determine if there are common stochastic trends present among the variables. In
other words, the test is to determine the stationarity of the dataset. According to
Granger and Newbold (1974), time series data is capable of producing spurious
regressions which can generally mislead. Thus, the study deployed Augmented Dick-
Fuller (ADF) and Phillip-Perron techniques to test for the presence of unit roots in
the data. These technique also were used by olukayode (2013), Christopoulos (2004)
,Kilimani (2009) and Abu-Bader and Abu-Qarn (2005)
35
CHAPTER FOUR
PRESENTATION OF FINDINGS AND INTERPRETATION
2.13 IintroductionThis chapter shows of what the researcher has found after
running the data. After collecting the data and analyzing them as described in chapter
three, the chapter presents of what actually was found. It shows the nature of the
relationship and the causal relationship between financial development and economic
growth as depicted by the model. The information in this chapter is mainly on how
the result shows and not researcher’s opinion. The findings are presented in line with
the research specific objectives
2.14 Presentation of Findings
The report has three specific objectives; the first one is to examine the relationship
between financial development and economic growth and the second objective was
to determine the nature of the relationship in these cases, time series linear regression
was used to examine the relationship and the nature between financial development
and economic growth. The dependent variable is economic growth represented by
annual growth while independent variable is financial development represented by
domestic credit to private sector, Liquidity Liabilities and Financial system deposits.
The third objective is to determine the causal relationship between financial
development and economic growth. The researcher used granger vector
autoregession (VAR) test to determine the causal relationship
2.14.1 The nature of relationship between economic growth and financial
development
The nature of relationship between financial development and economic growth in
east African countries was determined basing on the data of each country and the
result was as shown in tables and explained independently
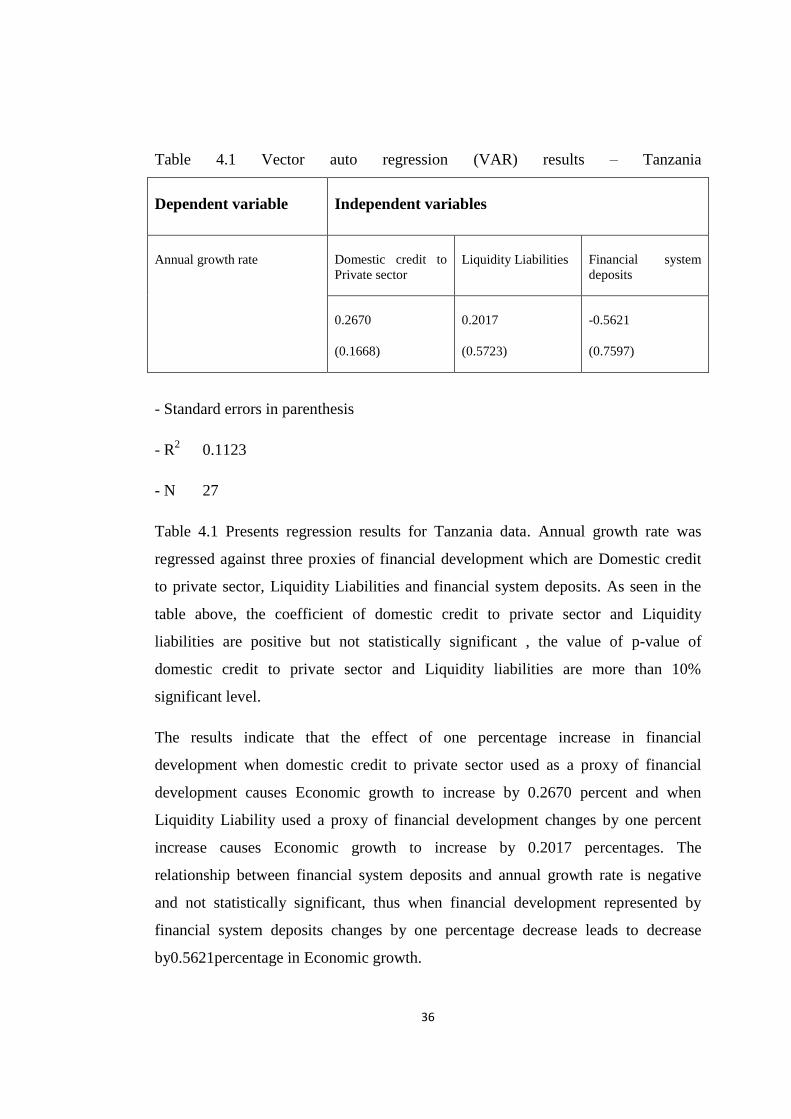
36
Table 4.1 Vector auto regression (VAR) results – Tanzania
Dependent variable Independent variables
Annual growth rate Domestic credit to
Private sector
Liquidity Liabilities Financial system
deposits
0.2670
(0.1668)
0.2017
(0.5723)
-0.5621
(0.7597)
- Standard errors in parenthesis
- R2 0.1123
- N 27
Table 4.1 Presents regression results for Tanzania data. Annual growth rate was
regressed against three proxies of financial development which are Domestic credit
to private sector, Liquidity Liabilities and financial system deposits. As seen in the
table above, the coefficient of domestic credit to private sector and Liquidity
liabilities are positive but not statistically significant , the value of p-value of
domestic credit to private sector and Liquidity liabilities are more than 10%
significant level.
The results indicate that the effect of one percentage increase in financial
development when domestic credit to private sector used as a proxy of financial
development causes Economic growth to increase by 0.2670 percent and when
Liquidity Liability used a proxy of financial development changes by one percent
increase causes Economic growth to increase by 0.2017 percentages. The
relationship between financial system deposits and annual growth rate is negative
and not statistically significant, thus when financial development represented by
financial system deposits changes by one percentage decrease leads to decrease
by0.5621percentage in Economic growth.
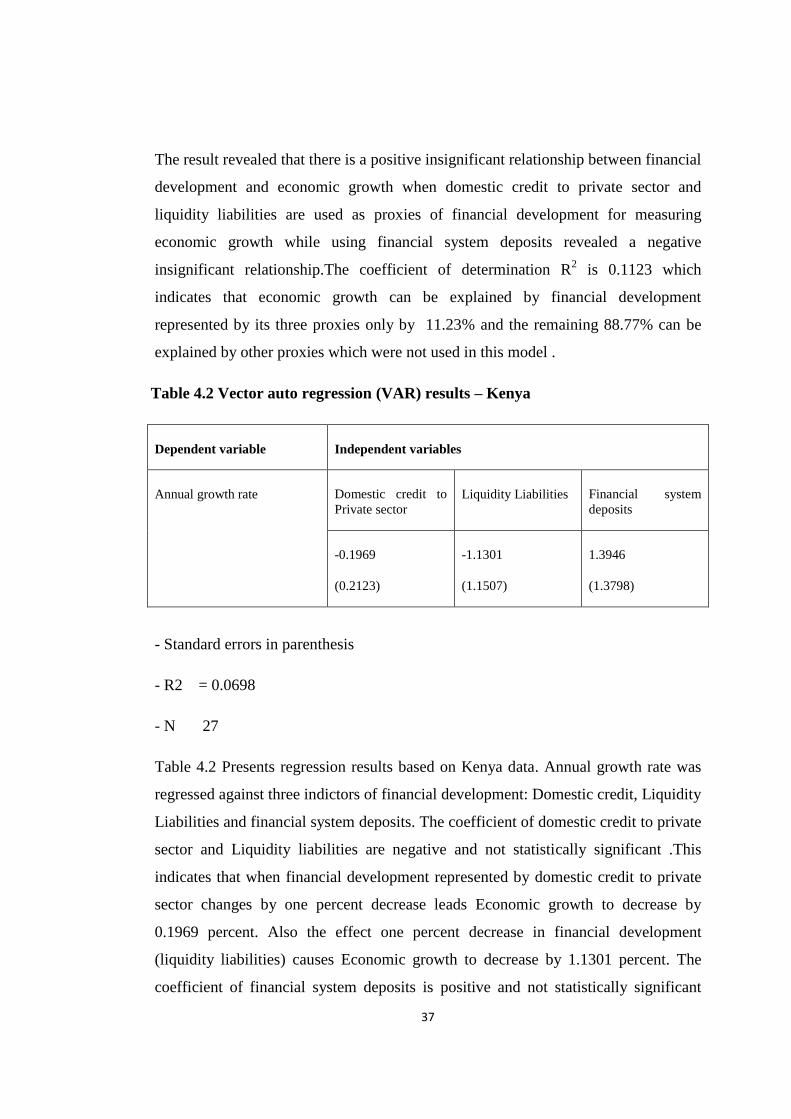
37
The result revealed that there is a positive insignificant relationship between financial
development and economic growth when domestic credit to private sector and
liquidity liabilities are used as proxies of financial development for measuring
economic growth while using financial system deposits revealed a negative
insignificant relationship.The coefficient of determination R2 is 0.1123 which
indicates that economic growth can be explained by financial development
represented by its three proxies only by 11.23% and the remaining 88.77% can be
explained by other proxies which were not used in this model .
Table 4.2 Vector auto regression (VAR) results – Kenya
Dependent variable Independent variables
Annual growth rate Domestic credit to
Private sector
Liquidity Liabilities Financial system
deposits
-0.1969
(0.2123)
-1.1301
(1.1507)
1.3946
(1.3798)
- Standard errors in parenthesis
- R2 = 0.0698
- N 27
Table 4.2 Presents regression results based on Kenya data. Annual growth rate was
regressed against three indictors of financial development: Domestic credit, Liquidity
Liabilities and financial system deposits. The coefficient of domestic credit to private
sector and Liquidity liabilities are negative and not statistically significant .This
indicates that when financial development represented by domestic credit to private
sector changes by one percent decrease leads Economic growth to decrease by
0.1969 percent. Also the effect one percent decrease in financial development
(liquidity liabilities) causes Economic growth to decrease by 1.1301 percent. The
coefficient of financial system deposits is positive and not statistically significant
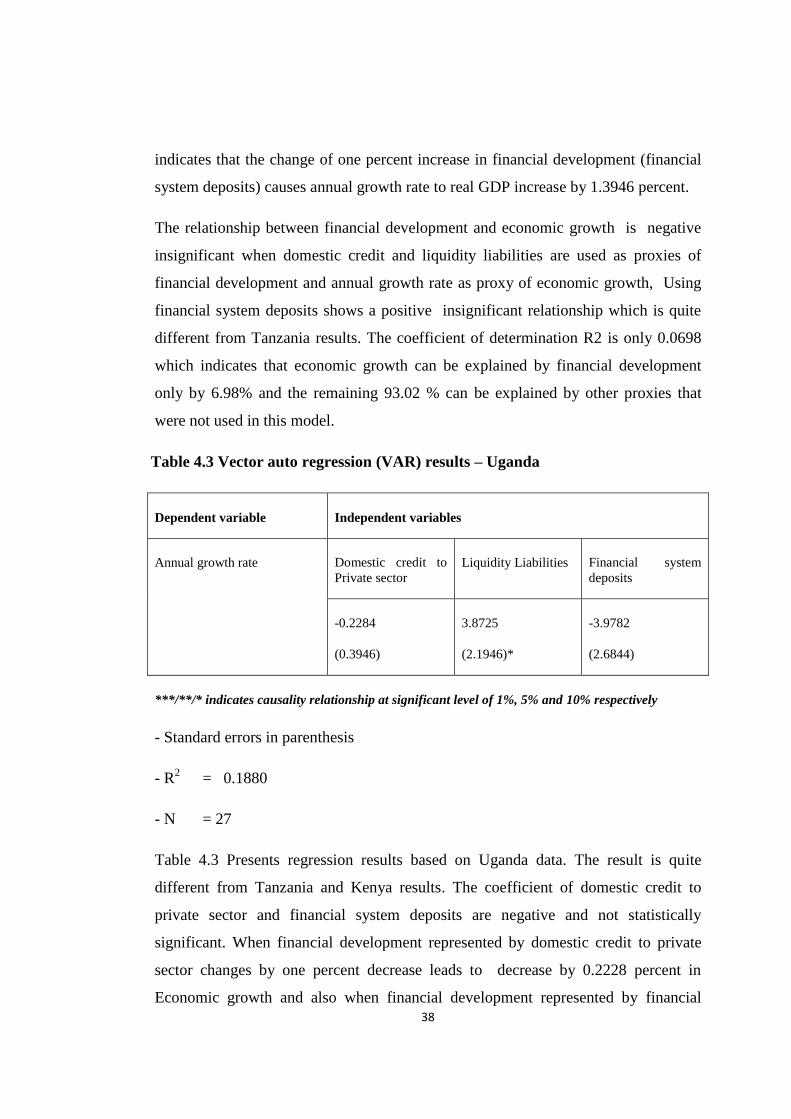
38
indicates that the change of one percent increase in financial development (financial
system deposits) causes annual growth rate to real GDP increase by 1.3946 percent.
The relationship between financial development and economic growth is negative
insignificant when domestic credit and liquidity liabilities are used as proxies of
financial development and annual growth rate as proxy of economic growth, Using
financial system deposits shows a positive insignificant relationship which is quite
different from Tanzania results. The coefficient of determination R2 is only 0.0698
which indicates that economic growth can be explained by financial development
only by 6.98% and the remaining 93.02 % can be explained by other proxies that
were not used in this model.
Table 4.3 Vector auto regression (VAR) results – Uganda
Dependent variable Independent variables
Annual growth rate Domestic credit to
Private sector
Liquidity Liabilities Financial system
deposits
-0.2284
(0.3946)
3.8725
(2.1946)*
-3.9782
(2.6844)
***/**/* indicates causality relationship at significant level of 1%, 5% and 10% respectively
- Standard errors in parenthesis
- R2 = 0.1880
- N = 27
Table 4.3 Presents regression results based on Uganda data. The result is quite
different from Tanzania and Kenya results. The coefficient of domestic credit to
private sector and financial system deposits are negative and not statistically
significant. When financial development represented by domestic credit to private
sector changes by one percent decrease leads to decrease by 0.2228 percent in
Economic growth and also when financial development represented by financial
39
system deposits changes by one percent decrease leads to decrease by 3.9782 percent
in Economic growth. When financial development as represented by Liquidity
liabilities changes by one percent increase leads to increase by 3.8725 percent in
Economic growth and statistically significant at 10% level of significant which
indicates that The result indicates a negative insignificant relationship between
financial development and economic growth when domestic credit to private sector
and financial system deposits used as indicators of financial development and annual
growth rate as indicator of economic growth. Using liquidity liabilities shows a
positive insignificant relationship .The coefficient of determination R2 indicates that
Annual growth rate can be explained by financial development proxies only by
18.80% and the remaining 81.20 % can be explained by other proxies that was not
included in the model.
2.14.2 Causal relationship between financial development and economic growth
The result of granger causality test are explained in term of the relationship between
financial development which is represented by domestic credit to private sector,
liquidity liabilities and financial system deposits and the Economic growth which is
represented by annual growth rate. The results obtained after running the model were
as shown in table 4.4, 4.5 and 4.6 below
From table 4.4 shows that Domestic credit to private sector, Liquidity Liabilities and
financial system deposits which used as proxies of financial development causes
Economic growth which was represented by annual growth rate in this model.
Domestic credit to private sector causes Annual growth rate at 1% level of significant
and Liquidity liabilities and financial system deposits causes’ annual growth rate at
5% statistically significant level
Also the results indicate that Annual growth rate which is proxy of economic growth
causes Domestic credit to private sector which represent financial development at
1% significant level. But the results do not indicate the causal relationship running
from annual growth rate to Liquidity Liabilities and from annual growth rate to
financial system deposits. This means that only one proxy of financial development
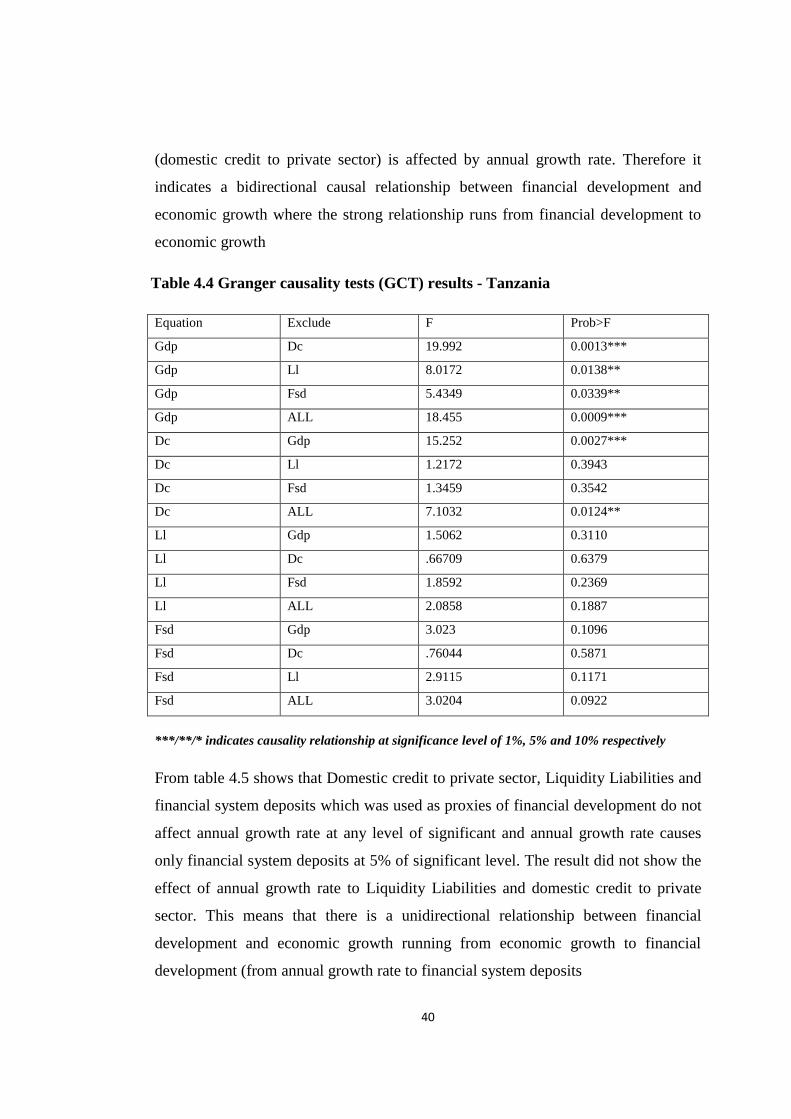
40
(domestic credit to private sector) is affected by annual growth rate. Therefore it
indicates a bidirectional causal relationship between financial development and
economic growth where the strong relationship runs from financial development to
economic growth
Table 4.4 Granger causality tests (GCT) results - Tanzania
Equation Exclude F Prob>F
Gdp Dc 19.992 0.0013***
Gdp Ll 8.0172 0.0138**
Gdp Fsd 5.4349 0.0339**
Gdp ALL 18.455 0.0009***
Dc Gdp 15.252 0.0027***
Dc Ll 1.2172 0.3943
Dc Fsd 1.3459 0.3542
Dc ALL 7.1032 0.0124**
Ll Gdp 1.5062 0.3110
Ll Dc .66709 0.6379
Ll Fsd 1.8592 0.2369
Ll ALL 2.0858 0.1887
Fsd Gdp 3.023 0.1096
Fsd Dc .76044 0.5871
Fsd Ll 2.9115 0.1171
Fsd ALL 3.0204 0.0922
***/**/* indicates causality relationship at significance level of 1%, 5% and 10% respectively
From table 4.5 shows that Domestic credit to private sector, Liquidity Liabilities and
financial system deposits which was used as proxies of financial development do not
affect annual growth rate at any level of significant and annual growth rate causes
only financial system deposits at 5% of significant level. The result did not show the
effect of annual growth rate to Liquidity Liabilities and domestic credit to private
sector. This means that there is a unidirectional relationship between financial
development and economic growth running from economic growth to financial
development (from annual growth rate to financial system deposits
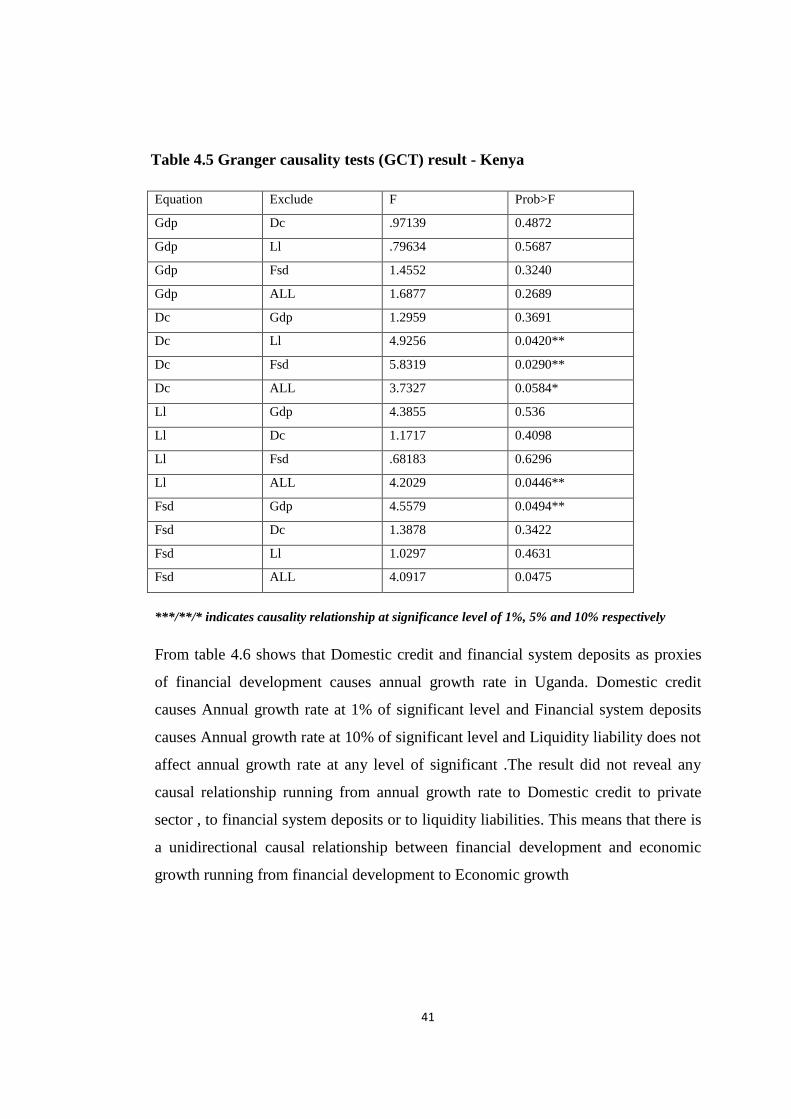
41
Table 4.5 Granger causality tests (GCT) result - Kenya
Equation Exclude F Prob>F
Gdp Dc .97139 0.4872
Gdp Ll .79634 0.5687
Gdp Fsd 1.4552 0.3240
Gdp ALL 1.6877 0.2689
Dc Gdp 1.2959 0.3691
Dc Ll 4.9256 0.0420**
Dc Fsd 5.8319 0.0290**
Dc ALL 3.7327 0.0584*
Ll Gdp 4.3855 0.536
Ll Dc 1.1717 0.4098
Ll Fsd .68183 0.6296
Ll ALL 4.2029 0.0446**
Fsd Gdp 4.5579 0.0494**
Fsd Dc 1.3878 0.3422
Fsd Ll 1.0297 0.4631
Fsd ALL 4.0917 0.0475
***/**/* indicates causality relationship at significance level of 1%, 5% and 10% respectively
From table 4.6 shows that Domestic credit and financial system deposits as proxies
of financial development causes annual growth rate in Uganda. Domestic credit
causes Annual growth rate at 1% of significant level and Financial system deposits
causes Annual growth rate at 10% of significant level and Liquidity liability does not
affect annual growth rate at any level of significant .The result did not reveal any
causal relationship running from annual growth rate to Domestic credit to private
sector , to financial system deposits or to liquidity liabilities. This means that there is
a unidirectional causal relationship between financial development and economic
growth running from financial development to Economic growth
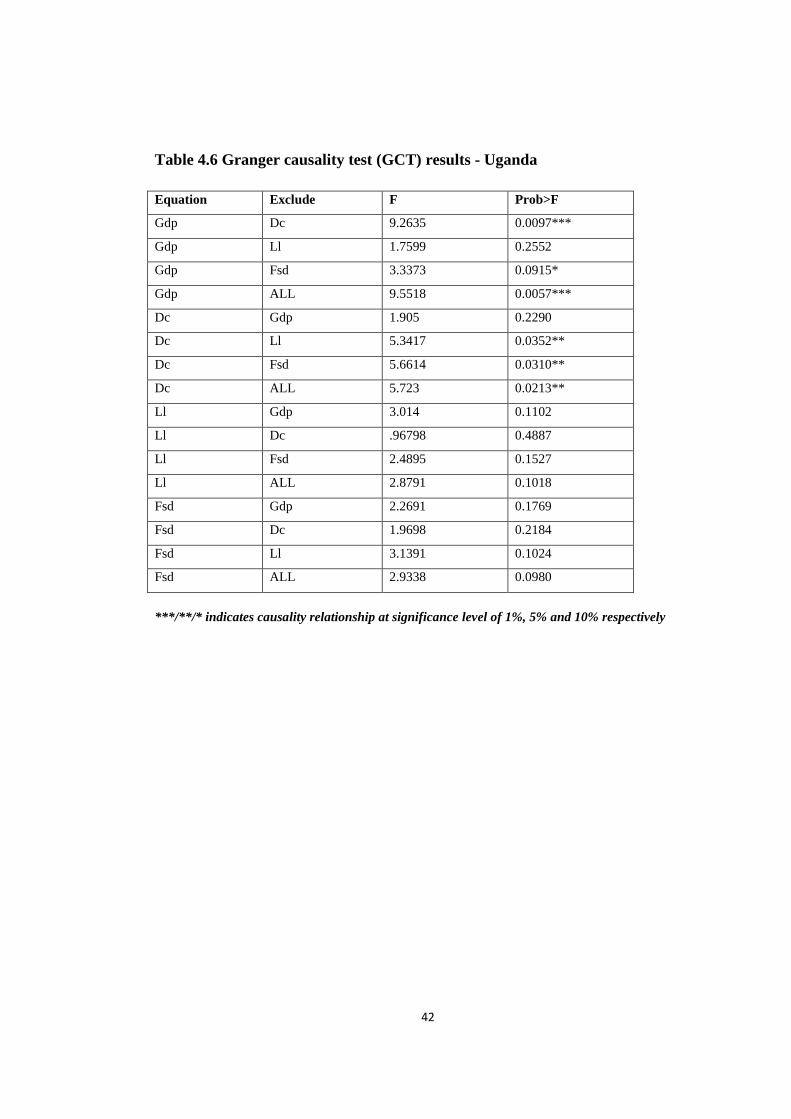
42
Table 4.6 Granger causality test (GCT) results - Uganda
Equation Exclude F Prob>F
Gdp Dc 9.2635 0.0097***
Gdp Ll 1.7599 0.2552
Gdp Fsd 3.3373 0.0915*
Gdp ALL 9.5518 0.0057***
Dc Gdp 1.905 0.2290
Dc Ll 5.3417 0.0352**
Dc Fsd 5.6614 0.0310**
Dc ALL 5.723 0.0213**
Ll Gdp 3.014 0.1102
Ll Dc .96798 0.4887
Ll Fsd 2.4895 0.1527
Ll ALL 2.8791 0.1018
Fsd Gdp 2.2691 0.1769
Fsd Dc 1.9698 0.2184
Fsd Ll 3.1391 0.1024
Fsd ALL 2.9338 0.0980
***/**/* indicates causality relationship at significance level of 1%, 5% and 10% respectively
43
CHAPTER FIVE
DISCUSSION OF THE FINDINGS
2.15 Introduction
This chapter discusses in detail the findings presented in chapter four. It begins with
discussing on the relationship examined and the nature of the relationship between
financial development and economic growth and also on causal relationship which is
the main concern of the report. Discussion based on what actually was revealed in
this report and made comparison from the results that were found by previous
researchers regarding the nature and the causal relationship between financial
development and economic growth. Also discussion based on how each proxy of
financial development relates or affects economic growth
2.16 The Relationship between financial development and economic growth
The nature of the relationship between financial development and economic growth
was determined as presented in Tables, 4.1, 4.2 and 4.3, that Domestic credit to
private sector revealed negative insignificant relationship for Kenya and Uganda
while for Tanzania revealed positive insignificant relationship to annual growth rate.
For all times in this study domestic credit to private sector when used as a proxy of
financial development the relationship between financial development and economic
growth in all countries under study indicated either positive or negative but
insignificant at all significance levels (Table 4.1 - 4.3)
Liquidity Liabilities as a proxy of financial development revealed positive
relationship for Tanzania and Uganda but for Kenya revealed Negative relationship.
In all cases Tanzania and Kenya results found not to be statistically significant but
for Uganda the result revealed positive statistically significant at 10% level of
significant. This means that there is a positive relationship between financial
development and economic growth in Tanzania, and Uganda but for Kenya it is
44
negative relationship when a Liquidity liability is applied as a proxy of financial
development
For Financial system deposits as a proxy of financial development revealed negative
relationship for Tanzania and Uganda but for Kenya revealed a positive relationship
and in all cases they are not statistically significant. The results indicates that there is
a negative relationship between financial development and economic growth for
Tanzania and Uganda, for Kenya there is a positive relationship when financial
system deposits is used as a proxy of financial development
The positive relationship between financial development and economic growth is
supported by Greenwood and Smith (1997) and (Levine 1997). They suggested that
in improving financial sector and the formation of credit contributes to the growth of
economy. Also was supported by Ghali (1999) who explained that the accessibility
of money in the financial system leads to the formation of credit to finance economic
activity and therefore improvement of economic growth.
The prevailing view of economist and theories suggests that financial development
and economic growth have a positive relationship. This can be agreed due to the
reason that financial development helps the improvement of the financial system by
carrying out various functions and these functions contributes to the influence of
savings and investment decisions thereby contributing the growth of economy.
Schumpeter, (1911) emphasized that the services given by the financial institutions
are significant for improvement and development which in turn contributes to the
growth of economy
The negative relationship between financial development and economic growth can
be due to the effect of Government interference on the development of financial
system as analyzed by Fry (1978, 1980) and Galbis (1977). According to them the
effect of the government interference to give limits such as credit ceilings and high
reserve requirements on the banking system which can cause a negative impact on
the development of the financial sector/institutions and this can lead to the negative
impact on economic growth.
45
These results shows that for each proxy of financial development used, gives the
same result for only two countries and different result in one country. This can be
argued that although east African countries have different economies but to some
extent the relationship between financial development and economic growth in one
country relates to another country when either one of the proxy is used (Domestic
credit to private sector, Liquidity Liabilities or financial system deposits) as
indicators of financial development to measure annual growth rate. These can be
argued that the relationship between these variables in one country relates to another
country meaning that if one proxy is used for example Domestic credit to private
sector indicated insignificant relationship for Uganda and Kenya (table 4.1,4.2, and
4.3). However the result did not indicate the same results for all countries when each
of the proxy was used as a measure of economic growth.
The coefficient of determination (R2) for all countries is less than 50% This means
that the chosen proxies of financial development do not explain more the economic
growth in east African countries The model were found not to be adequate because
the probability values for all cases were found not to be statistically significant
except Liquidity liability which indicated positive significant relationship for Uganda
at 10% level of significant. This can be argued that the variables selected as proxies
of financial development may not be suitable for measuring economic growth in east
African countries.
2.17 Causal relationship
From table 4.4 The result revealed that all proxies of financial development
contributes on economic growth and also economic growth in Tanzania contributes
to the development of financial system as annual growth rate cause domestic credit to
private sector. This indicates that there is bidirectional causal relationship between
financial development and economic growth, thus economic growth in Tanzania
depends on financial development, meaning that the increase of the ratio of domestic
credit to private sector, liquidity liabilities and the increase of deposit in the system
contributes to the growth of economy.
46
Also economy growth contributes to the increase, improvement and development of
financial institution or intermediaries in Tanzania, although the causal relationship of
economic growth to financial development is weak because only one proxy was seen
to be affected by economic growth, the result did not reveal the effect of economic
growth to liquidity liabilities as well as to financial system deposit. Since each proxy
was representing financial development, the effect of economic growth to any one of
proxy indicates that economic growth has a contribution to financial development.
Therefore this report indicates that there is bidirectional relationship between
financial development and economic growth in Tanzania.
The result of bidirectional is supported by Kar and Pentecost (2000) who found that
the causality runs from both directions and also revealed that the strength of the
causality running from economic growth to financial development is higher, which is
quit contrary to this study .The result of this study revealed that the strength of
causality run from financial development because all proxies of financial
development revealed the causal to economic growth and only one proxy was seen
to be affected by economic growth in Tanzania (domestic credit to private sector).
According to Andersen (2003) who argued that providing credit to the private sector
can increase investments, which again can accelerate economic growth. However, it
is also possible to argue for the fact that it can be difficult to develop a financial
sector without any economic resources that already existing
The contribution of Financial development to economic growth can be due to the fact
that the services provided by financial institution to their customers such as issuing
loans and investment, providing outlet for savings and other many services leads to
the economic growth. This argument was supported by Pradhan (2009), where the
researcher documented that the effect of financial development must be considered
as a variable necessary to stimulate economic growth and vice versa.
Also this result was supported by Wood (1993) who examined the causal relationship
between financial development and economic growth in Barbados during the 1946-
1990 period and found a bi-directional causal relationship between financial
development and economic growth. However, this direction relationship between
47
financial development and economic growth in Tanzania should not be taken as a
final conclusion but more researches need to be done using other proxies because the
chosen ones for representing financial development showed small percentage that
explained the dependent variable (economic growth). Therefore these proxies may
not be the proper explanatory to this model for measuring economic growth in
Tanzania.
From table 4.5 the result revealed that financial development in Kenya does not have
any effect on Economic growth. Only Economic growth leads to financial
development when financial system deposit is used as a proxy of financial
development. That means there is a unidirectional relationship between the two
variables. This result is supported by Guryay (2007) whereby the results revealed
that the causal relationship flows from economic growth to financial development. In
other words, financial development is influenced by economic growth and is contrary
to the result from table 4.4 above.
Another support to this study is from Chimobi (2010) who examined the causal
relationship among financial development and economic growth in Nigeria using the
vector auto regression (VAR) approach for the Granger causality test over the period
1970 – 2005. The causal results reveal a unidirectional causality running from
economic growth to financial development. This implies that economic growth leads
to financial development.
Also Odhiambo (2008) supported this results of Kenya, in his study concluded that it
is the economic growth which causes financial development. But he cautioned that
the causality relationship between financial development and economic growth is
sensitive to the choice of proxies of financial development .The result is opposite to
what was found by Akinlo and Egbetunde (2010) who found that there is a
bidirectional relationship between financial development and economic growth in
Kenya
These results is also different from what was revealed by Onuoga (2014) who found
that from all the estimated results of his study there is bi-directional causality
48
between financial development and economic growth in Kenya in the period of
study. The results agreed with other previous studies of (Songul 2009) that found bi-
directional causality between financial development and economic growth for Sub-
Saharan Africa and Rachdi and Mbarek (2011), whose findings revealed the
existence of bi-directional causality for OECD countries. The results also was
opposite to what found by Akinlo and Egbetunde (2010) whose findings confirmed
existence of bi-directional causality between financial development and economic
growth in Kenya.
Table 4.6 revealed that financial development in Uganda influences the economic
growth when domestic credit to private sector used as proxy of financial
development and not vice versa. The relationship between financial development and
economic growth is unidirectional. The result is contrary to those results for
Tanzania and Kenya. This relationship is supported by Gupter (1984) whose result
indicated that financial development leads to economic growth, also King and Levine
(1993) who examined the relationship between economic growth and financial
development whereby their result showed that a country’s level of financial
development can predict its level of economic growth, also Kilimani (2009),
Boulika, Trabelisi (2002) and Nowbusting, Ramsohok and Ramsohok (2010). This
result also is supported by Jung (1986) whose findings revealed that less developed
countries are characterized by a causal direction running from financial to economic
development
These results indicate that each country in east Africa has its own way of developing
in term of economic and financial institutions. As seen in Tanzania as financial
institution improves (increases) contributes the growth of economy and also as
economy grows leads to the improvement and increase of financial development. For
Kenya it is one way direction, only economic growth contributes to the development
of financial development, the development of financial institution does not have any
impact on economic growth and for Uganda, financial development contributes to
the growth of economy.
49
The implication of these results indicates that there is a need for east African
countries to improve their financial system for economic growth improvement. The
government of these countries should organize and support the improvement of
financial sectors which in turn leads to the economic growth. Financial system need
to be developed in such a way that it makes easier and attract foreigners to improve
or to establish financial institutions.
According to Andersen (2003), a well- improved financial system can be seen as
well-offered financial services that can contribute to more competition. Competition
brings more effective and efficient output such that lowering prices with high quality
of goods or services, Interest rate and taxes that can be reduced to a reasonable
percentage and also credits limitations can be reduced thereby allowing more
committed people to invest in the country. Andersen continued arguing that by
increasing services that rendered by financial sectors can lead to higher employment
opportunities which in turn improves economy of a country
Also the result showed that each country indicated only one proxy that showed a
positive relationship which differ from other countries. But for two countries the
relationship was insignificant and only Liquidity Liabilities indicated a positive
significant relationship for Uganda. Meaning that, more efforts are needed to
improve those proxies for development of economic growth. Also this indicates that
the government of the east African countries need to corporate to see what can be
done in order the three proxies used in this report to be the main factor that will
affect or contribute to economic growth positively in each country of east Africa.
According to Odhiambo (2011), the relationship between financial development and
economic growth may be sensitive to the proxy variables used to represent financial
development
The Governments of the east African countries together should improve the way of
operating their financial system with encouraging operating environment, by doing
so these countries will be able to support the economic positively by enabling
domestic credit to be accessible easily, enhancing the level of deposits and also
employments opportunities will be provided more to their people
50
There are several factors that might account for the differences between these
countries in the direction of causality between financial development and economic
growth, among these are; The selected proxies of financial development may not be
proper for measuring economic growth in each country under study, the used types
of data (time series data) may not also be suitable for this model. Also Different
policies, laws and regulations followed by the countries under consideration. As
according to Islam, Habib and Khan (2004), developing countries have their own
socioeconomic, political and institutional history which makes them different from
each other, and therefore existence of a reverse causality between finance and growth
(Levine, 2005), Said that although financial institutions and markets can foster
economic growth through several channels, but since many market frictions exist and
laws, regulations, and policies differ markedly across economies and over time,
improvements along any single dimension may have different implications for
resource allocation and welfare depending on other frictions in the economy.
51
CHAPTER SIX
SUMMARY, CONCLUSION AND RECOMMENDATIONS
2.18 Summary
This study examined the causal relationship between financial development and
economic growth in east African countries. The selected countries was three;
Tanzania, Kenya and Uganda which represent the all east African countries over the
years from 1987-2013. The study used granger causality test to test causality
relationship and Vector auto regression to test the relationship .Three proxies of
financial development used to measure annual growth rate which was a proxy of
Economic growth. These proxies of financial Development are domestic credit to
private sector, liquid liabilities and financial system deposits. The tests were done at
the country level and the study at all level of findings revealed that there is no
significant relationship between financial development and economic growth. The
causal relationship outcomes for all three countries were different from each other.
For Tanzania the causal relationship found to be bidirectional, Kenya the causal
relationship runs from economic growth to financial development and for Uganda the
causal relationship runs from financial development to Economic growth.
2.19 Conclusions
The causal relationship between financial development and economic growth for the
countries under study between 1987 and 2013 was not related to each other. for
Tanzania the result revealed bidirectional relationship meaning that policies , laws
and regulation designed to enhance efficiency for financial institutions/sectors and
economic growth have the same benefit to each other. For Kenya there is
unidirectional relationship running from economic growth to financial development
and for Uganda also the result showed unidirectional relationship but running from
financial development to economic growth, none of the proxies of financial
52
development found to have a significant effect on economic growth in these
countries.
Therefore one can simply say that the level of economic growth depends on the
proxies used by the researcher for financial development. Thus domestic credit to
private sector, liquidity liabilities and financial deposits might not contribute much to
the growth of economies in east African countries because the result found
insignificant relationship of financial development to economic growth in the
countries under study
The result of Tanzania maintained the result found by Quin and Ndiege (2013),
Pradha (2009), Calderon and Liu (2003) that the causal relationship between
Financial Development and Economic growth is bidirectional, meaning that both
financial development and economic growth make better to each other.
Using Domestic credit for Tanzania the result showed a positive insignificant
relationship, it indicates that this proxy is a good measure of economic growth. But
the insignificant means that there is a need of improving these domestic credit that
given by banking institutions for the growth of economy in Tanzania.
Findings from Kenya revealed that it economic growth that leads to financial
development. Also only one proxy of financial development (financial system
deposits) showed a positive insignificant relationship between financial development
and economic growth. This indicates that laws and regulation regarding the system of
deposits in Kenya need to be improved so that financial development can contribute
positive significant impact on economic growth.
For Uganda the report indicates that it is the financial development that leads to
economic growth. And Liquidity Liabilities is the only proxy for Uganda that gave
Positive relationship, meaning that the size of banking sector in Uganda need to be
improved more for the economic growth
53
2.20 Recommendations
The selected proxies of financial development may not be the proper representative
for measuring economic growth in this area and the used type of data (time series
data) may not also be suitable for this model. The small value of coefficient of
determination indicates that the proxies of financial development selected was not
suitable for explaining and measuring economic growth in east African countries(
less than 50% ). Therefore more researches need to be done by using different
proxies of financial development and use different types of data such as Panel data or
cross sectional data to see if the result will remain as the current study’s results.
There are different policies, laws and regulations followed by countries under
consideration. Although the use of the same policies, laws and regulations may be
difficult due to their own socioeconomic, political and institutional history which
makes them different from each other but it is the way of making their economies
and development of financial institutions equal all over the countries under study.
Therefore the government and Policy makers should considered these results as a
base of formulating of their future financial and economic policies, regulations and
laws for all east African countries
Tanzania should support and improve their credit system by formulating suitable
policy, laws and regulations for better economic growth and all financial
development that exist should be developed and encouraged more for the
improvement of the economic growth. Kenya should improve their financial system
deposits and Uganda should continue improving more their Liquidity Liabilities in
financial sector.
The east African countries should come together to review their policies, regulations
and laws that restricts the operation of financial system and also should remove their
barriers that hinder the effectiveness and efficiency operation of financial system in
their countries so that the economic growth of east African countries are highly
improved. Therefore policies makers in east African countries should make sure that
54
the formulation of laws that support financial systems in one country reflects to those
of other countries in east Africa.
The Government of East African countries should provide relevant structures and
environment for the smooth operation of financial institutions in these countries.
With an improved operating environment, the financial sector will contribute
positively to economic growth as it will provide more employment opportunities and
make credit easily accessible to qualifying applicant and deficient units and also
increase their deposit levels so that financial sector plays an important role in
economic growth.
55
REFERENCES
Abu-Bader, S. and Abu-Qarn, A. M. (2005). Financial development and economic
growth. Discussion Paper No. 05-14a Monaster Centre for Economic
Research , Discussion Paper No. 05-14a.
Akinboade, O.A. (1998). Financial Development and Economic Growth. a test for
causality, Savings and Development, XX11(3), , 331-347.
Al - Avad.M and Harb.N. (2005). Financial deepening and economic growth in the
middle east. Applied Financial Economics , 1041-1051.
Andersen. S. R. (2003). The influence and effect of financial development on
economic growth. an emperical approach .
Apergies . N , Filippidi .I and Economidou . C. (2007). Financial deepening and
economic growth linkages. Review of world of Econimics 143(1) , 179-198.
Aziakpono, M. (2005). Financial Development and Economic Growth in Southern
Africa. Reducing Capital Cost in Southern Africa , 137–167.
Beck, T., & Levine, R. &. (2000). Finance and the sources of growth. Journal of
Financial , 58: 261-300.
Beck, T; Levine, R & Loyaza, N. (2000). Finance and the sources of growth. Journal
of Financial Economics, , 58: 261-300.
Ben Salem, J.B and Trabelsi M. (2012). More on finance and growth in the Middle
East and North African region: More growth,more finance. Middle Eastern
Finance and Economics 17 , 113-124.
Benhabib, J & Spiegel, M. (2000). The role of financial development in growth and
investment. Journal of Economic Growth , 341-360.
Bordo, M.D., and Meissner, C.M.,. (2006). The role of foreign currency debt in
financial. Journal of Banking and Finance , 3299-3329.
56
Boulika, G., Trabelisi, M. (2002). Financial Development and Long-Run Growth:.
Granger Causality in Bivariate VAR Structure , 875.
Boyd J.H and Prescott E.C. (1986). Financial intermediary. Journal of economic
theory 38 , 211-232.
Calderon C and Liu L. (2003). Direction of causality between financia development
and economic growth. Jounal of Development Economics , 321-324.
Chimobi, O.P. (2010). The causal relationship among Financial Development and
Economic growth. International Journal of Economics and Finance , vol.2
no.2.
Choong, C. Z. (2001). Choong, C. K., Z. Yusop, S. H. Law“Financial Development
and Economic Growth in Malaysia: . The Stock Market Perspective .
Cole, R.A., Moshirian, F., and Wu, Q.,. (2008). Bank stock returns and economic
growth,. Journal of Banking and Finance , 995-1007.
Demetriades, PO & Hussein, KA. (1996). Does financial development cause
economic growth?,Time series evidence from 16 countries. Journal of
Development Economics, 51 , 387-411.
Eita J.H and Jordaan . A. C. (n.d.). Acauslity analysis between financial developmen
and economic growth. 2007.
Fry, J.M. (1978): “Money and Capital or Financial Deepening in Economic
Development?” Journal of Money, Credit and Banking, 10(4), pp. 464-475.
Fry, J.M. (1980): “Saving, Investment, Growth and the Cost of Financial
Repression”,World Development, 8, pp. 317-327.
Ghali, K.H. (1999). Government Size and Economic Growth. Evidence from a
Multivariate Cointegration Analysis, Applied Economics, 31(8), , 975-987.
Goldsmith.R.W. (1969). Financial structure and development.
57
Graff, M (1999). . (1999). “Financial Development and Economic Growth. Graff, M
(1999). “Fina A New Empirical Analysis” Dresden Discussion Papers in
Economics No. 5/99 .
Granger, C.W.J. (1988): “Some Recent Developments in a Concept of Causality”,
Journal of Econometrics, 39, pp. 199-211.
Greenwood, J. and Smith, B.D. (1997): “Financial Markets in Development and the
Development of Financial Markets”, Journal of Economic Dynamics and
Control, 21, pp.145-181
Greenwood, J & Jovanovic, B. (1990). Financial development, growth, and the
distribution of income. Journal of Political Economy, 98 , 1076-1107.
Gurley, J.G. and Shaw, E.S. (1967):“Financial Structure and Economic
Development”, Economic Development and Cultural Change,15(3), pp. 257-
268.
Hermes, N. and R. Lensink. (2003). Foreign Direct Investment, Financial
Development and Economic Growth. Journal of Development Studies, Vol.
40(1 , 142–163.
Hsueh.S.J ,Hu. Y.H and Tue.C.H. (2013). Economic growth and financial
development in Asian countries:A bootstrap panel granger causality analysis.
Economic Modelling, 32 , 294 - 301.
Jung, W.S. (1986): “Financial Development and Economic Growth: International
Evidence”, Economic Development and Cultural Change, 34, pp. 334-346
Kar M and Pentecost E J. (2000). Financial Development and Economic Growth in
Turkey: Further Evidence on the Causality Issue. Economic Research Paper ,
No.00/27.
Khan, S.M & Senhadji, A.S. (2000). financial development and economic growth.
An overview, IMF Working Paper, , No.00/209.
58
Khan.H, I. H. (2004). A time sereis analysis of finance and growth in Bangladesh.
The Bangladesh development studies, , 111-128.
Kilimani, N. (2009). The Link Between Financial Development and Economic. A
Causality Test, , 22-24.
King, R.G. and Levine, R. (1993). Finance and Economic Growth:Schumpeter
Might. Quarterly Journal of Economics , 717-736.
Levine ,R . (1998). The legal environment, banks, and long-run economic growth.
Journal of Money, Credit and Banking,30 , 596-613.
Levine R. (1997). Financial Development and Economic Growth. Journal of
Economic Literature 35(2) , 688-776.
Levine, R. (2004). Finance and Growth: Theory and Evidence. national Bureau of
Economic Research , Working Paper 10766.
Levine, R. (2005). In: Aghion, P. and Durlauf S.N. (Eds.), Finance and growth:
theory,mechanism and evidence. Handbook of Economic Growth, vol. 1. ,
865-934.
Levine,R and Zervos .S. (1998). Stock markets,banks, and economic growth.
American Economic Review, 88: , 537-558.
Luintel, K.B. and Khan, M. (1999). A Quantitative Reassessment of the Finance-
Growth:Evidence from a Multivariate VAR. Journal of Development
Economics , pp.381- 405.
M, B. (2012). Financial Development and Economic growth in Latin America:.
Journal of Policy Modeling 34 , 341- 355.
Narayan P.K. and Narayan S. (2013). The short -run relationship between the
financial system and economic growth. Internationa Review of financial
analysis 29 , 70-78.
59
Nowbusting, B.M., Ramsohok, S., Ramsohok, K. (2010). A Multivariate Analysis of
Financial Development and Growth. Global Journal of Human Social
Science, 10(1), , 2-13.
Odhiambo N M. (2007). Supply-leading versus demand-following hypothesis:
Empirical evidence from three SSA Countries,. African Development Review
19(2) , 257-399.
Odhiambo, N. (2005). Financial Development and Economic Growth in Tanzania:A
Dynamic Causality Test”,. African Finance Journal , pp. 1-17.
Odhiambo. M. (2011). Financial Intermediaries versus Financial Markets.
International Business and Economic Research Journal, Vol. 10 (2), , 77-84.
Padilla . S. B and Mayer .H.P. (2002). Is finanancial development important for
economic growth.
Patrick, T.H. (1966): Financial Development and Economic Growth in
Underdeveloped Countries”, Economic Development and Cultural Change,
14, pp. 174-189
Pradhan, R. P. (2009). The Nexus between Financial Development and Economic
Growth. Internatinal Jounal of Research and REviews in Applied Sciences ,
141-151.
Rajan R and Zingales L. (1998). Financial Dependence and Growth. American
Economic Review, 88(3) , 559-586.
Robinson J. (1952). The Generalization of the General Theory’ In: The Rate of
Interest and Other Essays,. The Rate of Interest and Other Essays , 67-142.
Saci, K, Giorgioni, G, and Holden, K. (2009). Does financial development affec
economic t growth?",. Jounal of applied Economics, 41 , 1701-1707.
60
Schumpeter, J.A. (1911): The Theory of Economic Development: An Inquiry into
Profits, Capital, Credit, Interest and the Business Cycle, Translated and
Reprinted 1961, New York: Oxford University Press
Shen, C, and Lee, C. (2006). Same financial development yet different economic
growth why? Journal of Money, Credit and Banking,38(7) , 1907-1944.
Sinha, D. and J Macri. (2001). Financialm Development and Economic growth.
Munich personal RePEc Archive (MPRA) , Paper no.18297.
Stern, N. (.–6. (1989). The Economics of Development. A Survey, Economic Journal,
99(397) , 597–685.
Vazakidis, A. and Adamopoulos A. (2009). Financial Development and Economic
Growth. An American Journal of Applied Sciences 6(7) , 1410-1417.
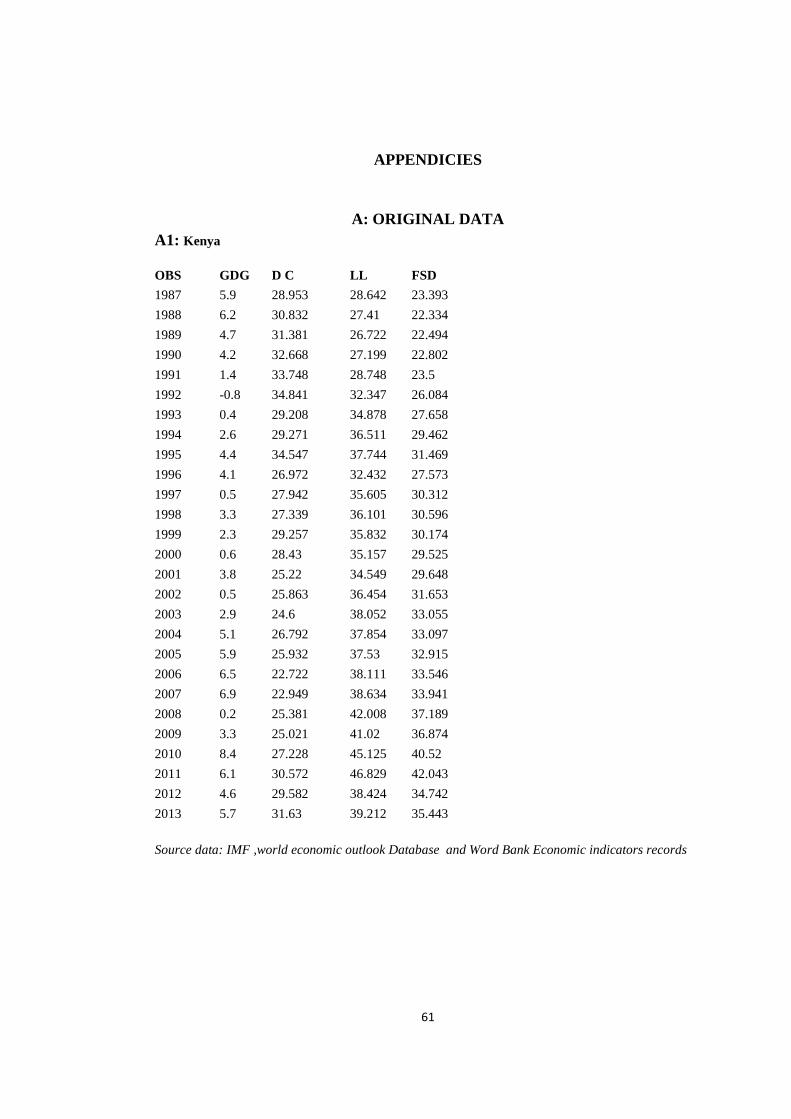
61
APPENDICIES
A: ORIGINAL DATA
A1: Kenya
OBS GDG D C LL FSD
1987 5.9 28.953 28.642 23.393
1988 6.2 30.832 27.41 22.334
1989 4.7 31.381 26.722 22.494
1990 4.2 32.668 27.199 22.802
1991 1.4 33.748 28.748 23.5
1992 -0.8 34.841 32.347 26.084
1993 0.4 29.208 34.878 27.658
1994 2.6 29.271 36.511 29.462
1995 4.4 34.547 37.744 31.469
1996 4.1 26.972 32.432 27.573
1997 0.5 27.942 35.605 30.312
1998 3.3 27.339 36.101 30.596
1999 2.3 29.257 35.832 30.174
2000 0.6 28.43 35.157 29.525
2001 3.8 25.22 34.549 29.648
2002 0.5 25.863 36.454 31.653
2003 2.9 24.6 38.052 33.055
2004 5.1 26.792 37.854 33.097
2005 5.9 25.932 37.53 32.915
2006 6.5 22.722 38.111 33.546
2007 6.9 22.949 38.634 33.941
2008 0.2 25.381 42.008 37.189
2009 3.3 25.021 41.02 36.874
2010 8.4 27.228 45.125 40.52
2011 6.1 30.572 46.829 42.043
2012 4.6 29.582 38.424 34.742
2013 5.7 31.63 39.212 35.443
Source data: IMF ,world economic outlook Database and Word Bank Economic indicators records
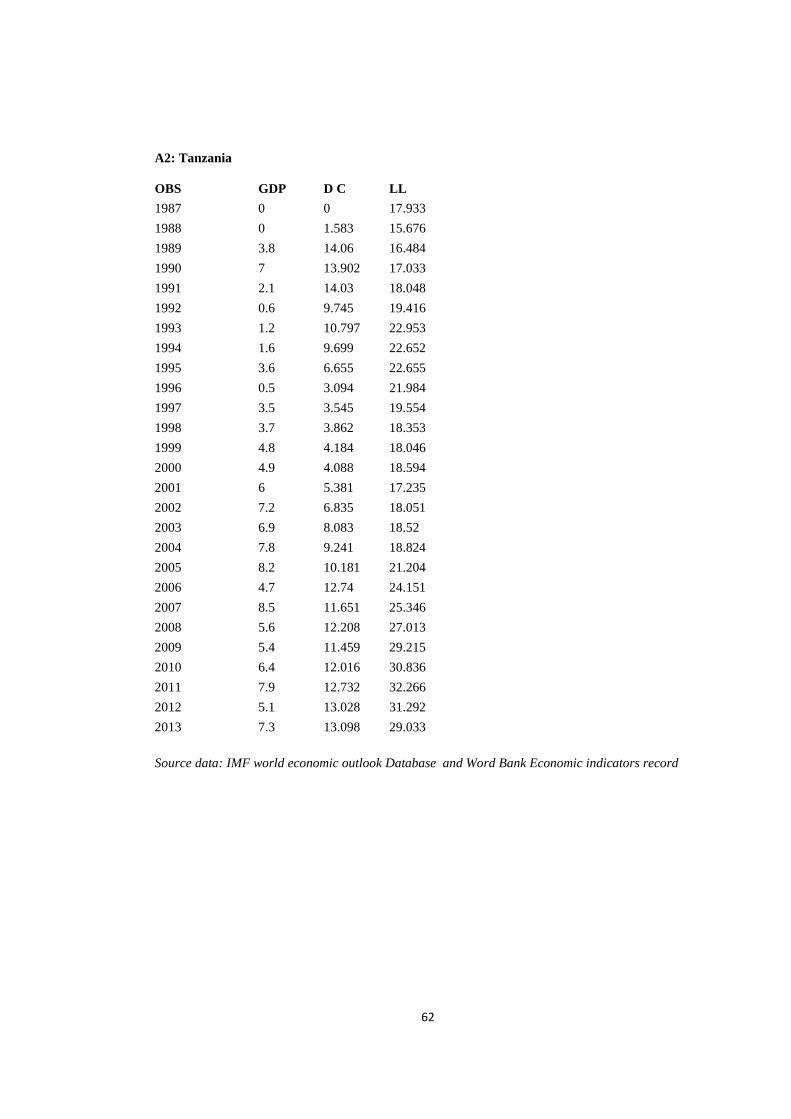
62
A2: Tanzania
OBS GDP D C LL
1987 0 0 17.933
1988 0 1.583 15.676
1989 3.8 14.06 16.484
1990 7 13.902 17.033
1991 2.1 14.03 18.048
1992 0.6 9.745 19.416
1993 1.2 10.797 22.953
1994 1.6 9.699 22.652
1995 3.6 6.655 22.655
1996 0.5 3.094 21.984
1997 3.5 3.545 19.554
1998 3.7 3.862 18.353
1999 4.8 4.184 18.046
2000 4.9 4.088 18.594
2001 6 5.381 17.235
2002 7.2 6.835 18.051
2003 6.9 8.083 18.52
2004 7.8 9.241 18.824
2005 8.2 10.181 21.204
2006 4.7 12.74 24.151
2007 8.5 11.651 25.346
2008 5.6 12.208 27.013
2009 5.4 11.459 29.215
2010 6.4 12.016 30.836
2011 7.9 12.732 32.266
2012 5.1 13.028 31.292
2013 7.3 13.098 29.033
Source data: IMF world economic outlook Database and Word Bank Economic indicators record
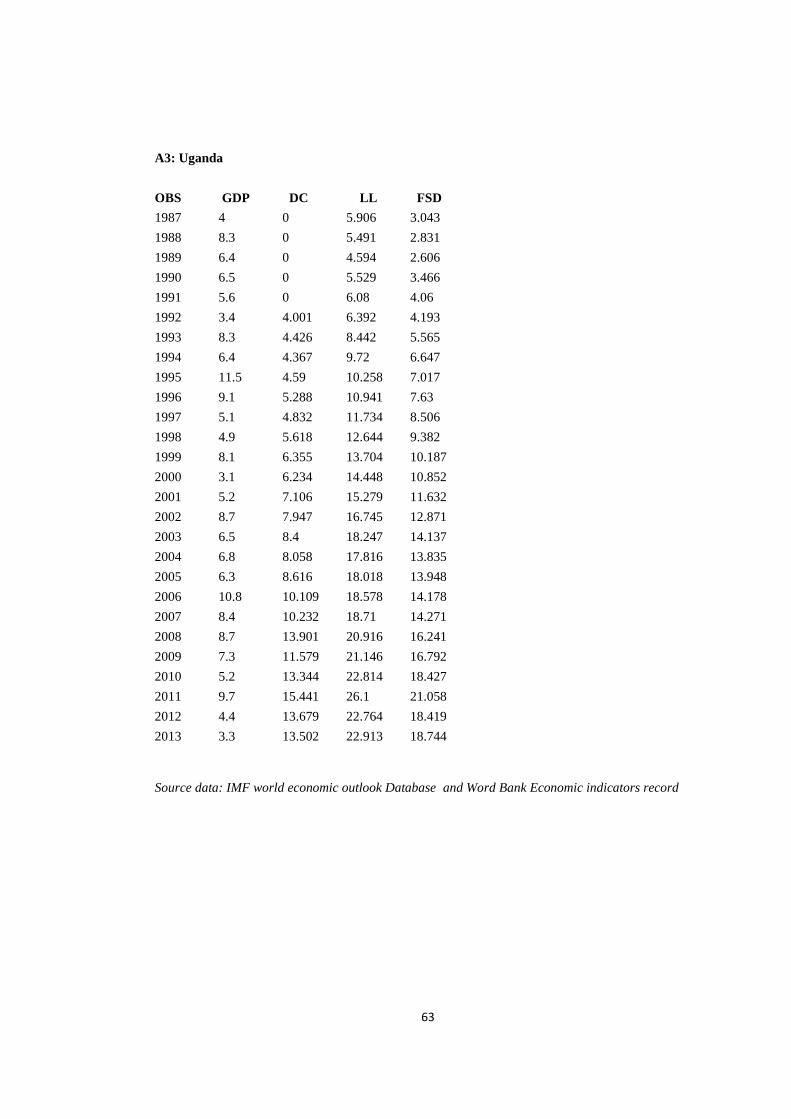
63
A3: Uganda
OBS GDP DC LL FSD
1987 4 0 5.906 3.043
1988 8.3 0 5.491 2.831
1989 6.4 0 4.594 2.606
1990 6.5 0 5.529 3.466
1991 5.6 0 6.08 4.06
1992 3.4 4.001 6.392 4.193
1993 8.3 4.426 8.442 5.565
1994 6.4 4.367 9.72 6.647
1995 11.5 4.59 10.258 7.017
1996 9.1 5.288 10.941 7.63
1997 5.1 4.832 11.734 8.506
1998 4.9 5.618 12.644 9.382
1999 8.1 6.355 13.704 10.187
2000 3.1 6.234 14.448 10.852
2001 5.2 7.106 15.279 11.632
2002 8.7 7.947 16.745 12.871
2003 6.5 8.4 18.247 14.137
2004 6.8 8.058 17.816 13.835
2005 6.3 8.616 18.018 13.948
2006 10.8 10.109 18.578 14.178
2007 8.4 10.232 18.71 14.271
2008 8.7 13.901 20.916 16.241
2009 7.3 11.579 21.146 16.792
2010 5.2 13.344 22.814 18.427
2011 9.7 15.441 26.1 21.058
2012 4.4 13.679 22.764 18.419
2013 3.3 13.502 22.913 18.744
Source data: IMF world economic outlook Database and Word Bank Economic indicators record

64
B: ORIGINAL DATA UNIT ROOT TEST RESULTS BI: Kenya – original Data
.
MacKinnon approximate p-value for Z(t) = 0.6393 Z(t) -1.278 -3.743 -2.997 -2.629 Z(rho) -2.387 -17.268 -12.532 -10.220 Statistic Value Value Value Test 1% Critical 5% Critical 10% Critical Interpolated Dickey-Fuller
Newey-West lags = 2Phillips-Perron test for unit root Number of obs = 26
. pperron fsd
MacKinnon approximate p-value for Z(t) = 0.4973 Z(t) -1.573 -3.743 -2.997 -2.629 Z(rho) -3.670 -17.268 -12.532 -10.220 Statistic Value Value Value Test 1% Critical 5% Critical 10% Critical Interpolated Dickey-Fuller
Newey-West lags = 2Phillips-Perron test for unit root Number of obs = 26
. pperron ll
MacKinnon approximate p-value for Z(t) = 0.3242 Z(t) -1.917 -3.743 -2.997 -2.629 Z(rho) -7.117 -17.268 -12.532 -10.220 Statistic Value Value Value Test 1% Critical 5% Critical 10% Critical Interpolated Dickey-Fuller
Newey-West lags = 2Phillips-Perron test for unit root Number of obs = 26
. pperron dc
MacKinnon approximate p-value for Z(t) = 0.0280 Z(t) -3.080 -3.743 -2.997 -2.629 Z(rho) -14.237 -17.268 -12.532 -10.220 Statistic Value Value Value Test 1% Critical 5% Critical 10% Critical Interpolated Dickey-Fuller
Newey-West lags = 2Phillips-Perron test for unit root Number of obs = 26
. pperron gdp
MacKinnon approximate p-value for Z(t) = 0.6012 Z(t) -1.360 -3.743 -2.997 -2.629 Statistic Value Value Value Test 1% Critical 5% Critical 10% Critical Interpolated Dickey-Fuller
Dickey-Fuller test for unit root Number of obs = 26
. dfuller fsd, lags(0)
MacKinnon approximate p-value for Z(t) = 0.4580 Z(t) -1.648 -3.743 -2.997 -2.629 Statistic Value Value Value Test 1% Critical 5% Critical 10% Critical Interpolated Dickey-Fuller
Dickey-Fuller test for unit root Number of obs = 26
. dfuller ll, lags(0)
MacKinnon approximate p-value for Z(t) = 0.2609 Z(t) -2.060 -3.743 -2.997 -2.629 Statistic Value Value Value Test 1% Critical 5% Critical 10% Critical Interpolated Dickey-Fuller
Dickey-Fuller test for unit root Number of obs = 26
. dfuller dc, lags(0)
MacKinnon approximate p-value for Z(t) = 0.0241 Z(t) -3.135 -3.743 -2.997 -2.629 Statistic Value Value Value Test 1% Critical 5% Critical 10% Critical Interpolated Dickey-Fuller
Dickey-Fuller test for unit root Number of obs = 26
. dfuller gdp, lags(0)
delta: 1 year time variable: obs, 1987 to 2013. tsset obs, yearly
(5 vars, 27 obs). insheet using "C:\Users\DOROTH HAKI\Desktop\current data\ORIGINAL DATA COM\Kenya repeated data.csv"
running E:\STATA 11.1\profile.do ...
2. (/v# option or -set maxvar-) 5000 maximum variables 1. (/m# option or -set memory-) 50.00 MB allocated to dataNotes:
STATA Licensed to: STATAForAll Serial number: 71606281563Single-user Stata license expires 31 Dec 9999:
979-696-4601 (fax) 979-696-4600 [email protected] 800-STATA-PC http://www.stata.com Special Edition College Station, Texas 77845 USA 4905 Lakeway Drive Statistics/Data Analysis StataCorp___/ / /___/ / /___/ 11.2 Copyright 1985-2009 StataCorp LP /__ / ____/ / ____/

65
BI: Tanzania– original Data
MacKinnon approximate p-value for Z(t) = 0.8970 Z(t) -0.474 -3.743 -2.997 -2.629 Z(rho) -0.737 -17.268 -12.532 -10.220 Statistic Value Value Value Test 1% Critical 5% Critical 10% Critical Interpolated Dickey-Fuller
Newey-West lags = 2Phillips-Perron test for unit root Number of obs = 26
. pperron fsd
MacKinnon approximate p-value for Z(t) = 0.8502 Z(t) -0.686 -3.743 -2.997 -2.629 Z(rho) -1.473 -17.268 -12.532 -10.220 Statistic Value Value Value Test 1% Critical 5% Critical 10% Critical Interpolated Dickey-Fuller
Newey-West lags = 2Phillips-Perron test for unit root Number of obs = 26
. pperron ll
MacKinnon approximate p-value for Z(t) = 0.1023 Z(t) -2.557 -3.743 -2.997 -2.629 Z(rho) -9.699 -17.268 -12.532 -10.220 Statistic Value Value Value Test 1% Critical 5% Critical 10% Critical Interpolated Dickey-Fuller
Newey-West lags = 2Phillips-Perron test for unit root Number of obs = 26
. pperron dc
MacKinnon approximate p-value for Z(t) = 0.1208 Z(t) -2.479 -3.743 -2.997 -2.629 Z(rho) -8.724 -17.268 -12.532 -10.220 Statistic Value Value Value Test 1% Critical 5% Critical 10% Critical Interpolated Dickey-Fuller
Newey-West lags = 2Phillips-Perron test for unit root Number of obs = 26
. pperron gdp
MacKinnon approximate p-value for Z(t) = 0.9321 Z(t) -0.251 -3.743 -2.997 -2.629 Statistic Value Value Value Test 1% Critical 5% Critical 10% Critical Interpolated Dickey-Fuller
Dickey-Fuller test for unit root Number of obs = 26
. dfuller fsd, lags(0)
MacKinnon approximate p-value for Z(t) = 0.9204 Z(t) -0.335 -3.743 -2.997 -2.629 Statistic Value Value Value Test 1% Critical 5% Critical 10% Critical Interpolated Dickey-Fuller
Dickey-Fuller test for unit root Number of obs = 26
. dfuller ll, lags(0)
MacKinnon approximate p-value for Z(t) = 0.1389 Z(t) -2.410 -3.743 -2.997 -2.629 Statistic Value Value Value Test 1% Critical 5% Critical 10% Critical Interpolated Dickey-Fuller
Dickey-Fuller test for unit root Number of obs = 26
. dfuller dc, lags(0)
MacKinnon approximate p-value for Z(t) = 0.0916 Z(t) -2.607 -3.743 -2.997 -2.629 Statistic Value Value Value Test 1% Critical 5% Critical 10% Critical Interpolated Dickey-Fuller
Dickey-Fuller test for unit root Number of obs = 26
. dfuller gdp, lags(0)
delta: 1 year time variable: obs, 1987 to 2013. tsset obs, yearly
(5 vars, 27 obs). insheet using "C:\Users\DOROTH HAKI\Desktop\current data\ORIGINAL DATA COM\Tanzania repeated.csv"
running E:\STATA 11.1\profile.do ...
2. (/v# option or -set maxvar-) 5000 maximum variables 1. (/m# option or -set memory-) 50.00 MB allocated to dataNotes:
STATA Licensed to: STATAForAll Serial number: 71606281563Single-user Stata license expires 31 Dec 9999:
979-696-4601 (fax) 979-696-4600 [email protected] 800-STATA-PC http://www.stata.com Special Edition College Station, Texas 77845 USA 4905 Lakeway Drive Statistics/Data Analysis StataCorp___/ / /___/ / /___/ 11.2 Copyright 1985-2009 StataCorp LP /__ / ____/ / ____/ ___ ____ ____ ____ ____ (R)

66
B3: Uganda –Original data
MacKinnon approximate p-value for Z(t) = 0.9310 Z(t) -0.260 -3.743 -2.997 -2.629 Z(rho) -0.207 -17.268 -12.532 -10.220 Statistic Value Value Value Test 1% Critical 5% Critical 10% Critical Interpolated Dickey-Fuller
Newey-West lags = 2Phillips-Perron test for unit root Number of obs = 26
. pperron fsd
MacKinnon approximate p-value for Z(t) = 0.9220 Z(t) -0.324 -3.743 -2.997 -2.629 Z(rho) -0.280 -17.268 -12.532 -10.220 Statistic Value Value Value Test 1% Critical 5% Critical 10% Critical Interpolated Dickey-Fuller
Newey-West lags = 2Phillips-Perron test for unit root Number of obs = 26
. pperron ll
MacKinnon approximate p-value for Z(t) = 0.8633 Z(t) -0.633 -3.743 -2.997 -2.629 Z(rho) -0.709 -17.268 -12.532 -10.220 Statistic Value Value Value Test 1% Critical 5% Critical 10% Critical Interpolated Dickey-Fuller
Newey-West lags = 2Phillips-Perron test for unit root Number of obs = 26
. pperron dc
MacKinnon approximate p-value for Z(t) = 0.0001 Z(t) -4.744 -3.743 -2.997 -2.629 Z(rho) -25.566 -17.268 -12.532 -10.220 Statistic Value Value Value Test 1% Critical 5% Critical 10% Critical Interpolated Dickey-Fuller
Newey-West lags = 2Phillips-Perron test for unit root Number of obs = 26
. pperron gdp
MacKinnon approximate p-value for Z(t) = 0.9189 Z(t) -0.345 -3.743 -2.997 -2.629 Statistic Value Value Value Test 1% Critical 5% Critical 10% Critical Interpolated Dickey-Fuller
Dickey-Fuller test for unit root Number of obs = 26
. dfuller fsd, lags(0)
MacKinnon approximate p-value for Z(t) = 0.9076 Z(t) -0.415 -3.743 -2.997 -2.629 Statistic Value Value Value Test 1% Critical 5% Critical 10% Critical Interpolated Dickey-Fuller
Dickey-Fuller test for unit root Number of obs = 26
. dfuller ll, lags(0)
MacKinnon approximate p-value for Z(t) = 0.8161 Z(t) -0.810 -3.743 -2.997 -2.629 Statistic Value Value Value Test 1% Critical 5% Critical 10% Critical Interpolated Dickey-Fuller
Dickey-Fuller test for unit root Number of obs = 26
. dfuller dc, lags(0)
MacKinnon approximate p-value for Z(t) = 0.0001 Z(t) -4.745 -3.743 -2.997 -2.629 Statistic Value Value Value Test 1% Critical 5% Critical 10% Critical Interpolated Dickey-Fuller
Dickey-Fuller test for unit root Number of obs = 26
. dfuller gdp, lags(0)
delta: 1 year time variable: obs, 1987 to 2013. tsset obs, yearly
(5 vars, 27 obs). insheet using "C:\Users\DOROTH HAKI\Desktop\current data\ORIGINAL DATA COM\Uganda repeated.csv"
running E:\STATA 11.1\profile.do ...
2. (/v# option or -set maxvar-) 5000 maximum variables 1. (/m# option or -set memory-) 50.00 MB allocated to dataNotes:
STATA Licensed to: STATAForAll Serial number: 71606281563Single-user Stata license expires 31 Dec 9999:
979-696-4601 (fax) 979-696-4600 [email protected] 800-STATA-PC http://www.stata.com Special Edition College Station, Texas 77845 USA 4905 Lakeway Drive Statistics/Data Analysis StataCorp___/ / /___/ / /___/ 11.2 Copyright 1985-2009 StataCorp LP /__ / ____/ / ____/ ___ ____ ____ ____ ____ (R)
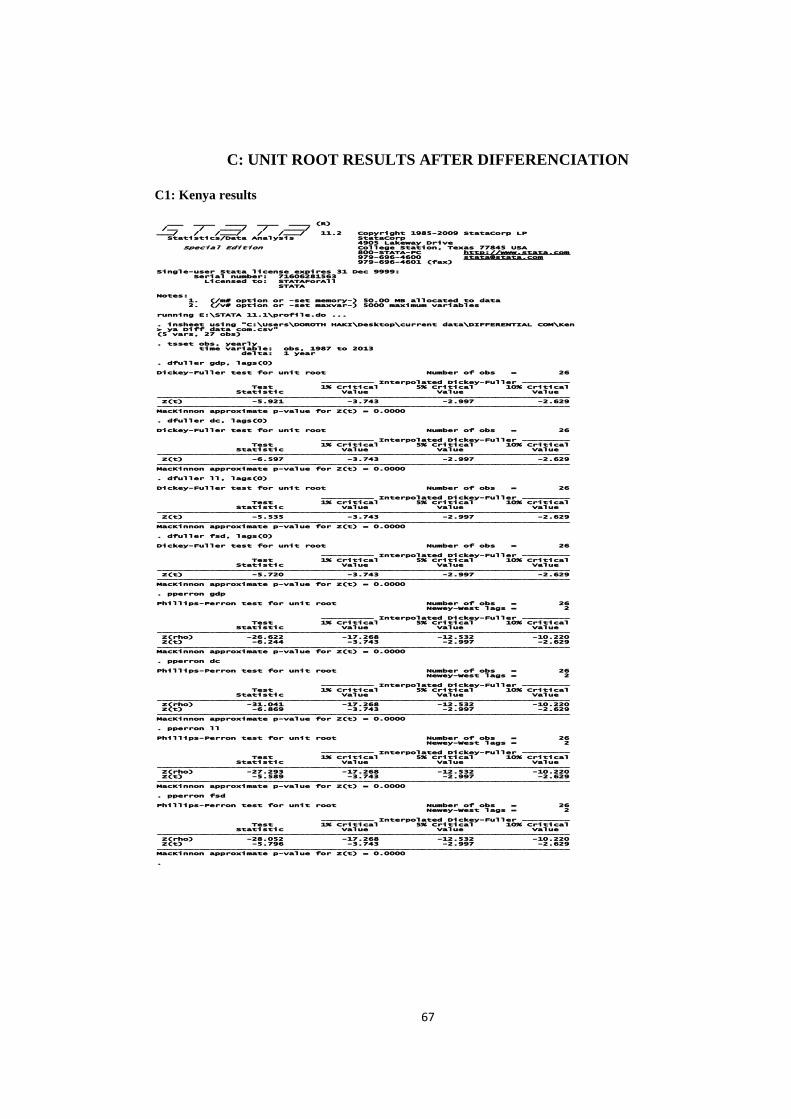
67
C: UNIT ROOT RESULTS AFTER DIFFERENCIATION
C1: Kenya results
.
MacKinnon approximate p-value for Z(t) = 0.0000 Z(t) -5.796 -3.743 -2.997 -2.629 Z(rho) -28.052 -17.268 -12.532 -10.220 Statistic Value Value Value Test 1% Critical 5% Critical 10% Critical Interpolated Dickey-Fuller
Newey-West lags = 2Phillips-Perron test for unit root Number of obs = 26
. pperron fsd
MacKinnon approximate p-value for Z(t) = 0.0000 Z(t) -5.589 -3.743 -2.997 -2.629 Z(rho) -27.293 -17.268 -12.532 -10.220 Statistic Value Value Value Test 1% Critical 5% Critical 10% Critical Interpolated Dickey-Fuller
Newey-West lags = 2Phillips-Perron test for unit root Number of obs = 26
. pperron ll
MacKinnon approximate p-value for Z(t) = 0.0000 Z(t) -6.869 -3.743 -2.997 -2.629 Z(rho) -31.041 -17.268 -12.532 -10.220 Statistic Value Value Value Test 1% Critical 5% Critical 10% Critical Interpolated Dickey-Fuller
Newey-West lags = 2Phillips-Perron test for unit root Number of obs = 26
. pperron dc
MacKinnon approximate p-value for Z(t) = 0.0000 Z(t) -6.244 -3.743 -2.997 -2.629 Z(rho) -26.622 -17.268 -12.532 -10.220 Statistic Value Value Value Test 1% Critical 5% Critical 10% Critical Interpolated Dickey-Fuller
Newey-West lags = 2Phillips-Perron test for unit root Number of obs = 26
. pperron gdp
MacKinnon approximate p-value for Z(t) = 0.0000 Z(t) -5.720 -3.743 -2.997 -2.629 Statistic Value Value Value Test 1% Critical 5% Critical 10% Critical Interpolated Dickey-Fuller
Dickey-Fuller test for unit root Number of obs = 26
. dfuller fsd, lags(0)
MacKinnon approximate p-value for Z(t) = 0.0000 Z(t) -5.535 -3.743 -2.997 -2.629 Statistic Value Value Value Test 1% Critical 5% Critical 10% Critical Interpolated Dickey-Fuller
Dickey-Fuller test for unit root Number of obs = 26
. dfuller ll, lags(0)
MacKinnon approximate p-value for Z(t) = 0.0000 Z(t) -6.597 -3.743 -2.997 -2.629 Statistic Value Value Value Test 1% Critical 5% Critical 10% Critical Interpolated Dickey-Fuller
Dickey-Fuller test for unit root Number of obs = 26
. dfuller dc, lags(0)
MacKinnon approximate p-value for Z(t) = 0.0000 Z(t) -5.921 -3.743 -2.997 -2.629 Statistic Value Value Value Test 1% Critical 5% Critical 10% Critical Interpolated Dickey-Fuller
Dickey-Fuller test for unit root Number of obs = 26
. dfuller gdp, lags(0)
delta: 1 year time variable: obs, 1987 to 2013. tsset obs, yearly
(5 vars, 27 obs)> ya Diff data com.csv". insheet using "C:\Users\DOROTH HAKI\Desktop\current data\DIFFERENTIAL COM\Ken
running E:\STATA 11.1\profile.do ...
2. (/v# option or -set maxvar-) 5000 maximum variables 1. (/m# option or -set memory-) 50.00 MB allocated to dataNotes:
STATA Licensed to: STATAForAll Serial number: 71606281563Single-user Stata license expires 31 Dec 9999:
979-696-4601 (fax) 979-696-4600 [email protected] 800-STATA-PC http://www.stata.com Special Edition College Station, Texas 77845 USA 4905 Lakeway Drive Statistics/Data Analysis StataCorp___/ / /___/ / /___/ 11.2 Copyright 1985-2009 StataCorp LP /__ / ____/ / ____/ ___ ____ ____ ____ ____ (R)

68
2.21 C2: Tanzania result
MacKinnon approximate p-value for Z(t) = 0.0000 Z(t) -5.532 -3.743 -2.997 -2.629 Z(rho) -26.979 -17.268 -12.532 -10.220 Statistic Value Value Value Test 1% Critical 5% Critical 10% Critical Interpolated Dickey-Fuller
Newey-West lags = 2Phillips-Perron test for unit root Number of obs = 26
. pperron fsd
MacKinnon approximate p-value for Z(t) = 0.0000 Z(t) -6.753 -3.743 -2.997 -2.629 Z(rho) -32.758 -17.268 -12.532 -10.220 Statistic Value Value Value Test 1% Critical 5% Critical 10% Critical Interpolated Dickey-Fuller
Newey-West lags = 2Phillips-Perron test for unit root Number of obs = 26
. pperron ll
MacKinnon approximate p-value for Z(t) = 0.0003 Z(t) -4.419 -3.743 -2.997 -2.629 Z(rho) -23.884 -17.268 -12.532 -10.220 Statistic Value Value Value Test 1% Critical 5% Critical 10% Critical Interpolated Dickey-Fuller
Newey-West lags = 2Phillips-Perron test for unit root Number of obs = 26
. pperron dc
MacKinnon approximate p-value for Z(t) = 0.0000 Z(t) -7.555 -3.743 -2.997 -2.629 Z(rho) -31.897 -17.268 -12.532 -10.220 Statistic Value Value Value Test 1% Critical 5% Critical 10% Critical Interpolated Dickey-Fuller
Newey-West lags = 2Phillips-Perron test for unit root Number of obs = 26
. pperron gdp
MacKinnon approximate p-value for Z(t) = 0.0000 Z(t) -5.475 -3.743 -2.997 -2.629 Statistic Value Value Value Test 1% Critical 5% Critical 10% Critical Interpolated Dickey-Fuller
Dickey-Fuller test for unit root Number of obs = 26
. dfuller fsd, lags(0)
MacKinnon approximate p-value for Z(t) = 0.0000 Z(t) -6.649 -3.743 -2.997 -2.629 Statistic Value Value Value Test 1% Critical 5% Critical 10% Critical Interpolated Dickey-Fuller
Dickey-Fuller test for unit root Number of obs = 26
. dfuller ll, lags(0)
MacKinnon approximate p-value for Z(t) = 0.0003 Z(t) -4.400 -3.743 -2.997 -2.629 Statistic Value Value Value Test 1% Critical 5% Critical 10% Critical Interpolated Dickey-Fuller
Dickey-Fuller test for unit root Number of obs = 26
. dfuller dc, lags(0)
MacKinnon approximate p-value for Z(t) = 0.0000 Z(t) -7.041 -3.743 -2.997 -2.629 Statistic Value Value Value Test 1% Critical 5% Critical 10% Critical Interpolated Dickey-Fuller
Dickey-Fuller test for unit root Number of obs = 26
. dfuller gdp, lags(0)
delta: 1 year time variable: obs, 1987 to 2013. tsset obs, yearly
(5 vars, 27 obs)> z Second Diff data com.csv". insheet using "C:\Users\DOROTH HAKI\Desktop\current data\TANZ SECOND DIFF\Tan
running E:\STATA 11.1\profile.do ...
2. (/v# option or -set maxvar-) 5000 maximum variables 1. (/m# option or -set memory-) 50.00 MB allocated to dataNotes:
STATA Licensed to: STATAForAll Serial number: 71606281563Single-user Stata license expires 31 Dec 9999:
979-696-4601 (fax) 979-696-4600 [email protected] 800-STATA-PC http://www.stata.com Special Edition College Station, Texas 77845 USA 4905 Lakeway Drive Statistics/Data Analysis StataCorp___/ / /___/ / /___/ 11.2 Copyright 1985-2009 StataCorp LP /__ / ____/ / ____/ ___ ____ ____ ____ ____ (R)

69
C3: Uganda results
.
MacKinnon approximate p-value for Z(t) = 0.0000 Z(t) -5.614 -3.743 -2.997 -2.629 Z(rho) -26.681 -17.268 -12.532 -10.220 Statistic Value Value Value Test 1% Critical 5% Critical 10% Critical Interpolated Dickey-Fuller
Newey-West lags = 2Phillips-Perron test for unit root Number of obs = 26
. pperron fsd
MacKinnon approximate p-value for Z(t) = 0.0000 Z(t) -5.689 -3.743 -2.997 -2.629 Z(rho) -27.138 -17.268 -12.532 -10.220 Statistic Value Value Value Test 1% Critical 5% Critical 10% Critical Interpolated Dickey-Fuller
Newey-West lags = 2Phillips-Perron test for unit root Number of obs = 26
. pperron ll
MacKinnon approximate p-value for Z(t) = 0.0000 Z(t) -7.536 -3.743 -2.997 -2.629 Z(rho) -31.729 -17.268 -12.532 -10.220 Statistic Value Value Value Test 1% Critical 5% Critical 10% Critical Interpolated Dickey-Fuller
Newey-West lags = 2Phillips-Perron test for unit root Number of obs = 26
. pperron dc
MacKinnon approximate p-value for Z(t) = 0.0001 Z(t) -4.744 -3.743 -2.997 -2.629 Z(rho) -25.566 -17.268 -12.532 -10.220 Statistic Value Value Value Test 1% Critical 5% Critical 10% Critical Interpolated Dickey-Fuller
Newey-West lags = 2Phillips-Perron test for unit root Number of obs = 26
. pperron gdp
MacKinnon approximate p-value for Z(t) = 0.0000 Z(t) -5.535 -3.743 -2.997 -2.629 Statistic Value Value Value Test 1% Critical 5% Critical 10% Critical Interpolated Dickey-Fuller
Dickey-Fuller test for unit root Number of obs = 26
. dfuller fsd, lags(0)
MacKinnon approximate p-value for Z(t) = 0.0000 Z(t) -5.606 -3.743 -2.997 -2.629 Statistic Value Value Value Test 1% Critical 5% Critical 10% Critical Interpolated Dickey-Fuller
Dickey-Fuller test for unit root Number of obs = 26
. dfuller ll, lags(0)
MacKinnon approximate p-value for Z(t) = 0.0000 Z(t) -7.038 -3.743 -2.997 -2.629 Statistic Value Value Value Test 1% Critical 5% Critical 10% Critical Interpolated Dickey-Fuller
Dickey-Fuller test for unit root Number of obs = 26
. dfuller dc, lags(0)
MacKinnon approximate p-value for Z(t) = 0.0001 Z(t) -4.745 -3.743 -2.997 -2.629 Statistic Value Value Value Test 1% Critical 5% Critical 10% Critical Interpolated Dickey-Fuller
Dickey-Fuller test for unit root Number of obs = 26
. dfuller gdp, lags(0)
delta: 1 year time variable: obs, 1987 to 2013. tsset obs, yearly
(5 vars, 27 obs)> nda Diff data com.csv". insheet using "C:\Users\DOROTH HAKI\Desktop\current data\DIFFERENTIAL COM\Uga
running E:\STATA 11.1\profile.do ...
2. (/v# option or -set maxvar-) 5000 maximum variables 1. (/m# option or -set memory-) 50.00 MB allocated to dataNotes:
STATA Licensed to: STATAForAll Serial number: 71606281563Single-user Stata license expires 31 Dec 9999:
979-696-4601 (fax) 979-696-4600 [email protected] 800-STATA-PC http://www.stata.com Special Edition College Station, Texas 77845 USA 4905 Lakeway Drive Statistics/Data Analysis StataCorp___/ / /___/ / /___/ 11.2 Copyright 1985-2009 StataCorp LP /__ / ____/ / ____/ ___ ____ ____ ____ ____ (R)
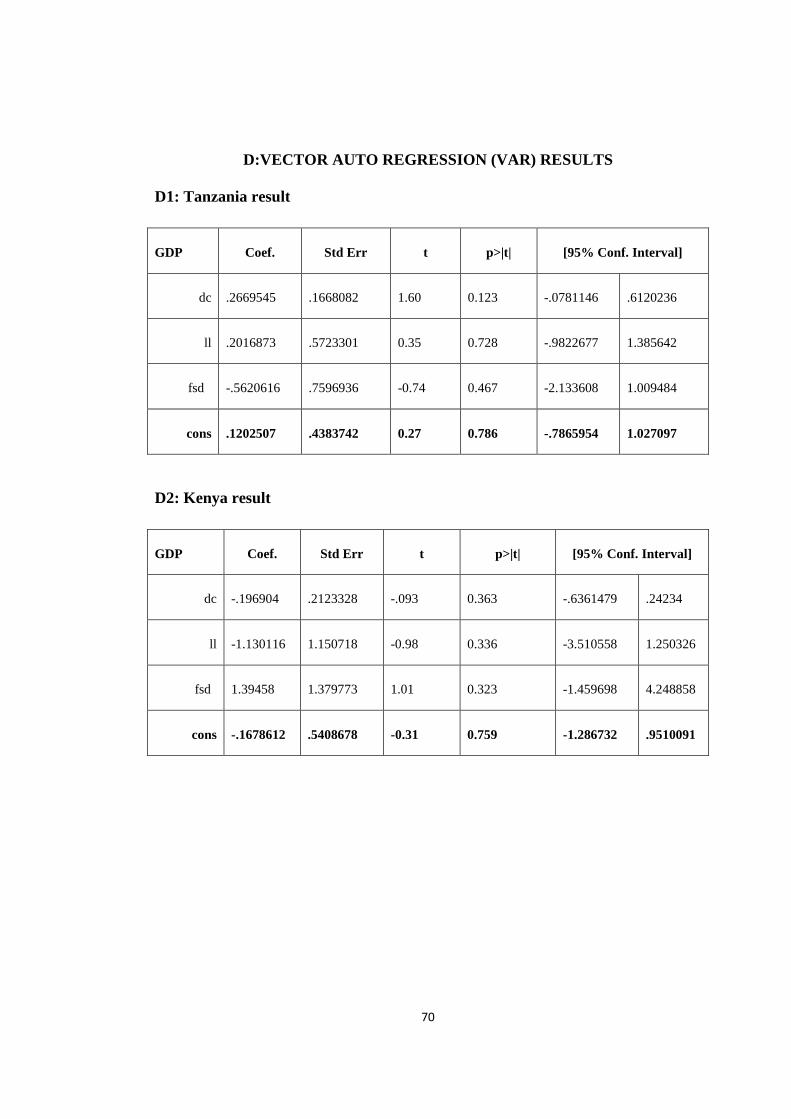
70
D:VECTOR AUTO REGRESSION (VAR) RESULTS
D1: Tanzania result
GDP Coef. Std Err t p>|t| [95% Conf. Interval]
dc .2669545 .1668082 1.60 0.123 -.0781146 .6120236
ll .2016873 .5723301 0.35 0.728 -.9822677 1.385642
fsd fsd -.5620616 .7596936 -0.74 0.467 -2.133608 1.009484
cons .1202507 .4383742 0.27 0.786 -.7865954 1.027097
D2: Kenya result
GDP Coef. Std Err t p>|t| [95% Conf. Interval]
dc -.196904 .2123328 -.093 0.363 -.6361479 .24234
ll -1.130116 1.150718 -0.98 0.336 -3.510558 1.250326
fsd fsd 1.39458 1.379773 1.01 0.323 -1.459698 4.248858
cons -.1678612 .5408678 -0.31 0.759 -1.286732 .9510091
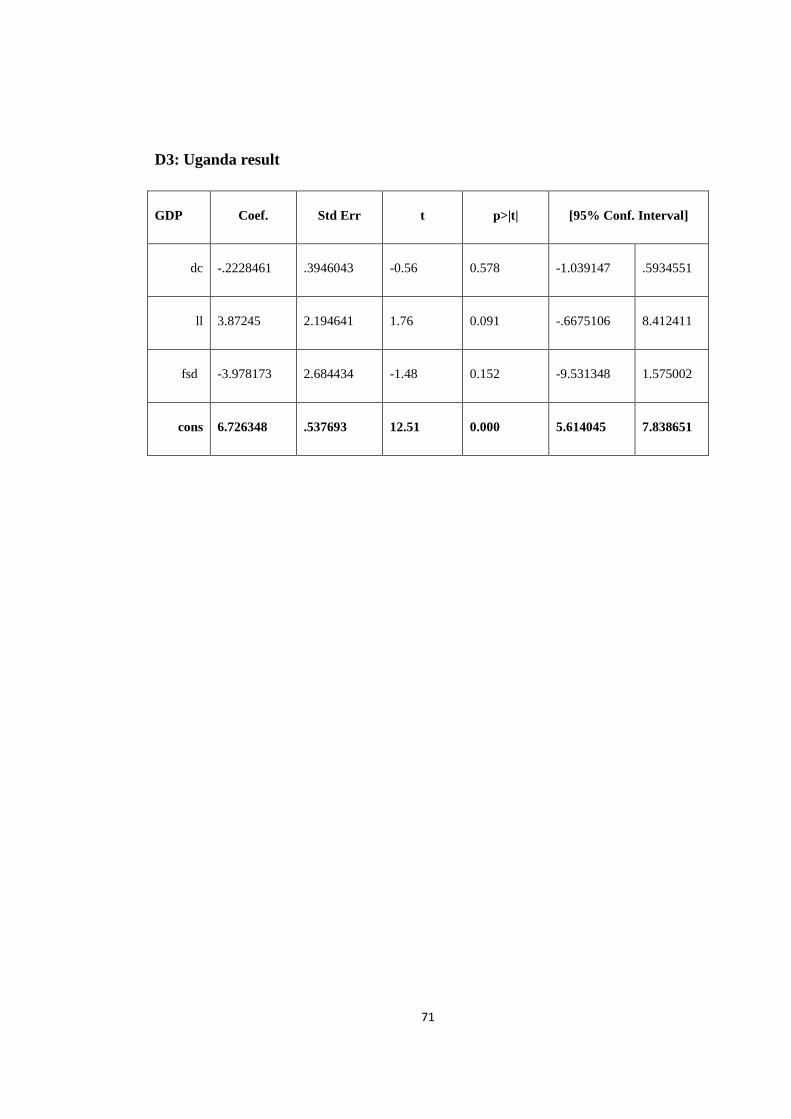
71
D3: Uganda result
GDP Coef. Std Err t p>|t| [95% Conf. Interval]
dc -.2228461 .3946043 -0.56 0.578 -1.039147 .5934551
ll 3.87245 2.194641 1.76 0.091 -.6675106 8.412411
fsd fsd -3.978173 2.684434 -1.48 0.152 -9.531348 1.575002
cons 6.726348 .537693 12.51 0.000 5.614045 7.838651