Embed Size (px)
Citation preview
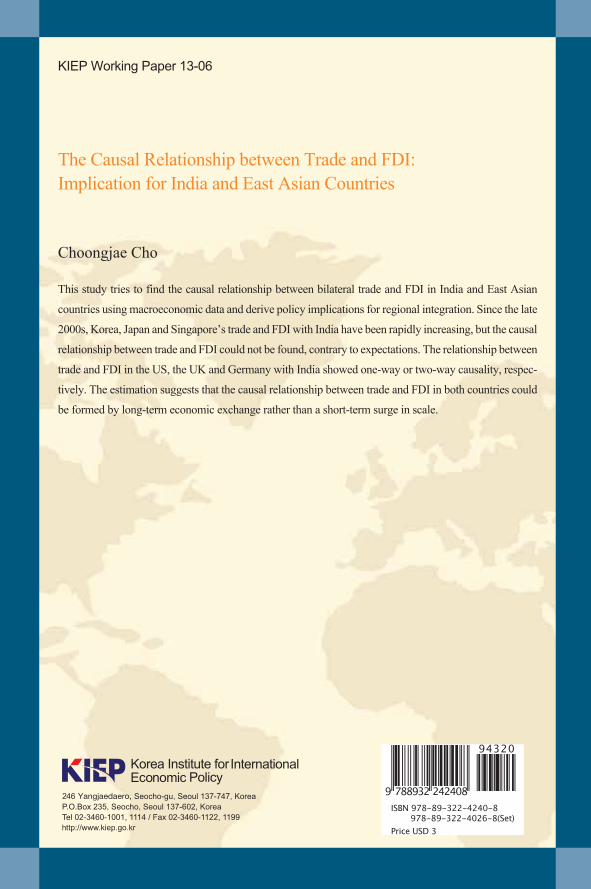
KIEP Working Paper 13-06
Choongjae Cho
Choongjae Cho
KIEP Working Paper 13-06
The Causal Relationship between Trade and FDI: Implication for India and East Asian Countries
The Causal Relationship between Trade and FDI:Implication for India and East Asian Countries
This study tries to find the causal relationship between bilateral trade and FDI in India and East Asian
countries using macroeconomic data and derive policy implications for regional integration. Since the late
2000s, Korea, Japan and Singapore’s trade and FDI with India have been rapidly increasing, but the causal
relationship between trade and FDI could not be found, contrary to expectations. The relationship between
trade and FDI in the US, the UK and Germany with India showed one-way or two-way causality, respec-
tively. The estimation suggests that the causal relationship between trade and FDI in both countries could
be formed by long-term economic exchange rather than a short-term surge in scale.
KIEP Working Paper 13-06
The Causal R
elationship between Trade and FD
I: Implication for India and E
ast Asian C
ountriesC
hoongjae Cho
KIEP Working Paper 13-06
The Causal Relationship between Trade and FDI: Implication for India
and East Asian Countries
Choongjae Cho
Korea Institute for International Economic Policy (KIEP) 246 Yangjaedaero, Seocho-Gu, Seoul 137-747, Korea Tel: (822) 3460-1251 Fax: (822) 3460-1144 URL: http://www.kiep.go.kr Il Houng Lee, President KIEP Working Paper 13-06 Published December 9, 2013 in Korea by KIEP ISBN 978-89-322-4240-8 94320
978-89-322-4026-8(set) Price USD 3
2013 KIEP
Executive Summary
This study tries to find the causal relationship between bilateral trade and FDI in
India and East Asian countries using macroeconomic data and derive policy im-
plications for regional integration. Since the late 2000s, Korea, Japan and Singa-
pore’s trade and FDI with India have been rapidly increasing, but the causal rela-
tionship between trade and FDI could not be found, contrary to expectations.
The relationship between trade and FDI in the US, the UK and Germany with
India showed one-way or two-way causality, respectively. The estimation suggests
that the causal relationship between trade and FDI in both countries could be
formed by long-term economic exchange rather than a short-term surge in scale.
Keywords: Trade, FDI, Causality
JEL Classification: C22, F19, O53

Choongjae Cho is a Research Fellow and Head of South Asia Team at Korea Institute for In-ternational Economic Policy (KIEP). Prior to joining KIEP he was a researcher at Daewoo Eco-nomic Research Institute and Lotte Economic Research Institute. He also worked for The Seoul Economic Daily as a reporter. He is an expert on Indian Economy and the economic cooperation between Korea an India. He holds a Ph.D in Economics from Hankuk University of Foreign Studies.
Contents
Executive Summary 3
I. Introduction 7
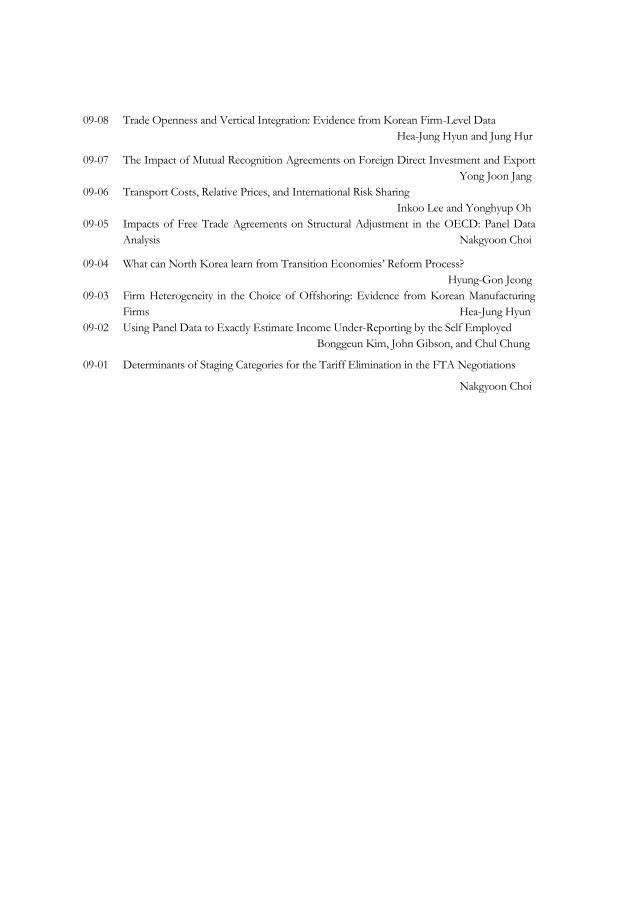
II. Trend of Trade and FDI between India and East Asia 10 1. Trade 10 2. FDI 13
III. Literature Review and Distinction 17
IV. Data, Methodology and Estimation 20 1. Analyzed Countries and Data 20 2. Methodology 23 3. Estimation 25
V. Conclusion and Policy Implication 30
References 33
Appendix 35
Tables
Table 1. India’s Top-20 Trade Partners in 2000/2001 11 Table 2. India’s Top-20 Trade Partners in 2011/2012 12 Table 3. Cumulative Country-wise FDI Inflows from April 2000 to March 2013 13 Table 4. Cumulative Country-wise FDI Inflows from 1991 to 2001 14 Table 5. Cumulative Country-wise FDI Inflows from 1991 to November 2005 15 Table 6. The Basic Descriptions of the Data 21 Table 7. The Correlation Coefficient between Trade and FDI by Countries 23 Table 8. The Results of Augmented Dickey and Filler (ADF) Unit Root Tests 26 Table 9. The Results of Johansen Cointegration Tests 27 Table 10. The Applied Data and Model by Countries 28 Table 11. The Granger Causality Estimation Results 29
Appendix Figures
Figure A1. Trade and FDI Variables by Countries 35
The Causal Relationship between Trade and FDI: Implication for India and East Asian
Countries*
Choongjae Cho
I. Introduction
Since the 1980s, full-fledged economic liberalization and deregulation have in-
creased the volume of trade and FDI. These have also led to increased economic
interdependence, in other words, the economic integration among countries. Vol-
ume of trade and FDI among the various countries increased approximately by 9
and 30 times respectively between 1980 and 2011, which in turn led the increase
in world GDP by about six folds.1 Therefore, it is argued that FDI and trade are
main drivers of economic growth and economic integration.
The study was presented at the ADB-KIEP-ICRIER Workshop, held on October 2012 in Seoul. In
the workshop, the relationship between Korea and India were analyzed. I would like to thank Dr.
Rajat Kathuria from the Indian Council for Research on International Economic Relations (ICRIER),
Mr. Ramesh Subramaniam and Dr. Jayant Menon from ADB and Dr. Junkyu Lee, International
Economic Advisor for the Ministry of Strategy and Finance, Korea who are made good comments.
The analysis target countries are included more and the analytical methods were also reinforced. 1 The figures were estimated by UNCTAD Handbook of Statistics (2012).
8 The Causal Relationship between Trade and FDI
The economic integration between South and East Asia has shown significant
progress since the 1980s. In particular, India, the largest country in South Asia,
and East Asian countries such as Korea, China, Japan and Singapore, have made
great efforts toward for economic integration. India is attractive to these four
countries in that she has immense market potential. In addition, as the Indian
government emphasized in the Look East Policy,2 East Asia is strategically very
important for India’s economic growth and diplomacy. The Indian government
has been trying to establish a strong economic relationship with East Asian coun-
tries. Now India has FTA agreements with Singapore, Korea, ASEAN and Japan.
Each FTA came into force in 2006, 2010 (Korea-India, ASEAN-India) and 2011
respectively.
In fact, FDI between the four East Asian countries to India has led to consid-
erable increases in trade volume. Based on cumulative FDI statistics from April
2000 to March 2013, Singapore and Japan were the first and third largest FDI
investors with respect to India.3 From 2002 to 2010, East Asia’s share of trade
volume in India’s total trade increased from 10.9% to 16.2%, while the share of
EU and the United States decreased to 15.2% and 7.8% from 21.7% and 14%
respectively.4
In this context, East Asian countries and India are making efforts to acceler-
ate economic integration between them. This paper is designed to find policy
implications for the acceleration of economic integration between India and East
Asian countries. Although various studies have been attempted in the past, this
2 India’s Look East policy represents its efforts to cultivate extensive economic and strategic relations
with the nations of East Asia. 3 If Mauritius, a tax-haven country, is included, they would be ranked second and fourth. 4 The figures were estimated by data issued from the Ministry of Commerce and Industry, India.
I. Introduction 9
paper focuses on the causal relationship between Trade and FDI between India
and East Asian countries since the 2000s. In other words, the purpose of this
paper is to examine the causal links (unidirectional, bidirectional or independent)
between trade and FDI and its policy implications.
Study of the causal relationship between trade and FDI will help us determine
the direction of policy sets, and policy choices and focus. It will help us to predict
the effects of FTAs launched from the late 2000s. Lee and Song (2007) argued
that identifying causality between trade and FDI is an important issue in order to
evaluate the dynamic effect of FTA in the mid and long run.5 The dataset em-
ployed in this paper includes countries such as USA, UK, Germany and the
Netherlands, which have traditionally been major trade and FDI partners to India
before the emergence of East Asian countries.
This study consists of five chapters. The first chapter introduces the back-
ground and purpose of this study. The trend of trade and FDI between the ma-
jor East Asian countries and India are presented by comparison with other major
countries in the second chapter. Brief review of literature on the relationship
between trade and FDI is included in the third chapter. Empirical data, model
and analysis are elaborated in the fourth chapter. The last chapter concludes with
policy implications.
5 Lee and Song (2007), pp. 28-29.
II. Trend of Trade and FDI between India and East Asia
1. Trade
Trade volume between India and East Asian countries has significantly in-
creased since 2000. The performance of China is outstanding because trade vol-
ume between India and China has increased sharply by about 30 times from USD
2.3 billion in 2000 to USD 67.8 billion in 2011. In the case of Singapore, the
amount of trade with India in 2000 was almost the same as China; but India-
Singapore trade also increased by about 10 times and reached USD 21.3 billion by
2011. During the same period the trade volume between Korea and India has
increased by thirteen times from USD 1.3 billion to USD 17.7 billion. On the
other hand, the trade between Japan and India appeared very prosperous in 2000
with the highest volume among four countries; but the Japan-India trade in-
creased only by about five times since, from USD 3.6 billion in 2000 to USD 18.6
billion in 2011, which represents the lowest figure among the four countries.
In terms of each country’s share in India’s total trade, the Chinese share has
more than doubled from 4.1% in 2002 to 8.9% in 2011. While Singapore’s share
has increased to 3.7% in 2011 from 2.5% in 2002, Korea’s share rose only slightly
from 1.9% to 2.1% during the same period. On the other hand, the Japanese ratio
decreased by 1% point from 3.3% to 2.3% during the same period. 6
6 Most figures were estimated from the CEIC Data Base.
II. Trend of Trade and FDI between India and East Asia 11
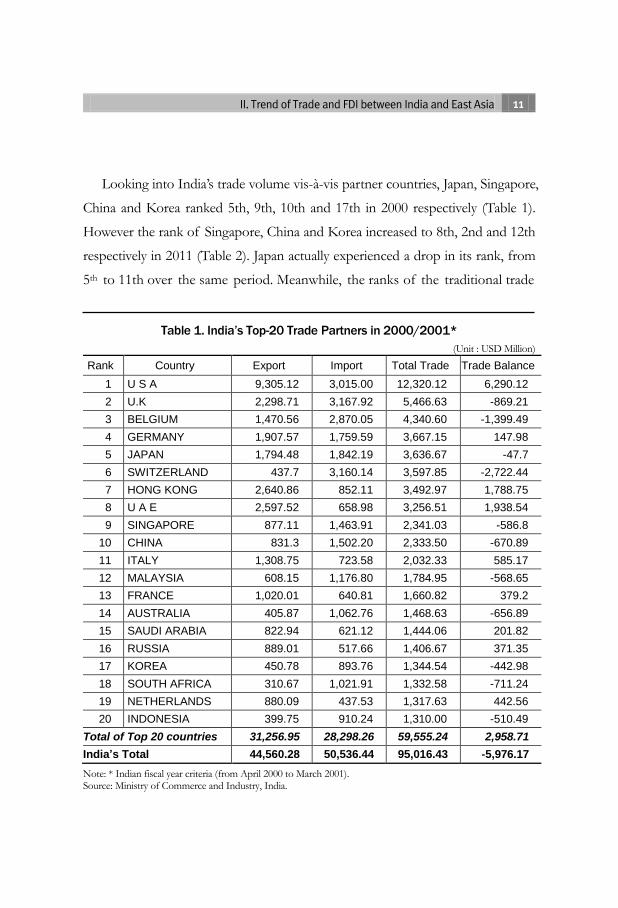
Looking into India’s trade volume vis-à-vis partner countries, Japan, Singapore,
China and Korea ranked 5th, 9th, 10th and 17th in 2000 respectively (Table 1).
However the rank of Singapore, China and Korea increased to 8th, 2nd and 12th
respectively in 2011 (Table 2). Japan actually experienced a drop in its rank, from
5th to 11th over the same period. Meanwhile, the ranks of the traditional trade
Table 1. India’s Top-20 Trade Partners in 2000/2001*
(Unit : USD Million)
Rank Country Export Import Total Trade Trade Balance
1 U S A 9,305.12 3,015.00 12,320.12 6,290.12
2 U.K 2,298.71 3,167.92 5,466.63 -869.21
3 BELGIUM 1,470.56 2,870.05 4,340.60 -1,399.49
4 GERMANY 1,907.57 1,759.59 3,667.15 147.98
5 JAPAN 1,794.48 1,842.19 3,636.67 -47.7
6 SWITZERLAND 437.7 3,160.14 3,597.85 -2,722.44
7 HONG KONG 2,640.86 852.11 3,492.97 1,788.75
8 U A E 2,597.52 658.98 3,256.51 1,938.54
9 SINGAPORE 877.11 1,463.91 2,341.03 -586.8
10 CHINA 831.3 1,502.20 2,333.50 -670.89
11 ITALY 1,308.75 723.58 2,032.33 585.17
12 MALAYSIA 608.15 1,176.80 1,784.95 -568.65
13 FRANCE 1,020.01 640.81 1,660.82 379.2
14 AUSTRALIA 405.87 1,062.76 1,468.63 -656.89
15 SAUDI ARABIA 822.94 621.12 1,444.06 201.82
16 RUSSIA 889.01 517.66 1,406.67 371.35
17 KOREA 450.78 893.76 1,344.54 -442.98
18 SOUTH AFRICA 310.67 1,021.91 1,332.58 -711.24
19 NETHERLANDS 880.09 437.53 1,317.63 442.56
20 INDONESIA 399.75 910.24 1,310.00 -510.49
Total of Top 20 countries 31,256.95 28,298.26 59,555.24 2,958.71
India’s Total 44,560.28 50,536.44 95,016.43 -5,976.17
Note: * Indian fiscal year criteria (from April 2000 to March 2001). Source: Ministry of Commerce and Industry, India.
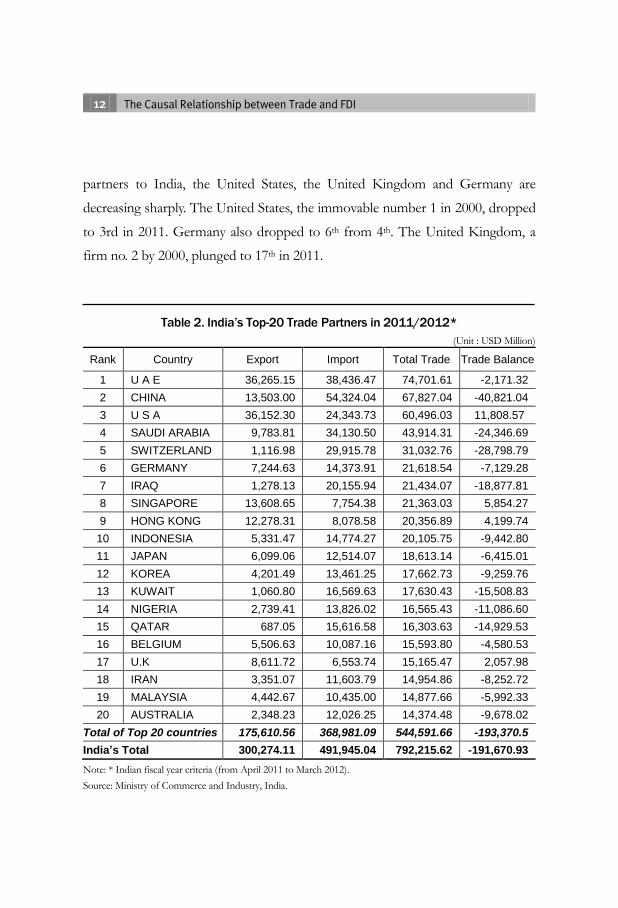
12 The Causal Relationship between Trade and FDI
partners to India, the United States, the United Kingdom and Germany are
decreasing sharply. The United States, the immovable number 1 in 2000, dropped
to 3rd in 2011. Germany also dropped to 6th from 4th. The United Kingdom, a
firm no. 2 by 2000, plunged to 17th in 2011.
Table 2. India’s Top-20 Trade Partners in 2011/2012*
(Unit : USD Million)
Rank Country Export Import Total Trade Trade Balance
1 U A E 36,265.15 38,436.47 74,701.61 -2,171.32
2 CHINA 13,503.00 54,324.04 67,827.04 -40,821.04
3 U S A 36,152.30 24,343.73 60,496.03 11,808.57
4 SAUDI ARABIA 9,783.81 34,130.50 43,914.31 -24,346.69
5 SWITZERLAND 1,116.98 29,915.78 31,032.76 -28,798.79
6 GERMANY 7,244.63 14,373.91 21,618.54 -7,129.28
7 IRAQ 1,278.13 20,155.94 21,434.07 -18,877.81
8 SINGAPORE 13,608.65 7,754.38 21,363.03 5,854.27
9 HONG KONG 12,278.31 8,078.58 20,356.89 4,199.74
10 INDONESIA 5,331.47 14,774.27 20,105.75 -9,442.80
11 JAPAN 6,099.06 12,514.07 18,613.14 -6,415.01
12 KOREA 4,201.49 13,461.25 17,662.73 -9,259.76
13 KUWAIT 1,060.80 16,569.63 17,630.43 -15,508.83
14 NIGERIA 2,739.41 13,826.02 16,565.43 -11,086.60
15 QATAR 687.05 15,616.58 16,303.63 -14,929.53
16 BELGIUM 5,506.63 10,087.16 15,593.80 -4,580.53
17 U.K 8,611.72 6,553.74 15,165.47 2,057.98
18 IRAN 3,351.07 11,603.79 14,954.86 -8,252.72
19 MALAYSIA 4,442.67 10,435.00 14,877.66 -5,992.33
20 AUSTRALIA 2,348.23 12,026.25 14,374.48 -9,678.02
Total of Top 20 countries 175,610.56 368,981.09 544,591.66 -193,370.5
India’s Total 300,274.11 491,945.04 792,215.62 -191,670.93
Note: * Indian fiscal year criteria (from April 2011 to March 2012).
Source: Ministry of Commerce and Industry, India.
II. Trend of Trade and FDI between India and East Asia 13
2. FDI
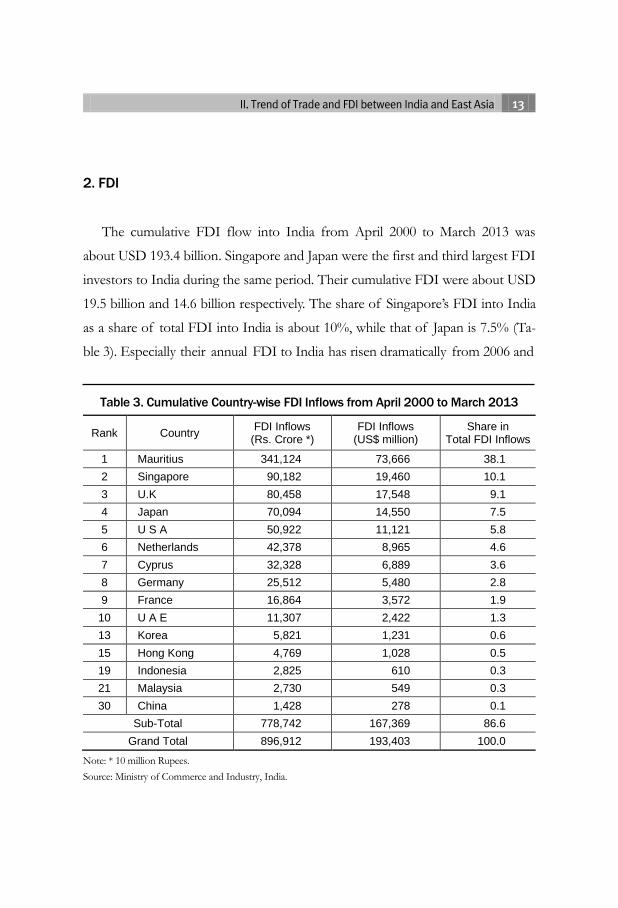
The cumulative FDI flow into India from April 2000 to March 2013 was
about USD 193.4 billion. Singapore and Japan were the first and third largest FDI
investors to India during the same period. Their cumulative FDI were about USD
19.5 billion and 14.6 billion respectively. The share of Singapore’s FDI into India
as a share of total FDI into India is about 10%, while that of Japan is 7.5% (Ta-
ble 3). Especially their annual FDI to India has risen dramatically from 2006 and
Table 3. Cumulative Country-wise FDI Inflows from April 2000 to March 2013
Rank Country FDI Inflows
(Rs. Crore *) FDI Inflows
(US$ million) Share in
Total FDI Inflows
1 Mauritius 341,124 73,666 38.1
2 Singapore 90,182 19,460 10.1
3 U.K 80,458 17,548 9.1
4 Japan 70,094 14,550 7.5
5 U S A 50,922 11,121 5.8
6 Netherlands 42,378 8,965 4.6
7 Cyprus 32,328 6,889 3.6
8 Germany 25,512 5,480 2.8
9 France 16,864 3,572 1.9
10 U A E 11,307 2,422 1.3
13 Korea 5,821 1,231 0.6
15 Hong Kong 4,769 1,028 0.5
19 Indonesia 2,825 610 0.3
21 Malaysia 2,730 549 0.3
30 China 1,428 278 0.1
Sub-Total 778,742 167,369 86.6
Grand Total 896,912 193,403 100.0
Note: * 10 million Rupees.
Source: Ministry of Commerce and Industry, India.
14 The Causal Relationship between Trade and FDI
2007 respectively. In 2005 Singapore-India Comprehensive Economic Coopera-
tion Agreement and Double Taxation Avoidance Act became effective. Since
then, FDI inflows from Singapore to India have soared from USD 321 million in
2005 to USD 4.2 billion in 2011. In 2006 Japan and India upgraded their relation-
ship from Global Partnership to a Global Strategic Partnership, and mutually
agreed to establish a Comprehensive Economic Partnership. Since then, as in the
case of Singapore, Japanese FDI into India has jumped from USD 116 million in
2006 to USD 3.1 billion in 2011.7
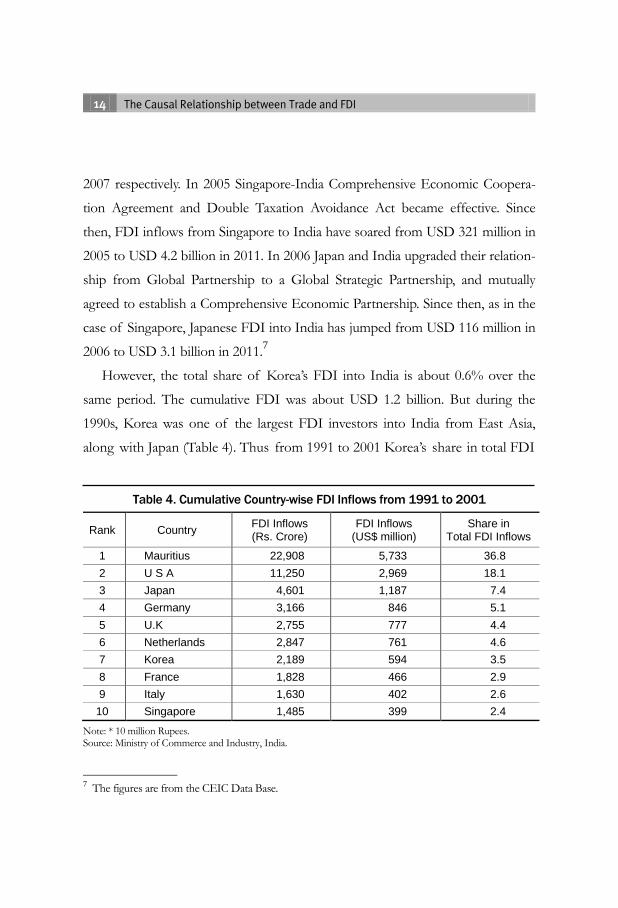
However, the total share of Korea’s FDI into India is about 0.6% over the
same period. The cumulative FDI was about USD 1.2 billion. But during the
1990s, Korea was one of the largest FDI investors into India from East Asia,
along with Japan (Table 4). Thus from 1991 to 2001 Korea’s share in total FDI
Table 4. Cumulative Country-wise FDI Inflows from 1991 to 2001
Rank Country FDI Inflows (Rs. Crore)
FDI Inflows (US$ million)
Share in Total FDI Inflows
1 Mauritius 22,908 5,733 36.8
2 U S A 11,250 2,969 18.1
3 Japan 4,601 1,187 7.4
4 Germany 3,166 846 5.1
5 U.K 2,755 777 4.4
6 Netherlands 2,847 761 4.6
7 Korea 2,189 594 3.5
8 France 1,828 466 2.9
9 Italy 1,630 402 2.6
10 Singapore 1,485 399 2.4
Note: * 10 million Rupees. Source: Ministry of Commerce and Industry, India.
7 The figures are from the CEIC Data Base.
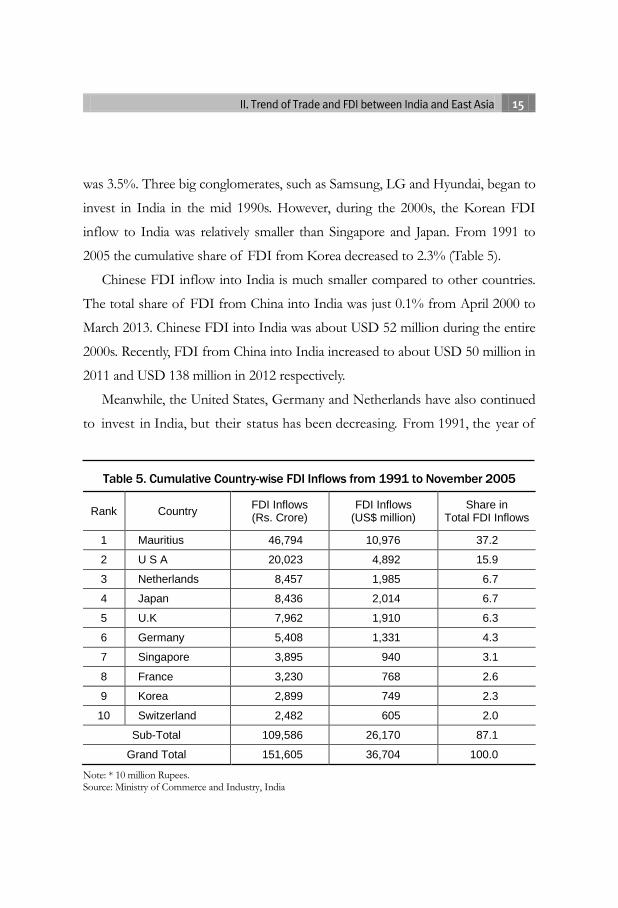
II. Trend of Trade and FDI between India and East Asia 15
was 3.5%. Three big conglomerates, such as Samsung, LG and Hyundai, began to
invest in India in the mid 1990s. However, during the 2000s, the Korean FDI
inflow to India was relatively smaller than Singapore and Japan. From 1991 to
2005 the cumulative share of FDI from Korea decreased to 2.3% (Table 5).
Chinese FDI inflow into India is much smaller compared to other countries.
The total share of FDI from China into India was just 0.1% from April 2000 to
March 2013. Chinese FDI into India was about USD 52 million during the entire
2000s. Recently, FDI from China into India increased to about USD 50 million in
2011 and USD 138 million in 2012 respectively.
Meanwhile, the United States, Germany and Netherlands have also continued
to invest in India, but their status has been decreasing. From 1991, the year of
Table 5. Cumulative Country-wise FDI Inflows from 1991 to November 2005
Rank Country FDI Inflows (Rs. Crore)
FDI Inflows (US$ million)
Share in Total FDI Inflows
1 Mauritius 46,794 10,976 37.2
2 U S A 20,023 4,892 15.9
3 Netherlands 8,457 1,985 6.7
4 Japan 8,436 2,014 6.7
5 U.K 7,962 1,910 6.3
6 Germany 5,408 1,331 4.3
7 Singapore 3,895 940 3.1
8 France 3,230 768 2.6
9 Korea 2,899 749 2.3
10 Switzerland 2,482 605 2.0
Sub-Total 109,586 26,170 87.1
Grand Total 151,605 36,704 100.0
Note: * 10 million Rupees. Source: Ministry of Commerce and Industry, India
16 The Causal Relationship between Trade and FDI
Reform, to 2001, they were the first, third and fifth largest FDI contributors to
India, respectively. But from 2000 to 2012 the United States and Germany
dropped to fourth and seventh respectively. The Netherlands has stayed at no. 5.
Only the United Kingdom increased in rank from the fourth to the second in the
same period.
III. Literature Review and Distinction
The interaction between FDI and trade has become complicated with the
trend of economic integration, while the importance of the relationship between
trade and FDI has increased over the years. Although researchers have theoreti-
cally and empirically studied the relationship between trade and FDI, it is still
under debate.8
According to the traditional Hecksher-Ohlin assumption, trade and FDI have
a substitute relationship (Mundell 1957). Moreover, some studies (Caves 1957)
assume that export and FDI can be mutual alternatives with respect to entering
foreign markets, implying that there is a substitutive relationship between export
and FDI. Gray (1998) also argued that market-seeking FDI and trade are substi-
tutes, while efficiency-seeking FDI and trade are complementary. In others stud-
ies the motives for FDI were divided into three categories; the horizontal motiva-
tions (Markusen 1984; Markusen and Venables 1998), the vertical motivations
(Helpman 1984; Helpman and Krugman 1985) and the knowledge-capital model
(Markusen and Maskus 2001), which combines both the horizontal and vertical
models.9 Theoretically, horizontal FDI is designed to place production close to
foreign consumers and thereby avoid trade costs10
and is a substitute to trade as
8 The studies on the relationship between trade and investment and the relationship between intra-
industry trade and investment with industry or company level data were many, but those introduced
here are mainly studies on the relationship between trade and investment with macro-economic level
data.
9 Jang (2011), p. 1, p. 629. 10 Jang (2011), p. 1, p. 629.
18 The Causal Relationship between Trade and FDI
in the relationship between market-seeking FDI and trade. On the other hand,
vertical FDI and trade are complementary because vertical FDI is driven by the
distance of production costs rather than trade costs.
When these existing theories and hypotheses are applied to the FDI inflow
from East Asian countries to India, the horizontal and vertical FDI motivations
are working simultaneously. Because of high trade cost such as overall high tariffs,
import ban on durable goods with very high tariffs and lower labor cost were
especially active in inducing FDI to India. Therefore, to find the relationship be-
tween trade and FDI in India-East Asia countries, the approach relying on the
nature of FDI would require deeper analysis. But India’s FDI statistics as well as
the country-specific statistics by FDI motivations are very limited, which is why
we try to find the causality between trade and FDI in this paper. Instead, this
study includes the western countries, traditional economic partners to India, in
the dataset because it brings greater clarity in understanding the relationship be-
tween trade and FDI between India and the East Asian Countries. And that
would help us decipher the effect of the quantitative expansion of India-East
Asia trade and FDI since the late 2000s and find the policy implications of accel-
erating economic integration between both.
The literature on the causal relationship between trade and FDI include Hsiao
and Hsiao (2006), who argued that FDI caused exports, in turn leading to eco-
nomic growth in the eight East and Southeast Asian countries (China, Korea,
Taiwan, Hong Kong, Singapore, Malaysia, Philippines and Thailand) from 1986
to 2004. Likewise, Min (2003) also supported that FDI inflows stimulated exports
in Malaysia.
However, Liu et al. (2001) found different results in the case of China with
nineteen countries from 1984 to 1998. They found that the growth rate of Chi-
III. Literature Review and Distinction 19
na’s imports caused the growth in inward FDI from home countries, which in
turn, caused the growth of exports from China to the home country.
In the case of Mexico, Pacheco-Lopez (2005) found bi-directional Granger
causality between exports and FDI, and between imports and FDI. She interpret-
ed the result as liberalization of FDI easing access of multinational corporations
to the country and promoting exports. In addition, an increase in exports led to
an increase in import in the case of Mexico.
And there are few studies on the causal relationship between trade and FDI in
the case of India. Jayachandran and Seilan (2010) performed a causality test
among trade, FDI and economic growth in India from 1970 to 2007 but did not
find a significant connection between trade and FDI.
In Korea, the results by Lee and Song (2008) were almost unique; applying the
Granger causality test method and employing annual data from 1970 to 2004.
They found that trade led to FDI between Korea and the United States, and Ko-
rea and China, while FDI caused trade between Korea and Japan.
IV. Data, Methodology and Estimation
1. Analyzed Countries and Data
The eight countries employed for analysis include; four East Asia countries
like Korea, Japan, Singapore, China and the other four countries such as the US,
UK, Germany and the Netherlands. All of these are the top countries in terms
of trade and FDI with India.
Among top trade partners to India, oil-importing countries like UAE, Saudi
Arabia, Iraq and a gold-importing country, Switzerland, were excluded. Also
among top FDI partners to India, the tax-haven countries like Mauritius, Cyprus
and the other countries, with cumulative FDI inflow of less than $1 billion by
March 2013, were also excluded.
In this study, bilateral trade and FDI volume data are used. From the third
quarter of 2004 to the fourth quarter of 2012, quarterly data were utilized. All of
the data came from the Ministry of Commerce and Industry in India and were
obtained through the CEIC database. The reason that this study could not cover
the data before 2004 is that there is no continuous FDI data by countries before
2004 because the Government of India changed the FDI estimation criteria two
or three times since. As a result, there was disconnection with respect to data be-
fore 2004.
In this study, trade data included bilateral export and import, but FDI data in-
cluded inflow to India from each country. FDI inflow from India to each country
IV. Data, Methodology and Estimation 21
was too small and sporadic to be included in this study.
The following table is the basic description of the data used in this study.
Both trade and FDI data have a positive value. Skewness and kurtosis values for
each of the data show that they are not normally distributed. Most of the data
distribution have a skewed right and more or less-peck rather than a normal dis-
tribution. As a result, the values of Jarque-Bera are not significant.
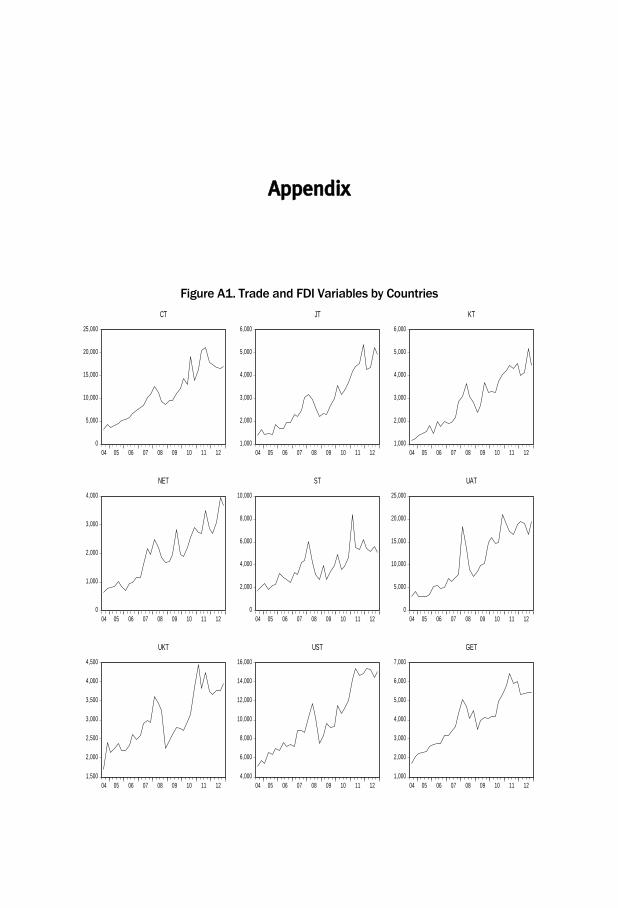
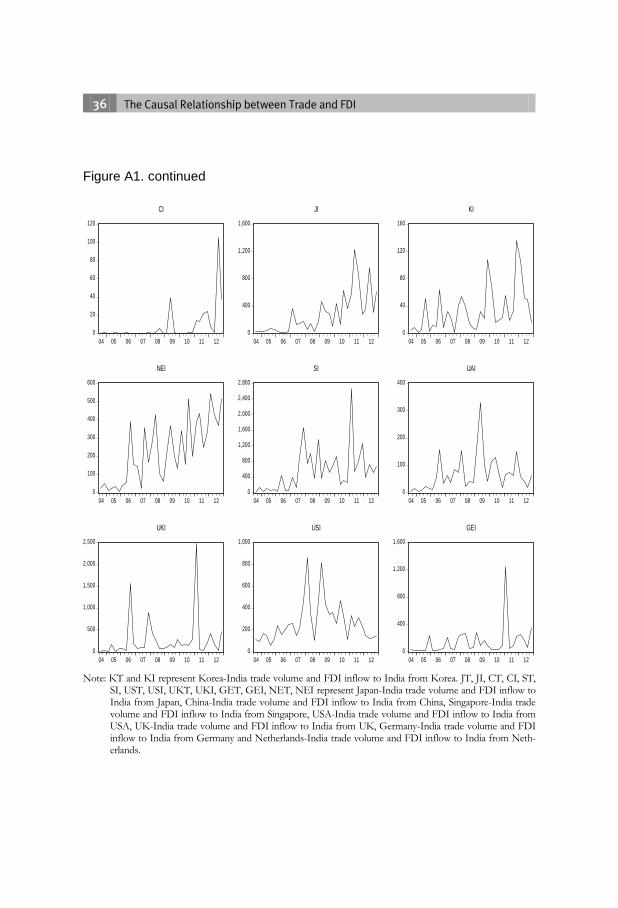
Looking to trade and FDI graph (Figure 1),11 the trade data show a generally
increasing trend. That means trade of all individual countries with India increased
over time. However, there exists a generally upward trajectory for FDI, though
the level is lower and more irregular than trade. Therefore the primary integral
data or the first difference integral data should be used in this study.
Table 6. The Basic Descriptions of the Data
KT JT CT ST UST UKT GET NET
Mean 2912.89 2903.26 11067.57 3911.29 10003.1 2986.73 4055.48 1976.70
Median 2982.12 2646.62 10569.26 3744.31 9253.985 2859.57 4114.25 1951.99
Maximum 5188.63 5340.46 21084.5 8426.34 15399.26 4465.81 6438.37 3972.12
Minimum 1170.47 1358.57 3226.41 1711.55 5067.01 1699.94 1732.26 634.85
Std. Dev. 1148.74 1178.876 5231.77 1506.386 3295.585 698.0934 1305.82 931.2171
Skewness 0.110011 0.528781 0.249807 0.774205 0.39918 0.352515 -0.02001 0.257637
Kurtosis 1.77407 2.162149 1.952326 3.519314 1.883065 2.111449 1.902606 2.125693
Jarque-Bera 2.197695 2.578946 1.908582 3.778621 2.67031 1.822668 1.708324 1.459054
Probability 0.333255 0.275416 0.385085 0.151176 0.263117 0.401988 0.42564 0.482137
Sum 99038.56 98711.08 376297.5 132984.1 340105.5 101549.1 137886.6 67208.12
Sum Sq. Dev. 43547528 45861707 9.03E+08 74883534 3.58E+08 16082035 56270510 28616457
Observations 34 34 34 34 34 34 34 34
11 See appendix.
22 The Causal Relationship between Trade and FDI
Table 6. continued
KI JI CI SI USI UKI GEI NEI
Mean 33.86 280.00 8.17 563.76 271.74 279.45 145.16 227.78
Median 22.8 160.28 0.585 424.655 233.655 125.365 66.365 197.59
Maximum 135.96 1234.19 105.85 2671.44 867.29 2476.89 1255.18 543.05
Minimum 0.64 12.82 0 4.9 57.12 6.56 17.73 6.5
Std. Dev. 32.84653 301.3317 20.15392 559.4996 184.8313 488.415 219.6597 170.3706
Skewness 1.471411 1.483816 3.691328 1.81869 1.70787 3.38118 3.951758 0.275566
Kurtosis 4.750801 4.760423 17.58002 7.186454 5.994206 14.41875 20.43918 1.751398
Jarque-Bera 16.61112 16.86674 3.78E+02 43.57233 2.92E+01 2.49E+02 519.3366 2.638903
Probability 0.000247 0.000217 0 0 0 0 0 0.267282
Sum 1151.39 9520.33 278 19168.16 9239.48 9501.36 4935.47 7744.59
Sum Sq. Dev. 35603.52 2996426 13403.96 10330312 1127367 7872123 1592262 957862.3
Observations 34 34 34 34 34 34 34 34
Note: KT and KI represents Korea-India trade volume and FDI inflow to India from Korea. JT, JI, CT, CI, ST, SI, UST, USI, UKT, UKI, GET, GEI, NET, NEI shows Japan-India trade volume and FDI inflow to In-dia from Japan, China-India trade volume and FDI inflow to India from China, Singapore-India trade vol-ume and FDI inflow to India from Singapore, USA-India trade volume and FDI inflow to India from USA, UK-India trade volume and FDI inflow to India from UK, Germany-India trade volume, FDI in-flow to India from Germany, Netherland-India trade volume and FDI inflow to India from the Nether-lands.
Since now the case of China-India is excluded in the analysis due to problems
in China’s FDI inflow data. In the 34 quarters, the volume of FDI is zero in 4
quarters and 7 quarters had FDI less than USD 100,000.12
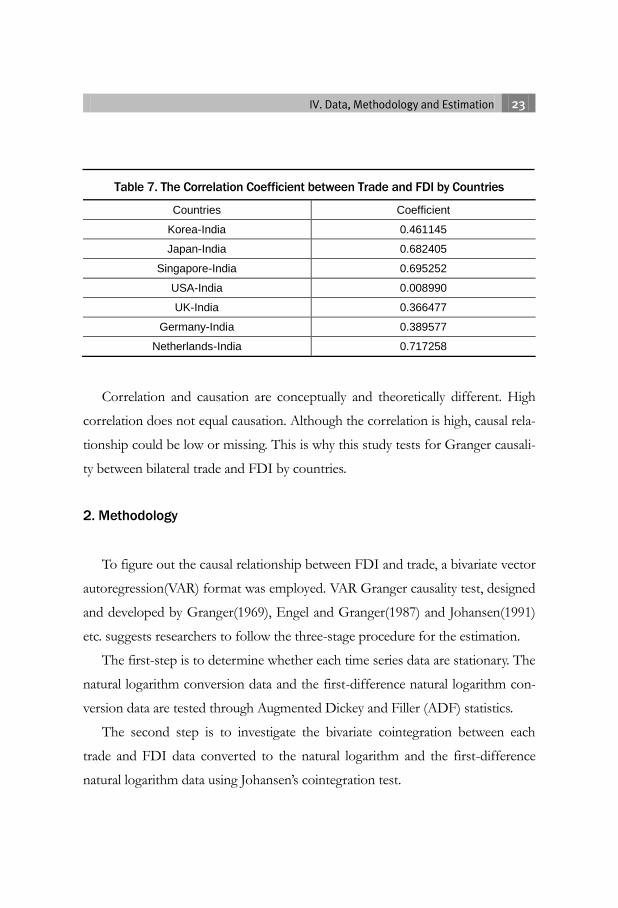
Meanwhile, the trade and FDI show positive correlation coefficients. In par-
ticular coefficients for the Netherlands, Singapore and Japan are very high, at
more than 68%. The coefficient of Korea is over 46%. Germany and the United
Kingdom’s coefficients are about 37%, 36% respectively. The United States is
unique, with very little correlation between trade and investment.
12 See the graph CI in the appendix 5
IV. Data, Methodology and Estimation 23
Table 7. The Correlation Coefficient between Trade and FDI by Countries
Countries Coefficient
Korea-India 0.461145
Japan-India 0.682405
Singapore-India 0.695252
USA-India 0.008990
UK-India 0.366477
Germany-India 0.389577
Netherlands-India 0.717258
Correlation and causation are conceptually and theoretically different. High
correlation does not equal causation. Although the correlation is high, causal rela-
tionship could be low or missing. This is why this study tests for Granger causali-
ty between bilateral trade and FDI by countries.
2. Methodology
To figure out the causal relationship between FDI and trade, a bivariate vector
autoregression(VAR) format was employed. VAR Granger causality test, designed
and developed by Granger(1969), Engel and Granger(1987) and Johansen(1991)
etc. suggests researchers to follow the three-stage procedure for the estimation.
The first-step is to determine whether each time series data are stationary. The
natural logarithm conversion data and the first-difference natural logarithm con-
version data are tested through Augmented Dickey and Filler (ADF) statistics.
The second step is to investigate the bivariate cointegration between each
trade and FDI data converted to the natural logarithm and the first-difference
natural logarithm data using Johansen’s cointegration test.
24 The Causal Relationship between Trade and FDI
Above two steps provides the proper data and analysis method. Engel and
Granger (1987) and Johansen (1991) recommend that when each time series data
are stationary and there is the presence of cointegration between both data, the
natural logarithm conversion data as a level data are better for the unrestricted
VAR Granger causality test. They also recommended when each time series data
are not stationary, but there is the presence of cointegration between both, the
natural logarithm conversion data (level data) could be used with vector error
correction VAR Granger causality test. The reason is that the possibility of spuri-
ous regression is low in that case.
Relying on the method above three estimation equations could be established
as follows. Let , be a stationary time series with zero means respective-
ly( =0, =0). The simple causal equation is (1). The definition Granger causal-
ity is as follows: If is causing provided some is not zero. Similarly
is causing if some is not zero. If both of these events occur, there is said
to be a feedback relationship between and (Granger 1969, p. 431).
In this study,13 if the level data of and are stationary and have
cointegration, an unrestricted VAR Granger equation 1 is applied.
(Equation 1)
Secondly, if the level data of and are not stationary but have
cointegration, an error correction VAR Granger Equation 2 is applied.
13 Ghosh (2006) also applied three models, as in this study.
IV. Data, Methodology and Estimation 25
(Equation 2)
Thirdly, if the level data of and are stationary but have no
cointegration, instead of level data the first-difference data with an unrestricted
VAR Granger Equation 3 is applied.
(Equation 3)
Through the equation 1, 2 or 3, if the null hypothesis could be rejected unilat-
erally, or Granger causes or respectively. If the null hypothesis
could be rejected simultaneously, and Granger causes each other.
3. Estimation
A. Unit Root and Cointegration Test
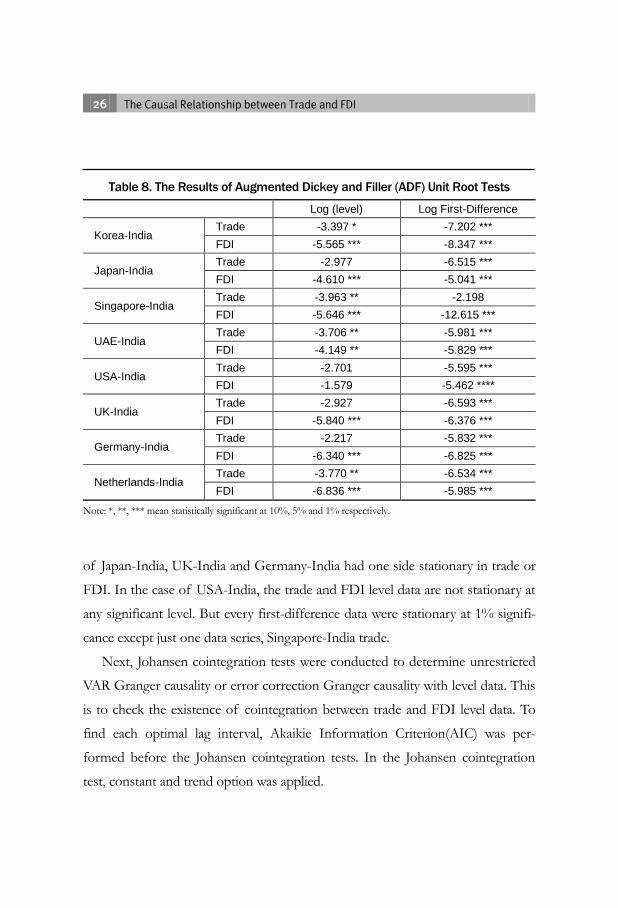
To examine whether the data are stationary, the Augmented Dickey and Filler
(ADF) unit root test was conducted. Table 8 presented the results of the ADF
test on the natural logarithms conversion data and the first-difference of the nat-
ural logarithms conversion data. As a level data, Korea-India, Singapore-India and
Netherland-India data were stationary at 10% significance level at least. The data
26 The Causal Relationship between Trade and FDI
Table 8. The Results of Augmented Dickey and Filler (ADF) Unit Root Tests
Log (level) Log First-Difference
Korea-India Trade -3.397 * -7.202 ***
FDI -5.565 *** -8.347 ***
Japan-India Trade -2.977 -6.515 ***
FDI -4.610 *** -5.041 ***
Singapore-India Trade -3.963 ** -2.198
FDI -5.646 *** -12.615 ***
UAE-India Trade -3.706 ** -5.981 ***
FDI -4.149 ** -5.829 ***
USA-India Trade -2.701 -5.595 ***
FDI -1.579 -5.462 ****
UK-India Trade -2.927 -6.593 ***
FDI -5.840 *** -6.376 ***
Germany-India Trade -2.217 -5.832 ***
FDI -6.340 *** -6.825 ***
Netherlands-India Trade -3.770 ** -6.534 ***
FDI -6.836 *** -5.985 ***
Note: *, **, *** mean statistically significant at 10%, 5% and 1% respectively.
of Japan-India, UK-India and Germany-India had one side stationary in trade or
FDI. In the case of USA-India, the trade and FDI level data are not stationary at
any significant level. But every first-difference data were stationary at 1% signifi-
cance except just one data series, Singapore-India trade.
Next, Johansen cointegration tests were conducted to determine unrestricted
VAR Granger causality or error correction Granger causality with level data. This
is to check the existence of cointegration between trade and FDI level data. To
find each optimal lag interval, Akaikie Information Criterion(AIC) was per-
formed before the Johansen cointegration tests. In the Johansen cointegration
test, constant and trend option was applied.
IV. Data, Methodology and Estimation 27
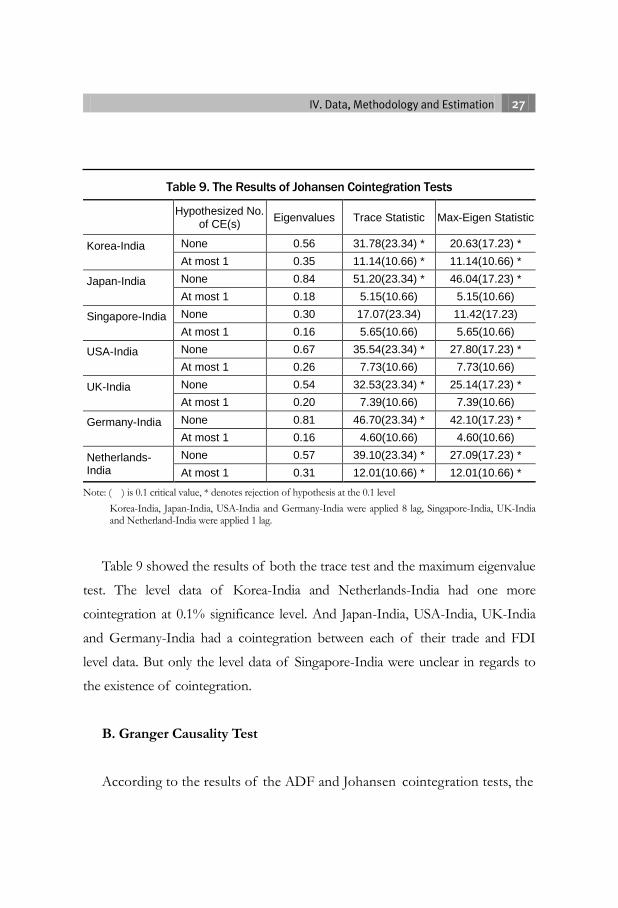
Table 9. The Results of Johansen Cointegration Tests
Hypothesized No.
of CE(s) Eigenvalues Trace Statistic Max-Eigen Statistic
Korea-India
None 0.56 31.78(23.34) * 20.63(17.23) *
At most 1 0.35 11.14(10.66) * 11.14(10.66) *
Japan-India
None 0.84 51.20(23.34) * 46.04(17.23) *
At most 1 0.18 5.15(10.66) 5.15(10.66)
Singapore-India
None 0.30 17.07(23.34) 11.42(17.23)
At most 1 0.16 5.65(10.66) 5.65(10.66)
USA-India
None 0.67 35.54(23.34) * 27.80(17.23) *
At most 1 0.26 7.73(10.66) 7.73(10.66)
UK-India
None 0.54 32.53(23.34) * 25.14(17.23) *
At most 1 0.20 7.39(10.66) 7.39(10.66)
Germany-India
None 0.81 46.70(23.34) * 42.10(17.23) *
At most 1 0.16 4.60(10.66) 4.60(10.66)
Netherlands-India
None 0.57 39.10(23.34) * 27.09(17.23) *
At most 1 0.31 12.01(10.66) * 12.01(10.66) *
Note: ( ) is 0.1 critical value, * denotes rejection of hypothesis at the 0.1 level
Korea-India, Japan-India, USA-India and Germany-India were applied 8 lag, Singapore-India, UK-India and Netherland-India were applied 1 lag.
Table 9 showed the results of both the trace test and the maximum eigenvalue
test. The level data of Korea-India and Netherlands-India had one more
cointegration at 0.1% significance level. And Japan-India, USA-India, UK-India
and Germany-India had a cointegration between each of their trade and FDI
level data. But only the level data of Singapore-India were unclear in regards to
the existence of cointegration.
B. Granger Causality Test
According to the results of the ADF and Johansen cointegration tests, the
28 The Causal Relationship between Trade and FDI
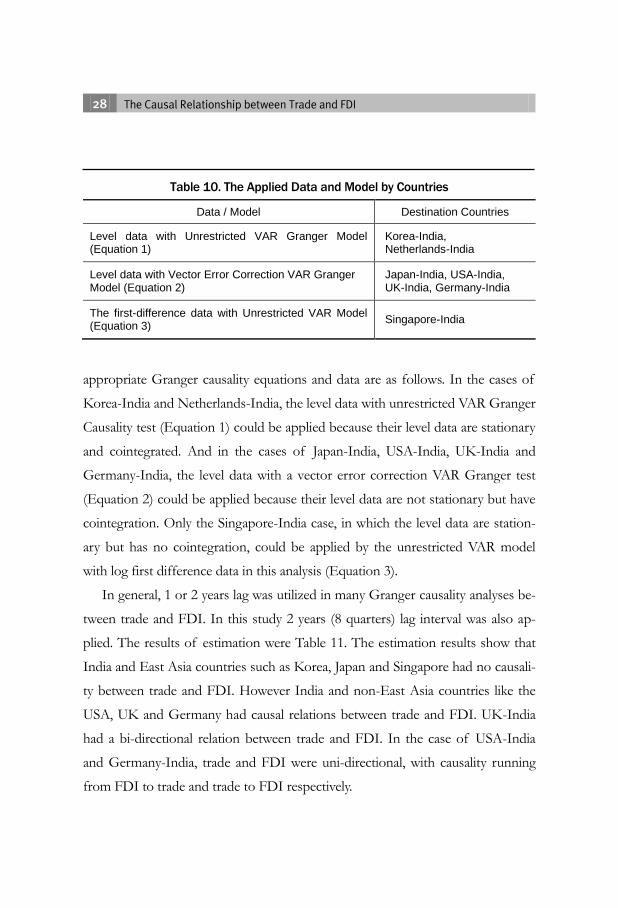
Table 10. The Applied Data and Model by Countries
Data / Model Destination Countries
Level data with Unrestricted VAR Granger Model (Equation 1)
Korea-India, Netherlands-India
Level data with Vector Error Correction VAR Granger Model (Equation 2)
Japan-India, USA-India, UK-India, Germany-India
The first-difference data with Unrestricted VAR Model (Equation 3)
Singapore-India
appropriate Granger causality equations and data are as follows. In the cases of
Korea-India and Netherlands-India, the level data with unrestricted VAR Granger
Causality test (Equation 1) could be applied because their level data are stationary
and cointegrated. And in the cases of Japan-India, USA-India, UK-India and
Germany-India, the level data with a vector error correction VAR Granger test
(Equation 2) could be applied because their level data are not stationary but have
cointegration. Only the Singapore-India case, in which the level data are station-
ary but has no cointegration, could be applied by the unrestricted VAR model
with log first difference data in this analysis (Equation 3).
In general, 1 or 2 years lag was utilized in many Granger causality analyses be-
tween trade and FDI. In this study 2 years (8 quarters) lag interval was also ap-
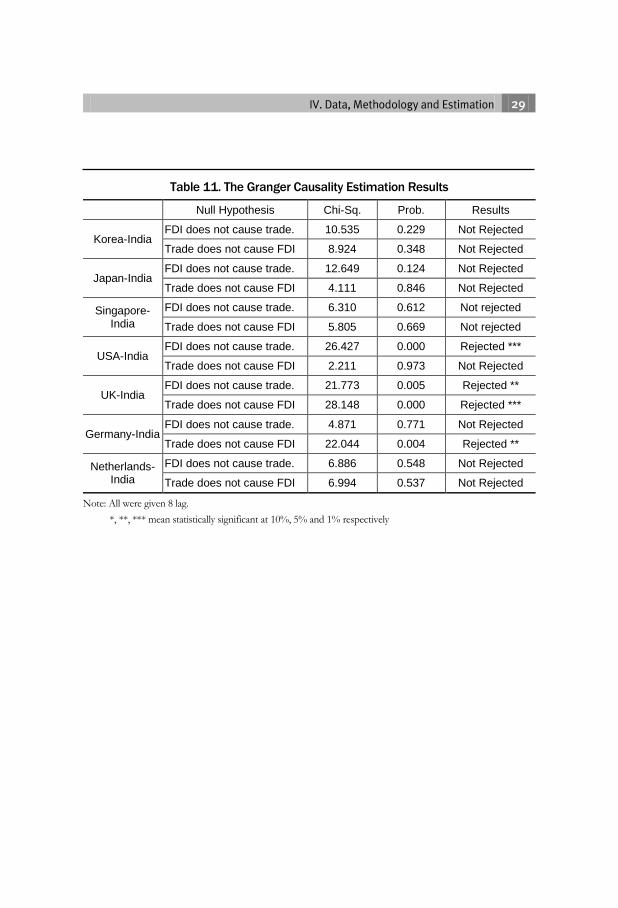
plied. The results of estimation were Table 11. The estimation results show that
India and East Asia countries such as Korea, Japan and Singapore had no causali-
ty between trade and FDI. However India and non-East Asia countries like the
USA, UK and Germany had causal relations between trade and FDI. UK-India
had a bi-directional relation between trade and FDI. In the case of USA-India
and Germany-India, trade and FDI were uni-directional, with causality running
from FDI to trade and trade to FDI respectively.
IV. Data, Methodology and Estimation 29
Table 11. The Granger Causality Estimation Results
Null Hypothesis Chi-Sq. Prob. Results
Korea-India FDI does not cause trade. 10.535 0.229 Not Rejected
Trade does not cause FDI 8.924 0.348 Not Rejected
Japan-India FDI does not cause trade. 12.649 0.124 Not Rejected
Trade does not cause FDI 4.111 0.846 Not Rejected
Singapore-India
FDI does not cause trade. 6.310 0.612 Not rejected
Trade does not cause FDI 5.805 0.669 Not rejected
USA-India FDI does not cause trade. 26.427 0.000 Rejected ***
Trade does not cause FDI 2.211 0.973 Not Rejected
UK-India FDI does not cause trade. 21.773 0.005 Rejected **
Trade does not cause FDI 28.148 0.000 Rejected ***
Germany-India FDI does not cause trade. 4.871 0.771 Not Rejected
Trade does not cause FDI 22.044 0.004 Rejected **
Netherlands-India
FDI does not cause trade. 6.886 0.548 Not Rejected
Trade does not cause FDI 6.994 0.537 Not Rejected
Note: All were given 8 lag.
*, **, *** mean statistically significant at 10%, 5% and 1% respectively
V. Conclusion and Policy Implication
As we have seen earlier, since the late 2000s the economic exchange between
India and East Asia have become increasingly active. The trade and FDI of major
East Asian countries such as Korea, China, Japan and Singapore with India ap-
pear to be more active than the western countries such as the United States, the
United Kingdom, Germany and the Netherlands who were major trade and FDI
partners for India previously. The correlation coefficients between trade and FDI
in cases of India-East Asian countries were much higher than for India-western
countries.
However, the causal relationship between bilateral trade and FDI for India
and the East Asian countries elicited results contrary to our expectations. In Ko-
rea-India, Japan-India and Singapore-India bilateral relationships, the causality
between trade and FDI could not be found. In contrast, for the cases of USA-
India, UK-India and Germany-India, while their bilateral trade and FDI was rela-
tively poor in the late 2000s, the relationship showed the two-way or one-way
causality respectively.
The estimation results raise new research questions such as the effect of the
exchange term or scale and the motives for FDI on the relationship between
trade and FDI. But those questions could not be answered clearly in this study
because of limitations in data and the analytical model.
Yet in spite of the limitations, the estimation results could provide us with
policy implications to the effect that bilateral trade and FDI causal relationship is
V. Conclusion and Policy Implication 31
growing by long-term economic exchange rather than a short-term increase of
quantity in trade or FDI. In other words, the UK, USA and Germany are old and
established economic partners for India just as USA, Japan and China are the
major (and established) economic partners for Korea. East Asian countries,
namely Korea, Japan and Singapore, have a relatively short history of economic
exchange in comparison to western countries such as the UK, USA and Germany.
The context of this study is similar with Lee and Song (2008) that showed the
causal relationship between bilateral trade and FDI in USA, Japan and China with
Korea, which appeared to be unidirectional.
In fact, before the 1991 reform in India, these Western countries engaged in
much economic exchanges with India. According to India’s Investment Center,
from 1981 to 1990 the total FDI inflow from the west was about USD 9.5 billion.
Among them, the United States (25%), Germany (16%) and the United Kingdom
(7%) accounted for 48% while they mainly invested in chemicals (34%), electron-
ics (19%) and machinery (4%) sectors.14
In terms of the number of joint ven-
tures in 1984, among the total of 412 companies, 189 companies belonged to
United Kingdom (46%), 90 and 47 companies were from the United States (22%)
and Germany (11%) respectively.15
In this situation, the question of the effectiveness of FTA which was signed
and went into force between India and each East Asian country like Korea, Japan
and Singapore may be raised. On the other hand, and paradoxically, the FTA may
contribute to enhanced interrelationship between trade and FDI although the
causal relationship has not been found yet.
Even with the uncertainty of the causal relationship between bilateral trade
14 Akhtar (2013), Table 3 and Table 4 were calculated. 15 Dhar (1988), Annexure I was numbered and calculated.
32 The Causal Relationship between Trade and FDI
and FDI, India and East Asian countries will eventually have to promote trade
and FDI simultaneously rather than to focus on one or the other. From this per-
spective, more measures for investment as well as trade have to be deployed in
future FTA upgrade negotiations between India and East Asia included. Fur-
thermore, the two governments should further strengthen bilateral efforts to cre-
ate a production division in the global supply chain through trade and FDI. The-
se efforts will make it possible to compensate for the relatively low trade-FDI
relationship and the short history of economic exchange between India and East
Asian Countries.
While this study focuses on the analysis of the causal relationship between bi-
lateral trade and FDI, it had its limitations especially in terms of data employment
and operation. The limitations of statistical data on Indian FDI inflow prevented
us from making a more detailed analysis. For example, the study could not reflect
on the fact that each country differs in its history and pattern regarding its trade
and FDI with India. If those facts had been taken into account and then analyzed,
the policy implications would be much clearer. In addition, inclusion of variables,
such as industry or business level, may have increased the validity of the model.
References
Akhtar, G. 2013. “Inflows of FDI in India : Pre and Post Reform Period.” International
Journal of Humanities and Social Science Invention, Vol. 2, Issue 2, pp. 1-11.
Caves, R. E. 1957. “International Trade and Industrial Organization: Problems, Solved
and Unsolved.” European Economic Review, Vol. 28, No. 3, pp. 377-395.
Dhar, B. 1998. “Foreign Controlled Companies in India: An Attempt and Identification.”
Institute for Studies in Industrial Development Working Paper 1988/03.
Engle,R.F and Granger,C. 1987. “Co-intergration and Error-correction: Representation,
Estimation and Testing.” Econometrica, Vol. 49(4), pp. 1057-1072.
Ghosh, S. 2006. “Steel Consumption and Economic Growth: Evidence from India.” Re-
source Policy, 31, pp. 7-11.
Granger, C. 1969. “Investigating Causal Relations by Econometric Models and Cross-
Spectral Methods.” Econometrica, Vol. 37, pp. 24-36.
Gray, H.P. 1998. “International Trade and Foreign Direct Investment: the Interface.” In
J.H. Dunning ed. Globalization, Trade and Foreign Direct Investment, pp. 19-28. Oxford:
Elsevier.
Helpman, E. 1984. “A Simple Properties of Generalized Method of Moments Estimator.”
Journal of Political Economy, 92, 3, pp. 457-471.
Helpman,E. and Krugman, P. 1985. Market Structure and International Trade. Cambrige, MT:
MIT Press.
Hsiao, F. S. T. and M.C. W. Hsiao. 2006. “FDI, Export and Growth in East and Southeast
Asia- Evidence from Time-Series and Panel Data Causality Analyses.” Journal of
Asian Economics, Vol. 17, No. 6, pp. 1082-1106.
Jayachandran,G and Seilan, A. 2010. “A Causal Relationship between Trade, Foreign Di-
rect Investment and Economic Growth for India.” International Research Journal of
Finance and Economics, Issue 42, pp. 74-88.
Jang, Y. J. 2011. “The Impact of Bilateral Free Trade Agreements on Bilateral Forign Di-
rect Investment among Developed Countries.” The World Economy, pp. 1628-1651.
34 The Causal Relationship between Trade and FDI
Johansen, S. 1991. “Estimation and Hypothesis Testing of Cointegration Vectors in
Gaussian Vector Autoregressive Models.” Econometrica, Vol. 59, No. 6, pp. 1551-
1580.
Lee, J.H. and J. S. Song. 2008. “Is There a Two-Way Linkage Between Trade and FDI?:
Evidence from Korea’s Major Trading Partners.” International Area Studies, Vol. 3,
pp. 25-41.
Liu, X., C. Wang and Y. Wei. 2001. “Causal Links between Foreign Direct Investment and
Trade in China.” China Economic Review, Vol. 12, pp. 190-202.
Markusen, J. 1984. “Multinationals, Multi-Plant Economies, and the Gains from Trade.”
Journal of International Economics, 16, 3-4, pp. 205-226.
Markusen, J. and Maskus, K. 2001. “General Equilibrium Approaches to the Multinational
Firm: A Review of Theory and Evidence.” NBER Working Paper 8334.
Markusen, J. and Venables, A. 1998. “Multinational Firms and the New Trade Theory.”
Journal of International Economics, 46, 2, pp. 183-203.
Min, B. S. 2003. “FDI and Trade: Links in the Case of Malaysia.” Journal of the Asia Pacific
Economy, Vol. 8, No. 2, pp. 229-250.
Mundell, R. A. 1957. “International Trade and Factor Mobility.” American Economic Review,
Vol. 47, pp. 321-325.
Pacheco-Lopez, P. 2005. “Foreign Direct Investment, Exports and Imports in Mexico.”
The World Economy, Vol. 28, No. 8, pp. 1157-1172.
Appendix
Figure A1. Trade and FDI Variables by Countries
0
5,000
10,000
15,000
20,000
25,000
04 05 06 07 08 09 10 11 12
CT
1,000
2,000
3,000
4,000
5,000
6,000
04 05 06 07 08 09 10 11 12
JT
1,000
2,000
3,000
4,000
5,000
6,000
04 05 06 07 08 09 10 11 12
KT
0
1,000
2,000
3,000
4,000
04 05 06 07 08 09 10 11 12
NET
0
2,000
4,000
6,000
8,000
10,000
04 05 06 07 08 09 10 11 12
ST
0
5,000
10,000
15,000
20,000
25,000
04 05 06 07 08 09 10 11 12
UAT
1,500
2,000
2,500
3,000
3,500
4,000
4,500
04 05 06 07 08 09 10 11 12
UKT
4,000
6,000
8,000
10,000
12,000
14,000
16,000
04 05 06 07 08 09 10 11 12
UST
1,000
2,000
3,000
4,000
5,000
6,000
7,000
04 05 06 07 08 09 10 11 12
GET
36 The Causal Relationship between Trade and FDI
Figure A1. continued
0
20
40
60
80
100
120
04 05 06 07 08 09 10 11 12
CI
0
400
800
1,200
1,600
04 05 06 07 08 09 10 11 12
JI
0
40
80
120
160
04 05 06 07 08 09 10 11 12
KI
0
100
200
300
400
500
600
04 05 06 07 08 09 10 11 12
NEI
0
400
800
1,200
1,600
2,000
2,400
2,800
04 05 06 07 08 09 10 11 12
SI
0
100
200
300
400
04 05 06 07 08 09 10 11 12
UAI
0
500
1,000
1,500
2,000
2,500
04 05 06 07 08 09 10 11 12
UKI
0
200
400
600
800
1,000
04 05 06 07 08 09 10 11 12
USI
0
400
800
1,200
1,600
04 05 06 07 08 09 10 11 12
GEI
Note: KT and KI represent Korea-India trade volume and FDI inflow to India from Korea. JT, JI, CT, CI, ST, SI, UST, USI, UKT, UKI, GET, GEI, NET, NEI represent Japan-India trade volume and FDI inflow to India from Japan, China-India trade volume and FDI inflow to India from China, Singapore-India trade volume and FDI inflow to India from Singapore, USA-India trade volume and FDI inflow to India from USA, UK-India trade volume and FDI inflow to India from UK, Germany-India trade volume and FDI inflow to India from Germany and Netherlands-India trade volume and FDI inflow to India from Neth-erlands.
A List of all KIEP publications is available at: http://www.kiep.go.kr
13-06 The Causal Relationship between Trade and FDI: Implication for India and East Asian
Countries Choongjae Cho
13-05 Nonlinear Effects of Government Debt on Private Consumption in OECD Countries
Dooyeon Cho and Dong-Eun Rhee
13-04 Anti-Dumping Duty and Firm Heterogeneity: Evidence from Korea
Seungrae Lee and Joo Yeon Sun
13-03 Regional Borders and Trade in Asia Woong Lee and Chankwon Bae
13-02 Joining Pre-existing Production Networks: An Implication for South-East Asian Eco-
nomic Integration Jeongmeen Suh and Jong Duk Kim
13-01 Measurement and Determinants of Trade in Value Added Nakgyoon Choi
12-07 An Assessment of Inflation Targeting in a Quantitative Monetary Business Cycle
Framework Dooyeon Cho and Dong-Eun Rhee
12-06 Real Frictions and Real Exchange Rate Dynamics: The Roles of Distribution Service and
Transaction Cost In Huh and Inkoo Lee
12-05 Korea’s Monetary Policy Responses to the Global Financial Crisis In Huh
12-04 Election Cycles and Stock Market Reaction: International Evidence
Jiyoun An and Cheolbeom Park
12-03 A Theory of Economic Sanctions Baran Han
12-02 Multilateral Engagement in North Korea’s Economic Rehabilitation and Possible Estab-
lishment of Trust Funds Jong-Woon Lee and Hyoungsoo Zang
12-01 Comparative Advantage, Outward Foreign Direct Investment and Average Industry
Productivity: Theory and Evidence Yong Joon Jang and Hea-Jung Hyun
11-12 Are Asian Business Cycles Different?
Yongseung Jung, Soyoung Kim, Doo Yong Yang and Tack Yun
11-11 Measuring Arbitrage Costs from Relative Prices: Implications for the PPP puzzle
In Huh And Inkoo Lee
11-10 Real Convergence and European Integration: What Factors Make the Difference in
Growth at Regional Level? Yoo-Duk Kang
11-09 Strategic Trade Policy with Border Carbon Adjustment Jeongmeen Suh
11-08 Can English Proficiency boost International Trade in Services?
Kyounghee Lee
11-07 A Quantitative Assessment of Credit Guaranty Scheme in Asian bond Markets
Dong-Eun Rhee
List of KIEP Working Papers (2009-2013. 12)
11-06 Regional Difference and Counterfactual Decomposition of Pro-Poor Growth: An Ap-
plication to Rural Ethiopia Sungil Kwak
11-05 Can Capital Account Liberalization Lessen Capital Volatility in a Country with ‘Original
Sin’? Bokyeong Park and Jiyoun An
11-04 Indirect Subsidization under WTO Disciplines: Financial Contribution to One Entity,
Benefit to Another Sherzod Shadikhodjaev
11-03 Determinants of Domestic Public Debt Crisis
Bokyeong Park and Wonho Song
11-02 Trade Liberalization, Intra-Industry Reallocation of Labor and Trade Adjustment Assis-tance Yong Joon Jang
11-01 Empirical Tests of Comparative Advantage: Factor Proportions, Technology, and Geogra-phy Nakgyoon Choi
10-11 Who Goes Where and How? Firm Heterogeneity and Location Decision of Korean Multina-
tionals Hea-Jung Hyun and Jung Hur
10-10 Information and Capital Flows Revisited: the Internet as a Determinant of Transactions in
Financial Assets Changkyu Choi, Dong-Eun Rhee, and Yonghyup Oh
10-09 Considering Happiness for Economic Development: Determinants of Happiness in Indonesia
Kitae Sohn
10-08 Impact of Rules of Origin on FTA Utilization in Korean FTAs
HanSung Kim and Mee Jin Cho
10-07 Learning in Negotiations: An Experimental Study Hankyoung Sung
10-06 Determinants of Exports: Productivity or Fixed Export Costs
Young Gui Kim and Jeongmeen Suh
10-05 Regionalism within Multilateralism:WTO Review Mechanisms for RTAs
Sherzod Shadikhodjaev
10-04 East Asian Financial and Monetary Cooperation and Its Prospect: Beyond the CMI
Young-Joon Park and Yonghyup Oh
10-03 Democracy and Trade Policy: the Role of Interest Groups Kyounghee Lee
10-02 Intra-industry Trade in an Enlarged Europe: Trend of Intra-industry Trade in the Europe-
an Union and its Determinants Yoo-Duk Kang
10-01 General Equilibrium Analysis of DDA Trade Liberalization: Assessment of Alternative
Scenarios Nakgyoon Choi
09-10 An Exploration of an Integration Index and its Application for Asian Regional Community
Heungchong Kim, Minhee Kim, and Jehoon Park et al.
09-09 External Adjustment under Increasing Integration in Korean Economy
Inkoo Lee and In Huh
09-08 Trade Openness and Vertical Integration: Evidence from Korean Firm-Level Data
Hea-Jung Hyun and Jung Hur
09-07 The Impact of Mutual Recognition Agreements on Foreign Direct Investment and Export
Yong Joon Jang
09-06 Transport Costs, Relative Prices, and International Risk Sharing
Inkoo Lee and Yonghyup Oh
09-05 Impacts of Free Trade Agreements on Structural Adjustment in the OECD: Panel Data
Analysis Nakgyoon Choi
09-04 What can North Korea learn from Transition Economies’ Reform Process?
Hyung-Gon Jeong
09-03 Firm Heterogeneity in the Choice of Offshoring: Evidence from Korean Manufacturing
Firms Hea-Jung Hyun
09-02 Using Panel Data to Exactly Estimate Income Under-Reporting by the Self Employed
Bonggeun Kim, John Gibson, and Chul Chung
09-01 Determinants of Staging Categories for the Tariff Elimination in the FTA Negotiations
Nakgyoon Choi
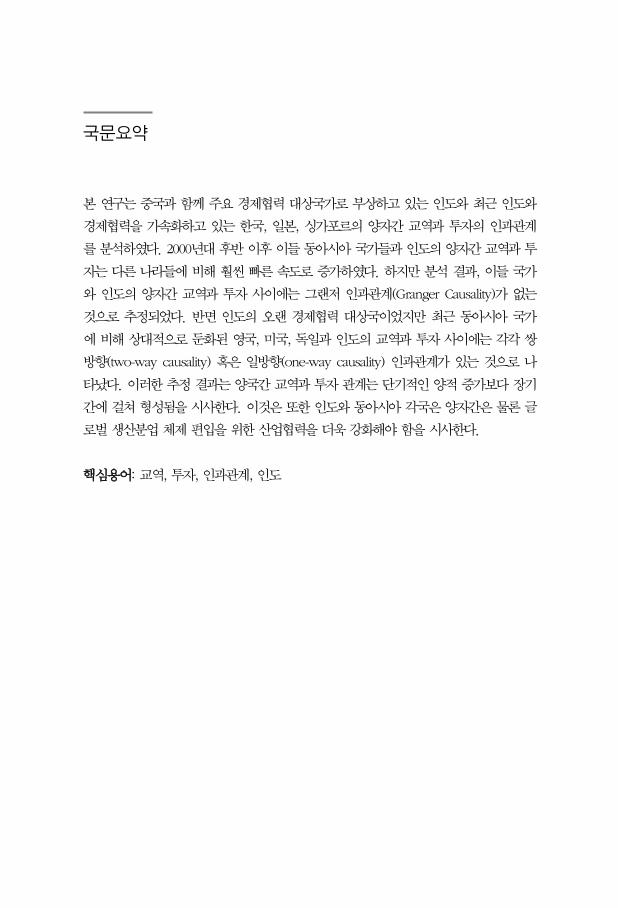
국문요약
본 연구는 중국과 함께 주요 경제협력 대상국가로 부상하고 있는 인도와 최근 인도와
경제협력을 가속화하고 있는 한국, 일본, 싱가포르의 양자간 교역과 투자의 인과관계
를 분석하였다. 2000년대 후반 이후 이들 동아시아 국가들과 인도의 양자간 교역과 투
자는 다른 나라들에 비해 훨씬 빠른 속도로 증가하였다. 하지만 분석 결과, 이들 국가
와 인도의 양자간 교역과 투자 사이에는 그랜저 인과관계(Granger Causality)가 없는
것으로 추정되었다. 반면 인도의 오랜 경제협력 대상국이었지만 최근 동아시아 국가
에 비해 상대적으로 둔화된 영국, 미국, 독일과 인도의 교역과 투자 사이에는 각각 쌍
방향(two-way causality) 혹은 일방향(one-way causality) 인과관계가 있는 것으로 나
타났다. 이러한 추정 결과는 양국간 교역과 투자 관계는 단기적인 양적 증가보다 장기
간에 걸쳐 형성됨을 시사한다. 이것은 또한 인도와 동아시아 각국은 양자간은 물론 글
로벌 생산분업 체제 편입을 위한 산업협력을 더욱 강화해야 함을 시사한다.
핵심용어: 교역, 투자, 인과관계, 인도

조충제(趙忠濟)
부산대학교 경제학과 졸업
한국외국어대학교 경제학 박사
대외경제정책연구원 신흥지역연구센터 인도남아시아팀장
(現, E-mail: [email protected])
저서 및 논문
『인도 주별 성장패턴 전망과 정책시사점』(2011, 공저)
『아시아 주요국의 대인도 경제협력 현황과 시사점』(2012, 공저) 외
KIEP Working Paper 13-06
Choongjae Cho
Choongjae Cho
KIEP Working Paper 13-06
The Causal Relationship between Trade and FDI: Implication for India and East Asian Countries
The Causal Relationship between Trade and FDI:Implication for India and East Asian Countries
This study tries to find the causal relationship between bilateral trade and FDI in India and East Asian
countries using macroeconomic data and derive policy implications for regional integration. Since the late
2000s, Korea, Japan and Singapore’s trade and FDI with India have been rapidly increasing, but the causal
relationship between trade and FDI could not be found, contrary to expectations. The relationship between
trade and FDI in the US, the UK and Germany with India showed one-way or two-way causality, respec-
tively. The estimation suggests that the causal relationship between trade and FDI in both countries could
be formed by long-term economic exchange rather than a short-term surge in scale.
KIEP Working Paper 13-06
The Causal R
elationship between Trade and FD
I: Implication for India and E
ast Asian C
ountriesC
hoongjae Cho


![Bayesian Causal Inference - uni-muenchen.de...from causal inference have been attracting much interest recently. [HHH18] propose that causal [HHH18] propose that causal inference stands](https://img.pdfslide.net/doc/110x75/5ec457b21b32702dbe2c9d4c/bayesian-causal-inference-uni-from-causal-inference-have-been-attracting.jpg)