Embed Size (px)
Citation preview

The Central X-Ray Point Source in Cassiopeia A
Deepto Chakrabarty,1 Michael J. Pivovaroff,1 Lars E. Hernquist,2
Jeremy S. Heyl,3 and Ramesh Narayan2
Submitted to The Astrophysical Journal
1999 December 23
ABSTRACT
The spectacular “first light” observation by the Chandra X-Ray Observatory revealed an X-ray point source near the center of the 300 yr old Cas A supernova remnant. We present ananalysis of the public X-ray spectral and timing data. No coherent pulsations were detected inthe Chandra/HRC data. The 3σ upper limit on the pulsed fraction is <25% for P > 100 ms,<35% for P > 5 ms, and <50% for P > 1 ms. The Chandra/ACIS spectrum of the point sourcemay be fit with an ideal blackbody (kT=0.5 keV), or with blackbody models modified by thepresence of a neutron star atmosphere (kT=0.25–0.35 keV), but the temperature is higher andthe inferred emitting area lower than expected for a 300 yr old neutron star according to standardcooling models. The spectrum may also be fit with a power law model (photon index Γ = 2.8–3.6). Both the spectral properties and the timing limits of the point source are inconsistentwith a young Crab-like pulsar, but are quite similar to the properties of the anomalous X-raypulsars. The spectral parameters are also very similar to those of the other radio-quiet X-raypoint sources in the supernova remnants Pup A, RCW 103, and PKS 1209–52. Current limits onan optical counterpart for the Cas A point source rule out models that invoke fallback accretiononto a compact object if fallback disk properties are similar to those in quiescent low-mass X-ray binaries. However, the optical limits are marginally consistent with plausible alternativeassumptions for a fallback disk. In this case, accreting neutron star models can explain the X-raydata, but an accreting black hole model is not promising.
Subject headings: accretion, accretion disks — black hole physics — stars: neutron — stars:peculiar — supernovae: individual (Cas A) — X-rays: stars
1Department of Physics and Center for Space Research, Massachusetts Institute of Technology, Cambridge, MA 02139;
[email protected], [email protected]
2Harvard-Smithsonian Center for Astrophysics, 60 Garden Street, Cambridge, MA 02138; [email protected],
3Theoretical Astrophysics, California Institute of Technology, Pasadena, CA 91125; [email protected]
– 2 –
1. INTRODUCTION
For over three decades, it has been well established that (some) supernova explosions give rise to stronglymagnetized (B ∼ 1012 G), rapidly rotating (P ∼ 10–30 ms) neutron stars (NSs), as in the young radio pulsarsfound in the Crab Nebula and nearly a dozen other supernova remnants (SNRs). In some cases, a synchrotronnebula (or “plerion”) has been detected around the pulsar, powered by non-thermal emission from the NS.Emission (in some cases pulsed) has been detected at other wavelengths (optical, X-ray, gamma-ray) arisingfrom thermal and non-thermal processes. However, several clues have recently emerged suggesting that thisparadigm is incomplete (see Kaspi 2000 and Gotthelf & Vasisht 2000 for recent reviews). First, there are thesix slowly-rotating (P ∼ 6 s) “anomalous X-ray pulsars” (AXPs), which seem to be young isolated NSs andmay have extremely strong (B ∼ 1014–1015 G) surface magnetic fields (Mereghetti 2000). Half of the AXPsare associated with SNRs. Possibly related are the four known soft gamma-ray repeaters (SGRs), which inquiescence share many properties with AXPs and may also be associated with SNRs (Hurley 2000).
Also intriguing has been the identification of at least three radio-quiet non-plerionic X-ray point sourcesnear the centers of SNRs (Brazier & Johnston 1999 and references therein). These objects have X-ray spectraroughly consistent with young, cooling NSs, but show no evidence for either X-ray pulsations or emission atother wavelengths (in contrast to “normal” young NSs). Finally, the ongoing failure to detect clear evidencefor a young NS in the remnant of SN 1987A in the Large Magellanic Cloud (LMC) has renewed theoreticalinterest in alternative models for the aftermath of a SN explosion, especially with respect to fallback of ejectedmaterial onto a newborn NS. Several groups have concluded that, under some circumstances, a newborn NSmight collapse into a black hole (BH) shortly after birth (Brown & Bethe 1994; Woosley & Timmes 1996;Zampieri et al. 1998; Fryer, Colgate, & Pinto 1999).
Nearby SNRs without known stellar remnants are thus obvious targets for further study. After SN1987A, the youngest known SNR in our Galaxy or the satellite Magellanic Clouds is Cassiopeia A. Itsparent supernova was evidently noticed (though misunderstood) by Flamsteed in 1680 (Ashworth 1980).This τhist = 320 yr historical age for Cas A is consistent with its optical expansion time scale (van denBergh & Kamper 1983), though somewhat shorter than its X-ray (τx ≈ 500 yr; Vink et al. 1998) and radio(τradio ∼750–870 yr; Anderson & Rudnick 1995) expansion time scales. The progenitor of this oxygen-richSNR was probably a very massive (zero-age main sequence mass MZAMS > 20M�) late WN-type Wolf-Rayetstar which underwent prodigious mass loss via a stellar wind and eventually exploded as a type II supernova(Fesen, Becker, & Blair 1987). The inferred distance to Cas A is 3.4+0.3
−0.1 kpc (Reed et al. 1995). Theremnant subtends 4 arcmin in the sky, is the brightest non-thermal radio source after the Sun, and has beenextensively studied in the radio, optical, and X-ray bands.
The spectacular “first light” observation of Cas A by the Chandra X-Ray Observatory on 1999 August20 revealed the presence of a compact X-ray source near the geometric center of the SNR (Tananbaum 1999).The source morphology is point-like, with no obvious evidence for extension or a surrounding nebula (e.g.,a plerion). The discovery announcement notes that no obvious counterparts were detected within a 5 arcsecradius of the point source position on 20 cm radio maps or optical images. Aschenbach (1999) detected theChandra point source in archival 0.1–2.4 keV X-ray images taken with the ROSAT/HRI in 1995-1996. Pavlov& Zavlin (1999) recovered the point source in archival 0.5–4 keV X-ray images taken with the Einstein/HRIin 1979 and 1981, and found that the Einstein, ROSAT, and Chandra count rates were consistent with aconstant X-ray source flux over all the observations. They also noted that the observed spectrum appearedto be inconsistent with pure blackbody radiation from the entire surface of a cooling NS. Umeda et al. (1999)speculated on some possible scenarios for the nature of the point source, based on these early results.
– 3 –
In this paper, we present a detailed analysis of the X-ray spectral and timing features of the centralpoint source in Cas A, based on the available public Chandra data. In §2, we give a detailed descriptionof the observation and our data analysis, including our efforts to verify the instrumental calibration. In §3,we discuss our results in the context of various models for the nature of the point source. We summarizeour finding in §4. While completing our manuscript, we learned of another paper presenting an independentanalysis of the spectral data by Pavlov et al. (1999b). They used a subset of the data that we discuss inour paper, and their spectral results are consistent with ours within the uncertainties. We include a briefdiscussion of their preferred interpretation in §3.
2. OBSERVATIONS AND ANALYSIS
Numerous imaging observations of Cas A have been made by Chandra (formerly AXAF; Weisskopf,O’Dell & van Speybroeck 1996) since its launch on 1999 July 23, as part of the mission’s Orbital Activationand Checkout (OAC) calibration program. All OAC data are immediately in the public domain. Mostof the Cas A observations were made using the AXAF CCD Imaging Spectrometer (ACIS; Burke et al.1997), which records both the sky position (0.49 arcsec/pixel) and the energy (∆E ≈ 50–200 eV) of eachdetected photon in the 0.1–10 keV range, with a time resolution of 3.2 s. A few of the observations weremade with the High Resolution Camera (HRC; Zombeck et al. 1995; Murray et al. 1997), which preciselyrecords the sky position (0.13 arcsec/pix) and arrival time (∆t=16 µs) of each detected photon, but withmodest (E/∆E ∼ 1) energy resolution. No diffraction gratings were in place for any of the ACIS or HRCobservations.
2.1. ACIS Data Reduction
As the analysis tools and calibration for Chandra are still under development at this early stage ofthe mission, we will describe our data reduction, analysis, and verification steps in detail. In using theACIS data to derive a spectrum for the point source in Cas A, we have restricted our analysis to the fourexposures obtained during 1999 August 20–23 with Cas A placed on the back-illuminated (BI) ACIS S3chip, for three reasons. First, preliminary analysis showed that the point source spectrum was relativelysoft, and the two BI chips (S1 and S3) have superior low energy response compared to the front-illuminated(FI) chips. Second, we wished to optimize the Chandra point spread function by minimizing the off-axisangle of the point source, and the Chandra aim points for ACIS lie on either the S3 or I3 chips. Inspectionof the Cas A images obtained on the other ACIS chips shows that the point source is spread out over manymore pixels, making it more difficult to separate from the background; the effective area of the mirror anddetector combination at these angles is also reduced. Finally, the BI chips have not suffered the radiationdamage that degraded the energy resolution of the FI chips soon after launch, and so are better calibratedat this early stage in the mission. A summary of the observations we used is given in Table 1.
We obtained the fully processed (level 2) ACIS event data for these observations from the ChandraData Archive. The data were acquired in Timed-Exposure/Faint mode, with a frame read out every 3.2 s. Asubstantial number of frames was lost to telemetry saturation due to the high total count rate from Cas A,resulting in an overall observation duty cycle of 42%. We filtered the events from the surviving frames,accepting only those which fell within the “standard” event grade set (grades 0+2+3+4+6) in order tomaximize the ratio of X-ray to non–X-ray events, and additionally discarding events with very large pulse
– 4 –
heights as due to cosmic rays. For all the observations, the ACIS focal plane temperature was −100◦ C.
We did not attempt to improve upon the spacecraft aspect solutions from the standard processing, butinstead proceeded from the assumption that the central source in Cas A is indeed point-like in morphology,as determined by Tananbaum (1999). For each observation, we extracted all events located within a givenradius of the centroid position of the point source. Ideally, we would use the calibrated angular response ofthe Chandra High-Resolution Mirror Assembly (HRMA) to choose an extraction radius which encircled somefixed fraction (e.g., 95%) of the flux from a point source for a given off-axis angle. However, both the focusposition of the detector and the quality of the spacecraft aspect solution were not necessarily optimal inthese early observations. Instead, we measured the radial distribution of source photons for each observationfrom the data and estimated a 95% extraction radius. Table 1 lists the aperture sizes.
The background in the point source region is dominated by the diffuse emission of the supernova remnantand has strong contributions from both continuum and line emission (e.g., Holt et al. 1994). The point sourceis located within a relatively low surface brightness region of the remnant. Still, the background must beestimated with care, as there are significant compositional gradients in this part of the remnant, resultingin varying line strengths with position. After investigating the line strengths in a number of nearby regions,we selected an off-centered 48×15 arcsec2 rectangular region around the point source (with the point sourceitself and a small surrounding buffer region excluded) to estimate the background surface brightness nearthe point source. The point source and the background region are shown in Figure 1.
The ACIS instrumental response may be parameterized by a photon energy redistribution matrix (here-after RMF), which maps incident photon energy to detected pulse height amplitudes (PHAs). Every ACISchip (1024 × 1026) is divided into four parallel (256 × 1026) quadrants, each read out separately by fourindividual amplifiers. Each quadrant requires a unique RMF, as each readout amplifier has a different gain.Additionally, the parallel and serial charge transfer inefficiency in the BI chips leads to differences in energyresolution and detection efficiency versus position within a quadrant as well. Consequently, the ACIS instru-ment team has supplied multiple position-dependent RMFs for each quadrant. We used the 1999 October28 version of RMFs developed for observations taken at a focal plane temperature of −100◦ C.
Fortuitously, the Cas A point source (and nearly all of the selected background region) lies entirely inquadrant 2 for all four of the S3 observations. Furthermore, the four observations were located within 250pixels of each other within the chip quadrant, minimizing the differences in CCD response. Thus, the fourRMFs appropriate for each observation may be combined using an exposure-weighted average, without anyserious loss of accuracy. This allows us to sum the four individual S3 count spectra into a single “grandtotal” S3 count spectrum with improved statistics. In addition to the RMFs, an ancillary response function(hereafter ARF) is needed to characterize the effective area of the HRMA and the quantum efficiency of theACIS detector as a function of incident photon energy and off-axis angle. We computed the appropriateARF for each observation using software created by members of the ACIS and High Energy TransmissionGrating instrument teams at MIT, and then combined them by an exposure-weighted average for use withour summed count spectrum.
2.2. X-Ray Spectral Fitting
The summed, background-subtracted ACIS count spectrum was analyzed using the XSPEC v10.00software package (Arnaud 1996). We rebinned the data at 0.15 keV resolution (32 ADU/channel) andrestricted our analysis to 21 bins in the 0.7–4.0 keV range, resulting in at least 10 count bin−1 in all but 3
– 5 –
bins at high energy (with a minimum of 5 count bin−1 and a maximum of 71 count bin−1). The rebinnedcount spectrum is shown in Figure 2. In light of the relatively low count rate, our model fitting weighted eachbin by 1 + (Ni + 0.75)1/2 rather than N
1/2i (where Ni is the number of counts in bin i). This is a superior
weighting scheme when Ni is small and asymptotes to the usual weighting when Ni is large (Gehrels 1986).
We fit several different spectral models to these data: a simple power law, thermal bremsstrahlung, anideal blackbody (BB), and two modified BB models. The modified BB models assume that the emittingobject is a NS and account for the effect of a light-element stellar atmosphere on the emergent spectrum.The strong NS surface gravity essentially guarantees that the photosphere will be dominated by the lightestelement present (Alcock & Illarionov 1980; Romani 1987). For such atmospheres with T ∼ 106 K, the E−3
dependence of free-free absorption will shift the peak of the emission blueward from that of an ideal BB(Romani 1987; Zampieri et al. 1995). Previous authors have shown that neglecting this effect and fitting theWien tails of such spectra with an ideal BB model significantly overestimates the effective temperature andunderestimates the emitting area (Rajagopal & Romani 1996; Zavlin, Pavlov, & Shibanov 1996; Rutledgeet al. 1999). To consider this possibility, we employed two models: the simple analytic spectrum emergingfrom the power-law atmosphere of Heyl & Hernquist (1998a; hereafter HH98a), with γ = 3 as appropriatefor a light-element atmosphere; and the more detailed H atmosphere model of Zavlin, Pavlov, & Shibanov(1996; hereafter ZPS96), developed for a weakly magnetized NS.
For all these models, we included the effect of photoelectric absorption by neutral gas along the line ofsight (Morrison & McCammon 1983), which is a significant effect at low (∼< 1 keV) energies. The absorptionis typically quantified in terms of the column density of neutral hydrogen NH toward the source, witha particular elemental abundance model assumed (e.g., Anders & Ebihara 1982 in our case). With therelatively small number of low-energy X-ray photons detected from the Cas A point source, it is difficult toconstrain NH precisely. Moreover, its value in this situation is highly spectral-model–dependent and stronglycovariant with the overall flux normalization. However,NH may also be determined from radio measurementsof the atomic and molecular hydrogen column densities using the 21 cm H I and 18 cm OH absorption lines,respectively. Keohane, Rudnick, & Anderson (1996) have used such data to derive a spatially-resolvedcolumn density map of the Cas A SNR at 30 arcsec resolution. Using this map, we estimate that the columndensity towards the Cas A point source is NH = (1.1 ± 0.1) × 1022 cm−2. However, this estimate must beused with caution, as the radio maps give no information on small–angular-scale variations in the column.For each spectral model we employed, we fit the data both with NH held fixed at this value and with NH asa free parameter.
Our spectral fitting results are summarized in Table 2, and a typical model fit is shown in Figure 2. Allof the models gave formally acceptable fits. However, the BB and NS atmosphere models fit slightly betterto the data than the other models, although with inferred radii considerably smaller than a typical 10 kmNS radius. Note that the quoted parameters for the BB and NS atmosphere models are for an observer atinfinity, assuming the gravitational redshift correction for a 10 km, 1.4M� NS.
Interpretation of our results depends critically upon the reliability of the energy and effective areacalibrations of Chandra, which are still being evaluated by the instrument teams. To verify the robustness ofour conclusions, we made a rough check of these calibrations by fitting the X-ray spectral data from the 1999Aug 23 ACIS/S3 observation of SNR E0102−72 (ObsId 1231), the brightest supernova remnant in the SmallMagellanic Cloud (SMC; Hayashi et al. 1994). For comparison, we also analyzed archival spectral data forthe same source as observed by ASCA on 1993 May 12–13. For both data sets, we restricted our analysisto 0.6–2.6 keV (an energy band that both contains the majority of the SNR flux and spans a range similarto that of the Cas A point source) and fit the same plasma model, with fixed column density and non-solar
– 6 –
abundances. The derived plasma temperatures agree to better than 2%, and the overall normalizations towithin 13%, using the preliminary calibrations.
2.3. X-Ray Timing
We examined two on-axis observations of Cas A made with the HRC as part of the OAC program, usingthe HRC-S and HRC-I detectors respectively. These observations are summarized in Table 1. We obtainedthe processed level 2 event data from the Chandra Data Archive. In both cases, the overall count rate (∼ 140count s−1) from Cas A was below the telemetry threshold (≈ 184 count s−1) where deadtime effects becomesignificant. For each observation, we extracted all events within 3 arcsec of point source centroid. The photonarrival times, provided in terrestrial time (TT) at the spacecraft, were corrected to barycentric dynamicaltime (TDB) at the solar system barycenter using the JPL DE200 solar system ephemeris (Standish et al.1992) and a geocentric spacecraft ephemeris.
We binned the events into 0.5 ms time bins and computed a Fourier power spectrum of the resulting timeseries. No significant pulsations were detected; the highest peak in the power spectrum had a significance ofonly 2σ when the number of trials is accounted for. To improve our statistics, we also computed an incoherentpower spectral sum of 9 ks segments of each observation. Again, no significant pulsations were found, withthe highest peak having a significance of only 0.8σ including the number of trials. A large pulse frequencyderivative might spread a coherent pulsation over multiple power spectral bins, reducing our sensitivity.However, for the ≈ 10 ks observations used here, a pulse frequency derivative of ν = 1/T 2 ∼> 10−8 Hz s−1
would be required. This is 25 times larger than ν for the Crab pulsar, and ∼> 105 larger than the typicalvalue for an AXP or SGR. To enhance our sensitivity to non-sinusoidal pulse shapes, we also performed aharmonic fold of the power spectrum. No significant pulsations were detected.
We used our incoherent power spectral sum to estimate an upper limit for the sinusoidal pulsed fractionof the Cas A point source, accounting for the suppression of power spectral sensitivity at high frequenciesdue to binning of the data (e.g., van der Klis 1989). We find that the 3σ upper limit on the sinusoidal pulsedfraction is <25% at low frequencies, ∼< 35% for ν < 200 Hz, and ∼< 50% for ν < 1 kHz.
Our sensitivity to rapid pulsations depends upon an accurate correction for the motion of the spacecraftwith respect to the barycenter. As a check of our barycenter corrections and of the spacecraft ephemeris, weanalyzed a 1999 August 31 HRC-I observation (ObsID 132) of PSR B0540–69, a young 50 ms pulsar associatedwith the supernova remnant N158A in the Large Magellanic Cloud, using the same data analysis procedure asfor Cas A. We compared this measurement with a 1999 September 1 observation of an overlapping field withthe Rossi X-Ray Timing Explorer (these data were generously made available by F. E. Marshall of NASAGoddard Space Flight Center). The frequencies measured in the two data sets were consistent within theuncertainties, and also agreed with the value extrapolated from a timing model based on a 1996 BeppoSAXobservation (Mineo et al. 1999).
3. DISCUSSION
We have shown that the X-ray point source in Cas A has a spectrum well-described by either an absorbedpower law with photon index 2.8–3.6 and unabsorbed 0.1–10 keV luminosity (7–160)×1033 erg s−1, or anabsorbed BB or modified BB with kT∞ ≈ 0.25–0.5 keV and bolometric luminosity L∞ ≈ (1–5)×1033 erg s−1.
– 7 –
Our Chandra spectral and timing measurements, combined with pre-existing limits at other wavelengths,severely constrain plausible models for the nature of the X-ray point source in Cas A.
We begin by pointing out, for completeness, that our steep power law spectral fit essentially rules outthe possibility that the point source is a background galaxy, as active galactic nuclei (AGN) typically liewithin a range of photon indices Γ = 1.2–2.2 (Turner & Pounds 1986). The AGN scenario is also extremelyimplausible given that the point source is located within a few arcsec of the expansion center of the SNR(Tananbaum 1999). Moreover, given the surface density of AGNs on the sky at this flux level (Boyle et al.1993), the probability of a chance coincidence is negligible. There is thus little doubt that the point sourceis associated with the supernova remnant.
We now summarize the implications of our results for several other interpretations.
3.1. Classical young pulsar
If the Cas A point source is a classical young pulsar (the conventional product expected for a typeII SN explosion), then the X-ray radiation should be predominantly non-thermal power-law emission fromrelativistic acceleration of e+e− pairs in the corotating NS magnetosphere (see Romani 1996). The propertiesof the point source are compared with the four youngest (< 104 yr) known pulsars4 in Table 3, all ofwhich have power law X-ray spectra with Γ = 1.5–1.7. There are several clear distinctions. The spectralshape of the Cas A point source is considerably steeper than that of the young pulsars, although its X-rayluminosity is marginally consistent with the lower end of the young pulsar range. The upper limit on thepoint source’s X-ray pulse fraction is lower than those measured in the young pulsars with the possibleexception of PSR B0540–69. Radio pulsations have not been detected from Cas A, with an upper limit ofL600 < 530 d2
3.4 mJy kpc2 for the 600 MHz radio luminosity (Lorimer, Lyne & Camilo 1998). This non-detection could be explained by beaming, judging from the observed radio luminosities for the known youngpulsars (≈ 900 mJykpc2 for the Crab and PSR B0540–69, but only ≈ 30 mJykpc2 for PSR B1509–58 andPSR J1119–6127; Taylor, Manchester, & Lyne 1993; Kaspi et al. 2000). However, the Chandra images alsoshow no evidence for a plerion surrounding the point source. Plerions, powered by synchrotron emission,have been detected around all four of the classical young pulsars in Table 3 (and even around some X-raypoint sources in SNRs which are not known pulsars). We conclude that the point source in Cas A is not aclassical young pulsar.
If the Cas A point source is a NS, the absence of both detectable radio pulsations and a synchrotronnebula may indicate that it lies beyond the so-called pulsar “death line”, an empirical boundary on thespin-period–magnetic-field plane beyond which radio pulsars have generally not been detected, presumablybecause the NS does not generate enough e+e− pairs to power significant non-thermal emission5 (Chen &Ruderman 1993). In this case, we would expect a strongly magnetized (B ∼> 1011 G) NS to have a spinperiod of order at least a few seconds. Conversely, a rapidly spinning NS (P ∼ 30 ms) would have a veryweak magnetic field (B ∼< 108 G), perhaps consistent with delayed field growth (Blandford, Applegate &Hernquist 1983).
4A fifth young (τc = 1.6 kyr) pulsar, PSR J1119–6127, has recently been discovered (Camilo et al. 2000; Kaspi et al. 2000).
However, its X-ray spectral properties are not yet determined.
5The recent identification of a radio pulsar well beyond the death line, PSR J2144–3933 (P = 8.51 s, B ≈ 6 × 10¹¹ G)
indicates that this argument must be used cautiously (Young, Manchester, & Johnston 1999).

– 8 –
3.2. Cooling neutron star
An alternative interpretation is that the X-rays from the Cas A point source arise from thermal emissionfrom a cooling NS. A 300 yr old NS cools primarily via neutrino emission; standard cooling models predictthermal photon emission from the surface with kT∞ = 0.15–0.25 keV (Page & Sarmiento 1996; Page 1998).All of our BB and modified BB fits for the Cas A point source yield somewhat higher temperatures (kT∞ ≈0.25–0.5 keV), as well as much smaller BB radii (R∞
bb ≈ 0.6–2.6 km) than expected for a 10 km NS, evenwhen accounting for a light-element atmosphere. The NS atmosphere models (HH98a, ZPS96) that we fitto the data were computed assuming a weak (B ∼< 1010 G) magnetic field, which may be a poor assumptionfor a young NS. Qualitatively, however, the presence of a magnetic field of order ∼ 1012 G will shift the peakof the emission in a light-element atmosphere redward towards the ideal BB case (Pavlov et al. 1995), thusexacerbating the discrepancy between the data and standard NS cooling curves. We note, however, that thebehavior of spectral shifts in ultrastrong magnetic fields (B ∼ 1014–1015 G) has not yet been calculated.
While our inferred temperature is marginally consistent with standard NS cooling curves, the smallemitting area remains problematic, especially given our limits on the X-ray pulsed fraction. Strong (B ∼1012–1013 G) magnetic fields will produce a non-uniform temperature distribution on the surface of a NS,owing to anisotropic electron conduction through the star’s outer envelope (e.g. Greenstein & Hartke 1983;Heyl & Hernquist 1998b, 1999). However, the resulting temperature variation across the surface does notproduce small hot spots, but is instead smoothly varying with a local flux roughly ∝ cos2 ψ, where ψ is thepolar angle from the magnetic axis. This would reduce the effective area of the emitting surface by a factor∼ 3, far less than the factor of 30–100 required by our spectral fits.
Similar conclusions motivated Pavlov et al. (1999b) to consider a model in which the magnetic polarcaps are intrinsically hotter than the bulk of the stellar surface, as a result of horizontal chemical abundancegradients through the conductive envelope. Light element envelopes transmit heat more readily than onesmade of heavy elements (Chabrier, Potekhin & Yakovlev 1997; Heyl & Hernquist 1997a), so hot polar capsconsisting of hydrogen embedded in a cooler iron crust can, in principle, yield an emitting area consistentwith the spectral fits (Pavlov et al. 1999b). However, such a model predicts that the emission should bepulsed at the rotation period of the star, unless either the magnetic and rotation axes are nearly aligned,or the line of sight nearly coincides with the rotation axis. Pulsed fractions at the level of 10–70% requiredto account for the putative thermal emission from middle aged radio pulsars (e.g. Becker & Trumper 1997)and AXPs (e.g., Mereghetti 2000) can be produced from smoothly varying properties of NS envelopes, suchas anisotropic heat conduction (Heyl & Hernquist 1998b) or directionally dependent opacities (e.g. Pavlovet al. 1994, Zavlin et al. 1995, Shibanov et al. 1995), even when gravitational bending of light is included(e.g. Page 1995, Heyl & Hernquist 1998b). An even larger pulsed fraction will result, in general, from thehot spot model. For example, in the case of the orthogonal rotator model of Pavlov et al. (1999b), weestimate typical maximum to minimum flux variations > 2 for 1.4M� NSs with radii R > 7 km. This is insevere disagreement with the upper limits we obtain for the pulsed fraction.6 Observationally, we cannotyet exclude the case of a nearly aligned rotator, but it is not clear that the horizontal abundance gradientsrequired by the Pavlov et al. model will be stable for long times in the liquid crust.
6For special choices of the NS radius, however, gravitational bending of light will make the entire stellar surface singly visible,
eliminating any pulsed component; see, e.g. figure 7 of Heyl & Hernquist (1998b).

– 9 –
3.3. Accretion onto a neutron star or black hole
We now consider the possibility that the point source in Cas A is powered by accretion onto a NS or aBH. This possibility was also raised by Umeda et al. (1999) and Pavlov et al. (1999b). We assume that theaccretion is fed by fallback material left over after the original supernova explosion (e.g. Chevalier 1989).We prefer such a model to a binary accretion model since there is no optical/IR evidence for a such binarycompanion star (van den Bergh & Pritchet 1986). A very low-mass dwarf companion might have evadeddetection, but such a companion would be unlikely to remain bound in the binary following the supernovaexplosion, given the high mass of the Cas A progenitor.
We begin with the possibility of accretion onto a NS. If the accretion occurs via a thin disk extendingdown to the marginally stable orbit at 6GM/c2, or the NS surface (whichever is larger), then we expectsignificant emission from an equatorial boundary layer where the accreting material meets the star. Theemitting zone is expected to have a radial extent roughly equal to the local scale height of the disk (Narayan& Popham 1993; see also Inogamov & Sunyaev 1999 for a recent discussion of boundary layer models).If the boundary layer is optically thick, then it will emit BB radiation. For an accretion luminosity ∼1033.5 erg s−1 ∼< 10−4LEdd, the scale height is ∼ 0.1 km, and the effective area of the radiating zone is ∼fewkm2. This is in reasonable agreement with the effective area ∼km2 determined from fitting the Chandra data(Table 2). We consider this a viable model, although we note that the optical thickness of such boundarylayers is not well understood.
This boundary layer model requires that the NS have a very weak magnetic field. Specifically, themagnetospheric radius rm has to be smaller than the stellar radius, which implies that B < 107 G for theestimated X-ray luminosity. If the magnetic field is somewhat stronger, then the disk would be terminatedat rm. Even in this case, we might expect a boundary layer to develop at rm, and the model would beconsistent with the observations for fields B ∼< 109 G. We note that for sufficiently large B, accretingmaterial is centrifugally expelled from the system at rm (Illarionov & Sunyaev 1975). In this case, verylittle material would reach the neutron star and there would be negligible X-ray emission (e.g., Chatterjee,Hernquist, & Narayan 1999; Alpar 1999).
If the NS instead has a magnetic field ∼> 1012 G typical of young radio pulsars, then boundary layeremission is unlikely to explain the observed X-rays. In this case, we would have to assume that the accretingmaterial is able to reach the surface of the neutron star, which would require that the neutron star bespinning quite slowly (in order to avoid centrifugal expulsion of matter). The effective area of the radiatingzone would again be small, and could thus be consistent with the observations. However, we would predictstrong coherent pulsations in the X-ray signal . Our upper limit of 25% on the pulsed fraction from theCas A point source does not rule out pulsations at the level observed in many known B ∼ 1012 G accretingpulsars. More sensitive searches for pulsation would be very worthwhile.
A third kind of accreting NS model is one in which the accretion disk is truncated at a large transitionradius, and the flow farther in occurs via an ADAF (as in the Narayan et al. 1997 model for low-luminosityBH binaries). Boundary layer emission in such a model is not well understood, so we are not in a position topredict the emission spectrum. However, if the ADAF is terminated at rm and the material then flows ontothe magnetic poles, the spectrum would be similar to the case with a thin disk which was discussed above.
Accreting BH models face considerably greater difficulty in fitting the observations. This is becauseneither a boundary layer nor channeled accretion onto magnetic poles is expected. Therefore, any blackbodyemission should be primarily from the inner accretion disk, with an effective area of several times πR2
S, where

– 10 –
RS is the Schwarzschild radius of the black hole. For a 10M� BH, the area is ∼ 103 km2, which is clearlyinconsistent with the X-ray data. This means that the X-ray emission from a BH point source in Cas Awould have to originate either via Compton scattering in an optically thin corona over a thin disk, or viaoptically thin bremsstrahlung emission from a hot ADAF. We have explored models of this kind, using themodeling techniques described in Narayan et al. (1997) and Quataert & Narayan (1999), but we find thatwe need to fine-tune the models to an uncomfortable degree to fit the observations.
It is important to note that accretion models are severely constrained by the observed flux ratio betweenX-ray and optical bands. The optical limits on a stellar remnant in Cas A are I ∼> 23.5 and R ∼> 24.8 (vanden Bergh & Pritchet 1986). Applying the extinction corrections estimated by these authors, the X-ray–to–optical flux ratio is FX/Fopt > 100. Although this is typical for bright X-ray binaries, it is considerably largerthan the ratios observed in quiescent accreting BHs and NSs with luminosities comparable to the Cas Apoint source, e.g. FX/Fopt ∼ 1/30 for the BH system A0620–00 and FX/Fopt ∼ 1/3 for the NS system CenX-4 (McClintock & Remillard 2000). Both sources have an X-ray luminosity lower than the point source inCas A, and both have optical luminosities significantly higher than the upper limit for the Cas A source. Ifthe spectra of these sources are characteristic of accreting BHs and NSs at low luminosities, then accretionmodels for Cas A are ruled out with high confidence.
It is possible, however, to evade this conclusion by arguing that these low-mass X-ray binaries (LMXBs)are a poor comparison to the Cas A point source. First of all, the quiescent optical emission in some BHbinaries has been modeled as synchrotron emission from a hot advection-dominated accretion flow (ADAF)close to the BH (Narayan, McClintock & Yi 1996; Narayan, Barret & McClintock 1997). However, if theemission instead comes from a “hot spot” (e.g., where the accretion stream from the mass donor hits thethin accretion disk), then it is specific to binary systems and should be absent in systems with a fallbackdisk. This possibility has not been modeled in any detail. Also, X-ray reprocessing in the accretion disk is asignificant source of optical emission in LMXBs (van Paradijs & McClintock 1995), especially since the outerdisks evidently subtend a large semi-angle (∼ 12◦) at the central object (de Jong, van Paradijs, & Augusteijn1996). The reason for such large angles may be warping of the outer disk (see Dubus et al. 1999; Esin etal. 2000). But if such warps are induced primarily by binary effects, then a fallback disk in Cas A mightnot be similarly warped (although it has been argued that irradiation alone can lead to significant warping;see Petterson 1977; Pringle 1996; Maloney et al. 1996). For an unwarped disk, the subtended semi-anglewould be set by the disk’s scale height at the relevant radius (∼ 1010 cm). By employing an analysis similarto that in Perna, Hernquist & Narayan (1999), we estimate that the re-emitted optical flux in such a modelwould be (just) below the optical flux limits for the Cas A source.
Thus, the optical limits strongly constrain accretion models, but do not yet conclusively eliminate them.By comparing the predictions of the models with the X-ray observations, specifically the small effective area∼ km2 of the emission, we conclude that models with accreting NSs are more promising than those withBHs.
3.4. Comparison with AXPs, SGRs, and radio-quiet point sources
It is interesting to compare the properties of the Cas A point source with three classes of objects whosenature remains puzzling: AXPs, SGRs, and the radio-quiet non-plerionic X-ray point sources in SNRs. BothAXPs and SGRs pulse with slow spin periods despite being young objects (based on their association withSNRs). We summarize the X-ray properties of these objects in Table 3.
– 11 –
The X-ray spectrum of most AXPs is best characterized by a two-component spectrum consisting of a∼ 0.5 keV BB and a steep (Γ = 3–4) power law extending out to 10 keV, with comparable luminosity inboth components. The BB components have R∞
bb = 1–4 km and L∞bb ∼ 1034–1035 erg s−1, quite similar to
the BB fit for the Cas A point source. (We note that, due to poor photon statistics in the present data, wewould be unable to detect the presence of an additional power-law component with this BB fit if the Cas Apoint source has an AXP-like two-component spectrum.) While four of the AXPs have large pulsed fractions(30–70%), two have much lower pulsed fractions (10–15%) which are consistent with the non-detection ofpulsations in Cas A. However, the X-ray luminosity of the Cas A source is at least a factor of three to tenlower than that of the AXPs, in spite of its relative youth. Overall, the properties of the Cas A point sourceare roughly consistent with being an underluminous AXP. This possibility can be tested by a deeper searchfor long-period X-ray pulsations.
The quiescent emission of SGRs may be fit with a power law with Γ = 1.1–2.5 and a 2–10 keV luminosityof (3–100)×1034 erg s−1. These spectral parameters are also consistent with those measured for Cas A.However, we note that the proposed associations between SGRs and SNRs are somewhat tenuous, in contrastto those proposed for AXPs (Gaensler 2000). Moreover, no soft gamma-ray bursts have ever been detectedfrom the direction of Cas A.
Finally, there are the three radio-quiet X-ray point sources that each lie near the center of an SNRand have no evidence for a plerion. The X-ray properties of these sources are summarized in Table 3. TheX-ray emission from these objects is well characterized by a BB spectrum with kT∞ ≈ 0.2–0.6 keV andRbb ≈ 0.6–3 km, comparable to what we measure in Cas A. From a spectral point of view, these four sourcesform a remarkably homogeneous group. A marginal detection of pulsations (P = 75.3 ms) was reportedfrom the source in Pup A with a pulsed fraction of 20% (Pavlov, Zavlin, & Trumper 1999a), below the limitplaced in Cas A. However, the point source in RCW 103 has shown order of magnitude variability in itsflux (Gotthelf, Petre, & Vasisht 1999a). This is in stark contrast to the Cas A point source, which showsno evidence for strong variability on either short (see Table 1) or long (Pavlov & Zavlin 1999; Pavlov et al.1999b) time scales.
4. Conclusions
At present, we do not have a unique model to account for the observed properties of the X-ray pointsource in Cas A. Thermal emission from an isolated, cooling NS can account for the data, but only ifunconventional modifications are incorporated into spectral models in order to satisfy the requirement thatthe emitting area be small. Localized hot spots can, in principle, be produced on the surface of a NSby horizontal chemical abundance gradients in the liquid envelope (Pavlov et al. 1999b). Alternatively,hot spots could be formed by particle bombardment of the polar caps through magnetospheric activity,as may be occurring in some middle-aged radio pulsars (e.g. Becker & Trumper 1997). Whether or notthis second possibility is reasonable for the Cas A point source in view of the absence of detectable radioemission is questionable. In any event, hot spots should give rise to a significant pulsed component to theemission, in general, and such models will likewise be constrained by future limits or detections of X-raymodulation. Accretion onto a BH does not appear promising, but NS accretion provides a viable mechanismfor explaining the characteristics of the X-ray emission. If the NS is very weakly magnetized, the observedemission could arise from a boundary layer. Otherwise, the X-rays could be produced by magnetically-channeled accretion onto the NS. In the latter case, we expect pulsed emission, so again, future timing limitstest this interpretation.
– 12 –
The point source in Cas A is similar in many respects to the AXPs and quiescent SGRs, which havebeen interpreted as ultramagnetized neutron stars (“magnetars”; Duncan & Thompson 1992; Thompson &Duncan 1996; Heyl & Hernquist 1997a, 1997b) or as neutron stars with normal magnetic fields of order1012–1013 G accreting from fallback disks (Chatterjee et al. 1999; Alpar 1999). It is important to note thedetailed thermal emission from neutron stars with magnetic fields B ∼ 1014–1015 has yet to be calculated.Conceivably, X-ray spectra in this regime could account for the small emitting areas of the Cas A pointsource and the AXPs without requiring small polar hot spots.
Regardless of the eventual resolution to the puzzling aspects of the point source in Cas A, it is alreadyclear that the mere existence of this and similar objects demands a dramatic revision of our generally acceptednotions of the nature of compact objects found in supernova remnants. The discovery of radio pulsars in the1960s led to a paradigm in which supernovae generally leave behind strongly magnetized, rapidly rotatingneutron stars. The subsequent failure to locate radio pulsars in the majority of SNRs has been a long-standing problem for this point of view (Kaspi 2000, Gotthelf & Vasisht 2000). The unanticipated propertiesof the Cas A point source and the relative youth of the Cas A SNR imply that the birthrate of “unusual”compact objects is likely to be at least roughly comparable to that of radio pulsars, potentially resolving thedifficulties posed by SNR/pulsar associations. In this sense, the identification of the point source in Cas Amay be as significant to our understanding of neutron stars as was the original discovery of radio pulsars.
We are grateful to Fred Baganoff, Mark Bautz, Bryan Gaensler, Vicky Kaspi, Herman Marshall, RosalbaPerna, Dimitrios Psaltis, and Norbert Schulz for advice and useful discussions. We also thank Frank Marshallfor allowing us to use his proprietary RXTE data to verify our pulse timing of PSR B0540–69, as well asFred Seward and Arnold Rots for help with retrieving data from the Chandra Data Archive. The ASCAdata for SNR E0102–72 was obtained from the High Energy Astrophysics Science Archive Research Center(HEASARC) at NASA Goddard Space Flight Center.
REFERENCES
Alcock, C. & Illarionov 1980, ApJ, 235, 534
Alpar, A. 1999, preprint (astro-ph/9912228)
Anders, E. & Ebihara, M. 1982, Geochim. Cosmochim. Acta, 46, 2363
Anderson, M. C. & Rudnick, L. 1995, ApJ, 441, 307
Arnaud, K. A. 1996, in Astronomical Data Analysis Software and Systems V, ed. G. Jacoby & J. Barnes (San
Francisco: ASP Conf. Ser. 101), 17
Aschenbach, B. 1999, IAU Circ., No. 7249
Ashworth, W. B. 1980, J. Hist. Astr., 11, 1
Becker, W. & Trumper, J. 1997, A&A, 326, 682
Blandford, R. D., Applegate, J. H. & Hernquist, L. 1983, MNRAS, 204, 1025
Boyle, B. J., Griffiths, R. E., Shanks, T., Stewart, G. C., & Georgantopoulos, I. 1993, MNRAS, 260, 49
Brazier, K. T. S. & Johnston, S. 1999, MNRAS, 305, 671
Brown, G. E. & Bethe, H. A. 1994, ApJ, 423, 659
Burke, B. E. et al., 1997, IEEE Trans. Elec. Devices, 44, 1633
Camilo, F., Kaspi, V. M., Lyne, A. G., Manchester, R. N., Bell, J. F., D’Amico, N., McKay, N. P. F., & Crawford,
F. 2000, Nature, submitted
Chabrier, G., Potekhin, A. Y., & Yakovlev, D. G. 1997, ApJ, 477, L99
Chatterjee, P., Hernquist, L., & Narayan, R. 1999, ApJ, in press (astro-ph/9912137)
Chevalier, R. A. 1989, ApJ, 346, 847
– 13 –
Chen, K. & Ruderman, M. 1993, ApJ, 402, 264
Corbel, S., Chapuis, C., Dame, T. M., & Durouchoux, P. 1999, ApJ, 526, L29
Corbel, S., Wallyn, P., Dame, T. M., Durouchoux, P., Mahoney, W. A., Vilhu, O., & Grindlay, J. E. 1997, ApJ, 478,
624
Corbet, R. H. D. & Mihara, T. 1997, ApJ, 475, L127
de Jong, J. A., van Paradijs, J., & Augusteijn, T. 1996, A&A, 314, 484
Dubus, G., Lasota, J.-P., Hameury, J.-M., & Charles, P. A. 1999, MNRAS, 303, 139
Duncan, R. C. & Thompson, C. 1992, ApJ, 392, L9
Eikenberry, S. S. & Matthews, K. 2000, ApJ, submitted
Esin, A. A., Kuulkers, E., McClintock. J. E., & Narayan, R. 2000, ApJ, in press (astro-ph/9911127)
Fesen, R. A., Becker, R. H., & Blair, W. P. 1987, ApJ, 313, 378
Finley, J. P., Oegelman, H., Hasinger, G., & Trumper, J. 1993, ApJ, 410, 323
Frail, D. A., Vasisht, G., & Kulkarni, S. R. 1997, ApJ, 480, L129
Fryer, C. L., Colgate, S. A., & Pinto, P. A. 1999, ApJ, 511, 885
Gaensler, B. M. 2000, in Pulsar Astronomy — 2000 and Beyond, ed. M. Kramer, N. Wex, & R. Wielebinski (San
Francisco: ASP), in press (astro-ph/9911190)
Gaensler, B. M., Brazier, K. T. S., Manchester, R. N., Johnston, S., & Green, A. J. 1999a, MNRAS, 305, 724
Gaensler, B. M., Gotthelf, E. V., & Vasisht, G. 1999b, ApJ, 526, L37
Gehrels, N. 1986, ApJ, 303, 336
Gotthelf, E. V., Petre, R., & Hwang, U. 1997, ApJ, 487, L175
Gotthelf, E. V., Petre, R., & Vasisht, G. 1999a, ApJ, 514, L107
Gotthelf, E. V. & Vasisht, G. 1997, ApJ, 486, 133
———. 2000, in Pulsar Astronomy — 2000 and Beyond, ed. M. Kramer, N. Wex, & R. Wielebinski (San Francisco:
ASP), in press (astro-ph/9911344)
Gotthelf, E. V., Vasisht, G., & Dotani, T. 1999b, ApJ, 522, L49
Greenstein, G. & Hartke, G.J. 1983, ApJ, 271, 283
Harnden, F. R. & Seward, F. D. 1984, ApJ, 283, 279
Hayashi, I. Koyama, K., Ozaki, M., Miyata, E., Tsunemi, H., Hughes, J. P., & Petre, R. 1994, PASJ, 46, L121
Helfand, D. J. & Becker, R. H. 1984, Nature, 307, 215
Heyl, J. S. & Hernquist, L. 1997a, ApJ, 489, L67
———. 1997b, ApJ, 491, L95
———. 1998a, MNRAS, 298, L17 (HH98a)
———. 1998b, MNRAS, 300, 599
———. 1999, MNRAS, in press (astro-ph/9808126)
Holt, S. S., Gotthelf, E. V., Tsunemi, H., & Negoro, H. 1994, PASJ, 46, L151
Hurley, K. 2000, in Proc. 5th Compton Symp., ed. M. McConnell (New York: AIP Press), in press
Hurley, K. et al. 2000, ApJ, 528, L21
Illarionov, A. F. & Sunyaev, R. A. 1975, A&A, 39, 185
Inogamov, N. A. & Sunyaev, R. A. 1999, Astron. Lett., 25, 269
Israel, G. L., Covino, S., Stella, L., Campana, S., Haberl, F., & Mereghetti, S. 1999a, ApJ, 518, L107
Israel, G. L. et al. 1999b, A&A, 346, 929
Kaspi, V. M. 2000, in Pulsar Astronomy — 2000 and Beyond, ed. M. Kramer, N. Wex, & R. Wielebinski (San
Francisco: ASP), in press (astro-ph/9912284)
Kaspi, V. M., Camilo, F., Lyne, A. G., Manchester, R. N., Bell, J. F., D’Amico, N., McKay, N. P. F., & Crawford,
F. 2000, in Pulsar Astronomy — 2000 and Beyond, ed. M. Kramer, N. Wex, & R. Wielebinski (San Francisco:
ASP), in press (astro-ph/9912281)
Kaspi, V. M., Chakrabarty, D., & Steinberger, J. 1999, ApJ, 525, L33
Keohane, J. W., Rudnick, L., & Anderson, M. C. 1996, ApJ, 466, 309
Kouveliotou, C. et al. 1998, Nature, 393, 235
Lorimer, D. R., Lyne, A. G., & Camilo, F. 1998, A&A, 331, 1002
– 14 –
Marsden, D. et al. 1997, ApJ, 491, L39
Marsden, D., Rothschild, R. E., Lingenfelter, R. E., & Puetter, R. C. 1996, ApJ, 470, 513
Maloney, P. R., Begelman, M. C., & Pringle, J. E. 1996, ApJ, 472, 582
Marshall, F. E., Gotthelf, E. V., Zhang, W., Middleditch, J., Wang, Q. D. 1998, ApJ, 499, L179
McClintock, J. E. & Remillard, R. A. 2000, ApJ, in press (astro-ph/9907316)
Mereghetti, S. 2000, in The Neutron Star–Black Hole Connection, ed. C. Kouveliotou, J. van Paradijs, & J. Ventura
(Dordrecht: Kluwer), in press (astro-ph/9911252)
Mereghetti, S., Bignami, G. F., & Caraveo, P. A. 1996, ApJ, 464, 842
Mineo, T., Cusumano, G., Massaro, E., Nicastro, L., Parmar, A. N., & Sacco, B. 1999, A&A, 348, 519
Morrison, R. & McCammon, D. 1983, ApJ, 270, 119
Murray, S. S. et al. 1997, Proc. SPIE, 3114, 11
Narayan, R., Barret D., & McClintock, J. E. 1997, ApJ, 482, 448
Narayan, R., McClintock, J. E., & Yi, I. 1996, ApJ, 457, 821
Narayan, R. & Popham R. 1993, Nature, 362, 820
Oosterbroek, T., Parmar, A. N., Mereghetti, S., & Israel, G. L. 1998, A&A, 334, 925
Page, D. 1995, ApJ, 442, 273
———. 1998, in The Many Faces of Neutron Stars, ed. R. Buccheri, J. van Paradijs, & M. A. Alpar (Dordrecht:
Kluwer), 539
Page, D. & Sarmiento, A. 1996, ApJ, 473, 1067
Pavlov, G. G. & Zavlin, V. E. 1999, IAU Circ., No. 7270
Pavlov, G. G., Zavlin, V. E., & Trumper, J. 1999a, ApJ, 511, L45
Pavlov, G. G., Shibanov, Y. A., Ventura, J. & Zavlin, V. E. 1994, A&A, 289, 837
Pavlov, G. G., Shibanov, Y. A., Zavlin, V. E., & Meyer, R. D. 1995, in The Lives of the Neutron Stars, ed. M. A.
Alpar, U. Kiziloglu, & J. van Paradijs (Dordrecht: Kluwer), 71
Pavlov, G. G., Zavlin, V. E., Aschenbach, B., Trumper, J., & Sanwal, D. 1999b, ApJ, submitted (astro-ph/9912024)
Perna, R., Hernquist, L. & Narayan, R. 1999, ApJ, submitted (astro-ph/9912297)
Petre, R., Becker, C. M., & Winkler, P. F. 1996, ApJ, 465, L43
Petre, R., Kriss, G. A., Winkler, P. F., & Canizares, C. R. 1982, ApJ, 258, 22
Petterson, J. A. 1977, ApJ, 216, 827
Pringle, J. E. 1996, MNRAS, 281, 357
Quataert, E. & Narayan, R. 1999, ApJ, 520, 298
Rajagopal, M. & Romani, R. W. 1996, ApJ, 461, 327
Reed, J. E., Hester, J. J., Fabian, A. C., & Winkler, P. F. 1995, ApJ, 440, 706
Rho, J. & Petre, R. 1997, ApJ, 484, 828
Romani, R. W. 1987, ApJ, 313, 718
Romani, R. W. 1996, in Pulsars: Problems and Progress, IAU Colloq. 160, ed. S. Johnston, M. A. Walker, & M.
Bailes (San Franciso: ASP), 331
Rutledge, R. E., Bildsten, L., Brown, E .F., Pavlov, G. G., & Zavlin, V. E. 1999, ApJ, 514, 945
Seward, F. D. & Harnden, F. R., J. 1994, ApJ, 421, 581
Shibanov, Y. A., Pavlov, G. G., Zavlin, V. E. & Tsuruta, S. 1995, in 17th Texas Symposium on Relativistic As-
trophysics and Cosmology, ed. H. Bohringer, G. E. Morfill & J. E. Trumper (New York: NY Acad. of Sci.),
291
Sonobe, T., Murakami, T., Kulkarni, S. R., Aoki, T., & Yoshida, A. 1994, ApJ, 436, L23
Standish, E. M., Newhall, X. X., Williams, J. G., & Yeomans, D. K. 1992, in Explanatory Supplement to the
Astronomical Almana, ed. P. K. Seidelmann (Mill Valley: University Science), 279
Sugizaki, M., Nagase, F., Torii, K. I., Kinugasa, K., Asanuma, T., Matsuzaki, K., Koyama, K., & Yamauchi, S. 1997,
PASJ, 49, L25
Tananbaum, H. 1999, IAU Circ., No. 7246
Taylor, J. H., Manchester, R. N., & Lyne, A. G. 1993, ApJS, 88, 529
Thompson, C. & Duncan, R.C. 1996, ApJ, 473, 322
– 15 –
Torii, K. I., Kinugasa, K., Katayama, K., Tsunemi, H., & Yamauchi, S. 1998, ApJ, 503, 843
Tuohy, I. & Garmire, G. 1980, ApJ, 239, 107
Turner, T. J. & Pounds, K. A. 1986, MNRAS, 240, 833
Umeda, H., Nomoto, K., Tsuruta, S., & Mineshige, S. 1999, ApJ, submitted (astro-ph/9910113)
van den Bergh, S. & Kamper, K. W. 1983, ApJ, 268, 129
van den Bergh, S. & Pritchet, C. J. 1986, ApJ, 307, 723
van der Klis, M. 1989, in Timing Neutron Stars, ed. H. Ogelman & E. P. J. van den Heuvel (Dordrecht: Kluwer), 27
van Paradijs, J. & McClintock, J. E. 1995, in X-Ray Binaries, ed. W. H. G. Lewin, J. van Paradijs, & E. P. J. van
den Heuvel (Cambridge: Cambridge Univ. Press), 58
Vancura, O., Blair, W. P., Long, K. S., & Raymond, J. C. 1992, ApJ, 394, 158
Vasisht, G., Kulkarni, S. R., Frail, D. A., & Greiner, J. 1994, ApJ, 431, L35
Vink, J., Bloemen, H., Kaastra, J. S., & Bleeker, J. A. M. 1998, A&A, 339, 201
Wang, Q. D. & Gotthelf, E. V. 1998a, ApJ, 494, 623
Wang, Q. D. & Gotthelf, E. V. 1998b, ApJ, 509, L109
Weisskopf, M. C., O’Dell, S. L., & van Speybroeck, L. P., 1996, Proc. SPIE, 2805, 2
White, N. E., Angelini, L., Ebisawa, K., Tanaka, Y., & Ghosh, P. 1996, ApJ, 463, L83
Woods, P. M., Kouveliotou, C., van Paradijs, J., Finger, M. H., & Thompson, C. 1999a, ApJ, 518, L103
Woods, P. M. et al. 1999b, ApJ, 519, L139
Woosley, S. E. & Timmes, F. X. 1996, Nucl. Phys. A, 606, 137
Young, M. D., Manchester, R. N., & Johnston, S. 1999, Nature, 400, 848
Zampieri, L., Colpi, M., Shapiro, S. L., & Wasserman, I. 1998, ApJ, 505, 876
Zampieri, L., Turolla, R., Zane, S., & Treves, A. 1995, ApJ, 439, 849
Zavlin, V. E., Pavlov, G. G., & Shibanov, Y. A. 1996, A&A, 315, 141 (ZPS96)
Zavlin, V. E., Pavlov, G. G., Shibanov, Y. A. & Ventura, J. 1995, A&A, 297 441
Zombeck, M. V. et al. 1995, Proc. SPIE, 2518, 96
This preprint was prepared with the AAS LATEX macros v4.0.
– 16 –
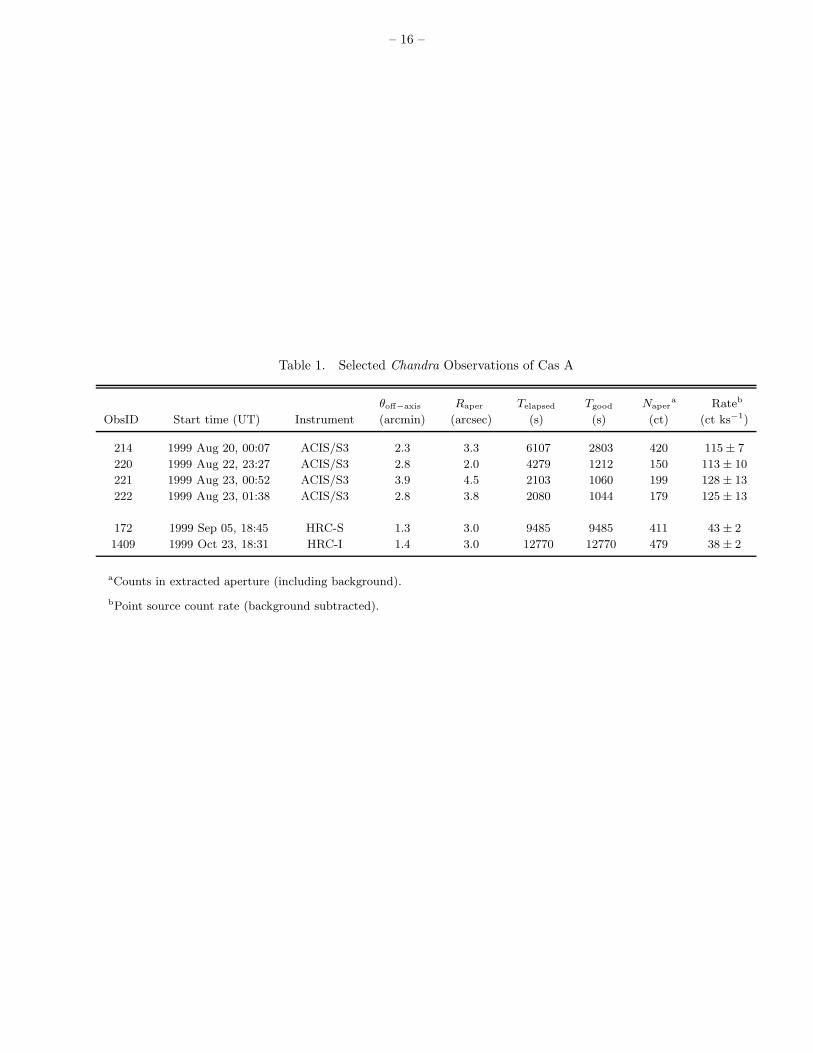
Table 1. Selected Chandra Observations of Cas A
θoff−axis Raper Telapsed Tgood Napera Rateb
ObsID Start time (UT) Instrument (arcmin) (arcsec) (s) (s) (ct) (ct ks−1)
214 1999 Aug 20, 00:07 ACIS/S3 2.3 3.3 6107 2803 420 115 ± 7
220 1999 Aug 22, 23:27 ACIS/S3 2.8 2.0 4279 1212 150 113 ± 10
221 1999 Aug 23, 00:52 ACIS/S3 3.9 4.5 2103 1060 199 128 ± 13
222 1999 Aug 23, 01:38 ACIS/S3 2.8 3.8 2080 1044 179 125 ± 13
172 1999 Sep 05, 18:45 HRC-S 1.3 3.0 9485 9485 411 43 ± 2
1409 1999 Oct 23, 18:31 HRC-I 1.4 3.0 12770 12770 479 38 ± 2
aCounts in extracted aperture (including background).
bPoint source count rate (background subtracted).

– 17 –
Table 2. X-ray Spectral Fits for Cas A Point Source
NH Photon kT∞ c R∞bb
d
Model (1022 cm2) indexa C1b (keV) (km) Lx,33
e χ2red/dof
Power law 1.68+0.39−0.22 3.13+0.50
−0.30 1.62+1.22−0.47 · · · · · · 43+122
−22 1.12/18
1.1 (fixed) 2.35 ± 0.12 0.65+0.07−0.05 · · · · · · 7.4+1.5
−1.0 1.44/19
Thermal brems. 1.39+0.23−0.13 · · · 1.37+0.61
−0.40 1.47+0.34−0.26 · · · 5.2+3.3
−1.9 0.92/18
1.1 (fixed) · · · 0.84 ± 0.09 1.97+0.26−0.21 · · · 3.8+0.7
−0.6 1.00/19
Ideal blackbody 0.84 ± 0.15 · · · · · · 0.53 ± 0.04 0.41+0.08−0.07 1.7+1.6
−0.9 0.69/18
1.1 (fixed) · · · · · · 0.49 ± 0.02 0.52+0.05−0.04 2.0+0.8
−0.6 0.77/19
NS atm. (HH98af) 0.85+0.18−0.15 · · · · · · 0.42 ± 0.03 0.67 ± 0.12 1.8+1.0
−0.6 0.70/18
1.1 (fixed) · · · · · · 0.38 ± 0.02 0.88 ± 0.07 2.1+0.5−0.4 0.76/19
NS atm. (ZPS96g) 0.92+0.20−0.16 · · · · · · 0.28 ± 0.03 1.80+0.55
−0.35 2.5+1.6−0.9 0.74/18
1.1 (fixed) · · · · · · 0.26 ± 0.02 2.23+0.24−0.19 2.8+0.6
−0.5 0.73/19
aPhoton index, defined such that the unabsorbed photon number flux dN/dE ∝ E−Γ.
bUnabsorbed flux density at 1 keV, in units of 10−3 photon cm−2 s−1 keV−1.
cFor BB and NS atmosphere models, as measured by an observer at infinity.
dImplied blackbody radius assuming a source distance of 3.4 kpc, as measured by an observer at infinity.
e0.1–10 keV luminosity in units of 1033 erg s−1 assuming a source distance of 3.4 kpc or bolometric luminosity at infinity
for blackbody models.
fAnalytic NS power-law atmosphere of Heyl & Hernquist (1998a), with γ = 3.
gH atmosphere for a non-magnetic NS (Zavlin et al. 1996).

– 18 –
Table 3. Cas A and Comparison Objects
Power law spectrum Blackbody spectrumPspin log τc/log τSNR d Photon log Lpl kT∞ R∞
bblog L∞
bbPulsed
Source SNR β (s) (yr) (kpc) index (erg s−1) (keV) (km) (erg s−1) frac. (%) Ref
Cassiopeia A
Point sourcea Cas A 0.0 · · · · · · /2.5 3.4 2.2–3.6 33.8–34.6 0.5 0.5 33.3 < 35
Other non-plerionic X-ray point sources in SNRsb
1E 0820−4247 Pup A 0.1 0.075? 3.9/3.6 2.0 · · · · · · 0.28 2 33.6 20? 1-31E 1614−5055 RCW 103 0.0 · · · · · · /3.1 3.1 · · · · · · 0.56 0.81 33.9 · · · 4,51E 1207−5209 PKS 1209−52 0.2 · · · · · · /3.8 1.5 · · · · · · 0.25 1.1 33.1 · · · 6,7
Young classical pulsars
PSR B0535+21 Crab 0.0 0.033 3.1/3.0 2.0 1.74 36.2 · · · · · · · · · ∼> 75 8
PSR B1509−58 MSH 15−52 0.2 0.150 3.2/3.2 5.2 1.36 35.3 · · · · · · · · · 65 9,10PSR B0540−69 N158A 0.2 0.050 3.2/3.1 47 1.3 36.6 · · · · · · · · · ∼> 15 11,12
PSR J0537−6910 N157B 0.5 0.016 3.7/3.7 47 1.6 35.5 · · · · · · · · · 10 13-15
Anomalous X-ray pulsars
1E 1841−045 Kes 73 0.2 11.8 3.6/3.3 7.0 3.4 36.9 · · · · · · · · · 15c 16,171E 1048.1−5937 · · · · · · 6.45 3.7?/ · · · 3.0 2.5 34.4 0.64 0.6 33.9 70 18,19AX J1845−0258a G29.6+0.1 0.2 6.97 ?/<3.9 8.5 4.6 38.6 0.72 1.6 34.9 50 20,21RXS J1708−40 · · · · · · 11.0 4.0/ · · · 10.0 2.9 36.9 0.41 8.9 35.5 50 22-244U 0142+61 · · · · · · 8.69 4.8?/ · · · 1 3.7 35.9 0.39 2.4 33.5 10 25,261E 2259+586 CTB 109 0.3 6.98 5.3/4.0 4.0 4.0 36.9 0.43 2.2 34.3 30 24,27
Soft gamma repeatersd
SGR 1900+14 G42.8+0.6? 1.2 5.16 2.8?/4.0 5.0 1.1 34.5 0.51 1.4 34.2 11 28,29SGR 1806−20 · · · e 0.0 7.47 3.1?/ · · · 14.5 2.2 36.0 · · · · · · · · · 23 30-32SGR 0526−66 N49 0.6 8 ?/3.7 47 · · · · · · · · · · · · · · · <66 33,34SGR 1627−41 G337.0−0.1? 2 6.41? ?/3.7 11.0 2.5 35.8 · · · · · · · · · 10 35-37
aFor the Cas A point source and AX J1845−0258, the powerlaw (PL) and (blackbody) BB models are alternative fits to the same data. For all the other sources, the PL andBB models are each components of a combined model.
bHere, we only include those sources that are well-established and have constrained spectral properties.cWe note that this value is half that reported in the literature, due to a different definition of pulsed fraction by these authors.
dThe spectral properties and pulse fractions listed for the SGRs are for quiescent emission.eThe extended radio nebula G10.0−0.3, once identified as a SNR, is now thought to be powered by a massive companion or the SGR itself (Gaensler 2000; Eikenberry &
Matthews 2000; Frail, Vasisht & Kulkarni 1997).
References. — (1) Petre et al. 1982; (2) Petre, Becker & Winkler 1996; (3) Pavlov, Zavlin & Trumper 1999a; (4) Helfand & Becker 1984; (5) Mereghetti, Bignami & Caraveo1996; (6) Tuohy & Garmire 1980; (7) Gotthelf, Petre & Hwang 1997; (8) Harnden & Seward 1984; (9) Marsden et al. 1997; (10) Gaensler et al. 1999a; (11) Finley et al. 1993;(12) Seward & Harnden 1994; (13) Wang & Gotthelf 1998a; (14) Wang & Gotthelf 1998b; (15) Marshall et al. 1998; (16) Gotthelf & Vasisht 1997; (17) Gotthelf, Vasisht &Dotani 1999b; (18) Corbet & Mihara 1997; (19) Oosterbroek et al. 1998; (20) Torii et al. 1998; (21) Gaensler et al. 1999b; (22) Sugizaki et al. 1997; (23) Israel et al. 1999a;(24) Kaspi, Chakrabarty & Steinberger 1999; (25) White et al. 1996; (26) Israel et al. 1999b; (27) Rho & Petre 1997; (28) Vasisht et al. 1994; (29) Woods et al. 1999a (30)Sonobe et al. 1994; (31) Corbel et al. 1997; (32) Kouveliotou et al. 1998 ; (33) Vancura et al. 1992; (34) Marsden et al. 1996 ; (35) Woods et al. 1999b ; (36) Corbel et al.1999 ; (37) Hurley et al. 2000
Note. — β is defined as the ratio between the source distance from the center of the SNR to the radius of the SNR; the characteristic age is defined as τc = P/2P ; luminositiesare either bolometric (BB) or for the 0.1 − 10 keV band (PL).
– 19 –
FIGURE CAPTIONS
FIGURE 1: A broad-band 0.3–10 keV intensity map of Cassiopeia A, as imaged by a 2.8 ks exposure withACIS S3 (ObsID 214). The upper panel shows the incredible structure present, including the central pointsource. The lower panel is an expanded view of the boxed region in the upper panel. Both the point sourceand the rectangular region used for the background region (see §2.2) are indicated.
FIGURE 2: The background-subtracted Chandra/ACIS-S count spectrum of the Cas A point source, summedfrom the four individual S3 exposure on 1999 Aug 20–23 for a total exposure of 6119 s. The dark line showsthe spectrum predicted by an absorbed blackbody model with kT∞ = 0.53 keV and NH = 0.84×1022 cm−2.Other models (power law, NS atmosphere) predict similar spectra. The present data do not discriminatestrongly between these models.
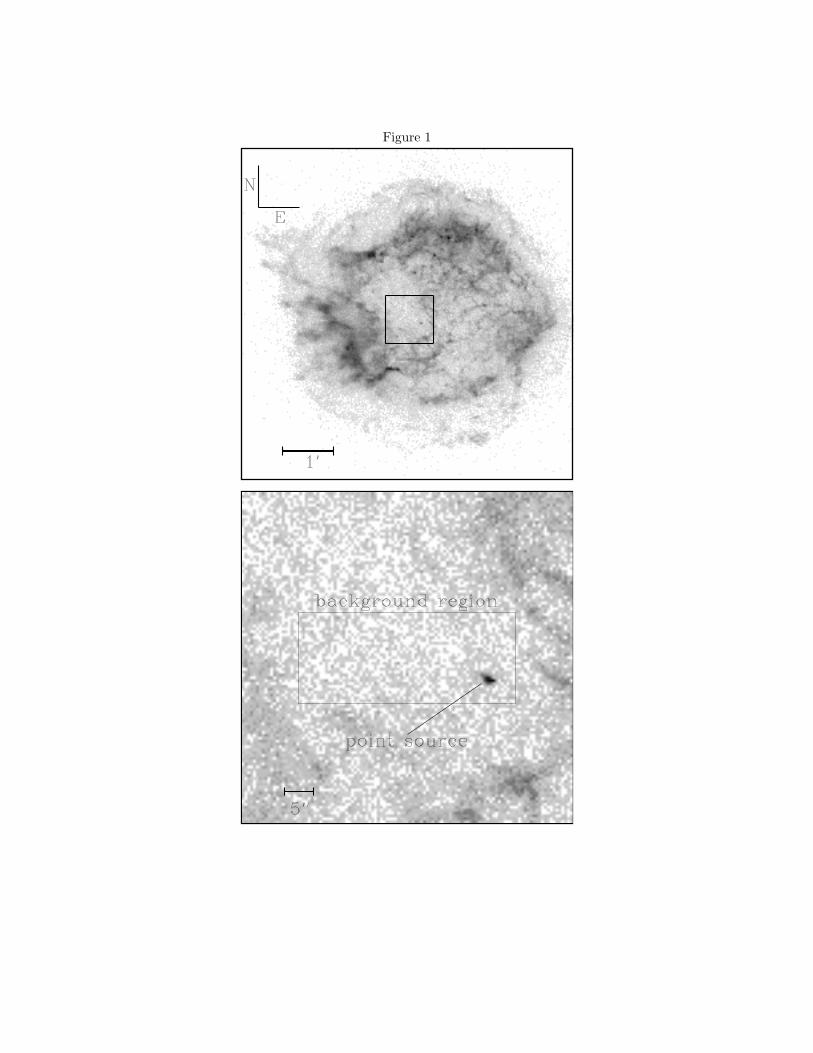
Figure 1

Figure 2