Embed Size (px)
Citation preview

Kajian Malaysia, Jld. XXV, No 2, Disember 2007
1
THE CHALLENGES OF RAISING REVENUES AND RESTRUCTURING SUBSIDIES IN MALAYSIA Suresh Narayanan School of Social Sciences Universiti Sains Malaysia Penang [email protected] Malaysia has run deficit budgets in all but five years since 1970 but past deficits have been managed thanks to substantial oil revenues and high domestic savings. However, the slow growth or decline of several traditional sources of revenue and the rising subsidy bill since 2007 have given pause for reflection on the traditional approach to fiscal management. In this paper, it is argued that fiscal management must not only centre around reducing non-productive expenditures and wasteful leakages but must also confront the problem of reducing and restructuring subsidies, particularly to petrol and petroleum-related products. The global dip in petroleum process has fortuitously provided the respite needed for such an exercise and should not lull policy makers into complacency. When the economy recovers from the current downswing, a solid revenue raising instrument such as the value-added tax must be introduced in order to wean the economy away from the current over reliance on petroleum-based taxes. Keywords: budget deficit, petroleum subsidies, revenue, value-added tax INTRODUCTION Malaysia has experienced difficulties in balancing its budget. Since 1970, the budget has been in deficit in all but five years and deficits have accumulated in periods of economic upturns and downturns, alike. Furthermore, since 1999, the deficits have consistently exceeded the figures forecast. This has prompted observers to comment that not only is the budget deficit structural in nature (not cyclical), but there is also an apparent lack of fiscal discipline (Ahmad Saifuddin, 2008).

Suresh Narayanan
2
Budget deficits in Malaysia became commonplace with the advent of the National Economic Policy (NEP) in 1970. In the ensuing decades, fiscal spending was actively used as a policy tool in support of NEP restructuring objectives. This spending spree came to a halt only in 1986, when it was clear that the budget deficits had reached unsustainable levels. Concerted efforts to downsize public intervention yielded five years of small budget surpluses. But this period was short-lived. Periodic downswings have forced the government to intervene with anti-cyclical fiscal policies, where expenditures often overshoot revenues. This was evident during the economic crisis of 1997−1999 and is becoming evident with the looming global crisis that threatens to derail the country’s export-led growth. On 4 November 2008, the Finance Minister revised the Growth Domestic Product (GDP) growth estimates for 2008 and 2009 downward, from 5.7% to 5% and from 5.4% to 3.5%, respectively. The budget deficit forecasted for 2009 was revised upward, from 3.6% of the GDP to 4.8%. An initial stimulus package was also announced. It consists of RM7 billion financed from savings accumulated as a result of the reduction in fuel subsidies implemented earlier in the year. Despite the fact that expenditure growth has outpaced tax revenue growth, past deficits have been managed by resorting to substantial oil revenues and large domestic savings. These resources have enabled low-cost borrowing. In fact, several traditional sources of tax revenue have either declined or are growing very slowly. A substantial portion of the revenue for 2009 will come from taxes on petroleum, petroleum products and dividends from Petronas. From this perspective, the high oil prices that prevailed during much of 2008 have been a great advantage. However, due to softening oil prices and the likelihood that developed countries experiencing recessions will demand less oil, oil prices may remain low in 2009. This, in turn, will adversely affect government receipts in 2010. If private sector activity remains lacklustre, the public sector would have to continue to enlarge its direct participation in boosting economic activity. Seeking new revenue sources would become an immediate and urgent imperative. Even if this scenario does not emerge, the public sector cannot continue with its dependency on revenue from petroleum, petroleum products and petroleum related activities. Not only is petroleum a depleting resource, it is a volatile source of revenue. Successful fiscal management, therefore, depends on how well Malaysia can reduce non-productive
Raising Revenues and Restructuring Subsidies
3
expenditures and wasteful leakages and how efficiently it can tap into new and reliable sources of revenue. THE FEDERAL GOVERNMENT BUDGET During the 38-year period from 1970 to 2008, the federal government budget was in surplus for only 5 years: from 1992 to 1997. For the other 33 years, the budget was in deficit, regardless of whether the economic cycle was good or bad. This suggests that the Malaysian deficit is of a structural nature. Beginning in the 1970s and up until 1986, the government played an active role in the economy, undertaking massive expenditures in support of the country’s new economic policy. This was particularly evident in the period spanning the Third Malaysia Plan, 1976−1980. By the end of 1982, the federal budget deficit had peaked at 16.6% of the GDP. The government downsized its role only in the aftermath of the major recession, which lasted from 1983−1986. This enabled the accumulation of surpluses in the early 1990s. Subsequently, the economic crisis triggered by the financial meltdown in 1997 induced the government to increase spending again, this time in a counter-cyclical effort. In 2003, following a change in administration, the government recommitted itself to balancing the budget (Narayanan, 1996; Narayanan, forthcoming). In attempts to reign in the budget deficit (which was equivalent to 5.3% of the GDP in 2003), several large projects were scaled down, postponed or cancelled between 2004 and 2006. By 2005, the budget deficit had been lowered to 3.6% of the GDP (see Table 1). In further attempts to reduce the deficit, fuel subsidies were cut and government-controlled fuel prices were allowed to rise. Between May 2004 and February 2008, fuel prices were raised five times (see Table 2). The fuel price hike in February 2006 alone reportedly allowed the government to save RM4.4 billion. By 2007, the budget deficit was down to 3.2% of the GDP.
However, the March 2006 launch of the Ninth Malaysia Plan envisaged that RM200 billion would be spent in public development expenditures between 2006 and 2010. This represented an 18% increase over the previous five-year period. The situation was exacerbated when crude oil prices hit record high levels in May 2008 and domestic petroleum prices were raised in order to reduce subsidy costs.

Table 1: Revenues, Expenditures and Budget Deficits.
Year Total Revenue
Operating Expenditure
Development Expenditure
Total Expenditure
Deficit GDP Deficit/ GDP
Revenue/ GDP
2000 61.9 56.5 27.9 84.4 −22.5 343.2 −6.6 18.0 2001 79.6 63.8 35.2 99.0 −19.4 352.6 −5.5 22.6 2002 83.6 68.7 36.0 104.7 −21.1 362.0 −5.8 23.1 2003 92.6 75.2 38.3 113.5 −20.9 395.2 −5.3 23.4 2004 99.5 91.3 27.5 118.8 −19.3 474.0 −4.1 21.0 2005 106.2 97.7 27.3 125.0 −18.8 522.4 −3.6 20.3 2006 123.5 107.7 35.0 142.7 −19.2 573.7 −3.3 21.5 2007 139.9 123.1 37.5 160.6 −20.7 641.9 −3.2 21.8 2008 161.6 151.0 45.1 196.1 −34.5 715.9 −4.8 22.6 2009 154.2 50.5 204.7 −204.7
Source: Ministry of Finance, various years Note: Development expenditures refer to net expenditures

Raising Revenues and Restructuring Subsidies
5
Table 2: Changes in Petrol Price (Per Litre).
Date Petrol (RM) Diesel (RM)
1 May 2004 1.37 0.78 10 October 2004 1.42 0.83 1 March 2005 1.42 0.88 1 May 2005 1.52 1.08 31 July 2005 1.62 1.28 28 February 2008 1.92 1.58 5 June 2008 2.70 2.58 23 August 2008 2.55 2.50 24 September 2008 2.45 2.40 15 October 2008 2.30 2.20 1 November 2008 2.15 2.05 18 November 2008 2.00 1.90
Source: Loh (2008) Note: Petrol refers to RON97 The budget deficit is anticipated to rise to 4.8% of the GDP in 2008, though it is projected to fall again by 2009, to 3.6%. The situation changed on 4 November 2008. The Finance Minister announced an additional stimulus package of RM7 billion in order to stave off the effects of the recession gripping the world. He revised the 2009 deficit upwards, to 4.8% of the GDP. The additional funds will come from savings in subsidies made possible by falling oil prices.1 However, if oil prices remain soft in 2009, revenues will be adversely affected in 2010 (see the subsequent discussion).
1 This is a curious claim. Since June 2008, when the petrol price was steeply
increased, the government announced that the fuel subsidy would be fixed at 30 sen per litre, regardless of the oil price. Consequently, falling oil prices will induce higher consumption and result in greater outlays on the fuel subsidy and will not induce ‘savings’, as the Minister claimed. In a subsequent statement, the Minister of Domestic Trade and Consumer Affairs announced that the government had stopped paying fuel subsidies from November 2008 and it will save RM10 billion in subsidies next year if prices remained stable (Cheah, 2008: N10).

Suresh Narayanan
6
In terms of budget deficits, how does Malaysia fare relative to its ASEAN neighbours? As evident from Table 3, Malaysia’s deficit to GDP ratio was the highest among all the countries listed between 2000 and 2003. In the later period, 2004−2006, Malaysia’s deficit was second only to Vietnam.
Table 3: Budget Deficit as a Proportion of the GDP in ASEAN Countries.
2000 2001 2002 2003 2004 2005 2006 2007 2008
Brunei 10.9 0.4 −9.9 −1.7 13.5 25.2 12.8 Indonesia −1.1 −2.4 −1.5 −1.7 −1.0 −0.5 −1.0 Malaysia −6.6 −5.5 −5.8 −5.3 −4.1 −3.6 −3.3 −3.2 −4.8 Philippines −4.0 −4.0 −5.3 −4.6 −3.8 −2.7 −1.1 Singapore 10.0 5.1 4.8 3.1 4.1 7.0 Thailand −2.2 −2.4 −1.4 0.4 0.1 −0.6 1.1 Vietnam −5.0 −4.0 −3.1 −4.8 −4.7 −4.6 −4.1
Sources: ASEAN data: Asian Development Bank, 2007. Malaysian data: Ministry of Finance, various issues While annual budget deficits deserve attention, the impact of deficits accumulated over long periods become national debt. This conveys important information on the ability of an economy to sustain continuous deficits. The debt ratio, defined as the total federal government debt as a percentage of the GDP, determines the level at which the country can afford to borrow. The movement of the debt ratio over time provides an indication of whether the deficits are sustainable and adds to the overall burden on the economy (Riedl, 2008).2 Over the period from 2000 to 2008, federal debt averaged about 42.6% of the GDP (Table 4). The absolute size of the federal debt is growing, though the rate at which it grows has decreased. Between 2000 and 2003, federal debt grew at 12.2% per year, far exceeding the GDP
2 We refer to federal government debt and not to total debt, which includes the
debts held by the private sector. We also exclude debts of the non-financial public enterprises (NFPEs), government-linked companies that are not subject to government budgeting procedures or scrutiny. However, these entities borrow heavily and their accumulated debt often exceeds federal government debt.
Raising Revenues and Restructuring Subsidies
7
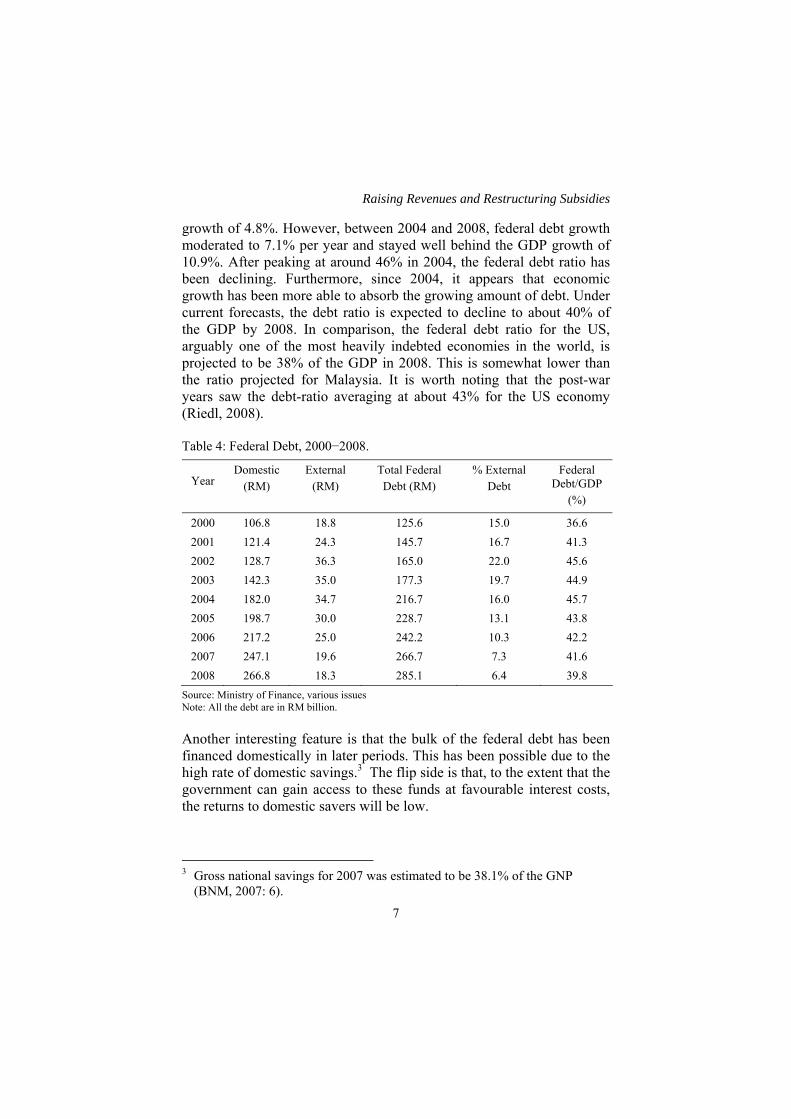
growth of 4.8%. However, between 2004 and 2008, federal debt growth moderated to 7.1% per year and stayed well behind the GDP growth of 10.9%. After peaking at around 46% in 2004, the federal debt ratio has been declining. Furthermore, since 2004, it appears that economic growth has been more able to absorb the growing amount of debt. Under current forecasts, the debt ratio is expected to decline to about 40% of the GDP by 2008. In comparison, the federal debt ratio for the US, arguably one of the most heavily indebted economies in the world, is projected to be 38% of the GDP in 2008. This is somewhat lower than the ratio projected for Malaysia. It is worth noting that the post-war years saw the debt-ratio averaging at about 43% for the US economy (Riedl, 2008).
Table 4: Federal Debt, 2000−2008.
Year
Domestic (RM)
External (RM)
Total Federal Debt (RM)
% External Debt
Federal Debt/GDP
(%)
2000 106.8 18.8 125.6 15.0 36.6 2001 121.4 24.3 145.7 16.7 41.3 2002 128.7 36.3 165.0 22.0 45.6 2003 142.3 35.0 177.3 19.7 44.9 2004 182.0 34.7 216.7 16.0 45.7 2005 198.7 30.0 228.7 13.1 43.8 2006 217.2 25.0 242.2 10.3 42.2 2007 247.1 19.6 266.7 7.3 41.6 2008 266.8 18.3 285.1 6.4 39.8
Source: Ministry of Finance, various issues Note: All the debt are in RM billion. Another interesting feature is that the bulk of the federal debt has been financed domestically in later periods. This has been possible due to the high rate of domestic savings.3 The flip side is that, to the extent that the government can gain access to these funds at favourable interest costs, the returns to domestic savers will be low. 3 Gross national savings for 2007 was estimated to be 38.1% of the GNP
(BNM, 2007: 6).

Suresh Narayanan
8
The Nature of the Deficit Current revenues, covered operating expenditures, and the budget deficit traditionally coincided with the size of development expenditures. This was breached only in 1986 and 1987, when revenues failed to cover operating expenditures (Narayanan, 2004). Between 2000 and 2007, total revenues managed to fund operating expenditures comfortably. This is projected to be the case for 2008 and 2009 as well (Table 1).
However, the operating budget has expanded rapidly over the years. Between 2000 and 2003, the operating budget accounted for 66% of total expenditures, on average. In the second period (2004−2008), this rose to 77% of total spending. In fact, the growth rate between 2004 and 2008 had overtaken the growth rate of revenue (Table 5). If this trend continues, Malaysia will reach a point where revenues will not be sufficient to cover operating expenditures. Table 5: Growth in Total Revenue and Expenditure Components, 2000–2008
2000−2003 2004−2008
Average share
Growth Average share
Growth
(%) (%) (%) (%)
Total expenditure - 10.4 - 13.3 Operation expenditure 65.8 10.0 76.9 13.4 Development expenditure 34.2 11.1 23.1 13.2 Total revenue - 14.1 - 12.9
Much of the recent expansion of the operating budget and the concomitant increase in budget deficits expected this year and the next has been attributed to rising subsidies and other social safety net measures (Zainal, 2008). The share of subsidies in operating expenditures and total expenditures has risen substantially since 2007; it is expected to account for slightly over one fifth of operating expenditures and about 17% of total expenditures in 2008 and 2009 (Table 6). In fact, faced with rising oil prices in the middle of 2008, the Second Finance Minister indicated that spending on subsidies might rise, from the original figure of RM34 billion to at least RM40 billion. Subsidies have now become almost as large as emoluments, the single largest item in operating expenditures (Zainal, 2008).

Raising Revenues and Restructuring Subsidies
9
As specified by the National Food Supply Guarantee Policy, subsidised items include fuel, cooking oil, flour, bread, and imported rice. Subsidies are transfers and do not add to the productive capacity of the economy directly. Furthermore, because they distort market signals and economic decisions, they should be used judiciously. They are presumably necessary to ease the burden on lower income groups. However, the biggest share of the subsidy bill goes towards subsidised fuels (petrol, diesel and LPG). Fuel subsidies began ballooning in 2004, when the market price for fuel rose substantially above the pump price determined
by the government.4 By 2006, the fuel subsidy amounted to RM7.3 billion, comprising 56.6 % of the subsidy allocation. By 2007, the fuel subsidy had increased to RM8.7 billion and accounted for 64% of the allocation. The fuel subsidy was projected to be RM18.3 billion (based on a crude oil price of US 105 per barrel) in 2008. This could amount to 54% of the subsidy allocation (Bernama.com, 2009). However, an ease in the price of crude oil would change this figure. In an attempt to reel in the fuel subsidy bill, the government announced a 41% increase in petrol price in June 2008. The expected savings of RM13.7 billion will be rechanneled into the subsidisation of other essential items (Table 7). The government subsequently committed itself to maintaining the petrol subsidy at 30 sen per litre, regardless of oil prices (Loh, 2008: 4).
4 Pump prices have been determined through the Automatic Pricing
Mechanism (APM) since 1983. APM accounts for the global market price of petrol, marketing and transportation costs and a margin for dealers. When the market price is below the pump price (inclusive of all the other costs as worked out through the APM), the government collects a duty. When the market price exceeds the pump price, the government provides a subsidy to bridge the difference. Thus, subsidy payouts will increase with increases in the market price. Prior to 2004, the government collected duties, as the market price was lower than the pump price. Since then, it has been paying subsidies (Mikhail Raj, 2008). For six months, from September 2001 to February 2002, the government also collected taxes from the retail sales of petrol (Cheah, 2008: N10).

Table 6: The Rising Subsidy Bill, 2000−2009.
2000 2003 Growth 2004 2007 2008 Growth 2009 2000−2003 2004−2008 (%) (%)
Subsidy (RM billion) 6.5 5.0 –8.4 8.5 13.6 34.1 41.5 33.8 % of operating expenditure 11.5 6.7 - 9.3 11.0 22.6 - 21.9 % of total expenditure 7.7 4.4 - 7.2 8.4 17.4 - 16.5 Fuel subsidy (RM billion) - - - - 16.2* 18.3# - -
Source: Ministry of Finance, various issues Note: For the 2000−2007 period, scholarships, educational aid and operating grants to schools have been added to subsidies to make the data comparable
with the 2008 and 2009. * Cheah (2008: N10) # Subsidy payments till end of October 2008 was RM15.6 billion

Raising Revenues and Restructuring Subsidies
11
Table 7: Rechanneling of Savings from the Reduction of Petrol Subsidies.
RM billion %
Petrol subsidies 7.5 54.7 National food supply guarantee policy 4.0 29.2 Cooking oil subsidy 1.5 10.9 Subsidy for imported rice 0.4 2.9 Flour subsidy 0.2 1.5 Bread subsidy 0.1 0.7
Total 13.7 100.0
Source: Loh (2008: 4). Several points are worth noting. First, subsidies are difficult to retract once they are granted. This was evident in the mass protests in the wake of the steep increase in petrol prices in June of 2008. Second, though they are often intended for the poor, subsidies do not always end up helping the poor. Between 70%−72% of the fuel subsidies are estimated to benefit the urban rich (Zainal, 2008). If correct, this represents a substantial loss to poor households. Third, due to the scope for substantial leakages, subsidies are a notoriously inefficient way to help target groups. A direct cash handout would be more efficient, reaching the target group with minimal leaks.5 Reducing fuel subsidies will not result in a smaller total subsidy bill, since the savings would simply be redistributed as subsidies for fuels and a wider range of products. However, since additional subsidies are granted to products consumed by the poor, this move will benefit poorer households. Nonetheless, up to 55% of the savings is used to maintain fuel subsidies that accrue disproportionately to rich, urban households.
5 As Dzof Azmi (2008) notes, “Subsidies…create strange economic situations.
Approximately 100,000 fishermen get diesel subsidies amounting to around RM100 million a month. This is roughly equivalent to RM1000 per fisherman a month – probably more than they make catching and selling fish. If we were really worried about their welfare, we should just give them money directly, and have them do something else…”.

Suresh Narayanan
12
In addition, some of the potential savings in subsidies (RM8 billion in 2008) was whittled away by the granting of fuel rebates, which were effective beginning in April of 2008 and discriminate in favour of car owners, as opposed to motorcycle owners (see Zainal, 2008). Finally, fixing the petrol subsidy at 30 sen per litre will create the odd situation of a larger subsidy bill during periods of low petrol prices and a lower subsidy bill when petrol prices are high. A low price encourages consumption and consequently increases the subsidy bill. The reverse will hold true when prices are high. One can question whether subsidies are really needed in times of low prices.6 OVERVIEW OF REVENUES, 2000−2008 Given that subsidies have been a rising component of expenditures in recent years, tax revenues are a declining component of overall revenues. Tax revenues have grown more slowly during 2004−2008 relative to the 2000−2003 (Tables 8 and 9). Whereas total revenue grew at 14.4% per annum in the earlier period, the growth rate tapered to 12.9% over the later period. Importantly, the dampening of overall revenue growth was a result of the slower growth in both tax and non-tax revenues in the second period. In both periods, the growth of non-tax revenues was significantly higher than tax revenues. However, between 2000 and 2003, non-tax revenue returned an annual growth rate that was twice the rate of tax revenue. In the second period, despite the fact that growth in both components had moderated, non-tax revenue growth continued to outpace tax revenue growth by 1.7 times. The growing importance of revenue from non-tax sources can be seen from the fact that its share in the total revenue averaged 24% during 2000–2003, but rose to 29% between 2004 and 2008.
6 A recent announcement suggests that mechanism such as a floor price for
petrol is in the cards (Cheah, 2008: N10).

Raising Revenues and Restructuring Subsidies
13
Table 8: Shares of Taxes in Total Revenue and Rates of Growth, 2000−2003 and 2004–2008.
2000−2003 2004−2008
Average share
Growth (%) Average share
Growth (%)
Direct tax 49.9 13.8 49.3 12.4 Income tax 47.1 14.5 46.9 12.5 Company tax 26.0 20.0 22.9 8.1 Individual tax 10.9 4.6 8.6 12.9 Petroleum income tax 10.1 12.3 14.4 20.8 Co-ops 0.0 −11.7 1.1 1.9 Other 2.8 6.0 2.5 9.2 Indirect tax 26.0 6.8 21.3 6.6 Export tax 1.3 6.3 1.8 17.0 Petroleum export 1.2 3.2 1.7 17.9 Other 0.0 7.7 0.0 10.7 Import tax 4.6 2.7 2.5 −11.4 Excise 5.6 9.6 7.0 12.9 Sales 9.7 10.1 5.7 2.8 Service 2.5 5.6 2.3 9.1 Other 2.4 −1.8 2.0 10.3
Tax Revenue 75.9 11.2 70.6 10.6
Non Tax 24.1 23.5 29.4 18.4
Total - 14.4 - 12.9
Source: Computed from data in Table 8. Turning to taxes on income, petroleum income tax recorded a significantly higher rate of growth in the second period (20.8% relative to 12.3%), followed by individual income tax (12.9% relative to 4.6%). In contrast, corporate income tax recorded a considerably lower growth rate (8.1% relative to 19.9%).

Suresh Narayanan
14
Table 9: Sources of Federal Revenue, 2000−2008 (RM billion)
2000 2001 2002 2003 2004 2005 2006 2007 2008
Direct tax 29.2 42.1 44.4 43 48.7 53.4 61.6 69.4 77.6 Income tax 27 40.1 42.2 40.5 46.1 50.8 58.8 65.7 73.8 Company tax 13.9 20.8 24.6 24 24.4 26.3 26.5 32.1 33.3 Individual tax 7 9.4 9.9 8 9 8.7 10.2 11.7 14.6 Petroleum income tax 6 9.9 7.6 8.5 11.5 14.6 20.7 20.5 24.5 Co-ops 0.1 0.1 0.1 0.1 1.3 1.2 1.4 1.4 1.4 Other 2.1 2 2.1 2.5 2.6 2.8 2.8 3.7 3.7
Indirect tax 18 19.4 22.5 21.9 23.4 27.1 25 25.8 30.2 Export tax 1 0.9 0.8 1.2 1.6 2.1 2.4 2.3 3 Petroleum export 1 0.8 0.8 1.1 1.5 2 2.3 2.3 2.9 Other 0.0 0.0 0.0 0.1 0.1 0.1 0.0 0.1 0.1 Import tax 3.6 3.2 3.7 3.9 3.9 3.4 2.7 2.4 2.4 Excise 3.8 4.1 4.8 5 6.4 9.3 8.6 9 10.4 Sales 6 7.4 9.2 8 6.8 7.7 6.5 6.6 7.6 Service 1.7 1.9 2.2 2 2.4 2.6 2.7 3 3.4 Other 1.9 1.9 1.8 1.8 2.3 2 2.2 2.4 3.4 Tax revenue 47.2 61.5 66.9 64.9 72.1 80.5 86.6 95.2 107.8
Non-tax revenue 14.7 18.1 16.7 27.7 27.4 25.7 36.9 44.7 53.8
Total 61.9 79.6 83.6 92.6 99.5 106.2 123.5 139.9 161.6
Source: Ministry of Finance, various years Petroleum income tax was introduced in 1967 and quickly emerged as an important source of tax revenue. Its share of total revenue averaged 10% in the 2000−2003 period and rose to 14.4% over the 2004−2008 period. However, petroleum income receipts are volatile. Not only do they vary with petroleum prices, but Petronas has sometimes protected its revenues by upping its output in the face of falling petroleum prices (BNM, 1985: 102).
Raising Revenues and Restructuring Subsidies
15
Despite the higher rate of growth of receipts from personal income tax between 2004 and 2008, its share in total revenue actually fell from 10.9% in the first period to 8.6% in the second period. This is not surprising, since its base has always been narrow and any broadening that has occurred has been eroded by increasing exemptions and by raising the taxable income thresholds. Unmarried taxpayers must earn more than RM2,950 per month before becoming liable for income tax, while a married individual has to earn in excess of RM3,200 per month to start paying income tax. Of the 10.5 million workers, only one million, or 9.5%, pay income tax. Most recently, in the 2009 budget, as a measure to lighten the burden of low income groups, the tax rebate was raised from RM350 to RM400 for those with a taxable income of RM35,000 and below. This move took an estimated 100,000 taxpayers out of the income tax base (Bernama, 2008c).
It is important to remember that the poor do not pay income taxes. Thus, any benefit accorded via the income tax system will miss the group it was designed to serve. The personal income tax revenue accounted for only 2.8% of the Gross National Product (GNP) in 2001 and has declined to 2.1% of the GNP in 2008. Revenue from personal income taxes has been sustained largely by better taxpayer compliance, which is estimated to be about 75% (Hamisah Hamid, 2007a), and collection efficiency, rather than through base broadening measures. The virtual halving of the growth rate of corporate taxes has resulted in a decline in the average share of total revenue, from 26% in the first period to 23% in the second. As a percentage of GNP, its share fell from 6.4% in 2001 to 4.8% by 2008. Bearing the reductions in the corporate tax rates over the years in mind, this is not entirely surprising. Nonetheless, the fact that the growth rate has remained positive can be largely attributed to an expanding income base, a higher degree of tax compliance—about 65% (Hamisah Hamid, 2007a)—induced by lower rates and better tax collection mechanisms (through a wider use of withholding).7
7 Under the 2007 budget proposals, the corporate tax rate for 2007 was lowered
from 28% to 27%, and to 26% for 2008. A one percent reduction in the corporate tax rate results in a loss of RM500 million. However, Malaysia’s

Suresh Narayanan
16
Under indirect taxes, the petroleum export tax, excise duties and service tax returned higher rates of growth in the second period relative to the first. In the case of petroleum export tax and excise duties, their higher rates of growth were accompanied by growing shares in total revenue, from 11.8% to 17.4% for the former and from 5.6% to 7% for the latter, between the two periods. However, in the case of the service tax, the average share was not only small to begin with but has declined in the second period, despite a higher rate of growth. The growth of revenue from import duties, on the other hand, turned from a positive 2.7% per annum in the first period to a negative 11.4% growth rate between 2004 and 2008. This is the only revenue source with a negative growth rate. The decline of this revenue source began in the 1960s, with the adoption of the import substitution strategy that prompted a steady decline in imports and, thus, declining revenue from import duties. The move to the ASEAN Free Trade Area, along with other measures of trade liberalization, has compromised the revenue contribution of import duties even further. The 2009 budget lowered import taxes on consumer durables, from between 10%−60% to between 5%−30%. In any case, the bulk of revenue from import duties are raised from a very narrow base of commodities, including petroleum, alcohol, heavy fuels and oils, spirits and tobacco products. About 60% of imports are estimated to escape the tax (BNM, 1991: 206). To some extent, the demise of the role of import duties also gave new impetus to excise duties as a revenue generator. To compensate for the loss of import duties on cars from the ASEAN region, for example, the government raised excise duties on cars. Interestingly, the growth rate of the sales tax fell drastically, from 10.1% between 2000 and 2003 to just 2.8% between 2004 and 2008. Its average share of total revenue also declined, from 9.7% in the first period to 5.6% period in the second. The sales tax was introduced in 1972 with the specific objective of generating additional revenue.
tax rate is still above Hong Kong's 17.5%, Singapore's 20% and Taiwan's 25% (Hamisah Hamid, 2007b).

Raising Revenues and Restructuring Subsidies
17
The sales tax has been plagued by weaknesses in its coverage. It is a single-stage levy confined to manufacturers and importers and applied largely to consumption goods. Its narrow base is reflected in the fact that it only captures about 40% of locally manufactured and imported goods (BNM, 1991: 206), thus failing to live up to expectations as a significant generator of revenue. The revenue generated by sales tax compares unfavourably to that of ASEAN neighbours, who have introduced a broader tax on consumption. One example is the VAT (value-added tax). For example, Singapore’s VAT generated 8.4% of tax revenue, despite a low tax rate of 3%. On the other hand, in the Philippines, a standard rate of 10% generated 22.1% of total tax revenues (Table 10). In striking contrast, the Malaysian sales tax contributed a mere 6.9% of all tax revenue in 2007. Table 10: Contribution of VAT to Tax Revenue for Selected ASEAN Countries.
Country* Date introduced Rate at introduction % Tax revenue % GDP
Indonesia 1985 10% 19.3 2.7 Philippines 1988 10% 22.1 3.0 Thailand 1992 10% 20.8 2.8 Singapore 1994 3% 8.4 1.2 Vietnam 1999 5%, 10%, 15% 24.5 4.0
Source: Ebril, Keen, Bodin and Summers (2001: 9–12). Note: *Based on data available as of Summer 1999. Apart from its narrow base, the sales tax suffers from tax ‘pyramiding’. Since the tax is imposed at the manufacturing level, as the taxed good passes through wholesalers and distributors each applies their percentage mark-ups to the purchase price, which already incorporates the sales tax. Thus, the tax pyramids as it reaches the final consumer, resulting in high consumer prices that do not generate commensurate revenues. Also, because it is applied at the first stage of production, it fails to tax the value added at subsequent stages of the distribution chain. Despite the ‘ring system’ to exempt inputs from being taxed, imperfections in implementation have resulted in the persistence of tax cascading (or the multiple application of a given tax to the same commodity).
More generally, the poor revenue performance of the indirect taxes offers a poor defence for their complex structure. Some levies (such as sales and service taxes) suffer from narrow bases, while others (such as
Suresh Narayanan
18
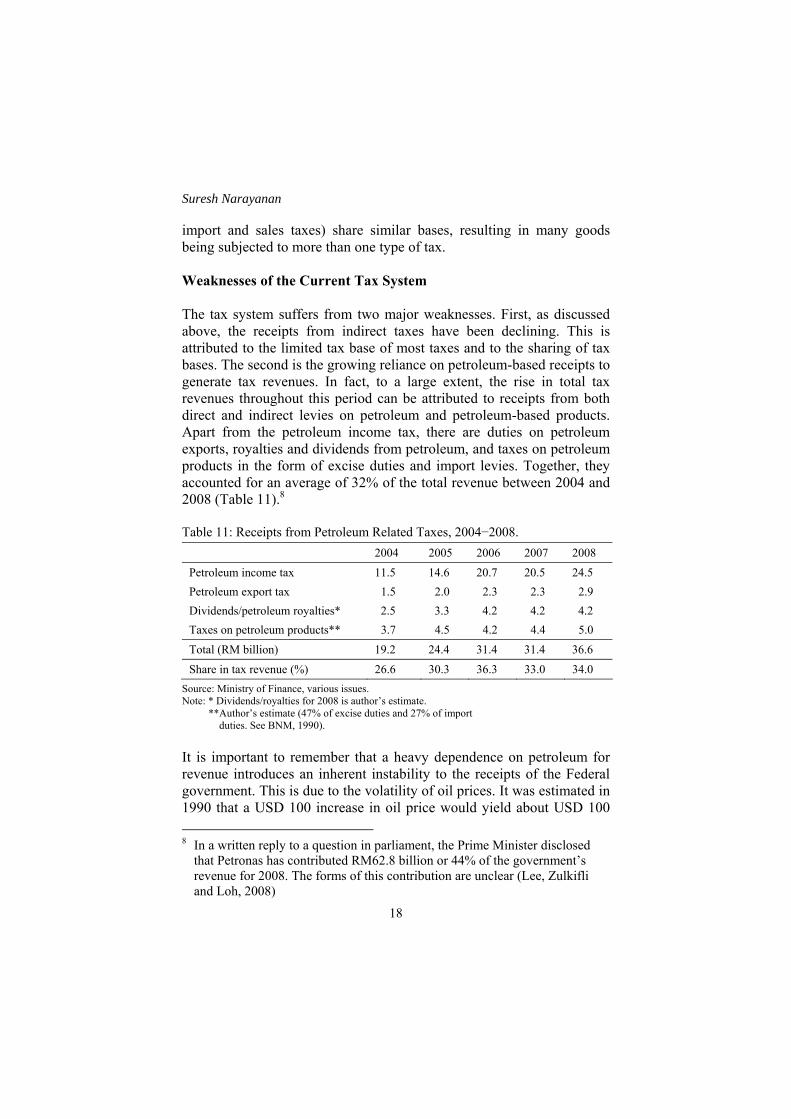
import and sales taxes) share similar bases, resulting in many goods being subjected to more than one type of tax. Weaknesses of the Current Tax System The tax system suffers from two major weaknesses. First, as discussed above, the receipts from indirect taxes have been declining. This is attributed to the limited tax base of most taxes and to the sharing of tax bases. The second is the growing reliance on petroleum-based receipts to generate tax revenues. In fact, to a large extent, the rise in total tax revenues throughout this period can be attributed to receipts from both direct and indirect levies on petroleum and petroleum-based products. Apart from the petroleum income tax, there are duties on petroleum exports, royalties and dividends from petroleum, and taxes on petroleum products in the form of excise duties and import levies. Together, they accounted for an average of 32% of the total revenue between 2004 and 2008 (Table 11).8
Table 11: Receipts from Petroleum Related Taxes, 2004−2008.
2004 2005 2006 2007 2008
Petroleum income tax 11.5 14.6 20.7 20.5 24.5 Petroleum export tax 1.5 2.0 2.3 2.3 2.9 Dividends/petroleum royalties* 2.5 3.3 4.2 4.2 4.2 Taxes on petroleum products** 3.7 4.5 4.2 4.4 5.0
Total (RM billion) 19.2 24.4 31.4 31.4 36.6
Share in tax revenue (%) 26.6 30.3 36.3 33.0 34.0
Source: Ministry of Finance, various issues. Note: * Dividends/royalties for 2008 is author’s estimate. **Author’s estimate (47% of excise duties and 27% of import duties. See BNM, 1990). It is important to remember that a heavy dependence on petroleum for revenue introduces an inherent instability to the receipts of the Federal government. This is due to the volatility of oil prices. It was estimated in 1990 that a USD 100 increase in oil price would yield about USD 100 8 In a written reply to a question in parliament, the Prime Minister disclosed
that Petronas has contributed RM62.8 billion or 44% of the government’s revenue for 2008. The forms of this contribution are unclear (Lee, Zulkifli and Loh, 2008)

Raising Revenues and Restructuring Subsidies
19
million in additional revenue from petroleum income tax, export duties and royalties in the first year and an additional USD 400 million in the following year. A dollar decrease in the petrol price would have the reverse effect. The fall in petrol prices was a major cause of the first decline in Federal revenue in nearly 30 years in 1986−1987 (BNM, 1991: 206). The recent rise and fall of oil prices has raised concerns about the sustainability of Malaysia’s forecasted revenue. For example, the 2009 budget was drawn up based on revenues forecasted when oil prices were around USD 125 per barrel. High crude oil prices were sustained for about four month before they began to slide in September, 2008. On October 23, 2008 the price had fallen to as low as USD 67.40 per barrel in New York. If this persists, actual revenue will be lower than forecast in 2009. More significantly, if prices remained at an average of USD 70 (RM245) per barrel in 2009, the revenue implications for 2010 would be serious. This underscores the urgency of looking for alternative sources of revenue, as was publicly acknowledged by the second Finance Minister (Yeow, 2008: B1). The Value Added Tax Alternative Malaysia has flirted with the idea of a value added tax (VAT) on several occasions, but has stopped short of implementation. A VAT was first mooted in 1988, the finance Minister then recognised the need for a stable and reliable source of revenue. However, he left office soon after, in 1991. The impending implementation of a comprehensive sales and services tax (SST)–essentially a repackaged VAT–was announced in 1993. However, the continually buoyant economy yielded enough revenues to turn around the public sector budget from 1993 to 1997, obviating the immediate need to overhaul the tax system. This was unfortunate. The years of rapid growth were ideally suited to “integrate the existing sales, service and excise taxes and derive economies in a single tax administration” (BNM, 1991: 207). An integrated consumption-based tax would have removed the distortions inherent in the current sales, services and excise taxes, and simplified the tax machinery. It would have helped to moderate growth and curb the inflationary pressures by reducing resources in private hands. More importantly, there would have been a solid foundation to generate fiscal surpluses in the years of prosperity. This could have been achieved

Suresh Narayanan
20
without serious opposition, as incomes were rising (Narayanan, 1996: 869–881). Unfortunately, this window of opportunity was missed. The idea of a VAT was resurrected when the Badawi administration came into power, inheriting a significant budget deficit. As Finance Minister, he announced in 2005 that a goods and services tax (GST) would come into force in 2007. In the intervening period, increases in petrol prices and several other commodities appear to have undermined the will to introduce the GST. The immediate impact would be a one-time increase in the general price level, not a desired outcome in a period when prices were rising due to other factors. Thus, while Malaysia hesitated on the matter, virtually all of its ASEAN neighbours adopted the VAT.
The potential tax base of a consumption type VAT based on the destination principle can be estimated through three approaches (Jenkins and Kuo, 2000). The simplest of the three, used here, relies on the GDP, the sum of the value added in the domestic production of all goods and services. Based on the destination principle, imports are taxed but exports are not. Thus, we add imports to the GDP and subtract exports. Because only consumption is taxed, gross private capital formation is subtracted from the tax base. The potential tax base is given by: Potential Tax Base = GDP + Imports – Exports – Gross Private Capital Formation The actual revenue that generated from this tax base will vary with the number and level of rates proposed, the exemptions allowed, the degree of compliance and the cost of the administration. The revenue implication of allowing exemptions and zero rating vary, depending on which stage of the production-distribution chain is allowed to be zero-rated or exempted. To truly free a commodity from taxation, zero-rating must occur at the final stage. Similarly, if exemption is designed to give preferential status to a commodity, exemption must occur at the final stage. Zero-rating and exemption, granted at the final stage, will further erode the tax base and revenue collected (Narayanan, 1991). Allowing for the exemption of some sectors, the zero-rating of some products, tax avoidance at the retail end, lapses in compliance, and costs of administration, we assumed that only 40% of the potential tax base

Raising Revenues and Restructuring Subsidies
21
becomes available.9 We assumed that the VAT, if introduced, will replace the existing sales, service and import levies (except the petroleum export tax). The authorities may prefer to retain excises to impose a separate tax on luxury goods without complicating the VAT framework. The potential tax base of the VAT is computed for 2005, 2006 and 2007 and shown in Table 12. Several points are worth highlighting. Table 12: Potential Tax Base of the VAT in Malaysia.
Year 2005 2006 2007
Potential tax base(RM billion) 349.5 385.0 437.3
Available base (RM billion)(40% of potential) 139.8 154.0 174.9
VAT rate required to raise revenue equivalent to sales, service and import taxes (%)
9.8 7.7 6.9
VAT revenue at 10% (RM billion) 14.0 15.4 17.5
VAT revenue as % of post-VAT total revenue 13.1 12.1 12.0
Pre-VAT deficit/GDP (%) 3.6 3.3 3.2
Post-VAT deficit/GDP (%) 3.5 2.7 2.4
Source: Author’s estimates First, the VAT tax rate that would generate the revenues equivalent to what was raised by the sales, service and import taxes in the respective years is shown in row 4. On average, it is considerably lower that the rates associated with these taxes at present. Second, assuming a single tax rate of 10% (used by most countries in ASEAN, at least as a basic rate, excepting Singapore as shown in Table 10), the revenue generated by VAT makes a noticeable contribution to total tax revenue that is far greater that the combined contribution of the existing sales, service and import taxes. These taxes, taken together, accounted for 12.9%, 9.6% and 8.6% of total revenue in 2005, 2006 and
9 Jenkins and Kuo (2000) estimated that, in a less monetized economy such as
Nepal, the available tax base for VAT was about 20% of gross domestic expenditure. Given that the taxes the VAT is most likely to replace, if introduced, are sales, service and imports, our assumption of 40% of the potential base being available seems reasonable. The current import and sales tax only captures about 40% of their respective bases.

Suresh Narayanan
22
2007, respectively. The comparable contribution of VAT to total revenue would have been 13% in 2005 and about 12% in 2006 and 2007.10
Finally, VAT revenues contribute significantly to a reduction in the budget deficit. Needless to say, through better compliance and stricter monitoring, the tax base can be raised to 45% or more. In this case, the impact on revenue and the budget deficit would be even greater. While the VAT may be a more efficient source of revenue than the three taxes it might replace, it cannot be to sole tool relied upon to balance the budget. In would be wise to limit expenditures to prudent levels, to focus on increasing the productive capacity of the economy and to plug leakages. For example, in order to balance the budget in 2006 with a 10% rate in place, the VAT would have to raise a total of RM30.7 billion. This would require that almost 79.7% of the potential tax base be available. In order to balance the budget in 2007, the VAT must generate RM32.7 billion and capture 74% of the potential base. The introduction of a VAT usually raises expectations that taxes on personal income will be reduced. Otherwise, taxpayers will be hit from two sides: on the receipt of income and when they seek to spend it. Table 13 computes (in static terms) the percentage of the potential base that must be captured if the VAT was to make up for revenues lost by completely abolishing the personal income tax (an extreme assumption). We assume that the VAT is imposed at a single rate of 10%.11 To make up for revenues lost by removing the income tax altogether in 2006, 57.4% of the potential tax base must be available. This falls to 54.2% by 2007. On the other hand, reducing income tax receipts in 2007 by 50% would require the tax base to be about 41% of the potential base available that year. Clearly, significant reductions in personal income taxes require a considerable widening of the tax base over time.12
10 Post-VAT total revenue was computed by replacing revenue from the sales,
service and import taxes with revenue from a VAT of 10% imposed on 40% of the potential tax base for each year.
11 We assumed that the VAT replaced the sales, service and import taxes. 12 The alternative is to raise the VAT rate. For example, complete removal of
income tax would have been possible in 2007 with 40% of the potential tax base available if the rate is raised to 13.6%. However, this option must be

Raising Revenues and Restructuring Subsidies
23
Table 13: Can a VAT Replace Receipts from Personal Income Tax?
Possible reductions in personal income tax revenue 2005 2006 2007
VAT (RM billion) revenue required if income tax is abolished
22.4 22.1 23.7
% of potential tax base required 64.1 57.4 54.2 VAT (RM billion) revenue required to compensate for the loss of half of income tax receipts
18.1 17.1 17.9
% of potential tax base required 51.8 44.4 40.9
Source: Author’s estimates
Despite the obvious attraction of the VAT alternative, we do not advise implementation in the current environment of rising consumer prices. While not inflationary, the implementation of the VAT is usually accompanied by a one-time increase in consumer prices. A VAT is best introduced during a period of rising incomes and prosperity, a window of opportunity that was lost in the early 1990s when the idea was first raised. Plugging Other Leakages
While weakening tax revenue sources and a rising component of unproductive expenditures (subsidies are after all transfers and do not directly raise the productive capacity of the economy) contribute to fiscal imbalance and attract immediate attention, other leakages also weaken the revenue and expenditure equation of the federal government. For example, the Auditor General’s report for 2007 noted that there were 57 federal ministries or departments, with arrears of revenue totalling RM14.08 billion. Of this, RM9.48 billion (67.3%) had been outstanding for more than three years (Ambrin Buang, 2008: 5). On the expenditure side, whereas 98.8% of the operating expenditure for 2007 was used up, only 89% of the allocated development expenditure
exercised with caution. Raising taxes on consumption (undertaken by everyone) to reduce personal income tax (paid by a small group of not-so- badly- off people in an economy like ours) will raise equity concerns. At best, the VAT is a proportionate tax and cannot really be made progressive without seriously compromising its base. Its lack of progressivity must be addressed from the expenditure side.

Suresh Narayanan
24
was spent (Ambrin Buang, 2008: 5). Thus, 11%, or some RM5 billion stayed out of the economy, despite being allocated for various economic activities. Corruption and financial mismanagement contribute to further leakages. On financial management, the Auditor’s Report noted that a few ministries and federal departments were not serious in addressing the financial management, despite the fact that the weaknesses had been repeatedly pointed out by the National Audit Department. More specifically, of the 28 ministries evaluated using Accountability Index of Financial Management, only one (3.6%) was rated as ‘excellent’, while five (18%) were rated as only ‘satisfactory’. Of the 31 federal departments, only five (16%) were rate ‘excellent’ while six (19%) were just ‘satisfactory’ (Ambrin Buang, 2008: 4–5). CONCLUDING COMMENTS Since 2004, the operating budget has been growing faster than revenue collections. If left unchecked, there may come a time when the latter will be insufficient to cover the former. Within the operating budget, the rate of growth of subsidy payments switched from a negative rate to a whopping 41.5% per year between 2004 and 2008. In fact, subsidies are expected to account for about 23% of the operating budget by 2008. Much of this has gone to fuel subsidies that disproportionately benefit the urban, higher income groups. On the revenue side, non-tax revenues are growing faster than tax receipts. The rates of growth in receipts from the personal and petroleum income taxes, petroleum export tax, excises and the service tax have increased in the second period, while the rate of growth of receipts from corporate taxes has declined and revenues from sales tax saw negative growth. Clearly, tax revenue growth in the later period is driven by petroleum-based taxes. Thus, the challenge of fiscal management consists of finding more stable sources of revenue, redirecting expenditures on subsidies to more productive uses and eliminating wasteful expenditures in the public sector. While the VAT is a viable source of stable revenues, it cannot be
Raising Revenues and Restructuring Subsidies
25
implemented quickly. The timing of the VAT is crucial if its initial impact on prices is to be mitigated. Implementation must wait for a period of stable economic growth. More immediately, subsidies must be phased out. This needs to be done gradually and in a consistent manner. The 41% hike in petrol prices was an unwise policy move; it provided the excuse for a general price increase, which has caused hardship to low income families. The general price level remains high despite the fact that petrol prices have almost returned to the previous levels. Finally, more serious and concerted efforts must be made to reduce waste in public spending. There is no evidence that anyone pays a price for negative mention in the Auditor General’s annual reports. ACKNOWLEDGEMENT This paper was presented at the 2009–2010 National Economic Outlook Conference, organised by the Malaysian Institute of Economic Research (MIER), December 2–3, 2008, Kuala Lumpur. REFERENCES Ahmad Saifuddin, 2008, ‘An analysis of the 2009 National budget.’
Presentation made at the 2009 Federal Budget Dialogue organised by the Socioeconomic and Environmental Research Institute (SERI), 6 September 2008, Penang.
Ambrin Buang, 2008, ‘Auditor General’s Report: Synopsis on
Public Accounts Statement and Financial Management of Federal Government Ministries/Departments’, http://www.audit.gov.my /xboer/upload/ sctivities_ REPORT_2007_Account. pdf? CqC3= CqC3.
Asian Development Bank, 2007, Key Indicators 2007: Country Tables,
http://www.adb.org/Documents/Books/Key_Indicators/2008/Country. asp (accessed on August 2008).

Suresh Narayanan
26
Bank Negara Malaysia (BNM), 1985, Annual Report 1984, Kuala Lumpur: Bank Negara Malaysia.
_______, 991, Annual Report 1990, Kuala Lumpur: Bank Negara
Malaysia. _______, 2007, Annual Report 2006, Kuala Lumpur: Bank Negara
Malaysia. Bernama, 2008, ‘Government oil revenue could slip in 2010 due to low
prices’. Quoted in Malaysian Insider, http://www. Themalaysian insider. com (accessed on 23 October 2008)
Bernama, 2008a, “Government only saved RM1.4billion from petrol
price hike in 2006, says PM”, http://www.bernama.com/ bernama/v5/newsindex.php?id=335652 (accessed on 27 May 2008).
_______, 2008c, ‘Income tax exemption in 2009?’ 12 June, 2008
http://www.bernama.com/bernama/v3/ news_lite.php?id=339053 (accessed on 12 June 2008).
Cheah, R., 2008, ‘Government not paying petrol subsidies,’ The Star,
19 November. Dzof Azmi, 2008, ‘Fuelling trouble with petrol subsidies,’ The Star
Online, http://biz.thestar.com.my/ (accessed on 30 March 2008). Ebril, L., Keen, M., Bodin, Jean-Paul and Summers, V., 2001, The
Modern VAT, Washington: International Monetary Fund. Hamisah Hamid, 2007a, ‘New IRB chief on mission to improve tax
compliance’, New Straits Times, 10 May 2007. _______, 2007b, ‘Corporate tax cut won't hurt revenue’, Business Times,
4 June.

Raising Revenues and Restructuring Subsidies
27
Jenkins, G. K., 2000, ‘A VAT Revenue Simulation Model for Tax Reform in Developing Countries’. Harvard Institute for International Development, http://www.cid.harvard.edu/hiid/522. pdf.
Lee, Y. P., Zulkifli Abd. Rahman and Loh, F. F., 2008, ‘Petronas pays
44% of Government’s revenue.’ The Star, 12 November 2008. Loh, d. 2008, Subsidy still in force, New Straits times, 5 June. Mikhail Raj Abdullah, 2008, ‘Uncontrolled fuel subsidy payments will
jeopardise Malaysia’s economic future’, Bernama.com, 12 June 2008.
Ministry of Finance, various years, Economic Report, Kuala Lumpur:
Ministry of Finance. Narayanan, S., 1991, The Value Added Tax in Malaysia, Kuala Lumpur:
ISIS Malaysia. _______, 1996, ‘Fiscal reform in Malaysia: Behind a successful
experience’, Asian Survey, XXXVI, 869−881. _______, 2004, ‘Fiscal deficits in the Pacific region: Malaysia’, in Akira
Kohsaka (ed). Fiscal Deficits in the Pacific Region, London: Routledge, 228−243.
_______, (forthcoming), “Fiscal policy in Malaysia,” in Malaysia’s
Economy: Past, Present and Future. Kuala Lumpur: The Malaysian Strategic Research Centre.
Riedl, B., 2008, “Ten myths about budget deficit and debt”, The
Heritage Foundation, Backgrounder#2178, http://www. heritage. org/Research/budget/bg2178.cfm (accessed on September 2008).

Suresh Narayanan
28
Yeow, P. L., 2008, "Bonds, savings to fund stimulus," The Star (Star Biz), 6 November: B1.
Zainal Aznam, 2008, "Fuel subsidy getting to be untenable", New
Sunday Times, 7 September: 20. (http://thestar.com.my/news/ story.asp?file=/2008/6/5/nation/21461533&sec=nation)