Embed Size (px)
Citation preview
The Challenges & Opportunities created by
California’s new Benchmarking
LegislationMartha Brook
California Energy Commission
2008 ASHRAE Annual Meeting, Salt Lake City
Presentation Topics
CA’s new benchmarking policies
Challenges of benchmarking the diversity of CA’s commercial buildings
Creating a regional market for efficient commercial real estate
Energy use benchmarks from building design through operations
2008 ASHRAE Annual Meeting, Salt Lake City
State Building Benchmarking
State buildings > 50,000 sf
U.S. EPA’s Energy Star Portfolio Manager
Benchmarks by January, 2008
20% efficiency improvements by 2015
2008 ASHRAE Annual Meeting, Salt Lake City
Part of the Governor’s 2004
Green Building Initiative
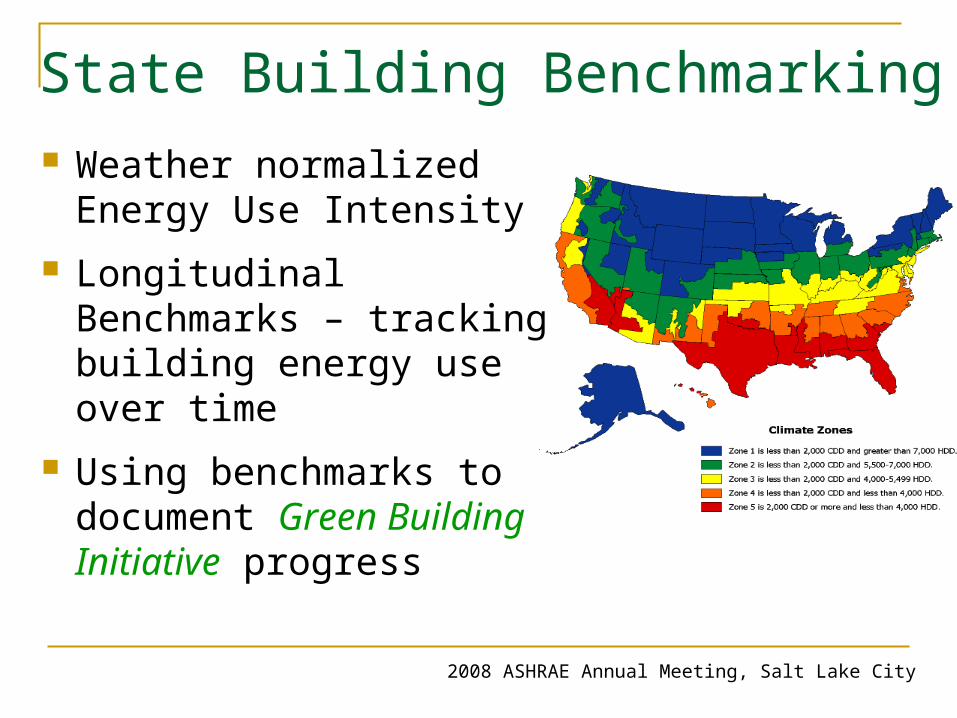
State Building Benchmarking Weather normalized
Energy Use Intensity
Longitudinal Benchmarks – tracking building energy use over time
Using benchmarks to document Green Building Initiative progress
2008 ASHRAE Annual Meeting, Salt Lake City
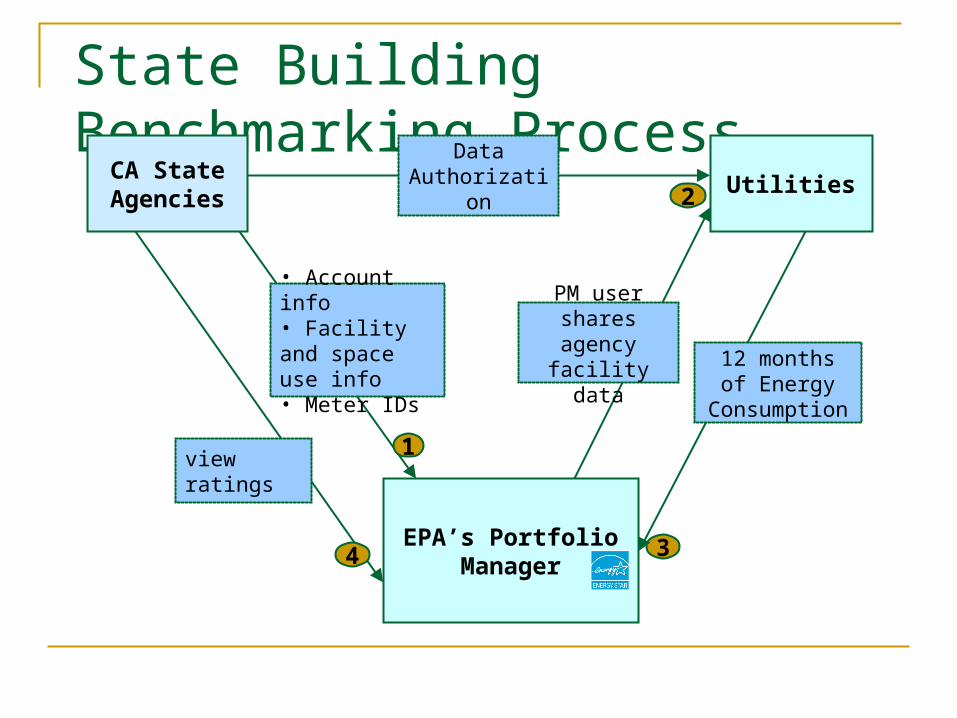
State Building Benchmarking Process
1
• Account info• Facility and space use info• Meter IDs
CA State Agencies
EPA’s Portfolio Manager
Utilities
4
view ratings
3
12 months of Energy
Consumption
PM user shares agency
facility data
2
Data Authorization
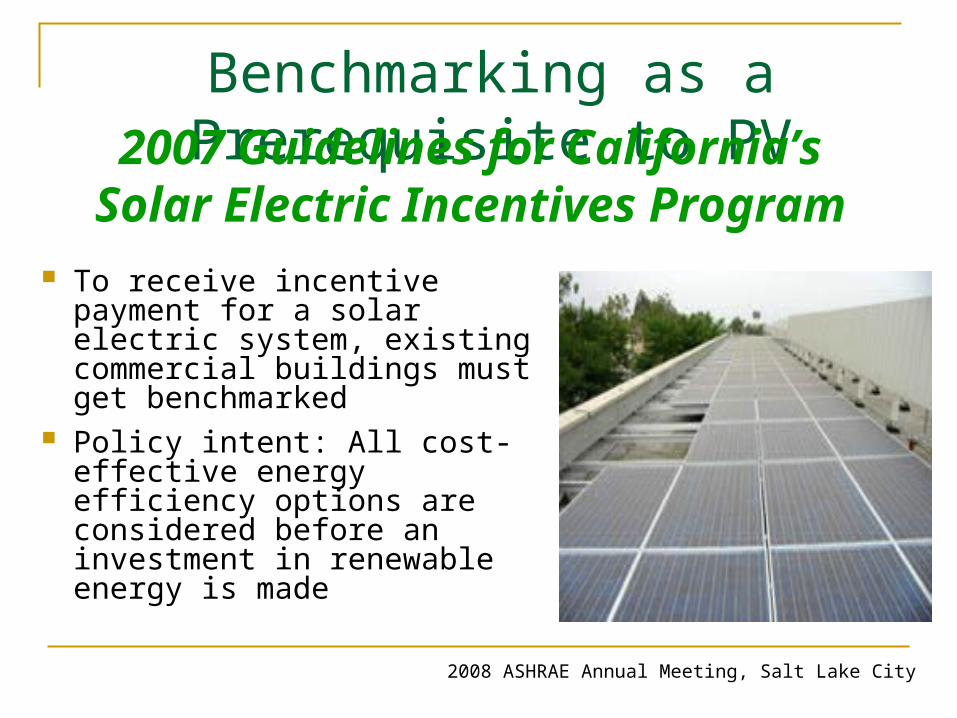
Benchmarking as a Prerequisite to PV
To receive incentive payment for a solar electric system, existing commercial buildings must get benchmarked
Policy intent: All cost-effective energy efficiency options are considered before an investment in renewable energy is made
2008 ASHRAE Annual Meeting, Salt Lake City
2007 Guidelines for California’s Solar Electric
Incentives Program
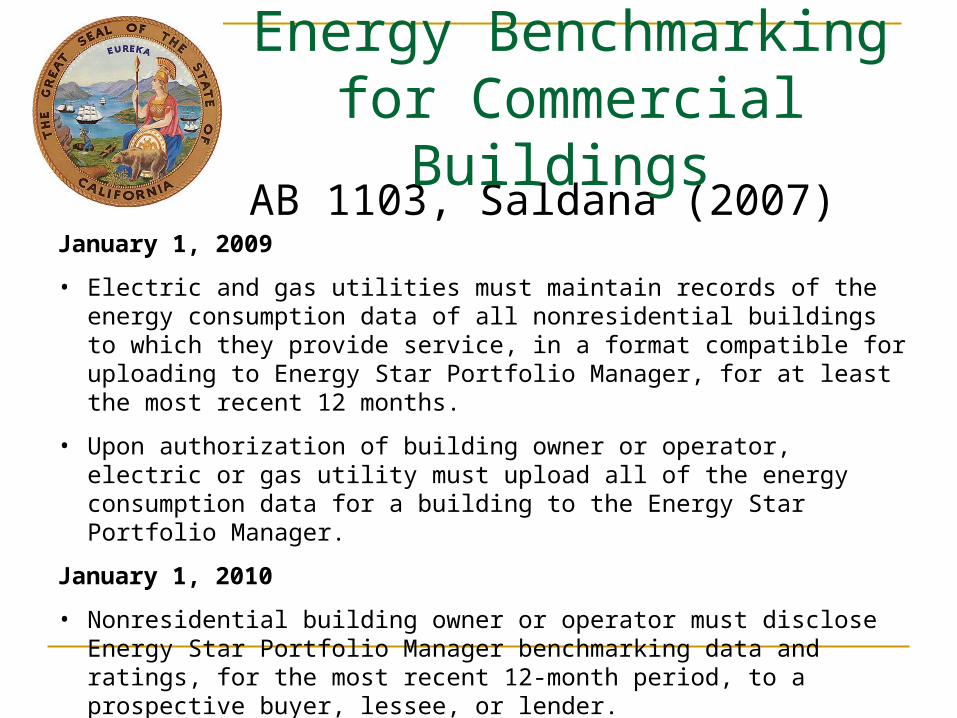
AB 1103, Saldana (2007)January 1, 2009
• Electric and gas utilities must maintain records of the energy consumption data of all nonresidential buildings to which they provide service, in a format compatible for uploading to Energy Star Portfolio Manager, for at least the most recent 12 months.
• Upon authorization of building owner or operator, electric or gas utility must upload all of the energy consumption data for a building to the Energy Star Portfolio Manager.
January 1, 2010
• Nonresidential building owner or operator must disclose Energy Star Portfolio Manager benchmarking data and ratings, for the most recent 12-month period, to a prospective buyer, lessee, or lender.
Energy Benchmarking for Commercial
Buildings
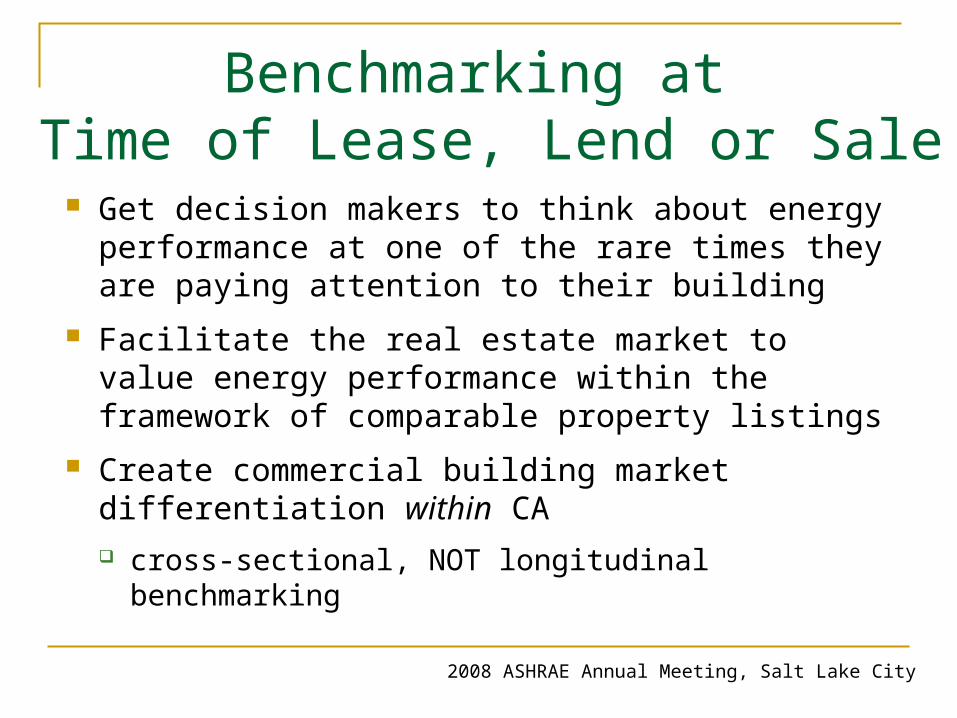
Benchmarking at Time of Lease, Lend or Sale
Get decision makers to think about energy performance at one of the rare times they are paying attention to their building
Facilitate the real estate market to value energy performance within the framework of comparable property listings
Create commercial building market differentiation within CA cross-sectional, NOT longitudinal benchmarking
2008 ASHRAE Annual Meeting, Salt Lake City
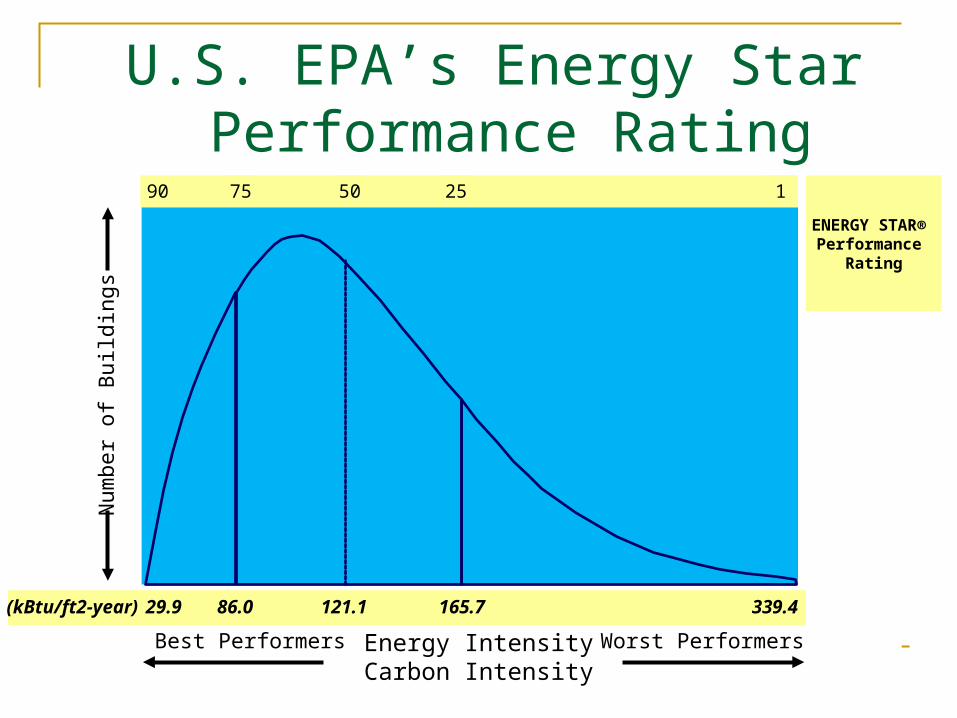
U.S. EPA’s Energy Star Performance Rating
Energy IntensityCarbon Intensity
Worst PerformersBest Performers
Num
ber
of
Build
ings
121.129.9 165.786.0 339.4(kBtu/ft2-year)
125507590
ENERGY STAR® Performance
Rating
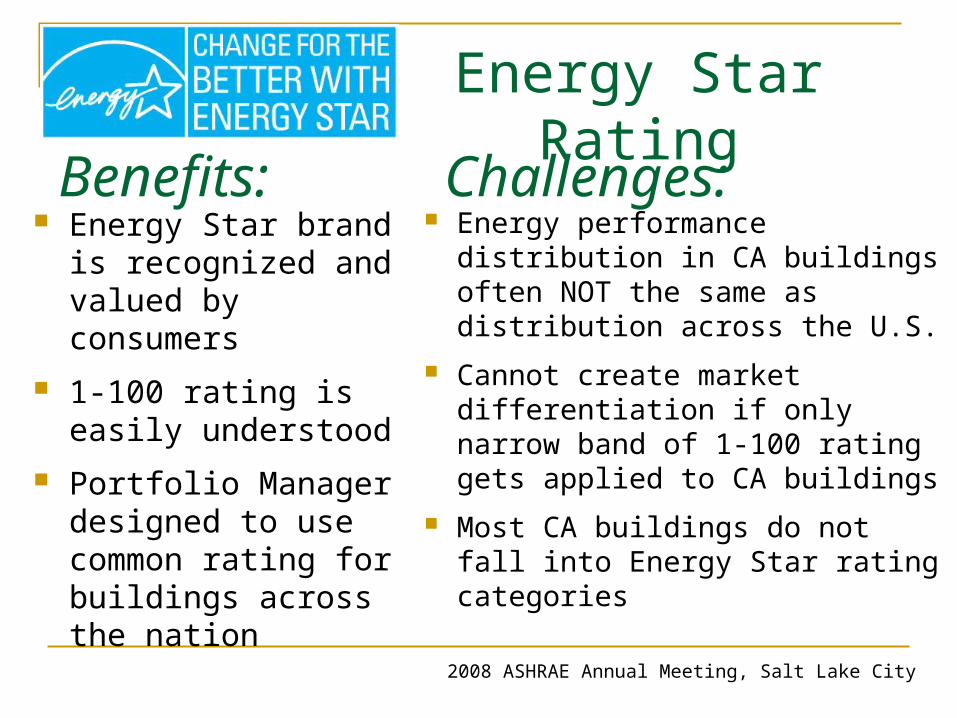
Energy Star Rating
Energy Star brand is recognized and valued by consumers
1-100 rating is easily understood
Portfolio Manager designed to use common rating for buildings across the nation
2008 ASHRAE Annual Meeting, Salt Lake City
Benefits:
Challenges:
Energy performance distribution in CA buildings often NOT the same as distribution across the U.S.
Cannot create market differentiation if only narrow band of 1-100 rating gets applied to CA buildings
Most CA buildings do not fall into Energy Star rating categories
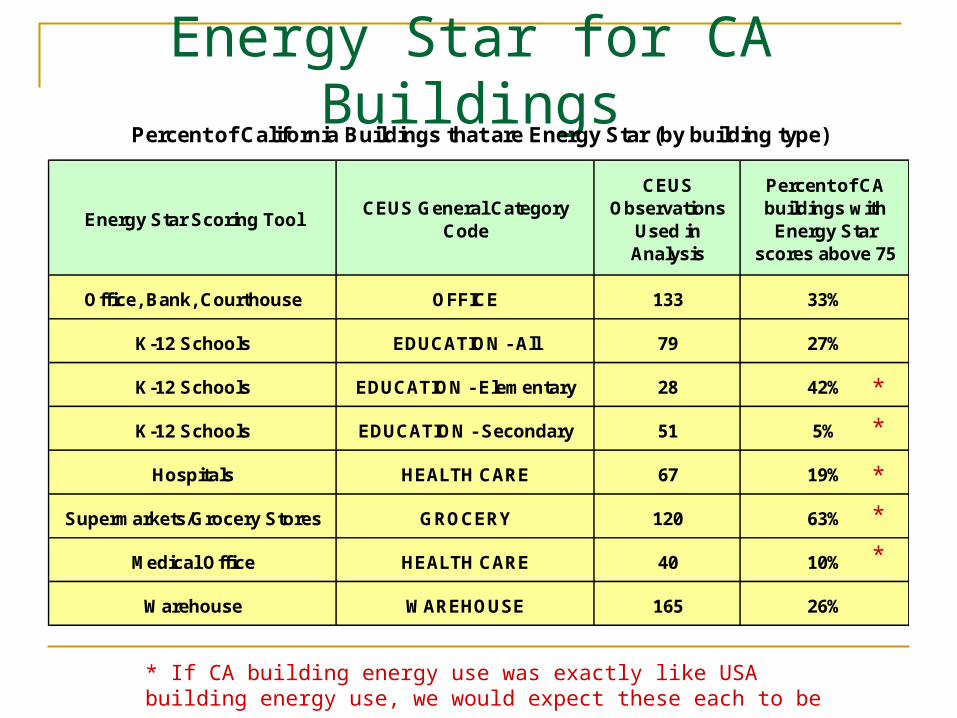
Energy Star for CA Buildings
Office, Bank, Courthouse OFFICE 133 33%
K-12 Schools EDUCATION - All 79 27%
K-12 Schools EDUCATION - Elementary 28 42%
K-12 Schools EDUCATION - Secondary 51 5%
Hospitals HEALTH CARE 67 19%
Supermarkets/Grocery Stores GROCERY 120 63%
Medical Office HEALTH CARE 40 10%
Warehouse WAREHOUSE 165 26%
Percent of California Buildings that are Energy Star (by building type)
Energy Star Scoring ToolCEUS General Category
Code
Percent of CA buildings with
Energy Star scores above 75
CEUS Observations
Used in Analysis
*
* If CA building energy use was exactly like USA building energy use, we would expect these each to be 25%
*
*
*
*
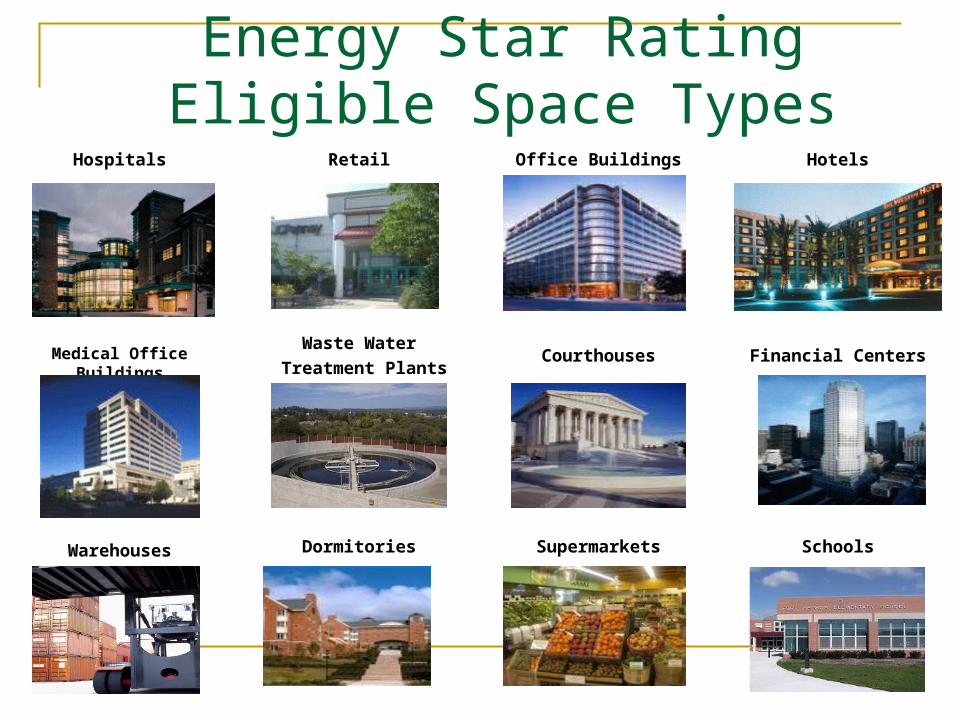
Hospitals Retail Office Buildings Hotels
Medical Office BuildingsWaste Water
Treatment PlantsCourthouses Financial Centers
Warehouses Dormitories Supermarkets Schools
Energy Star Rating Eligible Space Types
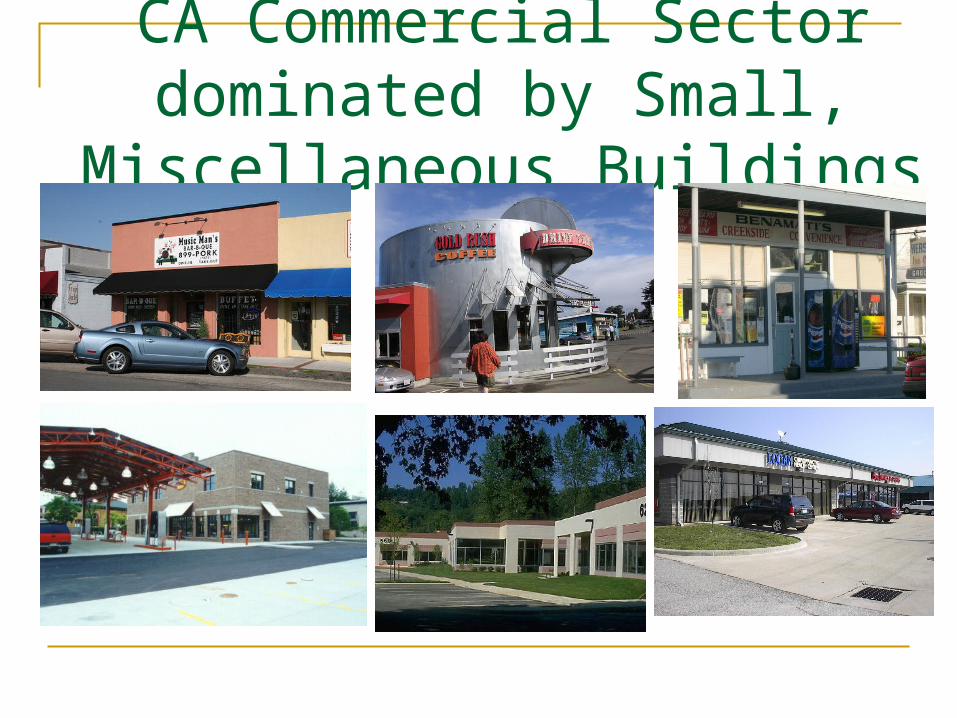
CA Commercial Sector dominated by Small,
Miscellaneous Buildings
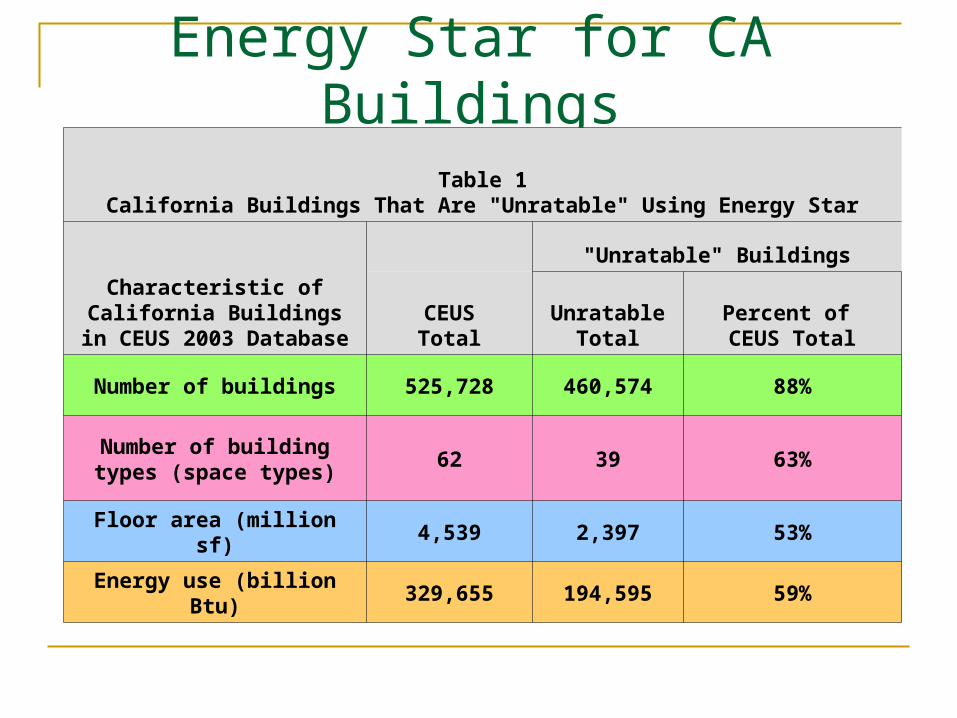
Energy Star for CA Buildings
Table 1California Buildings That Are "Unratable" Using Energy Star
Characteristic of California Buildings in CEUS 2003
Database
"Unratable" Buildings
CEUSTotal
Unratable Total
Percent of CEUS Total
Number of buildings 525,728 460,574 88%
Number of building types (space types)
62 39 63%
Floor area (million sf) 4,539 2,397 53%
Energy use (billion Btu) 329,655 194,595 59%
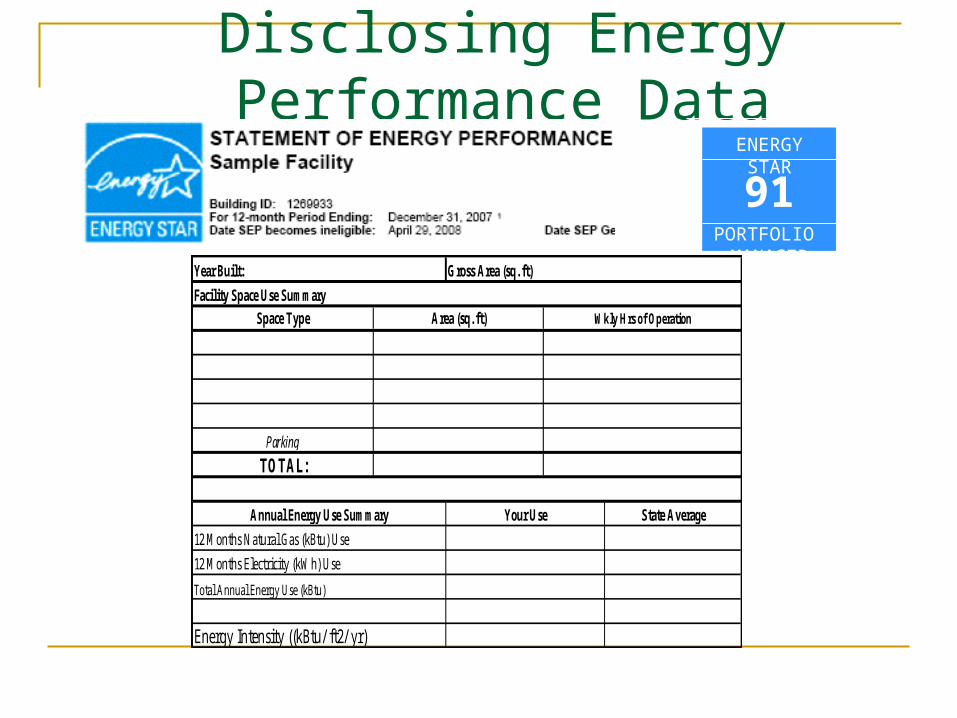
Disclosing Energy Performance Data
91PORTFOLIO MANAGER
ENERGY STAR
Total Annual Energy Use (kBtu)
Year Built:
Space Type Area (sq. ft) Wkly Hrs of Operation
Facility Space Use Summary
TOTAL:
Annual Energy Use Summary Your Use State Average
12 Months Natural Gas (kBtu) Use
Energy Intensity ((kBtu/ ft2/ yr)
Gross Area (sq. ft)
12 Months Electricity (kWh) Use
Parking
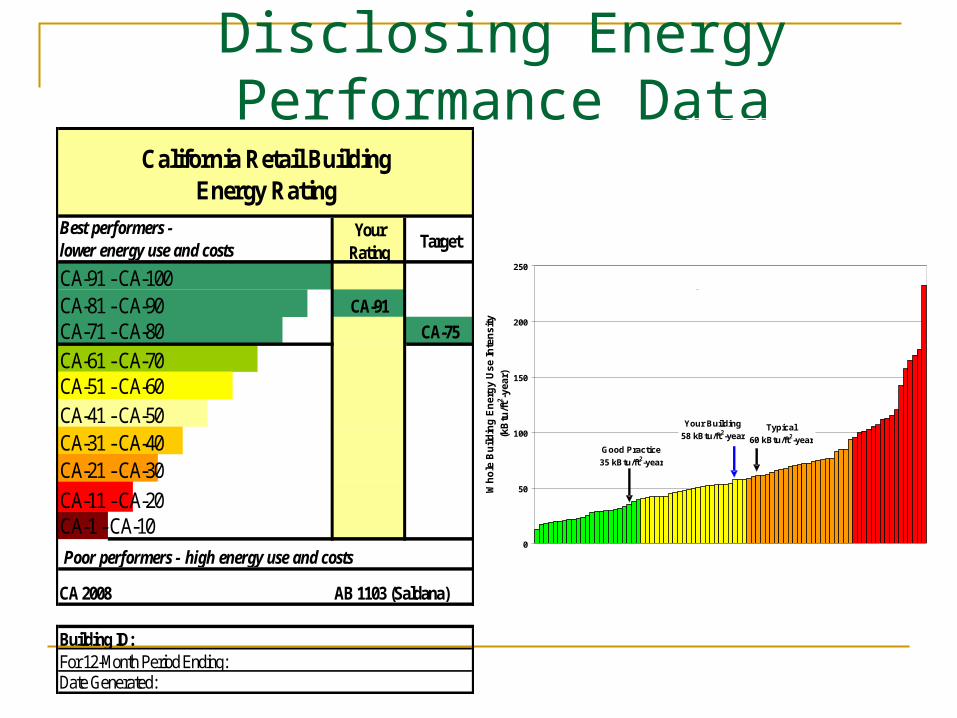
Disclosing Energy Performance Data
Your Rating
Target
CA-91 - CA-100CA-81 - CA-90 CA-91CA-71 - CA-80 CA-75
CA-61 - CA-70CA-51 - CA-60
CA-41 - CA-50CA-31 - CA-40CA-21 - CA-30CA-11 - CA-20CA-1 - CA-10
AB 1103 (Saldana)
Poor performers - high energy use and costs
Date Generated:For 12-Month Period Ending:Building ID:
CA 2008
Best performers - lower energy use and costs
California Retail Building Energy Rating
0
50
100
150
200
250
Wh
ole
Bu
ild
ing
En
erg
y U
se I
nte
nsi
ty
(kB
tu/f
t2 -yea
r)
California Office Buildings
Good Practice
35 kBtu/ft2-year
Typical
60 kBtu/ft2-year
Your Building
58 kBtu/ft2-year
Source: CEUS
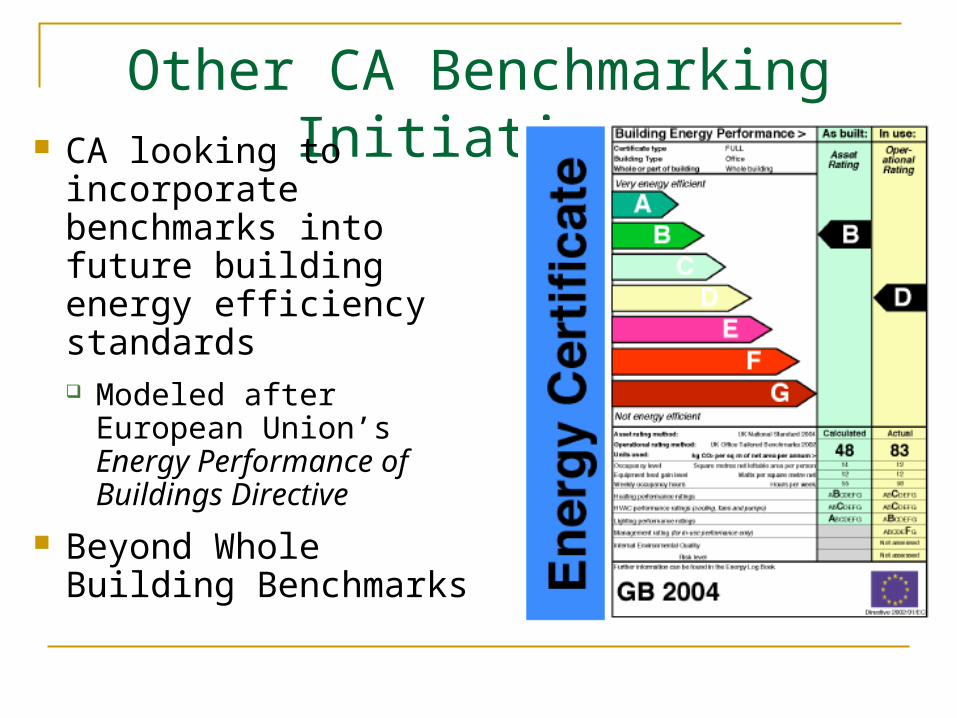
Other CA Benchmarking Initiatives CA looking to
incorporate benchmarks into future building energy efficiency standards Modeled after European
Union’s Energy Performance of Buildings Directive
Beyond Whole Building Benchmarks
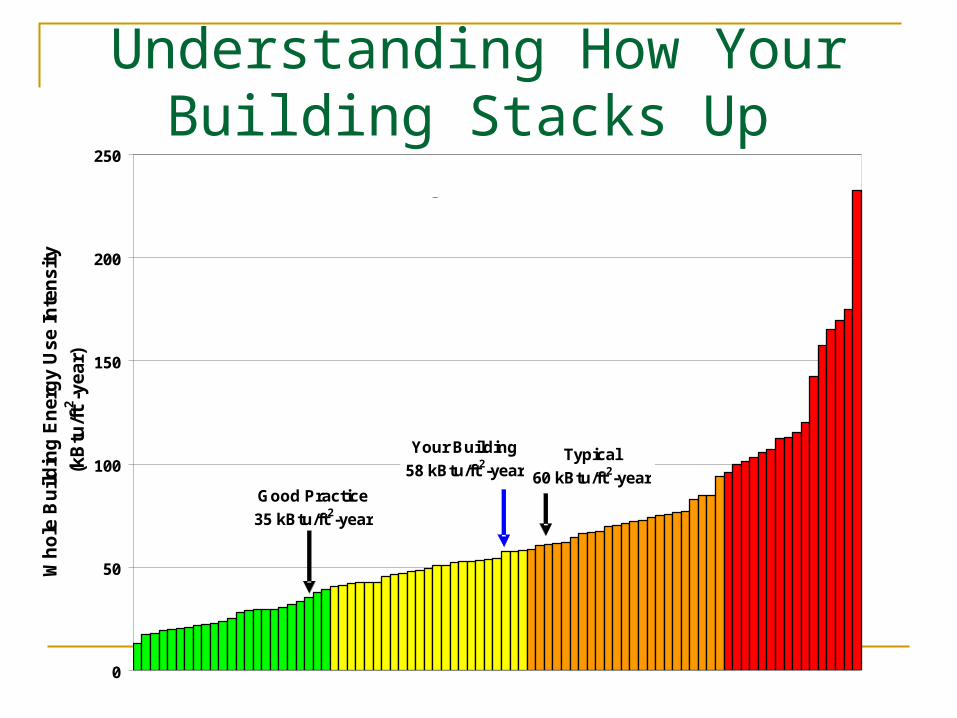
Understanding How Your Building Stacks Up
0
50
100
150
200
250
Wh
ole
Bu
ild
ing
En
erg
y U
se I
nte
nsi
ty
(kB
tu/f
t2 -yea
r)
California Office Buildings
Good Practice
35 kBtu/ft2-year
Typical
60 kBtu/ft2-year
Your Building
58 kBtu/ft2-year
Source: CEUS
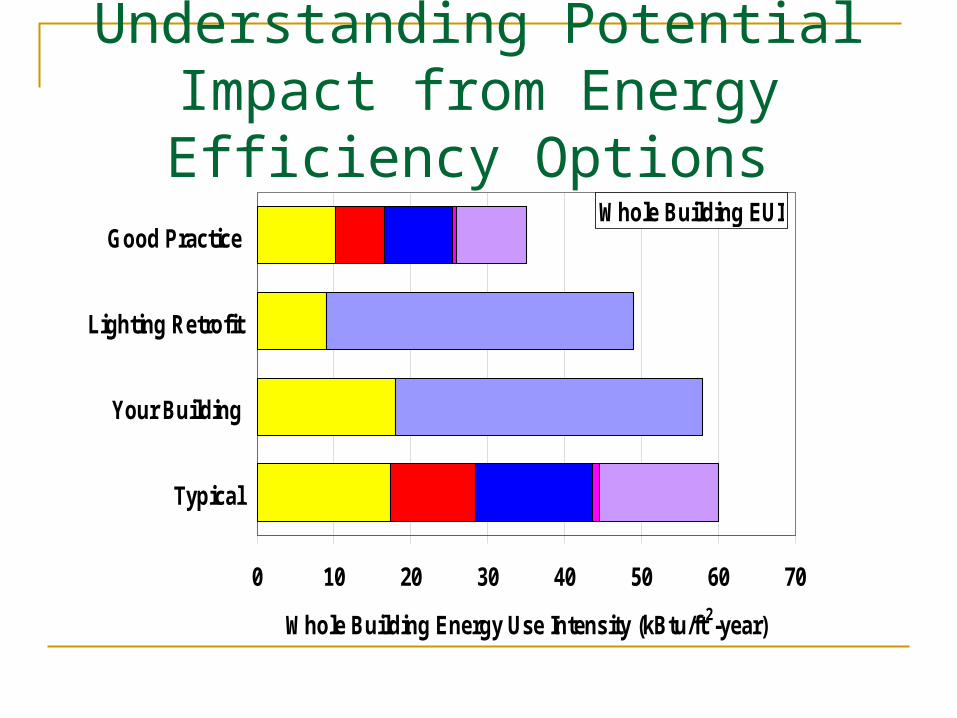
Understanding Potential Impact from Energy Efficiency Options
wb_light_retrofit
0 10 20 30 40 50 60 70
Typical
Your Building
Lighting Retrofit
Good Practice
Whole Building Energy Use Intensity (kBtu/ft2-year)
Whole Building EUI
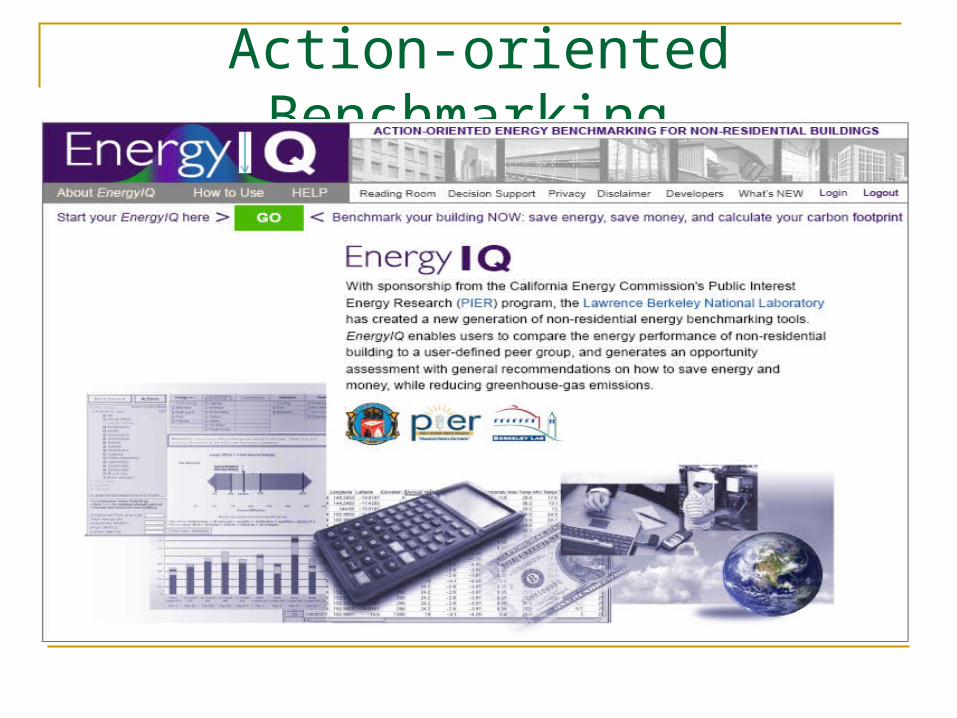
Action-oriented Benchmarking