Embed Size (px)
Citation preview
1
The Changing Nature of Labour Demand in the New Economy
and Skill-Biased Technology Change1
Stephen Machin*
November 2001 January 2002 - Revised
* Department of Economics, University College London and Centre for Economic Performance, London School of Economics
Abstract In this paper I consider recent patterns of change in the labour market, placing particular emphasis on the way in which labour demand has shifted in favour of workers with more skills and education. The paper describes recent trends and critically evaluates the role played by skill-biased technological change. It also presents some recent evidence on the relation between relative demand shifts and computerization in the UK and US, showing that the links between simple headcount measures of computer use at work and shifts in skill demand were moderated in the 1990s as compared to the 1980s. JEL Classification: J0. Keywords: labour market inequality; relative demand shifts; skill-biased technology change; computer usage.
1 This paper draws upon and builds on some of my existing joint work funded under the Leverhulme project ‘The Labour Market Consequences of Technological and Structural Change’. I am very grateful to my co-authors in this work (Eli Berman, John Bound, Thibaut Desjonqueres, John Van Reenen). I would like to thank my discussant at the September 2001 Conference, Steve Pischke, for a number of useful comments that have been incorporated in this paper and Francis Green for giving me access to some of the computer data I use.
2
1. Introduction There have been dramatic changes in the structure of employment in many countries in
recent years. A key aspect of this has been the upskilling of the workforce as employers
have shifted their demand requirements to employ more workers possessing higher
educational qualifications and with higher skill levels. A by now large academic
literature2 has documented the changing demand for skills in many countries and has
looked at the key factors underpinning the observed changes. A big emphasis has been
placed upon the role played by the kinds of new technologies used in modern workplaces
and how they have altered employers’ demand for skills. Some of this work uses
evocative phrases like ‘collapse in demand for the unskilled’, ‘the deteriorating position
of low skill workers’ and ‘rapidly rising wage gaps between the skilled and unskilled’, all
of which are in line with the notion that very large shifts have occurred.
In this paper I look at some of the evidence on changes in the demand for labour
in the new economy. I begin by reviewing the literature on the contribution made to
changing labour demand by new technologies, particularly those that are biased in favour
of relatively skilled workers. As will be made clear much of this work relies on fairly
coarse skill and technology definitions and much of the work concentrates on the 1980s.
So in the remainder of the paper I also present a small piece of new evidence looking at
the common nature of shifts in employer demand for skills in the same industries in
recent years in two countries, the United Kingdom and the United States.
2 See the review of Katz and Autor (1999) and the references contained therein.
3
2. Changes in Labour Demand and Skill-Biased Technology Change
The Facts
Many more skilled workers are now in employment than in the past, both in absolute
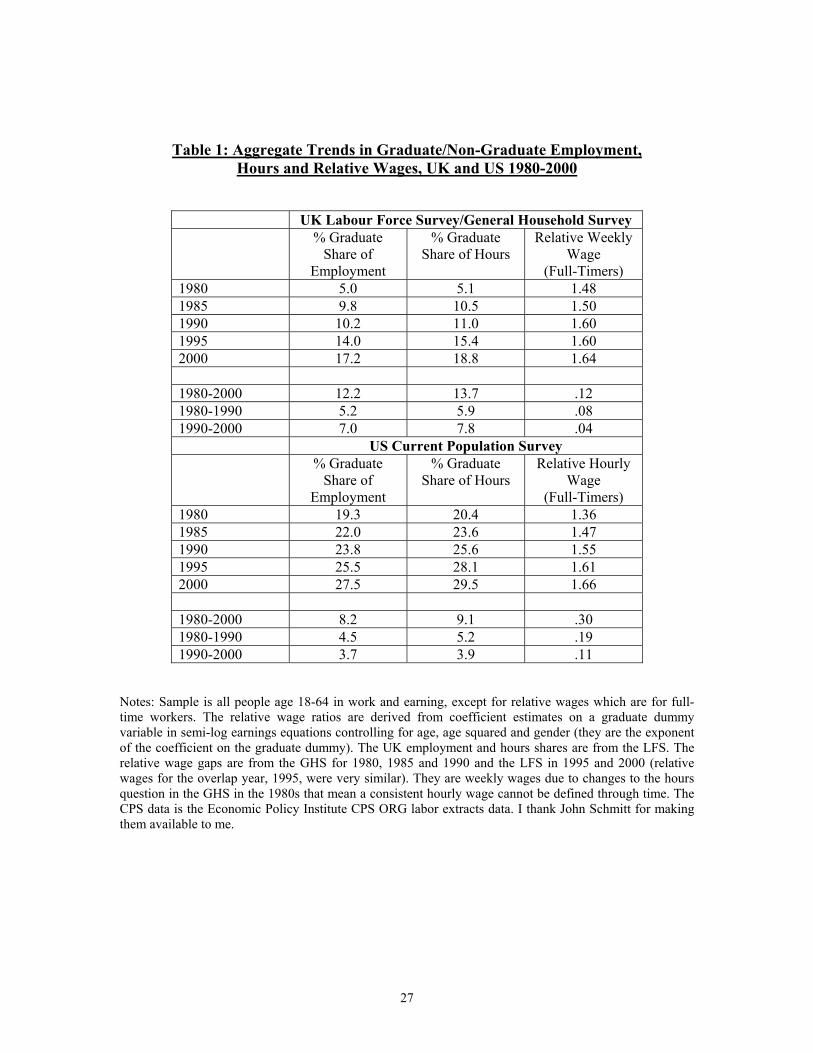
numbers and relative to their less skilled counterparts. The upper panel of Table 1 shows
the employment, hours and wage bill shares of workers with a degree in the UK and US
between 1980 and 2000. It also shows (for full-timers) the relative wage of graduates
versus non-graduates. The Table very clearly confirms rapid increases in the shares of the
relatively skilled group of workers (graduates) that have occurred in both countries.
What is also interesting, and by now well known, is that, despite their increased
numbers, the wages of more skilled workers have not fallen relative to the less skilled.3 In
fact the opposite has occurred and wage gaps between graduates and non-graduates rose
in both countries (albeit at a faster rate in the US). There are differences in the rate of
increase in the two decades considered as the bulk of the rise in wage gaps between the
two education groups occurs in the 1980s. The Table confirms that relative wages and
employment moved in tandem when one observes that the wage bill share of graduates
rises by more than the employment (or hours) shares.4 This is true of both decades for
both countries but it is clear that it is employment share changes driving the bulk of the
shifts in the 1990s.
In a simple relative demand and supply framework simultaneously rising relative
wages and employment suggest that demand must have risen at a faster rate than supply.
3 The Table only looks at education based measures of skill. Much the same emerges if one looks at broad occupational categories. 4 If the elasticity of substitution between skilled and unskilled workers (here graduates and non-graduates) is unity the wage bill share corresponds exactly to the skill demand. If it is not unity then one needs to factor in the relative wage change. More precisely the demand for skills, D, is defined as D = (WsNs/WN) + (Φ-1)(Ws/WU) where W is wages (s subscript denotes skilled, u subscript denotes unskilled, no subscript denotes total), N is employment and Φ is the elasticity of substitution between skilled and unskilled workers.
4
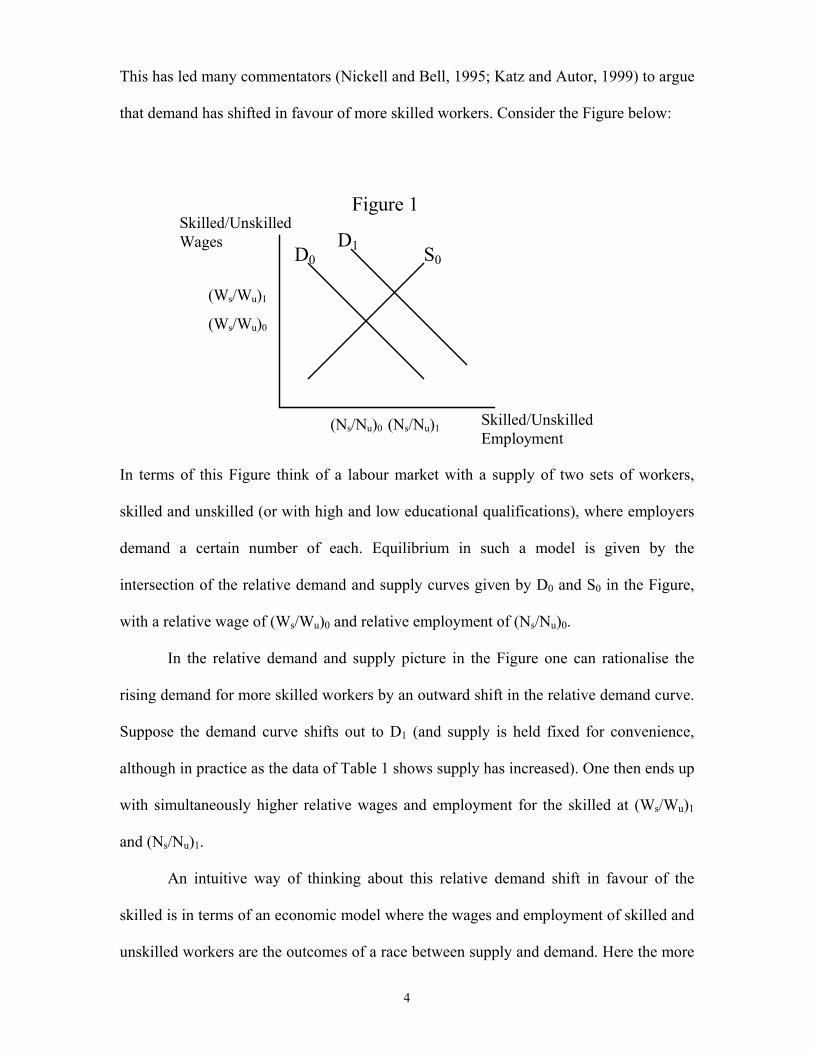
This has led many commentators (Nickell and Bell, 1995; Katz and Autor, 1999) to argue
that demand has shifted in favour of more skilled workers. Consider the Figure below:
In terms of this Figure think of a labour market with a supply of two sets of workers,
skilled and unskilled (or with high and low educational qualifications), where employers
demand a certain number of each. Equilibrium in such a model is given by the
intersection of the relative demand and supply curves given by D0 and S0 in the Figure,
with a relative wage of (Ws/Wu)0 and relative employment of (Ns/Nu)0.
In the relative demand and supply picture in the Figure one can rationalise the
rising demand for more skilled workers by an outward shift in the relative demand curve.
Suppose the demand curve shifts out to D1 (and supply is held fixed for convenience,
although in practice as the data of Table 1 shows supply has increased). One then ends up
with simultaneously higher relative wages and employment for the skilled at (Ws/Wu)1
and (Ns/Nu)1.
An intuitive way of thinking about this relative demand shift in favour of the
skilled is in terms of an economic model where the wages and employment of skilled and
unskilled workers are the outcomes of a race between supply and demand. Here the more
S0
D0 D1
Skilled/Unskilled Employment
Skilled/Unskilled Wages
(Ns/Nu)0 (Ns/Nu)1
(Ws/Wu)1
(Ws/Wu)0
Figure 1
5
general implication is that both demand and supply curves are shifting and the question is
which curve has moved the most. To have generated simultaneously higher wages and
employment for the skilled it seems that relative demand must have increased by more
than relative supply. Put alternatively, over the period of rising wage inequality, demand
has won the race and employers are prepared to pay workers with appropriate skills more
than less skilled workers, despite there being many more of them supplying their labour
(this argument is made in many places, for a recent exposition see Manning and
Manacorda, 1998).
Researchers have therefore tried to explore what lies behind the rise in wage
inequality by asking what might have caused relative demand to increase at a more rapid
rate than relative supply. Quite a large body of work has argued that the critical factor has
been the introduction of new technologies that are biased in favour of skilled workers. In
the next sub-section I review some of the evidence that has been brought forward to
support this hypothesis of skill-biased technology change.
Evidence on Skill-Biased Technology Change
The skill-biased technology change (sbtc) hypothesis is founded upon the notion
that employers’ demand for more skilled workers has been shaped by the kinds of new
technologies that are permeating into modern workplaces. The idea is that these new
technologies lead to higher productivity, but that only some workers possess the
necessary skills to use them. As such employers are prepared to increase the wages of the
skilled workforce who are complements with the new technology. But at the same time
less skilled workers do not possess enough skills to operate the new technologies and
their wages are lowered or they lose their jobs. As such the relative wages and
employment of the more skilled rise.
6
What evidence has been brought to bear on the sbtc hypothesis? There is a range
of evidence that exists, much of which is supportive of the idea that sbtc has altered the
structure of labour markets across the world:
1). The extent of skill upgrading differs for workplaces, firms and industries.
For the sbtc story to hold one clearly requires that shifts in skill demand be
variable, and that the variability is systematically related to the adoption and introduction
of new technologies. Because of this one can think that an important component of skill
demand shifts is that which is going on within particular workplace, firms and industries
(each of whom is likely to differ in the extent of their use of new technologies). Some
indirect evidence on sbtc has therefore been considered by looking at how much of the
shifts in relative demand are within workplaces or firms or industries rather than between
them.
Consider the familiar decomposition of aggregate changes in wage bill (or
employment) shares of skilled workers, ∆S, for j (=1,…N) industries as follows:
∑∑−−
+=j
jjj
jj S∆PP∆S∆S
where the first term is the within-industry component of skill upgrading and the second
term is the between-industry component (P is a measure of the relative size of industry j,
namely the share of industry j’s wage bill or employment in the aggregate wage bill or
employment, and a bar denotes a time mean).
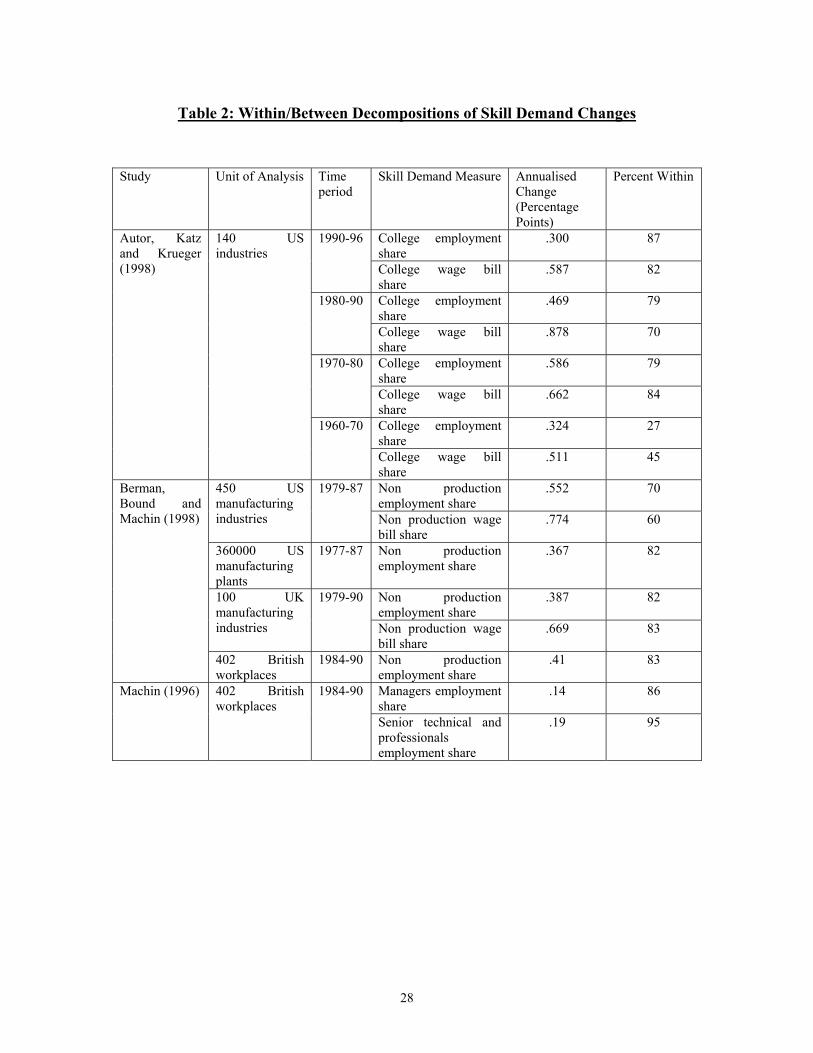
Table 2 reports evidence on this decomposition from various studies for the UK
and US at workplace and industry level. At both levels of aggregation it is clear that the
bulk of the observed (wage and employment) shifts towards the relatively skilled group5
5 Berman, Bound and Machin (1998) used the production/non-production distinction as it is the only comparison of ‘skill’ that is available for a reasonably large number of countries (their focus is very much on international comparisons). Indeed it should be noted that the definitions of ‘skill’ used in this literature are all rather coarse. But the measures used do seem to display similar trends. For example, the two most
7
occur within, rather than between industries (the only exception concerns the Autor,
Katz, Krueger, 1998, results for the 1960s). That the bulk of the shifts are seen within
industries (i.e. some industries have faster rates of skill upgrading than others) is
essentially a prerequisite for skill-biased technological change to even be a starter as a
possible explanation of the observed shifts in skill demand.
2). Skill demand has risen faster in more technologically intensive workplace, firms and
industries
Table 2 makes it very clear that the bulk of the upgrading that has happened has
occurred since the start of the 1970s has been within, rather than between, industries.
Identification of which industries have had faster rates of upgrading, and their
characteristics, can therefore shed light on what may underpin the improving relative
labour market of the more skilled. Indeed if one investigates which have the biggest
increases in relative wages and/or employment of more skilled workers it is clearly those
where technological change has been more important. For example, industries that spend
more money on Research and Development (R&D), have produced and used more
commercially significant innovations and have more workers who use computers have
seen faster skill upgrading.
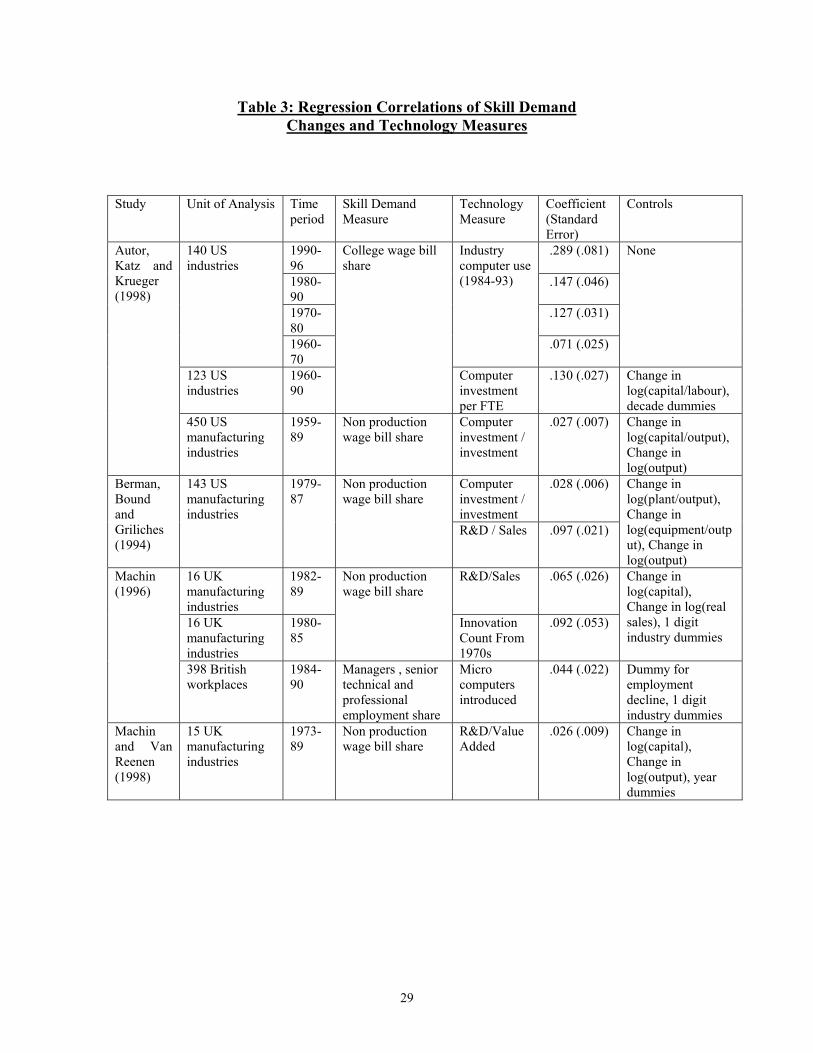
One (frequently used) way in which researchers have formally tested this is to
estimate cost share equations that relate changes in the skilled wage bill/employment
share in a given industry to observable measures of technology. A typical specification
(Berman, Bound and Griliches, 1994; Machin and Van Reenen, 1998), measured for
commonly used measures (forced upon researchers by data availability constraints) are to define non-production workers and workers with a college degree as relatively skilled and production workers and non-graduates as relatively unskilled. Trends in the wage and employment rates of non-production vis-à-vis production workers and graduates vis-à-vis non-graduates show very similar trends in the countries for which both measures are available.
8
industry j in year t, is:
∆(Skilled wage bill share)jt = α + β∆log(Capitaljt) + δ∆log(Outputjt) + φTECHjt + εjt
where the cost share equation can be generated from a translog cost function with two
labour inputs (skilled and unskilled) and assuming capital to be a quasi-fixed factor. The
focus in these equations then becomes whether the coefficient φ on the technology
indicator TECH is estimated to be positive.
Table 3 summarises the US and UK results. It is clear that for a range of time
periods, different levels of aggregation and different technology measures that there
exists a positive association between industry shifts in skilled wage bill or employment
shares and observable technology measures. Put differently it appears to be the
technologically more advanced industries where one has seen faster increases in the
relative demand for skilled workers. This has been taken in some quarters as evidence in
line with the hypothesis that skill-biased technology changes lie behind the demand shifts
favouring relatively skilled workers.
3). Workers receive a wage payoff for using computers at work
A more controversial area of research in this field asserts that individuals receive
a wage payoff for working with computers. If true this would, of course, be very much in
line with the sbtc hypothesis as it would imply computer users are rewarded for higher
productivity linked to their use of computers. The most well known paper here is
Krueger’s (1993) study of US Current Population Survey data where he augments
standard human capital earnings functions with a computer usage dummy. Even after
controlling for a range of human capital and job related characteristics he reports a
sizable wage premium for computer users. In his most detailed specification Krueger
9
reports a 15 percent wage premium in 1984 and this goes up, despite a coincident rise in
the number of computer users, to 18 percent by 1989.6
There are clearly some concerns with this, relating to possible reverse causation
and omitted variable bias. Indeed DiNardo and Pischke (1997) adopt a similar approach
replacing the computer use variable with a pencil use variable and uncover a wage
premium linked to pencil use. This seems suggestive of the idea that the computer use
variable may be proxying other unobserved characteristics of people not measured in the
survey data (and therefore not controlled in the regression equation). Nonetheless the
computer premia in Krueger’s analysis are sizable and one does require a large
unobserved heterogeneity (or endogeneity) bias to eliminate them. As such they have also
been cited in some quarters as evidence in line with the sbtc hypothesis.
4). Faster changes in skill demand are concentrated in similar industries in different
countries
Adopting a wider international perspective can shed further light on the validity of
the sbtc hypothesis. If one considers more countries then there is evidence that one sees
that bigger improvements in the labour market position of more skilled workers appear to
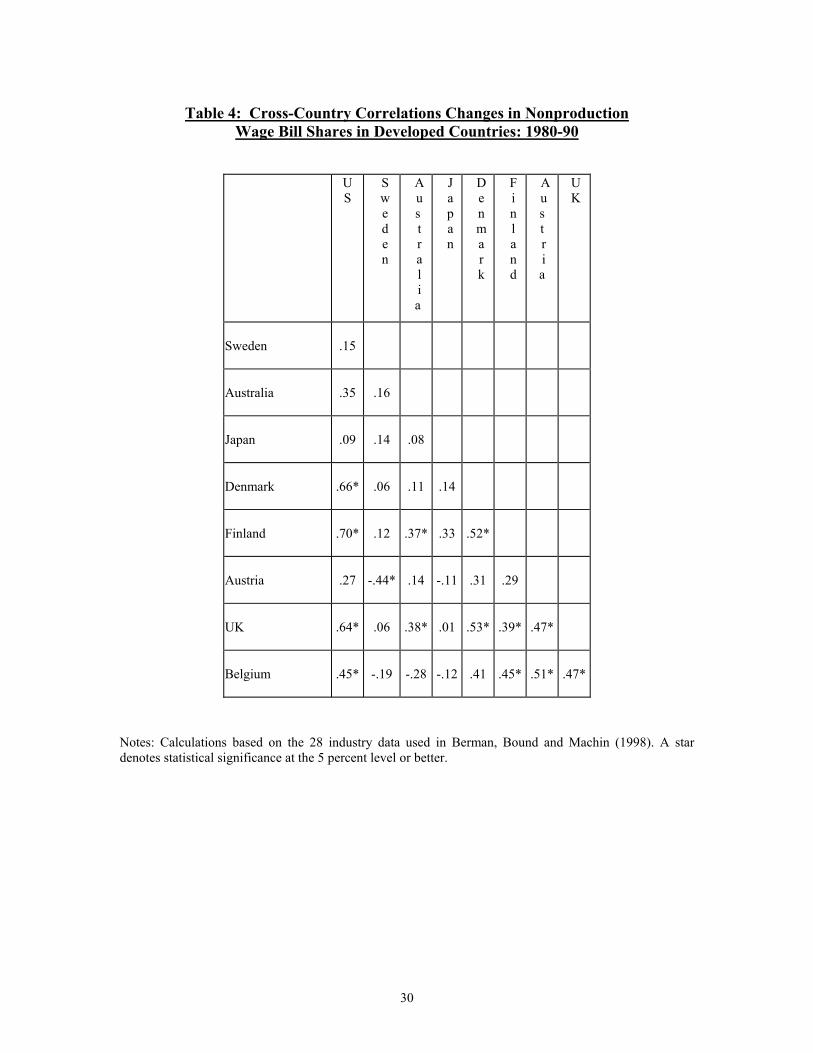
be concentrated in similar kinds of industries in many countries. Table 4 shows cross-
country correlations of changes in non-production wage bill shares in the 1980-90 time
period (from Berman and Machin, 2000). There is indeed a cross-country
correspondence: 31 out of 36 pairwise comparisons are positive and a sizable number of
the correlations are statistically significant (13 of them). Bearing in mind the possible
attenuation that looking at correlations of changes may bring about, this suggests that
skill upgrading has a tendency to be clustered in the same sorts of industries across
6 These are calculated as [exp(.140) – 1]X100 and [exp(.162)-1]X100 where .140 and .162 are the coefficients on the computer use dummy in a semi-log wage equation controlling for education, experience,
10
different countries. In this sense one might think that sbtc has been pervasive in changing
labour market outcomes across the developed world.
5). Skill upgrading is occurring in the more technology intensive countries in the developing world
As noted above, one also sees skill upgrading happening in the more
technologically advanced industries of some developing countries (Feliciano, 2001,
Hanson and Harrison, 1999, Robbins, 1995). This is entirely consistent with sbtc altering
relative wage and employment outcomes globally. Furthermore shifts in skill demand in
the developing world are correlated with the shifts seen in developed world and with
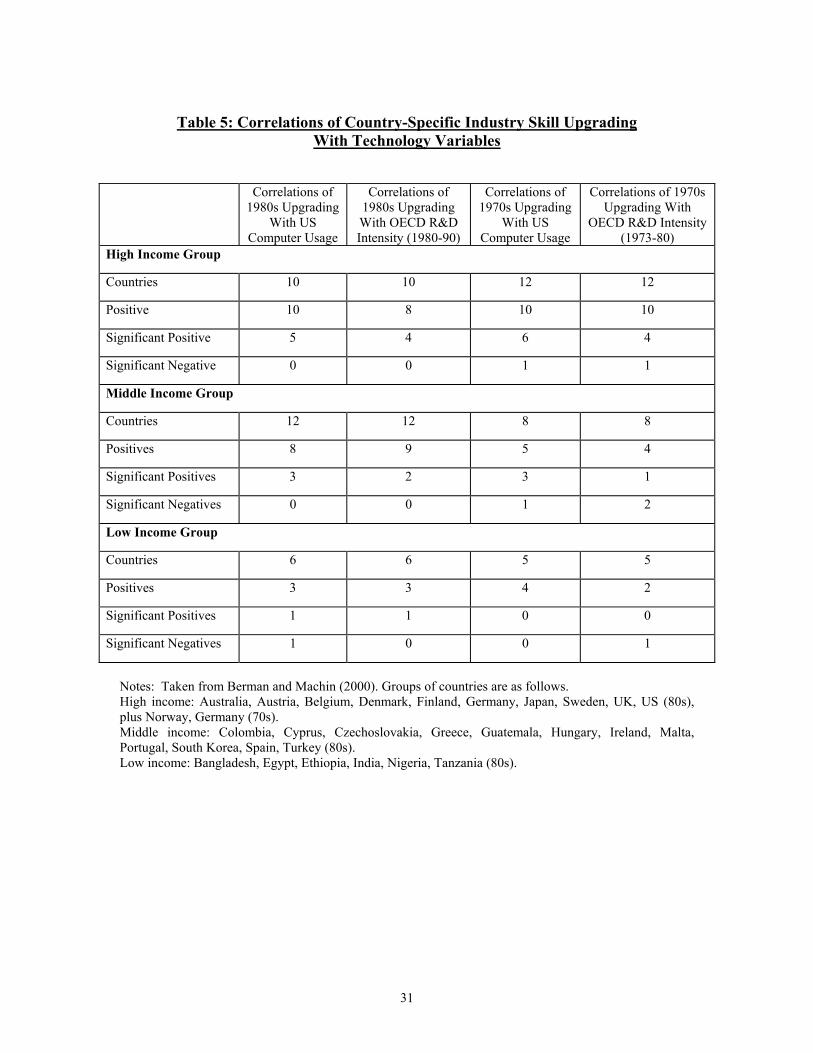
technology indicators from the developed world. Table 5 presents some evidence on this
(from Berman and Machin, 2000).
Table 5 reports correlations between industry changes in non-production wage bill
shares and US computer usage and OECD R&D intensity for those industries for
countries grouped by income levels. The pattern in the high income countries, given in
the upper panel of the Table, has already been noted above and shows a strong
correspondence between skill upgrading and the technology measures. But the pattern of
skill-biased technology transfer to the middle income countries is also strong. Indeed,
patterns of skill upgrading in middle income countries in the 1980s are well predicted by
the two indicators of recent skill-biased technological change in the OECD, indicating
skill-biased technology transfer into the middle income countries. There is weaker
evidence of skill-biased technology transfer altering the skill mix of employment in the
lower income countries where around half of the correlations with the technology
indicators are positive.
race, part-time job status, living a metropolitan area, gender, veteran status, whether married, whether a

11
Difficulties With the SBTC Evidence
Whilst a sizable body of evidence has been amassed there are, of course,
difficulties with the sbtc evidence. Some of these include the following:
a) Other hypotheses may be consistent with the evidence.
Of course it is well known that there has been a vigorous debate on whether
technology or trade matters most for rises in labour market inequality. The trade view is
predicated on the notion that there has been a widespread opening up of markets to
increased international competition and it is this that has damaged the labour market
prospects of low skill workers.
In its simplest form the argument goes as follows. Suppose there are two countries
that, to start with, do not trade with each other. Both have skilled and unskilled
workforces who respectively manufacture skill intensive and unskill intensive products.
One country, the high wage or developed country, has a comparative advantage in
making skill intensive products with skilled labour, the other country, the low wage or
developing country, has a comparative advantage in making unskill intensive products
with unskilled labour. Suppose these countries begin to trade with one another. Then (in
the standard Heckscher-Ohlin model of international trade) the developed country will
begin to import unskill intensive products from the low wage country as they are cheaper
to produce there. This will then lower the wages of unskilled workers in the developed
country. It will also be likely to reduce the employment of less skilled workers. As such
one sees the pattern of relative demand shifts discussed above. The relative wages and
employment of skilled workers rise because of the opening up to trade with the
developing country.
union member and broad occupation . Computer usage rises from 25 to 37 percent between 1984 and 1989.

12
This argument has lots of intuitive appeal. However, it has proven rather hard to
back it up with empirical evidence. This is for several reasons:
i) Whilst rising very fast in recent years (from very low initial levels) trade flows
with low wage developing countries do not seem big enough to be able to explain
the very large changes in labour market inequality seen in a number of developed
countries. Indeed, most trade is still done between developed countries
themselves.
ii) The industries that have seen the biggest increases in trade with the developing
world do not actually appear to be the ones that have seen bigger labour market
shifts in favour of more skilled workers.7
iii) As noted above, one sees skill upgrading (higher relative wages and employment
for more skilled groups of workers) going on in the developing world as well as
the developed world. This runs counter to the Heckscher-Ohlin model which
predicts that skill upgrading should increase in developed economies but that the
less skilled should do better in the developing world as demand for the products
they manufacture rises.
iv) Skill upgrading appears to be happening in industries that do not trade across
international borders (see the evidence in Desjonqueres, Machin and Van Reenen,
1999). Again, this runs counter to the Heckscher-Ohlin model. If one includes a
traded sector and a non-traded sector in the model the prediction would be that the
unskilled workers displaced from the traded sector by the opening up to trade
should find jobs (or lower the wages of less skilled workers or both) in the non-
traded sector. In reality one does not see this. In non-traded sectors (e.g. non-
7 Machin and Van Reenen (1998) enter various import competition measures into the kind of cost share equation described above and, unlike the technology measures, cannot pick up any correlation with these measures of trade.
13
manufacturing industries like retail trade) one has also seen skill upgrading
happening, and at similar rates to those in more traded sectors (like most
manufacturing industries).
All this means that the literature has found it hard to present evidence in line with
the notion that increased trade is the principal factor behind increased inequalities for the
skilled and less skilled.8 Of course, this does not mean that trade will not necessarily have
an impact on labour markets in future. It seems implausible to believe that globalisation
is unlikely to have serious ramifications for labour. Rather the bulk of the recent rises in
labour market inequality seen in the last couple of decades do not seem attributable to
rising competition with low wage countries.
b) A lot of sbtc evidence is based only on manufacturing and the 1980s.
A second worry with the sbtc evidence is tends to be rather limited in that it
covers short time periods and, perhaps more worrying is often confined to manufacturing
because of lack of good technology data outside of manufacturing, or because this is
forced on researchers who want to look at the same industries across countries. I present a
bit of evidence on this in the next Section but some work is careful to try and use as much
data as possible to look at longer time periods and at the whole economy. Autor, Katz and
Krueger (1998) do this most comprehensively for the US, using Census data back to 1960
and as much as possible not focusing on manufacturing alone. They seem to show
important shifts in the skill structure of employment that are related to technology and
that have occurred economy wide.
c) Issues of reverse causation
Much of the more direct evidence in this research area is based upon industry-
level regressions of changes in wage bill shares, or employment shares, of relatively
14
skilled workers on observable technology indicators. If, rather than technology inducing
shifts in employer demand, it is really that technological changes occur because of
employers employment strategies (e.g. employers do more R&D because they hire more
scientists) then one may be looking at the relationship the wrong way round. Related to
this, and as noted in the debate on wage returns to computer usage considered above, it
may be that the technology indicators are just proxying other unobservables that are
driving shifts in employment structure. When these kinds of arguments are made it does
make it rather difficult to give clear conclusions, but the varieties of different evidence
accumulated would suggest that such biases would have to be large to roll over the
observed correlations between skill upgrading and technology.9
d) Skilled demand shifts have been happening for years and it is longer run supply
changes that matter more.
This argument is a more subtle and probably more significant one, resting on the
notion that there has been a trend increase in demand for skills and movements in relative
wages around that trend shift are influenced by relative supply changes. For example, it is
well known that education supply rose very fast in the 1970s, at a slower rate in the
1980s, and then likely speeded up again in the 1990s in the UK and US. The wage gap
between educated and less educated workers fell in the 70s, rose sharply in the 80s and
probably rose but at a much slower rate in the 90s. This is entirely consistent with
constant demand shifts and the wage gaps being shifted by longer run, decade length
shifts in relative supply.
8 Although see an interesting paper, with a different angle, by Haskel and Slaughter (2001) who prefer to emphasise the potential for trade to affect sector bias, thereby looking more at between-sector shifts. 9 There is some evidence on this possibility but it is largely an unsatisfactory literature in that it either relies on ad hoc exclusion restrictions that enable researchers to treat technology as endogenous, or removes person specific fixed effects from wage equations based on longitudinal data to control for unobserved heterogeneity. This latter approach may be likely to remove too much of the variance in wages, some of which one is interested in for possible wage-computer use correlations. See the special issue of the Economics of Innovation and New Technology (1998, Volume 5) for several papers in this vein.
15
This argument clearly does warrant attention. Card and Lemieux (2001), for
example, present a cohort based analysis showing relative supply changes to be
important. However, at the time of writing, the importance of this in ruling out the sbtc
route is unclear and more work based on more recent data seems to be required.
Moreover, rising residual wage inequality (a feature of the recent inequality changes)
seems hard to square up with the patterns of supply changes. It does look as if the 1980s
was the period of rapid wage inequality changes in the UK and US, but it is evident that
one needs to delve deeper into wage and employment trends by skill at the micro-level,
and to develop plausible tests of whether demand shifts are indeed constant over time and
space to consider this in more detail.
3. A Bit of More Recent Evidence on Changes in the Skill Structure of Labour
Demand
In this section of the paper I consider some more recent evidence on the nature of
demand shifts for skilled and less skilled workers. The purpose of this is to try to see
whether technology driven shifts in employer demand have continued to affect
contemporary labour markets in similar ways to that described in earlier work.
Earlier Table 1 of the paper reported evidence on changes in the education
structure of US and UK labour markets between 1980 and 2000. Both show persistent
educational upgrading and, at the same time, rising relative wages for graduates leading
to increased wage bill shares for that group. There are, however, clear decade differences
in the rate of change of these labour market outcomes, with the faster changes in wage
structure occurring in the 80s.
In this Section of the paper I therefore consider some more recent evidence on
possible connections between skill upgrading and technological change. For the US I am
16
able to look at changes in the relationship between industry shifts in skill demand and
changes in technology across the two decades. For the UK I can look at changes seen in
the 1990s. I begin by discussing the data used to measure technological change and then
move to the US and UK empirical analyses in turn.
Changes in Technology Across Industries
The only data on technology measures that exists for similar definitions at a
reasonably disaggregated level across the whole economy for both countries are those
measuring computer usage in the workplace. These have obvious drawbacks (see some of
the discussion above and some more below) but I use them in what follows. Data on
computer usage at work is available for several years in the US in various supplements of
the monthly Current Population Survey. The first of these is in October 1984, then there
are further supplements of the same structure in October 1989 and 1993, and the most
recent is October 1997.10 I use all of these to look at correlations between skill upgrading
and changes in computer usage at work. Data for the UK is more sparse. There is data in
the British Social Attitudes Surveys of 1985 (for a very small sample) and in 1987 and
1990. There is also data in a more recent survey, the 1997 Skills Survey, and it is these
latter data I use in this paper.
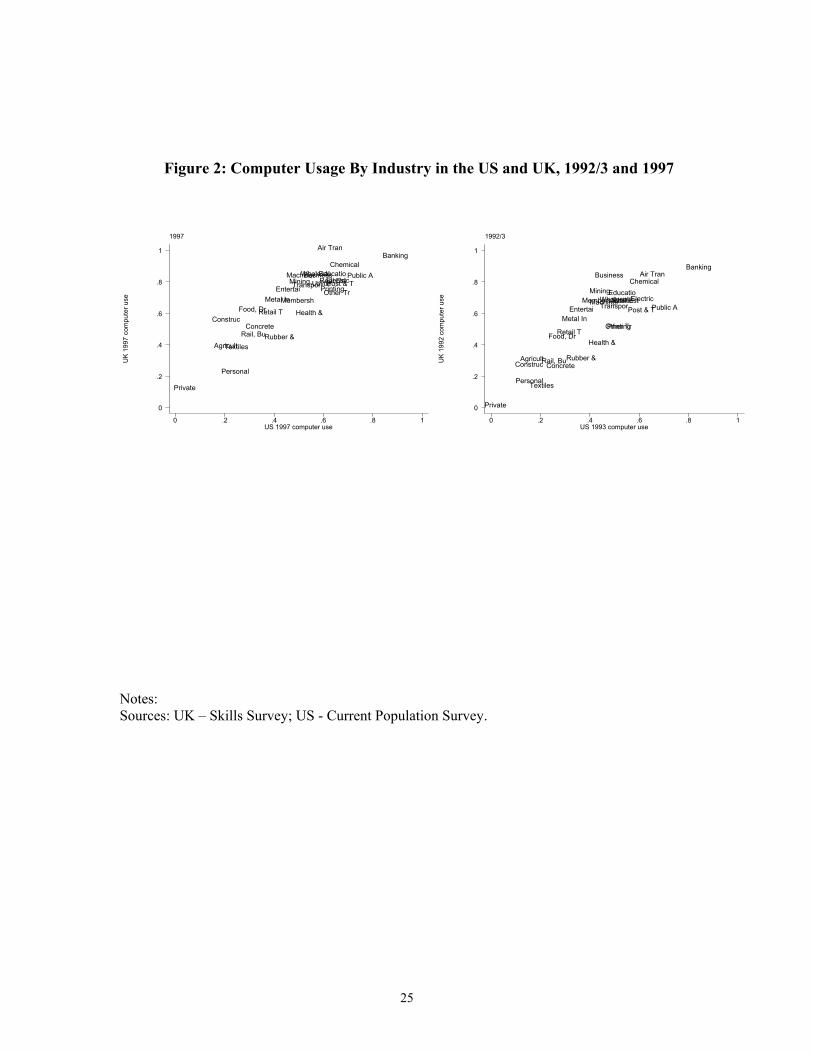
The first thing to notice is that there exists a very strong correspondence between
industry computer usage across the two countries. In other words, it is very much the
same industries that have more employees working with computers. Despite industry
definition differences across countries (which force me to aggregate industries), coupled
with small cell sizes in the UK data (which force further aggregation) I have put together
series on computer usage for the same 31 industries in the two countries in 1992/3 and in
1997. Figure 2 plots the US and UK computer usage variables, showing a strong
17
correlation between industrial computer usage across the countries (correlation
coefficients = .88 for 1997 and .86 for 1992/3).11
The implications of changing computer use can also be studied with the graphs in
Figure 2. It is fairly self evident that they show a similar structure across years, with
essentially an upward move to the right between 1992/3 and 1997 occurring. The neutral
nature of this shift, maintaining a similar cross-country computer structure, is borne out if
one considers the cross-time correlations in computer usage within countries. These
reveal strong persistence through time in both countries:
US: correlation coefficient between 1993 and 1997 computer usage = .98
UK: correlation coefficient between 1992 and 1997 computer usage = .96
What is also clear is that computer usage is at high levels in some industries,
which, certainly by 1997, are near saturation point and cannot rise much on the basis of
the percent using computers variable. This presents some concerns if, as we do below,
one wishes to relate skill upgrading to changes in industry computer usage, in the aim of
picking up shifts in skill demand related to increased computer usage.
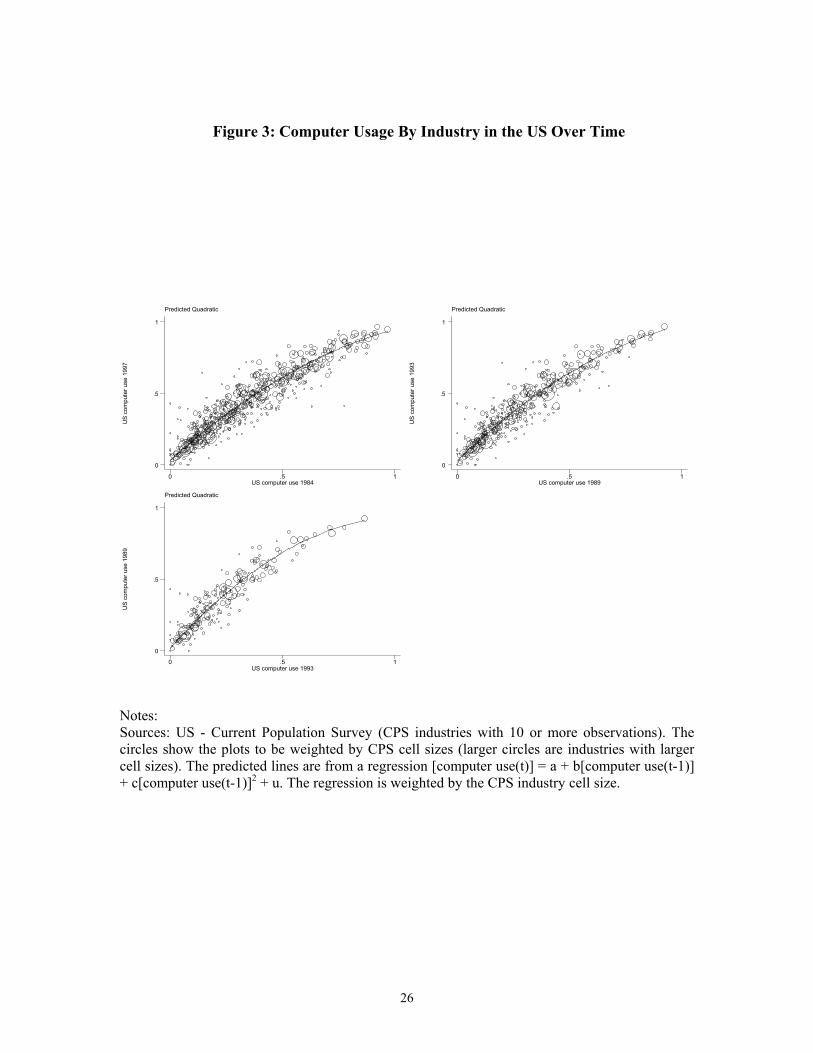
This concept of reaching saturation point can be further considered using the US
data which goes back further in time, and which can be considered at a more disaggregate
level. Using data on computer use in the four available years (1984, 1989, 1993 and
1997) Figure 3 plots computer use in a given year against computer use in the previous
time period for 220 US industries. It then fits a quadratic through the points.12 It becomes
clear that in the earlier time periods, computer usage grew fastest at the top end of the
computer use spectrum. By the 1993 to 1997 comparison, however, this is no longer true
10 There are two more up to date CPS supplements in the US (December 1998 and August 2000) but they do not ask about computer use at work and are very much more focused on internet usage at home. 11 The same is true if one plots the CPS data against the BSAS data for the same UK and US industries in 1989. 12 The quadratic functional form works well to illustrate the changing shape of the cross-time correlations.
18
and computer use appears to have reached its saturation point in already high computer
using industries. In fact one can also see this by considering regressions of the change in
computer usage on the initial level of computer use for the three time periods (regressions
weighted by industry employment, standard errors in parentheses, constant not reported):
Change in computer use, 1984-89 = (.005).039 Computer use, 1984
Change in computer use, 1989-93 = (.004).013 Computer use, 1989
Change in computer use, 1993-97 = (.003).011- Computer use, 1993
So the computer use pattern moves from faster computerization in already high computer
industries in the first two periods, to the opposite pattern between 1993 and 1997. This
tilt in the computer use growth profile will prove important to bear in mind when we look
at correlations between skill upgrading and computer use. I turn to this next.
US Industry Skill Upgrading and Computer Use at Work
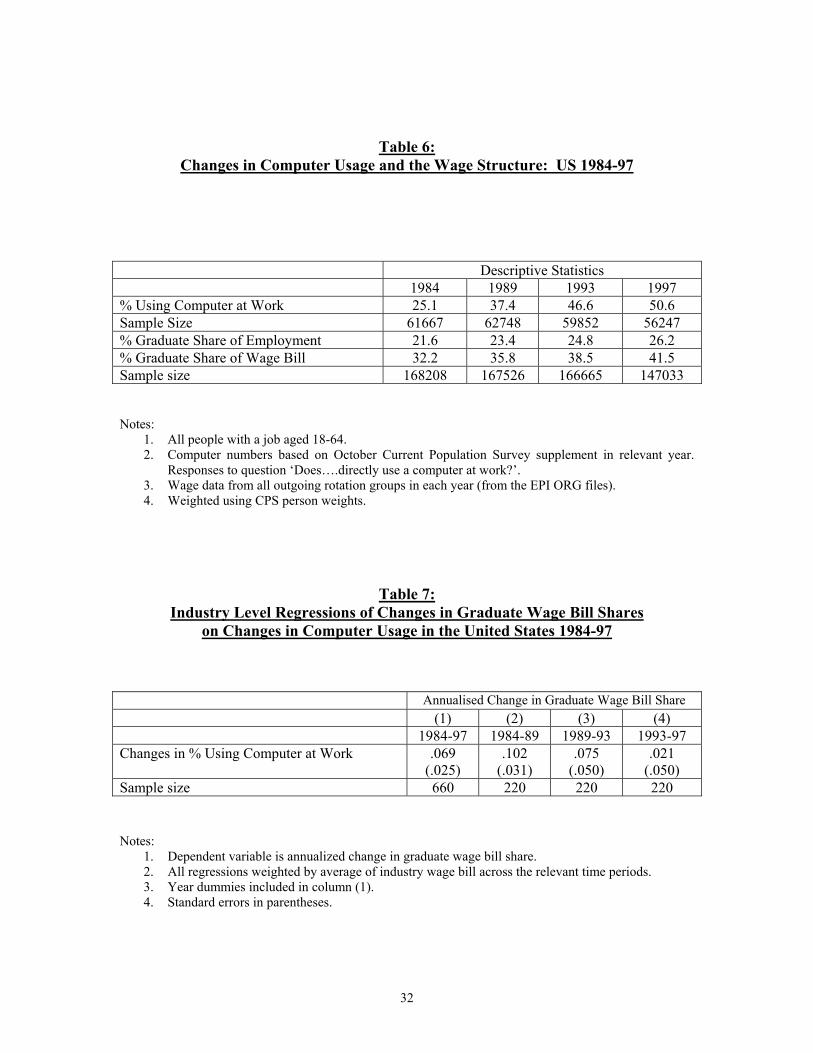
Table 6 reports some descriptive statistics on the data I use to consider the
connections between skill upgrading and increased computerization in the US. The Table
shows the percent using computers at work doubling from around 1 in 4 in 1984 to half
the workforce by 1997. The graduate shares of employment and the wage bill rise sharply
as well, as pointed out earlier for the decade differences considered in Table 1.
Table 7 reports estimated coefficients from regressions of changes in the graduate
wage bill share on increases in computer usage for the full 1984 to 1997 time period and
then for the three sub-periods of change for which I have data (1984-89, 1989-93 and
1993-97). The overall period regression shows a strong association between changes in
graduate wage bill shares and increased computer usage. The same is true of the first two
sub-periods, 1984-89 and 1989-93. However, the relationship disappears by the time we
get to the final column specification looking at the 1993-97 sub-period. It appears, as one
19
might have suspected from the pattern in Figure 3, that some technologically advanced
industries have reached saturation point in terms of computer diffusion and as such links
between skill upgrading and increased computerization, at least measured in head count
terms, have gone away. Of course, this does not mean that skill-biased technology change
no longer exerts an influence on the wage structure, but it may cast doubt on simple
headcount measures of computer use as picking up biased technology change in the
1990s.
UK Industry Skill Upgrading and Computer Use at Work
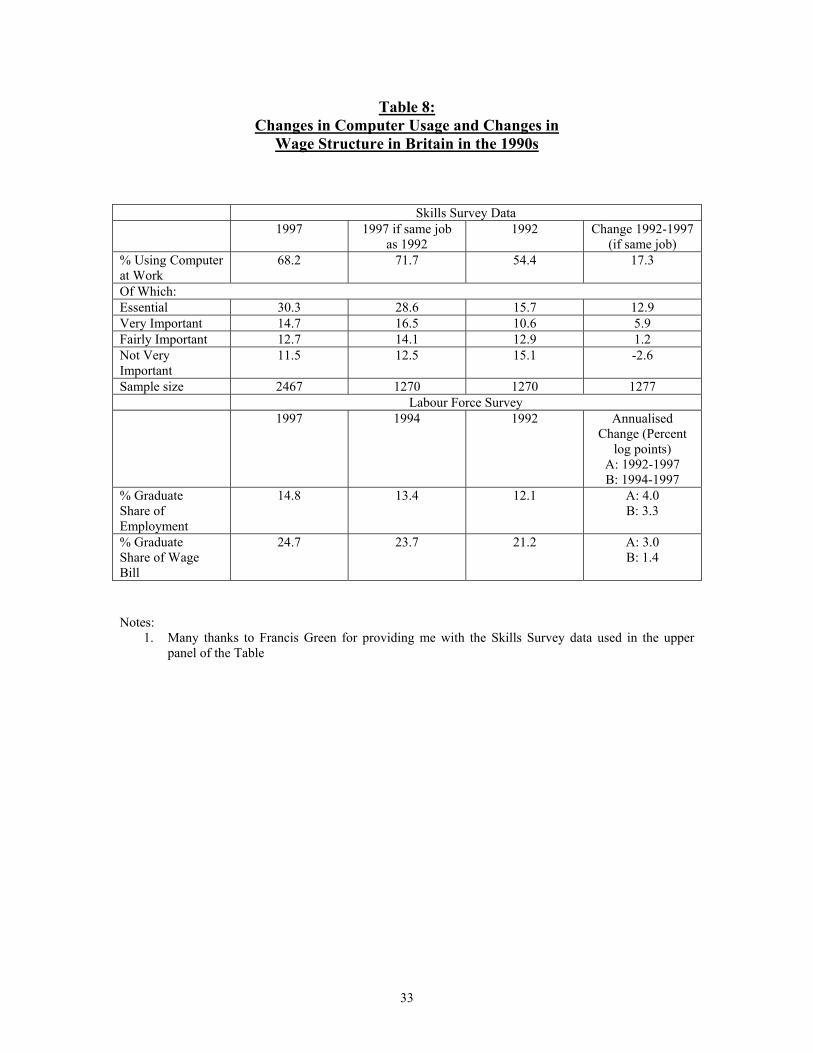
The UK situation in the 1990s is considered in Tables 8 and 9. The upper panel of
Table 8 shows some descriptive statistics on computer usage in 1992 and 1997 from the
1997 Skills Survey. Because the data come from a cross-section two 1992 numbers are
reported, those for all people and for people in the same job as in 1997. The latter should
more accurately pick up trends between 1992 and 1997. The first row of the Table clearly
confirms the increased computerization of jobs carrying on through the 1990s (this is also
emphasized in Green et al, 2001).
The Skills Survey also contains data on the importance of computers and the
Table reports the percent of computer users broken down into sub-groups indicating
whether computers are ‘essential’, ‘very important’, ‘fairly important’ or ‘not very
important’. This breakdown shows a rise over time in the first three categories, showing
computers to be more important by 1997, and a fall in the ‘not very important group’ by
1997. Such a distinction is useful in the earlier discussion about computer saturation of
the job market in some industries.
The lower panel of the Table reports numbers on the graduate share of
employment and the wage bill from the Labour Force Survey. Three years are reported
because of an industry definition change that occurs between 1992 and 1997. This means
20
I carry out the industry-level empirical analysis between 1994 and 1997 for a consistent
set of industries.
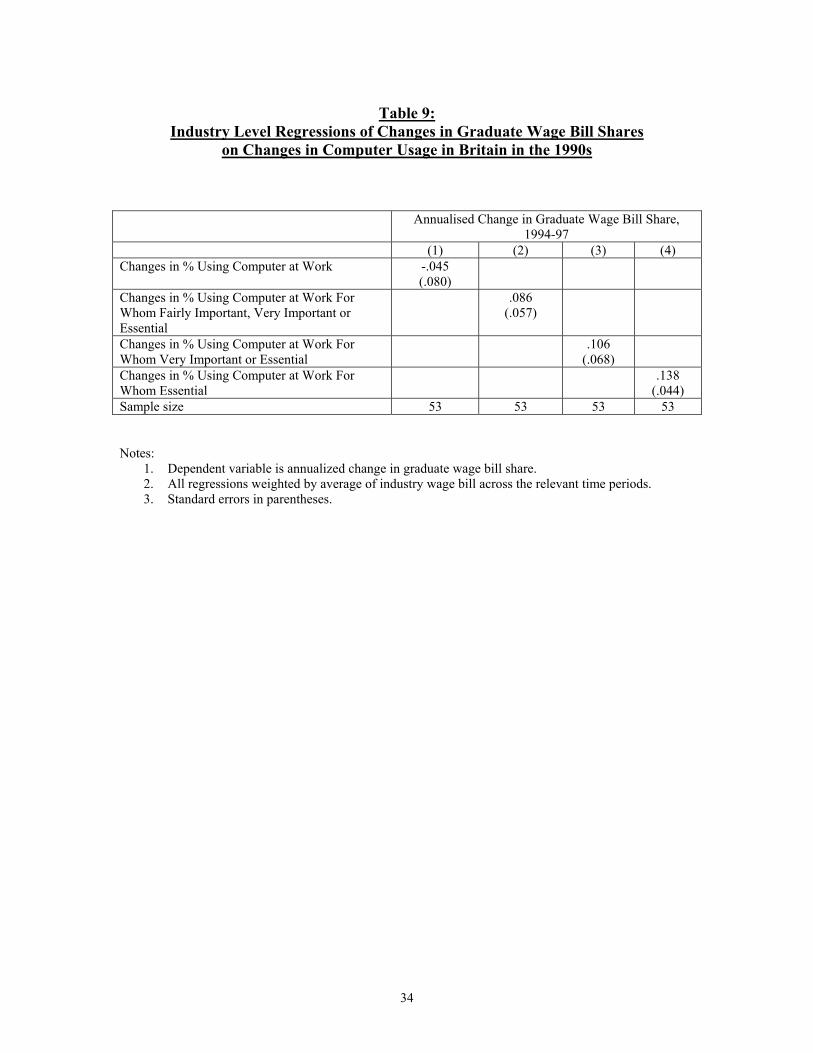
In Table 9 I therefore report a set of industry-level regressions of changes in
graduate wage bill shares in the UK in the 1990s on changes in the percent of people
using a computer at work (in column(1)) and then on changes in the importance of
computers (to varying degrees) amongst computer users in the remaining columns. The
first column shows no relation between 1990s skill upgrading and the increased use of
computers in the 1990s. This mirrors the insignificant US finding over the same period
and supports the notion that simple computer usage measures may not be particularly
good measures of technology change in the 1990s when computer use levels have
reached such high levels in technologically advanced industries.
However, once broken down by importance of the computer to the job I do find
industry skill upgrading to be associated with the increased importance of computers. As
one moves across the Table increasingly stringent measures of the importance of
computers are considered. In column (2) I regress changes in graduate wage bill shares
on changes in the percent of people using computers that are stated to be at least fairly
important to their job. In column (3) the cutoff is at very important for the job and in
column (4) is at essential for the job. The strongest positive (and statistically significant)
association is between changes in graduate wage bill shares and changes in the percent
using computers for whom the computer is essential to their job. It seems that relative
demand is still shifting in favour of skilled workers in industries where computers are
becoming more important, even in the 1990s.
21
4. Conclusions
In this paper I have considered existing evidence on the links between skill-biased
technology change and shifts in the employment and wage structure of modern labour
markets. As in many areas of empirical work in economics one can quibble with the large
body of evidence that has been amassed on the role played by technology in influencing
the skill structure of labour demand. There are clearly some worries linked to
measurement of the key variables, especially technology, and some data driven and
modeling drawbacks in the literature. Nonetheless it seems rather hard in my view to
totally debunk the sbtc hypothesis. The array of evidence that has been accumulated
seems to be in line with the notion that technological changes that have occurred in recent
years seem to be linked strongly to the relative demand shifts and movements in labour
market inequality seen in the labour markets of many countries.
Some more recent evidence on the question highlights some other interesting
observations. It now seems very clear that the 1980s was the decade of the recent past
where wage gaps between the skilled and less skilled widened out by most in the UK and
US. One can certainly uncover empirical associations showing that proxies for skill-
biased technology change were associated with the rapid rise in wage inequality seen in
that period. However, once one moves to the 1990s, with slower rising inequality, it
seems that the basic computer use at work variable that was strongly connected to the
1980s changes is not correlated with industry relative demand shifts of the 1990s. This is
most likely because the diffusion of computers at work has become so widespread that a
simple headcount measure no longer measures technological advances as computers have
become a standard work aid, especially in technologically advanced industries. Whether
this means computers are no longer skill-biased, or whether one requires more refined
data on the nature of skill-bias is not entirely clear (though see Autor, Levy and

22
Murnane’s, 2001, detailed discussion on the skill content of technical change). However I
do present some evidence that the latter may be important in that, at least in the UK,
industry patterns of increased skill demand are linked to the increased use of computers
that are deemed essential for the job.
23
References Autor, David, Lawrence F. Katz and Alan Krueger (1998) “Computing Inequality: Have
Computers Changed the Labor Market?”, Quarterly Journal of Economics, 113, 1169-1214.
Autor, David, Frank Levy and Richard Murnane (2001) “The Skill Content of Recent
Technological Change: An Empirical Exploration”, National Bureau of Economic Research Working Paper 8337.
Berman, Eli, John Bound and Zvi Griliches (1994)"Changes in the demand for skilled labor
within U.S. manufacturing industries: Evidence from the Annual Survey of Manufacturing", Quarterly Journal of Economics, 109, 367-98.
Berman, Eli, John Bound and Stephen Machin (1998) "Implications of Skill-Biased
Technological Change: International Evidence”, Quarterly Journal of Economics, 113, 1245-1280.
Berman, Eli and Stephen Machin (2000) “Skill-Biased Technology Transfer Around the World”,
Oxford Review of Economic Policy, 16(3), 12-22. Card, David and Thomas Lemieux (2001) “Can Falling Supply Explain the Rising Return to
College for Younger Men? A Cohort-Based Analysis", Quarterly Journal of Economics, 116, 705-46.
Desjonqueres, T., Machin, S. and Van Reenen, J. (1999) “Another Nail in the Coffin? Or Can the
Trade Based Explanation of Changing Skill Structures be Resurrected?”, Scandinavian Journal of Economics, 101, 533-54.
DiNardo, John and Steve Pischke (1997) “The Returns to Computer Use Revisited: Have Pencils
Changed the Wage Structure Too?” Quarterly Journal of Economics, 112, 291-303. Feliciano, Zadia (2001) "Workers and Trade Liberalization: The Impact of Trade Reforms in
Mexico on Wages and Employment," Industrial and Labor Relations Review, 55, 95-115. Green, Francis, Alan Felstead and Duncan Gallie (2001) "Computers and the changing skill-
intensity of jobs." Applied Economics, forthcoming. Hanson, Gordon H. and Ann Harrison (1999) "Trade, Technology, and Wage Inequality in
Mexico," Industrial and Labor Relations Review, 52, 271-288. Haskel, Jonathan and Matthew Slaughter (2001) “Trade, Technology and UK Wage Inequality”,
Economic Journal, 111, 163-87. Katz, Lawrence and David Autor (1999) “Changes in the Wage Structure and Earnings
Inequality”, in O. Ashenfelter and D. Card (eds.) Handbook of Labor Economics, North Holland
Krueger, Alan (1993) “How Computers Have Changed the Wage Structure: Evidence from
Microdata, 1984-1989", Quarterly Journal of Economics, 108, 33-60.
24
Machin, Stephen (1996) “Changes in the relative demand for skills in the UK labor market,” in Acquiring Skills: Market Failures, Their Symptoms and Policy Responses, Alison Booth and Dennis Snower (eds.), Cambridge: Cambridge University Press.
Machin, Stephen, and John Van Reenen (1998) "Technology and changes in skill structure:
Evidence from Seven OECD Countries," Quarterly Journal of Economics, 113, 1215-1244.
Manning, Alan and Marco Manacorda (1998) "Just Can't Get Enough: More on Skill-Biassed
Change and Labour Market Performance”, Center for Labor Economics Working Paper #7, Berkeley.
Nickell, Stephen and Brian Bell (1995) “The Collapse in Demand for the Unskilled and
Unemployment across the OECD”, Oxford Review of Economic Policy, 11, 40-62. Robbins, Donald J. (1995) "Trade, Trade Liberalization and Inequality in Latin America and
East Asia- Synthesis of Seven Country Studies." Harvard mimeo.
25
Figure 2: Computer Usage By Industry in the US and UK, 1992/3 and 1997
1997
UK
1997
com
pute
r use
US 1997 computer use0 .2 .4 .6 .8 1
0
.2
.4
.6
.8
1
Agricult
Mining,
ConstrucFood, Dr
Textiles
Printing
Chemical
Rubber &Concrete
Metal In
MachinerElectricTransporUtilitie
Wholesal
Retail T
Rail, Bu
Air Tran
Other TrPost & T
Banking
Real EstBusiness Public AEducatio
Health &
MembershEntertai
Personal
Private
1992/3
UK
1992
com
pute
r use
US 1993 computer use0 .2 .4 .6 .8 1
0
.2
.4
.6
.8
1
Agricult
Mining,
Construc
Food, Dr
Textiles
Printing
Chemical
Rubber &Concrete
Metal In
Machiner ElectricTranspor
UtilitieWholesal
Retail T
Rail, Bu
Air Tran
Other Tr
Post & T
Banking
Real Est
Business
Public A
Educatio
Health &
MembershEntertai
Personal
Private
Notes: Sources: UK – Skills Survey; US - Current Population Survey.
26
Figure 3: Computer Usage By Industry in the US Over Time
Predicted Quadratic
US
com
pute
r use
199
7
US computer use 19840 .5 1
0
.5
1
Predicted Quadratic
US
com
pute
r use
199
3
US computer use 19890 .5 1
0
.5
1
Predicted Quadratic
US
com
pute
r use
198
9
US computer use 19930 .5 1
0
.5
1
Notes: Sources: US - Current Population Survey (CPS industries with 10 or more observations). The circles show the plots to be weighted by CPS cell sizes (larger circles are industries with larger cell sizes). The predicted lines are from a regression [computer use(t)] = a + b[computer use(t-1)] + c[computer use(t-1)]2 + u. The regression is weighted by the CPS industry cell size.
27
Table 1: Aggregate Trends in Graduate/Non-Graduate Employment, Hours and Relative Wages, UK and US 1980-2000
UK Labour Force Survey/General Household Survey % Graduate
Share of Employment
% Graduate Share of Hours
Relative Weekly Wage
(Full-Timers) 1980 5.0 5.1 1.48 1985 9.8 10.5 1.50 1990 10.2 11.0 1.60 1995 14.0 15.4 1.60 2000 17.2 18.8 1.64 1980-2000 12.2 13.7 .12 1980-1990 5.2 5.9 .08 1990-2000 7.0 7.8 .04
US Current Population Survey % Graduate
Share of Employment
% Graduate Share of Hours
Relative Hourly Wage
(Full-Timers) 1980 19.3 20.4 1.36 1985 22.0 23.6 1.47 1990 23.8 25.6 1.55 1995 25.5 28.1 1.61 2000 27.5 29.5 1.66 1980-2000 8.2 9.1 .30 1980-1990 4.5 5.2 .19 1990-2000 3.7 3.9 .11
Notes: Sample is all people age 18-64 in work and earning, except for relative wages which are for full-time workers. The relative wage ratios are derived from coefficient estimates on a graduate dummy variable in semi-log earnings equations controlling for age, age squared and gender (they are the exponent of the coefficient on the graduate dummy). The UK employment and hours shares are from the LFS. The relative wage gaps are from the GHS for 1980, 1985 and 1990 and the LFS in 1995 and 2000 (relative wages for the overlap year, 1995, were very similar). They are weekly wages due to changes to the hours question in the GHS in the 1980s that mean a consistent hourly wage cannot be defined through time. The CPS data is the Economic Policy Institute CPS ORG labor extracts data. I thank John Schmitt for making them available to me.
28
Table 2: Within/Between Decompositions of Skill Demand Changes Study Unit of Analysis Time
period Skill Demand Measure Annualised
Change (Percentage Points)
Percent Within
College employment share
.300 87 1990-96
College wage bill share
.587 82
College employment share
.469 79 1980-90
College wage bill share
.878 70
College employment share
.586 79 1970-80
College wage bill share
.662 84
College employment share
.324 27
Autor, Katz and Krueger (1998)
140 US industries
1960-70
College wage bill share
.511 45
Non production employment share
.552 70 450 US manufacturing industries
1979-87
Non production wage bill share
.774 60
360000 US manufacturing plants
1977-87 Non production employment share
.367 82
Non production employment share
.387 82 100 UK manufacturing industries
1979-90
Non production wage bill share
.669 83
Berman, Bound and Machin (1998)
402 British workplaces
1984-90 Non production employment share
.41 83
Managers employment share
.14 86 Machin (1996) 402 British workplaces
1984-90
Senior technical and professionals employment share
.19 95
29
Table 3: Regression Correlations of Skill Demand Changes and Technology Measures
Study Unit of Analysis Time period
Skill Demand Measure
Technology Measure
Coefficient (Standard Error)
Controls
1990-96
.289 (.081)
1980-90
.147 (.046)
1970-80
.127 (.031)
140 US industries
1960-70
Industry computer use (1984-93)
.071 (.025)
None
123 US industries
1960-90
College wage bill share
Computer investment per FTE
.130 (.027) Change in log(capital/labour), decade dummies
Autor, Katz and Krueger (1998)
450 US manufacturing industries
1959-89
Non production wage bill share
Computer investment / investment
.027 (.007) Change in log(capital/output), Change in log(output)
Computer investment / investment
.028 (.006) Berman, Bound and Griliches (1994)
143 US manufacturing industries
1979-87
Non production wage bill share
R&D / Sales .097 (.021)
Change in log(plant/output), Change in log(equipment/output), Change in log(output)
16 UK manufacturing industries
1982-89
R&D/Sales .065 (.026)
16 UK manufacturing industries
1980-85
Non production wage bill share
Innovation Count From 1970s
.092 (.053)
Change in log(capital), Change in log(real sales), 1 digit industry dummies
Machin (1996)
398 British workplaces
1984-90
Managers , senior technical and professional employment share
Micro computers introduced
.044 (.022) Dummy for employment decline, 1 digit industry dummies
Machin and Van Reenen (1998)
15 UK manufacturing industries
1973-89
Non production wage bill share
R&D/Value Added
.026 (.009) Change in log(capital), Change in log(output), year dummies
30
Table 4: Cross-Country Correlations Changes in Nonproduction Wage Bill Shares in Developed Countries: 1980-90
U S
S w e d e n
A u s t r a l i a
J a p a n
D e n m a r k
F i n l a n d
A u s t r i a
U K
Sweden
.15
Australia
.35
.16
Japan
.09
.14
.08
Denmark
.66*
.06
.11
.14
Finland
.70*
.12
.37*
.33
.52*
Austria
.27
-.44*
.14
-.11
.31
.29
UK
.64*
.06
.38*
.01
.53*
.39*
.47*
Belgium
.45*
-.19
-.28
-.12
.41
.45*
.51*
.47*
Notes: Calculations based on the 28 industry data used in Berman, Bound and Machin (1998). A star denotes statistical significance at the 5 percent level or better.
31
Table 5: Correlations of Country-Specific Industry Skill Upgrading With Technology Variables
Correlations of 1980s Upgrading
With US Computer Usage
Correlations of 1980s Upgrading With OECD R&D Intensity (1980-90)
Correlations of 1970s Upgrading
With US Computer Usage
Correlations of 1970s Upgrading With
OECD R&D Intensity (1973-80)
High Income Group
Countries 10 10 12 12
Positive 10 8 10 10
Significant Positive 5 4 6 4
Significant Negative 0 0 1 1
Middle Income Group
Countries 12 12 8 8
Positives 8 9 5 4
Significant Positives 3 2 3 1
Significant Negatives 0 0 1 2
Low Income Group
Countries 6 6 5 5
Positives 3 3 4 2
Significant Positives 1 1 0 0
Significant Negatives 1 0 0 1
Notes: Taken from Berman and Machin (2000). Groups of countries are as follows. High income: Australia, Austria, Belgium, Denmark, Finland, Germany, Japan, Sweden, UK, US (80s), plus Norway, Germany (70s). Middle income: Colombia, Cyprus, Czechoslovakia, Greece, Guatemala, Hungary, Ireland, Malta, Portugal, South Korea, Spain, Turkey (80s). Low income: Bangladesh, Egypt, Ethiopia, India, Nigeria, Tanzania (80s).
32
Table 6: Changes in Computer Usage and the Wage Structure: US 1984-97
Descriptive Statistics 1984 1989 1993 1997 % Using Computer at Work 25.1 37.4 46.6 50.6 Sample Size 61667 62748 59852 56247 % Graduate Share of Employment 21.6 23.4 24.8 26.2 % Graduate Share of Wage Bill 32.2 35.8 38.5 41.5 Sample size 168208 167526 166665 147033 Notes:
1. All people with a job aged 18-64. 2. Computer numbers based on October Current Population Survey supplement in relevant year.
Responses to question ‘Does….directly use a computer at work?’. 3. Wage data from all outgoing rotation groups in each year (from the EPI ORG files). 4. Weighted using CPS person weights.
Table 7: Industry Level Regressions of Changes in Graduate Wage Bill Shares
on Changes in Computer Usage in the United States 1984-97
Annualised Change in Graduate Wage Bill Share (1) (2) (3) (4) 1984-97 1984-89 1989-93 1993-97
Changes in % Using Computer at Work .069 (.025)
.102 (.031)
.075 (.050)
.021 (.050)
Sample size 660 220 220 220
Notes:
1. Dependent variable is annualized change in graduate wage bill share. 2. All regressions weighted by average of industry wage bill across the relevant time periods. 3. Year dummies included in column (1). 4. Standard errors in parentheses.
33
Table 8: Changes in Computer Usage and Changes in
Wage Structure in Britain in the 1990s Skills Survey Data 1997 1997 if same job
as 1992 1992 Change 1992-1997
(if same job) % Using Computer at Work
68.2 71.7 54.4 17.3
Of Which: Essential 30.3 28.6 15.7 12.9 Very Important 14.7 16.5 10.6 5.9 Fairly Important 12.7 14.1 12.9 1.2 Not Very Important
11.5 12.5 15.1 -2.6
Sample size 2467 1270 1270 1277 Labour Force Survey 1997 1994 1992 Annualised
Change (Percent log points)
A: 1992-1997 B: 1994-1997
% Graduate Share of Employment
14.8 13.4 12.1 A: 4.0 B: 3.3
% Graduate Share of Wage Bill
24.7 23.7 21.2 A: 3.0 B: 1.4
Notes:
1. Many thanks to Francis Green for providing me with the Skills Survey data used in the upper panel of the Table
34
Table 9: Industry Level Regressions of Changes in Graduate Wage Bill Shares
on Changes in Computer Usage in Britain in the 1990s Annualised Change in Graduate Wage Bill Share,
1994-97 (1) (2) (3) (4) Changes in % Using Computer at Work -.045
(.080)
Changes in % Using Computer at Work For Whom Fairly Important, Very Important or Essential
.086 (.057)
Changes in % Using Computer at Work For Whom Very Important or Essential
.106 (.068)
Changes in % Using Computer at Work For Whom Essential
.138 (.044)
Sample size 53 53 53 53 Notes:
1. Dependent variable is annualized change in graduate wage bill share. 2. All regressions weighted by average of industry wage bill across the relevant time periods. 3. Standard errors in parentheses.