Embed Size (px)
Citation preview

�
EDUCATION, TRAINING AND DEMAND FOR LABOUR IN FINLAND BY 2020
Ilpo Hanhijoki, Jukka Katajisto, Matti Kimari, Hannele Savioja
2
© Finnish National Board of Education and the authors
Layout and figures: Kirsti Pohjapelto
Translation and interpretation service: Intertext Ok, Katja Ranta-aho
ISBN 978-952-13-4108-3 (paperback)ISBN 978-952-13-4109-0 (pdf) Edita Prima Oy, Helsinki 2009
F I N L A N D
HELS INKI
Population 5.3millionSurfacearea 338,000km2
Officiallanguages Finnish(91.2%)andSwedish(5.5%) SaamilanguageintheSaamidomicileinLaplandReligion Lutheran(82%) Orthodox(1%) Other(1%) Unaffiliated(16%)
Source:StatisticsFinland,2008.
FINLAND IN BRIEF

�
BACKGROUND ...............................................................................................4 Objective of the anticipation .........................................................................4 Organisation of anticipation..........................................................................4 The Finnish education system and steering and regulation of provision ...............7 The Finnish education system .................................................................7 Steering and regulation of provision .......................................................9 Anticipation method ...................................................................................11
DEMAND FOR NEW LABOUR UP UNTIL 2020 .................................................17 Demand for labour by industry between 2005 and 2020 ...............................17 Basic scenario ....................................................................................18 Target scenario ..................................................................................18 Demand for labour by industry .............................................................18 Demand for labour by occupational group between 2005 and 2020 ..............20 Basic and target scenarios for developments in the occupational structure ................................................................21 Change in the occupational structure between 2005 and 2020 ...............21 Natural wastage from the employed labour force between 2005 and 2020 .....25 Job openings between 2005 and 2020 .......................................................29
INTAKE TARGETS ...........................................................................................32
Humanities and Education ..........................................................................34 Culture ....................................................................................................34 Social Sciences, Business and Administration ................................................35 Natural Sciences .......................................................................................36 Technology, Communications and Transport ..................................................37 Natural Resources and the Environment ........................................................38 Social Services, Health and Sports ...............................................................39 Tourism, Catering and Domestic Services ......................................................40
USE OF ANTICIPATION INFORMATION AND DEVELOPMENT OF ANTICIPATION .................................................................41
LITERATURE ON ANTICIPATION OF LABOUR AND EDUCATIONAL NEEDS AND THE FINNISH EDUCATION SySTEM ......................43 CONTACT INFORMATION .............................................................................45
APPENDICES 1–6 ..........................................................................................46
CONTENTS

�
BACKGROUND
Objective of the anticipation
Anticipation of educational needs aims to consolidate the knowledge base relevant to decisions on educational provision, thus promoting the balance between sup-ply and demand on the labour market. Anticipation provides information on quantitative needs for vocationally/professionally oriented education and training, which are based on long-term employment forecasts. The focus is on anticipating demand for labour over a 15-year period and using the results to derive educa-tional needs. This anticipation concerns vocationally/professionally oriented edu-cation and training intended for young people – i.e. upper secondary vocational education and training (VET), polytechnic education and university education
– which mainly lasts from 3 to 8 years, depending on the level of education. Edu-cational needs have been expressed in terms of intake needs. This publication is an abbreviated version of a wider-reaching Finnish-language report entitled Koulutus ja työvoiman kysyntä 2020 (‘Education, training and demand for labour by 2020’) produced by the Finnish National Board of Education.
This report deals with developments in demand for labour over the period from 2005 to 2020 and, based on these developments, provides forecasts of quantitative educational needs in the first half of the 2010’s. Long-term demand for labour is examined from different perspectives: in terms of changes in labour demand by industry, new job openings and opportunities compensating for natural wastage by occupational group (labour market demand) and in terms of intake needs ad-justed according to the average young (16–21) age group. In parallel with national anticipation work, all 19 regions of Finland have also anticipated regional labour and educational needs in a consistent manner.
Organisation of anticipation
The Finnish National Board of Education (FNBE) implemented a development project of anticipation of demand for labour and educational needs between 1996 and 1999, with funding from the European Social Fund and the Finnish Minis-
�
try of Education. The project further developed an anticipation method already in use in Finland, which is geared towards anticipating long-term educational needs (about 15 years) based on the needs of the labour market. At the same time, the project created a calculation model (named Mitenna) suitable for anticipa-tion purposes. Following this development work, the method was put to use in national and regional anticipation of demand for labour and educational needs, while also launching co-operation with different ministries. Key collaboration partners include the Ministry of Education, the Ministry of Employment and the Economy (formerly the Ministry of Labour) and Statistics Finland.
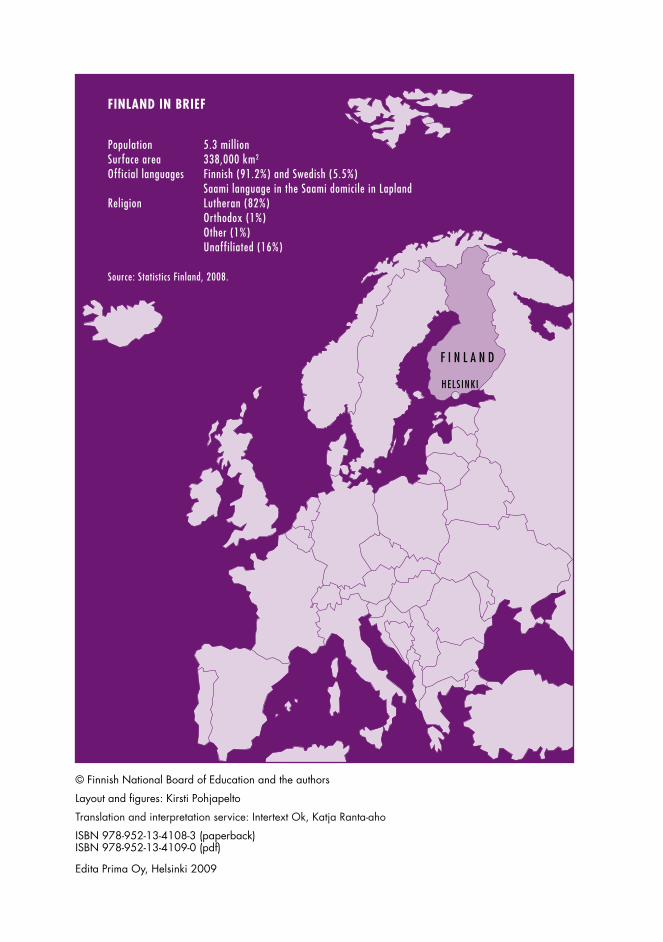
In late 2005, the Ministry of Education launched an anticipation project with a view to producing anticipation data for the purpose of preparing the Devel-opment Plan for Education and Research for 2007–2012 (Figure 1). The aim was to anticipate national and regional intake targets for 2012 by level, field and subfield of education. In addition, anticipation also involved intake targets for Swedish-language provision. The national and regional anticipation projects were completed in 2007. The results of the nationwide anticipation work are reported in this publication.
The national anticipation work was carried out by the Finnish National Board of Education. The then Ministry of Labour produced national industry forecasts and their regional equivalents in co-operation with the regions. The Finnish National Board of Education supported regional anticipation by providing instructions, adapting statistical data required in anticipation for the 19 regions and producing calculations (based on the Mitenna model) for the regions based on forecasts of demand for labour prepared by the regions.
�
Ministry of the Interior
Finnish National Board of Education Statistics Finland
The Ministry of Education Committee on Educational Provision
2012
Co-ordinator
Labour market organisations
Education providers and educational institutions
Regional Council
Employment and Economic Development
Centre Supply of and demand for labour
Proposals for educa-tional needs
Labour demand forecasts
Calculation results
Industry forecasts
Dialogue on results
Assignment and instructions
Calculation results
State Provincial Office
Figure �. Organisation of anticipation.
Ministry of Labour
�
The Finnish education system and steering and regulation of provision
The Finnish education system
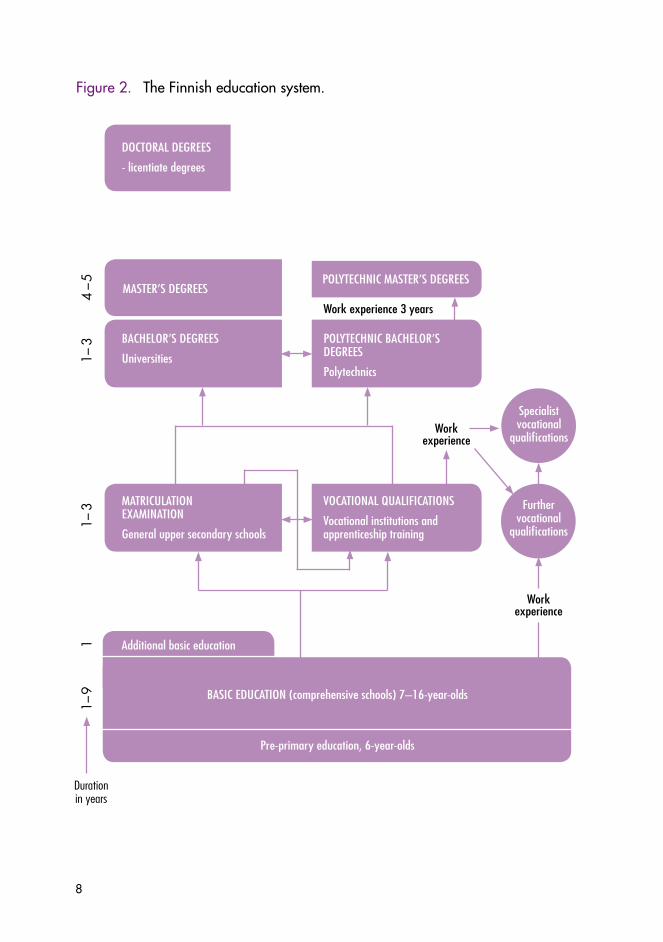
Before compulsory education, children have a subjective right to pre-primary edu-cation at the age of six. Participation in pre-primary education is voluntary and is provided for 6-year-olds at day-care centres and in pre-primary classes operating in conjunction with comprehensive schools. In 2007, almost all 6-year-olds par-ticipated in pre-primary education.
Compulsory education begins at the age of seven. After nine years in basic educa-tion, it is possible to continue either to general upper secondary education or to vocational upper secondary education and training, and then to a polytechnic or university. Basic education means general education provided for each age group as a whole. It is intended for children aged between seven and sixteen and completion of its syllabus at comprehensive school takes nine years. Once they have completed basic education, pupils have fulfilled their compulsory education.
Upper secondary education includes general upper secondary education and upper secondary vocational education and training. General upper secondary education is non-vocational education preparing for the matriculation examin-ation. The main objective of upper secondary vocational education and training, in turn, is to provide vocational competence. In 2007, approximately 92% of comprehensive school leavers moved on to general or vocational upper secondary studies immediately after basic education. In 2007, 86% of the 25–34 age group had attained at least upper secondary education.
Higher education is made available by universities and polytechnics. Both sectors have their own profiles; universities focus on scientific research and instruction, whereas polytechnics are professionally oriented higher education institutions adopting a more practical approach.
�
Figure 2. The Finnish education system.
Workexperience
Duration in years
DOctORALDEgREES
-licentiatedegrees
MAStER’SDEgREES
MAtRIcULAtIONExAMINAtION
generaluppersecondaryschools
Specialistvocational
qualifications
Furthervocational
qualifications
Additionalbasiceducation
BASIcEDUcAtION(comprehensiveschools)7–16-year-olds
Pre-primaryeducation,6-year-olds
VOcAtIONALqUALIFIcAtIONS
Vocationalinstitutionsandapprenticeshiptraining
BAcHELOR’SDEgREES
Universities
POLytEcHNIcBAcHELOR’SDEgREES
Polytechnics
POLytEcHNIcMAStER’SDEgREES
Workexperience3years
Workexperience
1–9
1–3
1–3
4–5
1
�
Steering and regulation of provision
Upper secondary VET
The quantitative regulation system of Finnish vocational education and training was reformed in the late 1990’s. The new legislation is more flexible, emphasi-sing education providers’ own responsibility and enabling them to decide on the means used to achieve the objectives of education and training independently, within the limits of the relevant legislation and the authorisation to provide edu-cation and training.
In 2008, there were 169 providers of upper secondary VET in Finland. The au-thorisation to provide upper secondary VET specifies the framework for the pro-vider’s education and training activities. The authorisations include regulations on the types and scopes of education and training that providers may organise with financing for the education and culture sector. Within the framework of its authorisation, each provider decides on the configuration, names and educational missions of their educational institutions and on the forms of provision. The au-thorisations specify aspects such as fields and levels of education and, in certain cases, qualifications and annual student numbers.
Education providers may independently transfer intake quotas from one insti-tution and field to another on a yearly basis within the limits of the maximum annual student numbers authorised. Provision of some qualifications has been restricted due to modest educational needs or high costs of provision, etc. Ex-amples of such qualifications include upper secondary vocational qualifications in the field of Culture and qualifications for forest machine operators within the field of Natural Resources. A specific educational mission may also include obliga-tions, such as an obligation to offer certain types of education and training or to maintain certain services.
Higher education institutions
The Finnish higher education system consists of two complementary sectors, namely, universities and polytechnics (universities of applied sciences), which have different roles and profiles. The model is based on the differentiated degrees, contents and missions of the two sectors. The network of higher education institu-tions operating within the Ministry of Education sector consists of 20 universities and 26 polytechnics.
�0
One of the key objectives of the Government’s higher education reform is to achieve a network of higher education institutions that is stronger and more effect-ive in regional terms. This entails a reduction in the number of higher education institutions and their units. The role of polytechnic education and research, devel-opment and innovation activities will become more pronounced in areas without an independent university in particular.
By nature, polytechnics are mostly multidisciplinary and regional higher edu-cation institutions with operational focus on links with the world of work and regional development. Their degrees are higher education degrees with a profes-sional emphasis. The statutory mission of polytechnics is to provide higher educa-tion for professional expert assignments based on the requirements of the world of work and its development as well as on research and artistic premises. According to Government policy decisions, polytechnics focus on high-quality education relevant to the world of work and on applied research and development specif-ically geared towards supporting small and medium-sized business activities and the service sector. Polytechnics are also responsible for responding to regional demand for labour.
All Finnish universities are state-owned and they operate under the auspices of the Ministry of Education within central government. The Ministry is responsible for preparing matters concerning universities and appropriate operations and steering of universities.
A new Universities Act is due to come into force on 1st January 2010. The purpose of the university reform and the new Universities Act is to increase universities’ autonomy, establish them as independent legal entities and create better operating conditions for them in international terms. The reform would change the status of universities from state accounting offices to independent public corporations or foundations governed by the Foundations Act. The new Universities Act would include provisions on the universities’ mission, administration, operational fund-ing and steering, as well as on aspects relating to university research and education, students and staff.
The key objectives of the university reform and structural development include improving the quality of education, developing study processes and raising the international standard of research. As a result of the university reform, universities’ increasing powers and accountability create incentives and conditions to organise university operations more efficiently and appropriately. The operations of uni-versities, including private institutions, will mostly be financed from government funds and the universities will also continue to discharge the public mission as-signed to them by central government.

��
The key components of the system employed by the Ministry of Education to steer higher education institutions are funding, legislation and information-based guidance. The main steering instruments include agreements between the Min-istry and higher education institutions, the feedback procedure and monitoring systems.
Regular negotiations between the Ministry of Education and higher education in-stitutions play a key role in the steering process. In these negotiations, the parties
– i.e. the universities and the Ministry of Education within the university sector and the polytechnics, their maintaining organisations and the Ministry within the polytechnic sector – agree on the individual institutions’ mission, profile and priority fields as well as on key objectives and development measures in terms of national higher education policy to be set for their operations for a specified number of years at a time. The outline of the agreements for the 2010–2012 period consists of the common objectives of the higher education system, the missions, profiles and priority fields of individual higher education institutions, their quantitative targets, such as degree targets, as well as significant development measures and funding criteria. Starting from 2013, agreements will be negotiated for four years at a time.
Anticipation method
The anticipation work in terms of demand for labour and educational needs car-ried out by the Finnish National Board of Education is based on an application of the labour force method. In this method, new labour requirements are anticipated on the basis of demand on the labour market and the labour demand is then converted into educational needs. The aim is to ensure the best possible match between provision of vocationally/professionally oriented education and training and future demand for skilled labour on the labour market.
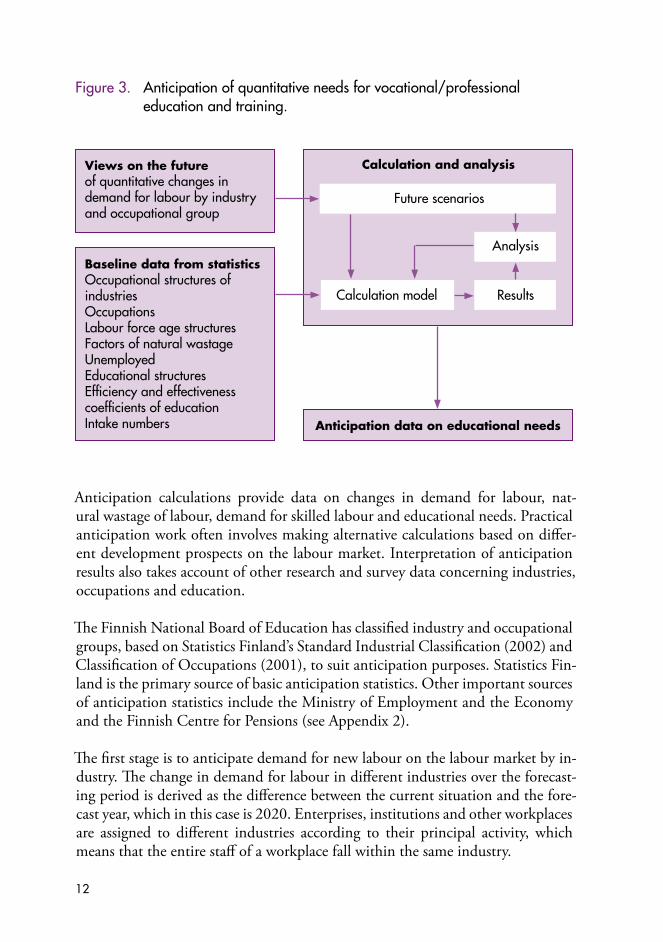
In addition to statistics, anticipation makes use of surveys and studies on trends and developments in different industries as well as on changes in occupations and skills needs. Different views on the future have an impact, first and foremost, on preparation of industry and occupational structure forecasts, on determination of the efficiency and effectiveness targets for education and training and on for-mulation of correspondence keys between occupations and education. Choices of baseline data and views on future changes in the labour market and labour force influence the trend of results produced by the anticipation model (Figure 3 and Appendix 1).
�2
Views on the future of quantitative changes in demand for labour by industry and occupational group
Baseline data from statistics Occupational structures of industriesOccupationsLabour force age structuresFactors of natural wastageUnemployedEducational structuresEfficiency and effectiveness coefficients of educationIntake numbers
Analysis
ResultsCalculation model
Future scenarios
Calculation and analysis
Anticipation data on educational needs
Figure �. Anticipation of quantitative needs for vocational/professional education and training.
Anticipation calculations provide data on changes in demand for labour, nat- ural wastage of labour, demand for skilled labour and educational needs. Practical anticipation work often involves making alternative calculations based on differ-ent development prospects on the labour market. Interpretation of anticipation results also takes account of other research and survey data concerning industries, occupations and education.
The Finnish National Board of Education has classified industry and occupational groups, based on Statistics Finland’s Standard Industrial Classification (2002) and Classification of Occupations (2001), to suit anticipation purposes. Statistics Fin-land is the primary source of basic anticipation statistics. Other important sources of anticipation statistics include the Ministry of Employment and the Economy and the Finnish Centre for Pensions (see Appendix 2).
The first stage is to anticipate demand for new labour on the labour market by in-dustry. The change in demand for labour in different industries over the forecast-ing period is derived as the difference between the current situation and the fore-cast year, which in this case is 2020. Enterprises, institutions and other workplaces are assigned to different industries according to their principal activity, which means that the entire staff of a workplace fall within the same industry.

��
Since education is more closely associated with occupations than industries, it is essential to establish a link between occupations and education. This is why the process also involves anticipation of changes in the occupational structures of industries. This means analysis of the different occupations represented by peo-ple employed in each industry and the relative proportions of these occupations among people employed in that specific industry. Change in demand for labour is calculated as the difference between the occupational structure forecasts for the target year summed up by industry and the occupational structure of the most recent reference year.
The total demand for new labour – in other words, the number of job openings – is obtained by summing up the change in demand for labour and natural wast-age (due to death, disability and retirement) over the forecasting period. In practi-cal terms, natural wastage is calculated for each factor by making use of the annual wastage coefficients by occupational and age group obtained from the most recent data available. The total demand for new labour is calculated for the forecasting period, also taking account of the current supply of unemployed labour and the estimated unemployment rate for 2020. These results indicate the amounts and types of labour required by the world of work.
Data on changes in demand for labour and natural wastage (number of job open-ings) is converted into demand for education and training using an instrument known as the correspondence key. Each occupational group currently used in anticipation has a correspondence key, which indicates the types of education and training (field and level) expected to be required in the occupational group in question, as well as the proportion of different programmes as a percentage of the total educational provision required. The correspondence key between occupa-tions and education has been revised to cover about 400 occupations.
The targets set for the efficiency (programme completion rates and further study tracks) and effectiveness (labour force participation rates among qualification-holders) of education and training are taken into account at the next calculation stage, before arriving at specific results on intake needs. The coefficients allow con-version of the educational needs of the world of work into intake needs by field and subfield, i.e. the entrant numbers required to cover demand for new labour between 2005 and 2020.

��
Intake needs have been calculated taking account of the following targeted coef-ficients describing the performance of education and training, i.e. factors of ef-ficiency and effectiveness:
• the proportion of entrants completing their qualification (completion rate)• the proportion of qualification-holders moving on to complete another edu- cational qualification (further study tracks and multiple education)
• the proportion of qualification-holders moving on to the labour market (labour force participation rate).
The completion rate of education influences the relative weightings of differ-ent subfields in particular, whereas the effects of further study tracks and mul-tiple education focus on the relative proportions of different levels of education. The coefficient based on these targeted proportions varies considerably by level and subfield of education (1.04–2.46). The coefficient allows translation of the subfield-specific graduate needs into intake needs. An integral feature of the Finn-ish education system is the fact that some students move from one level of edu-cation to the next after completing a qualification. This is why the number of student places available should exceed the figure that the size of the young age group would suggest. The coefficients also cause the structure of the calculated in-take needs to differ from that of the qualifications required on the labour market. The proportion of qualification-holders moving on to further studies is highest in upper secondary VET, which is why its intake needs differ the most from the qualifications requirements of the world of work. In addition to the calculation coefficients outlined above, another aspect taken into account when calculating intake needs is the labour force participation rate among qualification-holders, which is not very significant in terms of differences between subfields in this anticipation.
Completion rates vary by subfield of education. Conversely, the proportions of qualification-holders taking further studies and labour force participation rates have been defined consistently by level of education. Table 1 below shows a sum-mary of educational efficiency and effectiveness targets.

��
Table �. The targeted efficiency and effectiveness of education used in anticipation calculations (%).
Proportions of qualification-hold-ers taking further studies
Completion rates of entrants
Labour force participation rates of qualification-holders
Upper secondary VET 23 52.8 – 90.7 91
Polytechnic education 5 60.2 – 89.4 92
University education 3 60.4 – 92.2 93
The intake needs for vocationally/professionally oriented provision can be cal-culated by adjusting anticipation results of educational needs to the 16–21 age group forecast. In this anticipation, intake needs of young people refer to the intake needs of the world of work adjusted to the average size of the 16–21 age group during the 2011–2015 period. Intake needs adjusted to the young age group mean the average intake anticipated per year that is required to guarantee educational opportunities for the age group. In other words, the required entrant numbers are derived from the size of the young age group, while the distribution of educational needs over different levels and subfields is based on demand for labour. Intake needs are quantified taking account of the average effects of further study tracks and completion rates within the entire education system.
��
Figure �. Population forecast (200�) for ��–2�-year-olds in Finland for 200�–20�0.
70,000
68,000
66,000
64,000
62,000
60,000
58,000
56,000
People20
06
2007
2008
2009
2010
2011
2012
2013
2014
2015
2016
2017
2018
2019
2020
2021
2022
2023
2024
2025
2026
2027
2028
2029
2030
16-year-olds17-year-olds18-year-olds19-year-olds20-year-olds21-year-oldsAverage
Source: Statistics Finland, 2007.
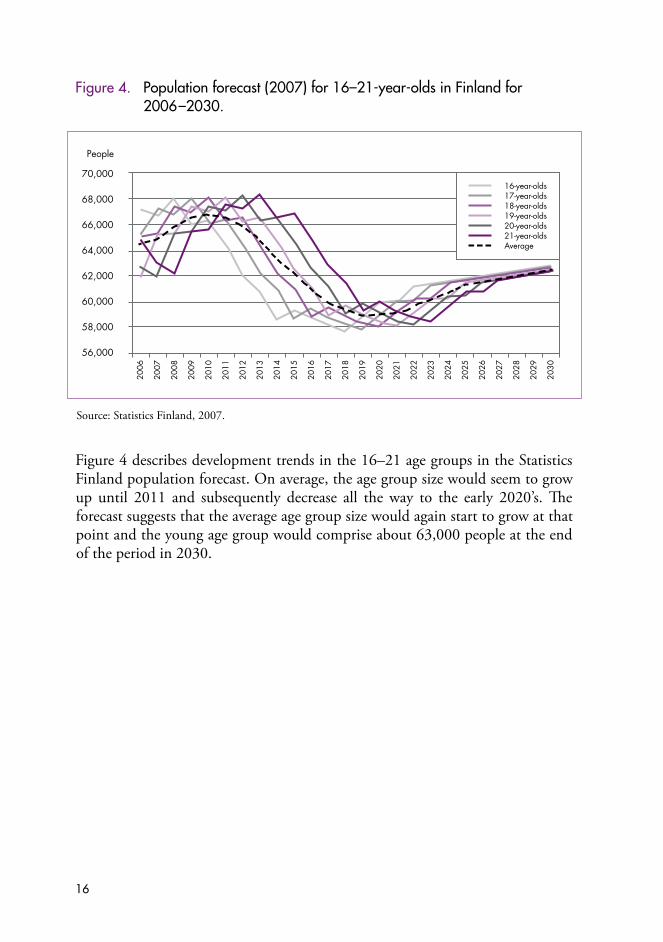
Figure 4 describes development trends in the 16–21 age groups in the Statistics Finland population forecast. On average, the age group size would seem to grow up until 2011 and subsequently decrease all the way to the early 2020’s. The forecast suggests that the average age group size would again start to grow at that point and the young age group would comprise about 63,000 people at the end of the period in 2030.
��
DEMAND FOR NEW LABOUR
UP UNTIL 2020
Demand for labour by industry between 2005 and 2020
This chapter deals with Finland’s economic development in the early 21st century. The forecasts produced by the then Ministry of Labour extend through to 2025 and are based on estimates included in the ‘Labour Force 2025’ report (Ministry of Labour 2007). Anticipation is based on the estimated employment rates in dif-ferent industries by 2020, derived from these forecasts.
The anticipation project has used the industry forecasts produced by the Labour Force 2025 working group. The total number of employed people in 2004 was 2,262,000. By 2020, the basic scenario and the target scenario project an increase of 63,000 and 189,000 people, respectively. Development trends in the number of employed people have been anticipated up until 2020 for a total of 60 occupa-tional groups within all 28 industries.
Finland’s economic development took a downward turn in 2001. The downturn damaged the forestry and technology industries in particular, but other manu-facturing industries were also affected. The situation also accelerated transfer of electrical and electronics industry subcontracting to lower-cost countries. At the same time, however, development in the domestic sector was exceptionally strong in Finland. The economic growth took an upward turn again during 2004 due to domestic demand and the recovery of the global economy and exports.
Manufacturing industries reduced personnel such that employment at the turn of 2004 and 2005 was about 40,000 people less than at the beginning of 2002. However, total employment did not decrease to any significant extent, because employment increased in services and construction. In late 2005, employment in manufacturing took an upward turn, which contributed to an improvement in the overall employment situation.
Industry developments have been examined over the 2005–2025 anticipation period in terms of two alternative scenarios describing basic and target develop-ment. The basic scenario describes the future based on data available at the time
��
of the analysis (2006) and according to probable trends. The point of reference used for the target scenario, in turn, is better employment and reduction in un-employment to the extent that full employment is achieved. The target scenario involves influencing economic developments and other factors through social and economic policies.
Basic scenario
According to the Labour Force 2025 report, the basic development scenario projects an average GDP growth of 2.2% over the 2005–2025 period, because average growth would remain below 2% during 2010–2025. Growth in export of goods and services is expected to decrease from the average growth (5.9%) projected for the 2005–2010 period, while growth in imports will also decline. Growth in private consumption is expected to decrease, whereas public consump-tion is projected to increase. Growth in productivity is expected to decline only slightly from the 2005–2010 levels (2.6%). The basic scenario anticipates that the employment rate will rise to 75% during the 2020’s, as the working-age popula-tion decreases.
Target scenario
The target scenario anticipates an average growth of 3.4% for the last few years of the current decade. Growth is predicted to slow down towards the end of the forecasting period, such that the average growth for the 2005–2025 period would amount to 2.5%. The average growth in export of goods and services is projected to drop by a couple of percentage points from the 2005–2010 levels (6.1%), while the average growth in imports would fall by one percentage point during the 2005–2025 period. In this scenario, private consumption would only decline slightly, whereas public consumption would show clear growth. Growth in pro-ductivity is also expected to decrease to some extent from the 2005–2010 levels (2.5%) in the target scenario due to rapid growth in employment. The employ-ment rate in the target scenario is anticipated to rise close to 80% during the 2020’s.
Demand for labour by industry
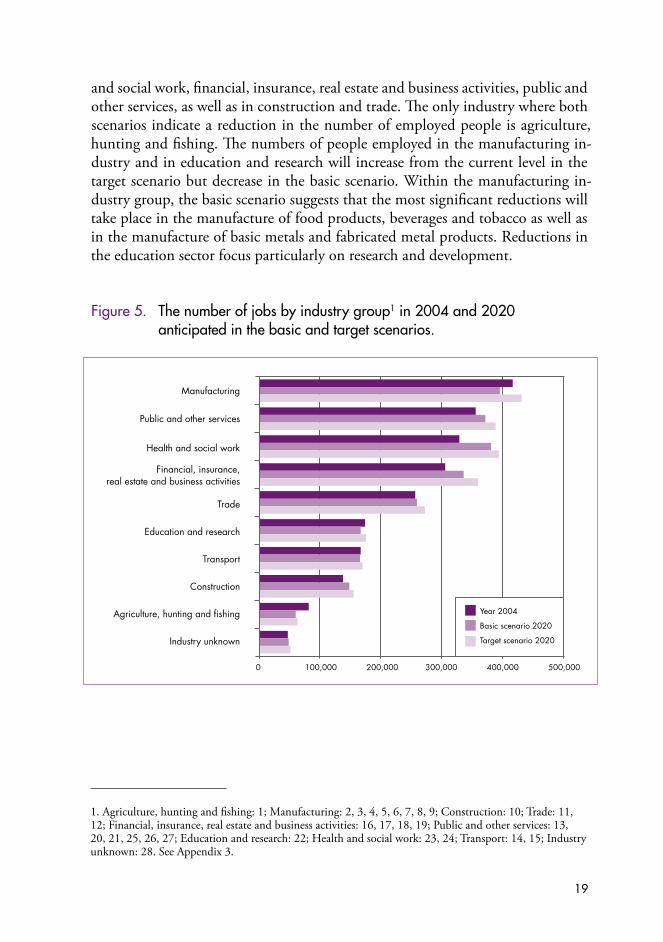
Figure 5 outlines the distribution of jobs by industry group in 2004 and 2020 in the alternative development scenarios. Both the basic and the target scenario estimate that the number of jobs will increase from the current levels in health
��
and social work, financial, insurance, real estate and business activities, public and other services, as well as in construction and trade. The only industry where both scenarios indicate a reduction in the number of employed people is agriculture, hunting and fishing. The numbers of people employed in the manufacturing in-dustry and in education and research will increase from the current level in the target scenario but decrease in the basic scenario. Within the manufacturing in-dustry group, the basic scenario suggests that the most significant reductions will take place in the manufacture of food products, beverages and tobacco as well as in the manufacture of basic metals and fabricated metal products. Reductions in the education sector focus particularly on research and development.
Figure �. The number of jobs by industry group� in 200� and 2020 anticipated in the basic and target scenarios.
Manufacturing
Public and other services
Health and social work
Financial, insurance, real estate and business activities
Trade
Education and research
Transport
Construction
Agriculture, hunting and fishing
Industry unknown
0 100,000 200,000 300,000 400,000 500,000
year 2004
Basic scenario 2020
Target scenario 2020
1. Agriculture, hunting and fishing: 1; Manufacturing: 2, 3, 4, 5, 6, 7, 8, 9; Construction: 10; Trade: 11, 12; Financial, insurance, real estate and business activities: 16, 17, 18, 19; Public and other services: 13, 20, 21, 25, 26, 27; Education and research: 22; Health and social work: 23, 24; Transport: 14, 15; Industry unknown: 28. See Appendix 3.

20
Demand for labour by occupational group between 2005 and 2020
Changes in the occupational structure refer both to changes in the relative pro-portions of people working in different occupational groups and to quantitative changes in the entire labour force over the 2005–2020 forecasting period. Antic-ipation of the occupational structure involves three stages. The first stage focuses on anticipation of employment trends in different industries. This is followed by assessment of changes in each occupational group within each specific industry. The third stage involves summing up the same occupational groups in different industries, which results in the anticipated occupational structure for the entire labour force that is in line with the industry forecast.
Anticipation of occupational structures in different industries aims to identify changes in skills needs that influence the relationships between and employment rates within different occupational groups. Factors underlying changes in the oc-cupational structure include new products, innovations and production methods, complete with new technologies. There are also variations between industries in terms of introduction of new technologies. In the future, business enterprises are anticipated to focus increasingly on their core functions and outsource some of their other functions. The change in the international operating environment is related to market deregulation, competition and changes in the global division of work, which also influence the occupational structures of different industries. All the above-mentioned changes may have effects on management and organisation of operations. The internal industry structures are also predicted to change to some extent (branches of industry). In addition, changes relating to the popula-tion structure have also been taken into account in anticipation of occupational structures.
Anticipation of the occupational structure has aimed to take account of key an-ticipation efforts covering the entire Finnish society and the views on the future within the Ministry of Education sector. Their general results can be used to make various interpretations relevant to the occupational structure. Anticipation of edu-cational needs has involved interpretation and synthesis of various anticipation results and using these as a basis to produce alternative views on the change in the occupational structure.
2�
Basic and target scenarios for developments in the occupational structure
Changes in the number of employed people by occupational group have been anticipated using two alternative development scenarios, the basic and target scen- arios. Background materials used to prepare forecasts include the most recent anticipation data on long-term changes and development scenarios in social and economic operating environments. In addition, the anticipation project has used industry-specific sources and consulted experts from different fields.
The basic scenario for the occupational structure forecast is based on the equiva-lent scenario for the industry forecast. The projected changes in different branches of industries have been taken into account in the occupational structure forecast. This scenario indicates that the occupational structures of industries will mainly change in line with prior developments in the occupational structures.
The occupational structure forecast in the target scenario, in turn, is based on the industry forecast in line with the target development scenario. This scenario has also taken internal structural changes within the main industries into account when analysing occupational structures. The occupational structure forecast in line with the target scenario is characterised by an occupational structure based on a high standard of technological, business, environmental and service expertise.
Change in the occupational structure between 200� and 2020
The anticipated changes in the occupational structure are outlined in Figure 6, where the major occupational groups have been combined to form five groups. The number of jobs in various occupations and expert professions relating to ser-vices continues to grow. In conditions of favourable economic development, the numbers of manufacturing and transport jobs will remain at the current levels. Job opportunities in agricultural and forestry work and in office work will con-tinue to decrease similar to developments in the previous decade.
The numbers of production and transport jobs are estimated to remain at levels equivalent to the midpoint of the current decade or to increase slightly. Within this group, the overall number of jobs in manufacturing work and transport work will remain unchanged, but their internal structural change would suggest an in-crease in the number of white-collar employees and a decrease in production jobs. New jobs may be created in construction work.

22
1,100,000
1,000,000
900,000
800,000
700,000
600,000
500,000
400,000
300,000
200,000
100,000
0
1995 2000 2004 2010 2015 2020
Service work, target scenario
Service work, basic scenario
Production and transport work, target scenario
Production and transport work, basic scenario
Education, culture and expert work in certain fields, target scenario
Education, culture and expert work in certain fields, basic scenario
Office work, basic scenario
Office work, target scenario
Agricultural and forestry work, target scenario
Agricultural and forestry work, basic scenario
The numbers of service jobs are anticipated to grow at almost the same rate as in the early years of the current decade. The highest growth within this group will focus on health and social work both in quantitative and relative terms. Growth in other areas of service work is also expected to be significant. Job numbers within rescue and safety work are projected to remain close to current levels.
Job numbers in education, culture and certain expert professions (natural sciences, economics and business administration, law, social sciences, humanities) continue to grow rapidly. Within this group, growth focuses on expert professions and cul-tural and communications occupations. Within teaching and education, the basic scenario does not suggest any growth, while the target scenario does.
Figure �. Change in the occupational structure in ����–2020.2
2. The groups in the Figure have been formed from the following major occupational groups:Service work: service work, health and social work, rescue and security work.Production and transport work: manufacturing work, construction work, transport and logistics work, occupation unknown.Education, culture and expert work in certain fields: teaching and education, cultural and communications work, other executive and expert work.Office work: office work.Agricultural and forestry work: agricultural and forestry work.

2�
VET, target scenario
VET, basic scenario
Higher education, target scenario
Higher education, basic scenario
Both higher education and VET, target scenario
Both higher education and VET, basic scenario
1,200,000
1,000,000
800,000
600,000
400,000
200,000
01995 2000 2004 2010 2015 2020
The changes in the occupational structure described above are only indicative of future educational needs in different fields of education. The effects of the deci-sions made in the occupational structure forecast on the future educational needs at different levels is illustrated in Figure 7, where the 60 occupational groups have been grouped into three classes according to the level of education that the occupations are expected to require. Both the basic and the target scenario an-ticipate clear growth in the number of jobs requiring a higher education degree. Conversely, jobs available for those with upper secondary vocational qualifications would appear to start decreasing slowly after the turn of the next decade.
Figure �. Changes in job numbers according to education required for the job between ���� and 2020.
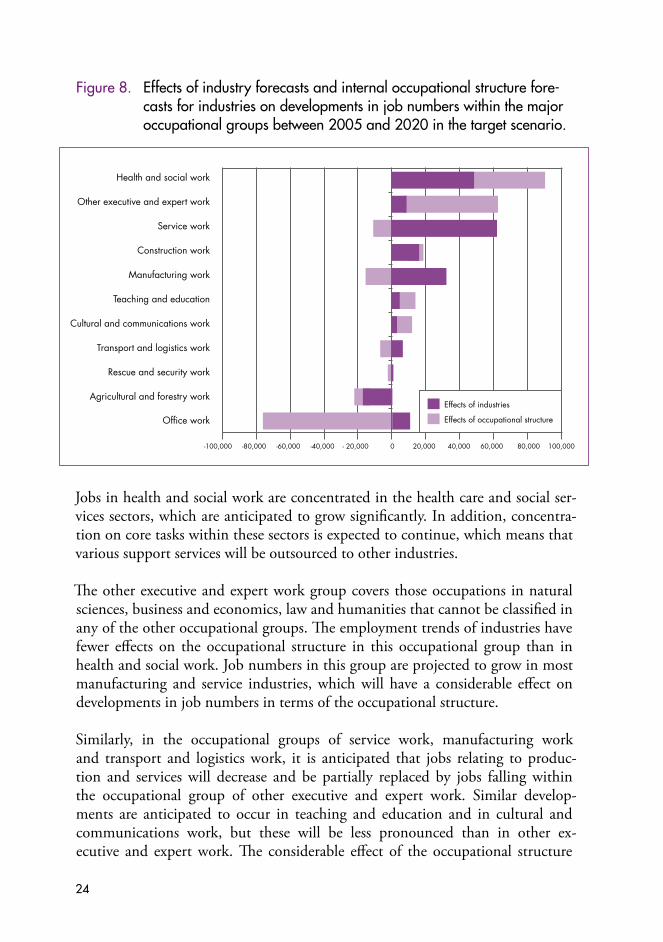
Figure 8 outlines the changes in the occupational structure anticipated for 2005–2020 in terms of two aspects, one describing the effects of changes in em-ployment in different industries and the other the effects of changes in occu-pational structures within industries on the overall occupational structure. The effects of changes in employment in different industries have been calculated such that the internal occupational structures of industries have been retained at the level of the 2004 reference year throughout the forecasting period. Deducting the resulting change in employment in different occupations from the anticipated change in total employment shows the effect of change in the internal occupa-tional structures of industries on each occupation’s employment trend.
2�
Figure �. Effects of industry forecasts and internal occupational structure fore- casts for industries on developments in job numbers within the major occupational groups between 200� and 2020 in the target scenario.
Jobs in health and social work are concentrated in the health care and social ser-vices sectors, which are anticipated to grow significantly. In addition, concentra-tion on core tasks within these sectors is expected to continue, which means that various support services will be outsourced to other industries.
The other executive and expert work group covers those occupations in natural sciences, business and economics, law and humanities that cannot be classified in any of the other occupational groups. The employment trends of industries have fewer effects on the occupational structure in this occupational group than in health and social work. Job numbers in this group are projected to grow in most manufacturing and service industries, which will have a considerable effect on developments in job numbers in terms of the occupational structure.
Similarly, in the occupational groups of service work, manufacturing work and transport and logistics work, it is anticipated that jobs relating to produc-tion and services will decrease and be partially replaced by jobs falling within the occupational group of other executive and expert work. Similar develop-ments are anticipated to occur in teaching and education and in cultural and communications work, but these will be less pronounced than in other ex-ecutive and expert work. The considerable effect of the occupational structure
Health and social work
Other executive and expert work
Service work
Construction work
Manufacturing work
Teaching and education
Cultural and communications work
Transport and logistics work
Rescue and security work
Agricultural and forestry work
Office work
-100,000 -80,000 -60,000 -40,000 - 20,000 0 20,000 40,000 60,000 80,000 100,000
Effects of industries
Effects of occupational structure
2�
forecast on the decrease in office work is due to the estimate that traditional office tasks will continue to decrease clearly in almost all industries.
Natural wastage from the employed labour force between 2005 and 2020 In this analysis, ‘natural wastage’ refers to the permanent departure of people from the labour force over the selected forecasting period resulting from retirement or death. The natural wastage of employed people between 2005 and 2020 was calculated on the basis of the number of employed people shown in the Statistics Finland 2004 register of occupations. Calculations were made using the occupa-tion and age data for that year as a basis for calculating natural wastage for all years within the forecasting period and adding these up to produce the total natural wastage for the forecasting period. These take account of retirement due to pen-sionable age, retirement based on disability due to illness, accident or some other reason, and death.
The employment pension system has been developed since the early 1990’s so as to encourage ageing employees to stay at work longer. The 2005 pension reform3
plays a key role in terms of retaining ageing people at work. One of the long-term objectives of the pension reform is to raise the average retirement age by 2 to 3 years. Some pension forms have been eliminated from the new system, while also raising some age limits. The transitional periods included in the pension reform are different for the private and public sectors.
The pension reform appears to delay retirement in the 55–64 age group. The pen-sion solution contributes to the sufficient supply of labour by alleviating demand due to natural wastage focusing on young people completing their studies during the next decade. The solution will put off some demand for new labour and, in the best case scenario, level it out over the course of several years.
It is anticipated that a total of about 913,000 employees are retiring from the labour market during the period from 2005 to 2020, accounting for 41% of the number of employed people in 2004. The average amount of natural wastage per year is 57,000 people. In practical terms, virtually all employed people aged 50 and over will retire during the 16-year period used in calculation of natural
3. A description of the main features of the 2005 pension reform both in the private and public sector can be found on the website of the Finnish Pension Alliance TELA at www.tela.fi.

2�
wastage. In 2004, this group amounted to 648,000 people. A total of 265,000 employees aged below 50 will leave the labour market. This means that those aged over 50 account for more than 70% of natural wastage, showing a clear increase compared with calculations in earlier anticipation projects. In 2000, the 50+ age group comprised 580,000 people, which means a growth of almost 70,000 people within a four-year period.
In 2004, the baby-boomer age groups born between 1946 and 1950 comprised 420,000 people. Among these age groups, employed people amounted to 282,000 or 67%. The average size of an employed age group was 56,000 people. Since 2000, the number of employed people had dropped by 43,000 people. Baby boomers are starting to retire in the last few years of the current decade, which means a steady growth in natural wastage towards the end of the decade. The growth will continue at a decelerating pace in the early years of the next decade, such that natural wastage would appear to be highest in 2013–2014, amounting to 66,000 people per year.
Figure �. Natural wastage from the employed labour force between 200� and 2020 and proportion of natural wastage as a percentage of people employed in 200�.
200,000
180,000
160,000
140,000
120,000
100,000
80,000
60,000
40,000
20,000
0
People
60
50
40
30
20
10
0
%Amount of natural wastage Proportion of wastage, % of people employed in 2004
Serv
ice
wor
k
Man
ufac
turin
g w
ork
Hea
lth a
nd s
ocia
l wor
k
Offi
ce w
ork
Con
struc
tion
wor
k
Agr
icul
tura
l and
fore
stry
wor
k
Tran
spor
t and
logi
stics
wor
k
Oth
er e
xecu
tive
and
expe
rt w
ork
Teac
hing
and
edu
catio
n
Resc
ue a
nd s
ecur
ity w
ork
Cul
tura
l and
com
mun
icat
ions
wor
k

2�
The number of retiring employees is highest in service work and manufacturing work: combined, these two groups account for more than 40% of natural wastage (Figure 9). If a third major occupational group, health and social work, is also con-sidered, the combined amount of natural wastage within these three occupational groups is 490,000 people, which is clearly more than half of the total amount of wastage.
The extent of natural wastage is mostly influenced by the age of employed people. In 2004, the median age of employed people was 42 years. Differences between occupational groups are very pronounced. The median age within the 60 occu-pational groups included in the occupational classification used in anticipation ranged between 29 and 49 years. The median age is typically low in those oc-cupational groups where growth over the last 10 years has been rapid and where new employees have been recruited from among recent graduates. Conversely, the median age is high in those occupational groups where employment has contin-ued declining since the recession of the early 1990’s and where recruitment of new labour has been modest.
The major differences in the age structures between occupational groups suggest that there will also be considerable differences in terms of natural wastage. Nat-ural wastage among people employed in 2004 varies between 37% and 52% in the major occupational groups (Figure 9). The proportion is clearly highest in agricultural and forestry work and in construction work, while service work and teaching and education account for the lowest proportions of wastage. There may be considerable differences in the proportions of wastage within individual major occupational groups. Figure 10 shows examples of the occupational groups with the highest and lowest proportions of natural wastage.

2�
Figure �0. Proportion of wastage as a percentage of people employed in 200� by size (�0 occupational groups).
Health and social services managers
Water traffic operators and officers
Agricultural entrepreneurs and workers
Property managers and building caretakers
Artistic and cultural services managers and producers
Legal professionals
Textiles, clothing and leather workers
Cleaners
Restaurant and catering workers
Artists and other artistic professionals
Travel service workers
Electrical and electronics engineers
Computing managers and professionals
Other rescue and security workers
Horticultural and agricultural labourers
%
Low
est p
ropo
rtion
Hig
hest
prop
ortio
n
0 10 20 30 40 50 60
As Figure 10 shows, the category with the highest natural wastage includes very different occupations. What is typical of the occupational groups in this category is that their jobs have decreased for a long time (textiles, clothing and leather workers, agricultural entrepreneurs and workers) or that it has been difficult to recruit new labour for the occupation (cleaners). The number of executive and expert jobs, in turn, has long been stable or shown reduction needs.
Natural wastage is lowest among occupational groups where workers are young due to strong and prolonged growth (computing managers and professionals, elec-trical and electronics managers and engineers), or where recruitment has focused on young people due to the nature and conditions of work assignments (travel service work, other rescue and security workers).

2�
Job openings between 2005 and 2020
Job openings refer to the sum of changes in the amount of natural wastage and in the number of jobs (employed people) during the anticipation period. Job open-ings are anticipated for each occupational group used in the analysis. If an occu-pational group is expected to see a growth in the number of employed people, the group will require new employees to satisfy the growth and compensate for nat-ural wastage. If an occupational group is declining, the number of jobs decreases through natural wastage and it is only necessary to replace part of the wastage with new labour. The basic scenario projects that there will be 976,000 job openings over the 2005–2020 period, while the target scenario, in turn, indicates 126,000 more job openings, i.e. 1,102,000 openings in total. Natural wastage accounts for a significant proportion of job openings, standing at almost 94% and at 83% in the basic and target scenario, respectively.
Increasing employment rates in different industries will generate a net amount of 63,000 new jobs in the basic scenario, while the equivalent figure for the target scenario is 189,000. Changes in occupational structures have also been antici-pated within industries. When examined by occupational group (60), the basic and target scenarios project that the number of new jobs will increase by a total of about 141,000 and 306,000, respectively, in the growing occupational groups. Correspondingly, the number of jobs in declining occupational groups is esti-mated to decrease by a total of about 78,000 in the basic scenario and 117,000 in the target scenario.
The target scenario (Figure 11) projects the highest number of job openings in the major occupational groups of service work, health and social work and manufac-turing. Combined, job openings in these fields account for 59% of all job open-ings. The target scenario suggests that the amount of expert work will grow, which can be seen in the anticipated growth in the number of employed people in the main occupational group of manufacturing work (including both skilled workers and professionals), for example.

�0
Job openings
Natural wastage
Change
Service work
Health and social work
Manufacturing work
Other executive and expert work
Construction work
Teaching and education
Transport and logistics work
Office work
Agricultural and forestry work
Cultural and communications work
Rescue and security work
-100,000 -50,000 0 50,000 100,000 150,000 200,000 250,000
Figure ��. Number of jobs becoming available between 200� and 2020 by major occupational group in the target development scenario.
The basic scenario anticipates that the highest number of completely new jobs will be created in the growing major occupational groups of health and social work, service work and other executive and expert work. The highest increases in the tar-get scenario are in the same major occupational groups, but they are clearly higher than in the basic scenario and focus more on other executive and expert work. In addition, the target scenario also shows an increase in the number of employed people in manufacturing work, among professionals in particular. Both scenarios anticipate the most considerable decreases in employment rates to occur with-in office work, agricultural and forestry work and manufacturing work (Appen- dix 4).
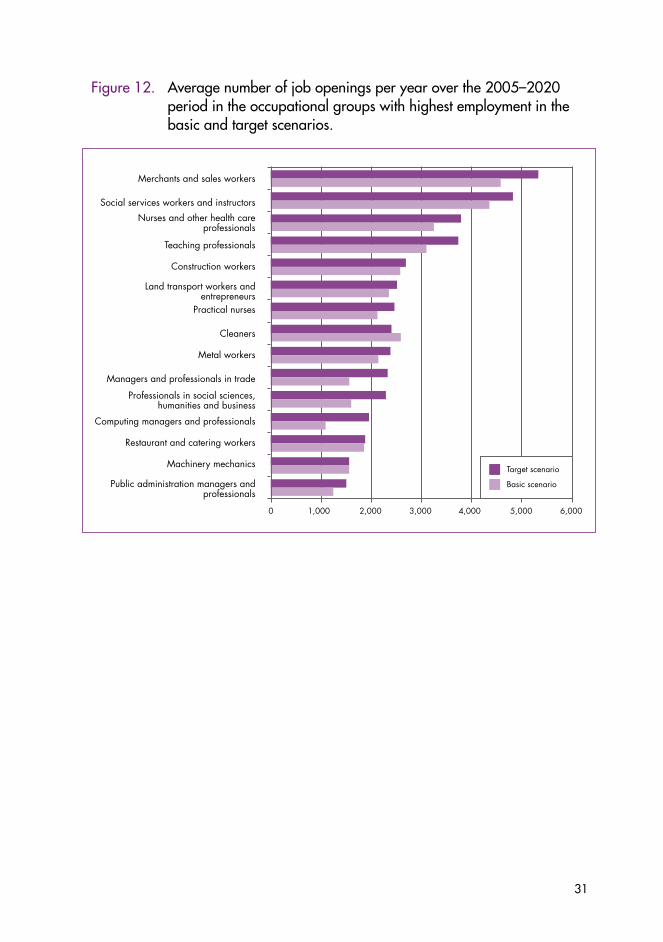
Figure 12 shows a sample of 15 out of the total 60 occupational groups with the highest number of job openings per year. The occupational groups employing the highest numbers include trade, health and social work and expert work in differ-ent fields. In addition, positions requiring vocational competence in construction, metalwork and transport provide significant job opportunities. The highest dif-ferences between the two scenarios are usually in occupations requiring higher education, where the target scenario projects more job opportunities than the basic scenario.
��
Figure �2. Average number of job openings per year over the 200�–2020 period in the occupational groups with highest employment in the basic and target scenarios.
Merchants and sales workers
Social services workers and instructorsNurses and other health care
professionals
Teaching professionals
Construction workers
Land transport workers and entrepreneurs
Practical nurses
Cleaners
Metal workers
Managers and professionals in trade
Professionals in social sciences, humanities and business
Computing managers and professionals
Restaurant and catering workers
Machinery mechanics
Public administration managers and professionals
Target scenario
Basic scenario
0 1,000 2,000 3,000 4,000 5,000 6,000

�2
The objective of this work was to anticipate educational needs on the basis of long-term demand for labour, which has been examined up until 2020. Changes in de-mand for labour have been used as a basis to derive intake needs for vocationally/professionally oriented provision – i.e. upper secondary vocational education and training (VET), polytechnic education and university education – for the first half of the 2010’s. Anticipation work was linked to preparation of the Development Plan for Education and Research adopted by the Government for 2007–2012, which sets out intake targets for 2012. Development Plans for Education and Research are drawn up every four years.
The primary focus of the work was on educational needs in terms of vocation-ally/professionally oriented provision aimed at young people. In this publication, intake targets have been presented in terms of two alternative scenarios, namely, the basic development scenario and the target development scenario. The results have been expressed in terms of nationwide intake needs. In parallel with national work, both demand for labour and educational needs were also anticipated in all 19 regions, using a corresponding method, for the purposes of regional strategy development and decision-making.
In addition to preparation of the periodic Development Plans for Education and Research, quantitative educational anticipation results are also used when prepar-ing target and performance agreements between the Ministry of Education and individual polytechnics and universities, deciding on authorisations to provide education and training, as well as for the purposes of vocational guidance, em-ployment counselling and guidance counselling. Long-term anticipation data is used to steer education providers’ annual provision.
The starting point for Finnish education policy is to provide the entire age groups finishing basic education (aged 15–16) and general upper secondary education (aged 18–20) with opportunities to continue on vocationally/professionally ori-ented programmes within the VET sector or in higher education. In addition, a sufficient share of vocational qualification-holders will have the possibility to con-tinue in higher education, particularly at polytechnics. According to calculations, this target will be achieved if educational provision is quantified to accommodate
INTAKE TARGETS
��
about 95,300 entrants in the early part of the next decade. These calculations take account of completion rates and the proportions of holders of initial qualifica-tions moving on to the next level of education to complete higher qualifications (further study tracks).
In addition to the efficiency factors outlined above, intake needs for different levels and subfields of education are also influenced by the proportion of those entering the labour market after completing their qualification. The targets set for these factors as part of the anticipation project differ from the current situation and achievement of the targets requires an increase in the efficiency and effective-ness of education and training. Raising efficiency and effectiveness targets will lead to a reduction in intake needs in most subfields.
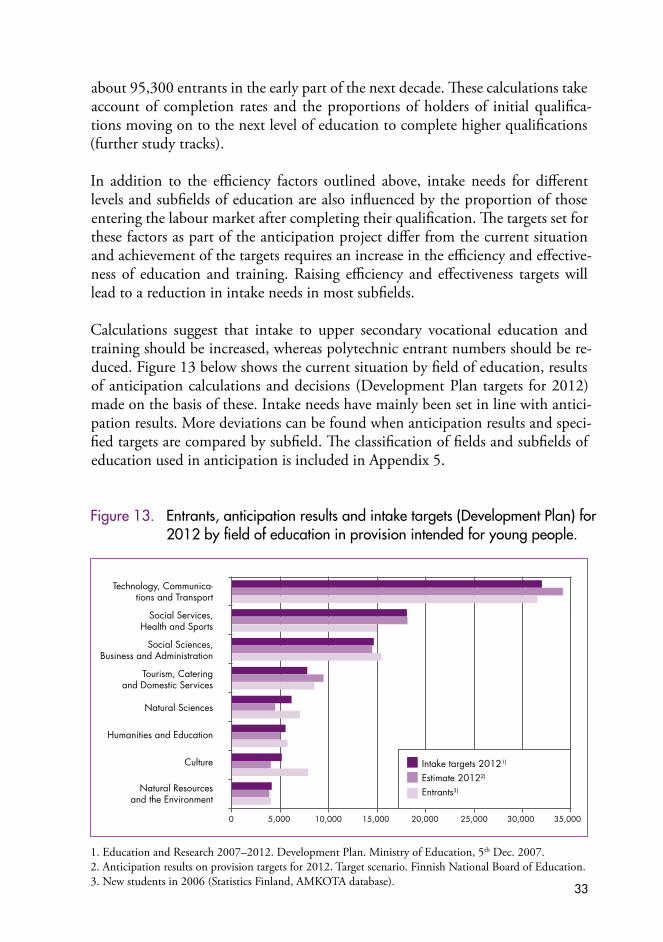
Calculations suggest that intake to upper secondary vocational education and training should be increased, whereas polytechnic entrant numbers should be re-duced. Figure 13 below shows the current situation by field of education, results of anticipation calculations and decisions (Development Plan targets for 2012) made on the basis of these. Intake needs have mainly been set in line with antici-pation results. More deviations can be found when anticipation results and speci-fied targets are compared by subfield. The classification of fields and subfields of education used in anticipation is included in Appendix 5.
1. Education and Research 2007–2012. Development Plan. Ministry of Education, 5th Dec. 2007.2. Anticipation results on provision targets for 2012. Target scenario. Finnish National Board of Education.3. New students in 2006 (Statistics Finland, AMKOTA database).
Intake targets 20121) Estimate 20122) Entrants3)
0 5,000 10,000 15,000 20,000 25,000 30,000 35,000
Technology, Communica- tions and Transport
Social Services,
Health and Sports
Social Sciences, Business and Administration
Tourism, Catering
and Domestic Services
Natural Sciences
Humanities and Education
Culture
Natural Resourcesand the Environment
Figure ��. Entrants, anticipation results and intake targets (Development Plan) for 20�2 by field of education in provision intended for young people.
��
The following sections will examine anticipated intake needs by field and level of education.
Humanities and Education
Anticipated intake needs within the field of Humanities and Education will be somewhat smaller than current entrant numbers in both the basic and the target scenario. The target scenario projects that reductions will primarily be required in the largest level of education in terms of entrant numbers, i.e. university educa-tion and all subfields, except for Teaching and Education and Theology. Intake needs in Teaching and Education are increasing, while educational needs in The-ology will remain at current levels. Similarly, future intake needs within upper sec-ondary VET in Youth and Leisure Instruction and in Sign Language Instruction will correspond to the current situation. In terms of polytechnic education, intake needs will grow slightly within the Degree Programmes in Youth Work and Civic Activity and in Sign Language Interpretation.
Culture
Programmes within the field of Culture have been highly sought-after, because many young people have wanted to find employment in various cultural and communications positions. Current provision within the field is no longer in line with demand for labour in all respects, as it seems to exceed future demand for labour in upper secondary VET and polytechnic sectors in particular. This is pri-marily due to the fact that provision has increased in the 1990’s and in the early years of the current decade. Consequently, provision of upper secondary VET has been restricted since 2003 by making any expansion subject to authorisation from the Ministry of Education. People currently employed in the culture and commu-nications field are relatively young and the rate of age-related natural wastage is low. Conversely, reduction needs in university education provided in this field are not as high as those found in the upper secondary VET and polytechnic sectors. In quantitative terms, needs to reduce intake within upper secondary VET will primarily focus on the largest subfields, i.e. Crafts and Design and Information and Communication.
In percentage terms, university provision seems to be highest in Cultural and Arts Research when compared with future labour demand. Upper secondary VET and polytechnic provision in Music should also be reduced to match demand in the

��
world of work. Reduction needs in upper secondary vocational provision in Music are also based on education policy targets set for completion rates. The high drop-out rate in this subfield can be attributed, among other things, to the fact that music institutions have for decades provided music education progressing step-by-step in parallel with basic education (comprehensive school). Competencies achieved at music institutions thus reduce completion rates of upper secondary vocational qualifications. Student selection in vocational education and training has focused on musical competencies. Unlike students in other subfields, music students are more capable of continuing their studies directly at higher levels of education due to their prior basic music education.
Social Sciences, Business and Administration
Anticipation efforts based on the basic and target scenarios provide conflicting results in terms of intake needs within the field of Social Sciences, Business and Administration. According to the basic scenario, intake needs would increase from the 2006 level, whereas the target scenario would suggest a decrease.
The basic scenario suggests that intake needs within the upper secondary VET and polytechnic sectors will be higher than 2006 levels. The target scenario, in turn, indicates that intake needs in VET and polytechnic provision will correspond to the current situation. The single most important reason for the differences be-tween the two scenarios is the pace of change in jobs relating to various office du-ties. The target scenario anticipates a rapid reduction in office work in different in-dustries due to strong development of information systems, increasing self-service and relocation of positions related to business administration to other countries. This is why the target scenario projects that the number of jobs will decrease at a considerably faster rate than in the basic scenario, where reduction in these jobs would be half the amount envisaged in the target scenario. Conversely, sales and expert positions in trade and other services would appear to be on the increase.
The number of jobs relevant to people holding university degrees in Social Sci-ences, Business and Administration would seem to be continuing to increase, in particular in trade and computing assignments. Job numbers would also remain close to current levels in other expert positions. In recent years, university entrant numbers have, however, been so high that the labour force required on the future labour market can be trained at somewhat lower entrant numbers, provided that completion rates can be improved. Both scenarios indicate that intake needs in university education in the subfield of Business and Commerce will decrease from current levels. The same also applies to smaller subfields, including Economics,

��
Administration, Statistics and Political Sciences. Conversely, both the basic and the target scenario anticipate some need to increase provision in Law, while the target scenario also projects increase needs in Social Sciences.
Natural Sciences
Anticipated intake needs within the field of Natural Sciences will account for 50–60% of the number of entrants in 2006. The most significant decrease in in-take needs is expected to occur in upper secondary VET. Upper secondary VET and polytechnic education in this field are only provided in the subfield of Com-puting and Software. Here, the focus would appear to shift from upper secondary VET to polytechnic education, where the target scenario anticipates that intake needs will be higher than current entrant numbers.
The number of jobs requiring different degrees of computing competence is anti-cipated to increase in the future in expert positions that demand higher education. Conversely, numbers of support and maintenance jobs are expected to decrease slightly. As a result of the equally rapid growth in job numbers over the last ten years, employees are mostly young people with long careers ahead of them. This is why natural wastage anticipated for the 2005–2020 period in computing oc-cupations will remain at 25–30%, while the figure for the entire employed labour force is over 40%.
Intake needs in university education in Natural Sciences are also expected to be considerably below the current level. This requires university subfields to be cap-able of making significant improvements in degree completion rates. The highest number of university degree-holders will find employment in the growing occu-pational groups of mathematicians and natural science professionals, computing managers and professionals and public administration managers and professionals (both scenarios), as well as in the occupational group of teaching professionals, where the number of jobs is anticipated to remain at the 2006 level or increase to some extent. A similar trend has also emerged in anticipated intake needs in Natural Sciences in earlier anticipation projects.
��
Technology, Communications and Transport Anticipated intake needs in provision intended for young people within the field of Technology, Communications and Transport are growing from the current numbers according to both the basic and the target scenario, which forecast a 6% and a 9% increase respectively. An analysis of anticipation results by level of edu-cation reveals distinct differences between different levels within this field. Both scenarios project that the upper secondary VET level will require more students, whereas anticipation calculations suggest that intake to higher education (poly-technics and universities) should be reduced from the current level. The target scenario points to considerably lower reductions in higher education intake needs than the basic scenario. While the field as a whole would require more entrants, there are quite significant differences in intake needs between different levels and subfields.
In quantitative terms, increase needs will be highest in upper secondary VET within the subfields of Mechanical, Metal and Energy Engineering, Architecture and Construction, Automotive and Transport Engineering, as well as Process, Chemical and Materials Engineering. Intake needs can primarily be attributed to anticipated development trends in relevant industries and impending natural wastage by occupational group. In terms of anticipated needs to increase provi-sion within the Technology, Communications and Transport field, it has been evident for quite some time now that the significant increase in student numbers has stretched the capacity of education in Engineering and Architecture to the limit. The Development Plan for Education and Research 2007–2012 outlines the intention to enhance higher education in the field by means such as reforming degree programme structures and improving degree completion rates.
The metal and mechanical industry has already suffered from labour shortages for several years. Earlier anticipation calculations by the Finnish National Board of Education in 1999 and 2004 also indicated a need to train more employees with vocational qualifications for the field. In the future, the industry will require a significant number of new skilled workers and, in order to attract young people to take up student places, continued attention also needs to be paid to the field’s attractiveness, increasing awareness of the field and factors influencing comple-tion of qualifications. It is anticipated that new job opportunities will open up for holders of qualifications from all levels of education. Demand for holders of upper secondary vocational qualifications is particularly high.
Growth in educational needs for upper secondary VET in Automotive and Trans-port Engineering is a result of industry forecasts for the key branch of the industry, i.e. transport, where the number of employed people is estimated to increase in
��
both development scenarios. The prospects for the transport industry essentially depend on future developments in foreign trade transport flows via Finland to Russia. Natural wastage also plays a significant role and will influence the out-come. Educational needs in the field are also increased by the fact that profes-sional drivers will be required to hold the initial qualification for drivers obtained through training in accordance with the EU Directive.
Within Architecture and Construction, both development scenarios indicate that new entrants would be required for both upper secondary VET and polytechnic education. Although growth in manufacturing is estimated to outpace construc-tion in the future, the latter will have higher employment effects due to its low development in productivity. The employment effects of house-building activities are based on the growing proportion of renovations, refurbishments and smaller repairs. Instead of new construction projects, the industry will focus on renova-tions and repairs. In terms of university education, the anticipation results based on the basic scenario indicate a reduction of about 10% from current entrant numbers. Conversely, the target scenario suggests a need to increase the number of entrants slightly. Raising the completion rate in the subfield will also require continued attention in the future, because those completing upper secondary VET currently account for 70% of entrants, while the equivalent figure for polytechnic and university education is just over half.
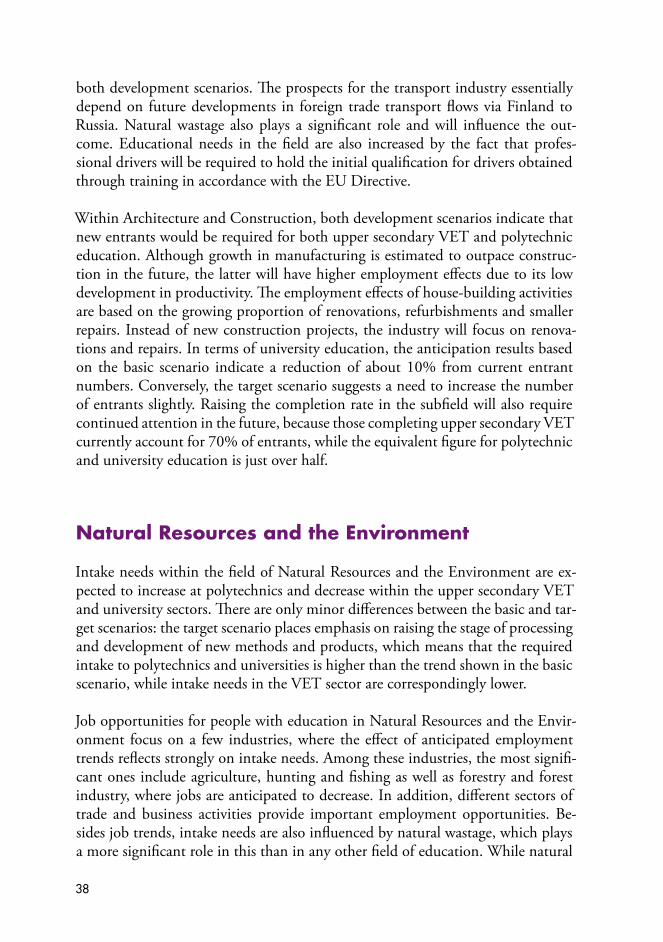
Natural Resources and the Environment
Intake needs within the field of Natural Resources and the Environment are ex-pected to increase at polytechnics and decrease within the upper secondary VET and university sectors. There are only minor differences between the basic and tar-get scenarios: the target scenario places emphasis on raising the stage of processing and development of new methods and products, which means that the required intake to polytechnics and universities is higher than the trend shown in the basic scenario, while intake needs in the VET sector are correspondingly lower.
Job opportunities for people with education in Natural Resources and the Envir-onment focus on a few industries, where the effect of anticipated employment trends reflects strongly on intake needs. Among these industries, the most signifi-cant ones include agriculture, hunting and fishing as well as forestry and forest industry, where jobs are anticipated to decrease. In addition, different sectors of trade and business activities provide important employment opportunities. Be-sides job trends, intake needs are also influenced by natural wastage, which plays a more significant role in this than in any other field of education. While natural
��
wastage from the entire employed labour force will stand at about 40% over the 2005–2020 period, the figure for occupations employing people with education in Natural Resources and the Environment is 50%. This is due both to the high age of employed people and to the health risks involved in the work assignments.
Increases in the Agriculture subfield will focus on upper secondary VET and poly-technic sectors. The Forestry subfield is facing needs to reduce intake at all levels of education – provided that the retention rate in forestry occupations of voca-tional qualification-holders in particular improves. Other subfields will mostly need to reduce their intake.
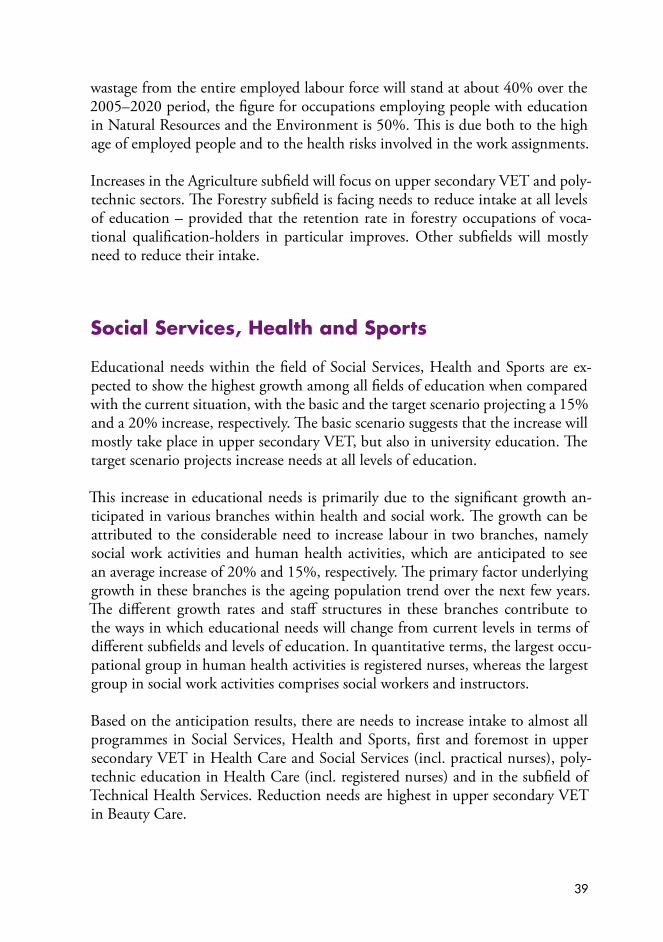
Social Services, Health and Sports
Educational needs within the field of Social Services, Health and Sports are ex-pected to show the highest growth among all fields of education when compared with the current situation, with the basic and the target scenario projecting a 15% and a 20% increase, respectively. The basic scenario suggests that the increase will mostly take place in upper secondary VET, but also in university education. The target scenario projects increase needs at all levels of education.
This increase in educational needs is primarily due to the significant growth an-ticipated in various branches within health and social work. The growth can be attributed to the considerable need to increase labour in two branches, namely social work activities and human health activities, which are anticipated to see an average increase of 20% and 15%, respectively. The primary factor underlying growth in these branches is the ageing population trend over the next few years. The different growth rates and staff structures in these branches contribute to the ways in which educational needs will change from current levels in terms of different subfields and levels of education. In quantitative terms, the largest occu-pational group in human health activities is registered nurses, whereas the largest group in social work activities comprises social workers and instructors.
Based on the anticipation results, there are needs to increase intake to almost all programmes in Social Services, Health and Sports, first and foremost in upper secondary VET in Health Care and Social Services (incl. practical nurses), poly-technic education in Health Care (incl. registered nurses) and in the subfield of Technical Health Services. Reduction needs are highest in upper secondary VET in Beauty Care.
�0
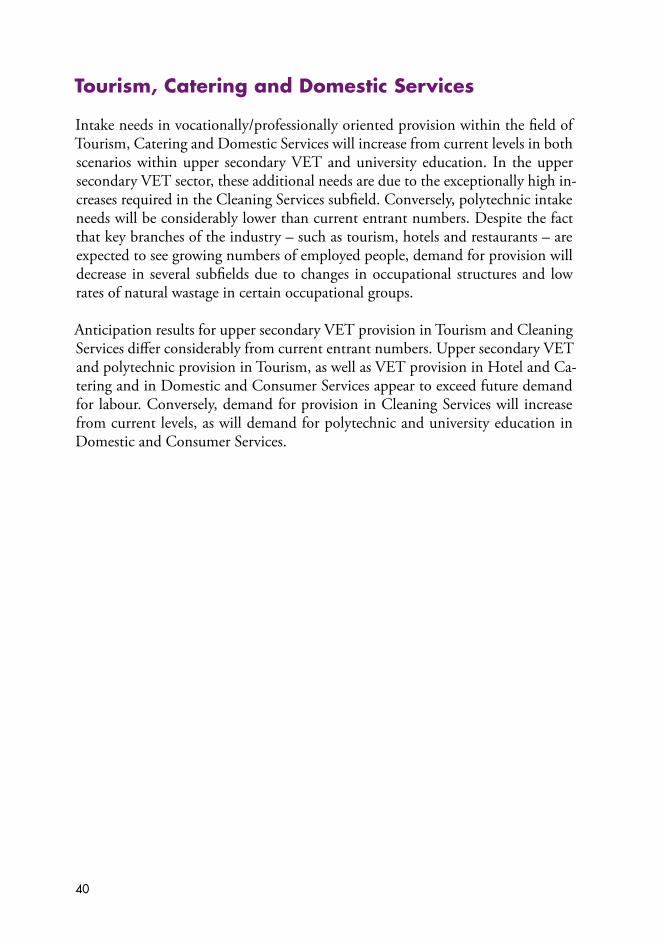
Tourism, Catering and Domestic Services
Intake needs in vocationally/professionally oriented provision within the field of Tourism, Catering and Domestic Services will increase from current levels in both scenarios within upper secondary VET and university education. In the upper secondary VET sector, these additional needs are due to the exceptionally high in-creases required in the Cleaning Services subfield. Conversely, polytechnic intake needs will be considerably lower than current entrant numbers. Despite the fact that key branches of the industry – such as tourism, hotels and restaurants – are expected to see growing numbers of employed people, demand for provision will decrease in several subfields due to changes in occupational structures and low rates of natural wastage in certain occupational groups. Anticipation results for upper secondary VET provision in Tourism and Cleaning Services differ considerably from current entrant numbers. Upper secondary VET and polytechnic provision in Tourism, as well as VET provision in Hotel and Ca-tering and in Domestic and Consumer Services appear to exceed future demand for labour. Conversely, demand for provision in Cleaning Services will increase from current levels, as will demand for polytechnic and university education in Domestic and Consumer Services.

��
USE OF ANTICIPATION INFORMATION AND
DEVELOPMENT OF ANTICIPATION
Anticipation of labour and educational needs has been an established part of the development of vocational/professional education and training in Finland for several decades now. The Finnish Government also highlights the significance of anticipation and development of co-operation in anticipation efforts. This stems from a common concern about the adequate supply of labour during the next decade, when employees will retire in much higher numbers than at present. This is why it is absolutely necessary to match the supply of labour with demand as effectively as possible. Vocationally/professionally oriented education and training is required to provide sufficient amounts of labour for different fields and areas. The young age groups entering these programmes (see Figure 4, page 16) will begin to dwindle before the mid-2010’s. The difference between demand for la-bour and the supply of young labour will increase. This means that the adult population will play an increasingly significant role in the supply of labour.
Recent years have seen an increase in the utilisation of anticipation data as part of decision-making processes. The aim is to utilise the results more systematic-ally on national, regional, provider and institutional levels, to further raise the level of anticipation know-how and to develop co-operation and methodologies. Anticipation information on educational needs is required when seeking solu-tions to challenges due to Finland’s demographic development and the increasing impact of the global economy. At a regional level, these effects are often stronger when compared with the perspective of the whole country. Regional demographic changes or a major company’s decision to relocate production away from Finland may permanently change a region’s conditions for development. Vocationally/pro-fessionally oriented education and training aims to meet such future challenges by enhancing the match between educational provision and labour market demand and by paying more attention to development needs in different regions.
Anticipation information on educational needs will cater for preparation of the Development Plans for Education and Research adopted periodically by the Gov-ernment, steering and regional distribution of educational provision and planning of educational resources, among other things. In addition, anticipation informa-tion will steer application for education and work and promote identification and abolishment of bottlenecks related to the labour force. Planning of studies and
�2
steering of the labour force will call for diverse anticipation information modified into a form understandable to students and job seekers.
At the Finnish National Board of Education, anticipation efforts have been carried out as broad co-operation between different administrative branches and regional parties. Within the educational administration, anticipation has been co-ord- inated by the Ministry of Education, while practical anticipation work has been carried out by the Finnish National Board of Education, which has also provided support for regional anticipation work managed by the Regional Councils. An-ticipation of industry changes has provided the point of reference for anticipation of educational needs. The Ministry of Labour has been responsible for industry forecasts. Continuing co-operation in anticipation work and its consolidation be-tween different administrative branches are prerequisites for successful anticipa-tion efforts, complete with co-operation with regional anticipation bodies. The Finnish National Board of Education is also partially responsible for administra-tion of projects funded by the European Social Fund (ESF).
The intention is to further increase the impact of anticipation on education and training. An investigation is being conducted during 2009 into development of and networking in anticipation of labour and educational needs between differ-ent ministries, division of responsibilities, co-ordination and increasing the ef-fectiveness of anticipation on decision-making processes. At a national level, a cross-ministerial Government Anticipation Network has already been set up to promote use and production of anticipation information.
Anticipation projects co-funded by the European Social Fund have contributed to development of anticipation methods, tools and co-operation. In addition, there have been several other development projects aiming to increase anticipation know-how. Anticipation of educational provision is strongly linked to changes in occupations and skills needs, which is why the parties aim to further consolidate co-operation between quantitative and qualitative anticipation. The Finnish Na-tional Board of Education has launched an ESF-funded project for the 2008–2011 period, which is geared towards development of national anticipation of vocation-al and professional skills needs. The objective is to create a permanent system to produce information on skills needs at all levels of education for purposes such as preparation of National Core Curricula and Qualification Requirements as well as education providers’ own local curricula. At the same time, anticipation of skills needs will also support quantitative anticipation of educational needs. Alongside national development, it is also important to participate in development of the European anticipation system (within CEDEFOP).
��
Education and research 2007–2012. Development Plan. Ministry of Education. Helsinki 2007.[Available at: http://www.minedu.fi/OPM/Julkaisut/2008/Koulutus_ja_ tutkimus_2007_2012._Kehittamisuunnitelma?lang=en]
Education and Science in Finland. Ministry of Education publications 2008:25. Helsinki.[Available at: http://www.minedu.fi/export/sites/default/OPM/Julkaisut/2008/ liitteet/opm25.pdf?lang=en]
The Education System in Finland, 2007/08. National Board of Education. Eurydice.[Available at: http://eacea.ec.europa.eu/ressources/eurydice/eurybase/pdf/0_ integral/FI_EN.pdf ]
Hanhijoki I, Katajisto J, Kimari M, Savioja H. Koulutus ja työvoiman kysyntä 2020. Tulevaisuuden työpaikat – osaajia tarvitaan. Opetushallitus. Edita Prima Oy. Helsinki 2009.[Education, Training and Demand for Labour by 2020. Jobs for the future – skilled labour required.Available at: http://www.oph.fi/julkaisut/2009/koulutus_ja_tyovoiman_ kysynta_2020.pdf ]
Hanhijoki I, Kantola S, Karikorpi M, Katajisto J, Kimari M, Savioja H.Koulutus ja työvoiman kysyntä 2015. Valtakunnallisia ja alueellisia laskelmia. Hakapaino Oy. Helsinki 2004.[Education, Training and Demand for Labour in 2015. National and regional estimates. Finnish National Board of Education. Hakapaino Oy. Helsinki 2004. Summary available in English.] Hanhijoki I, Katajisto J, Kimari M, Lehtinen J, Taipale-Lehto U.Demand for Educated Labour in Finland by the Year 2010 and the Dimension-ing of Education and Training. Abridged English version of an anticipation
LITERATURE ON ANTICIPATION OF LABOUR
AND EDUCATIONAL NEEDS AND THE FINNISH EDUCATION SYSTEM
��
publication entitled Vocational education and training 2010. Demand for labour in 2010 and dimensioning of vocational education and training. National Board of Education. Hakapaino Oy. Helsinki 2000.
Statistics Finland. Finland in Figures 2008. Helsinki 2008.[Available at: www.stat.fi]
Työvoima 2025. Täystyöllisyys, korkea tuottavuus ja hyvät työpaikat hyvinvoin-nin perustana työikäisen väestön vähentyessä. Työministeriö, Työpoliittinen tutkimus 325/2007. Helsinki 2007.[Labour Force 2025. Full employment, high productivity and good jobs will provide the foundation for well being as the working age population diminishes. Ministry of Labour Employment Policy Report No. 325. Oy Edita Ab. Helsinki 2007. Summary available in English.]
Vocational education and training in Finland. CEDEFOP (European Centre for the Development of Vocational Training), Office for Official Publications of the European Communities.[Available at: http://www.cedefop.europa.eu/etv/Information_resources/ NationalVet/Thematic/criteria_reply.asp]

��
Further information is available on the Internet at:www.oph.fiwww.edu.fi
Contacts at the Finnish National Board of Education:
Mr. Matti Kimari, Counsellor of Education (general topics, education and training in Social Services, Health and Sports)Tel. +358 40 348 7750E-mail: [email protected]
Mr. Ilpo Hanhijoki, Counsellor of Education (general topics, natural wastage, education and training in Social Sciences, Business and Administration, Natural Sciences and Natural Resources and the Environment)Tel. +358 40 348 7805E-mail: [email protected]
Mr. Jukka Katajisto, Counsellor of Education (education and training in Culture and Humanities and Education, Tourism, Catering and Domestic Services)Tel. +358 40 348 7949E-mail: [email protected]
Ms. Hannele Savioja, Counsellor of Education (education and training in Technology, Communications and Transport)Tel. +358 40 348 7780E-mail: [email protected]
Address:Finnish National Board of EducationP.O. Box 380FI-00531 HelsinkiFINLANDTel. +358 40 348 7555Fax +358 40 348 7865
CONTACT INFORMATION
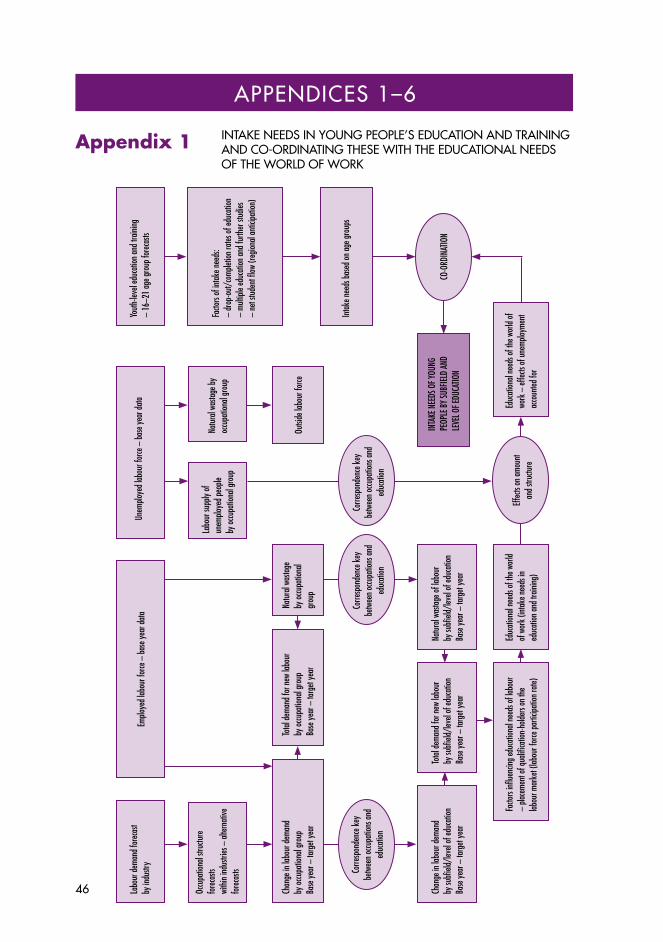
��
INTAKE NEEDS IN YOUNG PEOPLE’S EDUCATION AND TRAINING AND CO-ORDINATING THESE WITH THE EDUCATIONAL NEEDS OF THE WORLD OF WORK
APPENDICES �–�
Appendix 1La
bour
dema
ndfo
reca
stby
indu
stry
yout
h-lev
eled
ucat
ionan
dtra
ining
–16
–21
ageg
roup
fore
casts
Emplo
yedl
abou
rfor
ce–
base
year
data
Unem
ploye
dlab
ourf
orce
–ba
seye
arda
ta
Labo
ursu
pply
of
unem
ploye
dpeo
ple
byoc
cupa
tiona
lgro
up
Natu
ralw
asta
geby
oc
cupa
tiona
lgro
up
Outsi
dela
bour
force
Natu
ralw
asta
ge
byoc
cupa
tiona
lgr
oup
tota
ldem
andf
orn
ewla
bour
by
occu
patio
nalg
roup
Base
year
–ta
rget
year
chan
gein
labo
urde
mand
by
occu
patio
nalg
roup
Ba
seye
ar–
targ
etye
ar
tota
ldem
andf
orn
ewla
bour
by
subfi
eld/le
velo
fedu
catio
nBa
seye
ar–
targ
etye
ar
corre
spon
denc
ekey
be
twee
noc
cupa
tions
and
educ
ation
chan
gein
labo
urde
mand
by
subfi
eld/le
velo
fedu
catio
nBa
seye
ar–
targ
etye
ar
Educ
ation
alne
edso
fthe
wor
ld
ofw
ork
(inta
ken
eeds
in
educ
ation
andt
raini
ng)
Natu
ralw
asta
geof
labo
ur
bysu
bfield
/leve
lofe
duca
tion
Base
year
–ta
rget
year
INtA
KEN
EEDS
OFy
OUNg
PE
OPLE
By
SUBF
IELD
AND
LEVE
LOFE
DUcA
tION
cO-O
RDIN
AtIO
N
Effe
ctson
amou
nt
ands
tructu
re
Facto
rsof
inta
ken
eeds
:–
drop
-out
/com
pletio
nra
tesof
educ
ation
–mu
ltiple
educ
ation
andf
urth
erst
udies
–ne
tstu
dent
flow
(reg
ional
antic
ipatio
n)
Inta
ken
eeds
base
don
ageg
roup
s
Facto
rsinfl
uenc
inged
ucat
ional
need
sofl
abou
r–
place
ment
ofqu
alific
ation
-hold
erso
nth
elab
ourm
arke
t(lab
ourf
orce
parti
cipat
ionra
te)
Educ
ation
alne
edso
fthe
wor
ldof
wo
rk–
effe
ctsof
une
mploy
ment
ac
coun
tedfo
r
Occu
patio
nals
tructu
re
fore
casts
wi
thin
indus
tries
–al
terna
tive
fore
casts
corre
spon
denc
ekey
be
twee
noc
cupa
tions
and
educ
ation
corre
spon
denc
ekey
be
twee
noc
cupa
tions
and
educ
ation

��
Appendix 2 STATISTICAL DATA USED IN ANTICIPATION AND SOURCES
Data Statistics source
New students, entrant data (youth-level education and training)
Finnish National Board of Education, The Ministry of Education, Statistics Finland
New students’ progress, student and qualification data, expected completion rate (completion of education)
Statistics Finland, The Ministry of Education
Qualification-holders by subsequent education (multiple education and further study tracks)
Statistics Finland
Main occupation of the population (labour force participation rate)
Statistics Finland
Retirement and mortality statistics (natural wastage) Statistics Finland, Finnish Centre for Pensions
Population forecast (size of the young age group) Statistics Finland
Unemployment data The Ministry of Employment and the Economy
Occupational and educational data of employed people (correspondence key)
Statistics Finland
Industry and occupational data Statistics Finland
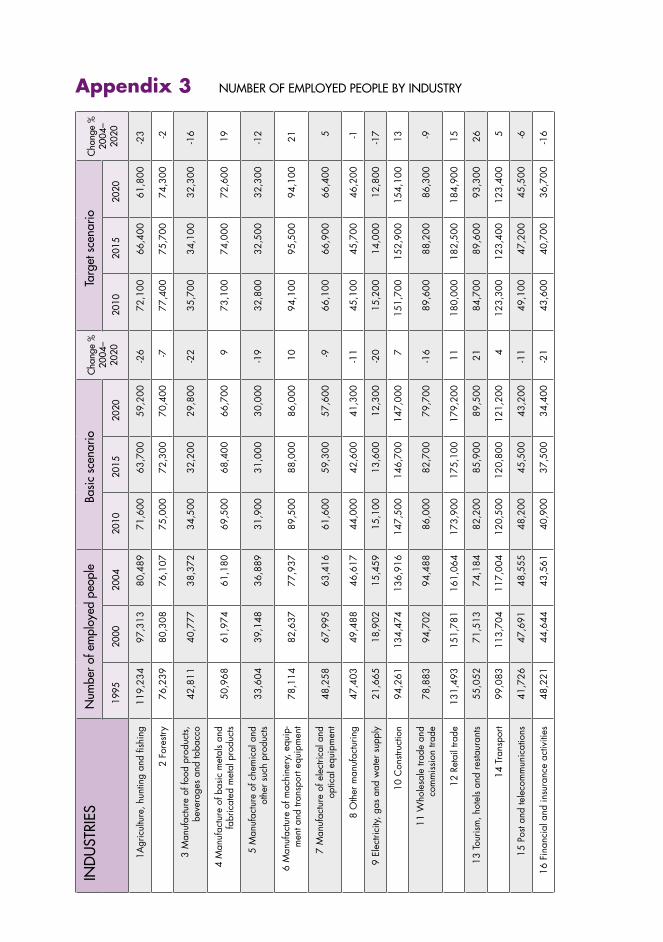
��
Appendix 3 NUMBER OF EMPLOYED PEOPLE BY INDUSTRYIN
DU
STRI
ESN
umbe
r of e
mpl
oyed
peo
ple
Basic
sce
nario
Cha
nge
%20
0�–
2020
Targ
et s
cena
rioC
hang
e %
200�
– 20
20��
��20
0020
0�20
�020
��20
2020
�020
��20
20
1Agr
icul
ture
, hun
ting
and
fishi
ng11
9,23
497
,313
80,4
8971
,600
63,7
0059
,200
-26
72,1
0066
,400
61,8
00-2
3
2 Fo
restr
y76
,239
80,3
0876
,107
75,0
0072
,300
70,4
00-7
77,4
0075
,700
74,3
00-2
3 M
anuf
actu
re o
f foo
d pr
oduc
ts,
beve
rage
s an
d to
bacc
o42
,811
40,7
7738
,372
34,5
0032
,200
29,8
00-2
235
,700
34,1
0032
,300
-16
4 M
anuf
actu
re o
f bas
ic m
etal
s an
d fa
bric
ated
met
al p
rodu
cts
50,9
6861
,974
61,1
8069
,500
68,4
0066
,700
973
,100
74,0
0072
,600
19
5 M
anuf
actu
re o
f che
mic
al a
nd
othe
r suc
h pr
oduc
ts33
,604
39,1
4836
,889
31,9
0031
,000
30,0
00-1
932
,800
32,5
0032
,300
-12
6 M
anuf
actu
re o
f mac
hine
ry, e
quip
- m
ent a
nd tr
ansp
ort e
quip
men
t78
,114
82,6
3777
,937
89,5
0088
,000
86,0
0010
94,1
0095
,500
94,1
0021
7 M
anuf
actu
re o
f ele
ctric
al a
nd
optic
al e
quip
men
t48
,258
67,9
9563
,416
61,6
0059
,300
57,6
00-9
66,1
0066
,900
66,4
005
8 O
ther
man
ufac
turin
g47
,403
49,4
8846
,617
44,0
0042
,600
41,3
00-1
145
,100
45,7
0046
,200
-1
9 El
ectri
city,
gas
and
wat
er s
uppl
y21
,665
18,9
0215
,459
15,1
0013
,600
12,3
00-2
015
,200
14,0
0012
,800
-17
10 C
onstr
uctio
n94
,261
134,
474
136,
916
147,
500
146,
700
147,
000
715
1,70
015
2,90
015
4,10
013
11
Who
lesa
le tr
ade
and
com
miss
ion
trade
78,8
8394
,702
94,4
8886
,000
82,7
0079
,700
-16
89,6
0088
,200
86,3
00-9
12
Reta
il tra
de13
1,49
315
1,78
116
1,06
417
3,90
017
5,10
017
9,20
011
180,
000
182,
500
184,
900
15
13
Tour
ism, h
otel
s an
d re
staur
ants
55,0
5271
,513
74,1
8482
,200
85,9
0089
,500
2184
,700
89,6
0093
,300
26
14
Tran
spor
t99
,083
113,
704
117,
004
120,
500
120,
800
121,
200
412
3,30
012
3,40
012
3,40
05
15
Post
and
tele
com
mun
icat
ions
41,7
2647
,691
48,5
5548
,200
45,5
0043
,200
-11
49,1
0047
,200
45,5
00-6
16
Fina
ncia
l and
insu
ranc
e ac
tiviti
es48
,221
44,6
4443
,561
40,9
0037
,500
34,4
00-2
143
,600
40,7
0036
,700
-16

��
17
Man
agem
ent o
f rea
l esta
te,
com
bine
d fa
cilit
ies
supp
ort a
ctiv
ities
, cl
eani
ng, s
ewag
e an
d re
fuse
disp
osal
, sa
nita
tion
and
simila
r act
iviti
es
45,9
4357
,225
63,4
3268
,500
71,0
0073
,800
1670
,000
72,3
0075
,000
18
18
Tech
nica
l bus
ines
s ac
tiviti
es64
,488
97,5
5310
3,94
411
8,80
011
9,50
012
0,70
016
126,
200
128,
300
131,
000
26
19 C
omm
erci
al a
nd a
dmin
istra
tive
busin
ess
activ
ities
50,0
0681
,609
93,7
5810
5,20
010
5,80
010
6,90
014
111,
600
113,
500
115,
900
24
20
Publ
ic a
dmin
istra
tion
and
com
pulso
ry s
ocia
l sec
urity
73,9
2876
,931
75,0
2869
,000
68,5
0067
,600
-10
69,8
0068
,800
68,1
00-9
21
Def
ence
act
iviti
es a
nd p
ublic
ord
er46
,179
48,5
2649
,377
48,9
0048
,600
48,1
00-3
49,5
0049
,000
48,7
00-1
22
Educ
atio
n an
d re
sear
ch14
4,40
816
6,11
117
3,26
116
9,20
016
9,40
016
6,70
0-4
175,
200
175,
400
174,
400
1
23 H
uman
hea
lth a
ctiv
ities
136,
933
154,
285
165,
635
174,
800
182,
700
187,
300
1317
9,20
018
5,50
019
3,00
017
24
Soci
al w
ork
activ
ities
117,
271
151,
174
162,
983
185,
200
190,
300
193,
000
1818
6,10
019
2,90
020
0,20
023
25 A
ctiv
ities
of m
embe
rshi
p or
gani
satio
ns26
,797
35,7
1939
,080
39,1
0039
,200
38,5
00-1
40,3
0040
,700
41,4
006
26 R
ecre
atio
nal,
cultu
ral a
nd s
porti
ng
activ
ities
and
pub
lishi
ng65
,622
75,2
9475
,843
79,6
0080
,700
81,3
007
81,5
0082
,500
83,7
0010
27 O
ther
ser
vice
act
iviti
es36
,485
38,2
4341
,686
43,9
0045
,400
46,5
0012
46,9
0049
,800
52,5
0026
28 In
dustr
y un
know
n57
,677
48,8
3646
,094
47,7
0047
,500
47,4
003
49,3
0049
,700
49,9
008
TOTA
L1,
932,
752
2,22
8,55
72,
262,
359
2,34
1,80
02,
333,
900
2,32
5,30
03
2,41
9,20
02,
437,
700
2,45
0,80
08
Sour
ces:
Sta
tistic
s Fi
nlan
d (y
ears
199
5, 2
000,
200
4), T
he M
inist
ry o
f Lab
our (
year
s 20
10, 2
015,
202
0)
APPENDIX 3
IND
UST
RIES
Num
ber o
f em
ploy
ed p
eopl
eBa
sic s
cena
rioC
hang
e %
200�
–20
20
Targ
et s
cena
rioC
hang
e %
200�
– 20
20��
��20
0020
0�20
�020
��20
2020
�020
��20
20

�0
O
CC
UPA
TIO
NA
L G
ROU
PSM
edia
n
age
1)
Num
ber o
f em
ploy
ed
peop
le �)
Nat
ural
w
asta
geBa
sic s
cena
rioTa
rget
sce
nario
Cha
nge
Job
open
ings
Cha
nge
Job
open
ings
2004
2004
2005
–202
020
05–2
020
2005
–202
020
05–2
020
2005
–202
0
1AG
RIC
ULT
URA
L A
ND
FO
REST
Ry W
ORK
4610
5,40
054
,600
-23,
400
31,2
00-2
1,10
033
,500
1.1
Agr
icul
tura
l and
hor
ticul
tura
l wor
kers
4785
,700
46,5
00-2
3,70
022
,800
-24,
000
22,5
00
1.2
Hor
ticul
tura
l and
agr
icul
tura
l lab
oure
rs19
2,80
050
01,
700
2,20
02,
400
2,90
0
1.3
Fore
stry
wor
kers
449,
600
4,60
0-7
003,
900
-500
4,10
0
1.4
Agr
icul
tura
l and
fore
stry
prof
essio
nals
447,
300
3,00
0-7
002,
300
1,00
04,
000
2 M
AN
UFA
CTU
RIN
G W
ORK
4144
8,70
017
9,30
0-1
0,70
016
8,60
018
,300
197,
600
2.1
Food
wor
kers
3822
,400
8,10
0-2
,700
5,40
0-3
,900
4,20
0
2.2
Text
iles,
clo
thin
g an
d le
athe
r wor
kers
4616
,300
8,10
0-4
,600
3,50
0-3
,300
4,80
0
2.3
Met
al w
orke
rs42
71,6
0031
,400
2,70
034
,100
6,60
038
,000
2.4
Mac
hine
ry m
echa
nics
4161
,100
24,8
00-2
0024
,600
100
24,9
00
2.5
Mec
hani
cal e
ngin
eers
4431
,300
13,2
002,
400
15,6
008,
100
21,3
00
2.6
Con
struc
tion
and
indu
stria
l equ
ipm
ent o
pera
tors
4421
,000
10,0
0010
010
,100
-1,2
008,
800
2.7
Woo
d-pr
oces
sing
wor
kers
and
tech
nici
ans
4229
,700
12,3
001,
600
13,9
006,
700
19,0
00
2.8
Che
mic
al p
roce
ss w
orke
rs41
45,9
0018
,700
-6,9
0011
,800
-8,6
0010
,100
2.9
Che
mic
al p
roce
ss e
ngin
eers
439,
900
4,00
0-4
003,
600
2,10
06,
100
2.10
Ele
ctric
al a
nd e
lect
roni
cs w
orke
rs39
47,0
0017
,400
100
17,5
00-9
0016
,500
2.11
Ele
ctric
al a
nd e
lect
roni
cs e
ngin
eers
3736
,200
9,00
060
09,
600
9,30
018
,300
2.12
Gra
phic
s w
orke
rs42
14,1
005,
700
-1,4
004,
300
-200
5,50
0
2.13
Pac
kagi
ng a
nd a
ssem
bly
wor
kers
4012
,700
5,30
0-2
,300
3,00
0-2
,800
2,50
0
2.14
Man
ager
s an
d ot
her p
rofe
ssio
nals
in m
anuf
actu
ring
4229
,500
11,3
0030
011
,600
6,30
017
,600
Appendix 4 NATURAL WASTAGE, CHANGE IN THE NUMBER OF EMPLOyED PEOPLE AND JOB OPENINGS By OCCUPATIONAL GROUP, 2005–2020

��
O
CC
UPA
TIO
NA
L G
ROU
PSM
edia
n
age
1)
Num
ber o
f em
ploy
ed
peop
le �)
Nat
ural
w
asta
geBa
sic s
cena
rioTa
rget
sce
nario
Cha
nge
Job
open
ings
Cha
nge
Job
open
ings
2004
2004
2005
–202
020
05–2
020
2005
–202
020
05–2
020
2005
–202
0
3 C
ON
STRU
CTI
ON
WO
RK43
132,
500
59,3
009,
000
68,3
0018
,100
77,4
00
3.1
Con
struc
tion
wor
kers
4178
,000
34,0
006,
800
40,8
008,
700
42,7
00
3.2
Hea
ting,
plu
mbi
ng a
nd v
entil
atio
n fit
ters
4212
,900
5,80
01,
900
7,70
03,
500
9,30
0
3.3
Build
ing
pain
ters
435,
700
2,60
010
02,
700
900
3,50
0
3.4
Man
ager
s an
d pr
ofes
siona
ls in
con
struc
tion
4635
,900
16,9
0020
017
,100
5,00
021
,900
4 TR
AN
SPO
RT A
ND
LO
GIS
TIC
S W
ORK
4112
9,20
052
,900
-1,0
0051
,900
500
53,4
00
4.1
Land
tran
spor
t wor
kers
and
ent
repr
eneu
rs43
76,6
0035
,200
2,30
037
,500
4,80
040
,000
4.2
Wat
er tr
affic
ope
rato
rs a
nd o
ffice
rs46
3,30
01,
900
-400
1,50
0-3
001,
600
4.3
Air
trans
port
man
ager
s an
d pr
ofes
siona
ls39
1,30
050
010
060
020
070
0
4.4
War
ehou
se w
orke
rs a
nd fo
rwar
ding
age
nts
3648
,000
15,3
00-3
,000
12,3
00-4
,200
11,1
00
5 SE
RVIC
E W
ORK
4051
1,20
018
9,10
027
,300
216,
400
53,1
0024
2,20
0
5.1
Prop
erty
man
ager
s an
d bu
ildin
g ca
reta
kers
4628
,700
15,1
001,
400
16,5
00-1
,300
13,8
00
5.2
Cle
aner
s45
85,5
0041
,900
-700
41,2
00-3
,700
38,2
00
5.3
Mer
chan
ts an
d sa
les
wor
kers
3819
8,40
062
,800
10,3
0073
,100
22,2
0085
,000
5.4
Man
ager
s an
d pr
ofes
siona
ls in
trad
e43
52,9
0020
,400
4,30
024
,700
16,5
0036
,900
5.5
Resta
uran
t and
cat
erin
g w
orke
rs35
68,2
0020
,900
8,80
029
,700
9,00
029
,900
5.6
Hot
el, r
esta
uran
t and
cat
erin
g m
anag
ers
and
prof
essio
nals
4322
,400
9,50
04,
900
14,4
007,
700
17,2
00
5.7
Trav
el s
ervi
ce w
orke
rs39
6,10
01,
700
1,00
02,
700
3,30
05,
000
5.8
Beau
ty c
are
wor
kers
4014
,400
5,00
050
05,
500
3,10
08,
100
5.9
Oth
er s
ervi
ce w
orke
rs36
34,6
0011
,800
-3,2
008,
600
-3,7
008,
100
APPENDIX 4

�2
O
CC
UPA
TIO
NA
L G
ROU
PSM
edia
n
age
1)
Num
ber o
f em
ploy
ed
peop
le �)
Nat
ural
w
asta
geBa
sic s
cena
rioTa
rget
sce
nario
Cha
nge
Job
open
ings
Cha
nge
Job
open
ings
2004
2004
2005
–202
020
05–2
020
2005
–202
020
05–2
020
2005
–202
0
6 O
FFIC
E W
ORK
4423
7,80
010
3,00
0-2
6,30
076
,700
-56,
400
46,6
00
6.1
Offi
ce w
orke
rs in
bus
ines
s ad
min
istra
tion
4612
1,10
057
,100
-17,
400
39,7
00-3
8,60
018
,500
6.2
Oth
er o
ffice
wor
kers
4084
,600
31,4
00-8
,400
23,0
00-1
7,00
014
,400
6.3
Offi
ce w
ork
man
ager
s an
d pr
ofes
siona
ls45
32,1
0014
,500
-500
14,0
00-8
0013
,700
7 H
EALT
H A
ND
SO
CIA
L W
ORK
4329
0,70
012
1,60
059
,100
180,
700
88,7
0021
0,30
0
7.1
Prac
tical
nur
ses
4356
,900
24,1
009,
500
33,6
0014
,900
39,0
00
7.2
Nur
ses
and
othe
r hea
lth c
are
prof
essio
nals
4281
,100
29,0
0022
,800
51,8
0031
,400
60,4
00
7.3
Med
ical
doc
tors
and
oth
er h
ealth
pro
fess
iona
ls44
24,3
009,
800
4,10
013
,900
7,50
017
,300
7.4
Soci
al s
ervi
ces
wor
kers
and
instr
ucto
rs43
115,
400
52,4
0017
,100
69,5
0024
,500
76,9
00
7.5
Soci
al w
ork
prof
essio
nals
448,
100
3,50
05,
800
9,30
09,
800
13,3
00
7.6
Hea
lth a
nd s
ocia
l ser
vice
s m
anag
ers
494,
900
2,80
0-2
002,
600
600
3,40
0
8 TE
AC
HIN
G A
ND
ED
UC
ATIO
N42
131,
900
49,1
0030
049
,400
10,5
0059
,600
8.1
Teac
hing
pro
fess
iona
ls42
131,
900
49,1
0030
049
,400
10,5
0059
,600
9 C
ULT
URA
L A
ND
CO
MM
UN
ICAT
ION
S W
ORK
4239
,100
15,2
004,
100
19,3
0011
,500
26,7
00
9.1
Cra
fts a
nd d
esig
n w
orke
rs43
1,40
060
00
600
600
1,20
0
9.2
Arti
sts a
nd o
ther
arti
stic
prof
essio
nals
3911
,100
3,20
080
04,
000
3,10
06,
300
9.3
Arti
stic
and
cultu
ral s
ervi
ces
man
ager
s an
d pr
oduc
ers
466,
400
3,30
01,
800
5,10
01,
900
5,20
0
9.4
Libra
rians
, arc
hivi
sts a
nd c
urat
ors
463,
800
1,80
030
02,
100
1,00
02,
800
9.5
Publ
ic re
latio
ns p
rofe
ssio
nals
and
jour
nalis
ts42
16,4
006,
300
1,20
07,
500
4,90
011
,200
APPENDIX 4
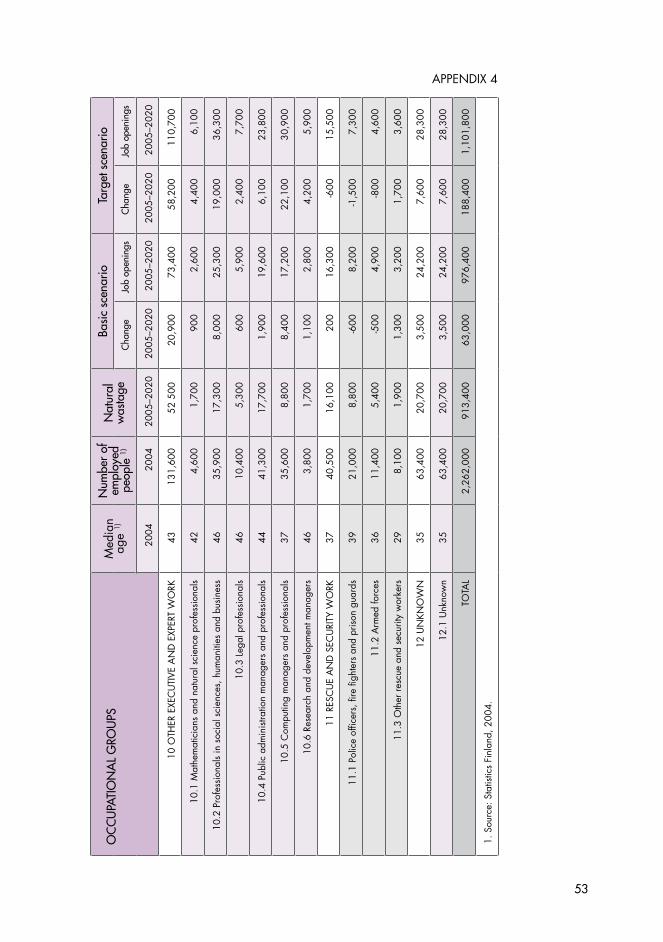
��
O
CC
UPA
TIO
NA
L G
ROU
PSM
edia
n
age
1)
Num
ber o
f em
ploy
ed
peop
le �)
Nat
ural
w
asta
geBa
sic s
cena
rioTa
rget
sce
nario
Cha
nge
Job
open
ings
Cha
nge
Job
open
ings
2004
2004
2005
–202
020
05–2
020
2005
–202
020
05–2
020
2005
–202
0
10 O
THER
EXE
CU
TIVE
AN
D E
XPER
T W
ORK
4313
1,60
052
500
20,9
0073
,400
58,2
0011
0,70
0
10.1
Mat
hem
atic
ians
and
nat
ural
sci
ence
pro
fess
iona
ls42
4,60
01,
700
900
2,60
04,
400
6,10
0
10.2
Pro
fess
iona
ls in
soc
ial s
cien
ces,
hum
aniti
es a
nd b
usin
ess
4635
,900
17,3
008,
000
25,3
0019
,000
36,3
00
10.3
Leg
al p
rofe
ssio
nals
4610
,400
5,30
060
05,
900
2,40
07,
700
10.4
Pub
lic a
dmin
istra
tion
man
ager
s an
d pr
ofes
siona
ls44
41,3
0017
,700
1,90
019
,600
6,10
023
,800
10.5
Com
putin
g m
anag
ers
and
prof
essio
nals
3735
,600
8,80
08,
400
17,2
0022
,100
30,9
00
10.6
Res
earc
h an
d de
velo
pmen
t man
ager
s46
3,80
01,
700
1,10
02,
800
4,20
05,
900
11 R
ESC
UE
AN
D S
ECU
RITy
WO
RK37
40,5
0016
,100
200
16,3
00-6
0015
,500
11.1
Pol
ice
offic
ers,
fire
figh
ters
and
pris
on g
uard
s39
21,0
008,
800
-600
8,20
0-1
,500
7,30
0
11.2
Arm
ed fo
rces
3611
,400
5,40
0-5
004,
900
-800
4,60
0
11.3
Oth
er re
scue
and
sec
urity
wor
kers
298,
100
1,90
01,
300
3,20
01,
700
3,60
0
12 U
NKN
OW
N35
63,4
0020
,700
3,50
024
,200
7,60
028
,300
12.1
Unk
now
n35
63,4
0020
,700
3,50
024
,200
7,60
028
,300
TOTA
L
2,26
2,00
091
3,40
063
,000
976,
400
188,
400
1,10
1,80
0
1. S
ourc
e: S
tatis
tics
Finl
and,
200
4.
APPENDIX 4

��
Appendix 5 CLASSIFICATION OF FIELDS, SUBFIELDS AND LEVELS OF EDUCATION 1)
0 General Education 001 Pre-primary education 002 Basic education 003 General upper secondary education 099 Other general education
1 Humanities and Education 101 Leisure Activities and youth Work 102 Languages 103 History and Archaeology 104 Philosophy 105 Educational Sciences and Psychology 106 Teaching and Education 107 Theology 199 Other education in Humanities and Education
2 Culture 201 Crafts and Design 202 Information and Communication 203 Literature 204 Theatre and Dance 205 Music 206 Visual Arts 207 Cultural and Arts Research 299 Other education in Culture
3 Social Sciences, Business and Administration 301 Business and Commerce 302 Economics 303 Administration 304 Statistics 305 Social Sciences 306 Political Sciences 307 Law 399 Other education in Social Sciences, Business and Administration
4 Natural Sciences 401 Mathematics 402 Computing and Software 403 Earth and Space Sciences and Astronomy 404 Physics 405 Chemistry 406 Biology 407 Geography 499 Other education in Natural Sciences
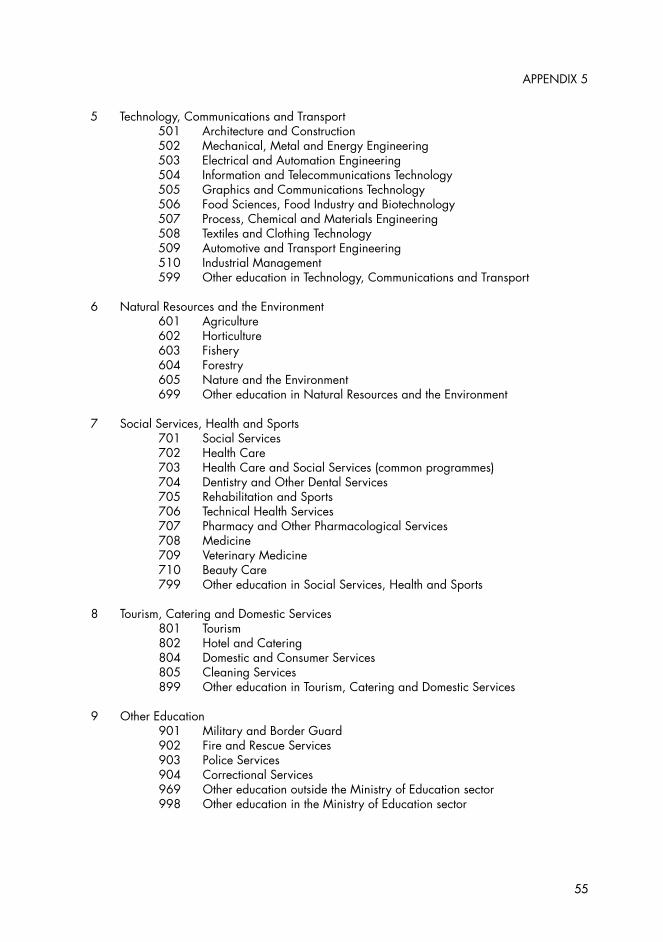
��
5 Technology, Communications and Transport 501 Architecture and Construction 502 Mechanical, Metal and Energy Engineering 503 Electrical and Automation Engineering 504 Information and Telecommunications Technology 505 Graphics and Communications Technology 506 Food Sciences, Food Industry and Biotechnology 507 Process, Chemical and Materials Engineering 508 Textiles and Clothing Technology 509 Automotive and Transport Engineering 510 Industrial Management 599 Other education in Technology, Communications and Transport
6 Natural Resources and the Environment 601 Agriculture 602 Horticulture 603 Fishery 604 Forestry 605 Nature and the Environment 699 Other education in Natural Resources and the Environment
7 Social Services, Health and Sports 701 Social Services 702 Health Care 703 Health Care and Social Services (common programmes) 704 Dentistry and Other Dental Services 705 Rehabilitation and Sports 706 Technical Health Services 707 Pharmacy and Other Pharmacological Services 708 Medicine 709 Veterinary Medicine 710 Beauty Care 799 Other education in Social Services, Health and Sports
8 Tourism, Catering and Domestic Services 801 Tourism 802 Hotel and Catering 804 Domestic and Consumer Services 805 Cleaning Services 899 Other education in Tourism, Catering and Domestic Services
9 Other Education 901 Military and Border Guard 902 Fire and Rescue Services 903 Police Services 904 Correctional Services 969 Other education outside the Ministry of Education sector 998 Other education in the Ministry of Education sector
APPENDIX 5
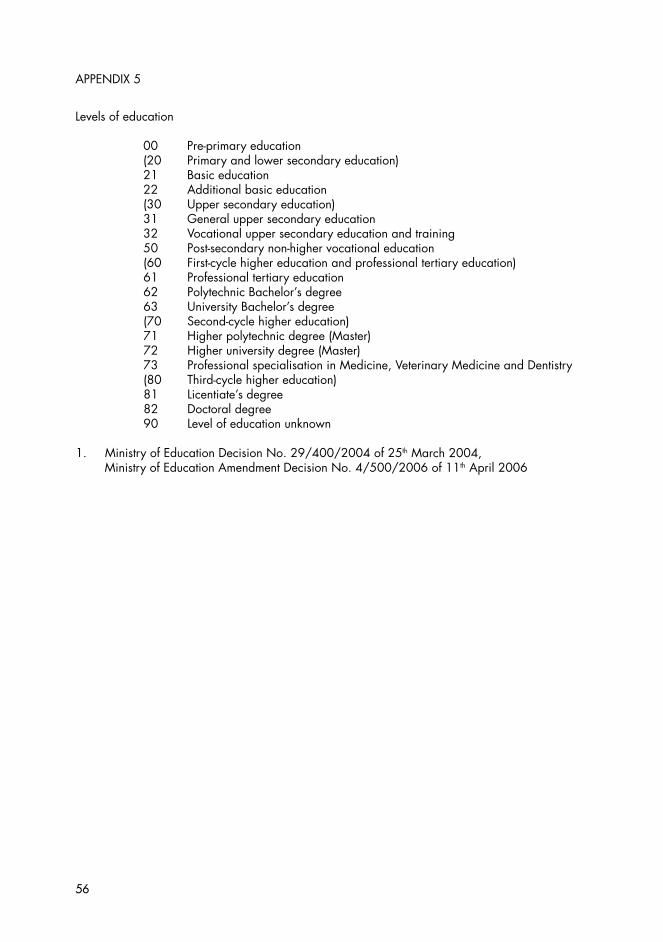
��
Levels of education
00 Pre-primary education (20 Primary and lower secondary education) 21 Basic education 22 Additional basic education (30 Upper secondary education) 31 General upper secondary education 32 Vocational upper secondary education and training 50 Post-secondary non-higher vocational education (60 First-cycle higher education and professional tertiary education) 61 Professional tertiary education 62 Polytechnic Bachelor’s degree 63 University Bachelor’s degree (70 Second-cycle higher education) 71 Higher polytechnic degree (Master) 72 Higher university degree (Master) 73 Professional specialisation in Medicine, Veterinary Medicine and Dentistry (80 Third-cycle higher education) 81 Licentiate’s degree 82 Doctoral degree 90 Level of education unknown
1. Ministry of Education Decision No. 29/400/2004 of 25th March 2004, Ministry of Education Amendment Decision No. 4/500/2006 of 11th April 2006
APPENDIX 5

��
Appendix 6 ENTRANTS IN yOUTH-LEVEL PROVISION, INTAKE NEEDS AND DEVELOPMENT PLAN TARGET
FIELD OF EDUCATION LEVEL OF EDUCATION
Entrants in youth-level provisionAverage intake needs 20��–20�� Develop-
ment Plan target for youth-level provision in 20�2
Youth-level provision Total needs
200� 200� 200� Basic scenario
Target scenario
Basic scenario
Target scenario
Humanities and Education 6,094 6,001 5,792 4,600 5,100 5,000 5,900 5,480
Upper secondary VET 893 919 844 800 800 900 900 850
Polytechnics 269 268 284 300 300 300 400 350
Universities 4,932 4,814 4,664 3,500 4,000 3,800 4,600 4,280
Culture 7,894 7,827 7,779 3,400 3,800 3,700 4,500 5,170
Upper secondary VET 3,907 3,943 3,901 1,500 1,600 1,600 1,900 2,270
Polytechnics 2,331 2,296 2,334 900 1,000 1,000 1,200 1,600
Universities 1,656 1,588 1,544 1,000 1,200 1,100 1,400 1,300
Social Sciences, Business and Administration 15,158 15,249 15,331 16,200 14,400 17,600 16,900 14,620
Upper secondary VET 5,314 5,122 5,238 6,800 5,200 7,400 6,100 5,200
Polytechnics 5,238 5,232 5,274 5,900 5,200 6,400 6,100 4,800
Universities 4,606 4,895 4,819 3,500 4,000 3,800 4,700 4,620
Natural Sciences 7,524 7,187 6,913 3,600 4,300 3,900 5,000 6,100
Upper secondary VET 2,314 2,303 2,177 800 500 900 600 1,500
Polytechnics 1,474 1,449 1,421 1,100 1,500 1,200 1,800 1,500
Universities 3,736 3,435 3,315 1,700 2,300 1,800 2,600 3,100
Technology, Communica- tions and Transport 31,367 30,901 31,511 33,500 34,200 36,700 40,200 31,950
Upper secondary VET 18,764 18,612 19,655 25,000 23,500 27,400 27,700 21,500
Polytechnics 8,468 8,285 7,972 6,100 7,500 6,700 8,700 6,950
Universities 4,135 4,004 3,884 2,400 3,200 2,600 3,800 3,500
Natural Resources and the Environment 4,300 4,149 3,912 4,000 3,800 4,300 4,500 3,940
Upper secondary VET 3,085 2,924 2,741 2,900 2,600 3,100 3,200 2,700
Polytechnics 800 809 765 800 900 900 1,000 900
Universities 415 416 406 300 300 300 300 340
Social Services, Health and Sports 14,564 14,904 14,987 17,300 18,000 18,800 21,200 18,000
Upper secondary VET 6,849 7,029 6,885 9,100 9,400 10,000 11,100 9,000
Polytechnics 6,166 6,305 6,445 6,300 6,600 6,800 7,700 7,150
Universities 1,549 1,570 1,657 1,900 2,000 2,000 2,400 1,850
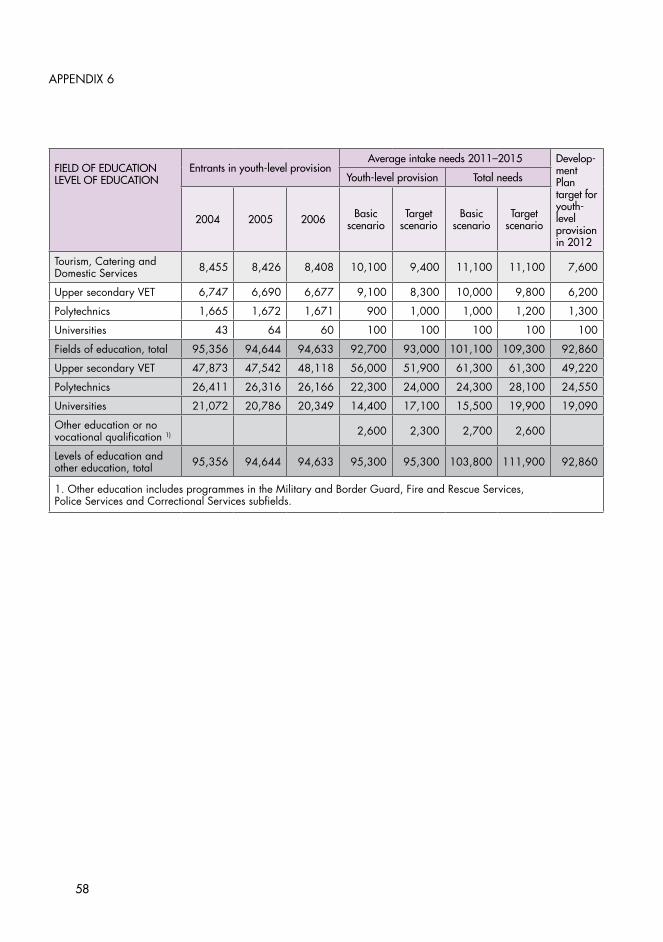
��
FIELD OF EDUCATION LEVEL OF EDUCATION
Entrants in youth-level provisionAverage intake needs 20��–20�� Develop-
ment Plan target for youth-level provision in 20�2
Youth-level provision Total needs
200� 200� 200� Basic scenario
Target scenario
Basic scenario
Target scenario
Tourism, Catering and Domestic Services 8,455 8,426 8,408 10,100 9,400 11,100 11,100 7,600
Upper secondary VET 6,747 6,690 6,677 9,100 8,300 10,000 9,800 6,200
Polytechnics 1,665 1,672 1,671 900 1,000 1,000 1,200 1,300
Universities 43 64 60 100 100 100 100 100
Fields of education, total 95,356 94,644 94,633 92,700 93,000 101,100 109,300 92,860
Upper secondary VET 47,873 47,542 48,118 56,000 51,900 61,300 61,300 49,220
Polytechnics 26,411 26,316 26,166 22,300 24,000 24,300 28,100 24,550
Universities 21,072 20,786 20,349 14,400 17,100 15,500 19,900 19,090
Other education or no vocational qualification 1) 2,600 2,300 2,700 2,600
Levels of education and other education, total 95,356 94,644 94,633 95,300 95,300 103,800 111,900 92,860
1. Other education includes programmes in the Military and Border Guard, Fire and Rescue Services, Police Services and Correctional Services subfields.
APPENDIX 6