Embed Size (px)
Citation preview

Managing Assets for the Future
The Changing Wealth of Nations 2021
S U M M A R Y B O O K L E T


THE CHANGING WEALTH OF NATIONS 2021Managing Assets for the Future
Summary Booklet

© 2021 International Bank for Reconstruction and Development / The World Bank1818 H Street NW, Washington, DC 20433Telephone: 202-473-1000; internet: www.worldbank.org
Some rights reserved
This work is a product of the staff of The World Bank with external contributions. The findings, interpretations, and conclusions expressed in this work do not necessarily reflect the views of The World Bank, its Board of Executive Directors, or the governments they represent. The World Bank does not guarantee the accuracy, completeness, or currency of the data included in this work and does not assume responsibility for any errors, omissions, or discrepancies in the information, or liability with respect to the use of or failure to use the information, methods, processes, or conclusions set forth. The boundaries, colors, denominations, and other information shown on any map in this work do not imply any judgment on the part of The World Bank concerning the legal status of any territory or the endorsement or acceptance of such boundaries.
Nothing herein shall constitute or be construed or considered to be a limitation upon or waiver of the privileges and immunities of The World Bank, all of which are specifically reserved.
Rights and Permissions
This work is available under the Creative Commons Attribution 3.0 IGO license (CC BY 3.0 IGO)http://creativecommons.org/licenses/by/3.0/igo. Under the Creative Commons Attribution license, you are free to copy, distribute, transmit, and adapt this work, including for commercial purposes, under the following conditions:
Attribution—Please cite the work as follows: World Bank. 2021. “The Changing Wealth of Nations 2021: Managing Assets for the Future.” Summary Booklet. World Bank, Washington, DC. License: Creative Commons Attribution CC BY 3.0 IGO
Translations—If you create a translation of this work, please add the following disclaimer along with the attribution: This translation was not created by The World Bank and should not be considered an official World Bank translation. The World Bank shall not be liable for any content or error in this translation.
Adaptations—If you create an adaptation of this work, please add the following disclaimer along with the attribution: This is an adaptation of an original work by The World Bank. Views and opinions expressed in the adaptation are the sole responsibility of the author or authors of the adaptation and are not endorsed by The World Bank.
Third-party content—The World Bank does not necessarily own each component of the content contained within the work. The World Bank therefore does not warrant that the use of any third-party-owned individual component or part contained in the work will not infringe on the rights of those third parties. The risk of claims resulting from such infringement rests solely with you. If you wish to re-use a component of the work, it is your responsibility to determine whether permission is needed for that re-use and to obtain permission from the copyright owner. Examples of components can include, but are not limited to, tables, figures, or images.
All queries on rights and licenses should be addressed to World Bank Publications, The World Bank Group, 1818 H Street NW, Washington, DC 20433, USA; e-mail: [email protected].
Cover images: Woman: © hadynyah / Getty Images. Used with the permission of hadynyah / Getty Images; further permission required for reuse. Lake scene: © Creative Travel Projects / Shutterstock. Tropical fish: © Richard Whitcombe / Shutterstock. Waterfalls: © balkanyrudej / Shutterstock. Wind turbine: © William Cushman / Shutterstock. All Shutterstock images used with the permission of the photographer and Shutterstock; further permission required for reuse. Solar panel: © lotusgraph / Bigstock. Used with the permission of lotusgraph / Bigstock; further permission required for reuse.
Cover design: Florencia Micheltorena
This booklet contains the Summary for Policy Makers and Executive Summary from The Changing Wealth of Nations 2021: Managing Assets for the Future, doi: 10.1596/978-1-4648-1590-4. A PDF of the final book is available at https://openknowledge.worldbank.org/ and http://documents .worldbank.org/, and print copies can be ordered at www.amazon.com. Please use the final version of the book for citation, reproduction, and adaptation purposes.

1
Summary for Policy Makers
Introduction
The COVID-19 pandemic and the increasingly severe impacts of climate change provide stark reminders of how vulnerable human prosperity can be to forces outside of economies. They highlight how our relationship to the natural environment can exacerbate the many other risks we face. Mismanagement of nature and failure to consider the longer-term impacts of our actions can carry severe consequences, even if they might not be immediately evident. We therefore need an expanded economic toolkit, including broader measures of economic progress, to secure our collective prosperity and even sustain our existence as a species.
Wealth accounting—the balance sheet for a country—captures the value of all the assets that generate income and support human well-being. Gross domestic product (GDP) indicates how much monetary income or output a country creates in a year; wealth indicates the value of the under-lying national assets and therefore the prospects for maintaining and increasing that income over the long term. GDP and wealth are comple-mentary indicators for measuring economic performance and provide a fuller picture when evaluated together. By monitoring trends in wealth, it is possible to see whether GDP growth is achieved by building capital assets, which is sustainable in the long run, or by liquidating assets, which is not. Wealth should be used alongside GDP to provide a means of moni-toring the sustainability of economic development.
The Changing Wealth of Nations 2021 (CWON 2021) finds that our material well-being is under threat: from unsustainable exploitation of nature, from mismanagement and mispricing of the assets that make up national wealth, and from a lack of collective action at local, national, and regional levels. CWON 2021 provides the data and analysis that can pro-mote a more sustainable approach to prosperity and help policy makers navigate these challenges. The report draws on a unique global asset data-base that allows detailed examination of the underlying value of a nation’s wealth, taking into account human, produced, and natural capital and

THE CHANGING WEALTH OF NATIONS 20212
noting where assets are being managed sustainably or unsustainably. CWON 2021 presents the world’s most comprehensive accounts to date of the wealth of nations that comprise not only what was made by people (produced capital) but also the wealth embedded in people themselves (human capital), and the wealth offered by nature (natural capital).
This report does not simply examine the historical wealth of nations; it provides the cutting-edge tools to manage wealth for the future. How do our collective actions impact the value of our natural and human assets? How will climate change affect the value of fossil fuel resources, and how should governments respond? How can policy better account for the value of ecosystem services such as the protection provided by mangroves or the value to people of protected natural areas? Robust answers to such ques-tions have been elusive, and CWON 2021 provides them. The analysis in this report and the accompanying database will help policy makers weigh national, regional, and global risks, and in the face of those risks determine how to build wealth that is sustainable over generations.
CWON 2021 marks a significant advance in how to measure and assess the sustainability of economic development. The report includes 146 countries and every year back to 1995, and it does so in a way that is both rigorous and comparable across space and time. This analysis does not claim to reflect all the intrinsic values of human or natural capital, but instead provides measures that are compatible with systems of national accounting. By doing so, CWON 2021 demonstrates that natural and human forms of capital deserve consideration at the highest levels of government and are also worthy investments to promote sustainable prosperity.
Global Wealth Has Never Been Greater, but the Risks Faced Have Also Never Been Greater
In many countries, GDP is increasing at the expense of total wealth and future prosperity. If not properly informed, citizens might mistakenly expect their improving prosperity to continue indefinitely. However, if ris-ing GDP today comes at the expense of declining wealth per capita, then prosperity will be unsustainable. Economic growth will erode its own base.
CWON 2021’s measure of the change in wealth per capita over time is perhaps the most important metric to consider in addition to GDP, and it provides an actionable way to track sustainability. Despite a global expansion in total wealth per capita between 1995 and 2018 (map PS.1), many countries are on an unsustainable development path because their natural, human, or produced capital is being run down in favor of short-term boosts in income or consumption. In countries where today’s GDP is achieved by consuming or degrading assets over time, for example by overfishing or soil degradation, total wealth is declining. This can happen even as GDP rises, but it undermines future prosperity.
Measuring the change in wealth per capita, and contributions from individual wealth components, allows policy makers to monitor the sus-tainability of development and its resilience to shocks. Countries can

Summary for Policy makerS 3
identify asset management policies that make future prosperity more sus-tainable, resilient, and equitable. CWON 2021 finds that while total wealth has increased everywhere, albeit with a widening gap between nations, per capita wealth has not. More than a third of low-income coun-tries saw falling wealth when measured in per capita terms as wealth cre-ation failed to keep pace with population. Declining wealth per capita breaks a core principle of sustainability: future generations should be left no worse off than current generations.
Global wealth inequality is also increasing. Low-income countries are falling further behind in terms of their share of global wealth. If they are to catch up with the rest of humankind, they will need their overall wealth, including human, natural, and produced assets, to grow at an above- average rate. This edition of CWON finds that precisely the opposite is occurring. Low-income countries are expanding their wealth at a relatively slow rate, as reflected in the global shares of wealth: between 1995 and 2018, the share of low-income countries in global wealth hardly changed, remaining below 1 percent despite being home to about 8 percent of the world’s population.
CWON 2021 Recommends Four Priorities for Policy Action
1. Measure and monitor wealth to boost sustainability and prosperity. Governments should measure and monitor wealth, alongside GDP. They can use the System of National Accounts (SNA) framework and the System of Environmental-Economic Accounting (SEEA) standards to integrate wealth accounting systematically into national balance
1−50–5−0<–5Missing data
% change
51−100> 100
IBRD 45862 | SEPTEMBER 2021
Source: World Bank.
MAP PS.1 Growth of Total Wealth per capita, 1995–2018

THE CHANGING WEALTH OF NATIONS 20214
sheets. CWON provides the world’s most comprehensive and SNA-compatible international data on wealth that can be used as a bench-mark and proxy in the absence of detailed bottom-up national wealth accounts. Other actors such as financial markets can utilize wealth accounting to track sustainability and environmental, social, and gover-nance (ESG)–related indicators.
2. Invest in sustainable wealth. Governments should create enabling con-ditions for balanced investments in all components of wealth, not just produced and nonrenewable assets but also human and renewable natural capital. Assets representing common and public goods, like education and public health and often the wealth provided by nature, will require public investments or active government intervention to establish property and use rights to prevent depletion or unsustainable conversion to other forms of capital. Governments also have the duty to correct market failures to enable private investment in wealth cre-ation by aligning private returns to investments with the public benefits and damages they create.
3. Create policy incentives to protect and increase the value of wealth. Where government policies are designed to maximize short-term income only, results can come at the expense of future income and well-being opportunities. Wealth accounting helps identify and correct such policy failures. Assets that are mispriced get mismanaged. Environmentally harmful produced capital and fossil fuels are often overrewarded by markets, while essential human and renewable natural assets are often undervalued and underpriced. This leads to the latter’s degradation and depletion, with systemic risks to macrofiscal stability and potentially existential risk to humans. Governments should therefore use policies and pricing to support socially beneficial assets and do the reverse for those with negative external effects.
4. Diversify and rebalance the asset portfolio to make growth resilient to exter-nal shocks. Multiple environmental crises (climate change, biodiversity loss, ocean damage, and pollution) increase the intensity and frequency of external shocks to growth while also making these shocks more dif-ficult to predict. Standard economic recipes for product and export diversification beyond commodities are no longer sufficient, as they often lead to accumulation of produced assets in emission-intensive manufacturing and land use. Diversification of wealth—the assets that countries rely on to generate income—can instead make economic development more resilient to uncertain external factors such as cli-mate change and global decarbonization. A diverse asset portfolio is also more sustainable than one overly dependent on single assets, par-ticularly depleting ones such as oil, gas, and some minerals.
These policy recommendations are informed by expanded wealth accounts, and accompanying analysis contained in the new CWON 2021 report. More detailed policy discussion can be found in the report and in the policy matrix presented in table PS.1 at the end of this summary.1

Summary for Policy makerS 5
Policy Priority 1: Measure and Monitor Wealth to Boost Sustainability and ProsperityCWON’s balance sheet approach to asset valuation, rigorously based on both the SNA framework and the SEEA, provides comparable and com-prehensive measures of wealth. This allows ministries of finance and national treasuries to consider monetary trade-offs and the important role for asset accumulation across natural capital, human capital, and produced capital. It also shines a light on the role of capital degradation, depletion, and depreciation, which can undermine the sustainability of economic growth. For some assets, particularly natural assets, this monetary valua-tion can help ensure they get an appropriate level of economic policy consideration, given their importance to sustainable economic prosperity.
Because low-income countries have so few other assets, proportion-ately, renewable natural assets such as land and ecosystems are crucial for them, comprising around 23 percent of their total wealth. This is the high-est fraction of total wealth coming from renewable natural capital among all income groups. Nonetheless, it is still likely to be a conservative esti-mate as several ecosystem services—most notably, natural carbon stor-age—cannot yet be included pending updates to SEEA methodologies. As a consequence, governments may be tempted to seek a short-term boost to consumption and growth by liquidating them. However, higher income levels are associated with success in enhancing the value of natural capital, not degrading it.
Sustainable well-being depends on well-functioning ecosystems and educated populations. Natural and human capital are therefore at the core of our prosperity, but few of these assets are accounted for in the national balance sheets and hence appear invisible or worthless to policy makers. When we think of wealth, most of us might think about financial assets, or companies, computers, and cars. But what about forests, mangroves, water, fish, or clean air? What about healthy people and their capacity for pro-ductive work? And can we cooperate when the challenges in managing our prosperity transcend national boundaries? Properly accounting for wealth can help us better manage it, work cooperatively across borders, and ensure that our prosperity is sustainable. CWON 2021 provides the data and analysis that can help.
Policy Priority 2: Invest in Sustainable WealthThe wealth of nations is inextricably linked to the policy choices nations make—it is not static and independent of government. Policy choices change the trajectories and composition of that wealth; price assets incorrectly, and economies may become exposed to needless risks and dependencies.
Where wealth per capita is declining, there is insufficient investment in a nation’s assets, or they are being mismanaged or misvalued. Actions to enhance the value of human capital, for example, would include the cre-ation of quality jobs, fair salaries, and investments to improve the educa-tion and health of citizens. Investments in produced capital would include the construction and maintenance of public infrastructure, buildings, and

THE CHANGING WEALTH OF NATIONS 20216
cities that enable citizens to lead productive lives. For natural capital, wealth can be built through nature restoration or improving the fertility of agricultural land, but it can also encompass protection of sensitive ecosys-tems such as forests to enhance their value.
Human capital, measured by the value of earnings over a person’s lifetime, is the most important component of wealth globally. It consti-tuted a staggering 64 percent of global wealth in 2018. CWON 2021 pro-vides wealth accounts for human capital disaggregated by gender and employment status. By measuring human capital in terms of expected life-time earnings, CWON 2021 provides policy makers with a direct view into the value people can obtain in the labor market. Job creation and quality jobs will be a critical challenge of the twenty-first century, particu-larly in countries with young and fast-growing populations. CWON 2021 measures can help policy makers evaluate past successes and future oppor-tunities to boost human capital—and the economic opportunities for people—as part of the development process.
High levels of air pollution and other drivers of environmental health are harming people and limiting the world’s human capital. Such factors can be integrated into human capital valuations, as premature deaths and disabilities reduce expected earnings. Pollution of outdoor and indoor air is one of the world’s leading environmental risk factors to health, account-ing for over 6 million premature deaths in 2019.
The consequences of COVID-19 have already had a negative impact on people’s lives and livelihoods around the world. The resulting eco-nomic downturn and associated unemployment and loss of earnings have already set back the long-term trajectory of poverty reduction, especially in low-income countries. This can be quantified in terms of the impact on human capital in the wealth of nations.
Policy Priority 3: Create Policy Incentives to Protect and Increase the Value of WealthGovernments have a role to play by enacting regulatory and fiscal incen-tives to better reflect the societal costs and benefits provided by different asset classes in their market prices. This can improve the efficiency and sustainability of natural capital utilization, such as protecting fisheries from overexploitation, taxing carbon emissions to signal to the market the full societal value of assets, or paying for ecosystem services. This can build national wealth and help to address global challenges such as climate change.
CWON 2021 finds the countries falling behind the most are often those struggling to manage their assets in sustainable ways. Declining stocks of renewable natural capital, for example, may reflect overexploita-tion or degradation of ecosystem services, and many of the 26 countries with declining or stagnant wealth per capita are those with falling values of natural capital per capita. New CWON 2021 decomposition analysis, which breaks down wealth changes into quantity and unit value compo-nents, can help shed light on what may be driving these patterns and how policy makers might respond.

Summary for Policy makerS 7
Countries that mismanage nature are also more vulnerable to eco-nomic shocks. Failing to diversify a nation’s assets puts growth at risk. Many countries with abundant mineral and fossil fuel resources have struggled to use the income from these assets to diversify the wealth base of their economies. CWON 2021 finds that when an external shock—such as a fall in commodity prices—hits, their entire economy is vulnera-ble and total wealth per capita can decline. Meanwhile, countries that have diversified their wealth are better equipped to weather such storms.
Without better regulations and changing social norms regarding how we value nonfinancial assets, many categories of wealth, including natural and human capital, will remain mispriced and hence mismanaged. Low-income countries will not catch up, and global wealth will be put at even greater risk.
Wealth held in renewable natural capital per person is greater in high-income than in low-income countries. This is encouraging news. It suggests that far from there being a trade-off between economic devel-opment and nature, they can be complements: prosperous countries are those that have protected and enhanced their natural assets, such as forests, fisheries, landscapes, productive land, and the value and scale of protected areas. Improving economic productivity of nature and of people is a key driver underpinning this trend. Therefore, low-income countries can emulate this strategy and prioritize both nature and overall economic prosperity at the same time.
The CWON accounts provide new ways to measure sustainability in the context of material well-being. However, changes in wealth per capita provide only a measure of “weak” sustainability that implicitly assumes a high degree of substitutability among different asset classes. The emer-gence of multiple global crises, such as biodiversity loss, climate change, and ocean pollution, is a strong wake-up call about the limits to replacing critical ecosystem services with human-made substitutes.
Policy Priority 4: Diversify and Rebalance the Asset PortfolioOverdependence on any single asset category in national wealth, particu-larly commodities, is risky for countries. Nonrenewable natural capital assets (for example, comprising fossil fuel and mineral wealth) grew rap-idly from 1995 until around 2014, but they have been declining in value since then, driven mainly by falling petroleum prices. Countries reliant on such resources for exports and government revenues were hit hard by this decline. Many of the 26 countries with declining or stagnant wealth per capita in this period were resource-rich, commodity-dependent countries. This edition of CWON provides new analysis on asset diversification and concentration to help policy makers achieve greater economic diversifica-tion to help manage and reduce these risks in the future.
What about the impact of climate change policies on fossil fuel wealth? CWON finds that as the world moves toward low-carbon sources of energy, the value of oil, gas, and coal could decline by 13 to 18 percent by 2050. But what matters most is that this risk falls unevenly around the world. Some countries more reliant on fossil fuels are facing

THE CHANGING WEALTH OF NATIONS 20218
significant economic risk. They can manage this risk by adopting proac-tive policies to navigate their own transition away from a dependence on fossil fuel wealth. Traditionally, diversification meant moving beyond extractive industries to exporting processed fuel and fossil fuel–intensive products instead. Going forward, such approaches will be much riskier amid global efforts to decarbonize economic activities. Countries are now beginning to tighten their climate policies and restrict access to their markets for imported carbon-intensive products. International cooperation can also help manage such risks. But CWON 2021 finds that some fuel exporters may have weak economic incentives to cooperate without bold policy actions by fuel importers, such as border carbon adjustment taxes (BCATs), already proposed by the European Union.
Renewable energy endowments, such as water, wind, and sunlight, represent a potentially large but unaccounted-for wealth of nations. Renewable energy should be included in national balance sheets in a simi-lar way to fossil fuel reserves. CWON 2021 presents an approach to doing so and finds that hydropower dominates renewable energy wealth, and its value exceeds the value of fossil fuels in some nonrenewable resource–rich countries. Better energy and climate policies can quickly unlock significant value from solar and wind energy assets. New analysis shows how policies can be used to increase the value of renewable energy to match the value of fossil fuel assets.
Using Wealth Accounting to Guide Policy
CWON 2021 contains not just updated and extended wealth accounts but also extensive policy analysis demonstrating how wealth accounts can help to guide policy choices. For example, CWON 2021 applies the lens of wealth to analysis of asset portfolio management under risk and uncer-tainty from factors such as climate change and global decarbonization. CWON 2021 does not attempt to predict the impact of rare and unex-pected events that have potentially extreme or wide-ranging impacts and which may be more frequent with expected environmental crises, such as climate change and biodiversity loss, and which may include surprises such as the COVID-19 pandemic. Instead, CWON 2021 helps us under-stand and navigate uncertainty by providing scenarios that explore future wealth under several possible scenarios of climate change and climate policies. For human capital, CWON 2021 explores the impact of the COVID-19 pandemic and air pollution, illustrating how management of natural assets and human assets can interact. For fossil fuels, the scenario analysis identifies policy pathways to manage the risks of stranded assets through cooperative and noncooperative low-carbon growth strategies and BCATs. CWON 2021 also explores how policy reforms can enhance wealth creation from natural capital such as fisheries and renewable energy.
Conventional measures of fiscal sustainability overlook important wealth considerations, such as the depletion and degradation of natural capital, and even the destruction of produced assets by natural disasters.

Summary for Policy makerS 9
For example, the source of government revenues may be unsustainable if it comes from extraction of nonrenewable assets, such as fossil fuels, or if it comes from an asset that is being mismanaged, such as an overfished fisheries sector or properties vulnerable to floods or cyclones. New analysis on the challenges of Dutch disease and resource dependence illustrate how countries might mitigate these risks and plan for declining demand for fossil fuels. By introducing information on the assets underlying gov-ernment revenue sources, the wealth accounts can help guide more sus-tainable fiscal policy.
Future Work and Unanswered Questions
Although the analysis considers the potential impacts of climate change on asset value, CWON does not yet include the value of carbon retention or sequestration services as part of wealth embedded in biological ecosys-tems (for example, forests, soils, and oceans). Nor does it subtract the social cost of carbon from fossil fuels. There are ample cross-country data available to measure physical carbon balances but no final agreement about how to account for the value of climate regulation services in the SEEA.
Future versions of CWON will also seek to capture how social capital and biodiversity influence the value of assets in the core wealth accounts. These advances are somewhat different in nature. Biodiversity and social capital are what Dasgupta (2021) refers to as enabling characteristics of assets, a quality that gives value to other assets, rather than assets as such. Social capital may not easily be made part of the core monetary accounts, but new techniques to measure social capital can provide essential, com-plementary indicators to changes in total wealth per capita. Currently, wealth accounts do not fully capture the impact on renewable natural capital where losses and degradation have brought ecosystems to the point of potentially irreversible thresholds, which may precipitate catastrophic events on a scale that escapes the conceptual apparatus of traditional economics.
Further, improvements in data, including those gathered via remote sensing methods, open possibilities for greater spatial and temporal mea-surement of wealth. For example, by breaking down the wealth accounts at subnational levels of analysis, policy makers can see how unequal the distribution of wealth and different assets is across the country, and how that has evolved over time. This may also provide data and analysis to guide local decision-making.
CWON 2021 describes some of the main findings emerging from the new, expanded wealth accounts—the most comprehensive and SNA-compatible wealth accounts available so far. The analysis and the abun-dance of data—which are available online—should provide a rich toolkit for policy makers. Excel tools and interactive data visualizations can be used to analyze trends within countries, across time, and between peers. Breaking down accounts by individual assets, and decomposing wealth by

THE CHANGING WEALTH OF NATIONS 202110
quantity and unit value, can further guide choices about building wealth for the future.
Sustainable Prosperity Requires Collective Action at Local, National, and Global Levels
A green, resilient, and inclusive recovery from the pandemic-induced eco-nomic crisis demands urgent changes in how local and national govern-ments manage their human, natural, and produced capital. It also requires unprecedented levels of international action and cooperation, including action to address climate change, loss of biodiversity, and other global chal-lenges. This means combining domestic policies with international agree-ments on taxing externalities such as carbon emissions or agreements over the sustainable management of transboundary assets such as fish or water.
Going forward, policy interventions—such as carbon taxes and pay-ments for ecosystems services—are urgently needed to make market prices explicitly reflect the social cost of carbon dioxide emissions and the value of global climate regulation services provided by nature. By ignoring pol-luting and climate change impacts and costs to society, fossil fuel assets are overvalued in the market. Yet assets that can help in climate mitigation efforts, such as forest ecosystems, are undervalued.
Governments are not the only actors that matter. Individuals, compa-nies, and investors are all managers of assets, and the choices they make can make an important difference. Financial markets, for example, have started to take sustainable development seriously as part of decision- making. This includes major progress on incorporating ESG considerations into investing choices. However, ESG often relies on environmental mea-sures that can overweight physical properties (for example, hectares of forest cover) while underestimating the asset value and the long-term eco-nomic benefits of sustainable management of natural resources (for exam-ple, expressed via natural capital accounts in CWON). Wealth data have the potential to improve ESG measures by providing insights into the changing natural wealth in monetary value terms at the country level. This can be used, for example, to inform sovereign ESG scores.
By better managing, measuring, and valuing natural assets, we can give our natural environment the ability to grow and enhance our well-being. By recognizing the importance of human capital, we can move beyond a focus on short-term profits and incomes to one based on investments in skills and a healthy population that will ensure continuous prosperity. By considering wealth distribution, we can ensure more inclusive and resilient growth in material well-being. Economic development, flourishing humans, and nature can all be complements—indeed, they must be treated as complements if humans are to thrive on this planet.

TABL
E PS
.1 P
olic
y m
atrix
and
Gui
de to
fur
ther
Det
ails
Asse
tsPr
iorit
y po
licy
area
sFu
rthe
r de
tails
Mea
sure
an
d tr
ack
wea
lth
Polic
ies
to
inve
st in
w
ealth
Polic
ies
to
incr
ease
val
ue o
f w
ealth
Dive
rsify
as
sets
to
man
age
risks
Rene
wab
le
natu
ral c
apita
l•
fore
sts:
Polic
ies
and
inve
stm
ents
to p
reve
nt d
efor
esta
tion
and
fore
st d
egra
datio
n ca
n en
hanc
e ov
eral
l nat
ural
cap
ital w
ealth
, esp
ecia
lly
in lo
w-in
com
e an
d lo
wer
-mid
dle-
inco
me
coun
tries
, whi
ch, a
s a
grou
p, s
how
a d
eclin
e in
fore
st ti
mbe
r and
fore
st e
cosy
stem
ser
vices
w
ealth
per
cap
ita. m
echa
nism
s th
at m
ake
visib
le th
e fu
ll va
lue
of fo
rest
eco
syst
em s
ervic
es c
an h
elp
ince
ntivi
ze p
rote
ctio
n an
d su
stai
nabl
e us
e, re
lativ
e to
tim
ber a
nd a
gric
ultu
ral u
ses.
chap
ter 5
✔✔
• cr
itica
l ser
vices
pro
vided
by
fore
sts
and
othe
r eco
syst
ems
inclu
de re
tent
ion
(sto
ck) a
nd s
eque
stra
tion
(flow
) of c
arbo
n. m
arke
ts s
o fa
r fa
iled
to re
flect
this
valu
e in
wid
espr
ead
carb
on p
rices
. Dom
estic
pol
icy a
ctio
n to
pric
e ca
rbon
, alo
ngsid
e in
tern
atio
nally
com
para
ble
acco
untin
g st
anda
rds
cons
isten
t with
See
a, m
ay p
ave
the
way
for t
he e
mer
genc
e of
glo
bal d
eman
d an
d w
illing
ness
to p
ay fo
r ret
entio
n an
d se
ques
tratio
n se
rvic
es p
rovid
ed b
y ec
osys
tem
s an
d st
em o
veru
se o
f for
ests
for t
imbe
r or c
lear
ance
.
chap
ter 1
✔
• m
arin
e ca
ptur
e fis
herie
s: re
form
ing
and
repu
rpos
ing
fishe
ry s
ubsid
ies,
agre
eing
to s
usta
inab
le q
uota
s, an
d th
e re
plen
ishm
ent a
nd
mon
itorin
g of
fish
sto
cks
can
all h
elp
prev
ent o
verfi
shin
g an
d de
plet
ion
of fi
sher
ies
wea
lth, e
spec
ially
impa
ctin
g co
asta
l com
mun
ities
.ch
apte
r 6✔
• m
angr
oves
: ret
urn
to in
vest
men
ts in
man
grov
e re
stor
atio
n an
d pr
eser
vatio
n sh
ould
inclu
de b
oth
the
valu
e of
the
ecos
yste
m s
ervic
es
they
pro
vide
to th
e ec
onom
y an
d th
e va
lue
of p
rodu
ced
capi
tal t
hey
prot
ect f
rom
floo
ds a
nd s
torm
sur
ges,
espe
cial
ly as
thes
e ris
ks a
re
incr
easin
g w
ith c
limat
e im
pact
s.
chap
ter 6
✔
• ag
ricul
tura
l lan
d: c
ount
ries
with
sig
nific
ant s
hare
s of
cro
plan
d w
ealth
that
are
vul
nera
ble
to th
e im
pact
s of
clim
ate
chan
ge o
n cr
op
yield
s sh
ould
man
age
this
risk
by d
ivers
ifyin
g th
eir p
ortfo
lio, i
nves
ting
in o
ther
rene
wab
le a
sset
s an
d/or
hum
an o
r pro
duce
d ca
pita
l.ch
apte
r 5✔
✔
• re
new
able
ene
rgy:
coun
tries
, SNa
, and
See
a sh
ould
ass
ign
expl
icit
valu
es to
rene
wab
le e
nerg
y as
sets
in n
atio
nal b
alan
ce s
heet
s, ju
st
as th
ey c
urre
ntly
assig
n va
lues
to fo
ssil
fuel
rese
rves
.ch
apte
r 14
✔
Nonr
enew
able
na
tura
l cap
ital
• fo
ssil
fuel
–ric
h co
untri
es s
houl
d m
anag
e th
e ris
ks a
ssoc
iate
d w
ith g
loba
l dec
arbo
niza
tion
and
stra
nded
ass
ets
via in
tern
atio
nal
coop
erat
ion
and
asse
t dive
rsifi
catio
n, a
void
ing
carb
on-in
tens
ive d
owns
tream
act
ivitie
s. Po
licy
inst
rum
ents
mig
ht in
clude
ene
rgy
taxa
tion
(or r
educ
ing
ener
gy s
ubsid
ies)
to b
ette
r refl
ect e
nviro
nmen
tal c
osts
of f
uels.
Thi
s ca
n al
so h
elp
man
age
exte
rnal
risk
s, su
ch a
s bo
rder
car
bon
adju
stm
ent t
axes
and
oth
er ta
riff a
nd n
onta
riff t
rade
bar
riers
to g
oods
with
a h
igh
envir
onm
enta
l foo
tprin
t.
chap
ters
9,
10, 1
1✔
✔
• re
sour
ce re
nts
from
non
rene
wab
le n
atur
al re
sour
ces
(esp
ecia
lly o
il, ga
s, an
d m
iner
als)
sho
uld
be tr
ansp
aren
tly c
olle
cted
and
re
inve
sted
in s
usta
inab
le fo
rms
of w
ealth
—in
cludi
ng p
ublic
infra
stru
ctur
e, g
reen
pro
duce
d ca
pita
l, re
new
able
nat
ural
wea
lth, a
nd
hum
an c
apita
l (sk
ills, h
ealth
) to
supp
ort s
usta
inab
le p
rosp
erity
.
chap
ters
9,
11
✔✔
Hum
an c
apita
l•
inve
stin
g in
girl
s’ e
duca
tion
can
impr
ove
both
the
leve
l and
equ
ity o
f hum
an c
apita
l wea
lth. T
his
may
be
parti
cula
rly u
rgen
t in
coun
tries
w
ith o
verly
une
qual
dist
ribut
ion
of h
uman
cap
ital,
such
as
mea
sure
d by
cW
oN, i
nclu
ding
in s
ome
reso
urce
-ric
h co
untri
es.
chap
ter 1
2✔
✔
• in
vest
men
ts in
edu
catio
n an
d he
alth
, inc
ludi
ng p
olic
ies
and
mea
sure
s th
at re
duce
pop
ulat
ion
expo
sure
to a
ir po
llutio
n, c
an e
nhan
ce th
e va
lue
of h
uman
cap
ital a
long
side
impr
ovin
g w
ell-b
eing
and
pro
duct
ivity.
chap
ters
7,
8, 1
2✔
✔
Prod
uced
ca
pita
l•
Publ
ic c
apita
l (fo
r exa
mpl
e, in
frast
ruct
ure)
: use
pro
ceed
s fro
m n
onre
new
able
nat
ural
reso
urce
s (o
il, ga
s, an
d m
iner
als)
to in
vest
in
publ
ic in
frast
ruct
ure
in c
apita
l-sca
rce
coun
tries
.ch
apte
rs
9, 1
1✔
✔
• ri
sks
to th
e va
lue
of p
rodu
ced
capi
tal,
such
as
infra
stru
ctur
e an
d ci
ties,
from
sto
rm a
nd fl
oodi
ng c
an b
e m
itiga
ted
by le
vera
ging
in
vest
men
ts in
nat
ure,
suc
h as
pro
tect
ive m
angr
oves
.ch
apte
r 6✔
✔
• Pr
ocee
ds fr
om n
onre
new
able
s ca
n be
inve
sted
in p
rodu
ced
capi
tal a
nd u
sed
to h
elp
impr
ove
the
inve
stm
ent e
nviro
nmen
t—a
proc
ess
know
n as
“in
vest
ing
in in
vest
ing,
” pr
omot
ing
both
ass
et d
iver
sific
atio
n aw
ay fr
om d
epen
denc
e on
non
rene
wab
les
and
econ
omic
sus
tain
abili
ty.
chap
ters
9,
11
✔
• fi
scal
pol
icie
s sh
ould
avo
id u
nwar
rant
ed a
ccum
ulat
ion
of p
rodu
ced
capi
tal i
n se
ctor
s ex
pose
d to
tran
sitio
n ris
ks a
nd e
ncou
rage
ac
cum
ulat
ion
of c
limat
e-pr
oof p
rodu
ced
asse
ts.
chap
ter 1
0✔
✔
Sour
ce: W
orld
Ban
k.No
te: C
WON
= C
hang
ing
Wea
lth o
f Nat
ions
; SEE
A =
Sys
tem
of E
nviro
nmen
tal-E
cono
mic
Acco
untin
g; S
NA =
Sys
tem
of N
atio
nal A
ccou
nts.

THE CHANGING WEALTH OF NATIONS 202112
Note
1. The Changing Wealth of Nations 2021 report, wealth accounts data, and other resources can be found at http://worldbank.org/cwon.
Reference
Dasgupta, P. 2021. The Economics of Biodiversity: The Dasgupta Review. London: HM Treasury.

13
Executive Summary
Sustainability, Resilience, and Inclusiveness Are Urgent Challenges for Economic Development
The Changing Wealth of Nations 2021 provides an updated database and analysis of the world’s wealth accounts spanning 146 countries, with annual data from 1995 to 2018. It also contains the widest set of assets covered so far, including the value of human capital broken down by gen-der, as well as many different forms of natural capital, spanning minerals, fossil fuels, forests, mangroves, marine fisheries, and more. The Changing Wealth of Nations (CWON) wealth accounts provide a rigorous, compa-rable monetary measure of these assets, grounded in the balance sheet approach based on both the System of National Accounts (SNA) frame-work and the System of Environmental-Economic Accounting (SEEA). This provides a rich set of economic indicators ready for use by a wide set of actors, including government and the private sector, to look beyond traditional measures such as gross domestic product (GDP).
Twenty-first century economic development challenges will be char-acterized by their complexity and interconnectedness with the natural environment. Climate change, loss of ecosystems, forests, and biodiversity; degradation of oceans and agricultural land; and different forms of pollu-tion all threaten material well-being, including through potential “nonlin-earities” and “fat tail” risks (Bolton et al. 2020).1 To navigate these challenges, wealth accounts can broaden policy makers’ lens beyond GDP; increasingly, experts and governments agree. For example, the Government of the United Kingdom commissioned the Dasgupta Review on the eco-nomics of biodiversity (Dasgupta 2021), which was released in early 2021 and has called for governments to embrace wealth measures, combining the value of produced capital, human capital, and natural capital.
Wealth and GDP are companions. When properly understood and combined, they provide the necessary guidance for managing economies more sustainably. However, on their own they are not sufficient for ensur-ing sustainability and human well-being, because they omit additional considerations of critical natural capital and social capital, among others.

THE CHANGING WEALTH OF NATIONS 202114
But the disaggregated wealth accounts provide deeper insight to better guide policy choices than GDP alone. Increasing the value of renewable natural capital per capita, for example, contributes to sustainable develop-ment if it is done through better management and investments in nature. Essential conditions for value creation include—although are not limited to— policies that make the value of nature’s services reflected in prices that economic agents and policy makers can see in the marketplace.
In addition, economic sustainability is not the same as human well-being. Wealth, like GDP, is intended to represent material well-being, not broader human well-being. Although per capita wealth may be similar for countries, the well-being of citizens may be quite different because of factors such as institutions, governance, culture, and social capital that influence but cannot be directly incorporated into monetary values. Furthermore, like other economic indicators, wealth measures reflect human-centered perspectives on value rather than an intrinsic or life-centered approach to valuation that is independent of utility to humans. Users of wealth accounts should therefore consider its strengths and weak-nesses for policy applications (see box ES.1).
BOX ES.1 Strengths and limitations of Wealth accounting
The wealth accounting approach allows a wider set of assets to be considered than conventional public finance
indicators, which normally focus on traditional capital assets and liabilities, such as machines, buildings, and
infrastructure. The Changing Wealth of Nations converts a wider range of natural and human assets into monetary
valuations while adhering to the System of National Accounts (SNA)–compatible balance sheet approach used
in economic policy. This makes the more comprehensive spectrum of wealth visible and investment-worthy for
economic and financial policy makers.
Comparable monetary measures of natural and human capital, alongside traditional forms of produced capital,
allow economic policy makers to consider the impact on and benefits of these assets. This wider set of assets can
be more easily included in policy making by ministries of finance, economy, and treasury and central banks. Wealth
accounts can provide a yardstick that is comparable to their own metrics used to evaluate economic performance.
The benefits of adherence to the rigor of SNA-compatible balance sheets go hand in hand with the limitations
of this approach. Some economic assets are more difficult than others to measure in market terms, especially
natural assets, which may not have defined owners and readily observable market prices. Other entities, such as
social capital (trust, institutions, and governance) and biodiversity are less amenable to the SNA-based balance
sheet approach, as they can be seen as characteristics of assets rather than assets themselves. They are
nonetheless essential to human well-being and enhance the value of more traditional assets as well as having
intrinsic value beyond monetary considerations. The wealth accounts of natural capital do not provide a full picture
of the management, accumulation, depletion, and degradation of ecosystems without complementary underlying
biophysical indicators, such as measures of species loss or tree cover.
Further, the wealth accounts take asset prices as given by (or derived from) the existing markets. Therefore,
they may not capture the “true” value of assets that are mispriced and/or mismanaged. Country policies,
(continued on next page)

EXECUTIVE SUMMARY 15
Global and Regional Trends in Wealth
Global total wealth grew significantly between 1995 and 2018. All income groups saw increasing total wealth and per capita wealth over the period. However, for some countries the growth in total wealth per capita was disappointing, and even negative in some cases.
CWON 2021’s measure of the change in wealth per capita over time is perhaps the most important metric to consider in addition to GDP and provides an actionable measure to track sustainability. Despite a global expansion in total wealth per capita between 1995 and 2018 (map ES.1), many countries are on an unsustainable development path, because their natural, human, or produced capital is being run down in favor of short-term boosts in income or consumption. In countries where today’s GDP is achieved by consuming or degrading net assets over time, for example, by overfishing or soil degradation, total wealth is declining. This can happen even as GDP rises, because the practice undermines future prosperity rather than economic output today.
institutions, property rights regimes, and governance can distort the prices that buyers and sellers face in
markets, failing to inform owners and users about the true value of an asset and often resulting in overharvesting
and/or degrading asset value. Although all assets can be subject to market failures, it is a particularly serious
problem for natural capital. Costs of fossil fuels or polluting factories fail to include external costs to society
resulting in unconstrained damages from carbon emissions and local pollution. On the other side, many
ecosystem services are not valued by markets at all, and if they are, the prices that users pay fail to reflect
their benefits to food production, human productivity, clean water and air for people, livelihoods, tourism, and
productive value chains. Market price distortions can vary over time within a country or across countries, even for
an asset that is physically identical.
Many natural systems, such as the atmosphere or open oceans, do not have owners and property rights
assigned. Therefore, their governance is subject to the “tragedy of the commons” (Hardin 1968; Ostrom 1990).
Many negative impacts on assets are visible to markets only long after the critical ecosystems degrade, making
them subject to the “tragedy of the horizon” as well (Carney 2015). These constitute additional limitations of relying
on explicit market prices for the valuation of assets.
The good news is that over the past several decades the problem of unvalued and undervalued assets has
been recognized, and tools for more accurately valuing nature or otherwise rewarding the ecosystem services
that nature provides have been developed. Markets, including financial markets, are beginning to consider social
costs and benefits of services that different assets provide. For example, while fossil fuel companies are facing
divestment, companies producing clean technologies, energy, and electric vehicles are seeing rising stock
prices. Several asset managers and investment banks have launched natural capital and environmental, social,
and governance funds. They are betting on further developments in policy instruments to value and reward good
stewardship of nature. Governments can therefore promote broader wealth creation and better management of
assets by correcting for externalities with environmental fiscal reforms, creating direct regulations, establishing
market payments for ecosystems’ services, and signaling the direction of future policy.
BOX ES.1 Strengths and limitations of Wealth accounting (continued)

THE CHANGING WEALTH OF NATIONS 202116
The strongest performance was found among upper-middle-income countries, which had increases in wealth of over 200 percent between 1995 and 2018 (figure ES.1). Low-income countries saw per capita wealth growth by less than the global average, at 22 percent compared with 44 percent. This means that low-income countries are falling fur-ther behind the rest of the world, creating a significant divergence in global wealth per person. Per capita wealth changes are consistently lower than total wealth growth, as they factor in the rate of population growth, which for some countries has been very rapid during this period.
Economic development cannot be socially sustainable if it is not inclusive. Inclusiveness across countries requires the poorest countries to catch up with the per capita wealth of the rest of the world. To do so, however, they will need an above-average rate of growth in assets—to ensure that they catch up and then keep pace with higher levels of popu-lation growth. Doing so would mean their share in global total wealth would be rising. Unfortunately, the data show that this is not happening quickly. Between 1995 and 2018, low-income countries’ share of global wealth increased only from 0.5 to 0.6 percent. The performance of lower-middle-income countries was better, increasing in share from 5 to 7 percent by 2018. China’s performance was the most striking, as its share of global total wealth transformed from a modest 7 percent in 1995 to 21 percent by 2018.
Although national total wealth increased everywhere, per capita total wealth did not. Twenty-six countries saw a decline or stagnation in per capita wealth as population growth outpaced net growth in asset value, especially in Sub-Saharan Africa among countries such as the Democratic
MAP ES.1 Growth of Total Wealth per capita, 1995–2018
1−50–5−0<–5Missing data
% change
51−100> 100
IBRD 45862 | SEPTEMBER 2021
Source: World Bank.

EXECUTIVE SUMMARY 17
Republic of Congo, Niger, and Zimbabwe. These twenty-six countries could be found in all income groups. As per capita wealth declines, the ability of countries to maintain per capita income will decline. If the trend continues, future generations in these countries will be worse off than cur-rent generations.
Natural CapitalRenewable natural capital (forests, mangroves, fisheries, agricultural land, and protected areas) has increased in value since 1995 globally and among all income groups. It remains critically important for low-income coun-tries, accounting for 23 percent of their total wealth in 2018 (figure ES.2). This share is almost half of what it was in 1995 (39 percent), as these countries invested and diversified their asset portfolios by building the value of human capital and produced capital. Renewable natural assets nonetheless remain important even as countries grow and develop. While the share of renewables in total wealth falls with income, the per capita values are highest in high-income Organisation for Economic Co-operation and Development (OECD) countries. This pattern shows that the route to prosperity need not come at the expense of nature—the opposite is true.
Enhancing and protecting renewable natural capital to increase its value has been a part of the sustainable development path of higher-income countries. CWON 2021 data show countries can avoid pursuing short-term growth of GDP at the expense of natural capital. Instead, sus-tainable development is better achieved by responsibly managing natural assets and using the proceeds from nature to support investment in human and produced capital.
FIGURE ES.1 changes in Total Wealth and Per capita Wealth, by income Group, 1995–2018
0
50
100
150
200
250
Low-income
% c
hang
e
Lower-middle-income
Upper-middle-income
High-income:non-OECD
High-income:OECD
World
Total wealth Per capita wealth
Source: World Bank staff calculations.Note: OECD = Organisation for Economic Co-operation and Development.

THE CHANGING WEALTH OF NATIONS 202118
CWON 2021, for the first time, presents accounts for major compo-nents of blue natural capital: mangroves and marine capture fisheries, which are a critical part of total wealth for some countries. Here, the per-formance has been mixed. Blue natural capital fell by half from 1995 to 2018, as the value of fisheries collapsed by 83 percent, and this was only partially compensated by an increase in mangrove asset value of 157 per-cent (figure ES.3). The relative importance of mangroves and marine cap-ture fisheries in blue natural capital reversed over time: the fisheries share declined from 85 to 27 percent of blue natural capital, while mangroves grew and became the dominant component of blue natural capital consid-ered in CWON accounts. In all regions except South Asia, the value of fisheries declined, while the value of mangroves increased in all regions except North America. The main reason for the decline in the value of fisheries is a physical depletion of fish stocks due to the failure to coordi-nate fishing activities between countries and the private sector. The value of aquaculture has not been taken into consideration while calculating blue natural capital.
The global wealth of mangroves has increased since 1995, but their physical area declined in the same period. The reason is that the value of coastal human structures that mangroves protect has dramatically increased. In line with SEEA/SNA methodology, a major part of the value of mangroves is derived from the market value of buildings, roads, and other physical infrastructure along the coast that mangroves protect from storm and tidal surges. Had their physical area also expanded along-side the value of human coastal infrastructure, far more wealth creation
FIGURE ES.2 renewable Natural capital, by income Group: Wealth per capita Value versus Share of Total Wealth, 2018
0
5
10
15
20
25
Shar
e of
tota
l wea
lth (%
)
0
2,000
4,000
6,000
8,000
10,000
Wea
lth p
er c
apita
(201
8 US
$)
Low-income Lower-middle-income
Upper-middle-income
High-income:non-OECD
High-income:OECD
Wealth per capita Share of total wealth (right axis)
Source: World Bank staff calculations.Note: OECD = Organisation for Economic Co-operation and Development.

EXECUTIVE SUMMARY 19
would have occurred. This analysis unveils the economic benefits of gov-ernment policies to facilitate physical protection and expansion of mangroves.
Low- and middle-income countries, where land accounts (forests, protected areas, and agricultural lands) are a large component of total wealth, have seen declining forest wealth but rising agricultural wealth. While forest wealth (timber plus ecosystem services) per capita decreased by 8 percent between 1995 and 2018, driven by population growth and a loss of forest area, agricultural land wealth (cropland plus pastureland) per capita has increased by 9 percent due to area expansion and increasing value per square kilometer (figure ES.4). The area in agriculture increased by 4 percent between 1995 and 2018, while forest land area declined by 4 percent overall, due to conversion to agriculture and other land uses. Although wealth in agricultural lands increased over 1995–2018, the sim-ulations of future impacts of climate change shows that this trend may be slowed or even reversed because of changes in temperature, precipitation, and land degradation. Protected areas show a rapid increase in area and wealth per square kilometer, which is promising news for the sustainabil-ity of human development.
Nonrenewable natural capital grew rapidly from 1995 until around 2014 and has declined in value since then, driven by falling prices (figure ES.5). Between 2014 and 2018, nonrenewable total wealth fell from US$46 trillion to US$30 trillion (a 35 percent decline in four years). This significant loss in value highlights the difficult development challenges faced by countries that depend on these assets, particularly where price changes are exogenous shocks falling outside the control of government policy or domestic company decisions.
FIGURE ES.3 Shares of mangroves and fisheries in Blue Natural capital, and Share of Blue Natural capital in Total Wealth, 1995–2018
0
0.05
0.10
0.15
0.20
0.25
0.30
0
10
20
30
40
50
60
70
80
90
1995 2000 2005 2010 2015 2018
Shar
e of
tota
l glo
bal w
ealth
(%)
Shar
e of
blu
e na
tura
l cap
ital (
%)
Mangroves Fisheries Blue natural capital (right axis)
Source: World Bank staff calculations.Note: Blue natural capital is the sum of mangrove assets valued for coastal protection services and marine capture fisheries.

THE CHANGING WEALTH OF NATIONS 202120
What Drives Changes in Asset Value?
The value of assets is a combined effect of changes in the physical volumes of assets and their unit rents (market revenues minus costs). Information on changes in physical volumes are essential from the point of view of a strong approach to environmental sustainability, which requires additional attention paid to the limits to substitution between natural and other forms of capital, including planetary environmental boundaries, thresholds in critical ecosystems services, as well as irreversibility of some uncertain effects of potential collapse of some forms of natural capital. CWON 2021 introduces for the first time a transparent decomposition analysis to disen-tangle the physical volume and market price effects on natural asset values.
FIGURE ES.4 forests, agricultural land, and Protected areas: change in land area, Wealth per Square kilometer, Population Dilution effect, and overall Wealth per capita in low- and middle-income countries, 1995–2018
–40
–20
0
20
40
60
% c
hang
e
Forest(timber and ecosystem services)
Agricultural land Protected areas
Land area Wealth per square kilometer (US$) Population dilution
Overall wealth per capita (US$)
Source: World Bank staff calculations.
FIGURE ES.5 Global Nonrenewable Natural capital, 1995–2018
Oil Gas Coal Metals and minerals
1995
1996
1997
1998
1999
2000
2001
2002
2003
2004
2005
2006
2007
2008
2009
2010
2011
2012
2013
2014
2015
2016
2017
2018
0
10
20
30
40
50
Cons
tant
201
8 US
$ (tr
illion
s)
Source: World Bank staff calculations.

EXECUTIVE SUMMARY 21
Table ES.1 shows the three-part decomposition for natural capital assets from 1995 to 2018. The decomposition shows the contribution of each factor to this change. Overall, the value of natural capital increased by 68 percent, with renewables increasing by 38 percent and nonrenew-ables increasing by 129 percent.
Decomposition analysis can highlight striking changes hidden in head-line wealth trends. Mangroves, as discussed, have declined globally in area but have risen in overall value. Had their area also expanded, far more wealth creation would have occurred—measured via the protective ben-efits from mangroves.
Unit rent effects (prices and costs) matter as well. Volatility in fossil fuel prices played a major role in fluctuations of values of oil, gas, and coal wealth. The declining unit rents for metals and minerals reflects, in part, the lower prices toward the end of the time period. This meant that despite increases in volume from additional production, and expansion of reserves reflected in lifetime effects, weakening commodity prices signifi-cantly reduced the potential growth in mineral wealth around the world. These reduced unit rents have had systemic macrofiscal consequences in countries that are highly dependent on metals and minerals for exports and government revenues.
TABLE ES.1 Three-Part Decomposition results for Natural capital Stocks, 1995–2018constant 2018 US$ (millions)
1995
Rent effect
Lifetime effect 2018Volume effect Unit rent effect
Natural capital 38,409 22,120 5,381 −1,370 64,542
Renewable natural capital 25,776 9,456 2,013 −1,660 35,586
forests, timber 2,544 239 99 −154 2,728
forests, nontimber 4,879 91 2,487 0 7,458
mangroves 213 −13 348 0 548
fisheries 1,225 62 −1,080 0 207
Protected areas 1,927 971 849 0 3,747
cropland 10,631 6,018 −456 −1,506 14,687
Pastureland 4,356 2,088 −233 0 6,211
Nonrenewable natural capital 12,633 12,665 3,368 290 28,956
oil 9,588 6,345 3,363 −188 19,108
Natural gas 1,090 1,695 559 −55 3,288
coal 949 2,150 383 0 3,482
metals and minerals 1,007 2,475 −937 533 3,078
Source: World Bank staff calculations. Note: Because the volume effect (in dollars) is weighted by unit rent, this can be positive even if physical quantities (e.g., catch in tons) show a negative trend. Moreover, the global volume effect shown here can be dominated by large countries. Green and pink cells represent positive and negative effects on natural capital, respectively.

THE CHANGING WEALTH OF NATIONS 202122
Human CapitalHuman capital—estimated as the present value of future earnings for the labor force, employed and self-employed—is the largest asset across all income groups, constituting 64 percent of total wealth in 2018, only slightly higher than in 1995. Self-employed workers account for 13 per-cent of global human capital but a much larger share of the total in many low-income countries, where the agriculture sector and informal employ-ment are significant. CWON 2021 provides human capital accounts bro-ken down by gender. Significant disparity between male and female human capital persists across most regions and income groups, with great varia-tion among regions: females hold 44 percent of human capital in Latin America and the Caribbean but only 13 percent in South Asia. Human capital per capita is growing fastest in upper-middle-income countries, at an annual rate of 5.3 percent, while growth in OECD countries is slower than the global average (figure ES.6).
The CWON 2021, for the first time, calculates human capital using region- and income group–specific future wage growth rates, making an important stride in improving the estimates of human capital. The slower annual wage growth in high-income countries (roughly 1 percent), com-bined with the aging of the labor force, reduces their share of global human capital. Meanwhile, higher rates of wage growth in some middle-income countries (up to 4 percent) increases their relative share.
Population health, education, and skills are embedded in the CWON methodology of human capital valuation via estimated lifetime earnings. Although the full, long-lasting effects of the COVID-19 pandemic are still unknown, the resulting economic downturn and associated unemploy-ment and loss of earnings have already set back the long-term progress in poverty reduction, especially in low-income countries. When the
FIGURE ES.6 annual Growth rate of Human capital per capita, by income Group, 1995–2018
1.7
1.2
0.4
5.3
3.0
2.1
0 0.5 1.0 1.5 2.0 2.5 3.0 3.5 4.0 4.5 5.0 5.5
World
High-income: OECD
High-income: non-OECD
Upper-middle-income
Lower-middle-income
Low-income
Growth rate (%)
Source: World Bank staff calculations. Note: OECD = Organisation for Economic Co-operation and Development.

EXECUTIVE SUMMARY 23
pandemic’s downward impact on future wage growth is incorporated into the estimation of human capital, low-income countries experience the largest negative impact, with a loss of 14 percent of total future human capital compared to the value in 2018. At the regional level, Sub-Saharan Africa and South Asia suffer the greatest setbacks, losing 15 and 7 percent of human capital, respectively. CWON 2021 also includes estimates of losses of human capital due to air pollution.
Policies to Manage Risk and Build Energy Wealth for the Future
Primary energy resources, such as renewable energy and fossil fuels, are important components of natural capital and should be accounted for as part of the wealth accounts. So far, from these, only subsoil nonrenewable fossil fuel assets are included in the national balance sheets and in the CWON wealth accounts. The measurement of renewable energy resources—wind, solar, and hydropower—as assets has not been system-atically addressed in the SNA or the SEEA. This edition of the CWON demonstrates how to account for renewable energy wealth in the same way as for fossil fuels.
The global low-carbon transition is already rebalancing the national portfolios of energy assets. If the goals of the Paris Agreement are achieved, the value of fossil fuels will be lower and the value of renewable energy will increase. But there is deep uncertainty about how exactly the low-carbon transition will unfold. Policies can also shape the evolution of this portfolio and levels of investment in the different assets. The CWON 2021 explores these risks and opportunities for energy assets and how the uncertainty can be navigated by getting the right prices and policies.
Countries that are well endowed in nonrenewable energy reserves (figure ES.7) saw significant growth in wealth over 1995–2014, albeit with considerable volatility. From 2014, global prices and associated rents from fossil fuels declined precipitously and have not fully recovered. The COVID-19 shock in 2020 has suppressed prices again. Historical changes to nonrenewable natural capital wealth are decomposed by their contrib-uting factors, such as depletion and discoveries, changes in prices and costs, and other factors. The CWON analysis explores the challenges facing countries that are dependent on nonrenewable natural capital and high-lights that the urgent low-carbon transition represents a significant risk to fossil fuel assets and the countries that rely on them.
Simulations of several potential global low-carbon transition path-ways show that transition risk can significantly affect the value of all fossil fuel assets, and that the impact will be unevenly distributed across fuels, countries, and asset owners. Distributions of risk will also significantly depend on the pathway along which the low-carbon transition will unfold. CWON 2021 unpacks the risk to the value of fossil fuel assets and explores it quantitatively by applying a macroeconomic model to run multiple cli-mate and trade policy scenarios. From 2018–50, if the Paris climate ambi-tions are achieved, global fossil fuel wealth may be US$4.4 trillion to

THE CHANGING WEALTH OF NATIONS 202124
US$6.2 trillion (13–18 percent) lower than under a business-as-usual scenario. Oil assets represent the largest value at risk and gas the lowest, but in percentage terms coal reserves would lose most of their reference value and oil the least. By country group, the highest value at risk is held by fuel exporters in the Middle East and North Africa because of their significant oil exports, and by the middle-income high fossil fuel users (including China and India) because of their high coal reserves and use (figure ES.8). Ambitious climate policies have large implications for coal wealth but do not represent a systemic macrofiscal risk to coal-intensive countries, because even for the largest producers, coal wealth accounts for a much smaller share of total wealth. However, managing the risks of stranded miners, stranded regions, and stranded coal power plants may be a significant challenge. The share of oil or gas in the total wealth among major producers of each is much higher than coal and poses significant macroeconomic risk if a managed transition away from fossil fuel depen-dence is not achieved.
Oil exporters have incentives to adopt their own climate policies in cooperation with international mitigation efforts. CWON modelling sug-gests that oil assets could lose more value if unilateral climate actions to achieve the goals of the Paris Agreement are undertaken by oil importers
FIGURE ES.7 Nonrenewable Natural capital assets’ Share of Total Wealth, by Highest-Share countries, 2018
0
10
20
30
40
50
60
70
Iraq
Perc
ent
Saud
i Arab
iaKu
wait
Azerb
aijan
Qatar
Iran,
Islamic
Rep.
Gabon
Oman
Unite
d Arab
Emira
tes
Kazak
hstan
Mongo
lia
Turkm
enist
an
Congo
, Rep
.Cha
d
Guinea
Russi
an Fe
derat
ion
Mozambiq
ue
Trinid
ad an
d Tob
ago
Nigeria
Surin
ame
Maurita
nia
Papu
a New
Guinea
Egyp
t, Arab
Rep.
Vene
zuela,
RB Peru
Oil Gas Coal Metals and minerals
Source: World Bank staff calculations.
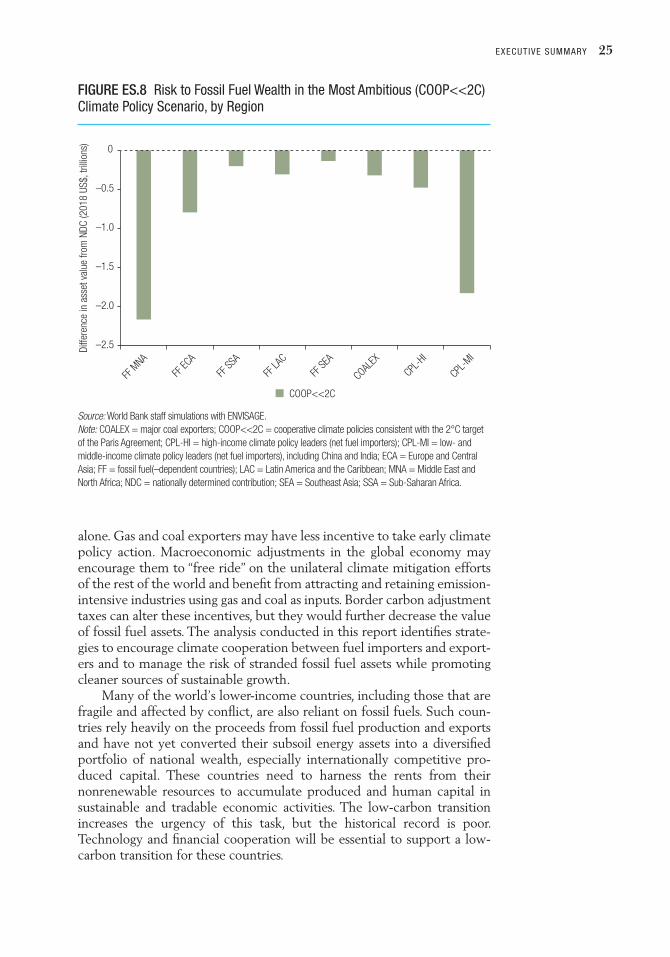
EXECUTIVE SUMMARY 25
alone. Gas and coal exporters may have less incentive to take early climate policy action. Macroeconomic adjustments in the global economy may encourage them to “free ride” on the unilateral climate mitigation efforts of the rest of the world and benefit from attracting and retaining emission-intensive industries using gas and coal as inputs. Border carbon adjustment taxes can alter these incentives, but they would further decrease the value of fossil fuel assets. The analysis conducted in this report identifies strate-gies to encourage climate cooperation between fuel importers and export-ers and to manage the risk of stranded fossil fuel assets while promoting cleaner sources of sustainable growth.
Many of the world’s lower-income countries, including those that are fragile and affected by conflict, are also reliant on fossil fuels. Such coun-tries rely heavily on the proceeds from fossil fuel production and exports and have not yet converted their subsoil energy assets into a diversified portfolio of national wealth, especially internationally competitive pro-duced capital. These countries need to harness the rents from their nonrenewable resources to accumulate produced and human capital in sustainable and tradable economic activities. The low-carbon transition increases the urgency of this task, but the historical record is poor. Technology and financial cooperation will be essential to support a low-carbon transition for these countries.
FIGURE ES.8 risk to fossil fuel Wealth in the most ambitious (cooP<<2c) climate Policy Scenario, by region
–2.5
–2.0
–1.5
–1.0
–0.5
0
FF M
NA
FF EC
A
FF SS
A
FF LA
CFF
SEA
COALEX
CPL-H
I
CPL-M
I
Diffe
renc
e in
ass
et v
alue
from
NDC
(201
8 US
$, tr
illion
s)
COOP<<2C
Source: World Bank staff simulations with ENVISAGE.Note: COALEX = major coal exporters; COOP<<2C = cooperative climate policies consistent with the 2°C target of the Paris Agreement; CPL-HI = high-income climate policy leaders (net fuel importers); CPL-MI = low- and middle-income climate policy leaders (net fuel importers), including China and India; ECA = Europe and Central Asia; FF = fossil fuel(–dependent countries); LAC = Latin America and the Caribbean; MNA = Middle East and North Africa; NDC = nationally determined contribution; SEA = Southeast Asia; SSA = Sub-Saharan Africa.

THE CHANGING WEALTH OF NATIONS 202126
Just like fossil fuels, hydropower, solar, and wind energy should be assigned an explicit asset value in the national balance sheets. So far, they are not included. CWON 2021 argues that the value of renewable energy as natural capital is not reflected in the value of produced capital (such as power generation plants) or the value of land used to generate renewable electricity. Leaving renewable energy assets out of the national balance sheets misses a great deal of emerging wealth. Experimental calcu-lations of renewable energy asset values for 15 countries for 1990–2017 show that the value of hydropower assets already matches the value of fossil fuel assets in some countries (for example, Brazil and Canada). As in other nascent industries, solar and wind energy had yet to create significant wealth for nations in 2017 (the last year for which consistent data series were available), even though renewable power plants generated profits in many markets, often with the help of subsidies. With rapidly declining costs, solar and wind resource rents are quickly approaching positive val-ues. However, total renewable energy wealth had been declining until 2017 (figure ES.9, panel a) because the rate of growth of the volume of renewable electricity generation has outpaced the speed at which rents per unit of produced electricity are approaching positive values (figure ES.9, panel b).
The critical policies that can increase asset values include making elec-tricity markets more competitive by removing protection of existing
FIGURE ES.9 renewable energy Wealth and energy Generation in 15 major Producing countries, 1990–2017
–3
–2
–1
0
1
2
3
4
5
6
7
1990
1991
1992
1993
1994
1995
1996
1997
1998
1999
2000
2001
2002
2003
2004
2005
2006
2007
2008
2009
2010
2011
2012
2013
2014
2015
2016
2017
US$
(trilli
ons,
201
8 pr
ices
)
Wind, onshore and offshore Solar PV and CSP Hydroelectricity
a. Total renewable energy wealth
(continued on next page)

EXECUTIVE SUMMARY 27
FIGURE ES.9 renewable energy Wealth and energy Generation in 15 major Producing countries, 1990–2017 (continued )
Source: World Bank staff calculations.Note: Negative values are illustrative only, portraying distance between present status and actual contribution to wealth. CSP = concentrated solar power; GWh = gigawatt hour; PV = photovoltaic.
–80
–90
–70
–50
–30
–60
–40
–20
–10
10
30
0
20
1990
1991
1992
1993
1994
1995
1996
1997
1998
1999
2000
2001
2002
2003
2004
2005
2006
2007
2008
2009
2010
2011
2012
2013
2014
2015
2016
2017
US$/
GWh
(milli
ons,
201
8 pr
ices
)
Wind, onshore and offshore Solar PV and CSP Hydroelectricity
b. Renewable energy generation
thermal plants from early retirement and by levelling the playing field by pricing carbon emissions. These policies can make clean energy not only profitable to operators of power plants, but also wealth-creating for society without requiring subsidies. Current technolo-gies can make clean energy profitable and create wealth, and with the right policies the value of renewable energy sources will begin to exceed those of fossil fuel assets.
Wealth Accounts as a Tool for Macroeconomic Policy and the Financial Sector
The CWON 2021 presents new analysis that shows different ways in which policy makers can better manage economic sustainability, diversification, and fiscal sustainability. One example is to use information on the evolution of different assets to see early warning signs of unsustainable growth. For example, degradation in the value of renewable natural capital has been associated with lower or declining total wealth per capita over time. Meanwhile, countries that are protecting and enhancing the value of natural assets and hence where values of renewable natural capital are rising have seen better economic performance over-all. Traditional measures of economic performance conceal the impact that the different sources of GDP growth are having on degrading or enhancing the human and natural capi-tal base for future prosperity. Measures from CWON, such as changes in wealth per capita and the adjusted net savings indicator, can provide rigorous yardsticks for policy makers. Diving deeper into the evolution of individual asset values over time provides even greater resolution into the sources of sustainable and unsustainable development.

THE CHANGING WEALTH OF NATIONS 202128
Abundance of nonrenewable natural capital raises special challenges for economic sustainability. This is because rents—and the revenues gov-ernment raise—are derived from depleting the assets. Furthermore, in addition to the traditional depletion effect, the value of fossil fuel rents is increasingly under pressure as the global economy decarbonizes. This means that fossil fuel wealth can shrink even if reserves are not depleted. Fiscal sustainability should therefore consider fossil fuel rents as an inherently unsustainable source of revenues. Macrofiscal prudency sug-gests that a large share of the remaining revenues from fossil fuels should be used to accumulate other sustainable assets, such as human capital and green physical infrastructure, and to enhance the value of renewable natural capital. Resource-rich countries have struggled to do this—they have on average a more negative measure of adjusted net savings com-pared with non-resource-rich countries. Asset diversification (Gill et al. 2014; Peszko et al. 2020)—the process of accumulation of a broad range of productive assets, to reduce dependence on fuel extraction and fuel-intensive manufacturing products—can be a pathway to sustainable prosperity, and the CWON indicators can provide a means for measur-ing such progress.
Few resource-rich countries have managed to achieve even traditional economic diversification, let alone asset diversification. Producing and exporting large quantities of nonrenewable resources can constrain the rest of the economy—a phenomenon known as the Dutch disease. Resource exports make it difficult to build value in other export sectors due to local currency appreciation leading to increased local costs. CWON 2021 presents evidence that the average level of human capital per capita is lower in resource-rich countries compared with non-resource-rich countries. CWON 2021 finds that the distribution of human capital between men and women in resource-rich countries is more unequal compared with non-resource-rich countries and that human capital is more skewed toward the public sector.
The CWON and wealth accounting can help financial markets assess the utility of environmental, social, and governance (ESG) frame-works as part of decision-making for sustainable development. Wealth data are uniquely suited to inform sovereign ESG scores because the wealth accounts put a dollar value on resources, adopt a forward-looking perspective, and have a long history of curated data that is comparable across 23 years and 146 countries. As wealth accounting reflects the natural resource’s long-term economic benefits, it can complement purely environmental indicators for decision-makers. Adoption of the wealth data has been constrained by their five-year frequency and late availability. The new wealth data in this edition of the CWON (see box ES.2) raise the updating frequency to annual. Econometric and machine-learning methods, combined with new remote-sensed data sources, can in the future help increase the wealth data to higher frequencies and subnational resolutions. This will allow for new applications of the wealth accounts.

EXECUTIVE SUMMARY 29
BOX ES.2 What’s New in cWoN 2021?
Expanded Coverage of Natural Capital
This edition of the CWON expands the coverage of natural capital by including components of blue natural capital
in the core wealth accounts for the first time. Blue natural capital includes the accounts for marine fisheries and
mangroves, which are valued for their coastal protection service, filling an important data gap in renewable natural
capital. CWON 2021 also advances the rigor of asset valuation for forest ecosystem services, timber, agricultural
land, and minerals, resulting in improved estimates of countries’ natural capital. CWON 2021 includes analysis
of the impact of air pollution exposure on human capital through premature mortality, making the important link
between environmental health risks and the accumulation of human capital. It also explores and pilots approaches
for including additional asset classes in future editions of the CWON, for example, renewable energy and
biosphere, at least through its climate regulatory services.
Expanded Wealth Account Data
CWON 2021 estimates wealth data for 146 countries for the years 1995 to 2018 in market exchange rates,
accompanied by policy analysis to help guide policy makers in managing their nation’s wealth for sustainable
prosperity. The analysis finds a critical role for governance at both national and international levels in shaping the
wealth of nations, and therefore a vital role for collective action to safeguard our future prosperity.
The wealth accounts are grounded in the concepts and framework of the System of National Accounts (SNA)
2008 (EC et al. 2009) and its extension for natural capital, the System of Environmental-Economic Accounting
(SEEA) Central Framework (UN et al. 2014a), and the SEEA Ecosystem Accounts (UN 2021; UN et al. 2014b).
Although there has been experimentation with human capital, it is not yet part of the SNA national balance sheet.
For the first time, the CWON 2021 includes decomposition analysis of what has driven changes in wealth.
For example, for fossil fuels and minerals, it examines whether changes in wealth were driven more by changes
in prices, costs, production, and reserves or by other factors. Future work will seek to expand this decomposition
analysis and make it more widely accessible for users.
Use of the Wealth Accounts for Policy
With substantial progress in measurement, CWON 2021 applies the lens of wealth to the analysis of asset
portfolio management under risk and uncertainty. CWON 2021 does not attempt to predict the impact of rare and
unexpected events that have potentially extreme or wide-ranging impacts, and which may be more frequent with
expected environmental crises, such as climate change and biodiversity loss, and surprises such as the COVID-19
pandemic. Instead, CWON 2021 helps understand and navigate uncertainty by providing scenarios that explore
future wealth under several possible scenarios of climate change and climate policies. For human capital, CWON
2021 explores the impact of the COVID-19 pandemic and air pollution. For fossil fuels, the scenario analysis
identifies policy pathways to manage the risks of stranded assets through cooperative and noncooperative low-
carbon growth strategies and border carbon adjustment taxes. CWON 2021 also explores how policy reforms can
enhance wealth creation from natural capital such as fisheries and renewable energy.
Conventional measures of fiscal sustainability overlook important wealth considerations, such as the depletion
and degradation of natural capital. Comprehensive wealth accounts can shed light on the sustainability of fiscal
policies and management. For example, the source of government revenues may be unsustainable if it comes from
extraction of nonrenewable assets, such as fossil fuels, or if it comes from an asset that is being mismanaged,
(continued on next page)

THE CHANGING WEALTH OF NATIONS 202130
Looking Ahead
While CWON 2021 has made significant progress, much work remains to be done. This edition includes pilots and discussion of where it is feasible to expand wealth coverage in future editions and to make wealth accounts even more comprehensive.
Renewable energy and water should be added to the core CWON accounts, depending on data availability. This volume provides a proof of concept that renewable energy can be part of the national balance sheets and develops experimental renewable energy accounts for a sample of 15 countries.
Although the analysis considers the potential impacts of climate change on asset value, CWON does not yet include the value of carbon retention or sequestration services as part of wealth embedded in biologi-cal ecosystems (for example, forests, soils, and oceans). Nor does it subtract the social cost of carbon from fossil fuels. There are ample cross-country data available to measure physical carbon balances but no final agreement about how to account for the value of climate regulation services in the SEEA.
The CWON team will pursue opportunities to capture how social capital and biodiversity influence the value of assets in the core accounts. These advances are somewhat different in nature. Biodiversity and social capital are what Dasgupta (2021) refers to as enabling characteristics of assets, a quality that gives value to other assets, rather than assets as such. Social capital may not easily be made part of the core monetary accounts, but new techniques to measure social capital can provide essential, com-plementary indicators to changes in total wealth per capita. Chapter 15 in this volume takes stock of what we know about measuring the economic
such as taxation of an overfished fisheries sector. By introducing information on the assets underlying government
revenue sources, the wealth accounts can help guide more sustainable policy making, including via fiscal
management.
Comparison of Wealth across Countries Using Purchasing Power Parities and Market Exchange Rates
For the first time, CWON 2021 looks at the unequal distribution of wealth across countries using purchasing
power parities (PPPs) in addition to market exchange rates (MERs). MERs have limitations for understanding how
material well-being varies across countries, because one US dollar can purchase different amounts of goods and
services across countries. While this analysis is still experimental, the initial results show that South Asia’s share of
PPP-based global wealth is 2.3 times higher than in MERs in 2018, and Sub-Saharan Africa’s PPP-based share
almost doubles. Looking at inequality across income groups, the MER-based total wealth per capita of the OECD in
2018 was 58 times greater than the low-income country average—but this gap narrows to 21 times when valued
in PPPs.
BOX ES.2 What’s New in cWoN 2021? (continued)

EXECUTIVE SUMMARY 31
implications of social capital. Further analytical work may illuminate how social capital adds value to national balance sheets.
The future work program for CWON will also consider how to better reflect the importance of biodiversity and critical natural capital in the analysis. For example, wealth accounts currently do not fully capture the impact on renewable natural capital where losses and degradation have brought ecosystems to the point of potentially irreversible thresholds, which may precipitate catastrophic events on a scale that escapes the con-ceptual apparatus of traditional economics. The CWON accounts have provided new ways to measure sustainability in the context of material well-being. However, changes in wealth per capita provide only a measure of “weak” sustainability that implicitly assumes a high degree of substitut-ability among different asset classes. The emergence of multiple global crises, such as biodiversity loss, climate change, and ocean pollution, is a strong wake-up call about the limits to replacing critical ecosystem ser-vices with human-made substitutes.
To date, the CWON accounts have reported measures of wealth at the national level and at annual time intervals. However, improvements in data, including via remote sensing methods, open possibilities for greater spatial and temporal measurement of wealth. Future editions of CWON may be able to explore increased spatial and temporal granularity to meet the needs of different stakeholders, especially investors and financial mar-kets, and to improve the targeting of policy interventions for sustainable wealth management. For example, by breaking down the wealth accounts at subnational levels of analysis, policy makers can see how unequal the distribution of wealth and different assets is across the country, and how that has evolved over time. Enhancing the valuation of some assets to monthly or even daily reporting could support new applications and analysis, such as those in the financial sector, which typically utilizes high- frequency information.
Limitations in the estimates of produced capital and human capital may be addressed in future editions. It would be useful to disaggregate produced capital by public and private sectors, and International Monetary Fund estimates (IMF 2019) could be incorporated in future editions of the CWON. Another improvement could include reflection of the impact of natural catastrophes on the value of produced assets. Produced capital is measured as the sum of investment minus normal depreciation, and its value is not routinely adjusted in national balance sheets for losses from catastrophic events. A study by the United Kingdom’s Office for National Statistics (ONS 2019) finds that normal depreciation rates that have been in use for many years do not reflect current depreciation, which is acceler-ated by the impacts of climate change. The study suggests revision. Others have called for a review of what are considered normal depreciation rates in light of the impact of climate change, which is becoming the “new normal.”
CWON 2021 describes some of the main findings emerging from the new, expanded wealth accounts—the most comprehensive and SNA-compatible wealth accounts available so far. The analysis and the abun-dance of data—which are available online—should generate new questions

THE CHANGING WEALTH OF NATIONS 202132
about development, the dynamics of how countries accumulate wealth, and how to promote efficient, equitable, and sustainable use of wealth. Sustainability into the 21st century will depend on building and managing a much broader asset base than the one that galvanized progress since the industrial revolution. New challenges require new concepts, data, and tools in economics. CWON 2021 proposes some of them.
Note
1. A nonlinear change is one that is not based on a simple proportional relation-ship between an independent variable and a dependent variable. Nonlinear phe-nomena often show unexpected changes that are difficult to predict. Tail risks are the events with potentially catastrophic consequences but small probabili-ties of occurring. When tails grow fat it mean that these probabilities increase (Weitzman 2014).
References
Bolton, P., M. Despres, L. Pereira da Silva, F. Samama, and R. Svartzman. 2020. The Green Swan: Central Banking and Financial Stability in the Age of Climate Change. Geneva: Bank for International Settlements.
Carney, M. 2015. “Breaking the Tragedy of the Horizon: Climate Change and Financial Stability.” Speech by Mark Carney, Governor of the Bank of England and Chairman of the Financial Stability Board, at Lloyd’s of London, London, September 29, 2015.
Dasgupta, P. 2021. The Economics of Biodiversity: The Dasgupta Review. London: HM Treasury.
EC (European Commission), IMF (International Monetary Fund), OECD (Organisation for Economic Co-operation and Development), UN (United Nations), and World Bank. 2009. System of National Accounts 2008. New York: United Nations. Retrieved from http://documents.worldbank.org/curated /en/417501468164641001/System-of-national-accounts-2008.
Gill, I. S., I. Izvorski, W. van Eeghen, and D. De Rosa. 2014. Diversified Development: Making the Most of Natural Resources in Eurasia. Washington, DC: World Bank.
Hardin, G. 1968. “The Tragedy of the Commons.” Science 162 (3859): 1243–48.IMF (International Monetary Fund). 2019. “Estimating the Stock of Public Capital
in 170 Countries: August 2019 Update.” https://www.imf.org/external/np/fad / publicinvestment/pdf/csupdate_aug19.pdf.
ONS (Office for National Statistics, UK). 2019. “National Accounts Articles: Changes to the Capital Stock Estimation Methods for Blue Book 2019.” London: ONS.
Ostrom, E. 1990. Governing the Commons: The Evolution of Institutions for Collective Action. Cambridge, UK: Cambridge University Press.
Peszko, G., D. van der Mensbrugghe, A. Golub, J. Ward, D. Zenghelis, C. Marijs, A. Schopp, et al. 2020. Diversification and Cooperation in a Decarbonizing World: Climate Strategies for Fossil Fuel–Dependent Countries. Climate Change and Development Series. Washington, DC: World Bank. https://openknowledge .worldbank.org/handle/10986/34011.
UN (United Nations). 2021. System of Environmental-Economic Accounting—Ecosystem Accounting: Final Draft. New York: United Nations. https://unstats

EXECUTIVE SUMMARY 33
.un.org /unsd/statcom/52nd-session/documents/BG-3f -SEEA-EA_Final_draft -E.pdf.
UN (United Nations), EC (European Commission), FAO (Food and Agriculture Organization), IMF (International Monetary Fund), OECD (Organisation for Economic Co-operation and Development), and World Bank. 2014a. System of Environmental-Economic Accounting 2012—Central Framework. New York: United Nations.
UN (United Nations), EC (European Commission), FAO (Food and Agriculture Organization), OECD (Organisation for Economic Co-operation and Development), and World Bank. 2014b. System of Environmental- Economic Accounting 2012—Experimental Ecosystem Accounting. New York: United Nations.
Weitzman, M. L. 2014. “Fat Tails and the Social Cost of Carbon.” American Economic Review 104 (5): 544–46.

ECO-AUDIT
Environmental Benefits Statement
The World Bank Group is committed to reducing its environmental footprint. In support of this commitment, we leverage electronic publishing options and print-on-demand technology, which is located in regional hubs worldwide. Together, these initiatives enable print runs to be lowered and shipping distances decreased, resulting in reduced paper consumption, chemical use, greenhouse gas emissions, and waste.
We follow the recommended standards for paper use set by the Green Press Initiative. The majority of our books are printed on Forest Stewardship Council (FSC)–certified paper, with nearly all containing 50–100 percent recycled content. The recycled fiber in our book paper is either unbleached or bleached using totally chlorine-free (TCF), processed chlorine–free (PCF), or enhanced elemental chlorine–free (EECF) processes.
More information about the Bank’s environmental philosophy can be found at http://www.worldbank.org/corporateresponsibility.


It is now clear that a narrow focus on the growth of gross domestic product (GDP)
is insufficient to achieve humanity’s aspirations for sustainable prosperity. Well-
functioning ecosystems and educated populations are requisites for sustainable well-
being. These and other too-often-neglected ingredients of national wealth must be
addressed if the development path is to be sustainable.
The Changing Wealth of Nations 2021: Managing Assets for the Future provides the most
comprehensive accounting of the wealth of nations, an in-depth analysis of the evolution
of wealth, and pathways to build wealth for the future. This report—and the accompanying
global database—firmly establishes comprehensive wealth as a measure of sustainability
and a key component of country analytics. It expands the coverage of wealth accounts
and improves our understanding of the quality of all assets, notably, natural capital.
Wealth—the stock of produced, natural, and human capital—is measured as the sum
of assets that yield a stream of benefits over time. Changes in the wealth of nations
matter because they reflect the change in countries’ assets that underpin future income.
Countries regularly track GDP as an indicator of their economic progress, but not wealth,
and national wealth has a more direct and long-term impact on people’s lives.
This report provides a new set of tools and analysis to help policy makers navigate
risks and to guide collective action. Wealth accounts can be applied in macroeconomic
analysis to areas of major policy concern such as climate change and natural resource
management. This report can be used to look beyond GDP, to gauge nations’ economic
well-being, and to promote sustainable prosperity.
SKU 33474
Global Programon Sustainability