Embed Size (px)
Citation preview

Institutionen för medicin och vård Avdelningen för radiofysik
Hälsouniversitetet
The choice of anti-scatter grids in diagnostic radiology:
the optimization of image quality and absorbed dose
Michael Sandborg, David R Dance, Gudrun Alm Carlsson and Jan Persliden
Department of Medicine and Care Radio Physics
Faculty of Health Sciences
Series: Report / Institutionen för radiologi, Universitetet i Linköping; 72 ISSN: 1102-1799 ISRN: LIU-RAD-R-072 Publishing year: 1993 © The Author(s)
25 Januari 1993 ISSN 1102-1799
The choice of anti-scatter grids in diagnostic radioIogy:the optimization of image quaIity and absorbed dose.
Michael Sandborg, David R. Dance+,Gudrun Alm Carlsson and Jan Persliden
Department of Radiation PhysicsLinköping University, US
ISRN ULi-RAD-R--72-SE
+Department of Medical PhysicsThe Royal Marsden HospitalFulham Road, SW3 6JJ LondonUnited Kingdom
SSI P 586.90


A report to the Swedish National Institute of Radiation Protection (NIRP)
Statens strålskyddsinstitut (SSI), Box 60204, 104 01 STOCKHOLM
SSI P 586.90
The choice of anti-scatter grids in diagnostic radiology:the optimization of image quality and absorbed dose.
by
Michael Sandborg, David R. Dancet ,
Gudrun Alm Carlsson and Jan Persliden
Department of Radiation PhysicsFaculty of Health Sciences
Linköping University
5-581 85 Linköping
Sweden
and
tDepartment of Medical Physics
Royal Marsden HospitalFulham Road
London SW3 6JJUnited Kingdom


ContentsPREFACE
ABSTRACT
1. INTRODUcrION
2. METHOD
2.1. Monte Carlo computational model
2.2. Grid design parameters2.3. Grid performance parameters
2.3.1. Screen-film imaging
2.3.2. Digital imaging2.4. Grid comparison and optimization strategies
2.4.1. Influence of cover and interspace material.2.4.2. Optimisation of grid design parameters and tube potential2.4.3. Optimisation of grid ratio and tube potential in digital imaging
2.5. Examination parameters2.6. Photon interaction cross-section and X-ray energy spectra
3. RESULTS AND DICSUSSION
The choice of anti-scatter grids in diagnostic radiology:the optimization of image quality and absorbed dose.
Michae\ Sandborg, David R. Dance , Gudrun Alm Carlsson and Jan Persliden
1
2
3
5
5
56
6
7
88
8
9
9
13
13
3.1. Validation of computer code 133.2. Selection of cover and interspace material 14
3.2.1. Quantification in terms of the CIF, DIF and SIF 14
3.2.2. Survey of commercial grids in different examinations 17
3.3. Optimisation of tube potential and grid ratio in screen-film imaging 193.4. Optimisation of tube potential and grid ratio in digital imaging 24
3.5. Global optimization of grid design for screen-film imaging 26
3.5.1. Paediatric pelvis 26
3.5.2. Adult lumbar spine 273.6. Dependence of interspace material 323.7. Limitations in using high grid ratios 323.8. Tube charge considerations 333.9. Risk related quantity and modellimitations 35
4. SUMMARY AND CONCLUSIONS 35
ACKNO~EDGEMENTS 36
REFERENCES 36


1
PREFACE
The methodology for this work and the analysis of the results have been set outin c!ose collaboration between the Department of Radiation Physics, LinköpingUniversity and the Department of Medical Physics, The Royal MarsdenHospital, London. This report includes the main results and conc!usions of theproject. A complete treatment is found in Sandborg et al [l-SJ listed below.
1. SANDBORG M., DANCE D.R, PERSLIDEN J. and ALM CARLSSON G.A Monte Carlo program for optimising image quality and absorbed dose indiagnostic radiology. Submitted to Camp. Meth. & Prag. Biomed. (93-01-22)
2. SANDBORG M., DANCE D.R, ALM CARLSSON G. and PERSLIDEN J.Selection of anti-scatter grids for different imaging tasks: the advantage oflow atomic number cover and interspace materials. Accepted for publicationin Br. J. Radial. (92-11-24)
3. SANDBORG M., DANCE D.R, ALM CARLSSON G. and PERSLIDEN J.Monte Carlo study of grid performance in diagnostic radiology: factorswhich affect the selection of tube potential and grid ratio. Accepted for publication in Br. ]. Radial. (93-01-18)
4. SANDBORG M., DANCE D.R, ALM CARLSSON G. and PERSLIDEN J.Monte Carlo study of grid performance in diagnostic radiology: task dependent optimization for screen-film imaging. Submitted to Br. ]. Radial.
(92-11-16)
5. SANDBORG M., DANCE D.R, ALM CARLSSON G. and PERSLIDEN J.Monte Carlo study of grid performance in diagnostic radiology: task dependent optimization for digital radiology. In preparation. To be submitted toMed. Phys.

2
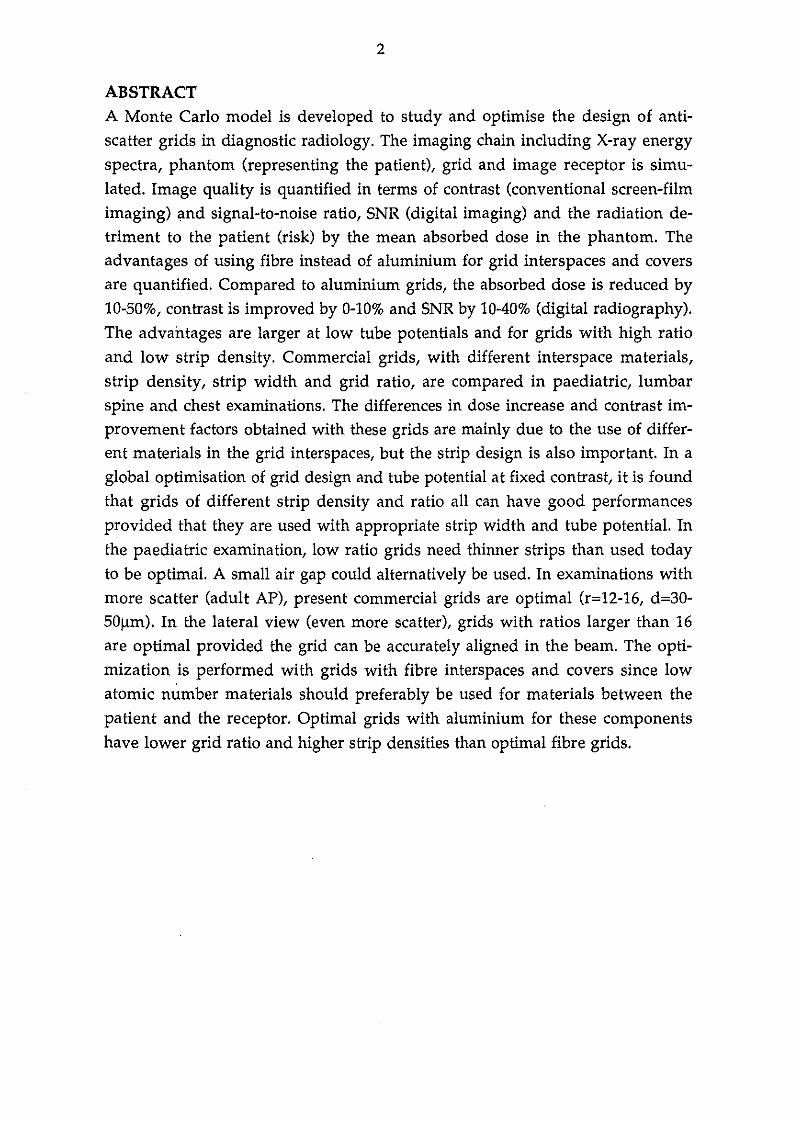
ABSTRACT
A Monte Carlo model is developed to study and optimise the design of antiscatter grids in diagnostic radiology. The imaging chain including X-ray energyspectra, phantom (representing the patient), grid and image receptor is simulated. Image qua1ity is quantified in terms of contrast (conventionai screen-filmimaging) and signal-to-noise ratio, SNR (digital imaging) and the radiation detriment to the patient (risk) by the mean absorbed dose in the phantom. Theadvantages of using fibre instead of aluminium for grid interspaces and coversare quantified. Compared to aluminium grids, the absorbed dose is reduced by10-50%, contrast is improved by 0-10% and SNR by 10-40% (digital radiography).The advantages are larger at low tube potentials and for grids with high ratioand low strip density. Commercial grids, with different interspace materials,strip density, strip width and grid ratio, are compared in paediatric, lumbarspine and chest examinations. The differences in dose increase and contrast improvement factors obtained with these grids are mainly due to the use of different materials in the grid interspaces, but the strip design is also important. In aglobal optimisation of grid design and tube potential at fixed contrast, it is foundthat grids of different strip density and ratio all can have good performancesprovided that they are used with appropriate strip width and tube potential. Inthe paediatric examination, low ratio grids need thinner strips than used todayto be optimal. A small air gap could a1ternatively be used. In examinations withmore scatter (adult AP), present commercial grids are optimal (r=12-16, d=30SOllm). In the lateral view (even more scatter), grids with ratios larger than 16are optimal provided the grid can be accurately a1igned in the beam. The optimization is performed with grids with fibre interspaces and covers since lowatomic number materials should preferably be used for materials between thepatient and the receptor. Optimal grids with aluminium for these componentshave lower grid ratio and higher strip densities than optimal fibre grids.


3
1. INTRODUCTIONIn X-ray projection radiography, large volumes of the human body are commonly irradiated and considerable amounts of scattered photons are generated.The scattered radiation degrades the image contrast in screen-film imaging systems and the signal-to-noise ratio, SNR, in digital imaging systems to an extentwhich depends on the ratio between the energies imparted to the image receptor by scattered and primary photons (scatter-to-primary ratio). The scatter-toprimary ratio itse1f depends upon the examination conditions (body size andcomposition, field size, radiographic projection), the operating parameters (tubepotential, anti-scatter grid design, atomic composition and thickness of the image receptor), and the position in the image plane. To achieve sufficient imagequality and enable accurate diagnosis at a low dose or manageable exposuretime, effi~ient scatter-rejection techniques are usually needed. The use of gridsis today the most common such technique.
In the literature, the performance of grids is usually studied and evaluated interms of the contrast improvement factor, CIF, and the dose increase factor, DIF(Bucky factor) which describes the increase in patient dose that is necessary tomaintain film optical density. The quantities CIF and DIF are usually derived interms of the fractions of primary and secondary photons transmitted throughthe grid (Bonenkamp and Hondius Boldingh 1959, Hondius Boldingh 1961,Strid 1976, Kalender 1979 and 1982, Nielsen 1980 and 1985, Chan and Doi 1982,Doi et al 1983, Chan et al 1985, Sandborg et al 1992b) and are determined at fixedtube potential. In some of these works, a large variety of grid designs were evaluated but for a lirnited range of irradiation conditions usually set by the international recommendations for testing and comparing grid performance (IEC 1978).It is not evident that a grid which works satisfactory in one irradiation condition will perform wel1 under other conditions. It is thus of interest to study gridperformance under various irradiation conditions resulting in varying levels ofscatter-to-primary ratios and angular- and energy distributions of the scatteredphotons.
To reduce patient irradiation, the International Commission on RadiologicalProtection (ICRP 1985) has put particular emphasis on the use of 'materials withvery low attenuation (such as those made of carbon fibre) for cassette fronts,table tops and the non-opaque parts of grids'. The effect on patient dose of replacing conventionaI materials, such as aluminium, in this equipment withcarbon fibre or other fibre materials has been experimentally investigated byseveral authors (Hufton and Russell1986, Hufton et al 1987, Avison 1989).
4
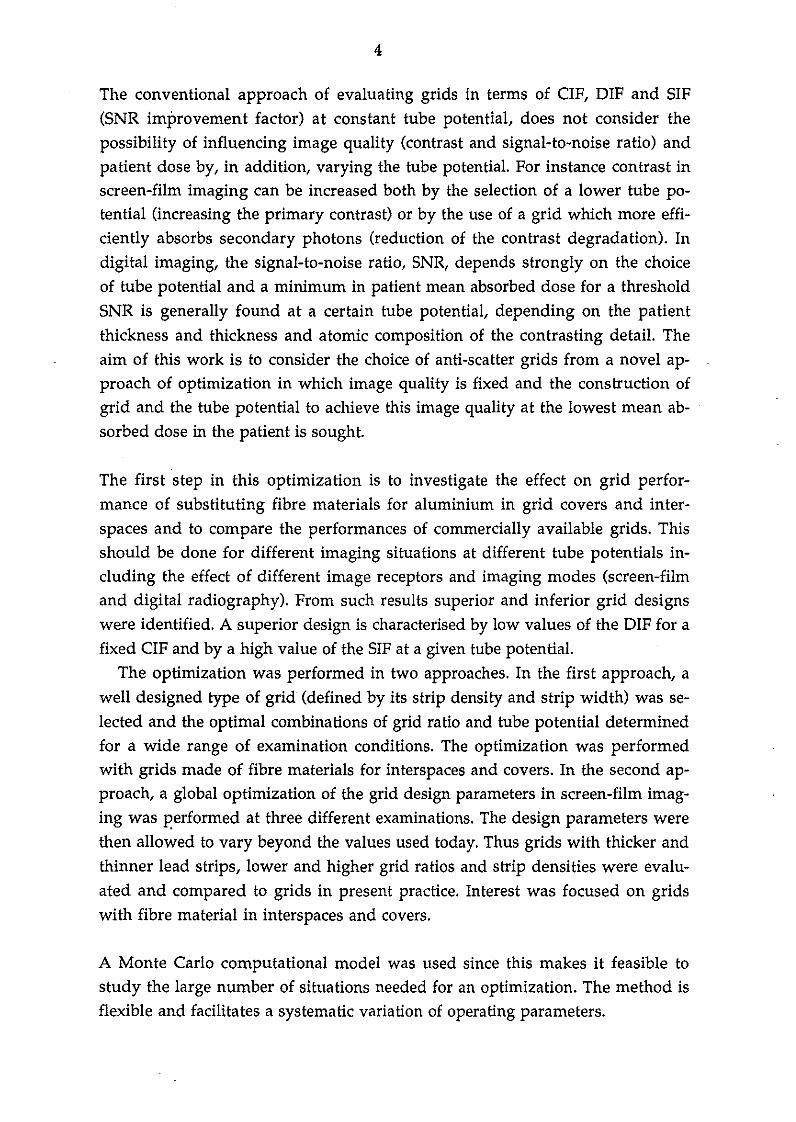
The conventional approach of evaluating grids in terms of CIF, DIF and SIF(SNR improvement factor) at constant tube potential, does not consider thepossibility of influencing image quality (contrast and signal-to-noise ratio) andpatient dose by, in addition, varying the tube potential. For instance contrast inscreen-film imaging can be increased both by the selection of a lower tube potential (increasing the primary contrast) or by the use of a grid which more efficiently absorbs secondary photons (reduction of the contrast degradation). Indigital imaging, the signal-to-noise ratio, SNR, depends strongly on the choiceof tube potential and a minimum in patient mean absorbed dose for a thresholdSNR is generally found at a certain tube potential, depending on the patient
thickness and thickness and atomic composition of the contrasting detail. Theaim of this work is to consider the choice of anti-scatter grids from a novel approach of optimization in which image quality is fixed and the construction ofgrid and the tube potential to achieve this image quality at the lowest mean absorbed dose in the patient is sought.
The first step in this optimization is to investigate the effect on grid performance of substituting fibre materials for aluminium in grid covers and interspaces and to compare the performances of commercially available grids. Thisshould be done for different imaging situations at different tube potentials including the effect of different image receptors and imaging modes (screen-filmand digital radiography). From such results superior and inferior grid designswere identified. A superior design is characterised by low values of the DIF for afixed CIF and by a high value of the SIF at a given tube potential.
The optimization was performed in two approaches. In the first approach, aweIl designed type of grid (defined by its strip density and strip width) was selected and the optimal combinations of grid ratio and tube potential determinedfor a wide range of examination conditions. The optimization was performedwith grids made of fibre materials for interspaces and covers. In the second approach, a global optimization of the grid design parameters in screen-film imaging was p'erformed at three different examinations. The design parameters werethen aIlowed to vary beyond the values used today. Thus grids with thicker andthinner lead strips, lower and higher grid ratios and strip densities were evaluated and compared to grids in present practice. Interest was focused on gridswith fibre material in interspaces and covers.
A Monte Carlo computational model was used since this makes it feasible tostudy the large number of situations needed for an optimization. The method isflexible and facilitates a systematic variation of operating parameters.

5
2. METHOD2.1. Monte Carlo computational modelMonte Carlo methods are used to model the imaging chain, including theemission of energy distributed X-rays and their transport through phantom,anti-scatter grid and image receptor. The computer program is based on programs developed by Dance 1980, Persliden 1983, Day and Dance 1983, Dance andDay 1984, Persliden and Alm Carlsson 1986, Dance et al 1992 and Sandborg andAlm Carlsson 1992. The special feature of the code is the use of a collision densitY estimator (Persliden and Alm Carlsson 1986) to compute physical quantities, such as the image quality parameters contrast and signal-to-noise ratio,SNR, at points in the image plane with high precision. Analytical and MonteCarlo methods are combined and the generation of secondary photons in bothphantom and grid is considered. The mean absorbed dose in the phantom isused as a measure of radiation detriment to the patient. The code allows easyvariation of input parameters, such as X-ray spectrum, composition and size ofthe phantom and contrasting detail, size of the entrance field, anti-scatter grid,air gap and image receptor. The program can thus be used to investigate a widerange of imaging configurations for screen-film and digital imaging. A detaileddescription of the methods, with a validation of the code is given in Sandborget al 1992a [1].
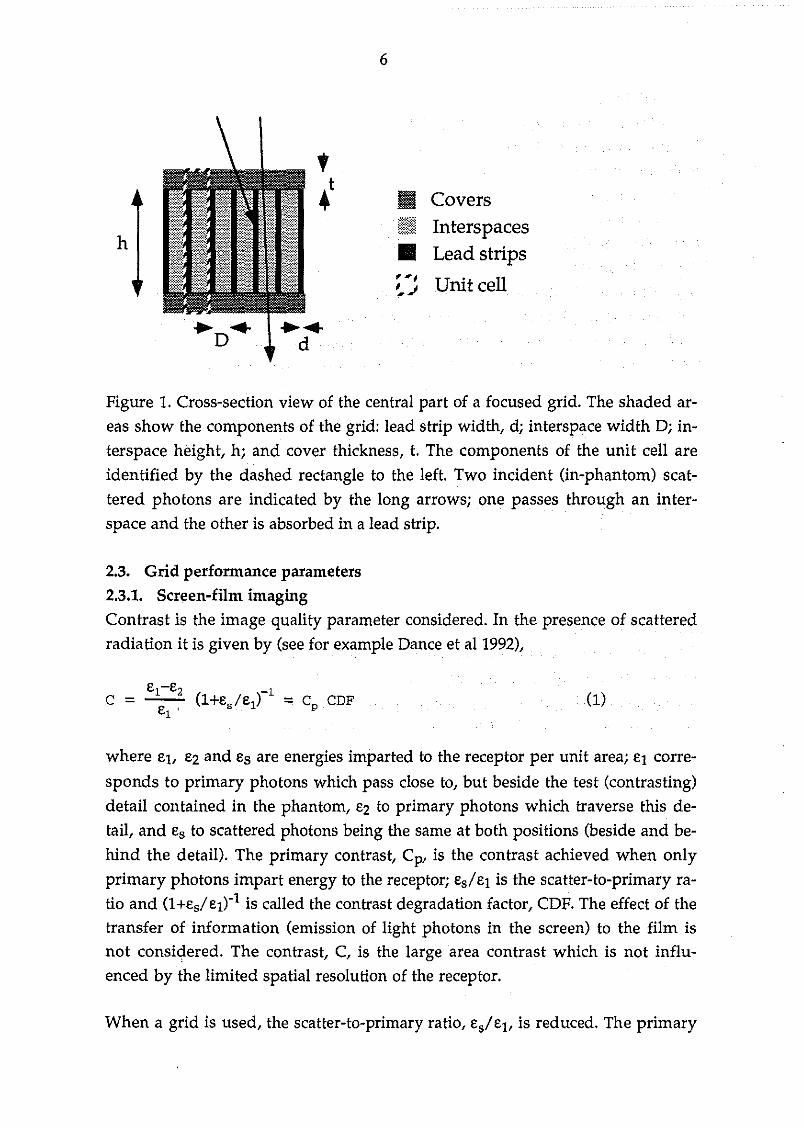
2.2. Grid design parametersGrids can be specified in terms of the number of lead strips per centimetre (strip
density, N), the width, d, and height of the lead strips, h, and the width of theinterspace material, D. It is common to quote the ratio of the height of the leadstrips and the width of the interspace material as the grid ratio, r=h/D. It is alsonecessary to specify the composition of the interspace material, and the thickness and composition of the top and bottom grid covers, t. A cross-section viewof the central part of a focused grid is shown in figure 1. All results are for a focused grid. The unit cell in the figure is used to characterise the grid in theMonte Carlo simulation of the generation of secondary photons in the grid itself, due to interactions of primary and scattered photons incident on it. Data ongrid cons~ruction for commercial grids were gathered from three manufacturers(MITAYA, Japan, SMIT Röntgen, The Netherlands and LYSHOLM, Sweden).The composition of cover and interspace materials are either aluminium orcotton fibre (cellulose) for grid interspaces and carbon fibre for grid covers.Complete details on grid construction and composition of the commercial gridsinvestigated is found in Sandborg et al 1992b [2].
h
6
II CoversIii Interspaces• Lead strips
Unit cell
Pigure 1. Cross-section view of the central part of a focused grid. The shaded areas show the components of the grid: lead strip width, di interspace width Di interspace height, hi and cover thickness, t. The components of the unit cell areidentified by the dashed rectangle to the left. Two incident (in-phantom) scat
tered photons are indicated by the long arrOWSi one passes through an interspace and the other is absorbed in a lead strip.
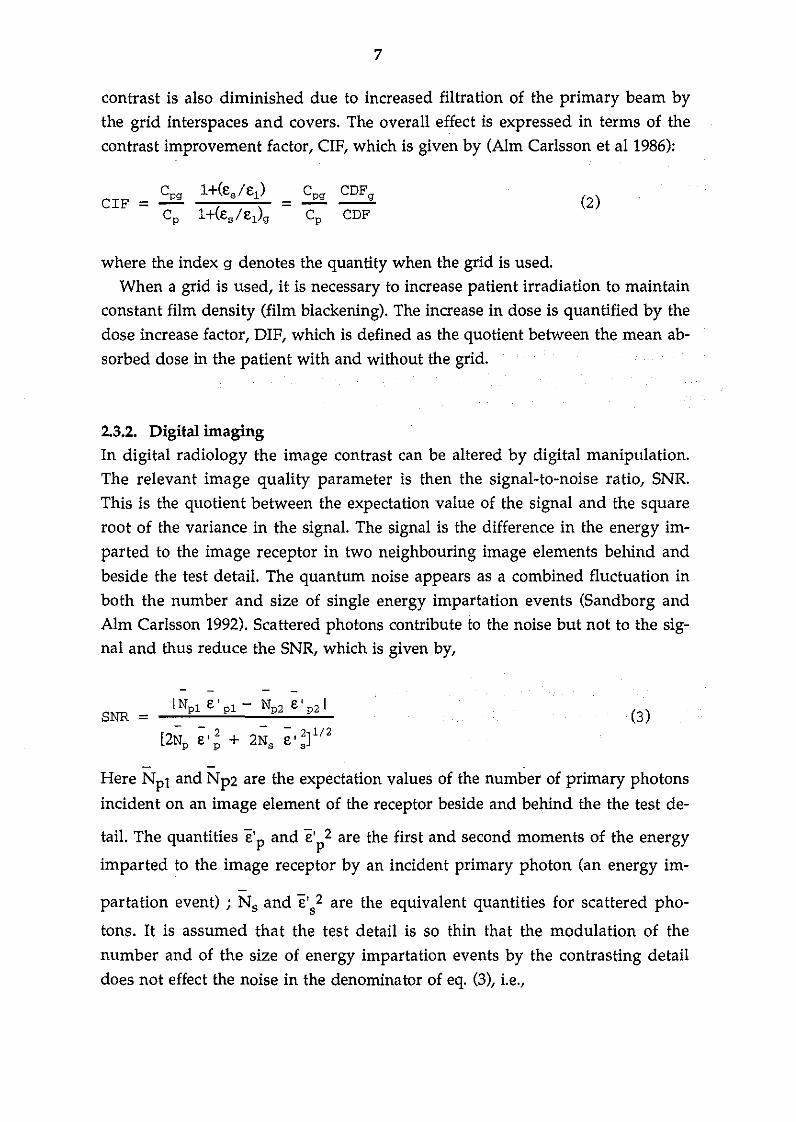
2.3. Grid performance parameters2.3.1. Screen-film imagingContrast is the image quality parameter considered. In the presence of scatteredradiation it is given by (see for example Dance et al 1992),
where et, E2 and Es are energies imparted to the receptor per unit areai El corre
sponds to primary photons which pass elose to, but beside the test (contrasting)detail contained in the phantom, E2 to primary photons which traverse this detail, and Es to scattered photons being the same at both positions (beside and behind the detail). The primary contrast, Cp, is the contrast achieved when only
primary photons impart energy to the receptori Es/E1 is the scatter-to-primary ratio and (l+Es/E1t1 is called the contrast degradation factor, CDP. The effect of thetransfer of information (emission of light photons in the screen) to the film isnot considered. The contrast, C, is the large area contrast which is not influenced by the limited spatial resolution of the receptor.
When a grid is used, the scatter-to-primary ratio, Es/E1, is reduced. The primary
7
contrast is also diminished due to increased filtration of the primary beam bythe grid interspaces and covers. The overall effect is expressed in terms of thecontrast improvement factor, CIF, which is given by (Alm Carlsson et al 1986):
CIF =l+(es/ei )
=l+(es/ei)g
CDFg
CDF
where the index g denotes the quantity when the grid is used.When a grid is used, it is necessary to increase patient irradiation to maintain
constant film density (film blackening). The increase in dose is quantified by thedose increase factor, DIF, which is defined as the quotient between the mean absorbed dose in the patient with and without the grid.
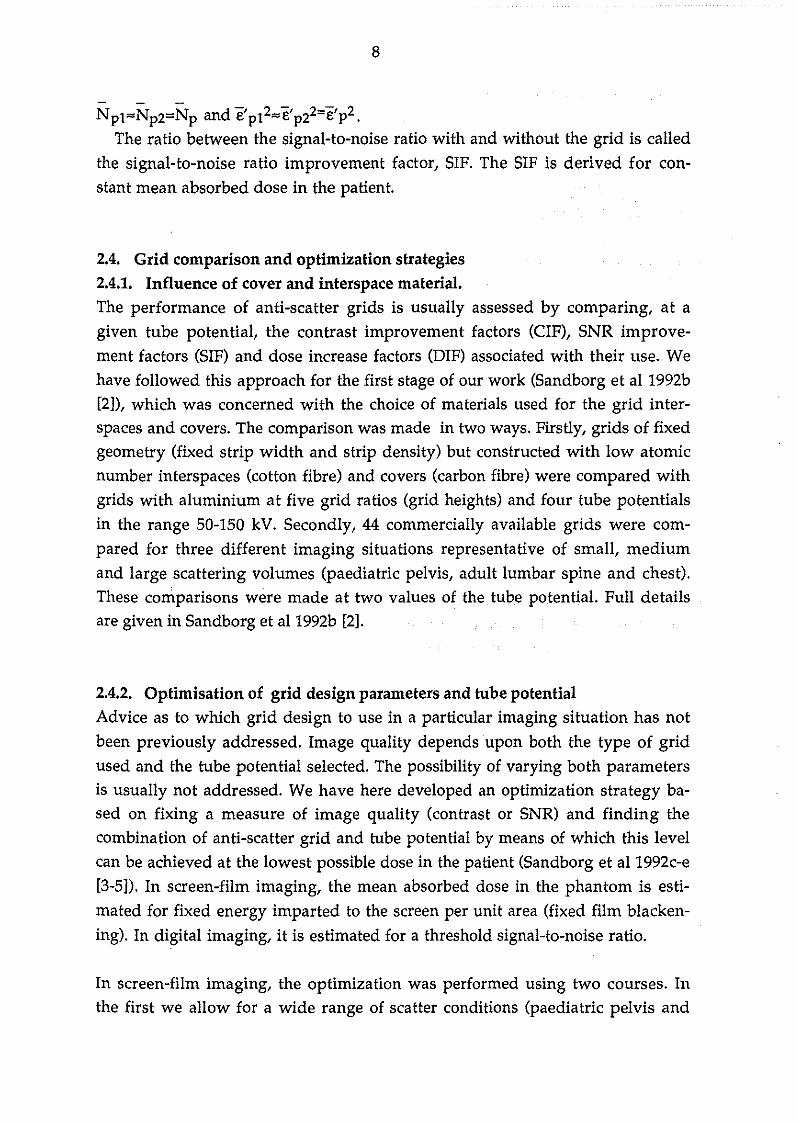
2.3.2. Digital imagingIn digital radiology the image contrast can be altered by digital manipulation.The relevant image quality parameter is then the signal-to-noise ratio, SNR.This is the quotient between the expectation value of the signal and the squareroot of the variance in the signal. The signal is the difference in the energy im
parted to the image receptor in two neighbouring image elements behind andbeside the test detail. The quantum noise appears as a combined f1uctuation inboth the number and size of single energy impartation events (Sandborg andAlm Carlsson 1992). Scattered photons contribute to the noise but not to the signal and thus reduce the SNR, which is given by,
SNR = INpi e' pi - Np2 e' p2 I
[2N ~,2+2N ~,2]1/2p p s s
(3)
- -Here Npl and Np2 are the expectation values of the number of primary photons
incident on an image element of the receptor beside and behind the the test de-
tail. The quantities e'p and e'/ are the first and second moments of the energy
imparted to the image receptor by an incident primary photon (an energy im-
partation event) ; Ns and e's2 are the equivalent quantities for scattered pho
tons. It is assumed that the test detail is so thin that the modulation of thenumber and of the size of energy impartation events by the contrasting detaildoes not effect the noise in the denominator of eq. (3), Le.,
8
Npl"'Np2=Np and e'p12",e'p22=e'p2.
The ratio between the signal-to-noise ratio with and without the grid is calledthe signal-to-noise ratio improvement factor, SIF. The SIF is derived for con
stant mean absorbed dose in the patient.
2.4. Grid comparison and optimization strategies2.4.1. Influence of cover and interspace material.The performance of anti-scatter grids is usually assessed by comparing, at agiven tube potential, the contrast improvement factors (CIF), SNR improvement factors (SIF) and dose increase factors (DIF) associated with their use. Wehave followed this approach for the first stage of our work (Sandborg et al 1992b[2]), which was concerned with the choice of materials used for the grid interspaces and covers. The comparison was made in two ways. Firstly, grids of fixedgeometry (fixed strip width and strip density) but constructed with low atomicnumber interspaces (cotton fibre) and covers (carbon fibre) were compared withgrids with aluminium at five grid ratios (grid heights) and four tube potentialsin the range 50-150 kV. Secondly, 44 commercially available grids were com
pared for three different imaging situations representative of small, mediumand large scattering volumes (paediatric pelvis, adult lumbar spine and chest).These comparisons were made at two values of the tube potential. Full detailsare given in Sandborg et al 1992b [2].
2.4.2. Optimisation of grid design parameters and tube potentialAdvice as to which grid design to use in aparticular imaging situation has not
been previously addressed. Image quality depends upon both the type of gridused and the tube potential selected. The possibility of varying both parametersis usually not addressed. We have here developed an optimization strategy based on fixing a measure of image quality (contrast or SNR) and finding thecombination of anti-scatter grid and tube potential by means of which this levelcan be achieved at the lowest possible dose in the patient (Sandborg et al 1992c-e[3-5]). In screen-film imaging, the mean absorbed dose in the phantom is estimated for fixed energy imparted to the screen per unit area (fixed film blacken
ing). In digital imaging, it is estimated for a threshold signal-to-noise ratio.
In screen-film imaging, the optimization was performed using two courses. Inthe first we allow for a wide range of scatter conditions (paediatric pelvis and

9
chest, adu1t lumbar spine, small field radiography, fluoroscopy and chest) butlimited the calculations, to one type of a well designed commercially availablegrid (SMIT Röntgen 36 strips/cm, 36 /lm lead strip width, fibre covers and interspaces) at a range of five grid ratios between 6-14. The optimization was confined to finding the most favourable combination of tube potential and grid ratio. In some cases, grid performance was compared to that of a 20 cm air gap.Full details are given in Sandborg et al 1992c [3], which contains recommendations for the various imaging situations, taking due account of the tube charge,Q (mAs) required to maintain the optical density on the film and the alignmentand focus~grid centring problems associated with the use of higher grid ratios.
In the second course, a global optimization was performed in which all thegrid parameters (strip width, strip density and grid ratio) were allowed to varyincluding values outside those presently available. To get a manageable computing time, the investigation was limited to three scatter conditions (paediatricpelvis AP, adult lumbar spine AP and lateral views). A full description of theresults is given in Sandborg et al 1992d [4].
2.4.3. Optimisation of grid ratio and tube potential in digital imaging.The main objective of the digital studies was to establish the optimal choice ofgrid and tube potential based on a range of "well designed" grids. In addition,the performance of grids with aluminium interspaces and covers was considered, so that the optimal tube potential could also be found for such grids. Threeexaminations (scatter conditions) were considered (paediatric pelvis, adult chestand an adult fluoroscopy) at a wide range of tube potentials, but for a limitedrange of grids. Grids with fibre interspaces and covers from SMIT Röntgen withstrip density 36 strips/cm, strip width 36 /lm and grid ratios 6, 10 and 14 wereused as well as grids with aluminium interspaces and covers from Mitaya withstrip density 34 strips/cm, strip width 50 /lm and grid ratio 10. An air gap of 20cm was also studied. A threshold signal-to-noise ratio was chosen as, SNRth=Sand the mean absorbed dose in the phantom was calculated at this threshold ofdetection. Full details are given in Sandborg et al 1992e [5].
2.5. Examination parametersHomogeneous blocks of soft tissue were used to represent the patient. A block~
shaped phantom with the same thickness as the maximal thickness of a cylinder-shaped phantom yields only 2 % larger value for the imparted fradion(Persliden and Sandborg 1993). Shrimpton at al (1984) have also confirmed the

10
validity of using simple homogeneous phantoms for the adult trunk sincephantoms containing bone- and lung-tissue did not yield significantly differentimparted fractions. This means that the approximation of using block-shapedphantom's is good, with regard to the energy imparted to the patient. Thin details of bone, iodine and soft tissue were used as contrasting details. Fluorescentscreens of CaW04, BaFCI, Gd20 2S and CsI, with thicknesses corresponding to
those found in present practice, have been used as image receptors. The focusfilm distance, field size and the block dimensions were seleeted to represent different radiological examinations of adults and children (details in table 1). Asmall air gap (4 cm) is retained between the phantom and the grid to al10w forthe grid and its movement mechanism. Aschematic description of the irradiation geometry used is shown in figure 2.
AG
FFD
Figure 2. The figure shows the irradiation geometry including phantom dimensions (length, Lj width, Wj and thickness, T), the entrance radiation field area(upper shaded area), air gap length, AG, and focus-film distance, FFD. The striped area shows the location of the grid, just above the image receptor (lowershaded area).
11
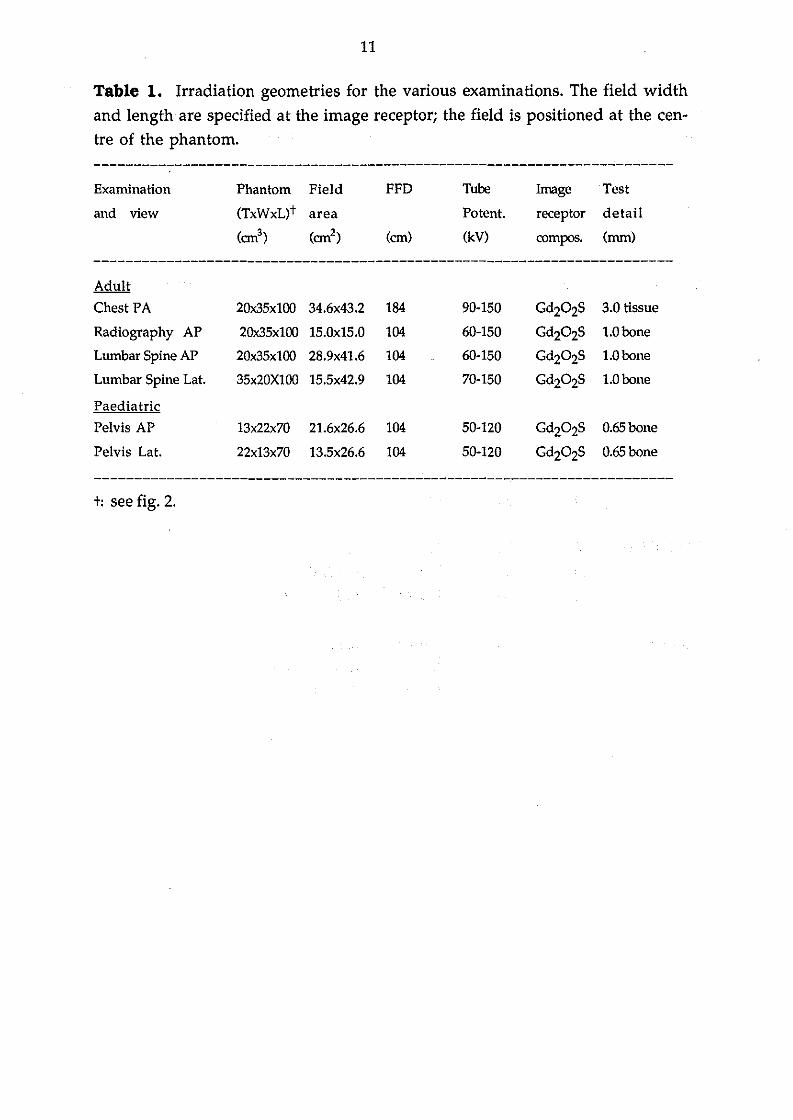
Table l. Irradiation geometries for the various examinations. The field widthand length are specified at the image receptor; the field is positioned at the centre of the phantom.
Examination
and view
Phantom Field
(TxWxL)t area
(cm3) (cm2)
FFD
(cm)
Tube
Potent.
(kV)
Image Test
receptor detail
compos. (mm)
Adult
Chest PA 20x35x100 34.6x43.2 184 90-150 Gd202S 3.0 tissue
Radiography AP 20x35x100 15.0x15.0 104 60-150 Gd202S 1.0bone
Lumbar Spine AP 20x35x100 28.9x41.6 104 60-150 Gd202S 1.0bone
Lumbar Spine Lat. 35x20X100 15.5x42.9 104 70-150 Gd202S 1.0bone
Paediatric
Pelvis AP 13x22x70 21.6x26.6 104 50-120 Gd202S O.65bone
Pelvis Lat. 22x13x70 13.5x26.6 104 50-120 Gd202S O.65bone
------------------------------------------------------------------------
t: see fig. 2.

12
Table 2. Parameters of commerciaIly available grids. The grids are specified by
their strip density, N, strip width, d, interspace width, D, grid ratio, r, and coverthickness, t. P denotes cotton fibre interspaces, CP carbon fibre covers and Al
aluminium interspaces and covers. The grid ratios is the ratio between the in
terspace height, h, and width, D. The grid ratios listed beloware rounded val
ues.
---------T--------------------------------------------------------------
Grid Strip Strip Interspace Grid Cover thickness
Manufacturer density, width, width, ratios, (top + bottom),
N d D r 2t
(cm-l) (J.un) (!lm) (mm)
------------------------------------------------------------------------
SMIT 24 50 370 P 4,8,10,12 1.0 CP
Röntgen 28 50 300 P 5,8,10,15 "36 36 250 P 6,10,12,14 "
40 69 200 P 8,11,15 "44 36 200 P 8,11,13,15 "60 36 120P 8,10,13 "
LYSHOLM 30 50 280 Al 5,8,10 0.5 CP
40 40 210 Al 8,10,12 "70 36 100 Al 6,11,13,16 "
MITAYA 34 50 250 Al 6,8,12,14 0.3 Al
40 50 200 Al 6, 8, 11, 13, 16 "60 46 120 Al 8,12,16 0.1 cpt
t: Approximates 0.1 mm polyester. Rigidity is ensured by a U-shaped stainless steel frame at
tached to the four sides of the grid.

13
2.6. Photon interaction cross-section and X-ray energy spectraFollowing the advice of Hubbell (1990), photo-electric cross-sections were takenfrom Berger and Hubbell 1987, total and differential scattering cross-sectionsfrom Hubbell et al 1975 (coherent) and Hubbell and 0verb0 1979 (incoherent).The effect of inter-atomic binding on the scattering cross-section (Morin 1982)was neglected due to lack of data for the medium used (soft tissue). The energiesof the K-absorption edges in the image receptor were taken from Lederer andShirley 1978 as were fluorescent yields and intensities of Ka and K~ characteristic X-rays. The energies of the Ka and K~ photons and the relative probability ofa photoelectric absorption taking place with the K-shell electrons were takenfrom Storm and Israel 1970.
Primary X-ray spectra were derived using a computer program developed byBirch et al 1979 and 1988. The energy spectra correspond to constant tube potentials between 40 and 150 kV with 3.0 mm aluminium total filtration.
3. RESULTS AND DICSUSSION
3.1. Validation of computer codeThe computer code has been extensively tested and validated against both measurements (meas.) and other Monte Carlo calculations (MC). Detailed comparisons have been made with Kalender 1981 (MC) with respect to scatter fractionsbehind water slabs in different irradiation geometries, with Nielsen 1985(meas.) with respect to scatter-to-primary ratios with air gap, with Alm Carlssonet al 1984 (MC) with respect to imparted fraction of incident energy to the phantom, with Chan et al 1985 (meas., MC) with respect to Monte Carlo derived fractions of transmitted primary and secondary photons through grids, and withWalraven 1991 (meas.) with respect to dose increase and contrast improvementfactors. Full details are given in Sandborg et al 1992a [1].
In table 3 calculations of the primary and total grid transmissions, Tp and Tt. are
compared with measurements by Chan et al 1985 in six situations with differenttube potentials, water slab thicknesses and image receptors.

14
Table 3. Ca1culated (this work) and measured (Chan et al 1985) primary and totalgrid transmissions, Tp and Tt. The notation N/r/d means N strips/cm, grid ra
tio r and strip width d. The error ranges given correspond to two standard deviations (95% confidence interval). The abbreviations LR and PS denote thescreen-film systems Kodak Lanex Regu!ar and DuPont Cronex Par Speed, re
spective!y. T= thickness of water stab, U=tube potential. Fie!d width is 30x30 cm2
at the top of the phantom.
-------------------------------------------------------------------------T U Rec. Grid Primary grid transmission, Tp Total grid transmission, Tt
on kV N/r/d This work Chan et al This work Chan et al
-------------------------------------------------------------------------25 70 LR 40/10/50 0.607±0.004 0.621±0.019 0.135±0.008 0.127±0.00720 80 LR 40/8/50 0.645±0.004 0.632±0.019 0.203±0.008 0.213±0.01220 80 PS 40/8/50 0.625±0.003 0.633±0.019 0.147±0.008 0.151±0.00915 120 LR 40/10/50 0.649±0.005 0.682±0.020 0.241±0.009 0.264±0.01520 80 LR 33/6/50 0.678±0.006 0.682±0.020 0.231±0.009 0.257±0.01520 80 PS 40/15/50 0.543±0.003 0.527±0.016 0.094±0.003 0.092±0.005
Our ca1culations and the resu!ts of Chan et a! agree, in 8 out of 12 tested cases,within two standard deviations (95% confidence interva1) of the measure
ments. Differences between ca1cu!ated and the measured va!ues may be due tothat the ca1cu!ations are performed on 'perfectly manufactured' grids whereasthe measurements are made with 'rea!' grids. Chan et a! used a Lucite tank with1 cm thick walls filled with water. Lucite is known to generate differentamounts of seattered photons compared to water (Nie!sen 1985, Sandborg 1990).The simulations were made with water on!y. Chan et al 1985 used covers ofaluminium without mentioning their thickness, which is an additiona! sourceof systematic uncertainty.
3.2. Selection of cover and interspace material3.2.1. Quantification in terms of the CIF, DIF and SIFThe advantage of using low atomic number materials instead of aluminium forthe construction of the grid interspaces and covers, to achieve dose reduction, iswell known. However, little data is availab!e to quantify the changes in terms ofimage qua1ity (contrast and SNR) and dose reduction for different radiographicprojections, tube potentials and grid designs. Such data are essentia! to provideproper scientific justification for the introduction of dose-saving (low atomic
15
number) grids.
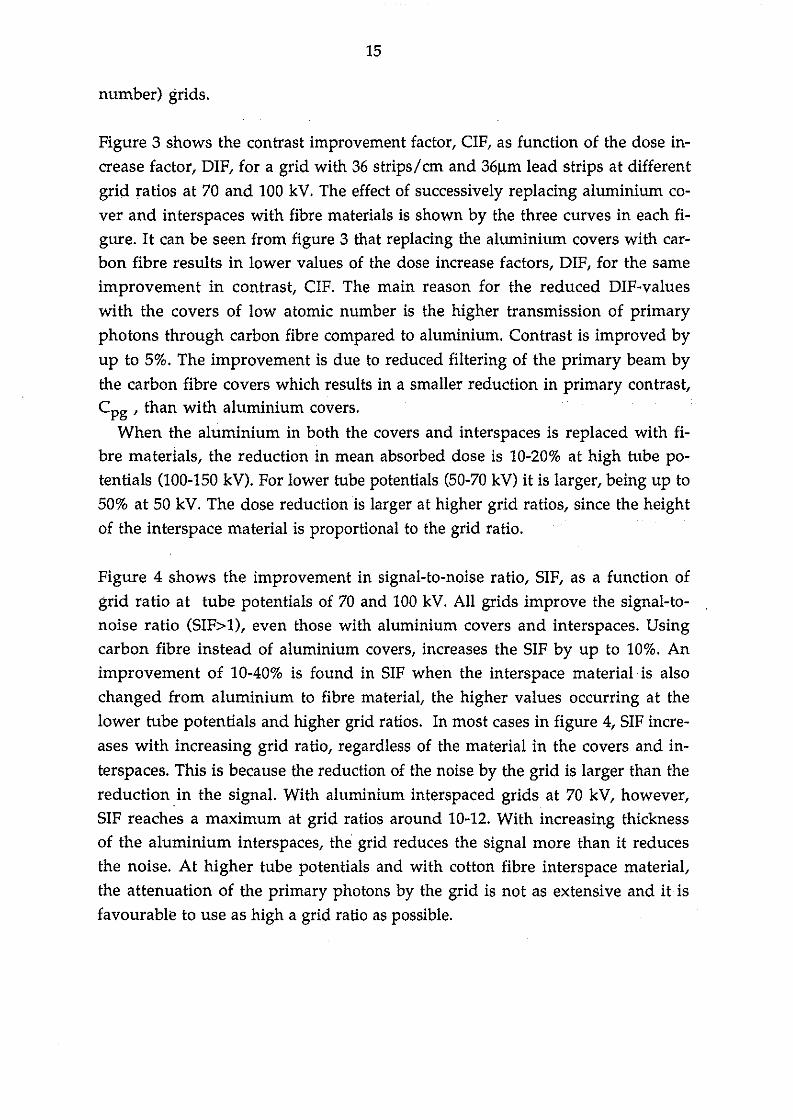
Figure 3 shows the contrast improvement factor, CIF, as function of the dose increase factor, DIF, for a grid with 36 strips/cm and 361lm lead strips at differentgrid ratios at 70 and 100 kV. The effect of successively replacing aluminium cover and interspaces with fibre materials is shown by the three curves in each figure. It can be seen from figure 3 that replacing the aluminium covers with carbon fibre results in lower values of the dose increase factors, DIF, for the sameimprovement in contrast, CIF. The main reason for the reduced DIF-valueswith the covers of low atomic number is the higher transmission of primaryphotons through carbon fibre compared to aluminium. Contrast is improved byup to 5%. The improvement is due to reduced filtering of the primary beam bythe carbon fibre covers which results in a smaller reduction in primary contrast,Cpg , than with aluminium covers.
When the aluminium in both the covers and interspaces is replaced with fibre materials, the reduction in mean absorbed dose is 10-20% at high tube potentials (100-150 kV). For lower tube potentials (50-70 kV) it is larger, being up to50% at 50 kV. The dose reduction is larger at higher grid ratios, since the heightof the interspace material is proportional to the grid ratio.
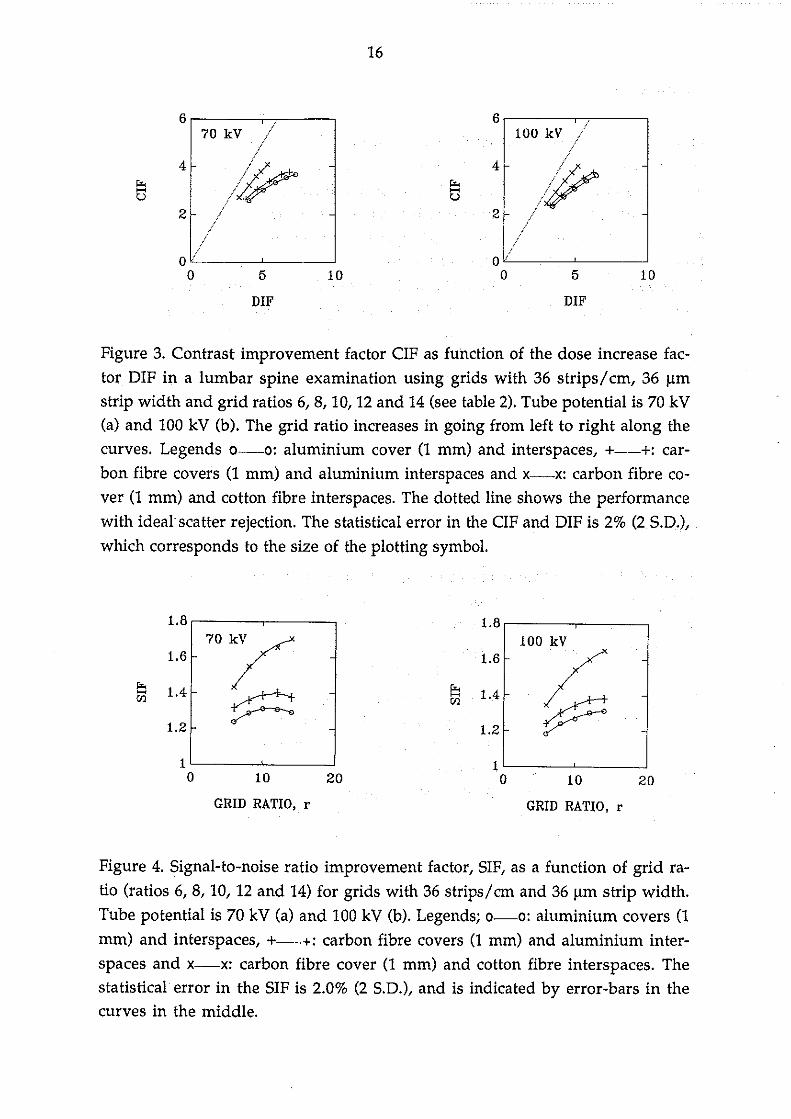
Figure 4 shows the improvement in signal-to-noise ratio, SIF, as a function ofgrid ratio at tube potentials of 70 and 100 kV. All grids improve the signal-tonoise ratio (SIF>l), even those with aluminium covers and interspaces. Usingcarbon fibre instead of aluminium covers, increases the SIF by up to 10%. Animprovement of 10-40% is found in SIF when the interspace material is alsochanged from aluminium to fibre material, the higher values occurring at thelower tube potentials and higher grid ratios. In most cases in figure 4, SIF increases with increasing grid ratio, regardless of the material in the covers and in
terspaces. This is because the reduction of the noise by the grid is larger than thereduction in the signal. With aluminium interspaced grids at 70 kV, however,SIF reaches a maximum at grid ratios around 10-12. With increasing thicknessof the aluminium interspaces, the grid reduces the signal more than it reducesthe noise. At higher tube potentials and with cotton fibre interspace material,the attenuation of the primary photons by the grid is not as extensive and it isfavourable to use as high a grid ratio as possible.
16
6~--~~--~./
100 kV /6
70 kV ./,/
4
j~Ii<>-<U
,/'2 ././
OO 5 10
DIF
4
2
O 5
DIF
10
Figure 3. Contrast improvement factor CIF as function of the dose increase factor DIF in a lumbar spine examination using grids with 36 strips/cm, 36 /lmstrip width and grid ratios 6, 8, 10, 12 and 14 (see table 2). Tube potential is 70 kV(a) and 100 kV (b). The grid ratio increases in going from left to right along thecurves. Legends o-o: aluminium cover (1 mm) and interspaces, +--+: carbon fibre covers (1 mm) and aluminium interspaces and x-x: carbon fibre cover (l mm) and cotton fibre interspaces. The dotted line shows the performancewith ideal scatter rejection. The statistical error in the CIF and DIF is 2% (2 S.D.),which corresponds to the size of the plotting symbol.
1.8 1.870r 100 kV
1.6 1.6
~Ii< 1.4 Ii<>-<
~-~>-< 1.4en en
1.21- 1.2
1 1O 10 20 O 10 20
GRID RATIO, r GRID RATIO, r
Figure 4. Signal-to-noise ratio improvement factor, SIF, as a function of grid ratio (ratios 6,8,10,12 and 14) for grids with 36 strips/cm and 36 /lm strip width.Tube potential is 70 kV (a) and 100 kV (b). Legends; o-o: aluminium covers (l
mm) and interspaces, +-+: carbon fibre covers (l mm) and aluminium interspaces and x-x: carbon fibre cover (l mm) and cotton fibre interspaces. Thestatistical error in the SIF is 2.0% (2 S.D.), and is indicated by error-bars in thecurves in the middle.

17
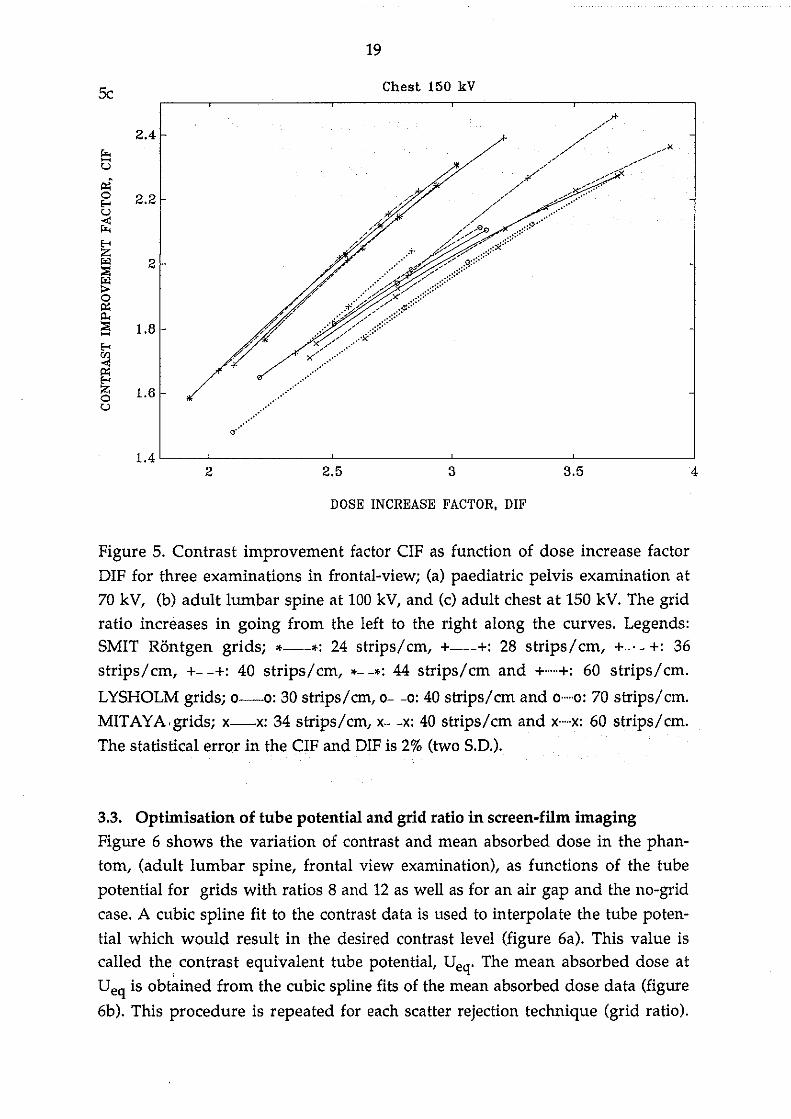
3.2.2. Survey of commercial grids in different examinationsThe results from the survey of commercially available grids are shown in figure5 in three examinations in frontal view; paediatrie pelvis 70 kV, adult lumbarspine 100 kV, and adult chest 150 kV. Grids with the same strip thickness andstrip density but with different grid ratios are plotted on the same curve. In thethree irradiation geometries shown in figure 5, a large variation in the relationbetween the contrast improvement and dose increase fadors is found amongthe grids from different manufacturers. The main reason for the differences isthe use of different materials for covers and interspaces but variations in gridconstruction such as strip thiekness and strip density are also important. Allgrids having carbon fibre covers and cotton fibre interspaces are located to theleft in the figure, Le., have lower DIF for a given CIF than grids with aluminium for these components. Grids of different construdion can give similar
. and good performance as indieated by the overlap of the leftmost curves (SMITRöntgen grids). The grids with aluminium interspace and with either carbon fibre or aluminium covers (Lysholm and Mitaya grids) perform similarly to eachother, but less wel1 compared to the grids with fibre covers and interspaces. Thisis consistent with the results noted in the previous section.
In the paediatrie examination at 70 kV (figure 5a) with a small scattering volume, it is important to use a grid with high primary transmission, Le., thin leadstrips, low grid height, and low atomic number materials in covers and interspaces. There is alarger spread in the performance of the grids from differentmanufacturers due to the lower tube potential used in this examination compared to those in figures 5b-c. The aluminium interspaced grids with high strip
density compare favourably with other aluminium interspaced grids, partieularly at high grid ratios.
In the lumbar spine examination at 100 kV (figure 5b), the Lysholm gridswith 30 and 40 strips/cm are the best aluminium interspaced grids particularlywhen high grid ratios are used. The grids with 60-70 strips/cm compare relatively less favourably at high tube potentials compared to grids with lower stripdensity. At lower tube potentials and at high grid ratios, however, these gridscompare weIl with other aluminium interspaced grids. Grids with high stripdensities do not benefit as much, with respect to dose reduction from beingmade with fibre interspaces as grids with lower strip densities.
In the chest examination at 150kV (figure 5c), the same overlap of the leftmost curves for the fibre made SMIT grids occurs as in figures 5a-b. Grids withhigh strip density compare less favourably with grids with the identieal interspace material and lower strip density.

18
Paediatric 70 kVSa2.6
2.5r.--u 2.4Pi'oE-< 2.3u...:r.-E-< 2.2ZI'<l~ 2.1I'<l:>op;;
2'"~-E-< 1.9<Il...:p;;E-< 1.8Zou
1.7
1.62.5
;s'
3 3.5 4 4.5 5
Sh
DOSE INCREASE FACTOR, DIF
Lumbar Spine 100 kV
4r.--uPi'
""",cc,~ ___/---_.xoE-< 3.5u~E-<ZI'<l~ 3~op;;
'"~- 2.5E-<<Il...:p;;E-<Zo 2'';
2.5 3 3.5 4 4.5 5 5.5 6 6.5
DOSE INCREASE FACTOR, DIF
Figure S cilptions on the next page
19
Se
2.4ro..-u~o 2.2...u..:ro.....Z"'l 2::>l"'l>o~~
::>l 1.8-...<Il..:~...Z 1.6Ou
Chest 150 kV
O'.··············
1.4 '----'---------'---------'----------'----------'2 2.5 3 3.5 4
DOSE INCREASE FACTOR, DIF
Figure 5. Contrast improvement factor CIF as function of dose increase factorDIF for three examinations in frontal-viewj (a) paediatric pelvis examination at70 kV, (b) adult lumbar spine at 100 kV, and (c) adult chest at 150 kV. The gridratio increases in going from the left to the right along the curves. Legends:SMIT Röntgen gridsj *---*: 24 strips/cm, +---+: 28 strips/cm, +-' - +: 36strips/cm, +- -+: 40 strips/cm, *- -*: 44 strips/cm and +...+: 60 strips/cm.
LYSHOLM gridsj o-o: 30 strips/cm, 0- -o: 40 strips/cm and 0·····0: 70 strips/cm.MITAYA,gridsj x-x: 34 strips/cm, x- -x: 40 strips/cm and x··..·x: 60 strips/cm.The statistical error in the CIF and DIF is 2% (two S.D.).
3.3. Optimisation of tube potential and grid ratio in screen-film imagingFigure 6 shows the variation of contrast and mean absorbed dose in the phantom, (adult lumbar spine, frontal view examination), as functions of the tubepotential for grids with ratios 8 and 12 as weil as for an air gap and the no-grid
case. A cubic spline fit to the contrast data is used to interpolate the tube potential which would result in the desired contrast level (figure 6a). This value iscalled the, contrast equivalent tube potential, Ueq. The mean absorbed dose atUeq is obtained from the cubic spline fits of the mean absorbed dose data (figure
6b). This procedure is repeated for each seatter rejection technique (grid ratio).

20
The mean absorbed dose required to achieve the desired contrast level is finallyplotted as a function of the grid ratio. From these plots, the combination of gridratio and tube potential yielding the lowest mean absorbed dose in the phantomcan be found. The procedure is repeated for different contrast levels from 1.1 to3.9% in order to investigate jf there is a dependence in the choice of optimal parameters (grid ratio) on the contrast leve!.
a b
r=12
U 100 150eq
TUBE POTENTIAL (kV)
'\"......,... r=8
+., '0. ...
.......... '''-- A'.... --<>--------e Ir gap........................................... No Grid
0.2
0.18
~ 0.16>..'-'El
0.14~
lA
»i 0.12UJoAA 0.1I'lo:lIl:; 0.08oUJ
~ 0.06Z<I'l
0.04;:;::
0.02
O50U 100 150
eq
TUBE POTENTIAL (kV)
Q
"''''''''0"',<>, r= 12
.....-o.~ r=8-f, --e..
................. '------<> Air gap.........+ + + No Grid
oL....__----"I!'----'- --'
50
0.08
0.07
0.06
0.05
'""'UJ<Il:; 0.04'""'Zo'-'
0.03
0.02
0.01
Figure 6. Contrast (a) and mean absorbed dose in the phantom (b) as function oftube potential for grids with ratios of 8 and 12. Data without grid and for a 20 cmair gap are also given. At 3% contrast level and grid ratio 12, the contrast equivalent tube potential, Ueq, is 85 kV. The corresponding mean absorbed dose in
the phantom is 0.071 mGy. The irradiation geometry represents an adu1t lumbar spine examination in AP view (table 1) with a bone contrasting detai!.
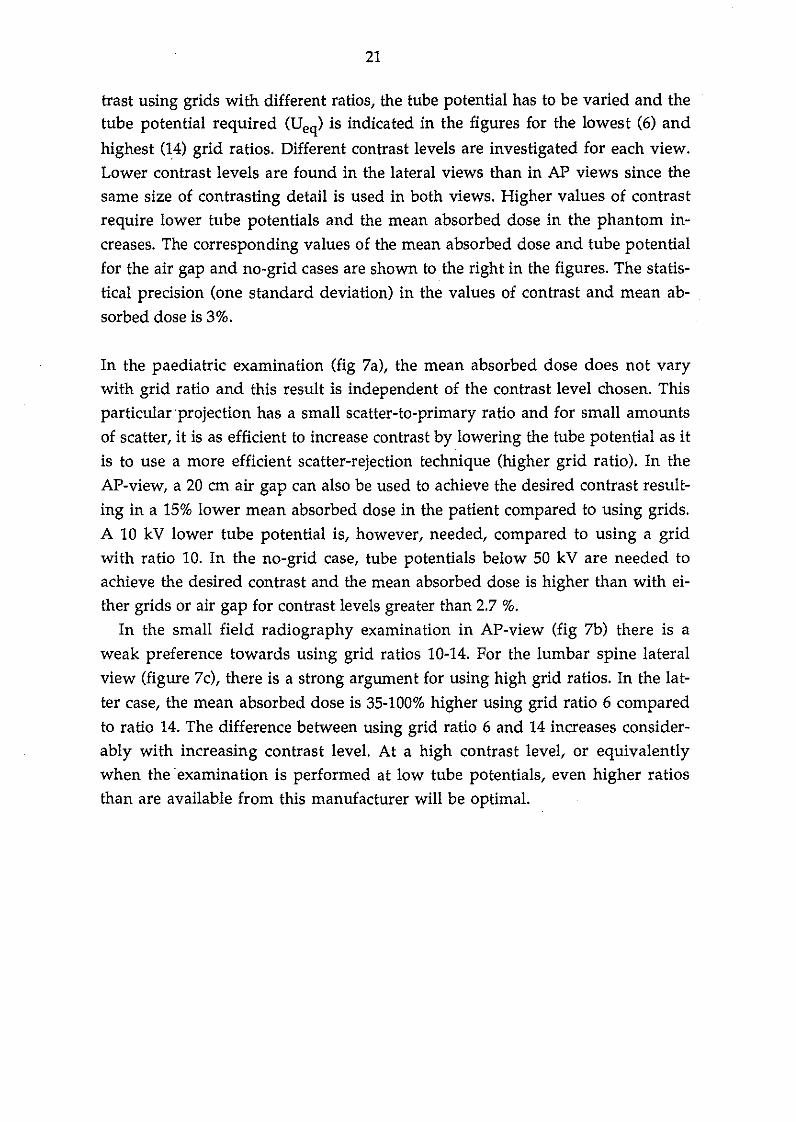
Figure 7 gives the mean absorbed dose in the phantom at fixed levels of contrastas a function of grid ratio in three different situations (paediatric pelvis AP,adult small field radiography AP and adu1t lumbar spine lateral view) using aSMIT Röntgen grid with 36 strips/cm and 36 strip width. To achieve equal con-
21
trast using grids with different ratios, the tube potential has to be varied and thetube potential required (Ueq) is indicated in the figures for the lowest (6) and
highest (14) grid ratios. Different contrast levels are investigated for each view.Lower contrast levels are found in the lateral views than in AP views since thesame size of contrasting detail is used in both views. Higher values of contrastrequire lower tube potentials and the mean absorbed dose in the phantom increases. The corresponding values of the mean absorbed dose and tube potentialfor the air gap and no-grid cases are shown to the right in the figures. The statistical precision (one standard deviation) in the values of contrast and mean absorbed dose is 3%.
In the paediatric examination (fig 7a), the mean absorbed dose does not varywith grid ratio and this resu1t is independent of the contrast level chosen. Thisparticular-projection has a small scatter-to-primary ratio and for small amountsof scatter, it is as efficient to increase contrast by lowering the tube potential as itis to use a more efficient scatter-rejection technique (higher grid ratio). In theAP-view, a 20 cm air gap can also be used to achieve the desired contrast resulting in a 15% lower mean absorbed dose in the patient compared to using grids.A 10 kV lower tube potential is, however, needed, compared to using a gridwith ratio 10. In the no-grid case, tube potentials below 50 kV are needed toachieve the desired contrast and the mean absorbed dose is higher than with either grids or air gap for contrast levels greater than 2.7 %.
In the small field radiography examination in AP-view (fig 7b) there is aweak preference towards using grid ratios 10-14. For the lumbar spine lateralview (figure 7c), there is a strong argument for using high grid ratios. In the latter case, the mean absorbed dose is 35-100% higher using grid ratio 6 comparedto ratio 14. The difference between using grid ratio 6 and 14 increases considerably with increasing contrast level. At a high contrast level, or equivalentlywhen the -examination is performed at low tube potentials, even higher ratiosthan are available from this manufacturer will be optimal.

22
7a PAEDIATRIC PELVIS (AP VIEW)0.05,---------.---__-,-----.,----------,-__---,---__---,
0.045NO GRID AIR GAP
62kV'*" lit • ~I • 70kV 3.9%• 41kV 3.5%
66kV><- * ), x 75kV 3.5%:EÅ 55kV 3.9%
+ 81kV 3.1%• 44kV 3.1%
70kV+ .. 60kV 3.5%
75kV· • , , --<> 90kV 2.7% • 48kV 2.7% .... 65kV 3.1%
.... 72kV 2.7%
~B 0.04
S~ 0.035
fil 0.03.oQ
Q 0.025
~o 0.02<Il
~~ 0.015
"'I::a 0.01
IQ
0.005
15105O'-------'-------'-----"'-------'-------'- ---J
O
GRID RATIO, r
7bSMALL FIELD RADIOGRAPHY (AP VIEW)
0.025 ,-------,.----.,--------,--------,
'& 0.02
S~
68kV",---
~81kV3.9%
IQ
fil 0.015oQ
f;j!Xl
g; 0.01<Il
~
~::a 0.005
73kV "-----li lE lE x 87kV 3.5%
79kV+ I 97kV 3.1%
86kVo • • o ..., 114kV 2.7%
2015105
OL- -'-- ---L- --'-- --'
O
GRID RATIO, r
Figure 7 captions on the next page

23
7eLUMBAR SPINE (LATERAL VIEW)
3
55kV
~2.5
&'El~
lA 2I>'l 59kV<FlOAA 1.5I>'l
72kV 2.9%~l>::o 65kV<Fl
~ 1 79kV 2.5%
~72kV~ 87kV 2.1%I>'l
;:;l0.5 83kV -______ - 100kV 1.7%
-------~-------------- 133kV 1.3%
OO 5 10 15 20
GRID RATIO, r
Figure 7. Mean absorbed dose in the phantom to aehieve the indieated contrastlevels (1.3-2.9%) as a funetion of grid ratio. Paediatrie pelvis examination, AP(a), small field radiography AP (b), and lumbar spine lateral view (c). For eaeh
contrast level, the tube potentials used at the smallest and highest grid ratios areindicated. Results for the no-grid ease are indicated by • and for the 20 cm airgap teehnique by .... SMIT Röntgen grids with 36 strips/cm, 36 11m strip width.The contrasting details are made of bone (table 1).
In examinations whieh generate relatively large amounts of seatter, the use ofhigh grid ratios at high tube potentials yield lower mean absorbed doses thanlow grid ratios at low tube potentials for equal contrast. In eases with less seatter,lower grid ratios can be used provided that the tube potential is varied aeeordingly to aehieve the desired contrast. High grid ratios may be preferable, becauseshorter exposure times can then be used, minimising movement blurring.However, careful alignment in the beam is required to prevent eut-off of primary radiation. In examinations with relatively small amounts of seatter, theair gap technique can be advantageous but, compared to using grids it needs tobe applied in combination with lower tube potentials.
24
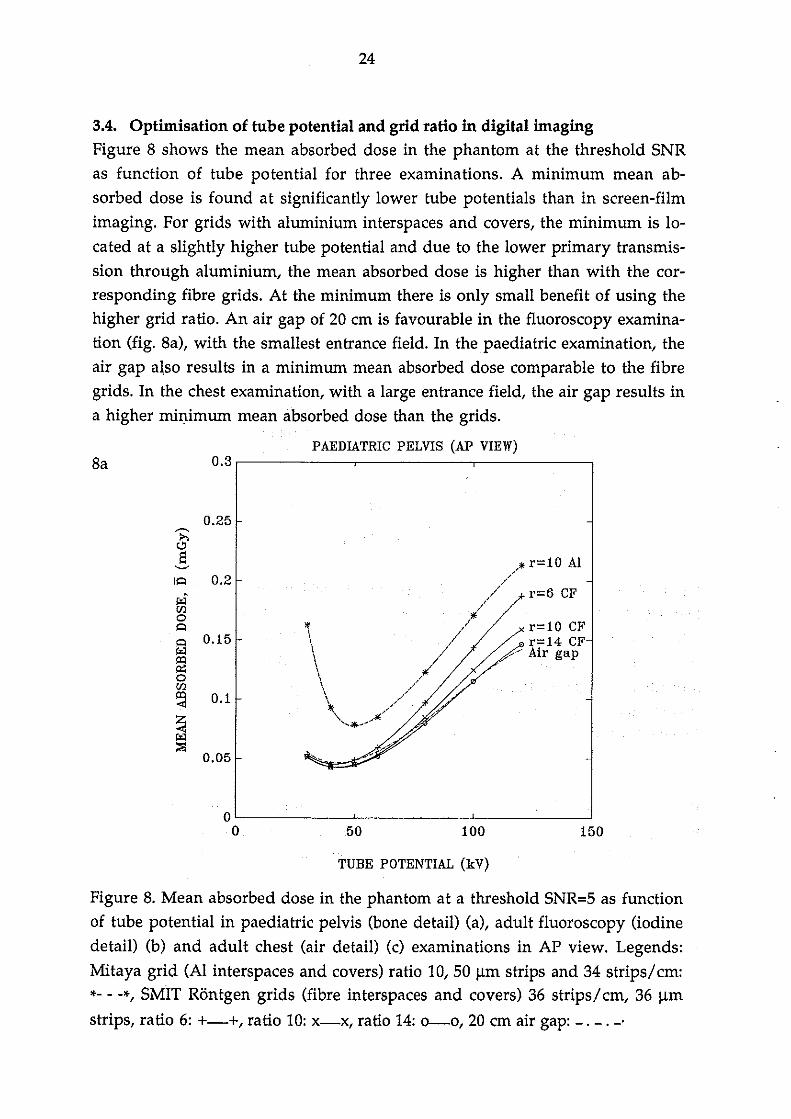
3.4. Optimisation of tube potential and grid ratio in digital imagingFigure 8 shows the mean absorbed dose in the phantom at the threshold SNRas function of tube potential for three examinations. A minimum mean absorbed dose is found at significantly lower tube potentials than in screen-filmimaging. For grids with aluminium interspaces and covers, the minimum is 10cated at a slightly higher tube potential and due to the lower primary transmission through aluminium, the mean absorbed dose is higher than with the corresponding fibre grids. At the minimum there is only small benefit of using thehigher grid ratio. An air gap of 20 cm is favourable in the fluoroscopy examination (fig. 8a), with the smallest entrance field. In the paediatric examination, theair gap al.so results in a minimum mean absorbed dose comparable to the fibregrids. In the chest examination, with a large entrance field, the air gap resu1ts ina higher minimum mean absorbed dose than the grids.
PAEDIATRIC PELVIS (AP VIEW)8a
0.25
IQ 0.2
I"l[floQ
Q 0.15
~o[fl
~ 0.1
~;::;l
0.05
...
.//.* r=10 Al
.' r=6 CF
* /' r=10 CF
\ // / lri:.~'" ;j1/
.......~J.......
15010050
ol--- --'- --'- -----l
O
TUBE POTENTIAL (kV)
Figure 8. Mean absorbed dose in the phantom at a threshold SNR=5 as fundionof tube potential in paediatric pelvis (bone detail) (a), adu1t fluoroscopy (iodinedetail) (b) and adu1t chest (air detail) (c) examinations in AP view. Legends:
Mitaya grid (Al interspaces and covers) ratio 10,50 11m strips and 34 strips/cm:*- - -*, SMIT Röntgen grids (fibre interspaces and covers) 36 strips/cm, 36 11m
strips, ratio 6: +-+, ratio 10: x-x, ratio 14: 0--0, 20 cm air gap: -. -.-'

25
TUBE POTENTIAL (kV)
FLUOROSCOPY (AP VIEW)Bb0.1
0.09
~ 0.08i>.0El
0.07~
I<=l
I"l 0.06'flo<=l
<=l 0.05I"lI!'I~ 0.04o'fl
~ 0.03Z-<I"l
0.02;:;l
0.01
OO
&
50 100 150
CHEST (PA VIEW)
200
-- Air gap
15010050
\*'\\,J]\1\Il1\l'\\\\t\I \l t[, ,\\\ l,\ \.... / r= 6 CF\1" ..... ------~-...-.... ... ..Af r=10 Al
_-,..------ r= 1O CF'"-"_ __--A---- r= 14 CF
2
1.8
~ 1.6&El
1.4~
I<=l
I"l 1.2'flo<=l
<=l 1I"lI!'I~ 0.8o'flI!'I-< 0.6Z-<I"l
0.4;:;l
0.2
OO
TUBE POTENTIAL (kV)
Figure 8 captions on the previous page

26
3.5. Global optimization of grid design for screen-film imagingThe same optimization procedure was used as in section 3.3. The minimumrisk (opti1llum operating point) was thus sought by plotting the mean absorbeddose in the phantom as a function of the two mutually independent grid designparameters; grid ratio, r, and strip width, d, respectively for each tested stripdensity, N. Examples of such results with one parameter varying are shown infigures 9 and lO, for a paediatric pelvis examination and an adult lumbar spine,both in AP view.
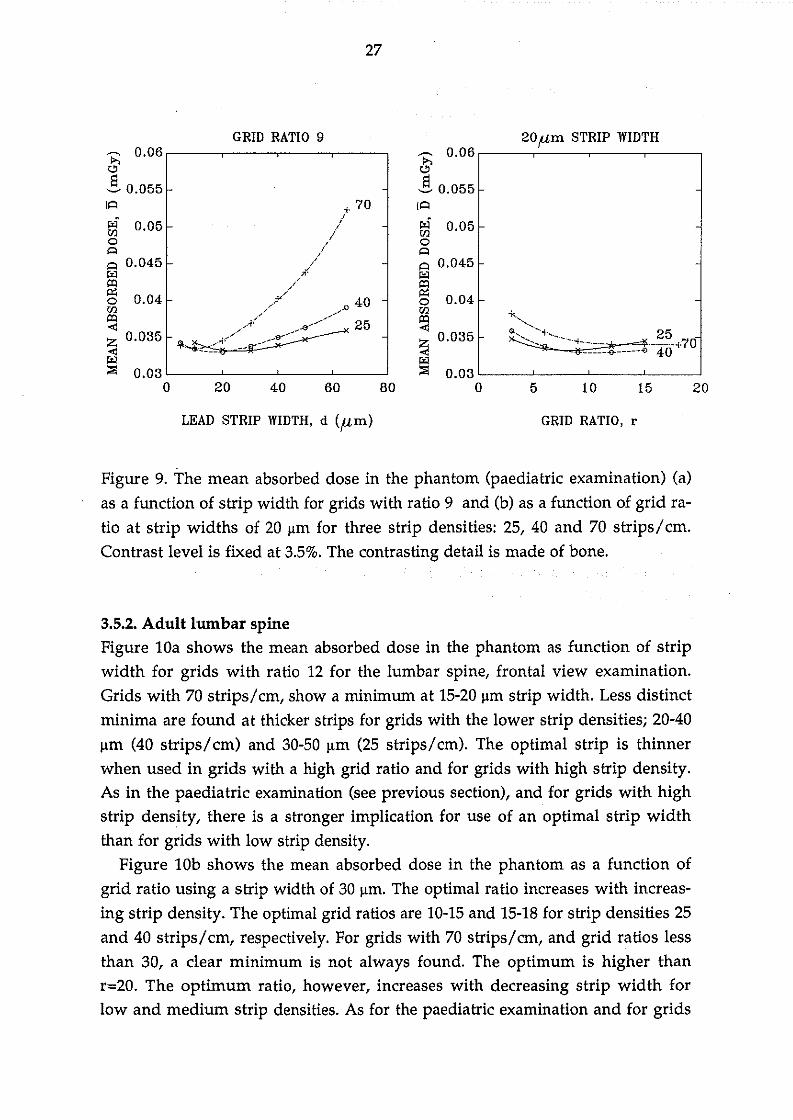
3.5.1. Paediatric pelvisFigure 9a shows the mean absorbed dose in the paediatric phantom as a function of strip width for grids with ratio 9 at three different strip densities (25, 40and 70 strips/cm). Minima are found at strip widths of 20-30 ;lm and 15-20 ;lm,for grids with 25 and 40 strips/cm, respectively. The variation of the mean absorbed dose with strip width is small and the minima are shallow. With thehigher strip density (70 strips/cm), the minima are more accentuated and foundat an even thinner strip width (lO ;!ffi). The optimal strip width decreases withincreasing strip density. The much higher doses found using thick strips (d>50;lm) at high strip density (70 strips/cm) is due to low primary grid transmission(58-52% at 70 kV, d=65 ;lm, ratios 3-12). The primary transmission with 25strips/cm, 30 ;lm strip width and ratio 3-12 is considerably higher, 87-79%.
Figure 9b shows the mean absorbed dose in the same phantom as function ofgrid ratio at strip widths 20 ;lm and for the same three strip densities. The optimal grid ratio increases with increasing strip density. With 25 strips/cm, the optimal grid ratio is 6-9 whereas for 40 strips/cm, it is 9-12. At 70 strips/cm, the optimal grid ratio is larger than 12 and a dear minimum is not found using onlygrids with ratios up to 18. The variation of mean absorbed dose with grid ratio issmall for ratios above 12. For the thinnest strip width tested (5 ;lm), ratios above18 were evaluated and a minimum was found at ratio 20. With thin strips andoptimal ratios, high strip density grids yield the lowest mean absorbed dose,whereas the opposite is true with thicker strips.
27
2015105
20 flm STRIP WIDTHp;:; O. O6 ,---------,-'-----,------,------,
"El~ 0.055lA
f;J 0.05O<=lA 0.045
~O 0.041-
~~ 0.0351-
l:iI::o 0.03 L-_--"__--'-__----'-__-'
O80604020
GRID RATIO 9p;:; 0.06,-----,-----,---,----,
"! 0.055lA
f;J 0.05oAA 0.045l:iI
~O 0.04
'"r;;j~ 0.035
l:iI::o 0.03 L-__'-----_-----'__----'-__---'
O
LEAD STRIP WIDTH, d (p,m) GRID RATIO, r
Figure 9. The mean absorbed dose in the phantom (paediatric examination) (a)as a function of strip width for grids with ratio 9 and (b) as a function of grid ra
tio at strip widths of 20 ~m for three strip densities: 25,40 and 70 strips/cm.Contrast level is fixed at 3.5%. The contrasting detail is made of bone.
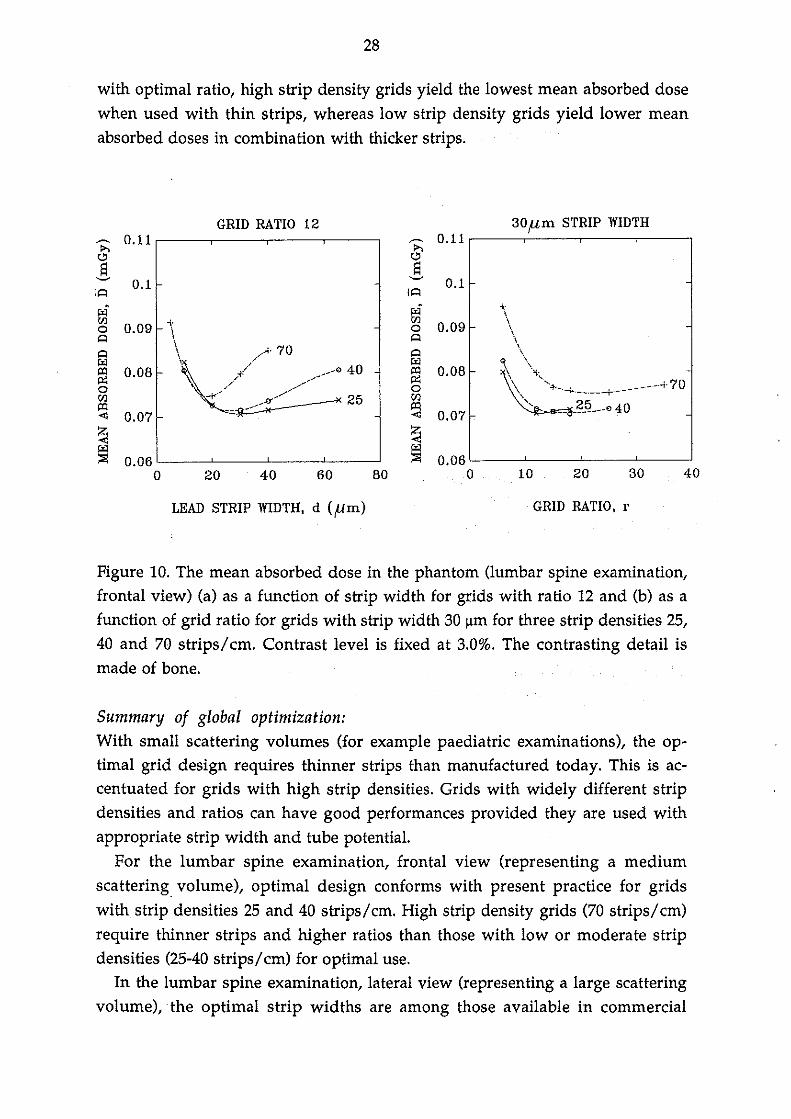
3.5.2. Adult lurnbar spineFigure 10a shows the mean absorbed dose in the phantom as function of stripwidth for grids with ratio 12 for the lumbar spine, frontal view examination.Grids with 70 strips/cm, showa minimum at 15-20 ~m strip width. Less distinctminima are found at thicker strips for grids with the lower strip densitiesj 20-40~m (40 strips/cm) and 30-50 ~m (25 strips/cm). The optimal strip is thinnerwhen used in grids with a high grid ratio and for grids with high strip density.As in the paediatric examination (see previous section), and for grids with highstrip density, there is astronger implication for use of an optimal strip widththan for grids with low strip density.
Figure lOb shows the mean absorbed dose in the phantom as a function ofgrid ratio using a strip width of 30 ~m. The optimal ratio increases with increasing strip density. The optimal grid ratios are 10-15 and 15-18 for strip densities 25and 40 strips/cm, respectively. For grids with 70 strips/cm, and grid ratios lessthan 30, a c1ear minimum is not always found. The optimum is higher thanr=20. The optimum ratio, however, increases with decreasing strip width forlow and medium strip densities. As for the paediatric examination and for grids
28
with optimal ratio, high strip density grids yield the lowest mean absorbed dosewhen used with thin strips, whereas low strip density grids yield lower meanabsorbed doses in combination with thicker strips.
GRID RATIO, r
30flm STRIP WIDTHGRID RATIO 12~ 0.11 ~ 0.11~ 0-<»S S~
0.1~
0.1lA lA
r4 r4<Il -\- <Il
0.09o 0.09 \ oA \
A
A \ //A· 70 A
J:<l / J:<llXI 0.08 / ___-o 40 lXI 0.08,:t:~ ,/ .-"........ ~o - " o<Il ,,-t< ~__...n--". 25 <IllXI lXI< 0.07 < 0.07 c
Z Z< <J:<l J:<l;:;: 0.06 ;:;: 0.06
o 20 40 60 80 o
LEAD STRIP WIDTH, d (/lm)
10 20 30 40
Figure 10. The mean absorbed dose in the phantom (lumbar spine examination,frontal view) (a) as a function of strip width for grids with ratio 12 and (b) as afunction of grid ratio for grids with strip width 30 ~m for three strip densities 25,40 and 70 strips/cm. Contrast level is fixed at 3.0%. The contrasting detail ismade of bone.
Summary of global optimization:With small scattering volumes (for example paediatric examinations), the optimal grid design requires thinner strips than manufactured today. This is accentuated for grids with high strip densities. Grids with widely different stripdensities and ratios can have good performances provided they are used withappropriate strip width and tube potential.
For the lumbar spine examination, frontal view (representing a mediumscattering volume), optimal design conforms with present practice for gridswith strip densities 25 and 40 strips/cm. High strip density grids (70 strips/cm)require thinner strips and higher ratios than those with low or moderate stripdensities (25-40 strips/cm) for optimal use.
In the lumbar spine examination, lateral view (representing a large scatteringvolume),the optimal strip widths are among those available in commercial
29
grids but higher ratios (r>18) are needed. The strip width can be widely varied,particularly for grids with low strip densities, provided optimal ratios (>18) areused.
The optimal high ratio grids yield both lower mean absorbed dose in thephantom and shorter exposure time than if the tube potential is reduced tomaintain contrast with a lower ratio grid. The required tube charge, to maintaina given energy imparted to the receptor (see section 4.3), decreases with increasing strip width and increasing grid ratio due to the increase in contrast equivalent tube potential. Prolonged exposure times, a possible consequence of a hightube charge, may impair resolution and therefore the designs with thick stripsand/or high grid ratio are of additional advantage.
On' the. other hand, high ratio grids need careful alignment in the beam toprevent cut-off of primary radiation, which would otherwise increase patientmean absorbed dose. In practice, problem with alignment of grid in the beammay preclude use of very high grid ratios. The recommended use of aratio 12grid with 40 strips/cm (Moores et al 1989) yield 25% higher mean absorbed dosein the patient than the optimal high ratio grids.
Many of the absorbed dose minima are shallow, particularly for grids withlow and medium strip densities. It is thus possible to find designs with a moderate grid ratio to prevent alignment problems, and yet keep the mean absorbeddose in the patient at a reasonable level (10%) above the absolute minimum(table 4 and 5).
When the aim is to achieve a given contrast level, the use of an appropriategrid can be explored to decrease the mean absorbed dose in the patient asdemonstrated for the examinations investigated here. To achieve the desiredcontrast level without grid would require use of a very low tube potential and aconcomitantly high mean absorbed dose in the patient. It is time to stress thedose saving effect of grids in screen-film radiography instead of talking aboutthe dose increase factor which presupposes the use of the same tube potentialwith and without grid at the expense of widely different image quality. Gridsshould not be used in situations without a dose saving effect as, for example, inimaging very thin objects (hands) or in using well collimated beams (slit radiography).
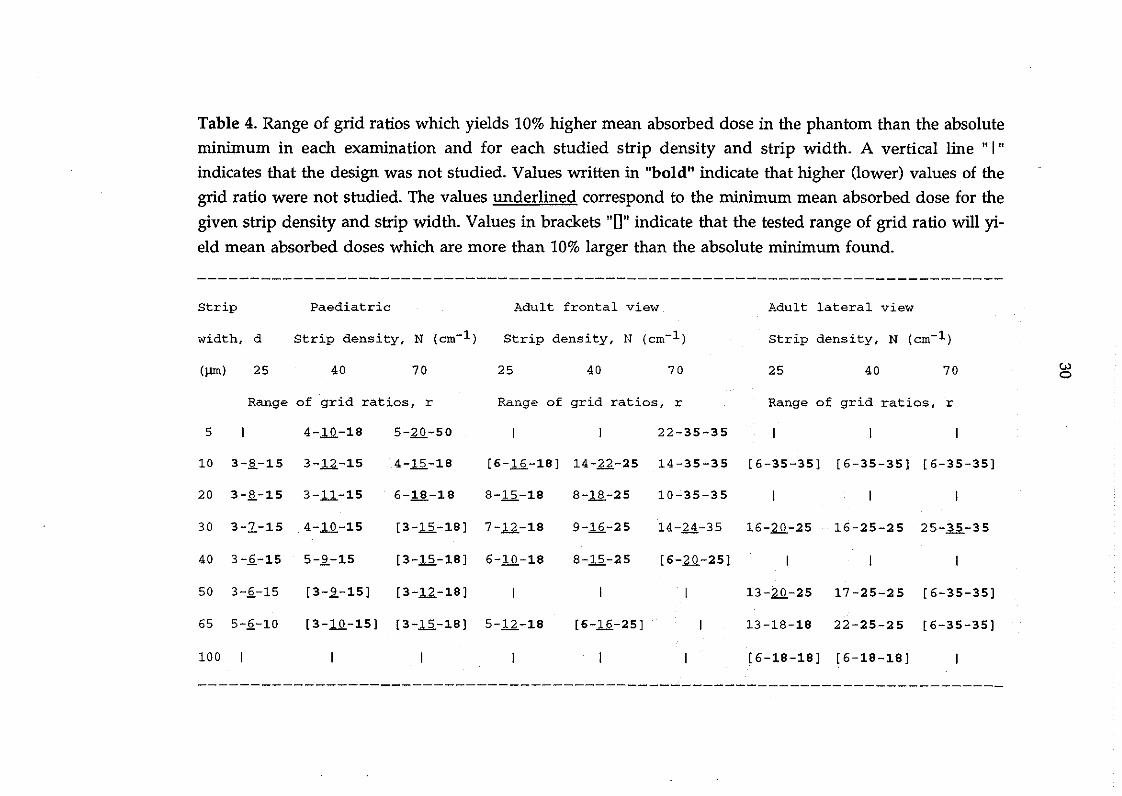
Table 4. Range of grid ratios which yields 10% higher mean absorbed dose in the phantom than the absoluteminimum in each examination and for each studied strip density and strip width. A vertical line "I"indicates that the design was not studied. Values written in "bold" indicate that higher (lower) values of the
grid ratio were not studied. The values underlined correspond to the minimum mean absorbed dose for the
given strip density and strip width. Values in brackets "[J" indicate that the tested range of grid ratio will yield mean absorbed doses which are more than 10% larger than the absolute minimum found.
Strip
width, d
Paediatric
Strip density, N (cm-l)
Adult frontal view
Strip density, N (cm-l)
Adult lateral view
Strip density, N (cm-l)
(lUll) 25 40 70 25 40 70 25 40 70 wo
Range of grid rat ios, r Range of grid ratios, r Range of grid rat ios, r
5 4-1.Q.-18 5-aQ.-50 22-35-35
10 3-~-15 3-12-15 4-li-18 [6-1.2.-18] 14-12.-25 14-35-35 [6-35-35] [6-35-35] [6-35-35]
20 3-~-15 3-.11-15 6-18-18 8-li-18 8-ll-25 10-35-35
30 3-2-15 4-1.Q.-15
40 3-~-15 5-~-15
[3-12-18] 7-12-18
[3-12-18] 6-1.Q.-18
9-1.2.-25
8-12-25
14-2..4.-35 16-aQ.-25 16-25-25 25-35-35
[6-aQ.-25]
50 3-2-15 [3-~-15] [3-12-18] 13-aQ.-25 17-25-25 [6-35-35]
65 5-2-10
100
[3-1.Q.-15] [3-12-18] 5-12-18 [6-1.2.-25] 13-18-18 22-25-25 [6-35-35]
[6-18-18] [6-18-18]
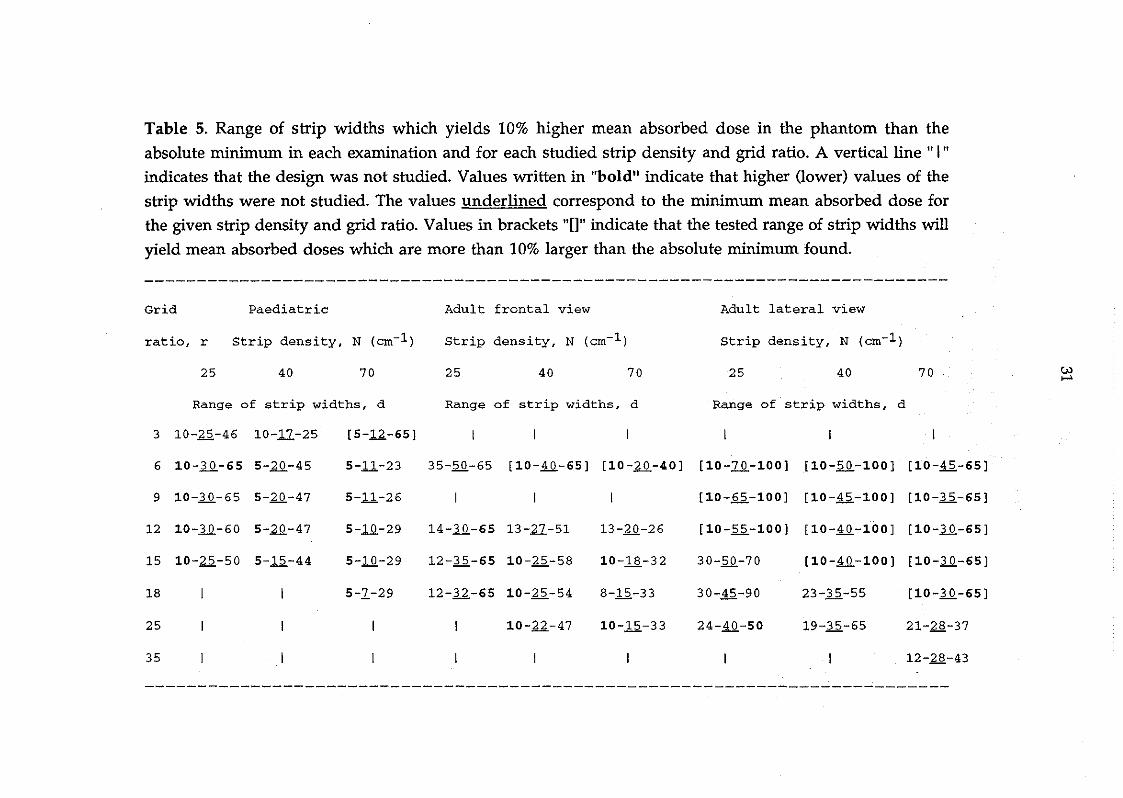
Table 5. Range of strip widths which yields 10% higher mean absorbed dose in the phantom than the
absolute minimum in each examination and for each studied strip density and grid ratio. A vertical line" I"
indicates that the design was not studied. Values written in "bold" indicate that higher (1ower) values of the
strip widths were not studied. The values underlined correspond to the minimum mean absorbed dose for
the given strip density and grid ratio. Values in brackets "[J" indicate that the tested range of strip widths will
yield mean absorbed doses which are more than 10% larger than the absolute minimum found.
Grid Paediatric
ratio, r Strip density, N (cro-1 )
Adult frontal view
Strip density, N (cro-1 )
Adult lateral view
Strip density, N (cro-1 )
25 40 70 25 40 70 25 40 70 UJ.....Range of strip widths, d Range of strip widths, d Range of strip widths, d
3 10-25-46 10-11-25
6 10-lQ.-65 5-1.Q.-45
9 10-lQ.-65 5-1.Q.-47
[5-12.-65)
5-11-23
5-11-26
35-50-65 [10-~-65) [lO-1.Q.-40) [lO-2Q.-100) [10-2Q.-100) [lO-li-65)
[10-65-100) [lO-li-100) [10-1.2.-65]
12 10-lQ.-60 5-1.Q.-47 5-.!Q-29 14-lQ.-65 13-27-51 13-20-26 [10-.2.2.-100) [10-~-100) [10-lQ.-65)
15 10-22-50 5-1.2.-44 5-.!Q-29 12-1.2.-65 10-25-58 10-il.-32 30-.2.Q,-7 O [10-~-100) [10-lQ.-65)
18
25
35
5-1-29 12-12.-65 10-22-54
10-22-47
8-1.2.-33
10-1.2.-33
30-li-90
24-~-50
23-1.2.-55
19-1.2.-65
[10-lQ.-65)
21-2.§.-37
12-28-43

32
3.6. Dependence of interspace materialA comparison was made with grids having aluminium, instead of fibre material in covers and interspaces, to identify any differences in optimum grid design. The carbon fibre covers and cotton fibre interspaces were replaced withaluminium, all other parameters being identica1. Figure 11 shows the mean absorbed dose in the phantom (lumbar spine, AP view) as function of grid ratio(l1a) for grids with 40 strips/cm, 40 ~m and as function of strip density (l1b) forgrids with r=12, d=30 ~m. The optimal grid ratio is smaller (r=12 instead of r=18)using aluminium grids. This is explained by the decreased primary transmission (Tp) in grids with aluminium instead of fibre materials, particularly
marked in grids with high ratios. A significant increase in the mean absorbeddose in the phantom, is noted for the same reason (see Sandborg et al 1992b).The minimum mean absorbed dose is further located at a higher strip densityfor grids with aluminium interspaces compared to fibre.
10 20 30
~, H" ··CF
... AlQ~__~-_-Q ~---G---------
100500'----------'--------'
O
0.1
0.2
0.05
i>'IUJo 0.15~
~i>'I
~oUJ
~
~r;
~ 0.25,-------,--------,&'S~
I~
~ 0.15,-------,------,-------,&'S~
I~
i>'I 0.1UJo~
~i>'I
~o 0.05UJ
~
~::;: 0'-----'----'-------'
O
GRIn RATIO, r STRIP DENSITY, N (strips/cm)
Figure 11. Mean absorbed dose in the phantom (lumbar spine, frontal view,bone detail) (a) as function of grid ratio for grids with 40 strips/cm, 40 ~m stripsand (b) as function of strip density for grids with ratio 12, 30 ~m strips for gridswith fibre materials or aluminium in interspaces and covers (equal coverthicknesses) Legends: X--X: fibre material and 0- - -o: aluminium.
3.7. Limitations in using high grid ratios
Grids require careful a1ignment in the beam to keep the cut-off of primary radiation, due to lateral de-centring and errors in the focus-grid distance of focused

33
grids, to a minimum. Lateral de-centring occurs when the X-ray tube focus ispositioned laterally to the convergent line of the grid but at the correct focal distance. It produces a uniform loss of primary radiation and a corresponding increase in mean absorbed dose to maintain film blackening (Curry et al 1984).The loss is proportional to the grid ratio and lateral decentering distance andinversely proportional to the focus-grid distance, FGD (Curry et al 1984). Thedemands for proper grid positioning are thus higher for high grid ratios andsmall FGD. Moving grids (grids with strip density less than approximately 60strips/cm) are always operated at some degree of lateral decentering. The loss ofprimary radiation can amount to 20% for a 1.5 cm lateral de-centring distancewith 104 cm FGD and grid ratio 14.
A tilted grid (off-leve!) produces the same uniform loss of primary radiationas a grid which is laterally decentered (Curry et al 1984).
An error in the focus-grid distance (use of non-optimal focusing distance)produces a progressively greater loss of primary radiation further away from thegrid central line. IEC (1978) defines upper and lower application limits as thedistances at which the value of the transmission of primary radiation at theborder most distant from the central line is 60% of that at the focusing distance.The range of the applicable focusing distances decreases with increasing grid ratio and focusing distance (Hondius Boldingh 1961). It will decrease even furtherif the grid is also laterally decentered (moving grid). The loss of primary radiation for a grid with ratio 14 and optimal focusing distance 104 cm, can amountto 20% if the focus-grid distance deviates 10 cm from its optimal value but is below 10% for a grid with ratio 6.
The use of high grid ratios should therefore be limited to examinationswhere precise alignment of the grid and X-ray beam can be made (in accordancewith Nielsen 1985). A large fraction of the dose reduction achieved in usinghigh grid ratios compared to low ratio grids may be lost if proper grid alignmentis not ensured.
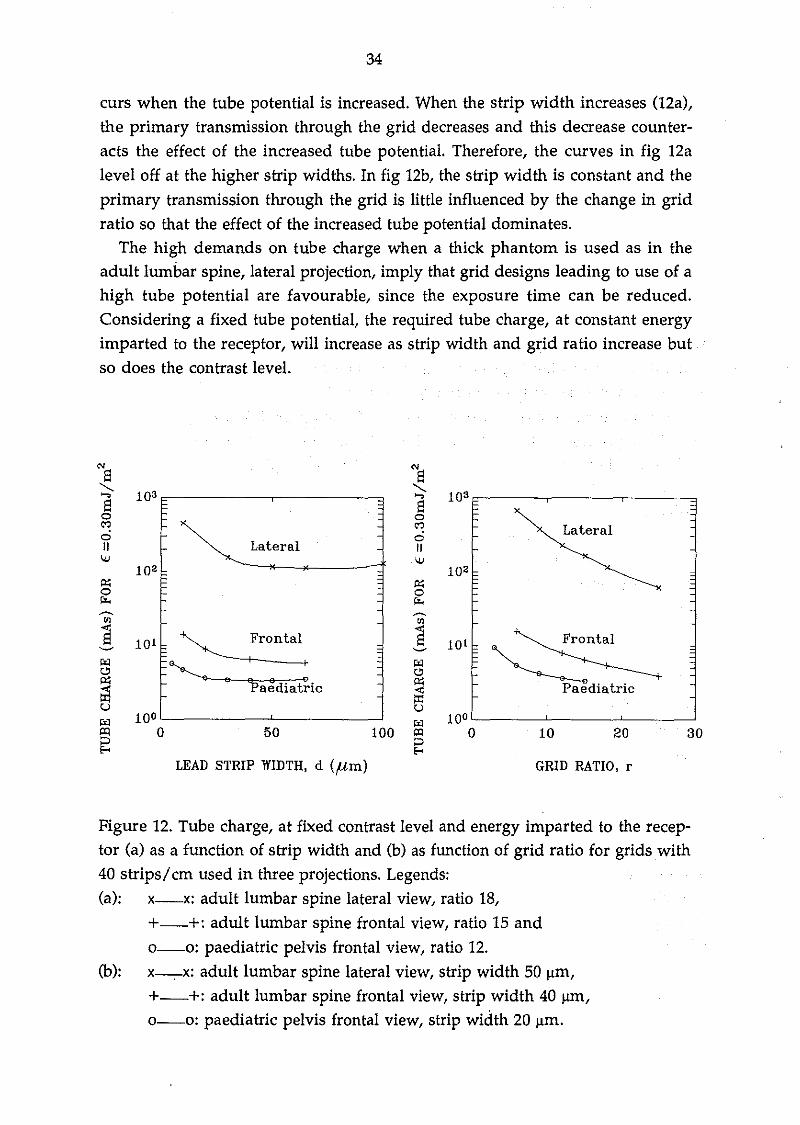
3.8. Tube charge considerationsIn the practical situation it is necessary to consider the tube charge as this mayimpose limits to using a particular grid in a given examination. The effect ontube charge is shown in fig. 12 for some grids used in the three examinationsinvestigated. The tube charge decreases with increasing strip width (l2a) andwith increasing ratio (12b), the decrease with strip width being slower. Since thetube potential used to achieve the specified contrast level increases with increasing strip width and grid ratio, the shape of the curves can be explained bythe increase in both X-ray output and primary phantom transmission which oc-
34
curs when the tube potential is increased. When the strip width increases (l2a),the primary transmission through the grid decreases and this decrease counteracts the effect of the increased tube potential. Therefore, the curves in fig 12aleveioff at the higher strip widths. In fig 12b, the strip width is constant and theprimary transmission through the grid is little influenced by the change in gridratio so that the effect of the increased tube potential dominates.
The high demands on tube charge when a thick phantom is used as in theadult lumbar spine, lateral projection, imply that grid designs leading to use of ahigh tube potential are favourable, since the exposure time can be reduced.Considering a fixed tube potential, the required tube charge, at constant energyimparted to the receptor, will increase as strip width and grid ratio increase butso does the contrast leve!.
N SEl"-.
103 "-.,..., ,...,El = Elo o., .,
Lateralo oII Lateral II
OJ OJ102
~ ~O O~ i%<~ ~
CIl CIl
Ej101
~S 101 Frontal
~ ~
~diatric1>'1 1>'10 ~ B ~ B :
<:O
~ ~ aediatric ~u U1>'1 10° 1>'1 10°"'l O 50 100 "'l O 10 20 30~ ::>...
LEAD STRIP WlDTH, d (firn) GRlD RATIO. r
Figure 12. Tube charge, at fixed contrast level and energy imparted to the receptor (a) as a function of strip width and (b) as function of grid ratio for grids with40 strips/cm used in three projections. Legends:(a): x-x: adult lumbar spine lateral view, ratio 18,
+--+: adult lumbar spine frontal view, ratio 15 ando-o: paediatric pelvis frontal view, ratio 12.
(b): x-ox: adult lumbar spine lateral view, strip width 50 11m,+--+: adu1t lumbar spine frontal view, strip width 40 11m,o-o: paediatric pelvis frontal view, strip wictth 20 11m.

35
3.9. Risk related quantity and modellimitationsIn the present work, the mean absorbed dose in the phantom is used as a measure of radiation risk whereas the ICRP 60 (1991) recommends the use of the
quantity effective dose. The latter quantity is the weighted sum of the equivalent doses in all the organs of the body and is the dosimetric quantity used forestimating radiation detriment. Our dosimetric quantity, the mean absorbeddose, is less laborious to derive and less dependent on field position and size.To test the inf1uence of using effective dose instead of the mea,n absorbed dosein the phantom on the results of this investigation, data from Jones and Wall1985 were, used to derive the relationship between effective dose and mean absorbed dose in the adult lumbar spine examination. The variation of the effective dose with grid ratio was found to be similar to that for the mean absorbeddose. We thus conclude that the optimization of grid ratio and tube potential isinsensitive to the dosimetric risk quantity used.
There are some limitations to the model used here. The simple uniform tissuephantoms are, by their nature, incapable of providing a proper evaluation ofthe variations of contrast (image quality) over the image plane in a realistic, patient situation with body inhomogeneties. Further, the limited spatial resolution and latitude of the image receptor are not considered. This is likely to inf1uence, for example, the choice of tube potential in chest radiography whenstructures in high and low optical density regions have to be visualised on thesame film. In this case, high contrast might not be desirable. High tube potentials will probably be preferred for this reason as well as the shorter exposuretimes achievable.
4. SUMMARY AND CONCLUSIONS
The Monte Carlo computer program developed jointly by the Departments ofRadiation Physics, Linköping University and the Medical Physics Department,Royal Marsden Hospital has proved to be a very powerful tool for the study andoptimization of the performance of anti-scatter grids. Using a novel optimization procedure, it has been possible to compare commercially available gridsand to optimise grid design for a wide range of imaging situations.Recommendations have been made for the choice of grid in each situation. Insome cases these correspond well with present "good practice" whereas in others, some modifications in the design or choice of grids are suggested. In certainsituations, the use of an air gap for scatter rejection should be considered.

36
ACKNO~EDGEMENTS
This work was supported by grants from the Swedish National Institute ofRadiation Protection (NIRP) and from the Commission of the EuropeanCommunities Radiation Protection Program.
REFERENCESALM CARLSSON G., CARLSSON c.A. and PERSLIDEN J., 1984. Energy imparted to the patient in diagnostic radiology: calculation of conversion factorsfor determining the energy imparted from measurements of the air collisionkerma integrated over beam area. Phys. Med. Biol.,29, 1329-1341.
ALM CARLSSON G., CARLSSON c.A., NIELSEN B. and PERSLIDEN J., 1986.Generalised use of contrast degradation and contrast improvement factors indiagnostic radiology. Application to vanishing contrast. Phys. Med. Bio/.,31,
737-749.
AVISON M., 1989. New materials for dose savings in diagnostic radiology: apractical assessment. In Proceedings of the workshop on "Optimization ofImage Quality and Patient Exposure in Diagnostic Radiology", ed. by Moores,Wall, Eriskat and Schibilla, BIR Report 20, 166-167.
BERGER M.J. and HUBBELL J.H., 1987. XCOM: Photon Cross Section on APersonal Computer, NBSIR 87-3597. U.S. Department of Commerce, NationalBureau of Standards, Office of Standard Reference Data, Gaithersburg MD 20899,United States of America.
BIRCH R., MARSHALL M. and ARDRAN G.M., 1979. Catalogue of SpectralData for Diagnostic X-rays. The Hospital Physicists' Association, ScientificReport Series 30, 47 Belgrave Square, London SW1X 8QX,
BIRCH R., 1988. Personal communication.
BONENKAMP J.G. and HONDIUS BOLDINGH W., 1959. Quality and choice ofpotter bucky grids. Acta Radio/., 51, 479-489, 52, 149-156, and 52,241-252.
CHAN H.-P. and DO! K., 1982. Investigation of the performance of antiscattergrids: Monte Carlo simulation studies. Phys. Med. Bio/.,27, 785-803.

37
CHAN H.-P., HIGASHIDA Y. and DOI K., 1985. Performance of anti-scatter gridsin diagnQstic radiology: Experimental measurements and Monte Carlo simula
tion studies. Med.Phys., 12,449-454.
CURRY T.5., DOWDEY J.E. and MURRY Re. 1984. Christensen's lntroduction
to the Physics of Diagnostic Radiology, 3rd edition. (Lea&Febiger, Philadelphia).
DANCE D.R, 1980. The Monte Carlo calculation of integral radiation dose inxeromammography. Phys. Med. Biol., 25, 25-37.
DANCE D.R and DAY G.J., 1984. The computation of seatter inmammography
by Monte Carlo methods. Phys. Med. Biol., 29, 237-247.
DAY G.J. and DANCE D.R, 1983. X-ray transmission formula for antiscatter
grids. Phys.Med. Biol., 28, 1429-1433
DANCE D.R, PERSLIDEN J. and ALM CARLSSON G., 1992. Calculation of doseand contrast for two mammographic grids. Phys. Med. Biol., 37, 235-248.
DOI K., FRANK P.H., CHAN H-P., VYBORNY e.J., MAKINO S., lIDA N. and
CARLIN M., 1983. Physical and Clinical evaluation of new high-strip density
radiographic grids. Radiology, 147, 575-582.
HONDIUS BOLDINGH W., 1961. Quality and choice of potter Bucky Grids partsIV and V. Acta Radiol., 55, 225-235.
HUBBELL J.H., 1990. Personal communication.
HUBBELL J.H., VEIGELE Wm.J., BRIGGS E.A., BROWN RT., CROMER D.T.
and HOWERTON RJ., 1975. Atomic Form Factors, lncoherent Scattering
Functions and Photon Scattering Cross Sections. J. Phys. Chem. Ref. Data" 4,471-538.
HUBBELL J.H. and 0VERB0 L, 1979. Relativistic Atomic From Factors and
Photon Coherent Scattering Cross Section. J. Phys. Chem. Ref. Data, 8, 69-105.
HUFTON A.P. and RUSSELL J.G.B., 1986. The use of carbon fibre material in
table tops, cassette fronts and grid covers: magnitude of possible dose reduction.
Br. J. Radiol., 59, 157-163.

38
HUFTON A.P., CROSTHWAITE C.M., DAVIES J.M. and ROBINSON L.A., 1987.Low attenuation material for table tops, cassette and grids: a review.
Radiography, 53, 17-18
ICRP, International Commission on Radiological Protection, 1985. Statementfrom the 1985 Paris meeting of the International Commission on RadiologicalProteetion. Ann. ICRP 15, Publication 45, 3, (Pergamon Press, Oxford)
ICRP, International Commission of Radiation Protection 1991. Annals of theICRP, publication 60. 1990 Recommendations of the International Commissionon Radiological Protection (Pergamon Press, Oxford).
IEC, International Electrotechnical Commission, IEC Standard, 1978.Characteristics of anti-scatter grids used in X-ray equipment. Publication 627,first edition. (Bureau Central de la Commission Electrotechnique Internationalel, Rue de Varembe, Geneva, Suisse.
JONES D.G. and WALL B.F., 1985. Organ Doses from Medical X-rayExaminations Calculated Using Monte Carlo Techniques. NRPB-R186, NationalRadiological Protection Board, Chilton, Didcot, Oxon OXll ORQ, U.K.
KALENDER W.A., 1979. Determination of the intensity of seattered radiationand the performance of grids in diagnostic radiology by Monte Carlo methods.Thesis, University of Wisconsin, Madison WI.
KALENDER W.A., 1981 Monte Carlo calculations of x-ray scatter data for diagnostic radiology. Phys. Med. Bio/., 26, 835-849.
KALENDER W.A., 1982. Calculation of X-ray grid characteristics by Monte Carlomethods. Phys. Med. Bio/., 27, 353-361
LEDERER C.M. and SHIRLEY V.S., (editors), 1978. Table of Isotopes. Seventhedition. (Wiley & Sons, New York).
MOORES B.M., WALL B.F., ERISKAT H. and SCHIBILLA H., 1989.Optimization of Image Quality and Patient Exposure in Diagnostic Radiology.Proceedings of a Workshop organised jointly by the CEC and the NRPB., BIRReport 20, 271-278.
39
MORIN L.RM., 1982. Molecular Form Factors and Photon Coherent ScatteringCross Sections of Water. J. Phys. Chern. Ref. Data, 11, 1091-1098.
NIELSEN B., 1980. A method for testing scattered radiation grids. Med. Phys.,7,165-167.
NIELSEN B., 1985. Scattered radiation in diagnostic radiology. Measurements,reduction, and influence on image quality. Thesis, University of Linköping,Sweden.
PERSLIDEN J., 1983. A Monte Carlo program for photon transport using analogue sampling of scattering angle in coherent and incoherent scattering processes. Camp. Prag. Biamed., 17, 115-128.
PERSLIDEN J. and ALM CARLSSON G., 1986. Calculation of the small-angledistribution of scattered photons in diagnostic radiology using a Monte Carlocollision density estimator. Med. Phys., 13, 19-24.
PERSLIDEN J. and SANDBORG M., 1993. Conversion factors between the energy imparted to the patient and air collision kerma integrated over beam areain paediatric radiology. Acta Radia/. (in press)
SANDBORG M., 1990. Comparison between Lucite and water as a phantom material in medical radiology. Prag. Nue/. Energy, 24, 355-364.
SANDBORG M. and ALM CARLSSON G., 1992. Influence of X-ray energy spectrum, contrasting detail and detector on the signal-to-noise ratio (SNR) and detective quantum efficiency (DQE) in projection radiography. Phys. Med. Bia/.,37,1245-1263.
SANDBORG M., DANCE D.R, PERSLIDEN J. and ALM CARLSSON G., 1992a.A Monte Carlo Program for the Simulation of Image Quality and AbsorbedDose in Diagnostic Radiology. Submitted to Camp. Meth. Prag. Biamed.
SANDBORG M., DANCE D.R, ALM CARLSSON G. and PERSLIDEN J., 1992b.Selection of anti-scatter grids for different imaging tasks: the advantage of lowatomic mimber cover and interspace materials. Accepted for publication in Br. J.Radial.

40
SANDBORG M., DANCE D.R, ALM CARLSSON G. and PERSLIDEN J., 1992c.Monte Carlo study of grid performance in diagnostic radiology: factors which affect the selection of tube potential and grid ratio. Accepted for publication in Br.J. Radiol.
SANDBORG M., DANCE D.R, ALM CARLSSON G. and PERSLIDEN J., 1992d.Monte Carlo study of grid performance in diagnostic radiology: task dependentoptimization for screen-film imaging. Submitted to Br. J. Radiol.
SANDBORG M., DANCE D.R, ALM CARLSSON G. and PERSLIDEN J., 1992e.Monte Carlo study of grid performance in diagnostic radiology: task dependentoptimization for digital radiology. To be submitted to Med. Phys.
SHRIMTON P.c., WALL B.F., JONES D.G. and FISHER E.S. 1984. The measurement of energy imparted to patients during diagnostic x-ray examinationsusing the diamentor exposure-area product meter. Phys. Med. Biol., 29, 11991208.
STORM E. and ISRAEL HJ., 1970. Photon cross Sections from 1 keV to 100 MeVfor Eleme~ts Z=l to Z=100. Nuclear Data Tables, A7, 565-681. (Academic Press,New York).
STRID K-G., 1976. Analysis of secondary screening with special reference togrids for abdominal radiography. Acta Radiol. , supp!. 351.
WALRAVEN J.P., 1991. Smit Röntgen Postbox 218, 5600 MD Eindhoven, TheNetherlands. Personal communication.