Embed Size (px)
Citation preview
THE CLIMATE AND WEATHER OF
CANTERBURY2nd edition G. R. Macara
Note to Second EditionThis publication replaces the first edition of New Zealand Meteorological Service Miscellaneous Publication 115 (17), written in 1987 by A. P. Ryan. It was considered necessary to update the first edition, incorporating more recent data and updated methods of climatological variable calculation.
NIWA SCIENCE AND TECHNOLOGY SERIES NUMBER 68
ISSN 1173-0382
© 2016. All rights reserved. The copyright for this report, and for the data, maps, figures and other information (hereafter collectively referred to as “data”) contained in it, is held by NIWA. This copyright extends to all forms of copying and any storage of material in any kind of information retrieval system.
While NIWA uses all reasonable endeavours to ensure the accuracy of the data, NIWA does not guarantee or make any representation or warranty (express or implied) regarding the accuracy or completeness of the data, the use to which the data may be put or the results to be obtained from the use of the data. Accordingly, NIWA expressly disclaims all legal liability whatsoever arising from, or connected to, the use of, reference to, reliance on or possession of the data or the existence of errors therein. NIWA recommends that users exercise their own skill and care with respect to their use of the data and that they obtain independent professional advice relevant to their particular circumstances.
THE CLIMATE AND WEATHER OF CANTERBURY2nd edition G.R. Macara
4
CONTENTSSUMMARY 5
INTRODUCTION 6
TYPICAL WEATHER SITUATIONS IN CANTERBURY 8Easterly-quarter airflows 8Southerly-quarter airflows 9West-southwesterly airflows 9Northwesterly airflows 10
CLIMATIC ELEMENTS 12Wind 12Rainfall 16
Rainfall distribution 16Rainfall frequency and intensity 19Recent extreme events in Canterbury 21Periods of low rainfall 22
Temperature 23Sea surface temperature 23Air temperature 23Earth temperatures 27Frosts 27
Sunshine and Solar Radiation 29Sunshine 29Solar radiation 30UV (ultra-violet) radiation 30
Other elements 31Snow 31Thunderstorms 32Hail 32Fog 32
DERIVED CLIMATOLOGICAL PARAMETERS 34Vapour pressure and relative humidity 34Evapotranspiration and soil water balance 35Degree-day totals 36
ACKNOWLEDGEMENTS 41
REFERENCES 41
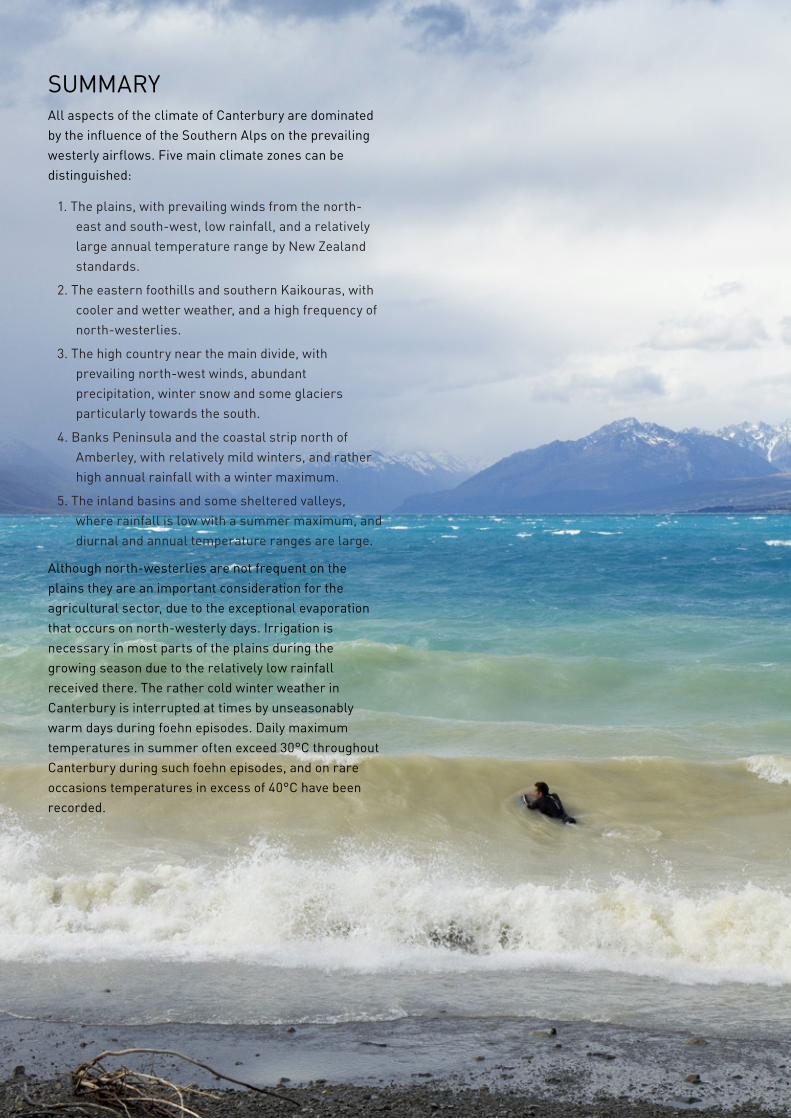
SUMMARYAll aspects of the climate of Canterbury are dominated by the influence of the Southern Alps on the prevailing westerly airflows. Five main climate zones can be distinguished:
1. The plains, with prevailing winds from the north-east and south-west, low rainfall, and a relatively large annual temperature range by New Zealand standards.
2. The eastern foothills and southern Kaikouras, with cooler and wetter weather, and a high frequency of north-westerlies.
3. The high country near the main divide, with prevailing north-west winds, abundant precipitation, winter snow and some glaciers particularly towards the south.
4. Banks Peninsula and the coastal strip north of Amberley, with relatively mild winters, and rather high annual rainfall with a winter maximum.
5. The inland basins and some sheltered valleys, where rainfall is low with a summer maximum, and diurnal and annual temperature ranges are large.
Although north-westerlies are not frequent on the plains they are an important consideration for the agricultural sector, due to the exceptional evaporation that occurs on north-westerly days. Irrigation is necessary in most parts of the plains during the growing season due to the relatively low rainfall received there. The rather cold winter weather in Canterbury is interrupted at times by unseasonably warm days during foehn episodes. Daily maximum temperatures in summer often exceed 30°C throughout Canterbury during such foehn episodes, and on rare occasions temperatures in excess of 40°C have been recorded.
6
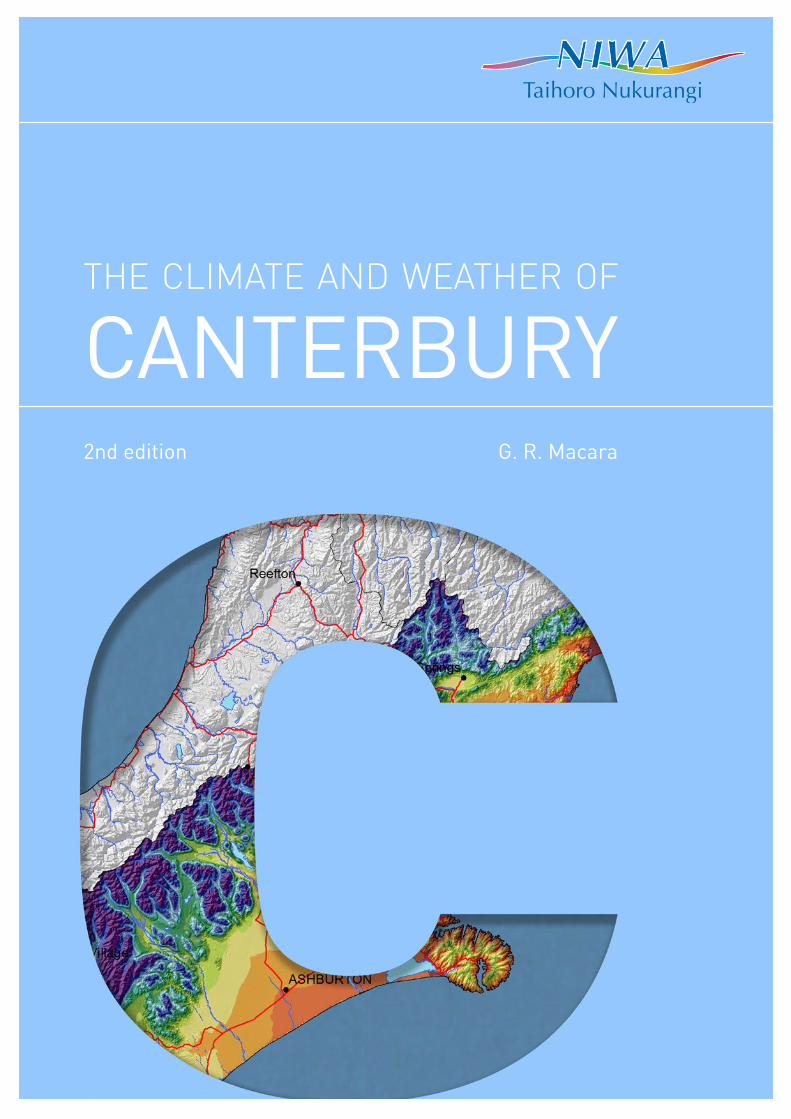
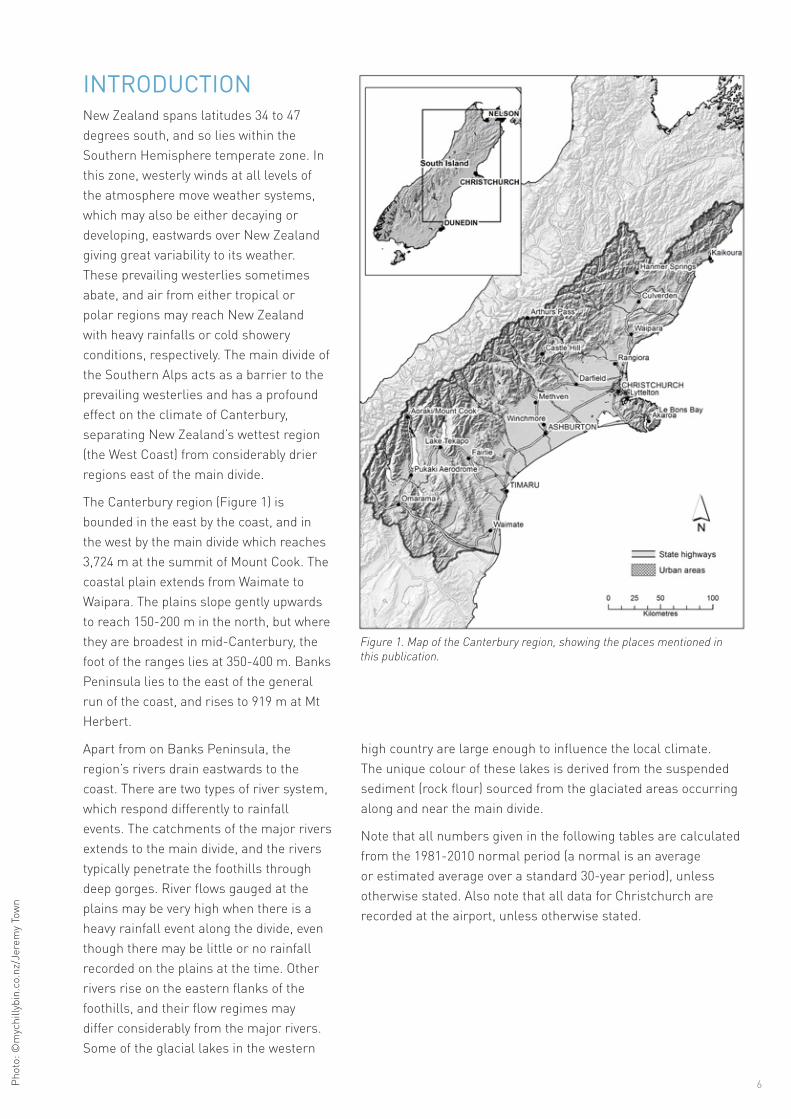
INTRODUCTIONNew Zealand spans latitudes 34 to 47 degrees south, and so lies within the Southern Hemisphere temperate zone. In this zone, westerly winds at all levels of the atmosphere move weather systems, which may also be either decaying or developing, eastwards over New Zealand giving great variability to its weather. These prevailing westerlies sometimes abate, and air from either tropical or polar regions may reach New Zealand with heavy rainfalls or cold showery conditions, respectively. The main divide of the Southern Alps acts as a barrier to the prevailing westerlies and has a profound effect on the climate of Canterbury, separating New Zealand’s wettest region (the West Coast) from considerably drier regions east of the main divide.
The Canterbury region (Figure 1) is bounded in the east by the coast, and in the west by the main divide which reaches 3,724 m at the summit of Mount Cook. The coastal plain extends from Waimate to Waipara. The plains slope gently upwards to reach 150-200 m in the north, but where they are broadest in mid-Canterbury, the foot of the ranges lies at 350-400 m. Banks Peninsula lies to the east of the general run of the coast, and rises to 919 m at Mt Herbert.
Apart from on Banks Peninsula, the region’s rivers drain eastwards to the coast. There are two types of river system, which respond differently to rainfall events. The catchments of the major rivers extends to the main divide, and the rivers typically penetrate the foothills through deep gorges. River flows gauged at the plains may be very high when there is a heavy rainfall event along the divide, even though there may be little or no rainfall recorded on the plains at the time. Other rivers rise on the eastern flanks of the foothills, and their flow regimes may differ considerably from the major rivers. Some of the glacial lakes in the western
high country are large enough to influence the local climate. The unique colour of these lakes is derived from the suspended sediment (rock flour) sourced from the glaciated areas occurring along and near the main divide.
Note that all numbers given in the following tables are calculated from the 1981-2010 normal period (a normal is an average or estimated average over a standard 30-year period), unless otherwise stated. Also note that all data for Christchurch are recorded at the airport, unless otherwise stated.
Phot
o: ©
myc
hilly
bin.
co.n
z/Je
rem
y To
wn
Figure 1. Map of the Canterbury region, showing the places mentioned in this publication.
7
8
TYPICAL WEATHER SITUATIONS IN CANTERBURYNew Zealand lies in the zone of mid-latitude westerlies where a succession of depressions (lows) and subtropical anticyclones (highs) generally progress eastwards over the country. Often, a trough of low pressure separates two highs, and it usually contains a frontal system, which extends into one or more lows on the southern side of the highs. As the highs move east, New Zealand experiences a regular weather sequence, which has a period of about a week. Whilst this pattern provides the basic framework of the day-to-day weather, the succession is frequently interrupted.
In anticyclonic conditions the weather in Canterbury is generally fine, but it is often cloudy in winter if winds are onshore. Approaching troughs of low pressure are commonly preceded by extensive high cloud, but significant precipitation east of the main divide is rare at the frontal passage unless it becomes slow-moving. Orographic influences on the weather in Canterbury are very strong. Westerly airflows bring rainfall and cloudiness along the main divide, but reduced rainfall and increased sunshine hours farther east. Conversely, an easterly airflow often results in rainfall and cloudiness for the east coast and plains, but reduced rainfall and increased sunshine hours farther west. Because of the orographic influence, both the pressure and airflow patterns can be strongly disturbed in Canterbury causing, for example, a lee wave depression.
Easterly-quarter airflows
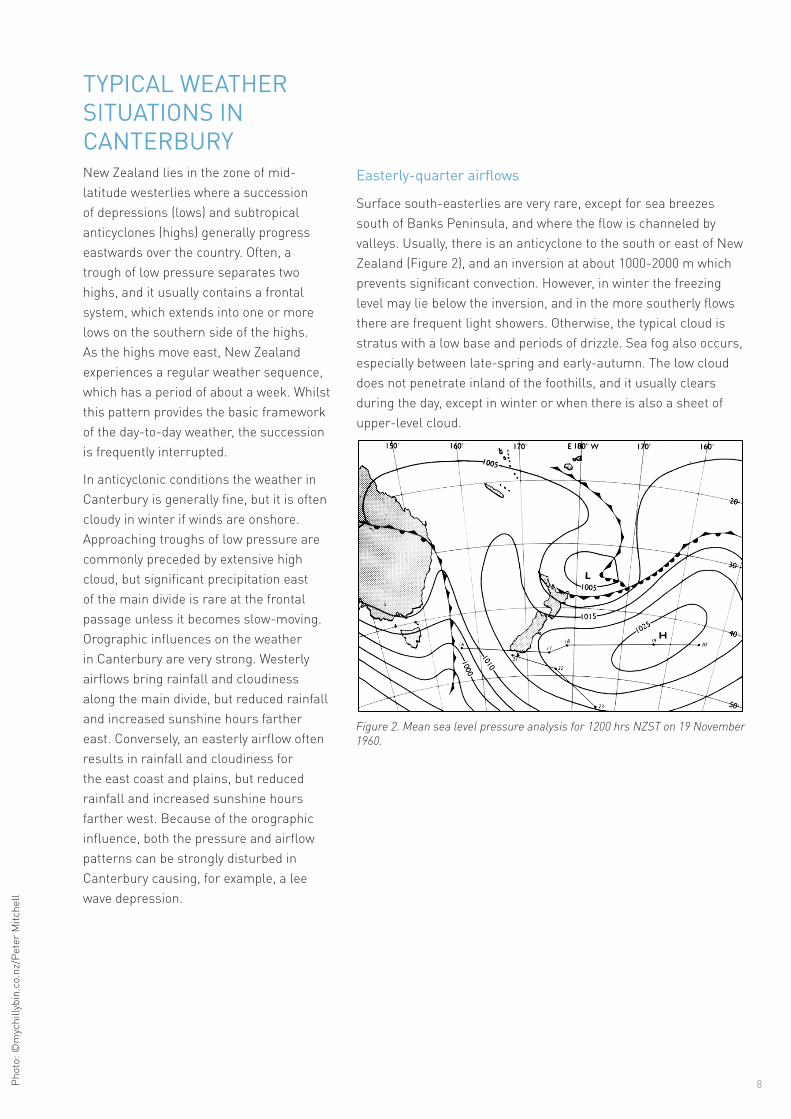
Surface south-easterlies are very rare, except for sea breezes south of Banks Peninsula, and where the flow is channeled by valleys. Usually, there is an anticyclone to the south or east of New Zealand (Figure 2), and an inversion at about 1000-2000 m which prevents significant convection. However, in winter the freezing level may lie below the inversion, and in the more southerly flows there are frequent light showers. Otherwise, the typical cloud is stratus with a low base and periods of drizzle. Sea fog also occurs, especially between late-spring and early-autumn. The low cloud does not penetrate inland of the foothills, and it usually clears during the day, except in winter or when there is also a sheet of upper-level cloud.
Phot
o: ©
myc
hilly
bin.
co.n
z/Pe
ter M
itche
ll
Figure 2. Mean sea level pressure analysis for 1200 hrs NZST on 19 November 1960.
9
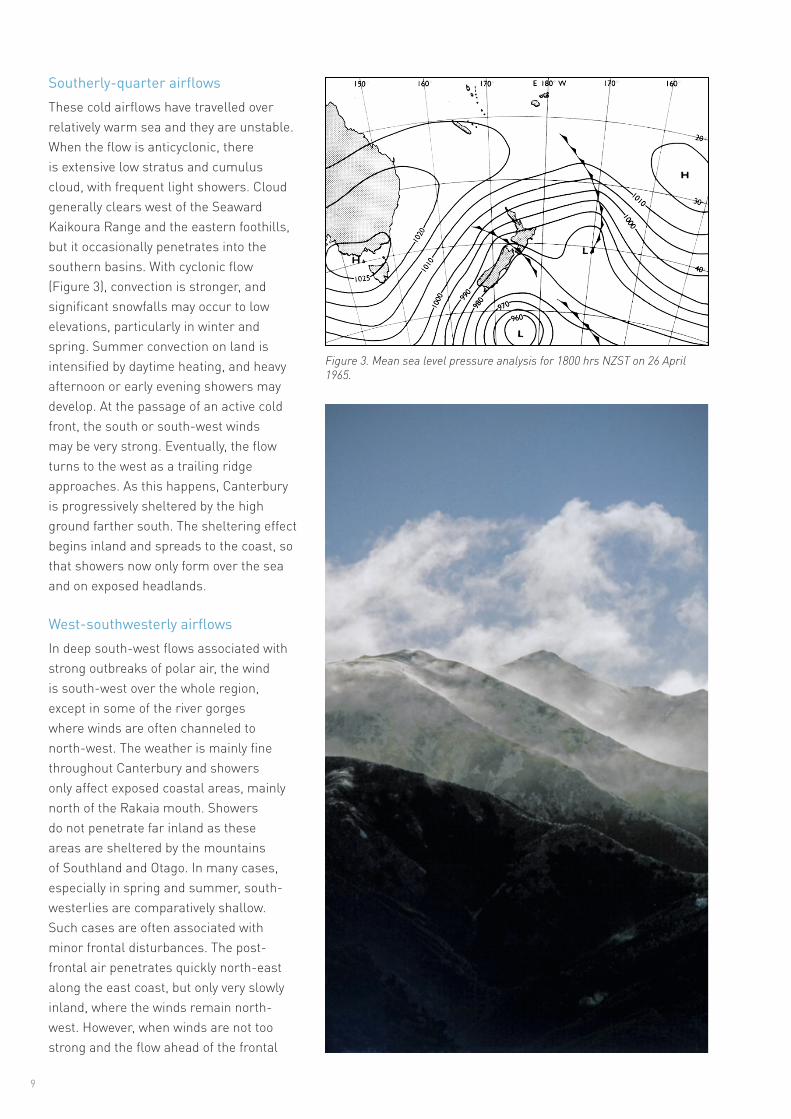
Southerly-quarter airflowsThese cold airflows have travelled over relatively warm sea and they are unstable. When the flow is anticyclonic, there is extensive low stratus and cumulus cloud, with frequent light showers. Cloud generally clears west of the Seaward Kaikoura Range and the eastern foothills, but it occasionally penetrates into the southern basins. With cyclonic flow (Figure 3), convection is stronger, and significant snowfalls may occur to low elevations, particularly in winter and spring. Summer convection on land is intensified by daytime heating, and heavy afternoon or early evening showers may develop. At the passage of an active cold front, the south or south-west winds may be very strong. Eventually, the flow turns to the west as a trailing ridge approaches. As this happens, Canterbury is progressively sheltered by the high ground farther south. The sheltering effect begins inland and spreads to the coast, so that showers now only form over the sea and on exposed headlands.
West-southwesterly airflowsIn deep south-west flows associated with strong outbreaks of polar air, the wind is south-west over the whole region, except in some of the river gorges where winds are often channeled to north-west. The weather is mainly fine throughout Canterbury and showers only affect exposed coastal areas, mainly north of the Rakaia mouth. Showers do not penetrate far inland as these areas are sheltered by the mountains of Southland and Otago. In many cases, especially in spring and summer, south-westerlies are comparatively shallow. Such cases are often associated with minor frontal disturbances. The post-frontal air penetrates quickly north-east along the east coast, but only very slowly inland, where the winds remain north-west. However, when winds are not too strong and the flow ahead of the frontal
Figure 3. Mean sea level pressure analysis for 1800 hrs NZST on 26 April 1965.
10
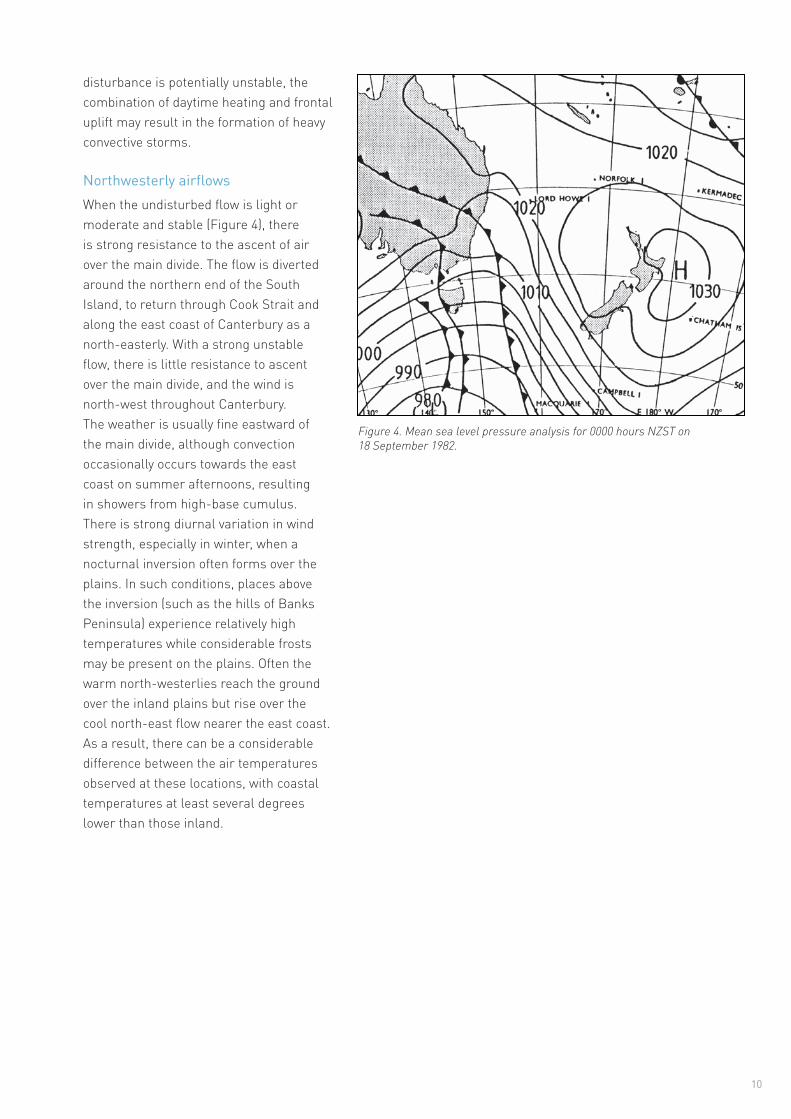
Figure 4. Mean sea level pressure analysis for 0000 hours NZST on 18 September 1982.
disturbance is potentially unstable, the combination of daytime heating and frontal uplift may result in the formation of heavy convective storms.
Northwesterly airflowsWhen the undisturbed flow is light or moderate and stable (Figure 4), there is strong resistance to the ascent of air over the main divide. The flow is diverted around the northern end of the South Island, to return through Cook Strait and along the east coast of Canterbury as a north-easterly. With a strong unstable flow, there is little resistance to ascent over the main divide, and the wind is north-west throughout Canterbury. The weather is usually fine eastward of the main divide, although convection occasionally occurs towards the east coast on summer afternoons, resulting in showers from high-base cumulus. There is strong diurnal variation in wind strength, especially in winter, when a nocturnal inversion often forms over the plains. In such conditions, places above the inversion (such as the hills of Banks Peninsula) experience relatively high temperatures while considerable frosts may be present on the plains. Often the warm north-westerlies reach the ground over the inland plains but rise over the cool north-east flow nearer the east coast. As a result, there can be a considerable difference between the air temperatures observed at these locations, with coastal temperatures at least several degrees lower than those inland.
11
12
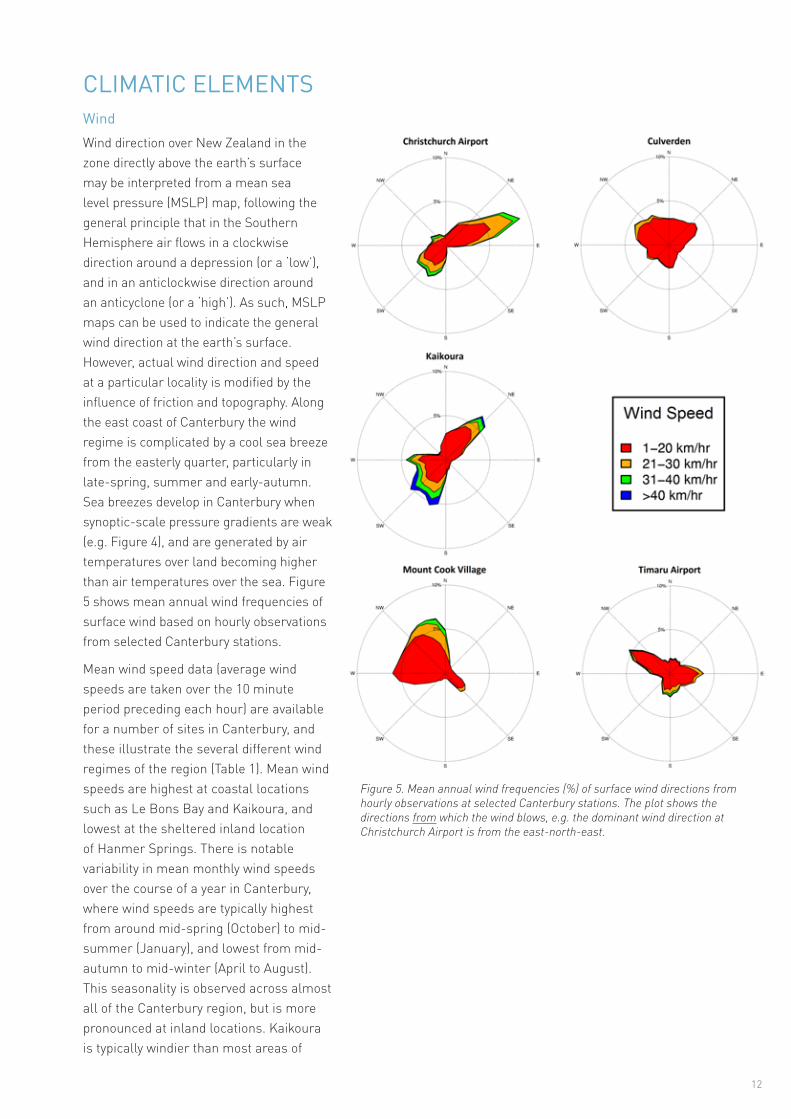
CLIMATIC ELEMENTSWindWind direction over New Zealand in the zone directly above the earth’s surface may be interpreted from a mean sea level pressure (MSLP) map, following the general principle that in the Southern Hemisphere air flows in a clockwise direction around a depression (or a ‘low’), and in an anticlockwise direction around an anticyclone (or a ‘high’). As such, MSLP maps can be used to indicate the general wind direction at the earth’s surface. However, actual wind direction and speed at a particular locality is modified by the influence of friction and topography. Along the east coast of Canterbury the wind regime is complicated by a cool sea breeze from the easterly quarter, particularly in late-spring, summer and early-autumn. Sea breezes develop in Canterbury when synoptic-scale pressure gradients are weak (e.g. Figure 4), and are generated by air temperatures over land becoming higher than air temperatures over the sea. Figure 5 shows mean annual wind frequencies of surface wind based on hourly observations from selected Canterbury stations.
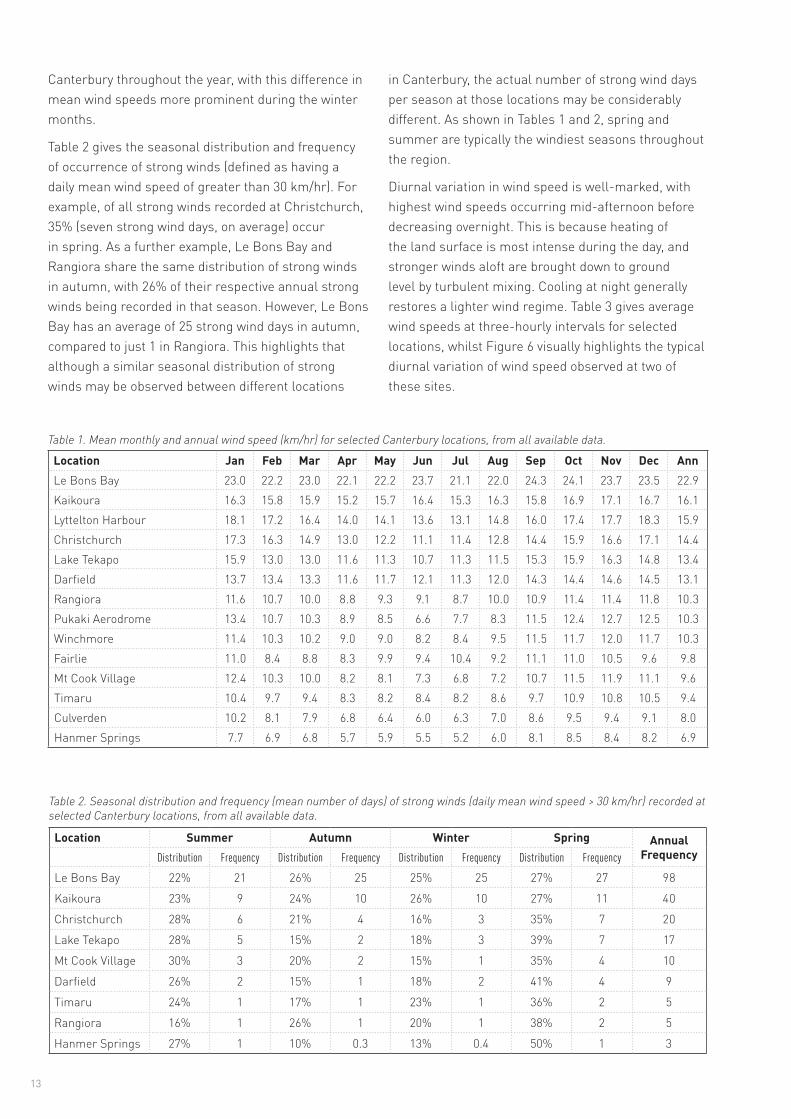
Mean wind speed data (average wind speeds are taken over the 10 minute period preceding each hour) are available for a number of sites in Canterbury, and these illustrate the several different wind regimes of the region (Table 1). Mean wind speeds are highest at coastal locations such as Le Bons Bay and Kaikoura, and lowest at the sheltered inland location of Hanmer Springs. There is notable variability in mean monthly wind speeds over the course of a year in Canterbury, where wind speeds are typically highest from around mid-spring (October) to mid-summer (January), and lowest from mid-autumn to mid-winter (April to August). This seasonality is observed across almost all of the Canterbury region, but is more pronounced at inland locations. Kaikoura is typically windier than most areas of
Figure 5. Mean annual wind frequencies (%) of surface wind directions from hourly observations at selected Canterbury stations. The plot shows the directions from which the wind blows, e.g. the dominant wind direction at Christchurch Airport is from the east-north-east.
13
Table 1. Mean monthly and annual wind speed (km/hr) for selected Canterbury locations, from all available data.
Location Jan Feb Mar Apr May Jun Jul Aug Sep Oct Nov Dec AnnLe Bons Bay 23.0 22.2 23.0 22.1 22.2 23.7 21.1 22.0 24.3 24.1 23.7 23.5 22.9Kaikoura 16.3 15.8 15.9 15.2 15.7 16.4 15.3 16.3 15.8 16.9 17.1 16.7 16.1Lyttelton Harbour 18.1 17.2 16.4 14.0 14.1 13.6 13.1 14.8 16.0 17.4 17.7 18.3 15.9Christchurch 17.3 16.3 14.9 13.0 12.2 11.1 11.4 12.8 14.4 15.9 16.6 17.1 14.4Lake Tekapo 15.9 13.0 13.0 11.6 11.3 10.7 11.3 11.5 15.3 15.9 16.3 14.8 13.4Darfield 13.7 13.4 13.3 11.6 11.7 12.1 11.3 12.0 14.3 14.4 14.6 14.5 13.1Rangiora 11.6 10.7 10.0 8.8 9.3 9.1 8.7 10.0 10.9 11.4 11.4 11.8 10.3Pukaki Aerodrome 13.4 10.7 10.3 8.9 8.5 6.6 7.7 8.3 11.5 12.4 12.7 12.5 10.3Winchmore 11.4 10.3 10.2 9.0 9.0 8.2 8.4 9.5 11.5 11.7 12.0 11.7 10.3Fairlie 11.0 8.4 8.8 8.3 9.9 9.4 10.4 9.2 11.1 11.0 10.5 9.6 9.8Mt Cook Village 12.4 10.3 10.0 8.2 8.1 7.3 6.8 7.2 10.7 11.5 11.9 11.1 9.6Timaru 10.4 9.7 9.4 8.3 8.2 8.4 8.2 8.6 9.7 10.9 10.8 10.5 9.4Culverden 10.2 8.1 7.9 6.8 6.4 6.0 6.3 7.0 8.6 9.5 9.4 9.1 8.0Hanmer Springs 7.7 6.9 6.8 5.7 5.9 5.5 5.2 6.0 8.1 8.5 8.4 8.2 6.9
Canterbury throughout the year, with this difference in mean wind speeds more prominent during the winter months.
Table 2 gives the seasonal distribution and frequency of occurrence of strong winds (defined as having a daily mean wind speed of greater than 30 km/hr). For example, of all strong winds recorded at Christchurch, 35% (seven strong wind days, on average) occur in spring. As a further example, Le Bons Bay and Rangiora share the same distribution of strong winds in autumn, with 26% of their respective annual strong winds being recorded in that season. However, Le Bons Bay has an average of 25 strong wind days in autumn, compared to just 1 in Rangiora. This highlights that although a similar seasonal distribution of strong winds may be observed between different locations
Table 2. Seasonal distribution and frequency (mean number of days) of strong winds (daily mean wind speed > 30 km/hr) recorded at selected Canterbury locations, from all available data.
Location Summer Autumn Winter Spring Annual FrequencyDistribution Frequency Distribution Frequency Distribution Frequency Distribution Frequency
Le Bons Bay 22% 21 26% 25 25% 25 27% 27 98
Kaikoura 23% 9 24% 10 26% 10 27% 11 40
Christchurch 28% 6 21% 4 16% 3 35% 7 20
Lake Tekapo 28% 5 15% 2 18% 3 39% 7 17
Mt Cook Village 30% 3 20% 2 15% 1 35% 4 10
Darfield 26% 2 15% 1 18% 2 41% 4 9
Timaru 24% 1 17% 1 23% 1 36% 2 5
Rangiora 16% 1 26% 1 20% 1 38% 2 5
Hanmer Springs 27% 1 10% 0.3 13% 0.4 50% 1 3
in Canterbury, the actual number of strong wind days per season at those locations may be considerably different. As shown in Tables 1 and 2, spring and summer are typically the windiest seasons throughout the region.
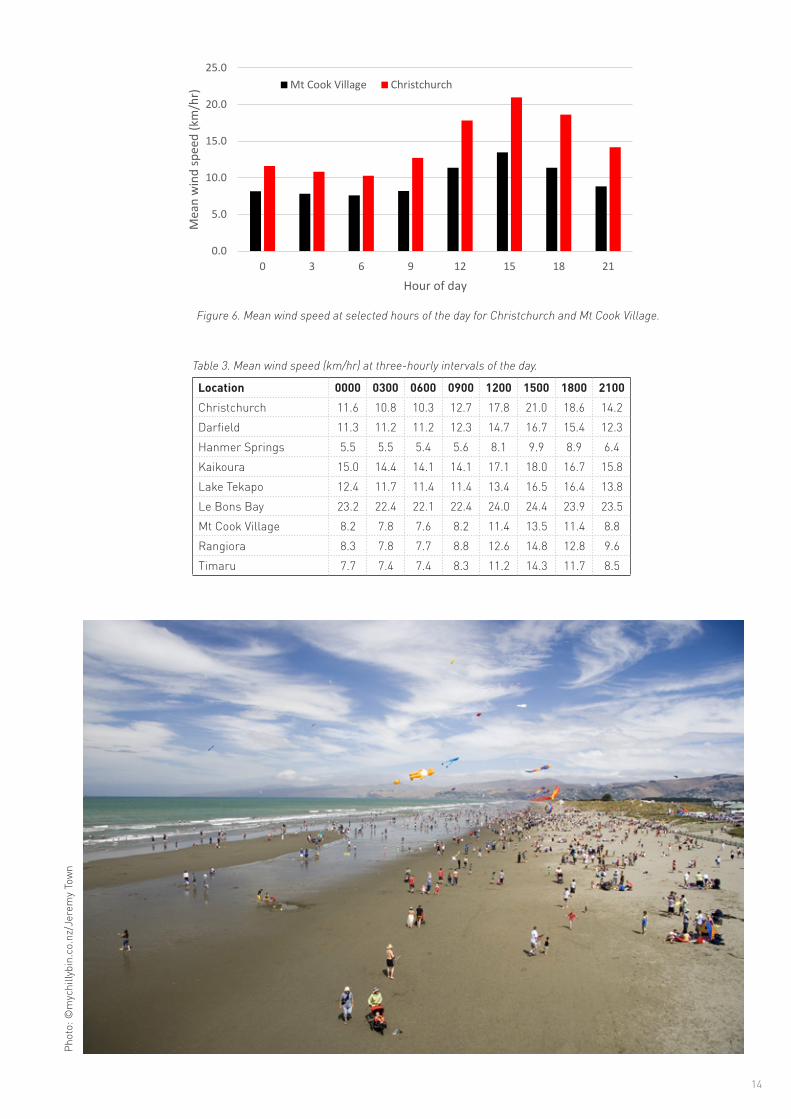
Diurnal variation in wind speed is well-marked, with highest wind speeds occurring mid-afternoon before decreasing overnight. This is because heating of the land surface is most intense during the day, and stronger winds aloft are brought down to ground level by turbulent mixing. Cooling at night generally restores a lighter wind regime. Table 3 gives average wind speeds at three-hourly intervals for selected locations, whilst Figure 6 visually highlights the typical diurnal variation of wind speed observed at two of these sites.
14
0.0
5.0
10.0
15.0
20.0
25.0
0 3 6 9 12 15 18 21
Mea
n w
ind
spee
d (k
m/h
r)
Hour of day
Mt Cook Village Christchurch
Figure 6. Mean wind speed at selected hours of the day for Christchurch and Mt Cook Village.
Table 3. Mean wind speed (km/hr) at three-hourly intervals of the day.
Location 0000 0300 0600 0900 1200 1500 1800 2100Christchurch 11.6 10.8 10.3 12.7 17.8 21.0 18.6 14.2Darfield 11.3 11.2 11.2 12.3 14.7 16.7 15.4 12.3Hanmer Springs 5.5 5.5 5.4 5.6 8.1 9.9 8.9 6.4Kaikoura 15.0 14.4 14.1 14.1 17.1 18.0 16.7 15.8Lake Tekapo 12.4 11.7 11.4 11.4 13.4 16.5 16.4 13.8Le Bons Bay 23.2 22.4 22.1 22.4 24.0 24.4 23.9 23.5Mt Cook Village 8.2 7.8 7.6 8.2 11.4 13.5 11.4 8.8Rangiora 8.3 7.8 7.7 8.8 12.6 14.8 12.8 9.6Timaru 7.7 7.4 7.4 8.3 11.2 14.3 11.7 8.5
Phot
o: ©
myc
hilly
bin.
co.n
z/Je
rem
y To
wn
15
Table 4. Mean number of days per year with gusts exceeding 61 km/hr (33 knots) and 94 km/hr (50 knots) for selected locations.
Table 5. Highest recorded wind gusts at selected Canterbury locations, from all available data.
LocationDays with gusts >61
km/hr
Days with gusts >94
km/hrChristchurch 52 2Darfield 43 1Hanmer Springs 36 2Kaikoura 97 17Lake Tekapo 69 5Mt Cook Village 108 15Mt John 158 72Rangiora 30 0.6Timaru 34 2
Location Gust (km/hr) Direction DateChristchurch (Airport) 172.4 WNW 01/08/1975Darfield 116.6 NW 05/05/2014Hanmer Springs 137.2 NW 28/03/2001Kaikoura 194.8 WNW 01/08/1975Lake Tekapo 122.4 WNW 13/10/2006Mt Cook Village 177.8 N 21/02/2004Mt John 250.0 NW 18/4/1970Rangiora 116.6 NW 22/09/2002Timaru 164.9 WNW 01/08/1975
Gusty winds are relatively infrequent throughout most lowland Canterbury locations, occurring more frequently in the mountain ranges and exposed coastal locations. Christchurch experiences an average of 52 days per year with wind gusts exceeding 61 km/hr, considerably less than Kaikoura where on average 97 such days per year are recorded (Table 4). Maximum gusts recorded at different locations in Canterbury are listed in Table 5. The highest gust recorded in the region (and for all New Zealand) was 250 km/hr, occurring at Mt John (near Lake Tekapo) on 18 April 1970 (http://www.niwa.co.nz/education-and-training/schools/resources/climate/extreme).
Phot
o: ©
myc
hilly
bin.
co.n
z/Je
rem
y To
wn
16
Rainfall
Rainfall distribution
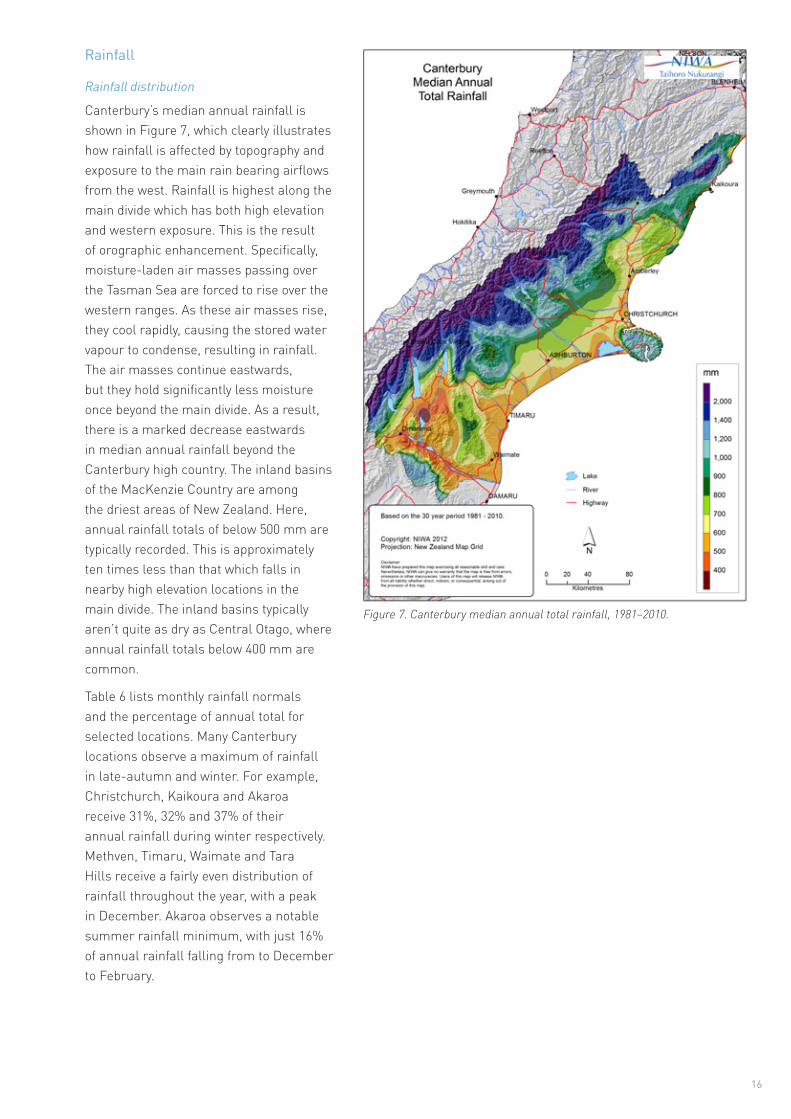
Canterbury’s median annual rainfall is shown in Figure 7, which clearly illustrates how rainfall is affected by topography and exposure to the main rain bearing airflows from the west. Rainfall is highest along the main divide which has both high elevation and western exposure. This is the result of orographic enhancement. Specifically, moisture-laden air masses passing over the Tasman Sea are forced to rise over the western ranges. As these air masses rise, they cool rapidly, causing the stored water vapour to condense, resulting in rainfall. The air masses continue eastwards, but they hold significantly less moisture once beyond the main divide. As a result, there is a marked decrease eastwards in median annual rainfall beyond the Canterbury high country. The inland basins of the MacKenzie Country are among the driest areas of New Zealand. Here, annual rainfall totals of below 500 mm are typically recorded. This is approximately ten times less than that which falls in nearby high elevation locations in the main divide. The inland basins typically aren’t quite as dry as Central Otago, where annual rainfall totals below 400 mm are common.
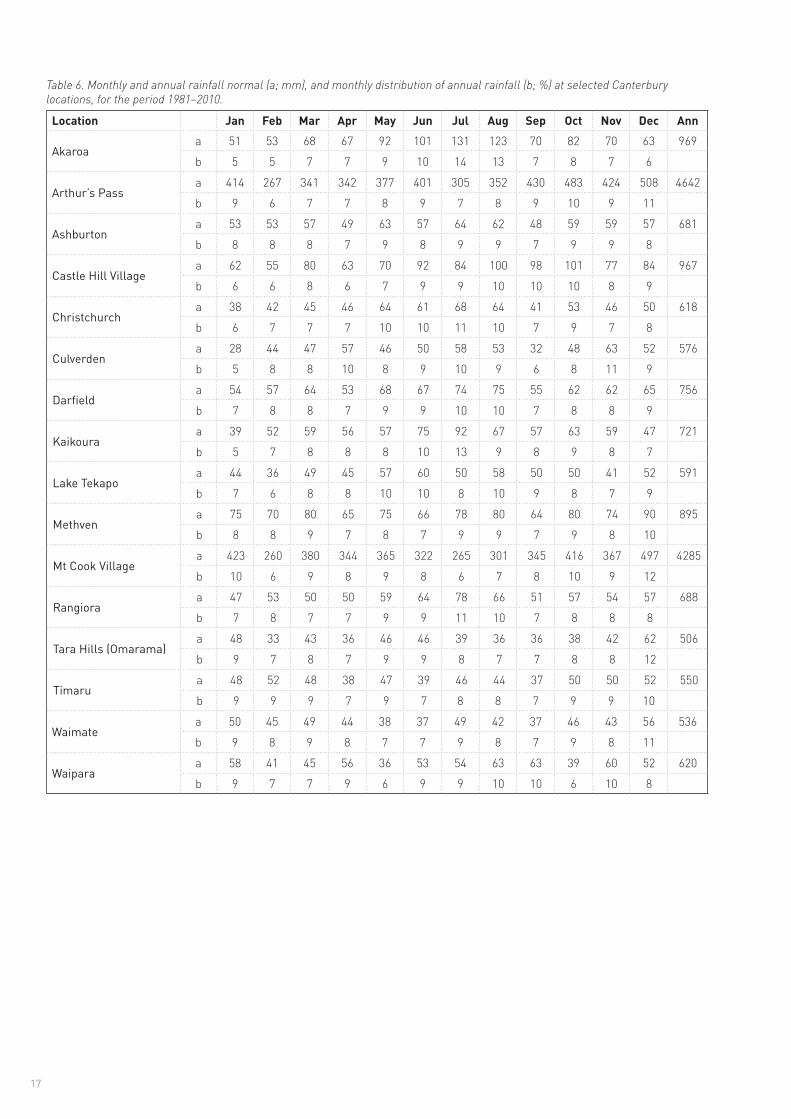
Table 6 lists monthly rainfall normals and the percentage of annual total for selected locations. Many Canterbury locations observe a maximum of rainfall in late-autumn and winter. For example, Christchurch, Kaikoura and Akaroa receive 31%, 32% and 37% of their annual rainfall during winter respectively. Methven, Timaru, Waimate and Tara Hills receive a fairly even distribution of rainfall throughout the year, with a peak in December. Akaroa observes a notable summer rainfall minimum, with just 16% of annual rainfall falling from to December to February.
Figure 7. Canterbury median annual total rainfall, 1981–2010.
17
Table 6. Monthly and annual rainfall normal (a; mm), and monthly distribution of annual rainfall (b; %) at selected Canterbury locations, for the period 1981–2010.
Location Jan Feb Mar Apr May Jun Jul Aug Sep Oct Nov Dec Ann
Akaroaa 51 53 68 67 92 101 131 123 70 82 70 63 969
b 5 5 7 7 9 10 14 13 7 8 7 6
Arthur’s Passa 414 267 341 342 377 401 305 352 430 483 424 508 4642
b 9 6 7 7 8 9 7 8 9 10 9 11
Ashburtona 53 53 57 49 63 57 64 62 48 59 59 57 681
b 8 8 8 7 9 8 9 9 7 9 9 8
Castle Hill Villagea 62 55 80 63 70 92 84 100 98 101 77 84 967
b 6 6 8 6 7 9 9 10 10 10 8 9
Christchurcha 38 42 45 46 64 61 68 64 41 53 46 50 618
b 6 7 7 7 10 10 11 10 7 9 7 8
Culverdena 28 44 47 57 46 50 58 53 32 48 63 52 576
b 5 8 8 10 8 9 10 9 6 8 11 9
Darfielda 54 57 64 53 68 67 74 75 55 62 62 65 756
b 7 8 8 7 9 9 10 10 7 8 8 9
Kaikouraa 39 52 59 56 57 75 92 67 57 63 59 47 721
b 5 7 8 8 8 10 13 9 8 9 8 7
Lake Tekapoa 44 36 49 45 57 60 50 58 50 50 41 52 591
b 7 6 8 8 10 10 8 10 9 8 7 9
Methvena 75 70 80 65 75 66 78 80 64 80 74 90 895
b 8 8 9 7 8 7 9 9 7 9 8 10
Mt Cook Villagea 423 260 380 344 365 322 265 301 345 416 367 497 4285
b 10 6 9 8 9 8 6 7 8 10 9 12
Rangioraa 47 53 50 50 59 64 78 66 51 57 54 57 688
b 7 8 7 7 9 9 11 10 7 8 8 8
Tara Hills (Omarama)a 48 33 43 36 46 46 39 36 36 38 42 62 506
b 9 7 8 7 9 9 8 7 7 8 8 12
Timarua 48 52 48 38 47 39 46 44 37 50 50 52 550
b 9 9 9 7 9 7 8 8 7 9 9 10
Waimatea 50 45 49 44 38 37 49 42 37 46 43 56 536
b 9 8 9 8 7 7 9 8 7 9 8 11
Waiparaa 58 41 45 56 36 53 54 63 63 39 60 52 620
b 9 7 7 9 6 9 9 10 10 6 10 8
050
100
150
200
250
300
050
150
250
350
450
030
060
090
012
0015
00
Christchurch
Kaikoura Arthur’s Pass
Timaru Lake TekapoR
ainf
all (
mm
)R
ainf
all (
mm
)
Rai
nfal
l (m
m)
050
100
150
200
250
300
Rai
nfal
l (m
m)
050
100
150
200
250
300
Rai
nfal
l (m
m)
J F M A M J J A S O DN J F M A M J J A S O DN J F M A M J J A S O DN
J F M A M J J A S O DN J F M A M J J A S O DN
Mean
Lowest Monthly Total
90 Percentile Value
10 Percentile Value
Highest Monthly Total
18
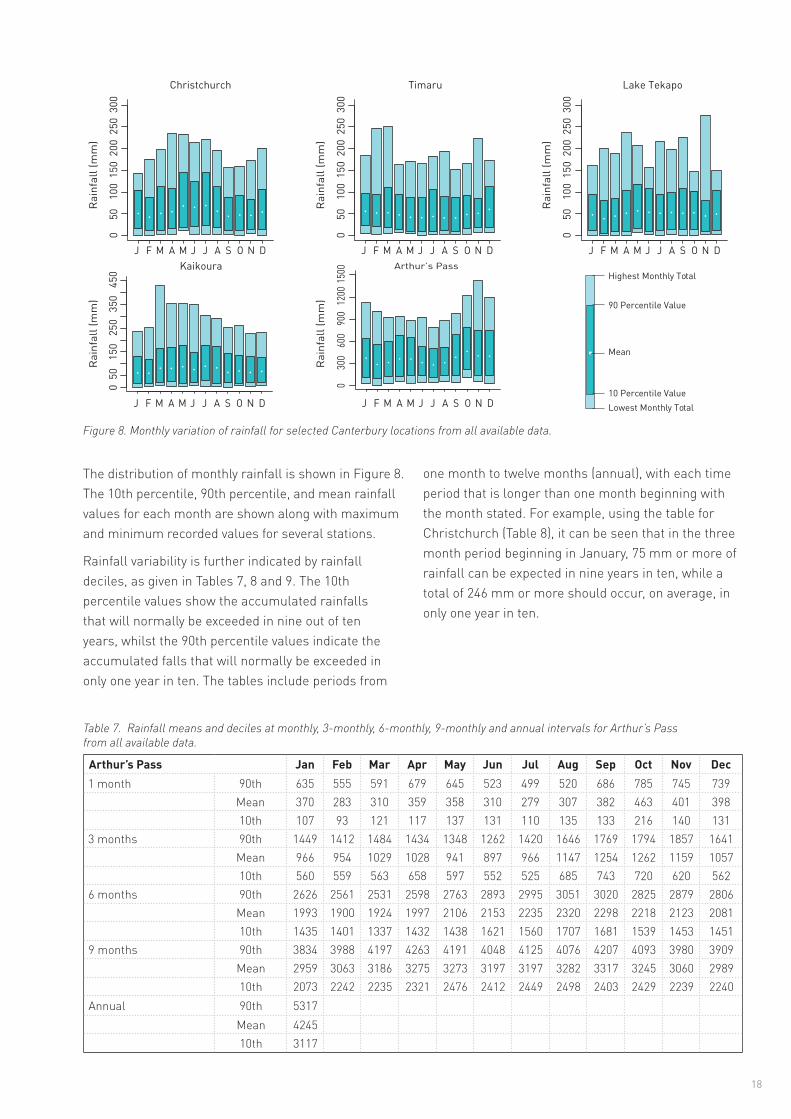
The distribution of monthly rainfall is shown in Figure 8. The 10th percentile, 90th percentile, and mean rainfall values for each month are shown along with maximum and minimum recorded values for several stations.
Rainfall variability is further indicated by rainfall deciles, as given in Tables 7, 8 and 9. The 10th percentile values show the accumulated rainfalls that will normally be exceeded in nine out of ten years, whilst the 90th percentile values indicate the accumulated falls that will normally be exceeded in only one year in ten. The tables include periods from
Figure 8. Monthly variation of rainfall for selected Canterbury locations from all available data.
Table 7. Rainfall means and deciles at monthly, 3-monthly, 6-monthly, 9-monthly and annual intervals for Arthur’s Pass from all available data.
Arthur’s Pass Jan Feb Mar Apr May Jun Jul Aug Sep Oct Nov Dec1 month 90th 635 555 591 679 645 523 499 520 686 785 745 739
Mean 370 283 310 359 358 310 279 307 382 463 401 39810th 107 93 121 117 137 131 110 135 133 216 140 131
3 months 90th 1449 1412 1484 1434 1348 1262 1420 1646 1769 1794 1857 1641Mean 966 954 1029 1028 941 897 966 1147 1254 1262 1159 105710th 560 559 563 658 597 552 525 685 743 720 620 562
6 months 90th 2626 2561 2531 2598 2763 2893 2995 3051 3020 2825 2879 2806Mean 1993 1900 1924 1997 2106 2153 2235 2320 2298 2218 2123 208110th 1435 1401 1337 1432 1438 1621 1560 1707 1681 1539 1453 1451
9 months 90th 3834 3988 4197 4263 4191 4048 4125 4076 4207 4093 3980 3909Mean 2959 3063 3186 3275 3273 3197 3197 3282 3317 3245 3060 298910th 2073 2242 2235 2321 2476 2412 2449 2498 2403 2429 2239 2240
Annual 90th 5317Mean 424510th 3117
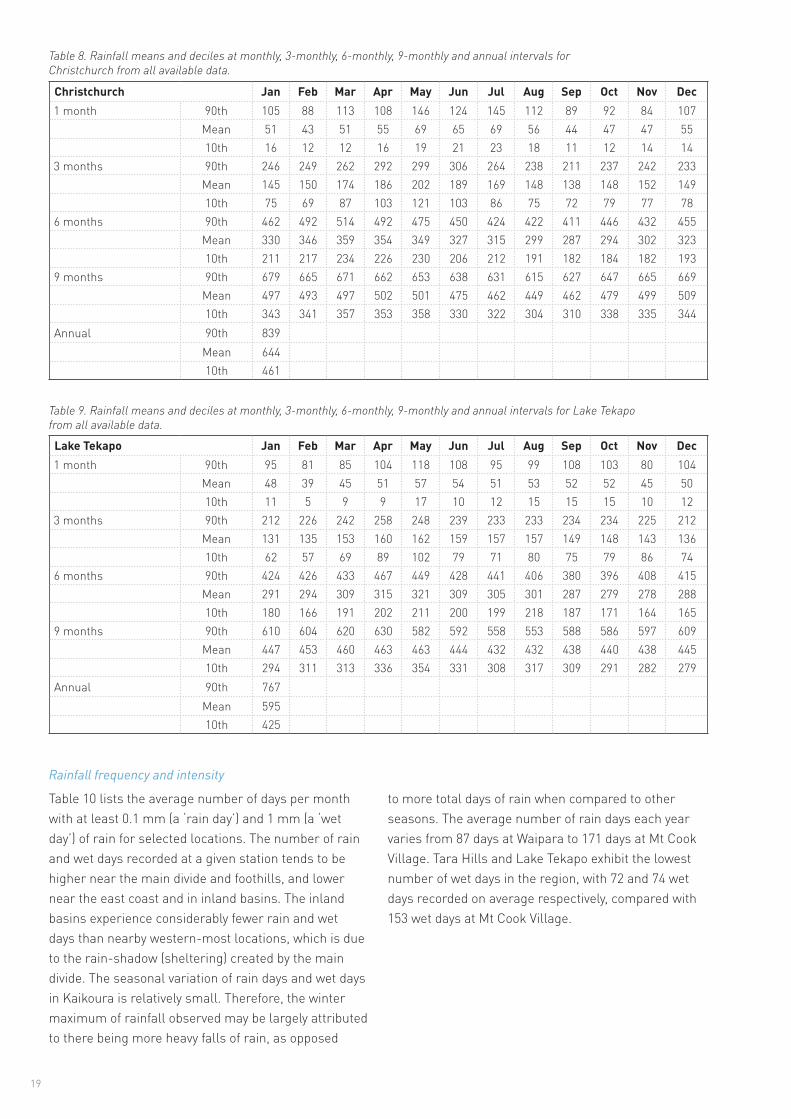
one month to twelve months (annual), with each time period that is longer than one month beginning with the month stated. For example, using the table for Christchurch (Table 8), it can be seen that in the three month period beginning in January, 75 mm or more of rainfall can be expected in nine years in ten, while a total of 246 mm or more should occur, on average, in only one year in ten.
19
Table 8. Rainfall means and deciles at monthly, 3-monthly, 6-monthly, 9-monthly and annual intervals for Christchurch from all available data.
Table 9. Rainfall means and deciles at monthly, 3-monthly, 6-monthly, 9-monthly and annual intervals for Lake Tekapo from all available data.
Christchurch Jan Feb Mar Apr May Jun Jul Aug Sep Oct Nov Dec1 month 90th 105 88 113 108 146 124 145 112 89 92 84 107
Mean 51 43 51 55 69 65 69 56 44 47 47 5510th 16 12 12 16 19 21 23 18 11 12 14 14
3 months 90th 246 249 262 292 299 306 264 238 211 237 242 233Mean 145 150 174 186 202 189 169 148 138 148 152 14910th 75 69 87 103 121 103 86 75 72 79 77 78
6 months 90th 462 492 514 492 475 450 424 422 411 446 432 455Mean 330 346 359 354 349 327 315 299 287 294 302 32310th 211 217 234 226 230 206 212 191 182 184 182 193
9 months 90th 679 665 671 662 653 638 631 615 627 647 665 669Mean 497 493 497 502 501 475 462 449 462 479 499 50910th 343 341 357 353 358 330 322 304 310 338 335 344
Annual 90th 839Mean 64410th 461
Lake Tekapo Jan Feb Mar Apr May Jun Jul Aug Sep Oct Nov Dec1 month 90th 95 81 85 104 118 108 95 99 108 103 80 104
Mean 48 39 45 51 57 54 51 53 52 52 45 5010th 11 5 9 9 17 10 12 15 15 15 10 12
3 months 90th 212 226 242 258 248 239 233 233 234 234 225 212Mean 131 135 153 160 162 159 157 157 149 148 143 13610th 62 57 69 89 102 79 71 80 75 79 86 74
6 months 90th 424 426 433 467 449 428 441 406 380 396 408 415Mean 291 294 309 315 321 309 305 301 287 279 278 28810th 180 166 191 202 211 200 199 218 187 171 164 165
9 months 90th 610 604 620 630 582 592 558 553 588 586 597 609Mean 447 453 460 463 463 444 432 432 438 440 438 44510th 294 311 313 336 354 331 308 317 309 291 282 279
Annual 90th 767Mean 59510th 425
Rainfall frequency and intensity
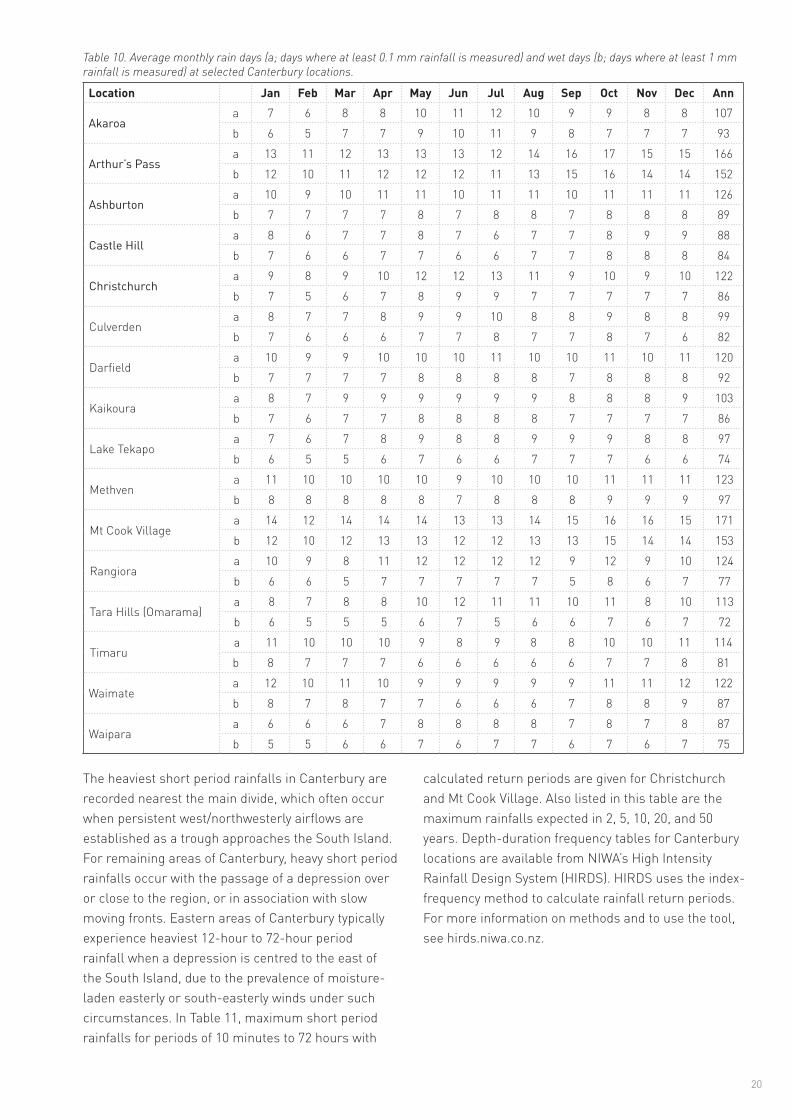
Table 10 lists the average number of days per month with at least 0.1 mm (a ‘rain day’) and 1 mm (a ‘wet day’) of rain for selected locations. The number of rain and wet days recorded at a given station tends to be higher near the main divide and foothills, and lower near the east coast and in inland basins. The inland basins experience considerably fewer rain and wet days than nearby western-most locations, which is due to the rain-shadow (sheltering) created by the main divide. The seasonal variation of rain days and wet days in Kaikoura is relatively small. Therefore, the winter maximum of rainfall observed may be largely attributed to there being more heavy falls of rain, as opposed
to more total days of rain when compared to other seasons. The average number of rain days each year varies from 87 days at Waipara to 171 days at Mt Cook Village. Tara Hills and Lake Tekapo exhibit the lowest number of wet days in the region, with 72 and 74 wet days recorded on average respectively, compared with 153 wet days at Mt Cook Village.
20
Table 10. Average monthly rain days (a; days where at least 0.1 mm rainfall is measured) and wet days (b; days where at least 1 mm rainfall is measured) at selected Canterbury locations.
Location Jan Feb Mar Apr May Jun Jul Aug Sep Oct Nov Dec Ann
Akaroaa 7 6 8 8 10 11 12 10 9 9 8 8 107b 6 5 7 7 9 10 11 9 8 7 7 7 93
Arthur’s Passa 13 11 12 13 13 13 12 14 16 17 15 15 166b 12 10 11 12 12 12 11 13 15 16 14 14 152
Ashburtona 10 9 10 11 11 10 11 11 10 11 11 11 126b 7 7 7 7 8 7 8 8 7 8 8 8 89
Castle Hilla 8 6 7 7 8 7 6 7 7 8 9 9 88b 7 6 6 7 7 6 6 7 7 8 8 8 84
Christchurcha 9 8 9 10 12 12 13 11 9 10 9 10 122b 7 5 6 7 8 9 9 7 7 7 7 7 86
Culverdena 8 7 7 8 9 9 10 8 8 9 8 8 99b 7 6 6 6 7 7 8 7 7 8 7 6 82
Darfielda 10 9 9 10 10 10 11 10 10 11 10 11 120b 7 7 7 7 8 8 8 8 7 8 8 8 92
Kaikouraa 8 7 9 9 9 9 9 9 8 8 8 9 103b 7 6 7 7 8 8 8 8 7 7 7 7 86
Lake Tekapoa 7 6 7 8 9 8 8 9 9 9 8 8 97b 6 5 5 6 7 6 6 7 7 7 6 6 74
Methvena 11 10 10 10 10 9 10 10 10 11 11 11 123b 8 8 8 8 8 7 8 8 8 9 9 9 97
Mt Cook Villagea 14 12 14 14 14 13 13 14 15 16 16 15 171b 12 10 12 13 13 12 12 13 13 15 14 14 153
Rangioraa 10 9 8 11 12 12 12 12 9 12 9 10 124b 6 6 5 7 7 7 7 7 5 8 6 7 77
Tara Hills (Omarama)a 8 7 8 8 10 12 11 11 10 11 8 10 113b 6 5 5 5 6 7 5 6 6 7 6 7 72
Timarua 11 10 10 10 9 8 9 8 8 10 10 11 114b 8 7 7 7 6 6 6 6 6 7 7 8 81
Waimatea 12 10 11 10 9 9 9 9 9 11 11 12 122b 8 7 8 7 7 6 6 6 7 8 8 9 87
Waiparaa 6 6 6 7 8 8 8 8 7 8 7 8 87b 5 5 6 6 7 6 7 7 6 7 6 7 75
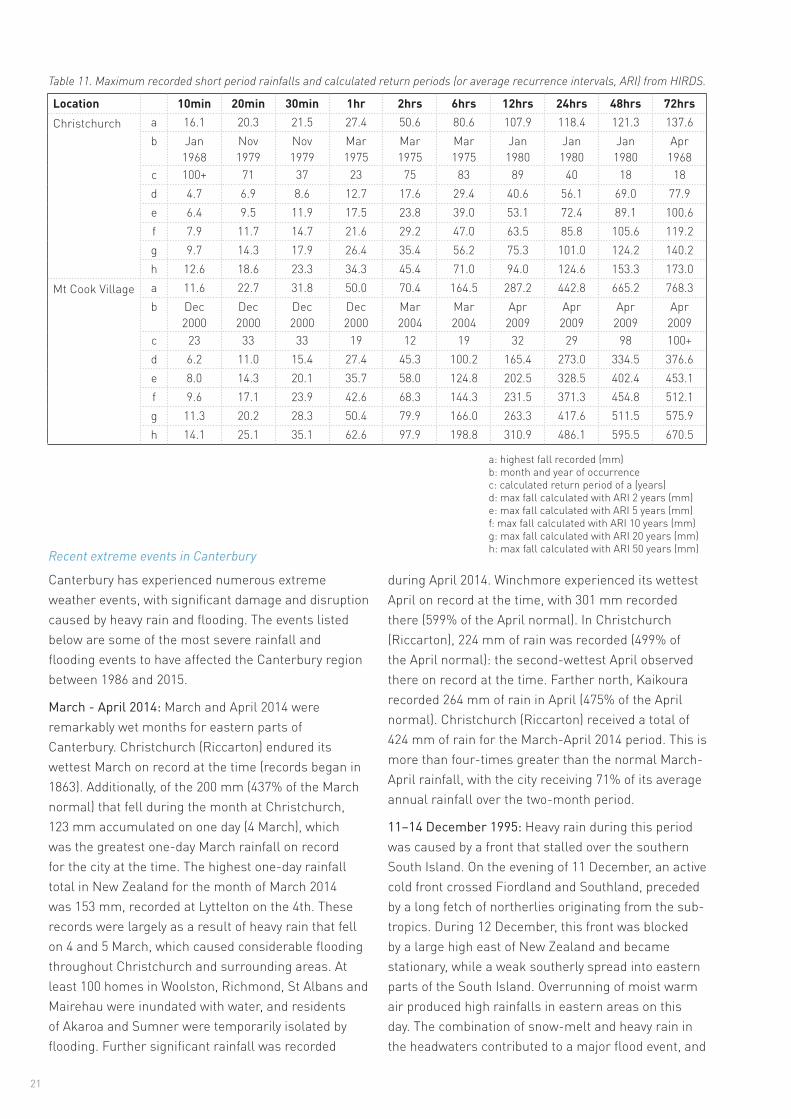
The heaviest short period rainfalls in Canterbury are recorded nearest the main divide, which often occur when persistent west/northwesterly airflows are established as a trough approaches the South Island. For remaining areas of Canterbury, heavy short period rainfalls occur with the passage of a depression over or close to the region, or in association with slow moving fronts. Eastern areas of Canterbury typically experience heaviest 12-hour to 72-hour period rainfall when a depression is centred to the east of the South Island, due to the prevalence of moisture-laden easterly or south-easterly winds under such circumstances. In Table 11, maximum short period rainfalls for periods of 10 minutes to 72 hours with
calculated return periods are given for Christchurch and Mt Cook Village. Also listed in this table are the maximum rainfalls expected in 2, 5, 10, 20, and 50 years. Depth-duration frequency tables for Canterbury locations are available from NIWA’s High Intensity Rainfall Design System (HIRDS). HIRDS uses the index-frequency method to calculate rainfall return periods. For more information on methods and to use the tool, see hirds.niwa.co.nz.
21
Table 11. Maximum recorded short period rainfalls and calculated return periods (or average recurrence intervals, ARI) from HIRDS.
Location 10min 20min 30min 1hr 2hrs 6hrs 12hrs 24hrs 48hrs 72hrsChristchurch a 16.1 20.3 21.5 27.4 50.6 80.6 107.9 118.4 121.3 137.6
b Jan 1968
Nov 1979
Nov 1979
Mar 1975
Mar 1975
Mar 1975
Jan 1980
Jan 1980
Jan 1980
Apr 1968
c 100+ 71 37 23 75 83 89 40 18 18d 4.7 6.9 8.6 12.7 17.6 29.4 40.6 56.1 69.0 77.9e 6.4 9.5 11.9 17.5 23.8 39.0 53.1 72.4 89.1 100.6f 7.9 11.7 14.7 21.6 29.2 47.0 63.5 85.8 105.6 119.2g 9.7 14.3 17.9 26.4 35.4 56.2 75.3 101.0 124.2 140.2h 12.6 18.6 23.3 34.3 45.4 71.0 94.0 124.6 153.3 173.0
Mt Cook Village a 11.6 22.7 31.8 50.0 70.4 164.5 287.2 442.8 665.2 768.3b Dec
2000Dec 2000
Dec 2000
Dec 2000
Mar 2004
Mar 2004
Apr 2009
Apr 2009
Apr 2009
Apr 2009
c 23 33 33 19 12 19 32 29 98 100+d 6.2 11.0 15.4 27.4 45.3 100.2 165.4 273.0 334.5 376.6e 8.0 14.3 20.1 35.7 58.0 124.8 202.5 328.5 402.4 453.1f 9.6 17.1 23.9 42.6 68.3 144.3 231.5 371.3 454.8 512.1g 11.3 20.2 28.3 50.4 79.9 166.0 263.3 417.6 511.5 575.9h 14.1 25.1 35.1 62.6 97.9 198.8 310.9 486.1 595.5 670.5
a: highest fall recorded (mm)b: month and year of occurrencec: calculated return period of a (years)d: max fall calculated with ARI 2 years (mm)e: max fall calculated with ARI 5 years (mm)f: max fall calculated with ARI 10 years (mm)g: max fall calculated with ARI 20 years (mm)h: max fall calculated with ARI 50 years (mm)Recent extreme events in Canterbury
Canterbury has experienced numerous extreme weather events, with significant damage and disruption caused by heavy rain and flooding. The events listed below are some of the most severe rainfall and flooding events to have affected the Canterbury region between 1986 and 2015.
March - April 2014: March and April 2014 were remarkably wet months for eastern parts of Canterbury. Christchurch (Riccarton) endured its wettest March on record at the time (records began in 1863). Additionally, of the 200 mm (437% of the March normal) that fell during the month at Christchurch, 123 mm accumulated on one day (4 March), which was the greatest one-day March rainfall on record for the city at the time. The highest one-day rainfall total in New Zealand for the month of March 2014 was 153 mm, recorded at Lyttelton on the 4th. These records were largely as a result of heavy rain that fell on 4 and 5 March, which caused considerable flooding throughout Christchurch and surrounding areas. At least 100 homes in Woolston, Richmond, St Albans and Mairehau were inundated with water, and residents of Akaroa and Sumner were temporarily isolated by flooding. Further significant rainfall was recorded
during April 2014. Winchmore experienced its wettest April on record at the time, with 301 mm recorded there (599% of the April normal). In Christchurch (Riccarton), 224 mm of rain was recorded (499% of the April normal): the second-wettest April observed there on record at the time. Farther north, Kaikoura recorded 264 mm of rain in April (475% of the April normal). Christchurch (Riccarton) received a total of 424 mm of rain for the March-April 2014 period. This is more than four-times greater than the normal March-April rainfall, with the city receiving 71% of its average annual rainfall over the two-month period.
11–14 December 1995: Heavy rain during this period was caused by a front that stalled over the southern South Island. On the evening of 11 December, an active cold front crossed Fiordland and Southland, preceded by a long fetch of northerlies originating from the sub-tropics. During 12 December, this front was blocked by a large high east of New Zealand and became stationary, while a weak southerly spread into eastern parts of the South Island. Overrunning of moist warm air produced high rainfalls in eastern areas on this day. The combination of snow-melt and heavy rain in the headwaters contributed to a major flood event, and
22
the hydro-lakes were at abnormally high levels. A Civil Defence Emergency was declared for Hakataramea, Waimate and Omarama districts. Seventeen people were evacuated from seven houses at Hakataramea, and 35 people were evacuated from Omarama. Rivers throughout Canterbury were running high. The Waitaki River at the Waitaki Dam had a peak flow of 3,300 cumecs: the highest flow since recordings began 55 years earlier. Farther north, the main trunk railway line was washed out near Rangitata. Mount Cook Village recorded 515 mm of rain in 72-hours from 9 a.m. on 11 December to 9 a.m. on 14 December.
12–13 March 1986: A very intense rainstorm brought flooding to large parts of Canterbury, resulting in very high damage costs and stock losses. Two key features combined to create this extreme event. Firstly, warm and moist air originating from a tropical cyclone near the Kermadec Islands spread down onto the South Island. Secondly, a high-latitude anticyclone brought cool south-easterly air up the east coast of the South Island. Convergence between the cool and warm airmasses resulted in intense convection. The highest rainfalls of the event occurred in the Timaru district and the western foothills of Ashburton, especially near Peel Forest. A Civil Defence Declaration was in place for the entire Canterbury region. The flood damage to property, roads, railway lines, bridges, crops and livestock throughout South Canterbury was extensive, and estimated to cost $60,000,000 (1986 dollars). Other damage costs included another $6,170,000 (1986 dollars) to river control works such as embankments and plantings. Geraldine recorded 102 mm of rain
in the 24-hours from 9 a.m. on 12 March to 9 a.m. the following day, and reported its worst flood since 1929. Rangiora recorded 86 mm of rain in the three hours from 1 a.m. to 4 a.m. on 13 March, and Timaru recorded 100 mm of rain in the 48-hours to 9 a.m. on 13 March.
Periods of low rainfall
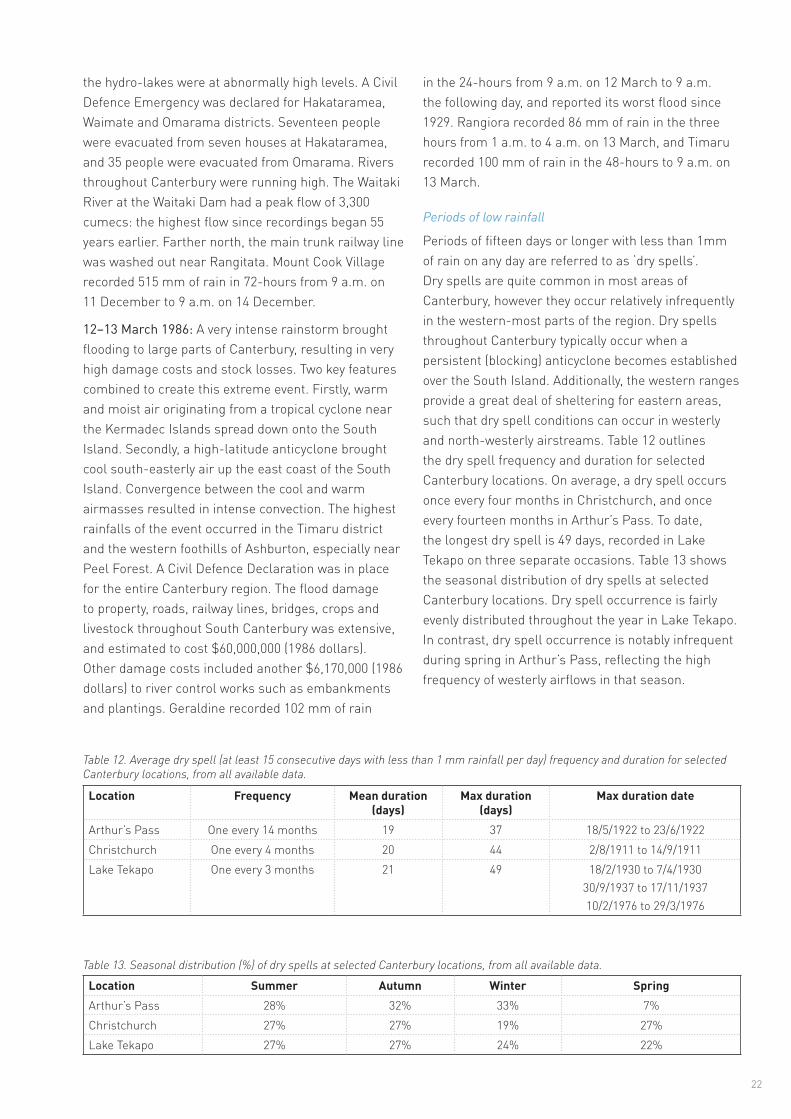
Periods of fifteen days or longer with less than 1mm of rain on any day are referred to as ‘dry spells’. Dry spells are quite common in most areas of Canterbury, however they occur relatively infrequently in the western-most parts of the region. Dry spells throughout Canterbury typically occur when a persistent (blocking) anticyclone becomes established over the South Island. Additionally, the western ranges provide a great deal of sheltering for eastern areas, such that dry spell conditions can occur in westerly and north-westerly airstreams. Table 12 outlines the dry spell frequency and duration for selected Canterbury locations. On average, a dry spell occurs once every four months in Christchurch, and once every fourteen months in Arthur’s Pass. To date, the longest dry spell is 49 days, recorded in Lake Tekapo on three separate occasions. Table 13 shows the seasonal distribution of dry spells at selected Canterbury locations. Dry spell occurrence is fairly evenly distributed throughout the year in Lake Tekapo. In contrast, dry spell occurrence is notably infrequent during spring in Arthur’s Pass, reflecting the high frequency of westerly airflows in that season.
Table 12. Average dry spell (at least 15 consecutive days with less than 1 mm rainfall per day) frequency and duration for selected Canterbury locations, from all available data.
Location Frequency Mean duration (days)
Max duration (days)
Max duration date
Arthur’s Pass One every 14 months 19 37 18/5/1922 to 23/6/1922Christchurch One every 4 months 20 44 2/8/1911 to 14/9/1911Lake Tekapo One every 3 months 21 49 18/2/1930 to 7/4/1930
30/9/1937 to 17/11/193710/2/1976 to 29/3/1976
Table 13. Seasonal distribution (%) of dry spells at selected Canterbury locations, from all available data.
Location Summer Autumn Winter SpringArthur’s Pass 28% 32% 33% 7%Christchurch 27% 27% 19% 27%Lake Tekapo 27% 27% 24% 22%
23
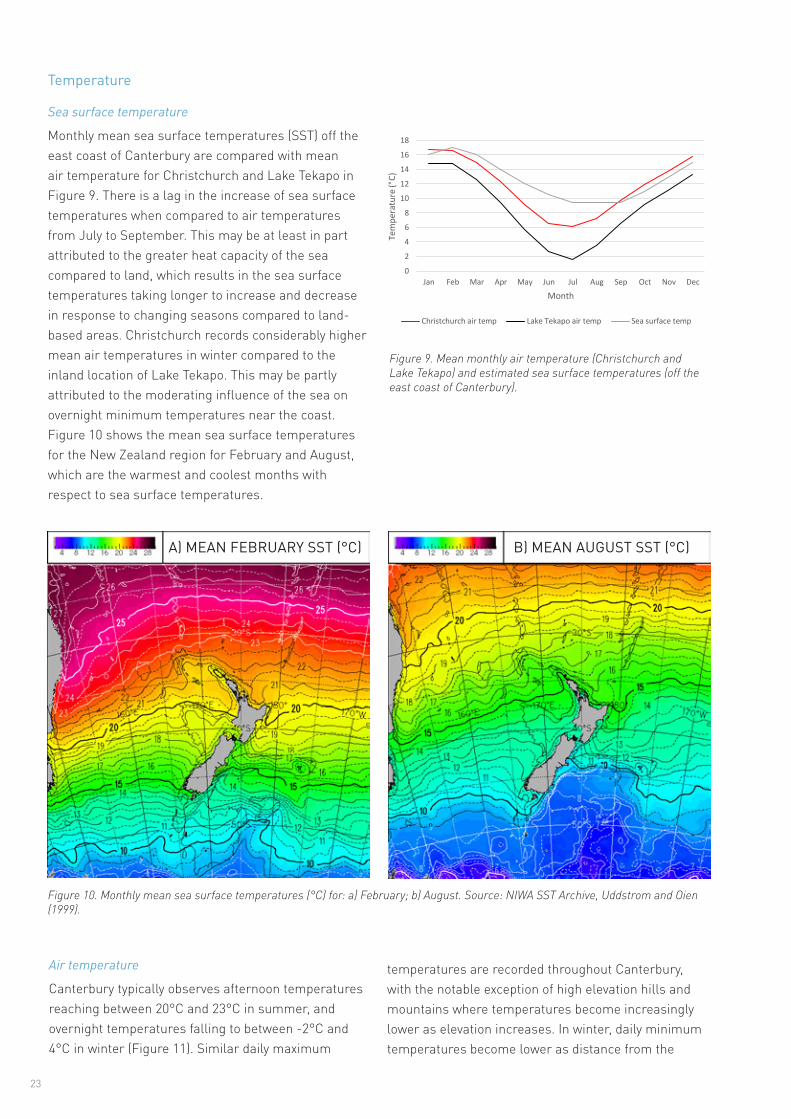
Figure 9. Mean monthly air temperature (Christchurch and Lake Tekapo) and estimated sea surface temperatures (off the east coast of Canterbury).
Figure 10. Monthly mean sea surface temperatures (°C) for: a) February; b) August. Source: NIWA SST Archive, Uddstrom and Oien (1999).
Temperature
Sea surface temperature
Monthly mean sea surface temperatures (SST) off the east coast of Canterbury are compared with mean air temperature for Christchurch and Lake Tekapo in Figure 9. There is a lag in the increase of sea surface temperatures when compared to air temperatures from July to September. This may be at least in part attributed to the greater heat capacity of the sea compared to land, which results in the sea surface temperatures taking longer to increase and decrease in response to changing seasons compared to land-based areas. Christchurch records considerably higher mean air temperatures in winter compared to the inland location of Lake Tekapo. This may be partly attributed to the moderating influence of the sea on overnight minimum temperatures near the coast. Figure 10 shows the mean sea surface temperatures for the New Zealand region for February and August, which are the warmest and coolest months with respect to sea surface temperatures.
Air temperature
Canterbury typically observes afternoon temperatures reaching between 20°C and 23°C in summer, and overnight temperatures falling to between -2°C and 4°C in winter (Figure 11). Similar daily maximum
A) MEAN FEBRUARY SST (°C) B) MEAN AUGUST SST (°C)
temperatures are recorded throughout Canterbury, with the notable exception of high elevation hills and mountains where temperatures become increasingly lower as elevation increases. In winter, daily minimum temperatures become lower as distance from the
0
2
4
6
8
10
12
14
16
18
Jan Feb Mar Apr May Jun Jul Aug Sep Oct Nov Dec
Tem
pera
ture
(°C)
Month
Christchurch air temp Lake Tekapo air temp Sea surface temp
24
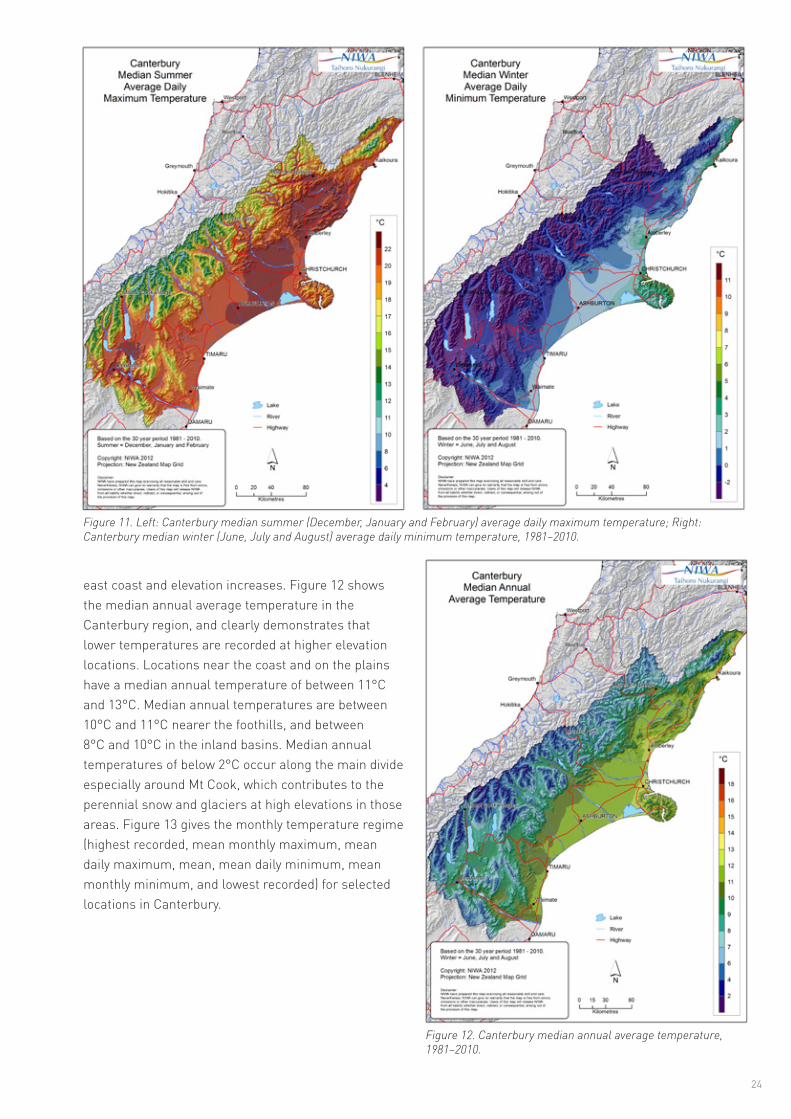
Figure 11. Left: Canterbury median summer (December, January and February) average daily maximum temperature; Right: Canterbury median winter (June, July and August) average daily minimum temperature, 1981–2010.
east coast and elevation increases. Figure 12 shows the median annual average temperature in the Canterbury region, and clearly demonstrates that lower temperatures are recorded at higher elevation locations. Locations near the coast and on the plains have a median annual temperature of between 11°C and 13°C. Median annual temperatures are between 10°C and 11°C nearer the foothills, and between 8°C and 10°C in the inland basins. Median annual temperatures of below 2°C occur along the main divide especially around Mt Cook, which contributes to the perennial snow and glaciers at high elevations in those areas. Figure 13 gives the monthly temperature regime (highest recorded, mean monthly maximum, mean daily maximum, mean, mean daily minimum, mean monthly minimum, and lowest recorded) for selected locations in Canterbury.
Figure 12. Canterbury median annual average temperature, 1981–2010.

25
Christchurch Hanmer Springs Kaikoura
TimaruLake Tekapo
Tem
pera
ture
(o C)
Tem
pera
ture
(o C)
Tem
pera
ture
(o C)
Tem
pera
ture
(o C)
Tem
pera
ture
(o C)
J F M A M J J A S O DN J F M A M J J A S O DN J F M A M J J A S O DN
J F M A M J J A S O DN J F M A M J J A S O DN
-15
-55
1525
3545
-15
-55
1525
3545
-15
-55
1525
3545
-15
-55
1525
3545
-15
-55
1525
3545
Table 14. Average daily temperature range (Tmax – Tmin, °C) for selected Canterbury locations.
Figure 13. Monthly variation in air temperatures for selected Canterbury locations from all available data.
Table 15. Median hourly mean air temperatures for January and July at Christchurch and Lake Tekapo.
Location Jan Feb Mar Apr May Jun Jul Aug Sep Oct Nov Dec AnnChristchurch 10.0 9.7 9.5 9.5 9.3 9.2 9.0 9.3 9.8 10.2 10.4 10.0 9.6Hanmer Springs 13.7 13.8 13.3 12.8 11.8 11.1 11.0 11.8 12.4 12.6 12.8 13.0 12.5Kaikoura 7.5 7.2 6.9 6.5 6.2 5.9 5.7 6.0 6.8 7.3 7.3 7.4 6.7Lake Tekapo 12.9 13.2 12.6 11.3 9.8 8.9 8.8 9.7 10.9 11.6 12.0 12.5 11.2Timaru 10.0 9.7 9.6 9.6 9.3 9.1 9.0 9.3 9.8 10.2 10.4 9.8 9.6
Table 14 shows that the average daily temperature range, i.e. the difference between the daily maximum and minimum temperature, is typically smaller at the coast (e.g. Kaikoura) than in inland areas (e.g. Hanmer Springs). This is the case for most of the year, however the difference is most prominent from January to April. The average daily temperature range in Lake
Highest Recorded
Mean
Mean Daily Maximum
Mean Daily Minimum
Mean Monthly Minimum
Mean Monthly Maximum
Lowest Recorded
00 01 02 03 04 05 06 07 08 09 10 11
Christchurch
January 14.7 14.4 14.0 14.0 13.8 13.7 13.7 14.4 15.7 16.8 17.8 18.8July 5.3 4.8 4.6 4.3 4.0 3.9 3.8 3.7 3.6 3.8 5.4 7.3
12 13 14 15 16 17 18 19 20 21 22 23January 19.3 19.8 19.9 19.8 19.2 18.7 18.1 17.3 16.2 15.7 15.3 15.1July 8.7 9.5 9.9 10.0 9.7 8.9 7.8 7.0 6.5 6.2 6.0 5.6
00 01 02 03 04 05 06 07 08 09 10 11
Lake Tekapo
January 11.4 11.1 10.8 10.3 9.8 9.6 9.5 11.2 13.2 14.8 16.1 17.4July -0.2 -0.3 -0.4 -0.6 -0.7 -0.8 -0.8 -0.9 -0.8 -0.6 0.9 2.6
12 13 14 15 16 17 18 19 20 21 22 23January 18.4 19.3 19.9 20.1 20.2 19.9 19.2 18.2 16.8 14.4 13.2 12.3July 3.8 4.4 5.1 5.4 5.1 4.2 2.0 0.9 0.6 0.6 0.2 0.0
Tekapo isn’t as pronounced as may be expected given its inland location. This is because the town is located at a relatively high elevation (the local climate station is 762 metres above sea level), which constrains the daily maximum air temperatures, particularly during the summer months.
26
Table 16. Highest and lowest recorded air temperatures, average number of days per year where maximum air temperature exceeds 30°C and 25°C, and average number of days per year where the minimum air temperature falls below 0°C, for selected Canterbury locations from all available data.
Figure 14. Median hourly mean air temperatures at Christchurch and Lake Tekapo in January and July.
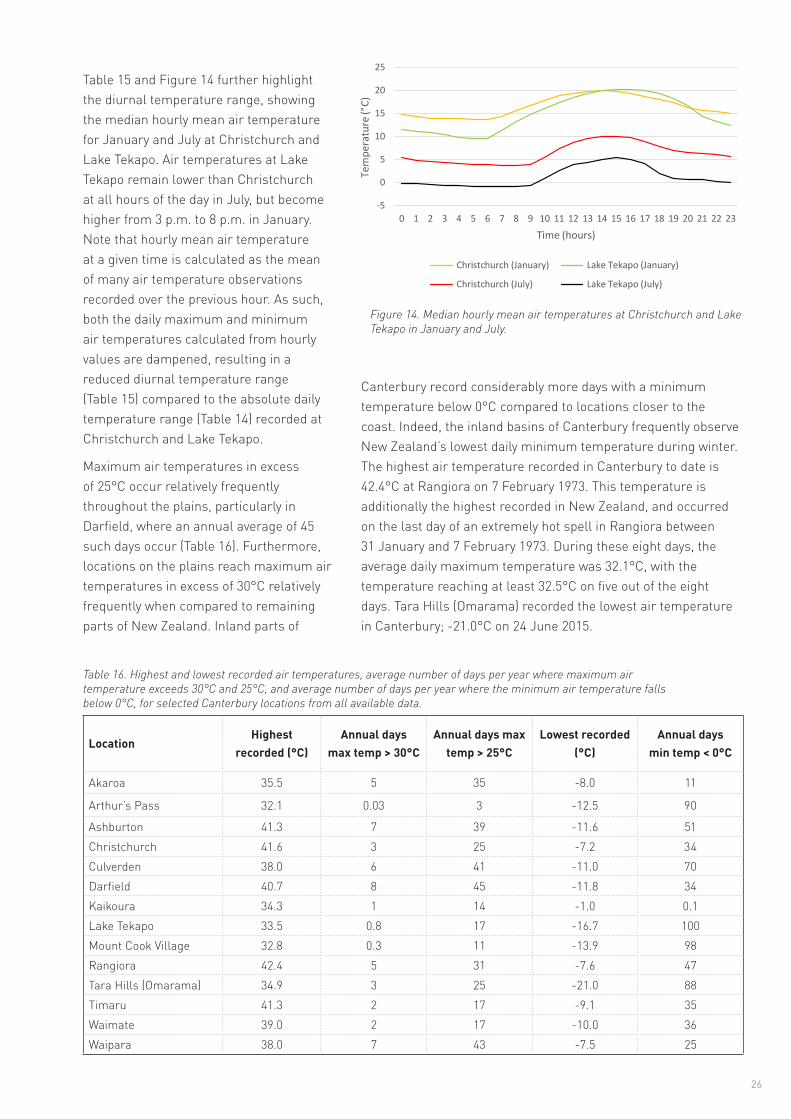
Table 15 and Figure 14 further highlight the diurnal temperature range, showing the median hourly mean air temperature for January and July at Christchurch and Lake Tekapo. Air temperatures at Lake Tekapo remain lower than Christchurch at all hours of the day in July, but become higher from 3 p.m. to 8 p.m. in January. Note that hourly mean air temperature at a given time is calculated as the mean of many air temperature observations recorded over the previous hour. As such, both the daily maximum and minimum air temperatures calculated from hourly values are dampened, resulting in a reduced diurnal temperature range (Table 15) compared to the absolute daily temperature range (Table 14) recorded at Christchurch and Lake Tekapo.
Maximum air temperatures in excess of 25°C occur relatively frequently throughout the plains, particularly in Darfield, where an annual average of 45 such days occur (Table 16). Furthermore, locations on the plains reach maximum air temperatures in excess of 30°C relatively frequently when compared to remaining parts of New Zealand. Inland parts of
LocationHighest
recorded (°C)Annual days
max temp > 30°CAnnual days max
temp > 25°CLowest recorded
(°C)Annual days
min temp < 0°C
Akaroa 35.5 5 35 -8.0 11
Arthur’s Pass 32.1 0.03 3 -12.5 90
Ashburton 41.3 7 39 -11.6 51Christchurch 41.6 3 25 -7.2 34Culverden 38.0 6 41 -11.0 70Darfield 40.7 8 45 -11.8 34Kaikoura 34.3 1 14 -1.0 0.1Lake Tekapo 33.5 0.8 17 -16.7 100Mount Cook Village 32.8 0.3 11 -13.9 98Rangiora 42.4 5 31 -7.6 47Tara Hills (Omarama) 34.9 3 25 -21.0 88Timaru 41.3 2 17 -9.1 35Waimate 39.0 2 17 -10.0 36Waipara 38.0 7 43 -7.5 25
Canterbury record considerably more days with a minimum temperature below 0°C compared to locations closer to the coast. Indeed, the inland basins of Canterbury frequently observe New Zealand’s lowest daily minimum temperature during winter. The highest air temperature recorded in Canterbury to date is 42.4°C at Rangiora on 7 February 1973. This temperature is additionally the highest recorded in New Zealand, and occurred on the last day of an extremely hot spell in Rangiora between 31 January and 7 February 1973. During these eight days, the average daily maximum temperature was 32.1°C, with the temperature reaching at least 32.5°C on five out of the eight days. Tara Hills (Omarama) recorded the lowest air temperature in Canterbury; -21.0°C on 24 June 2015.
-5
0
5
10
15
20
25
0 1 2 3 4 5 6 7 8 9 10 11 12 13 14 15 16 17 18 19 20 21 22 23
Tem
pera
ture
(°C)
Time (hours)
Christchurch (January) Lake Tekapo (January)
Christchurch (July) Lake Tekapo (July)

27
Table 17. Monthly and annual mean 9 a.m. earth temperatures (°C) at varying depths from the ground surface for selected Canterbury locations.
Earth temperatures
Earth (soil) temperatures are measured once daily at 9 a.m. at several Canterbury locations. Earth temperatures are measured at varying depths and are important for determining the growth and development of plants. Different plants have different rooting depths and as such, earth temperatures are routinely monitored at 10, 20, 30, 50, and 100 cm depths. Table 17 lists mean monthly earth temperatures for a number of standard depths. At the coastal Christchurch location, higher winter earth temperatures are observed when compared to the inland location of Tara Hills.
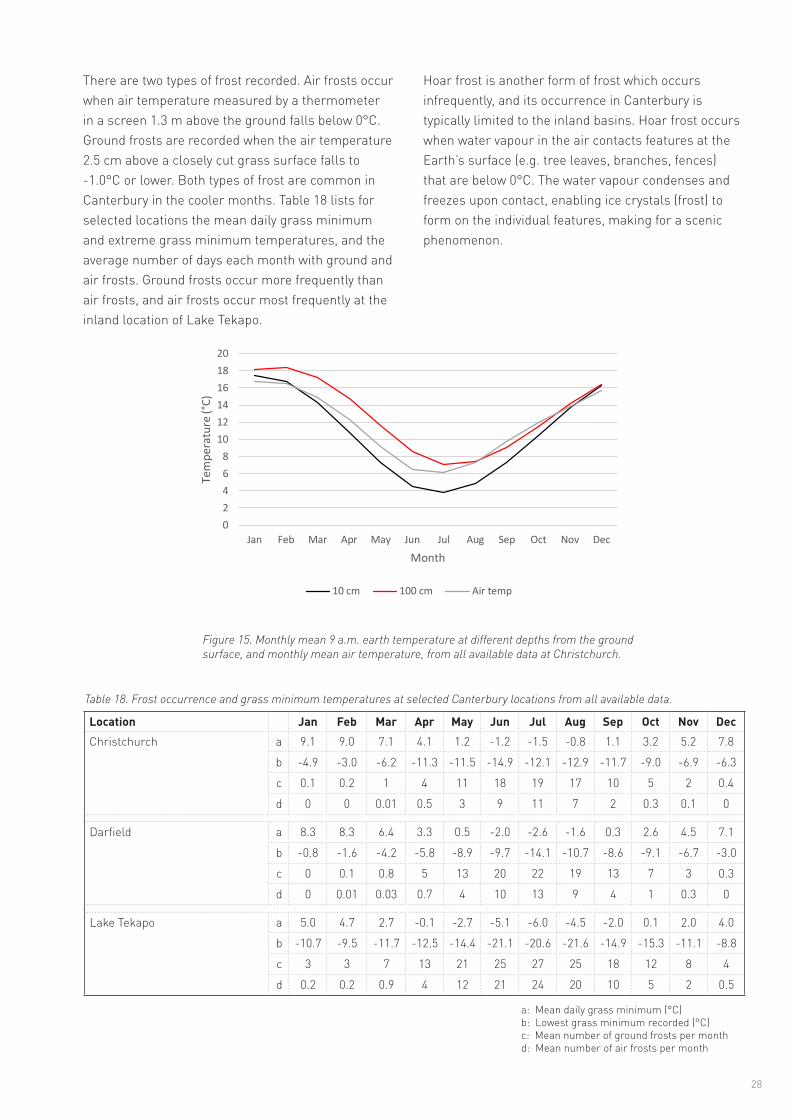
Figure 15 shows how earth temperatures change throughout the year at Christchurch, compared with mean air temperature. The 10 cm earth temperatures are lower than the mean air temperature except during summer. The annual earth temperature cycle at 100 cm depth is more dampened and lagged than at shallower depths. As a result, earth temperatures at 100 cm remain above mean air temperature in June and July, but fall slightly below mean air temperatures during spring, before returning to higher temperatures than the mean air temperature in summer. Diurnal
variation of earth temperatures (not shown) decreases with increasing depth, such that earth temperatures may show little-to-no diurnal variation at 100 cm depth.
Frosts
Frost is a local phenomenon and both its frequency of occurrence and intensity can vary widely over small areas. Frosts occur most frequently in winter during periods of anticyclonic conditions, primarily for two reasons. Firstly, clear skies associated with anticyclones enhance the rate of radiative cooling during the night. Secondly, anticyclones are associated with light winds, which reduces the amount of turbulent mixing of air. Cold air is relatively dense, so when there is a lack of turbulent mixing it tends to sink towards the earth surface. Therefore, areas most likely to experience frost are flat areas, where relatively cold air is not able to drain away on calm nights, and in valleys and basins, where relatively cold air pools after descending from higher elevation areas nearby. Under such conditions, temperature inversions (where the air temperature increases with elevation) are common.
Location Jan Feb Mar Apr May Jun Jul Aug Sep Oct Nov Dec AnnChristchurch 10 cm 17.4 16.7 14.3 10.8 7.3 4.5 3.8 4.8 7.3 10.5 13.7 16.2 10.6
20 cm 18.5 18.1 15.6 12.2 8.4 5.4 4.6 5.7 8.1 11.2 14.5 16.9 11.630 cm 19.2 18.9 16.6 13.3 9.5 6.3 5.4 6.5 8.9 12.0 15.1 17.6 12.5
100 cm 18.1 18.4 17.2 14.8 11.6 8.6 7.0 7.4 9.0 11.4 14.2 16.4 12.9
Rangiora 10 cm 17.3 16.5 14.0 11.2 7.8 5.0 4.3 5.7 8.3 10.7 13.9 16.3 10.820 cm 17.9 17.6 15.7 12.3 9.1 6.2 5.4 6.6 8.8 11.2 14.4 16.7 11.950 cm 17.9 17.8 16.3 13.9 11.1 8.3 6.9 7.7 9.6 11.7 14.5 16.5 12.6
100 cm 17.2 17.7 16.8 15.1 12.9 10.5 8.9 9.0 10.2 11.8 14.0 15.7 13.3
Tara Hills (Omarama) 10 cm 16.7 15.9 13.0 8.5 4.2 1.4 0.5 2.1 5.1 8.8 12.6 15.5 8.720 cm 17.8 17.6 14.6 10.1 5.6 2.4 1.3 2.9 5.9 9.4 13.2 16.2 9.730 cm 18.5 18.2 15.5 11.0 6.3 2.9 1.8 3.3 6.3 10.1 13.8 16.6 10.4
50 cm 18.1 18.5 15.3 11.6 7.7 5.0 3.1 4.2 7.0 9.8 13.2 16.2 11.1
100 cm 17.0 17.8 16.0 13.0 9.3 5.8 3.7 4.4 6.8 9.4 12.6 15.3 11.1
28
Table 18. Frost occurrence and grass minimum temperatures at selected Canterbury locations from all available data.
Location Jan Feb Mar Apr May Jun Jul Aug Sep Oct Nov DecChristchurch a 9.1 9.0 7.1 4.1 1.2 -1.2 -1.5 -0.8 1.1 3.2 5.2 7.8
b -4.9 -3.0 -6.2 -11.3 -11.5 -14.9 -12.1 -12.9 -11.7 -9.0 -6.9 -6.3
c 0.1 0.2 1 4 11 18 19 17 10 5 2 0.4
d 0 0 0.01 0.5 3 9 11 7 2 0.3 0.1 0
Darfield a 8.3 8.3 6.4 3.3 0.5 -2.0 -2.6 -1.6 0.3 2.6 4.5 7.1
b -0.8 -1.6 -4.2 -5.8 -8.9 -9.7 -14.1 -10.7 -8.6 -9.1 -6.7 -3.0
c 0 0.1 0.8 5 13 20 22 19 13 7 3 0.3
d 0 0.01 0.03 0.7 4 10 13 9 4 1 0.3 0
Lake Tekapo a 5.0 4.7 2.7 -0.1 -2.7 -5.1 -6.0 -4.5 -2.0 0.1 2.0 4.0
b -10.7 -9.5 -11.7 -12.5 -14.4 -21.1 -20.6 -21.6 -14.9 -15.3 -11.1 -8.8
c 3 3 7 13 21 25 27 25 18 12 8 4
d 0.2 0.2 0.9 4 12 21 24 20 10 5 2 0.5
a: Mean daily grass minimum (°C) b: Lowest grass minimum recorded (°C) c: Mean number of ground frosts per month d: Mean number of air frosts per month
Figure 15. Monthly mean 9 a.m. earth temperature at different depths from the ground surface, and monthly mean air temperature, from all available data at Christchurch.
There are two types of frost recorded. Air frosts occur when air temperature measured by a thermometer in a screen 1.3 m above the ground falls below 0°C. Ground frosts are recorded when the air temperature 2.5 cm above a closely cut grass surface falls to -1.0°C or lower. Both types of frost are common in Canterbury in the cooler months. Table 18 lists for selected locations the mean daily grass minimum and extreme grass minimum temperatures, and the average number of days each month with ground and air frosts. Ground frosts occur more frequently than air frosts, and air frosts occur most frequently at the inland location of Lake Tekapo.
02468
101214161820
Jan Feb Mar Apr May Jun Jul Aug Sep Oct Nov Dec
Tem
pera
ture
(°C)
Month
10 cm 100 cm Air temp
Hoar frost is another form of frost which occurs infrequently, and its occurrence in Canterbury is typically limited to the inland basins. Hoar frost occurs when water vapour in the air contacts features at the Earth’s surface (e.g. tree leaves, branches, fences) that are below 0°C. The water vapour condenses and freezes upon contact, enabling ice crystals (frost) to form on the individual features, making for a scenic phenomenon.

29
010
020
030
0
010
020
030
0
010
020
030
0
Christchurch
Lake Tekapo
Hanmer Springs
Bri
ght S
unsh
ine
(hou
rs)
Bri
ght S
unsh
ine
(hou
rs)
Bri
ght S
unsh
ine
(hou
rs)
J F M A M J J A S O DN J F M A M J J A S O DN
J F M A M J J A S O DN
Figure 17. Mean, highest and lowest recorded monthly bright sunshine hours for selected locations in Canterbury from all available data.
Sunshine and Solar Radiation
Sunshine
Sunshine hours are highest in the inland basins of Canterbury, which typically receive between 2,100 and 2,300 hours of sunshine annually (Figure 16). Lake Tekapo is frequently one of the top-5 sunniest locations in New Zealand on an annual basis. The remainder of the Canterbury region receives moderate annual sunshine hours compared to the rest of New Zealand. The notable exception is high elevation mountainous areas, where increased cloudiness reduces the annual sunshine totals experienced. Figure 17 shows the monthly mean, maximum, and minimum recorded bright sunshine hours for selected locations in Canterbury. Note that the lower sunshine hours recorded in the winter months tends to reflect the northerly declination of the sun, as opposed to signalling an increase in cloudiness during those times.
Figure 16. Median annual sunshine hours for Canterbury, 1981–2010.
Highest Recorded
Mean
Lowest Recorded
30
Table 19. Mean daily global solar radiation (MJ/m2/day) for selected Canterbury locations from all available data.
Solar radiation
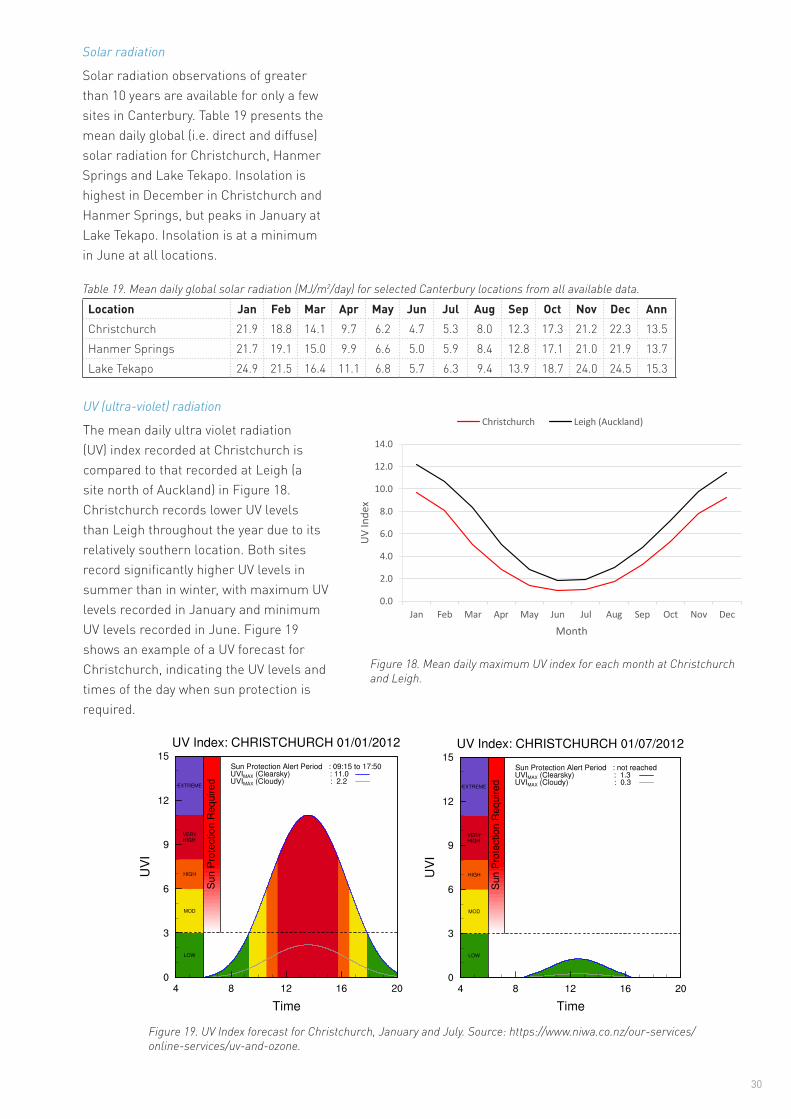
Solar radiation observations of greater than 10 years are available for only a few sites in Canterbury. Table 19 presents the mean daily global (i.e. direct and diffuse) solar radiation for Christchurch, Hanmer Springs and Lake Tekapo. Insolation is highest in December in Christchurch and Hanmer Springs, but peaks in January at Lake Tekapo. Insolation is at a minimum in June at all locations.
Location Jan Feb Mar Apr May Jun Jul Aug Sep Oct Nov Dec AnnChristchurch 21.9 18.8 14.1 9.7 6.2 4.7 5.3 8.0 12.3 17.3 21.2 22.3 13.5Hanmer Springs 21.7 19.1 15.0 9.9 6.6 5.0 5.9 8.4 12.8 17.1 21.0 21.9 13.7Lake Tekapo 24.9 21.5 16.4 11.1 6.8 5.7 6.3 9.4 13.9 18.7 24.0 24.5 15.3
UV (ultra-violet) radiation
The mean daily ultra violet radiation (UV) index recorded at Christchurch is compared to that recorded at Leigh (a site north of Auckland) in Figure 18. Christchurch records lower UV levels than Leigh throughout the year due to its relatively southern location. Both sites record significantly higher UV levels in summer than in winter, with maximum UV levels recorded in January and minimum UV levels recorded in June. Figure 19 shows an example of a UV forecast for Christchurch, indicating the UV levels and times of the day when sun protection is required.
Figure 18. Mean daily maximum UV index for each month at Christchurch and Leigh.
0.0
2.0
4.0
6.0
8.0
10.0
12.0
14.0
Jan Feb Mar Apr May Jun Jul Aug Sep Oct Nov Dec
UV
Inde
x
Month
Christchurch Leigh (Auckland)
Figure 19. UV Index forecast for Christchurch, January and July. Source: https://www.niwa.co.nz/our-services/online-services/uv-and-ozone.
31
Other elements
Snow
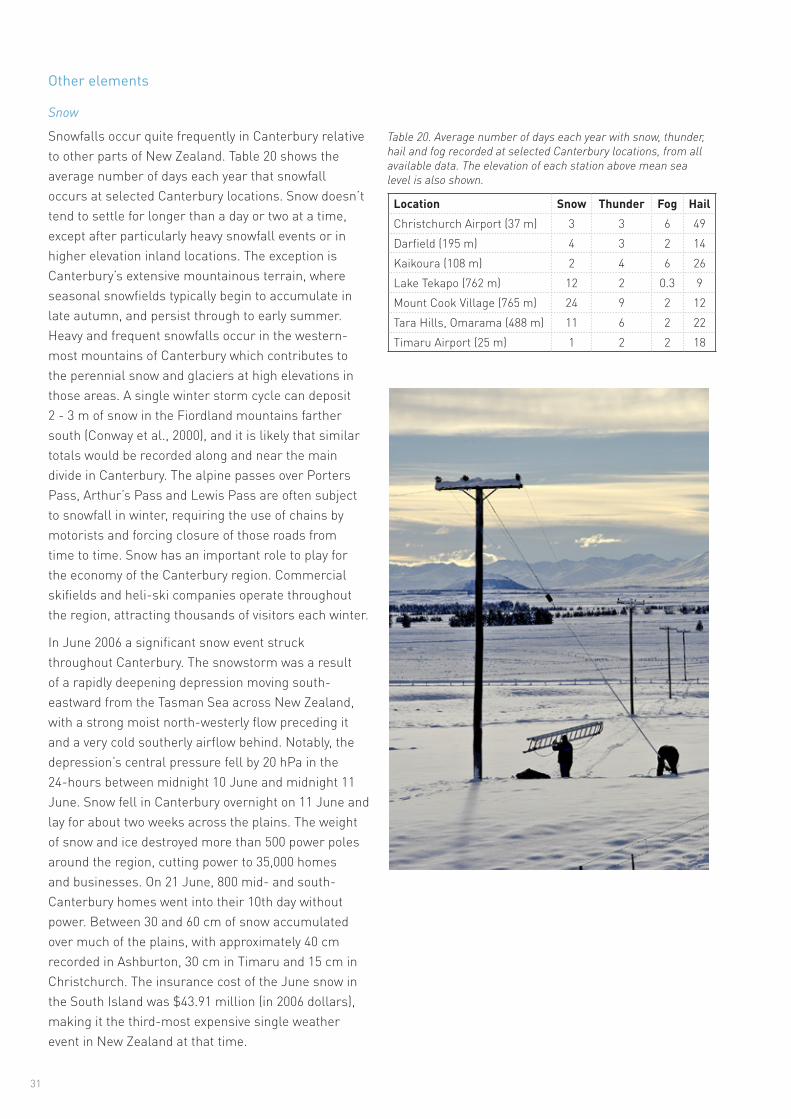
Snowfalls occur quite frequently in Canterbury relative to other parts of New Zealand. Table 20 shows the average number of days each year that snowfall occurs at selected Canterbury locations. Snow doesn’t tend to settle for longer than a day or two at a time, except after particularly heavy snowfall events or in higher elevation inland locations. The exception is Canterbury’s extensive mountainous terrain, where seasonal snowfields typically begin to accumulate in late autumn, and persist through to early summer. Heavy and frequent snowfalls occur in the western-most mountains of Canterbury which contributes to the perennial snow and glaciers at high elevations in those areas. A single winter storm cycle can deposit 2 - 3 m of snow in the Fiordland mountains farther south (Conway et al., 2000), and it is likely that similar totals would be recorded along and near the main divide in Canterbury. The alpine passes over Porters Pass, Arthur’s Pass and Lewis Pass are often subject to snowfall in winter, requiring the use of chains by motorists and forcing closure of those roads from time to time. Snow has an important role to play for the economy of the Canterbury region. Commercial skifields and heli-ski companies operate throughout the region, attracting thousands of visitors each winter.
In June 2006 a significant snow event struck throughout Canterbury. The snowstorm was a result of a rapidly deepening depression moving south-eastward from the Tasman Sea across New Zealand, with a strong moist north-westerly flow preceding it and a very cold southerly airflow behind. Notably, the depression’s central pressure fell by 20 hPa in the 24-hours between midnight 10 June and midnight 11 June. Snow fell in Canterbury overnight on 11 June and lay for about two weeks across the plains. The weight of snow and ice destroyed more than 500 power poles around the region, cutting power to 35,000 homes and businesses. On 21 June, 800 mid- and south-Canterbury homes went into their 10th day without power. Between 30 and 60 cm of snow accumulated over much of the plains, with approximately 40 cm recorded in Ashburton, 30 cm in Timaru and 15 cm in Christchurch. The insurance cost of the June snow in the South Island was $43.91 million (in 2006 dollars), making it the third-most expensive single weather event in New Zealand at that time.
Table 20. Average number of days each year with snow, thunder, hail and fog recorded at selected Canterbury locations, from all available data. The elevation of each station above mean sea level is also shown.
Location Snow Thunder Fog HailChristchurch Airport (37 m) 3 3 6 49Darfield (195 m) 4 3 2 14Kaikoura (108 m) 2 4 6 26Lake Tekapo (762 m) 12 2 0.3 9Mount Cook Village (765 m) 24 9 2 12Tara Hills, Omarama (488 m) 11 6 2 22Timaru Airport (25 m) 1 2 2 18
32
Thunderstorms
Thunder occurs relatively infrequently in Canterbury compared to other regions of New Zealand, with three or fewer days of occurrence per year in Christchurch, Darfield and Timaru (Table 20.) However, thunder occurs more frequently in the west of the region, with Mount Cook Village recording thunder on nine days per year, on average. Due to the localised nature of thunderstorm occurrence, it is possible that not all thunderstorms are detected at each station. Thunderstorms in Canterbury are associated with bouts of high intensity rainfall, lightning, hail, and wind squalls which sometimes cause considerable localised flooding and damage to vegetation and buildings.
Hail
Table 20 gives the average number of days per year on which hail is reported at selected locations. Hail occurs most often at Christchurch and Kaikoura compared with the other locations shown. As with thunder, hail can be a localised event, meaning some falls may escape detection at some stations. Severe hailstorms may be classified as those which cause damage and/or have hailstones of at least 0.5 cm in diameter. One such severe hailstorm occurred in Ashburton late in the afternoon on 17 November 2008. The hail stones were larger than 2.5 cm in diameter, with some reportedly as large as golf balls. The hail smashed glasshouses, skylights and windows, ruined gardens, damaged street lights and shop signs and created hazardous driving conditions. Hundreds of cars were damaged, and local orchardists had their crops decimated. Ashburton Airport recorded 13.6 mm of rainfall in the hour between 4 p.m. and 5 p.m.
Fog
The most common type of fog in the Canterbury basins is radiation fog, formed when the air cools to its dew-point on clear nights, allowing the water vapour in the air to condense. Near the coast, advection fog can occur, where sea fog spreads onto the land as evening cooling proceeds. The average number of days per year with fog for selected locations in Canterbury is listed in Table 20. The frequency of fog varies widely over the Canterbury region, ranging from an average of nine days with fog per year at Lake Tekapo to an average of 49 days per year at Christchurch Airport. Although fog can occur at any time of the year in Canterbury, it is recorded most frequently during late-
autumn and winter. For example, of the annual average of 49 days with fog at Christchurch Airport, 24 days (49%) are recorded between May and August. Similarly at Tara Hills, of the annual average of 22 days with fog there, 11 days (50%) are recorded between these same months.

DERIVED CLIMATOLOGICAL PARAMETERSApart from elements such as temperature and rainfall which can be measured directly, it has been found that parameters calculated from several elements have some important uses, especially in industry. Parameters which define the overall suitability of the climate for agriculture, horticulture, architectural and structural designs, and contracting, etc., are vapour pressure, relative humidity, evapotranspiration (leading to soil water balance), degree-days (thermal time), and rainfall extremes. Some of these and their uses are discussed in the following paragraphs. Note that short-duration high intensity rainfalls have already been addressed in this publication.
Vapour pressure and relative humidityVapour pressure and relative humidity are the two parameters most frequently used to indicate moisture levels in the atmosphere. Both are calculated from simultaneous dry and wet bulb thermometer readings, although a hygrograph may be used to obtain continuous humidity readings.
Vapour pressure is the part of the total atmospheric pressure that results from the presence of water
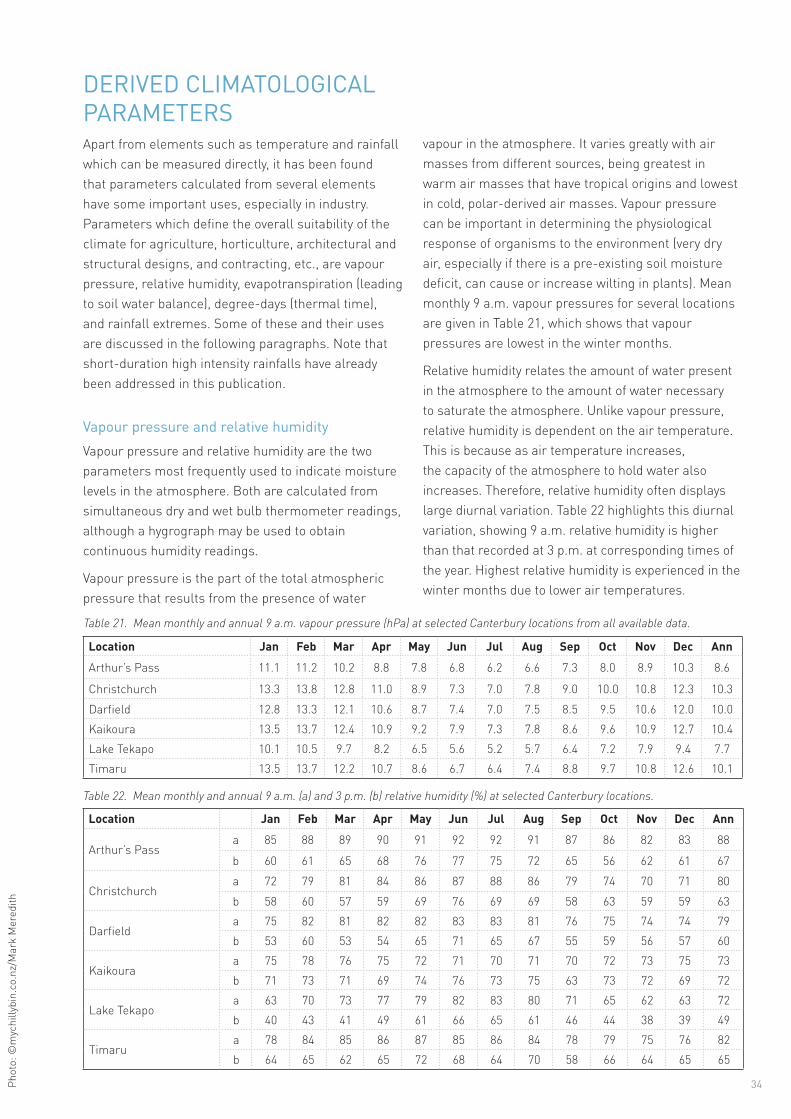
vapour in the atmosphere. It varies greatly with air masses from different sources, being greatest in warm air masses that have tropical origins and lowest in cold, polar-derived air masses. Vapour pressure can be important in determining the physiological response of organisms to the environment (very dry air, especially if there is a pre-existing soil moisture deficit, can cause or increase wilting in plants). Mean monthly 9 a.m. vapour pressures for several locations are given in Table 21, which shows that vapour pressures are lowest in the winter months.
Relative humidity relates the amount of water present in the atmosphere to the amount of water necessary to saturate the atmosphere. Unlike vapour pressure, relative humidity is dependent on the air temperature. This is because as air temperature increases, the capacity of the atmosphere to hold water also increases. Therefore, relative humidity often displays large diurnal variation. Table 22 highlights this diurnal variation, showing 9 a.m. relative humidity is higher than that recorded at 3 p.m. at corresponding times of the year. Highest relative humidity is experienced in the winter months due to lower air temperatures.
34
Table 22. Mean monthly and annual 9 a.m. (a) and 3 p.m. (b) relative humidity (%) at selected Canterbury locations.
Location Jan Feb Mar Apr May Jun Jul Aug Sep Oct Nov Dec Ann
Arthur’s Passa 85 88 89 90 91 92 92 91 87 86 82 83 88
b 60 61 65 68 76 77 75 72 65 56 62 61 67
Christchurcha 72 79 81 84 86 87 88 86 79 74 70 71 80b 58 60 57 59 69 76 69 69 58 63 59 59 63
Darfielda 75 82 81 82 82 83 83 81 76 75 74 74 79b 53 60 53 54 65 71 65 67 55 59 56 57 60
Kaikouraa 75 78 76 75 72 71 70 71 70 72 73 75 73b 71 73 71 69 74 76 73 75 63 73 72 69 72
Lake Tekapoa 63 70 73 77 79 82 83 80 71 65 62 63 72b 40 43 41 49 61 66 65 61 46 44 38 39 49
Timarua 78 84 85 86 87 85 86 84 78 79 75 76 82b 64 65 62 65 72 68 64 70 58 66 64 65 65
Table 21. Mean monthly and annual 9 a.m. vapour pressure (hPa) at selected Canterbury locations from all available data.
Location Jan Feb Mar Apr May Jun Jul Aug Sep Oct Nov Dec AnnArthur’s Pass 11.1 11.2 10.2 8.8 7.8 6.8 6.2 6.6 7.3 8.0 8.9 10.3 8.6
Christchurch 13.3 13.8 12.8 11.0 8.9 7.3 7.0 7.8 9.0 10.0 10.8 12.3 10.3Darfield 12.8 13.3 12.1 10.6 8.7 7.4 7.0 7.5 8.5 9.5 10.6 12.0 10.0Kaikoura 13.5 13.7 12.4 10.9 9.2 7.9 7.3 7.8 8.6 9.6 10.9 12.7 10.4Lake Tekapo 10.1 10.5 9.7 8.2 6.5 5.6 5.2 5.7 6.4 7.2 7.9 9.4 7.7Timaru 13.5 13.7 12.2 10.7 8.6 6.7 6.4 7.4 8.8 9.7 10.8 12.6 10.1
Phot
o: ©
myc
hilly
bin.
co.n
z/M
ark
Mer
edith
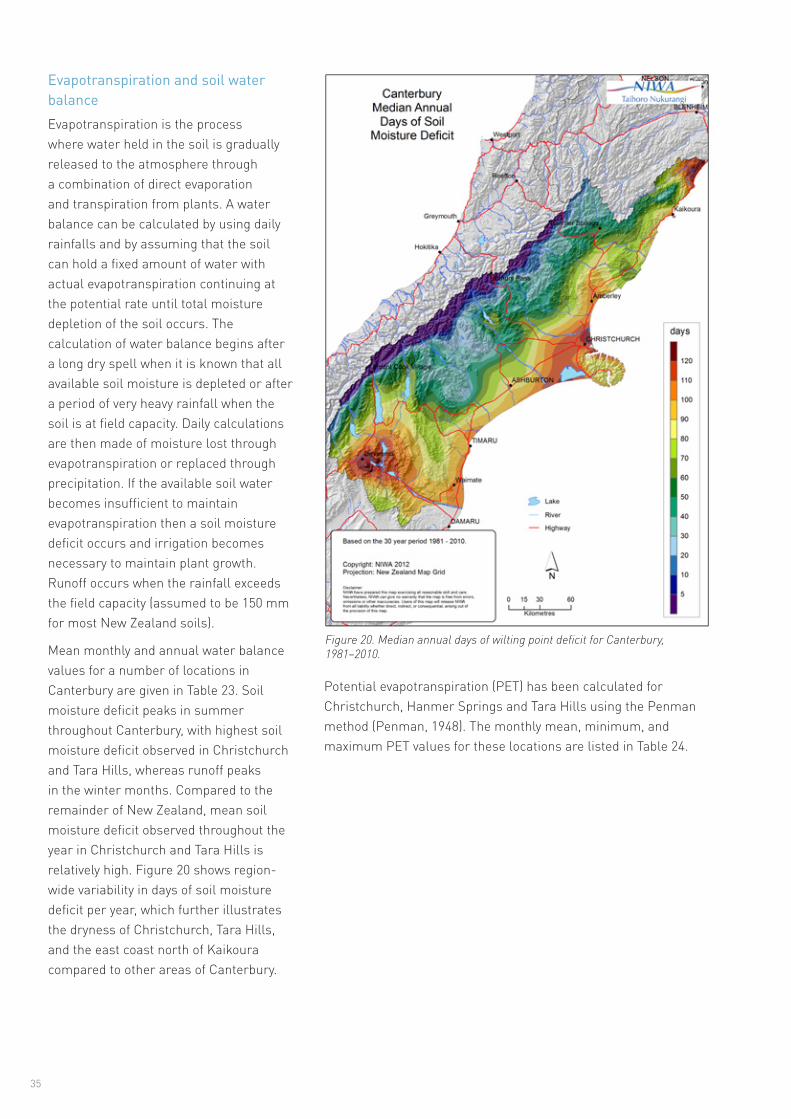
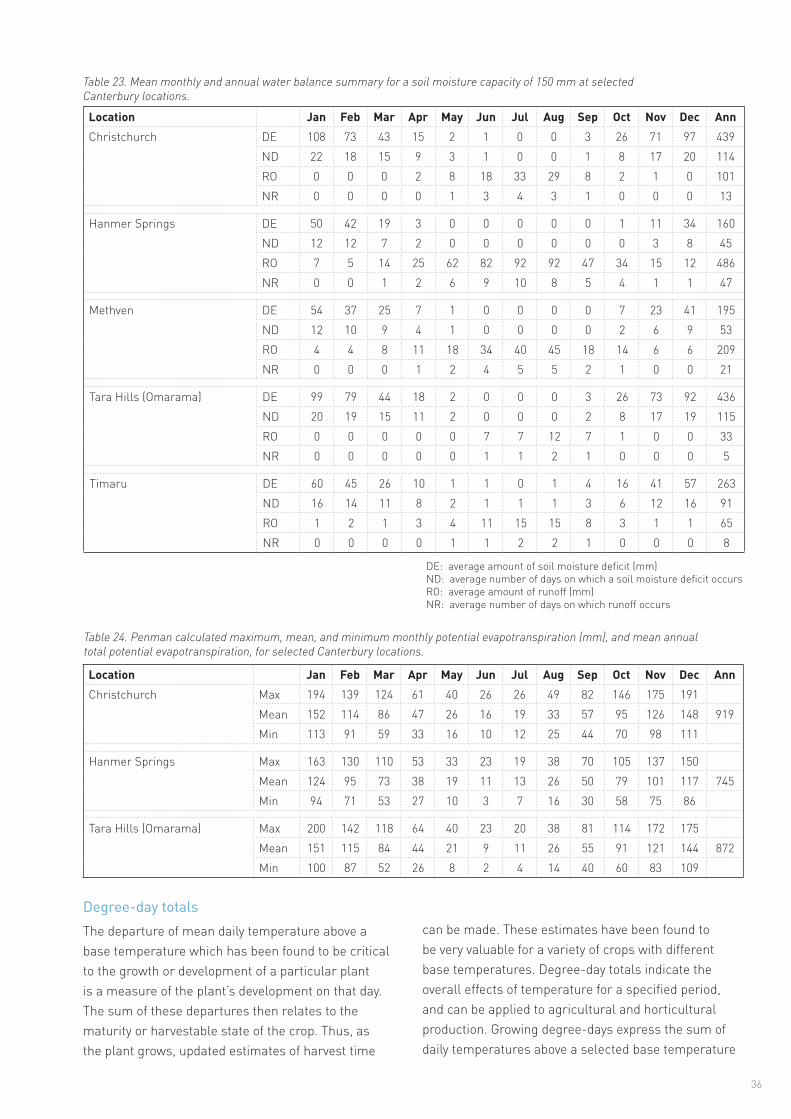
Evapotranspiration and soil water balanceEvapotranspiration is the process where water held in the soil is gradually released to the atmosphere through a combination of direct evaporation and transpiration from plants. A water balance can be calculated by using daily rainfalls and by assuming that the soil can hold a fixed amount of water with actual evapotranspiration continuing at the potential rate until total moisture depletion of the soil occurs. The calculation of water balance begins after a long dry spell when it is known that all available soil moisture is depleted or after a period of very heavy rainfall when the soil is at field capacity. Daily calculations are then made of moisture lost through evapotranspiration or replaced through precipitation. If the available soil water becomes insufficient to maintain evapotranspiration then a soil moisture deficit occurs and irrigation becomes necessary to maintain plant growth. Runoff occurs when the rainfall exceeds the field capacity (assumed to be 150 mm for most New Zealand soils).
Mean monthly and annual water balance values for a number of locations in Canterbury are given in Table 23. Soil moisture deficit peaks in summer throughout Canterbury, with highest soil moisture deficit observed in Christchurch and Tara Hills, whereas runoff peaks in the winter months. Compared to the remainder of New Zealand, mean soil moisture deficit observed throughout the year in Christchurch and Tara Hills is relatively high. Figure 20 shows region-wide variability in days of soil moisture deficit per year, which further illustrates the dryness of Christchurch, Tara Hills, and the east coast north of Kaikoura compared to other areas of Canterbury.
Potential evapotranspiration (PET) has been calculated for Christchurch, Hanmer Springs and Tara Hills using the Penman method (Penman, 1948). The monthly mean, minimum, and maximum PET values for these locations are listed in Table 24.
35
Figure 20. Median annual days of wilting point deficit for Canterbury, 1981–2010.
36
Location Jan Feb Mar Apr May Jun Jul Aug Sep Oct Nov Dec AnnChristchurch DE 108 73 43 15 2 1 0 0 3 26 71 97 439
ND 22 18 15 9 3 1 0 0 1 8 17 20 114RO 0 0 0 2 8 18 33 29 8 2 1 0 101NR 0 0 0 0 1 3 4 3 1 0 0 0 13
Hanmer Springs DE 50 42 19 3 0 0 0 0 0 1 11 34 160ND 12 12 7 2 0 0 0 0 0 0 3 8 45RO 7 5 14 25 62 82 92 92 47 34 15 12 486NR 0 0 1 2 6 9 10 8 5 4 1 1 47
Methven DE 54 37 25 7 1 0 0 0 0 7 23 41 195ND 12 10 9 4 1 0 0 0 0 2 6 9 53RO 4 4 8 11 18 34 40 45 18 14 6 6 209NR 0 0 0 1 2 4 5 5 2 1 0 0 21
Tara Hills (Omarama) DE 99 79 44 18 2 0 0 0 3 26 73 92 436ND 20 19 15 11 2 0 0 0 2 8 17 19 115RO 0 0 0 0 0 7 7 12 7 1 0 0 33NR 0 0 0 0 0 1 1 2 1 0 0 0 5
Timaru DE 60 45 26 10 1 1 0 1 4 16 41 57 263ND 16 14 11 8 2 1 1 1 3 6 12 16 91RO 1 2 1 3 4 11 15 15 8 3 1 1 65NR 0 0 0 0 1 1 2 2 1 0 0 0 8
DE: average amount of soil moisture deficit (mm) ND: average number of days on which a soil moisture deficit occurs RO: average amount of runoff (mm) NR: average number of days on which runoff occurs
Table 23. Mean monthly and annual water balance summary for a soil moisture capacity of 150 mm at selected Canterbury locations.
Table 24. Penman calculated maximum, mean, and minimum monthly potential evapotranspiration (mm), and mean annual total potential evapotranspiration, for selected Canterbury locations.
Location Jan Feb Mar Apr May Jun Jul Aug Sep Oct Nov Dec AnnChristchurch Max 194 139 124 61 40 26 26 49 82 146 175 191
Mean 152 114 86 47 26 16 19 33 57 95 126 148 919Min 113 91 59 33 16 10 12 25 44 70 98 111
Hanmer Springs Max 163 130 110 53 33 23 19 38 70 105 137 150Mean 124 95 73 38 19 11 13 26 50 79 101 117 745Min 94 71 53 27 10 3 7 16 30 58 75 86
Tara Hills (Omarama) Max 200 142 118 64 40 23 20 38 81 114 172 175Mean 151 115 84 44 21 9 11 26 55 91 121 144 872Min 100 87 52 26 8 2 4 14 40 60 83 109
Degree-day totalsThe departure of mean daily temperature above a base temperature which has been found to be critical to the growth or development of a particular plant is a measure of the plant’s development on that day. The sum of these departures then relates to the maturity or harvestable state of the crop. Thus, as the plant grows, updated estimates of harvest time
can be made. These estimates have been found to be very valuable for a variety of crops with different base temperatures. Degree-day totals indicate the overall effects of temperature for a specified period, and can be applied to agricultural and horticultural production. Growing degree-days express the sum of daily temperatures above a selected base temperature
37
Table 25. Average growing degree-day totals above base 5°C and 10°C for selected Canterbury locations.
Table 26. Average cooling (CDD) and heating (HDD) degree-day totals with base 18°C for selected Canterbury locations.
Location Jan Feb Mar Apr May Jun Jul Aug Sep Oct Nov Dec AnnArthur’s Pass 5°C 247 231 187 101 39 11 5 9 35 75 130 200 1268
10°C 99 95 51 9 1 0 0 0 0 4 23 61 344
Christchurch 5°C 365 326 308 218 129 55 47 77 142 216 264 333 248010°C 211 185 154 78 23 4 3 7 28 74 117 178 1062
Darfield 5°C 380 336 315 221 133 58 48 82 142 202 253 328 249910°C 225 195 161 82 26 6 4 9 31 66 110 175 1091
Kaikoura 5°C 358 322 317 244 188 119 99 115 159 208 249 320 269910°C 203 180 162 98 51 20 11 16 37 68 104 166 1117
Lake Tekapo 5°C 307 276 241 136 53 13 7 18 63 132 188 259 169310°C 155 138 96 29 4 0 0 0 5 26 61 113 628
Timaru 5°C 345 306 290 202 111 44 33 63 125 200 245 309 227410°C 190 165 136 62 13 2 1 3 19 58 98 154 903
Location Jan Feb Mar Apr May Jun Jul Aug Sep Oct Nov Dec AnnArthur’s Pass CDD 1 1 0 0 0 0 0 0 0 0 0 0 1
HDD 157 137 216 293 390 456 498 455 376 335 262 203 3779
Christchurch CDD 23 18 8 1 0 0 0 0 0 1 4 14 68HDD 60 59 103 173 275 345 370 332 249 188 130 84 2370
Darfield CDD 32 26 11 1 0 0 0 0 0 1 4 15 91HDD 55 57 99 171 272 348 373 329 250 202 140 90 2386
Kaikoura CDD 19 16 9 1 0 0 0 0 0 0 2 12 60HDD 64 61 96 147 215 272 305 289 231 195 143 94 2113
Lake Tekapo CDD 10 7 1 0 0 0 0 0 0 0 1 2 21
HDD 106 99 164 256 379 459 509 447 342 275 204 146 3385
Timaru CDD 14 10 4 0 0 0 0 0 0 1 2 7 38HDD 72 71 117 188 293 359 389 347 266 204 147 101 2555
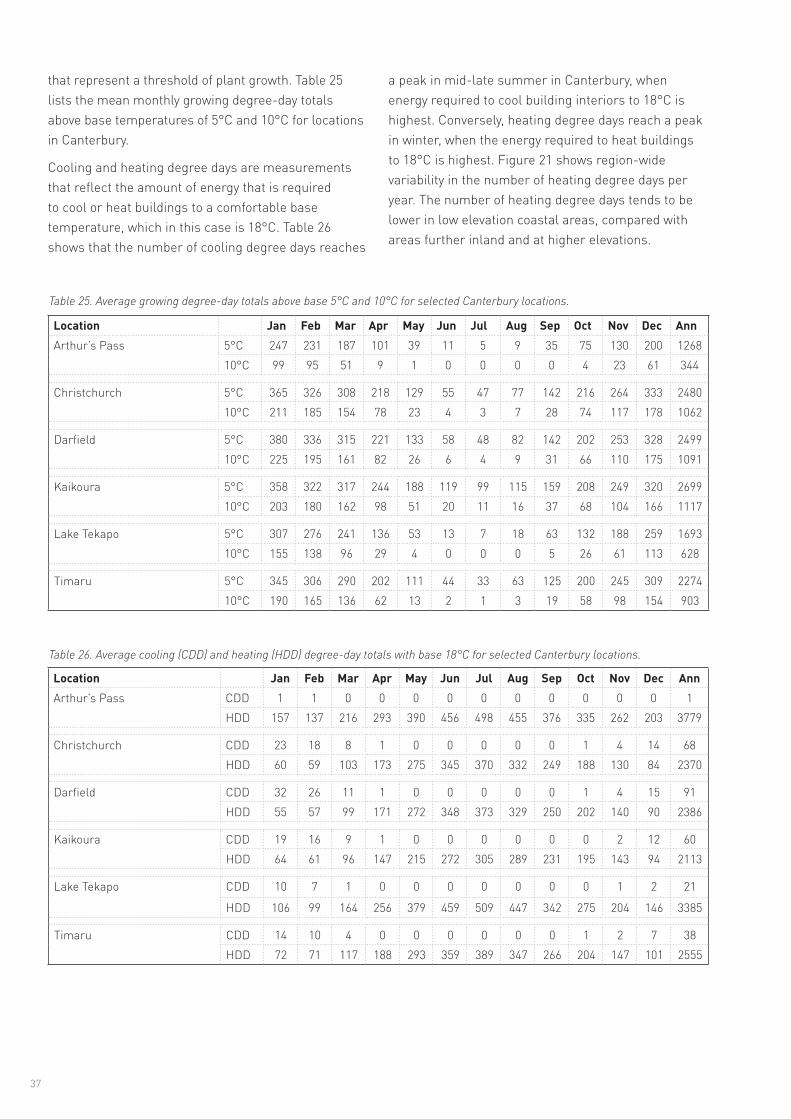
that represent a threshold of plant growth. Table 25 lists the mean monthly growing degree-day totals above base temperatures of 5°C and 10°C for locations in Canterbury.
Cooling and heating degree days are measurements that reflect the amount of energy that is required to cool or heat buildings to a comfortable base temperature, which in this case is 18°C. Table 26 shows that the number of cooling degree days reaches
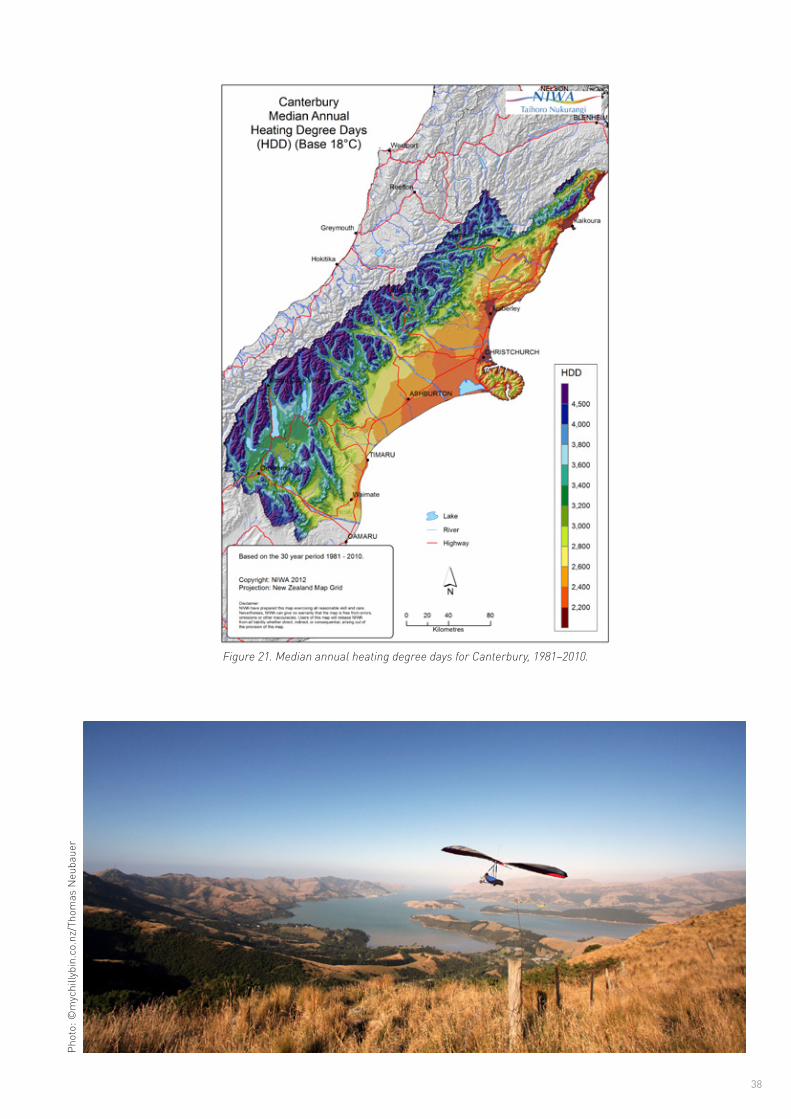
a peak in mid-late summer in Canterbury, when energy required to cool building interiors to 18°C is highest. Conversely, heating degree days reach a peak in winter, when the energy required to heat buildings to 18°C is highest. Figure 21 shows region-wide variability in the number of heating degree days per year. The number of heating degree days tends to be lower in low elevation coastal areas, compared with areas further inland and at higher elevations.
38
Figure 21. Median annual heating degree days for Canterbury, 1981–2010.
Phot
o: ©
myc
hilly
bin.
co.n
z/Th
omas
Neu
baue
r
39
Phot
o: ©
myc
hilly
bin.
co.n
z/M
ark
Mer
edith
40
41
ACKNOWLEDGEMENTSThe following people from NIWA are acknowledged for their contribution to the preparation of this publication: Dr Andrew Tait, Petra Chappell, Erika Mackay, Dr Elizabeth Somervell and Dr Michael Uddstrom.
Photo credits:Contents page, page 11, Dave Allen, NIWAPage 9, 31, Alan Blacklock, NIWA
REFERENCESNIWA databases used:
The National Climate Database cliflo.niwa.co.nz
HIRDS (High Intensity Rainfall Design System) hirds.niwa.co.nz
New Zealand Historic Weather Events Catalogue hwe.niwa.co.nz
NIWA Sea Surface Temperature Database
References:
CONWAY, H., CARRAN, W. & CARRAN, A. 2000. The timing, size and impact of avalanches on the Milford Highway, New Zealand. Proceedings of the International Snow Science Workshop, Big Sky, Montana USA, 167-172.
PENMAN, H. L. 1948. Natural evaporation from open water, bare soil, and grass. Proceedings of the Royal Society of London A, 193, 120-145.
UDDSTROM, M. J. & OIEN, N. A. 1999. On the use of high resolution satellite data to describe the spatial and temporal variability of sea surface temperatures in the New Zealand Region. Journal of Geophysical Research (Oceans), 104, 20729-20751.