Embed Size (px)
Citation preview

For comments, suggestions or further inquiries please contact:
Philippine Institute for Development Studies Surian sa mga Pag-aaral Pangkaunlaran ng Pilipinas
The PIDS Discussion Paper Series constitutes studies that are preliminary and subject to further revisions. They are being circulated in a limited number of copies only for purposes of soliciting comments and suggestions for further refinements. The studies under the Series are unedited and unreviewed.
The views and opinions expressed are those of the author(s) and do not necessarily reflect those of the Institute.
Not for quotation without permission from the author(s) and the Institute.
The Research Information Staff, Philippine Institute for Development Studies 18th Floor, Three Cyberpod Centris – North Tower, EDSA corner Quezon Avenue, 1100 Quezon City, Philippines Tel Numbers: (63-2) 3721291 and 3721292; E-mail: [email protected] visit our website at https://www.pids.gov.ph
The Comprehensive Agrarian Reform Program after 30 Years:
Accomplishments and Forward Options
DISCUSSION PAPER SERIES NO. 2017-34
Marife M. Ballesteros, Jenica Ancheta, and Tatum Ramos
December 2017

THE COMPREHENSIVE AGRARIAN REFORM PROGRAM (CARP) AFTER 30 YEARS:
ACCOMPLISHMENTS AND FORWARD OPTIONS
11 DECEMBER 2017 MARIFE M BALLESTEROS, JENICA ANCHETA AND TATUM RAMOS
Philippine Institute for Development Studies (PIDS)

CARP After 30 Years Draft Final Report
1
List of Acronyms
AGP Average Gross of Production
AO Administrative Order
ARB Agrarian Reform Beneficiary
ARC Agrarian Reform Community
ARF Agrarian Reform Fund
ASP Approved Survey Plan
BARC Barangay Agrarian Reform Council
BIR Bureau of Internal Revenue
CA Compulsory Acquisition
CARL Comprehensive Agrarian Reform Law
CARP Comprehensive Agrarian Reform Program
CARPER Comprehensive Agrarian Reform Program Extension with Reforms
CENRO Community Environment and Natural Resources Office
CF Claim Folder
CLOA Certificate of Land Ownership Award
DA Department of Agriculture
DAR Department of Agrarian Reform
DENR Department of Environment and Natural Resources
ERUL Estimated Remaining Useful Life
FGD Focus Group Discussion
GAA General Appropriations Act
GFI Government Financial Institution
GOL Government-Owned Land
KAMMPhil Kapunungan sa Mamumuong Mag-uuma sa Philippine Greenhills
KII Key Informant Interview
LBP Land Bank of the Philippines
LDIS Land Distribution and Information Schedule
LES Landed Estates
LH Landholding
LMS Land Management Sector
MARO Municipal Agrarian Reform Officer
MC Memorandum Circular
NOC Notice of Coverage
OCT Original Certificate of Title
ODC Owner's Duplicate Copy
OLT Operation Land Transfer
PARO Provincial Agrarian Reform Officer
PD Presidential Decree
RA Republic Act
ROD Register of Deeds

CARP After 30 Years Draft Final Report
2
Abstract
This study evaluates the performance of CARP in the last 30 years using the program’s theory of change.
A results chain framework was constructed and the program processes examined drawing from several
studies that assessed the implementation and impact of CARP. The study notes that the
accomplishments of CARP in terms of land reformed area and number of beneficiaries for the past 30
years have been substantial. However, there is evidence that the program has been poorly targeted in
terms of areas covered and beneficiaries. DAR experienced difficulty in constructing the land inventory
and masterlist of beneficiaries due to the absence of parcel based information on land use and ownership
and the poor land record system in the country. There is also no inventory of farmers or tenants in the
country. Targeting thus has been largely influenced by landowners, local officials including DAR officials at
the local level so as to expedite the process of land tenure improvement. The agrarian justice system
had to deal with conflicts between landowner and ARBS and among ARBs. It also has to deal with cases
on cancellation of titles creating instability in property rights of CARP generated titles. The study also
notes that there is weak evidence of overpricing of the land acquired by the government. The bulk of
subsidy to farmers comes from the amortization subsidy in terms of regular subsidy, and implicit
subsidies such as below market interest rates and non-imposition of penalties for delayed payment.
Impact studies of CARP reported some welfare effects but these are muted and are generally observed
among areas where lands covered have higher productivity. It is also not clear through what channels
CARP improved welfare since welfare effects were similar between land owning agricultural households
that acquired land through CARP and those through purchase or inheritance. There is also no clear
evidence whether the objectives of CARP to increase investments in agriculture, increase access to formal
credit of farmers and equity have been achieved. While the implementation of the program may have
been flawed, redoing land reform by revising the law towards a “genuine” program is unnecessary. Only
a few big-sized agriculture lands (greater than 50 hectares). The objectives of poverty and equity can also
be achieved through alternative programs that is of lower cost to the government. The agrarian sector
should instead focus on support programs to modernize agriculture that will benefit all small farmers
(whether ARB or non-ARB). DAR should consider developing organizations or mechanisms to improve
productivity and address economies of scale. The indefeasibility of CARP issued titles should be
established by facilitating the resolution of issues on conflicts, title cancellation, default on land payments
by ARBs, and transfers of awarded lands. The issue on landownership concentration can be dealt with
through a progressive land taxation that can be supported by the ongoing improvements and digitization
in land administration at the LRA and the DENR.
RP Republic of the Philippines
RSS Requisition of Survey Services
SETT Settlement Area
SMARBEFA San Miguel Agrarian Reform Beneficiaries Farmers’ Association
TCT Transfer Certificate of Title
VLT Voluntary Land Transfer
VOS Voluntary Offer to Sell

CARP After 30 Years Draft Final Report
3
CARP After 30 years: Accomplishments and Forward Options
I. Background of the Study
The Comprehensive Agrarian Reform Program (CARP) was introduced almost three decades ago
with the approval of Republic Act No. 6657 (RA 6657), also known as the Comprehensive Agrarian Reform
Law (CARL) of 1988.1 The program is an expanded version of previous land reform programs in the
country beginning the mid-1930s. Similar to the early land reform initiatives, CARP included both
developmental and redistributive programs. The developmental program provides for the disposal of
public alienable and disposable (A&D) lands with the intent to open up frontier lands while the
redistributive program involves the redistribution of property or rights on private agricultural lands and
the abolition of agricultural (or share) tenancy.
However, while post war land reform was largely a developmental program; CARL is centered on
the redistributive program. In particular, the focus on redistributive land reform started in the 1960s,
with the enactment of the Agriculture Land Reform Code of 1963 (RA 3844), which was further
strengthened by the Agrarian Code of 1972 (or PD27). RA3844 and PD27 decreed the abolition of share
tenancy; instituted a leasehold system; lowered the ceiling on agricultural landownership to 75 hectares
(RA3844) and further to 7 hectares under PD27. The lower retention limits on ownership of agricultural
lands effectively increased the scope of private farms or landholdings that can be subject to land
redistribution.2 The disposal of public alienable and disposable agricultural lands continued but as an
adjunct component under CARP.
Following both RA3844 and PD27, the Comprehensive Agrarian Reform Law (or CARL) adopted
similar mechanisms for leasehold and land transfers. However, while RA3844 and PD27 were
operationalized based on the basic principle of land to the tiller, the CARL has broader objectives. It
adopted the UN definition of land reform which considers “an integrated program of measures designed
to eliminate obstacles to economic and social development due to defects in the agrarian structure” (UN
Progress in Land Reform, 1990). This means CARL has the triple objectives of equity/ social justice,
improvement of farming efficiency and poverty reduction. Moreover, the coverage of CARP was
expanded from primarily rice and corn lands to all agricultural lands; target beneficiaries include both
tenants and farmworkers; and the retention limits on landownership of agricultural lands was set at 5
hectares. Furthermore, support services to agrarian reform beneficiaries were made an integral
component of CARP.
1 Republic Act No. 6657: Comprehensive Agrarian Reform Law of 1988. An Act Instituting a Comprehensive Agrarian Reform Program to Promote Social Justice and Industrialization, Providing the Mechanism for its Implementation, and for Other Purposes. 2 In early land reform programs, the retention limits for ownership of private agricultural lands were set at very high levels – 300 hectares of contiguous lands planted to rice; 600 hectares for corporate farms and 1,024 hectares for private farms other than rice (RA 1400 Land Reform Act of 1955).

CARP After 30 Years Draft Final Report
4
To date, CARP has been implemented for almost 30 years claiming land distribution
accomplishment of over 4.8 million hectares of private and non-private agricultural3; benefitting about
2.8 million agrarian reform beneficiaries or ARBs. The reformed area covers 70 percent of estimated
total non-owner cultivated agriculture land in the Philippines;4 benefitting about 54 percent of agriculture
households in the country.5 Moreover, it has supported the distribution of about 2.5 million hectares of
public A&D lands and issuance of stewardship rights to forest lands and leasehold rights to agricultural
lands not covered by land reform.
Many sectors opined that the land acquisition and distribution accomplishments of CARP have
been noteworthy. However, the “quality” of land distribution accomplishments especially of private
lands is questioned with regard to the type of agriculture lands that have been distributed; the legitimacy
of the land reform beneficiaries; and the indefeasibility of the titles of awarded lands. Moreover, the
implementation of land reform has been significantly delayed. The original phasing of the program
required land distribution to be completed in 1998 or 10 years after the CARP law was signed but the
program suffered from backlogs. CARP implementation was extended to another 10 years. An
amendatory law was again passed in 2009, which extends yet again the deadline for the completion of
land distribution to another five years or by 2014.
The objective of this paper is to review CARP implementation and accomplishments using
secondary sources. Several studies have examined different aspects of CARP. The findings of these
studies are brought together by developing the results chain framework based on the program’s theory
of change. The framework draws together the program inputs, activities and processes so that the
outputs/outcomes of CARP can be better understood. It also lays the groundwork for the
recommendation of program policies to move the agrarian/agriculture sectors forward.
The discussion is divided into seven sections. Section II presents an overview of the land reform
programs in the Philippines focusing on the CARP. Section III discusses the theory of change and
develops the results chain framework for the analysis. Section IV examines CARP implementation and
outputs. Section V discusses the impact of CARP based on the intended effects of the program. Section VI
presents resources provided for CARP implementation. The last section concludes the discussion and
provides forward options for the program.
II. Overview of the Land Reform in the Philippines
Land and tenancy relations are central issues in Philippine agriculture. It is widely viewed that
the historical distortions in the allocation of land resources in the country has caused unfairness in land
3 Non-private lands are government held lands that includes foreclosed properties of government financial institutions that were turned over to CARP, landed estates or haciendas acquired by government from earlier land reform programs; public agricultural lands in settlement areas, public A&D previously Proclaimed for agriculture and resettlement purposes 4Estimated total agriculture land is assumed 70% of A&D. Non-owner cultivated agriculture lands (31%) based on benchmark survey on potential CARP beneficiaries in the 1990s (IARDS 1990). 5 Household population estimates based on 2010 census of estimated number of rural households engaged in agriculture.

CARP After 30 Years Draft Final Report
5
ownership and tenancy relations in agriculture areas and led to the underperformance of the rural
economy. Land reform has been the main strategy of government to address these distortions as shown
in the reform laws dating back from the early 1900s to the present.
The land reform measures were both developmental and redistributive. Developmental reform
involves the distribution of alienable and disposable public agricultural lands while redistributive refers to
the redistribution of private agricultural lands and regulation of tenancy in private lands. The first of
these land reforms was the Friars Land Act of 1902, which was implemented in response to the growing
insurgency problems caused by the excesses of the friars, who controlled most agricultural estates.6 This
Act was followed by the land reform measures that dealt mainly with regulation of tenancy.7 Alongside
these redistributive measures, the distribution of public A&D lands were likewise drummed up. This was
started through the Public Land Act 1936 which was operationalized through Commonwealth Act 691 and
later by RA 1160 or the NARRA Law of 1954.8
During the early years until the early 1960s, the developmental reform gained prominence. In
1955, although government restarted land reform on private lands through the redistribution of the
private landed estates or “haciendas (Land Reform Act of 1955 (RA 1400), the acquisition of landed
estates was not confiscatory but voluntary on the part of the landowner or as requested by a majority of
the tenants (i.e., at least 1/3 of tenants). Also, the retention limit on land ownership for agricultural lands
was set at a very high level, that is, 300 contiguous hectares for private lands planted to rice; 600
contiguous hectares for corporate farms and 1,024 hectares for private farms other than rice.
The subsequent land reforms that followed were considered revolutionary. The Land Reform
Code of 1963 or RA 3844 has been cited as the turning point in land reform legislation. The law instituted
both redistribution of property and rights under the following components: (1) “Operation Leasehold
(OLH),” which was to convert share tenancy to leasehold with the fixed rent at 25 percent of the average
harvest in the three normal years preceding the Operation; and (2) “Operation Land Transfer (OLT),”
which provided for the compulsory acquisition of private lands (individual and corporate farms). The OLT
component lowered the retention limit of ownership of agricultural lands to 75 hectares way below the
limits set under the Land Reform Act of 1955. The Code also reorganized and strengthened land
settlement, legal assistance to tenants and small farmers, created the Land Reform Authority to take over
the activities of the Land tenure Agency (LTA) and the Land Bank to handle the financial aspect of land
acquisition. The 1963 Agrarian Code though has limited impact on the sector due to the insignificant
funding provided by the government for land redistribution. Government budget on land redistribution
under the program was less than P1.0 M for four years (Putzel 1990 p 122).
6 Access by the farmers have been limited because the American government at that time chose not to subsidize the program. The interested farmer or purchaser have to pay land based on prevailing market prices and pay for the cost of surveys and titling. Government supported the farmers mainly through the provision of credit for land purchase at subsidized interest rate (Iyer and Maurer 2009). 7 Rice Tenancy Act of 1933 amended by Republic Act 34 in 1946 and by Agricultural Tenancy Act of 1954 (RA 1199). 8 National Resettlement and Rehabilitation Administration (NARRA)

CARP After 30 Years Draft Final Report
6
In 1972, another land reform law was passed, this time providing for confiscatory and nationwide
implementation of the law. While the program covered only rice and corn farmlands, these farms make
up the bulk of agricultural production at that time. PD27 has increased smallholder family rice and corn
farms. It was intended to address the design limitations of the Land Reform Code of 1963. Presidential
Decree No 2 was first enacted to declare the entire country to land reform in 1971. Thereafter,
Presidential Decree 27 (or PD27) followed adopting the two-step land distribution scheme of the 1963
Code – the Operation Land Transfer (OLT) and Operation Leasehold or Leasehold Operation (LHO)-- but
with significant changes in retention limits and expropriation procedures. Under OLT, lands above the
retention limit of 7 hectares were transferred to tenants through compulsory and confiscatory acquisition
converting tenants into owners of the land they cultivated. Land valuation was based solely on
agricultural production fixed at 2.5 times the annual yield valued at 1972 government support price.9
Eligible tenant farmers received a Certificate of Land Transfer (CLT) issued by the Secretary of Agrarian
Reform, for the land they occupy and cultivate, up to a maximum three hectares if irrigated or five
hectares if unirrigated. For private agricultural lands, the beneficiary pays the land in equal amortization
to the Land Bank at 6% interest within 15 years. Upon completion of amortization, the tenant is deemed
owner and issued a land title called Emancipation Patent (or EP). Land reform under PD 27 was provided
annual budgetary support that allowed the program to have a nationwide coverage.
For the OLH scheme, tenanted rice and corn lands under the 7-hectare retention limit were to be
tilled under fixed rent lease contract with a rental ceiling of 25% of average production for three normal
years (net of the costs of seed, harvesting, threshing, loading, hauling and processing).
The CARP land distribution strategy draws heavily from two earlier laws, RA 3844 and PD27. In
particular, these laws have set in place a reform system that included a combination of land tenancy
regulation, redistribution of private lands and disposal of public lands. The similarities, however end
there. CARP unlike the previous programs has a comprehensive coverage; it has provided support
services to beneficiaries and considered the principle of “just compensation” and other incentives to
landowners to facilitate the land reform process.
In particular, RA 6657 or CARL provided for mechanisms/policies to support the comprehensive
nature of the program and to speed up its implementation thus, achieving CARP’s intended impact. The
key policies/programs are:
Coverage: CARL provided for the coverage of all agricultural lands and natural resources and
included both tenants and regular farm workers (who had been excluded as beneficiaries in the
previous reform Codes).
Exemption: Excluded under the coverage of CARP are military reservations, penal colonies,
educational and research fields, “timberlands”, undeveloped hills with 18 degrees slope and
church areas. Permanent exclusions have been granted on private farms directly, permanently
9 This valuation was similar to Taiwan’s compensation formula in the 1950s. South Korean and Japanese land reform used a compensation factor of 1.25 times and 7 times the annual yield, respectively (Iyer and Maurer 2008). However, PD 27 fixed prices at 1972 government support price of P35/cavan for rice and P31/cavan for corn.

CARP After 30 Years Draft Final Report
7
and exclusively used for prawn farming or fishponds and for commercial livestock and poultry
raising.10
Retention limit: CARL further lowered the ceiling on land ownership of agriculture lands to 5
hectares and allowed additional 3 hectares for each heir (of at least age 15 and actually tilling the
land or directly managing it).
Land valuation and owner compensation: CARL required just compensation on land, which based
land valuation on the following: (1) capitalized net income; (2) comparable sales; and (3) market
or zonal value. Land valuation is primarily the responsibility of the Land Bank which appraises
the property based on the land valuation formula provided by the Department of Agrarian
Reform. Landowners may appeal valuation to the special agrarian court or in the judiciary court,
which is the final arbiter in the determination of just compensation.
Beneficiary repayments and subsidy: Lands that have been paid by government through Land
Bank (i.e., compensable lands) are amortized by beneficiaries over 30 years with 6% annual
interest. Public A&D lands are non-compensable based on the Public Lands Act. Also, non-public
lands except those foreclosed properties of GFIs and the land estates.
Modes to Acquisition of Private Lands: CARL provides for various acquisition modes that includes:
(1) operation land transfer (OLT), the mechanism used for rice and corn lands under PD 27; (2)
compulsory acquisition, a mechanism where government expropriate private lands whether or
not landowner cooperates; (3) voluntary offer to sell (VOS), a mechanism providing incentive for
the landowners to voluntarily offer their land for coverage by raising the cash portion of
landowners’ compensation by five percent and corresponding 5% decrease in the bonds portion;
and (4) voluntary land transfer (VLT), also a voluntary scheme that allows landowners to directly
transfer their lands to tenants and workers under mutually agreed terms between peasants and
landowners on land value and payment terms. The responsibility of DAR under this arrangement
is to ensure that the terms of contract are not less favorable to peasants than if it were the
government purchasing the land.
Non-land transfers: These are land transfers that do not involve actual transfer of land ownership
but changes or improvement of property rights over land assets. The mechanisms include: (1)
Leasehold Operation (LHO), which is a lease agreement between landowner and tenant applied
to agriculture lands not covered by CARP (e.g. below 5 hectares or on retained agriculture lands
10 The land must have been actually, directly and exclusively used for prawn farms and fishponds. In cases were the fishponds or prawn farms have been subjected to CARP, by voluntary offer to sell, commercial farms deferment or notice of compulsory acquisition, they can be exempt from CARP if a simple and absolute majority of the actual regular workers or tenants consent to the exemption within one (1) year from the effectivity of RA 7881 or on 12 March 1995. In cases where the fishponds or prawn ponds have not been subjected to CARP, the consent of the farm workers shall no longer be necessary. In the case of fishponds, while exempted for land distribution, are required to provide profit sharing incentive plan whereby 7.5% of net profit over compensation to workers (DAR AO 3 series of 1995).

CARP After 30 Years Draft Final Report
8
of owners); and (2) Stock Distribution Option (SDO), whereby corporate landowners give their
farm workers the right to purchase a proportion of the capital stock of the corporation in relation
to the value of the agricultural land actually devoted to agricultural activities and in relation to
the company’s total assets (Sec.31 CARL).
Land reform developmental programs. CARP supported the disposition of public agricultural
lands through the DENR.
Agribusiness venture arrangements (AVAs) = CARP encouraged consolidated ownership or
management of agriculture farms/landholdings especially for commercial or export crops
through agribusiness venture arrangements such as lease back, growership, production and
profit Sharing (PPS), etc., as well as block farming. Under AVAs and block farming, lands are
transferred to cooperatives or farmers association or are individually integrated with or without
investors to enable a production system for economies of scale.
Special Agrarian Reform Fund (ARF): ARF is a special fund created for financing the activities of
CARP. The previous land reform programs were funded mainly through budget appropriations.
ARF is funded from the proceeds of the privatization of government assets by the Asset
Privatization Trust (APT) and receipts from sale of assets recovered by the Presidential
Commission on Good Governance (PCGG) from ill-gotten wealth of the Marcos family. The fund
is augmented by general appropriations.
Support Services: Refers to an integrated package of support services to beneficiaries of land
reform. Beneficiaries are assisted in terms of credit, roads, irrigation, post-harvest facilities,
technology transfer and organization to guide them to be farm entrepreneurs.
Agrarian Justice Delivery: CARL includes in the CARP organization agrarian legal assistance and
adjudication of agrarian cases. Legal assistance involves the resolution of agrarian law
implementation (ALI) cases, representation of ARBs by DAR lawyers before judicial and quasi-
judicial bodies and provision of alternative dispute resolution services such as mediation and
conciliation. Adjudication of cases involves the resolution of cases by the DAR Adjudication
Board (DARAB).
III. CARP Theory of Change: Assumptions, Activities, Outputs and Outcomes
It has been widely held that the rural economy’s underperformance especially in terms of
investment, productivity, income growth, poverty is engrained in the long-standing unfairness in land
ownership and tenancy relation in the country. Addressing these inequities is considered necessary to
improve the prospects of agrarian households to have access to and control of agricultural land thus
enabling them to construct viable livelihoods and overcome rural poverty. Private property rights to land

CARP After 30 Years Draft Final Report
9
also provides the incentives to improve farm productivity and to transform small farmers/tenants into
efficient agricultural producers or entrepreneurs.
Figure 1 shows the results chain matrix for CARP that illustrates how the different inputs and
activities of CARP are linked together to achieve the intended impact of increase productivity, household
incomes and investments and reduction in rural poverty.
Figure 1: CARP Results Chain Framework
The inputs of the CARP program include the fund, agrarian reform staff, adjudicator, valuator for
privately-owned lands (Land Bank of the Philippines), and facilities. The Agrarian Reform Fund (ARF) is the
pooled fund allocated for the implementation of the CARP. Under RA 9700, the sources of funding or
appropriations may come from: (1) proceeds of the sales of the Privatization and Management Office; (2)
receipts from the assets recovered and sales of ill-gotten wealth recovered through the Presidential
Commission on Good Government; (3) proceeds of the disposition and development of the government’s
properties in foreign countries; (4) income and collections from agrarian reform operations, projects, and
programs; (5) official foreign aid grants and concessional financing from all countries; (6) yearly
appropriations of at least P5.0 Billion from the General Appropriations Act (GAA); gratuitous financial
assistance from legitimate sources; and (7) other government funds not otherwise appropriated.
CARP After 30 Years Draft Final Report
10
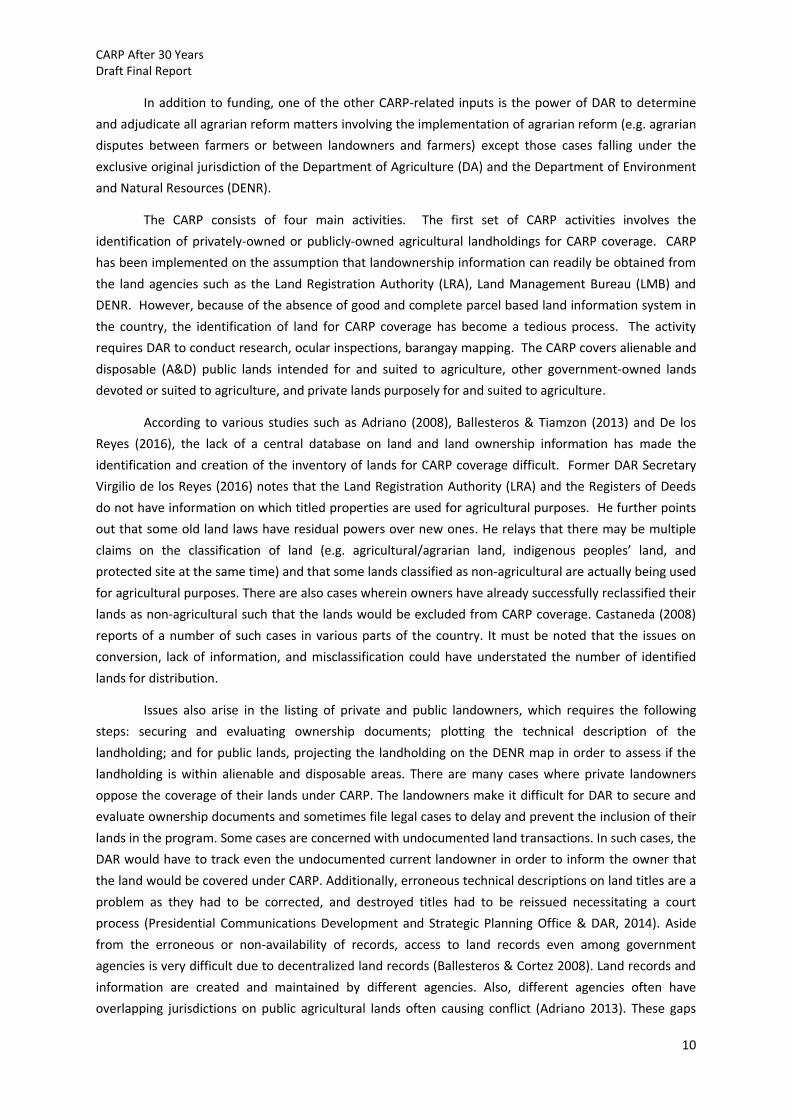
In addition to funding, one of the other CARP-related inputs is the power of DAR to determine
and adjudicate all agrarian reform matters involving the implementation of agrarian reform (e.g. agrarian
disputes between farmers or between landowners and farmers) except those cases falling under the
exclusive original jurisdiction of the Department of Agriculture (DA) and the Department of Environment
and Natural Resources (DENR).
The CARP consists of four main activities. The first set of CARP activities involves the
identification of privately-owned or publicly-owned agricultural landholdings for CARP coverage. CARP
has been implemented on the assumption that landownership information can readily be obtained from
the land agencies such as the Land Registration Authority (LRA), Land Management Bureau (LMB) and
DENR. However, because of the absence of good and complete parcel based land information system in
the country, the identification of land for CARP coverage has become a tedious process. The activity
requires DAR to conduct research, ocular inspections, barangay mapping. The CARP covers alienable and
disposable (A&D) public lands intended for and suited to agriculture, other government-owned lands
devoted or suited to agriculture, and private lands purposely for and suited to agriculture.
According to various studies such as Adriano (2008), Ballesteros & Tiamzon (2013) and De los
Reyes (2016), the lack of a central database on land and land ownership information has made the
identification and creation of the inventory of lands for CARP coverage difficult. Former DAR Secretary
Virgilio de los Reyes (2016) notes that the Land Registration Authority (LRA) and the Registers of Deeds
do not have information on which titled properties are used for agricultural purposes. He further points
out that some old land laws have residual powers over new ones. He relays that there may be multiple
claims on the classification of land (e.g. agricultural/agrarian land, indigenous peoples’ land, and
protected site at the same time) and that some lands classified as non-agricultural are actually being used
for agricultural purposes. There are also cases wherein owners have already successfully reclassified their
lands as non-agricultural such that the lands would be excluded from CARP coverage. Castaneda (2008)
reports of a number of such cases in various parts of the country. It must be noted that the issues on
conversion, lack of information, and misclassification could have understated the number of identified
lands for distribution.
Issues also arise in the listing of private and public landowners, which requires the following
steps: securing and evaluating ownership documents; plotting the technical description of the
landholding; and for public lands, projecting the landholding on the DENR map in order to assess if the
landholding is within alienable and disposable areas. There are many cases where private landowners
oppose the coverage of their lands under CARP. The landowners make it difficult for DAR to secure and
evaluate ownership documents and sometimes file legal cases to delay and prevent the inclusion of their
lands in the program. Some cases are concerned with undocumented land transactions. In such cases, the
DAR would have to track even the undocumented current landowner in order to inform the owner that
the land would be covered under CARP. Additionally, erroneous technical descriptions on land titles are a
problem as they had to be corrected, and destroyed titles had to be reissued necessitating a court
process (Presidential Communications Development and Strategic Planning Office & DAR, 2014). Aside
from the erroneous or non-availability of records, access to land records even among government
agencies is very difficult due to decentralized land records (Ballesteros & Cortez 2008). Land records and
information are created and maintained by different agencies. Also, different agencies often have
overlapping jurisdictions on public agricultural lands often causing conflict (Adriano 2013). These gaps

CARP After 30 Years Draft Final Report
11
and inconsistencies in land information and land records not only makes the identification of the actual
scope of agrarian reform difficult but also prevents realistic planning due to constant changes in scope.
Considering this situation, the inventory of lands for CARP coverage is based on the A&D public
agriculture lands and non-public government lands that are pre-identified for listing under CARP. This
includes landed estates, proclaimed lands, resettlement lands, and lands foreclosed by government
financial institutions (GFI land). For the identification of private agriculture lands for coverage, DAR
relied primarily on its provincial and municipal agrarian reform officials (e.g. MARO, PARO) for land
inventory at the local levels. DAR also provided incentives to landowners to voluntarily offer their lands
for the redistribution under the program through the Voluntary Offer to Sell (VOS) and Voluntary Land
Transfer (VLT) schemes.
The second set of CARP activities pertain to the identification of CARP beneficiaries. Similar to
the state of land information in the country, there is also no Registry of farmers, agricultural workers and
tenants in the country. Beneficiaries are either pre-identified by landowner or identified through listing
method and validation with landowners.
As stated in DAR AO 09 (series of 2011), the basic qualifications of farmers/tillers in order to be
qualified are as follows: (1) landless as defined by RA 6657; (2) Filipino citizen; (3) permanent resident of
the barangay and/or municipality where the landholding; (4) at least fifteen (15) years of age at the time
of identification, screening and selection; and (5) willing, able, and equipped with the aptitude to
cultivate and make the land productive. RA 6657 lists down qualified CARP beneficiaries in order of
priority: (1) agricultural lessees and share tenants; (2) regular farmworkers; (3) seasonal farmworkers; (4)
other farmworkers; (5) actual tillers/occupants of public lands; (6) collectives/cooperatives of the above
beneficiaries; and (7) others directly working on the land. RA 6657 also provides that the BARC11 and the
DAR should assist the potential CARP beneficiaries in listing or registration as potential beneficiaries.
However, the identification and screening of potential beneficiaries is not void of issues. Pre-
identification of beneficiaries are common in voluntary land transfer (VLT) scheme. As mentioned earlier
this scheme is a contract agreement between the landowner and tenant. It is assumed that the
contracting beneficiary is the legitimate beneficiary. However, it might happen that the contract is
between the landowner and persons (e.g. relatives, friends) that act as dummies of the landowner. The
DAR audit report showed patterns in the VLT accomplishments that suggest land reform evasion. It is
estimated that about 70% of VLT beneficiaries are relatives, heirs that are non-tillers or have no interest
in farming (DAR PSRC 2000; Borras 2005).
De los Reyes (2016) noted that conflicts do arise among farmworkers claiming to be the
beneficiaries of lands. Olano (2002) presented a case study of the Guingona Estate, a 609-hectare piece
of land in Bukidnon, which was placed under CARP. There were three groups of farm workers claiming to
be the rightful beneficiaries of the land: San Miguel Agrarian Reform Beneficiaries Farmers’ Association
(SMARBEFA), Kapunungan sa Mamumuong Mag-uuma sa Philippine Greenhills (KAMMPhil), and
PhilTreed. Olano (2002) relayed that the conflict among the three groups caused tension, and there were
many violent incidents in which members of the groups were involved. Also, according to De Los Reyes
11 Under RA 6657, the Barangay Agrarian Reform Committee (BARC) is mandated to assist in the registration of ARBs, assist in the initial determination of the value of the land, act as a mediator and conciliator in agrarian disputes, etc.

CARP After 30 Years Draft Final Report
12
(2016), clear identification tenants only works in tenanted farms such as rice, corn, coconut farms but not
for haciendas/plantation where there are several types of workers e.g. permanent, seasonal, and
temporary farm workers. The law qualifies all types but does not specify guidelines on the qualification
process. This can also lead to farmworker-to-farmworker conflict.
It is important to note that conflicts in coverage and beneficiaries create instability in property
rights. There were observations of cancellation of awards or CARP-issued titles due to conflicts that
emanated from coverage and beneficiary identification. De los Reyes (2016) provided specific details for
cancellation cases filed with DAR Secretary’s Office since 2010.12 From 1 July 2010 until 30 April 2016,
there were 405 cancellation cases decided involving 1,532 CARP issued titles. Of the 1,532 Titles 1,025
(66.91%) were ordered cancelled. Of the 1,025, 827 (80.68%) Titles were cancelled in favor of the former
landowners, while 111 (10.83%) were cancelled in favor of another ARB (De los Reyes 2016 p 35-36). The
balance reverted back to the State. These cancellation cases cover issues on titles issued on retained
lands of owners, land zoned as non-agriculture, and the proper identification of beneficiary.
The third set of activities under CARP includes preparing and approval of land surveys for
subdivision and titling. While DAR provides for the costs and manpower for land surveys and
subdivisions, the inspection, verification and approval of survey plans are the responsibility of the LRA or
the DENR. Delays and problems at this stage are still plausible because of unavailability of land
documents and the absence of a single projection map among land agencies. The absence of single
projection map implies that land boundaries can be erroneous. It requires gathering, securing, collating
land information from DENR and LRA and in some cases reconstruction of documents that cannot be
found in both agencies. There are also issues in the actual conduct of land-use and segregation survey of
the landholding. Land surveys could be improperly conducted in some areas. In fact, there have been
reports of CARP-covered areas that are not really suitable for agriculture. These issues again point to
gaps and errors in land information and the lack of a central database of land information and records.
Another component of land survey activities is land valuation. The land valuation process is
undertaken only on private lands. Private lands include private lands of individuals or corporations; lands
foreclosed by GFIs and landed estates acquired by the government from private individuals or
corporations (LES). On the other hand, non-private agricultural lands and private lands under VLT are not
compensable.13 The government has not or does not acquire them thus these lands do not go through
the valuation process.
In particular, the Land Bank has been tasked to determine land values based on a formula
provided for under the law. Note that CARP adopted programs of PD 27 of 1972 and the land reform
Code of 1963. Lands identified under these lands for redistribution under CARP used the same formula
for land valuation as stated in the previous laws. For instance, land planted to rice and corn can have
different valuation formula based on when the land was considered acquired by government. PD27 has
the simplest valuation- it is based solely on average gross production valued at government support price
12 Before June 2010, the resolution of these cases was diffused to adjudicators in the provincial level. RA9700 revised the process such that all cases filed on cancellation from 2009 onwards are to be filed to the DAR Secretary’s Office, who was given the sole authority to decide on these cases. 13 Voluntary land transfer (VLT) which is a direct payment scheme between the landowner and beneficiary on terms mutually agreed upon by them.

CARP After 30 Years Draft Final Report
13
for rice and corn in 1972.14 The valuation guideline in PD 27 is usually challenged by the landowners on
the basis of violation to the Bill of Rights. 15
On the other hand, land valuation under RA6657 is based on “just compensation” as determined
by (1) capitalized net income from the land; (2) comparable sales; and (3) market or zonal value.
However, the valuation formula was subject to different interpretation because there is no common land
valuation standard (Adriano 2013). Government agencies had different standards on real property
valuation. The just compensation formula was only clarified under RA 9700 of 2009. RA9700 identified
specific information as basis for land valuation such as: (1) the cost of acquisition of the land; (2) the
value of the standing crop; (3) the current value of similar properties, its nature, actual use and income;
(4) the sworn valuation by the landowner; (5) the tax declarations; (6) the assessment made by
government assessors; and (7) 70% of the BIR zonal valuation (translated into a basic formula by DAR). It
also provided for the adoption of the “just compensation” formula for all private agricultural lands for
CARP coverage regardless of program thus doing away with the valuation formula of PD27.
Land valuation activities starts from a joint field investigation of DAR and the Land Bank of the
Philippines (LBP); the preparation of the Land Distribution and Information Schedule (LDIS); the
evaluation of the completeness of the Claim Folders (CFs); the preparation and depositing of the
landowner compensation; and the cancellation of the landowner title and preparation of the title of the
Republic of the Philippines (RP) for each lot/parcel to be issued with a Certificate of Land Ownership
Award (CLOA).
The DAR and the LBP conduct a joint field investigation, and they produce a Field Investigation
Report which contain information on the landowner’s profile; the landholding’s topography, present
physical status, accessibility to roads; the availability of transportation and irrigation; the land use; crops
planted, average gross production, etc. (DAR, n.d.).16 The valuation is then estimated from the
information obtained from the field investigation report.
The fourth set of activities pertains to land titling. Land titling follows after the approval of land
subdivision and survey plans and/or determination of land valuation. As mentioned earlier, land
valuation applies only for compensable lands. However, land titling is not affected by the decision of the
landowner to accept or reject Land Bank valuation of the property. Landowners, who have accepted the
amount offered by the LBP, execute and deliver a deed of transfer to the Republic of the Philippines, and
surrender the Certificate of Title and other muniments of title. Within 30 days, the LBP pays the owner
with the purchase price of the land.17 On the other hand, in case of rejection or the absence of response
14 See footnote 10. 15 Section 9, Article III of the 1987 Philippine Constitution states that -- “Private property shall not be taken for public use without just compensation”. 16 There are cases wherein the DAR and the LBP only discover at this stage that the lands are no longer appropriate for agriculture or that the lands are already devoted to non-agricultural use (2016). Delays can also be caused by objection of the landowners, preventing entry of DAR and LBP officials into the property. DAR Administrative Order No. 09 (AO 09), Series of 2011 seeks to address this constrain by providing DAR (after 15th day notice) the authority to: (1) choose the retention area for the landowner; (2) there will be an initial temporary valuation of the land, treating it as if it were classified as an idle land (DAR AO 09, Series of 2011). 17 RA 6657 provides that the landowner may choose among the following modes of compensation: (1) cash payment (some percentage in cash while the rest would be paid in government financial instruments); (2) shares of stock in government-owned or controlled corporations, LBP preferred shares, physical assets or

CARP After 30 Years Draft Final Report
14
from the landowner on the value offered by the LBP, Land Bank creates a trust account in the name of
the landowner. The landowner may bring the matter to the appropriate courts for final determination of
just compensation. The trust account remains until such time that the landowner accepts or the case
filed in court has been resolved. Thus, land transfer and titling can proceed upon the deposit of the
compensation. The DAR takes immediate possession of the land and requests the appropriate Register of
Deeds for the issuance of a Transfer Certificate of Title (TCT) in the name of the Republic of the
Philippines and to the beneficiaries.
The issues that prevents land titling and transfer are the problems on the approval of land
subdivision surveys and the land registration regulations that are too rigid and formalistic. A substantial
number of land parcels remained outside of the formal system. The existing legal framework to enable
the government agencies to complete the registration of all land parcels is inadequate and the conditions
and the process to complete registration of land for the first time are rigid (Ballesteros and Tiamzon
2016). Constraints caused by judicial control over titles in the registry make the seemingly routine
registry processes like corrections of clerical mistakes, issuance of lost owner’s certificate of titles and
weeding out of fake and spurious certificates, difficult as these requires court processes. There is no
adequate mechanism to ensure consistency of information between the land agencies. Process becomes
tedious and creates uncertainties. These issues not only delays the process but renders land transfers
under the current institutional arrangements unlikely.
A key objective of CARP is to convert tenants, farmworkers, lessees, etc to be owners. This is
completed through the issuance of a land title called Certificate of Land Ownership Award (CLOA) or
emancipation Patent (EP) to the identified beneficiary, which in effect recognizes the title holder as a
registered owner of property in the Philippines.18 In general, the beneficiaries prefer titles issued
individually in their names. However, there are cases when a collective title is preferred by beneficiaries
who are part of a cooperative, an association or a family.19 In past years though, collective CLOAs(CLOA-
C) have been issued to speed up the process of title transfer to beneficiaries that are delayed due to
problems in the approval of land subdivisions and title transfers. The collective CLOA thus becomes a
“mother title” with the names of the individual beneficiaries listed on the title.
IV. Assessment of CARP Implementation and Accomplishments
4.1 Redistributive Land Reform Program (DAR)
4.1.1 Scope Analysis
The DAR scope for redistributive land reform was originally estimated at 3.82 million hectares
and projected to benefit some 1.56 Million farmers and agricultural workers (e.g., share tenants, farm
other qualified investments in accordance with Presidential Agrarian Reform Council (PARC) guidelines; (3) tax credits; and (4) LBP bonds. Prompt payment in the compensation would encourage other landowners in offering the sale of their agricultural land for distribution. 18 Emancipation Patents are titles issued to beneficiaries of the land reform under PD 27 or Operation Land transfer (OLT). 19 For instance, beneficiaries who are a couple or are related as parent and child or siblings.

CARP After 30 Years Draft Final Report
15
workers, and agricultural lessees). This estimate was issued by the Presidential Agrarian Reform Council
(PARC) using the 1980 Census of Agriculture as basis. The program was to be implemented in three
Phases (Table 1). Phase I, which represents 28% of the total area is the priority areas of reform consisting
of rice and corn lands covered under PD 27, idle and abandoned lands, foreclosed and sequestered lands
and government lands foreclosed by government financial institutions, and lands acquired by the
Presidential Commission on Good Government. Phase II covers landed estates and settlement areas
disposed through the early land reform programs and private agricultural farmlands above 50 hectares.
These lands represent 30% of the scope. Phase III consists of a total area of 1.58 million hectares or 41%
of the scope covering private agricultural farms between 5 and 50 hectares.
Among private farms, it is shown that at the beginning of CARP implementation the largest scope
comprised of farms between 5 and 24 hectares; representing 46% of total area of private agricultural
lands. Farms above 50 hectares represent 31% of private lands. This indicates that prior to CARP (that is
around 1988), there are probably few large-scale farms or haciendas. Hayami 1990 and Balisacan 2007
reported a significant reduction in the proportion of operational farm size above 25 hectares around the
1980s. The authors, however, attributed the decline to rapid population growth and the slow expansion
of productive employment in agriculture rather than the earlier land redistribution programs (e.g.
RA3488 and PD27).
In 1992, the incoming DAR administration realized the difficulty of doing realistic planning and
programming without a reliable and comprehensive landholding database. Thus, DAR launched the CARP
Scope Validation Project. The initial results in 1994 indicated that DAR’s CARP Scope increased to 4.29
million hectares and DENR’s share was 3.77 million hectares. DAR also identified the scope using mode of
acquisition as target criteria. Adjustments were again made and in 2006 DAR conducted its Inventory of
the CARP Scope but the inventory by mode was discontinued partly due to difficulty of achieving targets
by mode and that voluntary modes (VOS and VLT) have always exceeded the scope. Similarly, scope by
crop was not given much attention since the “carpet approach” to establish the land inventory was
designed to identify landholdings size regardless of crops planted.20 Crop identification becomes relevant
only for lands that are compensable, which are private lands acquired through OLT, CA, and VOS and
those foreclosed by government financial institutions.
Currently, the DAR CARP Scope is around 5.423 million hectares. Based on DENR-NAMRIA 2013
estimates of the area of private domain, the existing CARP scope of 5.4 million hectares covers already
48% of the total A&D lands privately owned, which includes land for residential, commercial and
industrial uses. This suggests that the DAR land inventory for LAD component has been more or less
completed.
Of the current scope, DAR has already distributed 4,823,027 hectares of land to 2,807,108
agrarian reform beneficiaries (Table 2). The total land reformed area has covered 89% of the total DAR
scope. In most regions accomplishments surpassed the national average. The remaining balance for land
reform are in regions with peace and order concerns (Region V- Bicol and ARRM) and Region 7 or the
20 In the absence of a systematic landownership information in the country, the “Barangay Carpet Approach” was devised to capture this data. The strategy is undertaken at the level of Municipal Agrarian Reform Office (MARO) who supervises Agrarian Reform Program Technologist (ARPT) or enumerators. The ARPTs create a list of landholdings with their corresponding beneficiaries to provide a basis for determining the areas to be covered (Ballesteros and Cortez, 2008).

CARP After 30 Years Draft Final Report
16
Negros Island regions, which are known for its sugar estates. Overall, DAR CARP accomplishments are
substantial covering about 83% of the estimated total titled agricultural lands and untitled agricultural
lands.21
However, in terms of CARP target areas or provinces, CARP fell short of its prioritization
objective. In the initial years of CARP, DAR identified 24 Strategic Operation Provinces (EO 406 of 1990)
which account for 70 percent of the land distribution workload, as the priority provinces. The intent is to
channel and use resources efficiently and effectively where coverage for land distribution is highest. The
SOPs included the provinces of: Pangasinan, Kalinga Apayao, Ifugao, Isabela, Nueva Ecija, Pampanga,
Batangas, Quezon, Mindoro Occidental, Sorsogon, Camarines Sur, Antique, Negros Occidental, Bohol,
Negros Oriental, Leyte, Western Samar, Zamboanga del Sur, Bukidnon, Agusan del Sur, Lanao del Norte,
South Cotabato, North Cotabato and Maguindanao.
Table 3 shows that the prioritization of provinces was not followed. Total land reformed area in
SOP represents only 67% of the target. In non-SOPs coverage was over 100% of scope. The
accomplishment in non-priority areas exceeded the scope by 37 percentage points.22
It was also noted that the overall targets of DAR across provinces were not particularly
consistent with key indicators like the landholding Gini and number of landless farmers (World Bank
2009). Ideally, CARP coverage should be in areas or provinces with large numbers of tenants/landless
workers and in provinces with high number of big landholdings. Correlation analysis show that this was
not the case (Table 4). In general, CARP scope was inversely correlated to the Gini for agricultural
landholding. This means that the CARP scope is not in provinces where there is high concentration of
agriculture landholding. This holds true for both private and non-private lands except for private lands
that are earmarked for compulsory acquisition. On the other hand, while there is a positive correlation
between CARP scope and the extent of landless workers (measured as the ratio of tenants/landless
workers to total farmers) in the province, this is observed only for specific modalities; that is those
identified for compulsory acquisition; those covered under the previous land reform program (Operation
land transfer or OLT) and government lands that are former agricultural estates (e.g. landed estates). For
the voluntary scheme specifically VLT, the relationship is inverse, which means that accomplishments
under this mode are not necessarily happening in provinces or areas where there is high concentration of
tenants or landless workers.
4.1.2 Coverage of Private and Non-Private Agricultural Lands
Around 54% (2,625,547 has.) of the total hectares of land distributed are private agricultural
lands, while around 45% (2,116,033 has.) are of non-private agricultural lands (Table 5). More than half
(about 57%) of the distributed private lands, were voluntarily and/or directly transferred by landowners
to the tenants under the VOS or VLT arrangement. Around 36% of private lands were transferred
21 According to the Land Management Bureau, it is estimated that of the 14.19 million hectares of A&D lands, 4.42 million hectares are titled agricultural lands. Of the 4.56 million hectares of untitled A&D lands, about 30% (or 1.36 million hectares) are classified as agricultural lands. 22 DAR argues that from a legal perspective, the provision of phasing and strategic provinces is only considered as directional rather than mandatory in character. It has been held that the difference between a mandatory and a directory provision is often determined on grounds of expediency (DOJ Opinion No. 9 (1997).

CARP After 30 Years Draft Final Report
17
through compulsory acquisition and confiscatory scheme under PD 27 while 7% are the private lands
foreclosed by government banks and dispensed to DAR for distributed under CARP. It is shown that
voluntary transfers by landowners have been the main mode that facilitated the distribution of private
lands.
Both VOS and VLT are designed to reduce landowners’ resistance to land reform coverage. In
VOS, the landowners voluntarily sell land to the government in return for a higher cash portion of
landowners’ compensation. The VOS scheme caused major controversy in the initial phase of CARP when
the scandal involving coverage of a large tract of land paid at a hefty amount but of little productive value
was exposed (see Garchitorena scandal as cited in Putzel). The scandal opened possibility of marginal
private lands being distributed and of marginal lands paid beyond its market value because of the
scheme’s potential susceptible to abuses.23
The VLT is a different case altogether. Lands covered under VLT provides for a direct payment of
land to beneficiaries on terms mutually agreed between the beneficiaries and landlord with DAR’s role
confined to information provision and contract enforcement. The VLT scheme is convenient specifically
when the issue is insufficient funds. However, audit reports on the VLT transactions reveal the non-
redistributive nature of the scheme (DAR PSRC 2000; Borras 2005). The DAR audit report showed
patterns in the VLT accomplishments that suggest land reform evasion. First, VLT declared children
(including minors), relatives and other dummies as beneficiaries (they are usually non-tillers or have little
desire to till).24 This partitioning of landowner’s property among heirs actually facilitated the inheritance
transfers of private persons with government paying for the costs of subdivision survey and titling (DAR
PSRC 2000 p. ix). Second, VLT accomplishments are sale transactions between non-legitimate ARB
beneficiaries. This is reflected in the DAR accomplishment by size which included farm size below 5
hectares. Third, VLT declared beneficiaries that are beneficiaries only on paper. There is no effective
transfer as the identified beneficiary remained as workers and the title is kept by the landlord on
anticipation of resale after the ten- year rental or sale prohibition. Fourth, VLT beneficiaries were
completely unaware of the transaction. The landlord simply submits land for coverage with list of
beneficiaries who are not aware of the award, ignorant of the landowner and location of the landholding
and not willing to till the land. DAR estimated that as much as 70% of VLT accomplishments are not
transfers to legitimate ARBs (DAR 2000).
Among the distributed non-private agricultural lands, around 58% are constituted by
government-owned lands (GOL). Settlements (SETT) and landed estates (LES) make up around 38% and
4%, respectively. Government-Owned Lands and Kilusang Kabuhayan at Kaunlaran (GOL/KKK) lands are
those owned by government agencies and instrumentalities, including all lands or portions reserved by
virtue of Presidential Proclamations for specific public uses by the government but are no longer actually,
directly and exclusively used or necessary for the purposes for which they have been reserved. These
23 To avoid similar abuses in the future, Executive Order 405 was issued in 1990, which vested upon the Land Bank the primary responsibility to determine land valuation and compensation for all lands covered under RA 6657.23 The EO provided the safeguards in ensuring that lands distributed are not valued on the basis of speculation. 24If a landowner has children, three (3) hectares may be awarded to each subject to the following qualifications: (a) that he is at least fifteen (15) years old as of 15 June 1988; and (b) that he is actually tilling the land or directly managing it (Rep. Act No. 6657 [1988], sec. 6).

CARP After 30 Years Draft Final Report
18
lands were bestowed to DAR by different government agencies. Settlement and landed estates are
mostly carried over from the post-war land reform initiatives.
Most of the settlement areas are the frontier lands provided to the landless that were bestowed
to DAR for administration. Landed estates are the large privately owned agricultural landholdings
(including haciendas) that were already expropriated or acquired by government under different laws
prior to CARP for redistribution to farmers therein. At the time that the CARP was instituted, a
substantial number of the allocated areas in settlements and landed estates had not yet been titled in the
name of the beneficiaries.
Except for the landed estates, other non-PAL lands (e.g. GOL and SETT) are generally of low
productivity or “poor quality” (WB 2009). A significant portion of the GOL/KKK lands were reservations
mandated by Presidential Proclamations. These areas were not yet developed and might not be easily
accessible. Settlement areas are quite similar to GOL/KKK lands since they were delineated from public
domain lands through Presidential Proclamations. Landed Estate areas would represent relatively more
productive lands since these were existing agricultural estates petitioned by the tenants and farmers to
be expropriated or acquired by government and re-sold to them.
Based on the data from the recent survey of agrarian reform beneficiaries (Barrios et al 2015)
the ecosystems of land acquired by through CARP showed that more than one-third of these lands are in
upland areas and more than 40% are non-irrigated farms (Table 6). For GOL/KKK and GFI lands, there is a
larger percentage of lands in upland areas. The crops mainly planted in lowland irrigated lands are palay.
In the lowland non-irrigated land, there are still palay farms but some are also planted to other crops
such as banana, corn, and coconut. In the uplands, the major crops are palay, coconut, corn, and
sugarcane (Table 7).
4.1.3 Individual and Collective Ownership
Almost half of the total number of hectares (around 46% or 2,168,116 hectares) of land
distributed by DAR were issued with collective CLOAs (Figure 3). About 42% of the CLOAs issued to
beneficiaries of distributed private lands are collective in nature, and around 50% of those issued to
beneficiaries of non-private agricultural lands are also collective. More than half of the beneficiaries of
lands acquired through VOS, VLT, GOL, and GFI lands were issued with collective CLOAs. Of the collective
CLOAs issued, GOL/KKK lands have the largest share with 32.7% (708,565 hectares), followed by VLT/DPS
with 20% (432,929 hectares), VOS with 18.7% (405,893 hectares), and Settlement with 15.6% (339,036
hectares) (Table 8).
Most of these collective CLOAs were issued to individual ARBs that are not considered
associations or cooperatives. As mentioned earlier this was the scheme to fast track LAD implementation
mostly during the 1990’s. Initially, this was supposed to be a temporary stage until the subdivision
surveys are conducted and approved. But the subdivision was eventually neglected after the
accomplishment had been reported.
As of January 1, 2016, the remaining balance for subdivision is 848,420 hectares out of the
2,168,116 hectares of lands issued with collective CLOAs. Lands under CA, VOS, OLT, GFI, LES, SETT and
CARP After 30 Years Draft Final Report
19
KKK/GOL, which makes up 579,566 hectares out of the 848,420 hectares are considered priorities for
subdivision (Table 9). While the remaining 268,854 hectares, which are VLT lands under Co-ownership
lands awarded to farmers’ association/cooperatives, are considered non-priorities. The VLT outputs were
not considered priority because it was assumed that the arrangement was part of the agreement
between the landowner and beneficiary. It is also believed that the high number of collective CLOAs
under this scheme reflects the findings with regard to the legitimacy of some transfers (De los Reyes
2016).
4.1.4 Land Valuation and Price Subsidy to ARBs
All private agricultural lands have to be paid by the ARBs either through the Land Bank or directly
to landowners. Beneficiaries of landed estates (LES), which were lands acquired by government prior to
CARP are also under obligation to pay the purchase price of the land directly to the DAR. On the other
hand, beneficiaries of GOL and SETT are in no obligation to pay the land.
Beneficiaries that pay directly to landowners are covered under the VLT mode. Land valuation of
these properties are not the concern of the Land Bank or DAR. So far, the agreements between the
landowner and beneficiary in terms of price and payment have been meritorious for both parties. Cases
of landowner and beneficiary conflicts under this mode is nil.
On the other hand, ARBs under OLT, CA, VOS, GFI and LES are financed by the Land Bank. Land
Bank advances payment to private landowners and the agrarian reform beneficiaries (ARBs) amortize the
loan at 6% interest rate for a period of 30 years.
The Land Bank compensable CARP area covers an area of about 1.79 million hectares or 37.7% of
the total LAD outputs (Table 10). Regions III and NIR have the largest LBP compensable areas and are also
the regions with second and third largest number of ARBs, respectively. Region 12 has the largest non-
compensable lands and also the highest number of ARBs.
Section 17 or RA6657 provides for the basis of land valuation or purchase price of land acquired
by the government. DAR translated Section 17 into a basic formula as follows:
LV = (CNI x 0.0) + (CS x 0.3) + (MV x 0.1)
where LV = Land value
CNI = capitalized net income at 6% interest
CS= comparable sales
MV = market value based on tax declaration
Among these factors, the CNI is given greater weight since the productivity of land is of primary
concern in the valuation. ARBs are also not expected to pay above the actual gross production of land,
which implies that government provides land price subsidy based on the difference between the
payment to the landowner and average gross production of the acquired land.

CARP After 30 Years Draft Final Report
20
Comparatively, PD27 or lands covered by OLT applied confiscatory pricing. DAR has translated
PD27 valuation into a formula whereby land is valued at 2.5 times the average gross production (AGP)
multiplied by government support price.
LV = AGP * 2.5 *GSP
Where AGP = annual average gross production for three consecutive normal years
GSP = government support price fixed at 1972 prices; P50/cavan (or P1.0/kilo) for palay and P 35/cavan
(or P0.70/kilo) for corn.
Since the prices for palay and corn are fixed at 1972 support price, valuation of lands under OLT
is much lower than rice lands valued under RA6657 and RA 9700 provisions. This difference in valuation
for rice and corn lands has partly caused delays in the completion of OLT lands since landowners
contested the application of PD27 valuation formula given that a new land reform law, RA6657 is already
in place. Based on several cases decided upon by the Court of Appeals and the Supreme Court that ruled
on the application of valuation formula under RA 6657 even on OLT lands, DAR issued an administrative
order implementing the decision of the higher courts. DAR AO 17 of 1989 qualified that the application
of CARP valuation formula on OLT shall be defined by the date of taking, which was interpreted to either
mean when Land Bank deposits payment to the landowner’s trust account or when land acquisition
process has commenced.
Under RA9700 or the CARPer law, the land valuation formula was further clarified to avoid
different interpretations on the “date of taking”. The revised CARP law provided that all valuation
including those pending in courts are to completed based on RA6657. The law also included the value of
standing crop and the BIR zonal values as factors for consideration in the valuation.
An examination of the land prices paid by the Land Bank shows different average prices per land
and program type. Average land prices for all modes (except on government lands) show higher prices
under RA9700. For instance, for OLT (rice and corn lands), there were three valuation formula applied.
Under the PD27 valuation formula, average land price is only P5,227/hectare compared to P7,800/ha and
P10,000/ha for RA6657 and RA9700, respectively (Table 11). It appears that the delay in the
implementation of the land reform tend to increase the cost of land acquisition as expansion of
development in rural areas is expected to put upward pressure on land/zonal values
Table 12 shows that the majority of LBP compensable lands are rice and corn farms (including
combined rice and corn lands). These farms account for 57.5% of the total compensable area. Sugar
lands account for 11%; coconut, 18% and commercial crops (rubber, banana, fruit tree) only 2.8%.
Controlling for crop type and mode, the average land values for crops are not necessarily highest under
RA9700. For instance, average land values of rice lands owned by government financial institutions (GFIs)
is only about 1/6 the value of rice lands acquired under RA6657. Likewise, average land values of banana
farms acquired under RA6657 is three times the value under RA9700. For sugar crops acquired through
CA and VOS, average land values are higher under RA9700 compared to RA6657. The reverse is noted in
the case of lands owned by government institution. These differences in prices could be explained by
differences in land productivity.
CARP After 30 Years Draft Final Report
21
We examined land quality in the case of rice farms by estimating the valuation formula on palay
yields and gross revenue under different ecological environment, that is, irrigated, rainfed and upland.
Table 13 shows that in 1993 and 1994, the land compensation values of palay landholdings acquired
based on RA6657 formula are closest to the estimated capitalized income for rainfed areas. This
indicates that rice lands acquired by government during these years are more or less in rainfed areas. In
contrast, the rice lands acquired from 1995 to 1999, are possibly the irrigated areas since the
compensation values are close to or higher than the estimated capitalized income from irrigated palay
farms in the same period. However, from 2000 onwards, the palay farms acquired are possibly rainfed
farms with land compensation less than the estimated CNI for average yield and irrigated rice. For the
period 2010 and 2014, the compensation values are considerably lower than the rainfed values
suggesting that the lands acquired could be lands with low productivity or in upland or remote areas.
The distribution of CARP acquired landholdings by crop shows that palay farms (excluding those
under PD27 valuation), sugar farms and combined farms have the most number of landholdings acquired
valued between P80, 000 and P200, 000 per hectare (Table 14). Overall, 57% of CARP landholdings
(excluding those under PD27/EO228 formula) were acquired at less than P40,000 per hectare. The
purchase of idle lands has gained some concerns. While idle lands are included in the scope of LAD, some
sectors noted that these idle lands are probably non-agriculture lands. However, idle lands cover only
2,426 hectares or 2% of total and most landholdings (78%) acquired were valued at less than P20,000 per
hectare. Moreover, the issue on idle lands can also arise from erroneous land use surveys. In such
cases, Land Bank list the land as idle. The land valuation data does not show evidence of overpricing or
“speculative land prices”.
As of March 2015, of the total 1.54 million hectares acquired by government through Land Bank,
landowners’ compensation amounted to a total of Php69 Billion or an average price of P7,032 per
hectare for claims under PD27; P43,760 per hectare for claims funded through RA6537 and P116,612 for
claims under RA9700 (Table 15). Total land price subsidy including the increase revaluation based on
court decisions amounted to P13.64 Billion or 20% of the amount paid to private landowners. As
expected given the land valuation formula, land price subsidy is lowest for those acquired under
PD27/EO28. Land subsidy per farmer amounts to P1,774 for PD27; P21,073 for RA6657 and P24,985 for
RA9700.
The other portion of the subsidy amounting to P7.5 Billion comes from regular subsidy to farmers
in terms of reduction in the payment of amortization. RA6657 provides that the farmer beneficiaries’
amortization payments for the first five annual payments may not be more than 5% of the value of the
annual gross production as established by DAR.25 In the succeeding years the scheduled annual
payments should not exceed 10% of annual gross production. In addition, in the event that the farmer
beneficiary failed to produce due to fortuitous events not due to beneficiary’s fault, the Land Bank may
reduce the interest rate or reduce principal obligations. The rationale for the regular subsidy is to make
repayments affordable to the beneficiary. An implicit subsidy which is not monitored by the Land Bank is
25 ARBs are only required to pay amortizations as follows: first 5 years, 5% of AGP; after the first year, 10% of AGP. The difference between annual amortizations and the AGP value is the regular subsidy. Subsidy is also given to beneficiaries in fortuitous cases (e.g. typhoon) or when failure to produce accordingly is not due to the beneficiary's fault. The LBP may reduce the interest rate or reduce the principal obligation to make the repayment affordable.

CARP After 30 Years Draft Final Report
22
the subsidy from reduce interest rate. Moreover, no penalty is imposed on delayed amortization
payments.
On the average, the amount to be amortized by each farmer beneficiary is only P61,807. This
amount is even lower for beneficiaries of PD27/EO228; only P10,690 per ARB which is expected since
these properties were acquired under confiscatory pricing. The loan of beneficiaries funded under
RA9700 is highest amounting to around P200,000 per beneficiary.
Despite the large subsidy given to ARBs in terms of amortization subsidies, the collection
performance of ARBs is not encouraging even in the context of cost recovery. As of 2014, there are a
total of 898,952 individual farmers account under the Land Bank ARR system categorize as follows: (1)
PD27/EO228 consisting of 282,326 accounts; (2) RA6657 with 577,666 accounts; and (3) RA9700 with
38,960 accounts. Overall collection performance based on accounts due is 52% on principal and interest
(Table 16).26 About 11% of the accounts have been fully paid but there is also a considerable number of
accounts in default. Accounts in default, which refer to accounts with no payment at all for at least three
years amount to 267,216 accounts or 30% of the total ARR (Table 17). The top three agrarian operation
centers (AOCs) with the highest number of accounts in default are AOCs II, III-2 and V. There is an
apparent disregard of the land payment by some ARBs.
4.1.5 Remaining DAR CARP Balance for Land Distribution
As with RA6657, CARP extension (RA9700) also provided priorities for implementation and
directed DAR to “plan and program the final acquisition and distribution of all remaining unacquired and
undistributed agricultural lands from the effectivity of this Act until June 30, 2014” (RA9700 Sec 7). The
law has indicated possible phasing as follows:
Phase 1: (a) Completion of land distribution on all private agricultural lands with aggregate
landholdings in excess of fifty (50) hectares which have already been subjected to a notice of coverage
issued on or before December 10, 2008; (b) rice and corn lands under Presidential Decree No. 27; (c) all
idle or abandoned lands; all private lands voluntarily offered by the owners for agrarian reform provided
that for voluntary land transfer only those submitted by June 30, 2009 shall be allowed; and (d)
Completion of transfer of all previously acquired lands wherein valuation is subject to challenge by
landowners through the application of Republic Act No. 6657 valuation formula as amended
Phase 2:a) Lands twenty-four (24) hectares up to fifty (50) hectares; (b) all alienable and
disposable public agricultural lands; (c) all arable public agricultural lands under agro-forest, pasture and
agricultural leases already cultivated and planted to crops; (d) all public agricultural lands which are to be
opened for new development and resettlement: and (e ) all private agricultural lands of landowners with
aggregate landholdings above twenty-four (24) hectares up to fifty (50) hectares which have already been
subjected to a notice of coverage issued on or before December 1O, 2008.
26 This does not include the advance payments made by farmers with no existing land information schedules yet (LDIS). Accounts with no LDIS occur due to incomplete documentation which is part of the redocumentation activities currently being undertaken by the DAR

CARP After 30 Years Draft Final Report
23
Phase 3: All other private agricultural lands commencing with large landholdings and proceeding
to medium and small landholdings under the following schedule: (a) Lands of landowners with aggregate
landholdings above ten (10) hectares up to twenty- four (24) hectares; (b) Lands of landowners with
aggregate landholdings from the retention limit up to ten (10) hectares.
As of end 2016, which is the expected completion of the land distribution component of CARP
under RA9700, DAR has yet to distribute a gross area of 603,206 hectares (Table 18). The regions with the
highest percentage of balance to scope are Region V, NIR, and ARMM with 20.9%, 29.3%, and 33.4%
respectively as these contain contentious lands. One-third of this balance are problematic landholdings,
which are landholdings that cannot be process for acquisition and transfer due to several problems such
as succession and land transfer issues, land title and survey issues, coverage and land use issues, peace
and order issues, ARB conflicts and others.
Problematic landholdings cover an area of 148,168 hectares (Table 19). Of the problematic
landholdings, 17% have land survey issues; 56% involve landholdings with problems on land titling – e.g.
succession/land transfer issues; basic document flaws and infirmities; lost titles; titles with no tech
description, etc.
There is no recent information on the details of the LAD balances. However, from earlier data (as
of end 2014) it was reported that the bulk or 85% of the remaining landholdings are planted to three
major crops which are: rice and corn (36%); coconut (30%) and sugar (19%) (Table 20). Sugar farms
specifically will be subject to land distribution in lieu of the repeal on stock distribution (or SDO) as an
option for land reform. Commercial crops, which were deferred for 10 years from 1988, have only a
remaining balance of 22,000 hectares or 3% of the total LAD balance by the end of 2014.
Moreover, from the earlier data, about one-third of the LAD balance comprise of farms above 50
hectares primarily in Regions VI and ARMM (Table 21) shows that DAR has yet to complete the
distribution of landholdings above 50 hectares as of the start of 2015. Only about 10% of the LAD
balance are landholdings with sizes greater than 24 hectares to 50 hectares. The remaining areas
accounting for 60% of the LAD balance consist mainly of medium to small-sized landholdings (i.e, 24
hectares and below). Excluding the areas from 10 and below, total LAD balance on private agricultural
lands would amount to a gross area of 465,447 hectares. About 61% of this area is found in Regions VI, V
and ARMM.
4.1.6 Non-Land Transfer Accomplishments: Leasehold and Stock Distribution Options
a. Leasehold Arrangement
The abolition of share tenancy and installation of LHA began much earlier than the
implementation of CARP. Specifically, RA 3844, Sec. 4, declared share tenancy to be contrary to public
policy and was abolished except in the case of fishponds, saltbeds, and lands principally planted to citrus,
coconuts, cacao, coffee, durian and other similar permanent trees at the time of the approval of said Act
(Section 35). When RA 6389 (1971) was enacted, agricultural share tenancy has been automatically
converted to leasehold but the exemptions remained. CARP supported the abolition of share tenancy

CARP After 30 Years Draft Final Report
24
and the exemptions provided under the earlier laws were expressly repealed under RA6657. The
Leasehold Agreement (LHA) was thus established for all agricultural production activities.
A leasehold arrangement exists when “a person who, either personally or with the aid of labor
available from members of his immediate farm household undertakes to cultivate a piece of agricultural
land, which is subject of cultivation by a single person together with members of his immediate farm
household, belonging to or legally possessed by, another in consideration of a fixed amount in money or
in produce or in both” (RA 1199 [1954]. The LHA is intended to protect the tenurial status of tenant
farmers in landowners’ retained areas and to establish tenants as entrepreneurs through the execution
of leasehold contract with a fixed sharing arrangement.27 Unlike share tenancy, LHA is not a joint
undertaking between the landowner and tenant farmers but the tenant himself has control over farm
management.
Leasehold Operations cover retained lands (or tenanted small farms) whereby DAR is expected
to regulate and monitor in terms of lease rental and other lease arrangments. However, DAR does not
have a database of leasehold contracts. Its merely a listing with no details of contracts. As explained by
DAR, it is possible that cases of renewed or recurring LH contracts which has already been accounted for
in their previous accomplishment reports are again posted as part of new accomplishments resulting into
double counting. DAR has yet to start the process of reviewing LHA accomplishments to enable an
accurate and systematic recording of accomplishment.
Data from the 1991 Census of Agriculture and Forestry (CAF) shows that the largest share (44%)
of the total parcels cultivated which is nearly 2.1 million parcels were fully owned (Table 22). With CARP
being implemented for only three years in 1991, it is not surprising that a relatively big proportion (20%)
were tenanted parcels. Parcels under leasehold arrangements comprised nearly 6% only although the
incidence of rent free lots was high at 14%. The low share of parcels under lease contradicts the DAR
data which showed that in 1991, DAR exceeded targets by four times. This could be attributed to the
double counting of accomplishments which was discussed earlier.
The 2002 CAF data, which covers only the first 10 parcels cultivated/managed by the
farmers/farm owners, shows that of the total 3,451,767 parcels, the proportion of fully owned parcels
remained to be the same at 44%. The share of tenanted parcels also hardly changed at all, from 20% to
19%. Similarly, the percentage of leased parcels practically remained the same.
Results of socio-economic surveys conducted in several areas in the country and among different
crops revealed that sharecropping is still being practiced and in some cases dominant (Urbis, 2003;
UPLBFI, 2007; UPLBFI, 2010). Moreover, old sharing agreements are applied particularly for coconut.
Tenants agree to stick to the old share tenancy arrangements because it addresses the risks involved in
farming. Some farmers prefer share tenancy because in the event of force majeure such as typhoons and
droughts, the landowner provides credit and financing for production in the following season.
27 The lease arrangement is based on a 75-25 sharing of net harvest in favor of the farmer.

CARP After 30 Years Draft Final Report
25
b. Stock Distribution Option
The Stock Distribution Option (SDO) is a scheme started under CARP. This scheme of non-land
transfer was applied primarily on sugar farms wherein the farmworkers become stock owners and are
given the rights to purchase capital stocks, equities or shares from the corporate landowners and
association. With the shares of stocks, they are entitled to dividends and other financial benefits and
representation in the seat of the board of directors. They also acquire management rights in the
corporate farm concerned.
As of June 10, 1993, a total of 88 applications have been filed under the SDO. However, when
the Supreme Court exempted livestock and poultry, the number of coverable cases decreased and out of
those left as coverable, 13 applications had been approved covering 7,703 hectares (Table 23). HLI’s area
comprise around 64% (or 4,916 hectares) of the total area of the 13 corporations and its FWBs is nearly
three-fourths (75%) of total beneficiaries.
In 1994, the then Institute of Agrarian Studies conducted a study that aimed to make an initial
assessment of the SDO in selected corporations, namely the Hacienda Luisita, Inc. (HLI); Arsenio Al. Acuna
Agricultural Corporation (AAAC) which is a merger of corporations; Ledesma Hermanos Agricultural
Corporations (LHAC); and Sycip Plantation, Inc. (SPI) (Penalba, Bravo, Reynoso, Cuarteros, Lopez and
Sanchez, 1994). The study noted that the corporations were given flexibility in implementing the SDO.
For instance, in the distribution of stocks, HLI provided for a 30-year period of stock distribution, one-
thirtieth of which will be distributed to farm-worker beneficiaries (FWBs) yearly. Meanwhile, the three
other corporations provided for the immediate distribution of stocks with the option of buying additional
stocks of about 7-10 percent of the shares of stocks. All the corporations provided the share of stocks to
the FWBs which were valued proportional to the value of agriculture land. However, in the case of HLI,
the land assets were excessively undervalued thus reducing the value of stock to the beneficiaries (Putzel
1992). With regard to the number and qualifications of FWBs, all corporations, except SPI, considered all
workers, regardless of whether they are regular, seasonal and migratory, including supervisory workers.
SPI included only regular workers.
The study further revealed that benefits to the FWBs also varied. Benefits received by the FWBs
include the provision of cash dividends, free homelots/housing, guaranteed production shares or
incentives, and continuation of the provision of existing benefits. All the corporations with the exception
of HLI extended alternative provisions (e.g., guaranteed bonus/dividends) in case of non-payment of
dividends as planned. Moreover, the findings showed that the major difference in the income and
benefits received by the FWBs lies only on the receipt of dividends accruing to the shares of stocks of
FWBs and the provision of guaranteed bonus in case of the inability to issue dividends due to financial
constraints. Hence, only the dividends make the FWBs different from other ordinary farm workers since
the provision of the other benefits is actually contained in the CBA and reiterated in the stock option
plan.
It was also pointed out that unlike in the land transfer scheme, ARB or FWBs under the SDO do
not participate in the decision-making process. This tend to create factions among FWBs often those
oppose to management as against those who favor the management eventually leading to decisions to
nullify the SDO and revert to a land transfer scheme.

CARP After 30 Years Draft Final Report
26
FWBs in ten of 13 the SDO corporations, 10 corporations have already filed a Petition for
Cancellation. Of those corporations with Petition for cancellation, the petition on the HLI has been
already granted, which revoked the Stock Distribution Plan (SDP) that Tarlac Development Corporation
(TADECO) executed with its spin-off corporation HLI and its 6,296 qualified farmworkers-beneficiaries
(FWBs). The DAR approval was made in 2005 but was contested by HLI. Finally, on July 5, 2011, the
Supreme Court upheld the decision of PARC (G.R. No. 171101). As a result, the DAR issued the Notice of
Coverage (NOC) to the 4,916 hectares of HLI lands under the Compulsory Acquisition coverage of the
CARP and land distribution is currently being undertaken.
Meanwhile, DAR is also reviewing the conditions of the FWBs in all SDOs considering that
provisions of the contracts between FWBs and corporations were not examined thoroughly. Moreover,
the concerned DAR Provincial Offices were not required to monitor the FWBs and the corporations to
ensure that terms stipulated in the contract are followed.
The AA Acuña Agricultural Corp is also another major case for SDO cancellation. The Corporation
is a merger of six companies (Archie Fishpond, Inc.; Arsenio Al Acuña Agricultural Corp.; Elenita
Agricultural Development Corporation; Ma. Clara Marine Ventures, Inc.; Palma Kabankalan Agricultural
Corporation; and Tabigue Marine Ventures, Inc.). The FWBs petitioned for the revocation of the SDO
from the corporation but instead of doing so, the Task Force on SDO of DAR Region VI was ordered to
initiate negotiation between representatives of AA Acuña Agricultural Corp. and the FWBs to improve the
terms stipulated in the Memorandum of Agreement (MOA) between the two parties. Meanwhile, the
revocation petitions of FWBs of three companies (Calatrava Negros Occ., Inc., SVJ Farms, Inc., and Asia
Agro-Industrial Enterprises) had been favorably endorsed by the PARC Technical Committee and had
been elevated for action of the PARC Executive Committee. It is worth noting that Asia Agro-Industrial
Enterprises produces coconut instead of sugarcane.
Decisions on the application of two corporations, the 14 Colored Corporation and Garcona Agro-
Industrial Enterprises, for SDO coverage are not yet final. Field visits and site validation for 14 Colored
Corporation was done in February 2014 only and the results were presented to PARC Executive
Committee on June 2, 2014. Meanwhile, The PARC ExeCom has recommended for the second time the
denial of the application of GARCONA to be covered under the SDO.
4.2 Developmental Land Reform Program (DENR)
Added to the DAR CARP activities is the continuing disposal of public lands for the expansion of
cultivated lands. This scheme was an integral part of early government land reform initiatives to
encourage frontier settlements and expand cultivation. Under the current environment however, most
public agricultural lands are already being cultivated and the CARP mainly facilitates the titling of the land
to current occupants or provide stewardship, “whenever applicable”, in accordance with law in the
disposition or utilization of lands of the public domain.
Lands with 18% slope or over are exempt from CARP coverage unless these are found to be
agriculturally developed as of 15 June 1988. These lands are allocated as follows: (a) If land is classified
as forest land, and therefore is inalienable and indisposable, this shall be allocated by the DENR under its
Integrated Social Forestry Program; (b) if classified as alienable and disposable, this shall be allocated by
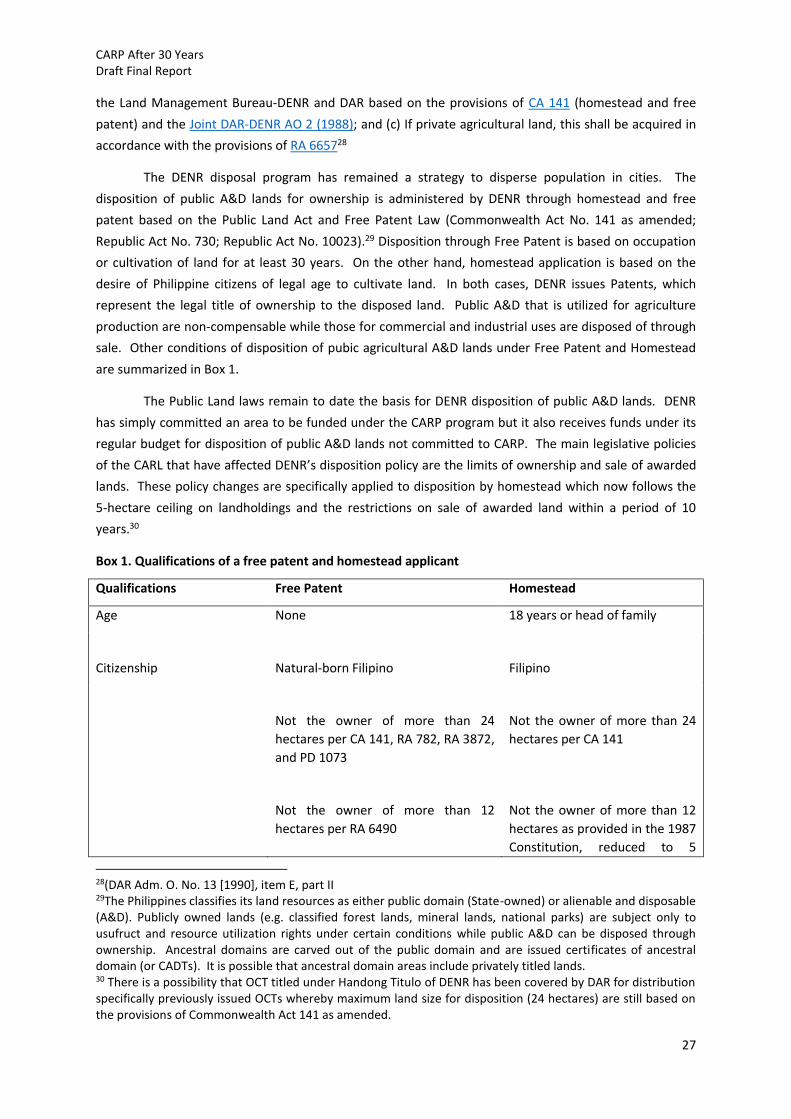
CARP After 30 Years Draft Final Report
27
the Land Management Bureau-DENR and DAR based on the provisions of CA 141 (homestead and free
patent) and the Joint DAR-DENR AO 2 (1988); and (c) If private agricultural land, this shall be acquired in
accordance with the provisions of RA 665728
The DENR disposal program has remained a strategy to disperse population in cities. The
disposition of public A&D lands for ownership is administered by DENR through homestead and free
patent based on the Public Land Act and Free Patent Law (Commonwealth Act No. 141 as amended;
Republic Act No. 730; Republic Act No. 10023).29 Disposition through Free Patent is based on occupation
or cultivation of land for at least 30 years. On the other hand, homestead application is based on the
desire of Philippine citizens of legal age to cultivate land. In both cases, DENR issues Patents, which
represent the legal title of ownership to the disposed land. Public A&D that is utilized for agriculture
production are non-compensable while those for commercial and industrial uses are disposed of through
sale. Other conditions of disposition of pubic agricultural A&D lands under Free Patent and Homestead
are summarized in Box 1.
The Public Land laws remain to date the basis for DENR disposition of public A&D lands. DENR
has simply committed an area to be funded under the CARP program but it also receives funds under its
regular budget for disposition of public A&D lands not committed to CARP. The main legislative policies
of the CARL that have affected DENR’s disposition policy are the limits of ownership and sale of awarded
lands. These policy changes are specifically applied to disposition by homestead which now follows the
5-hectare ceiling on landholdings and the restrictions on sale of awarded land within a period of 10
years.30
Box 1. Qualifications of a free patent and homestead applicant
Qualifications Free Patent Homestead
Age None 18 years or head of family
Citizenship
Natural-born Filipino
Filipino
Not the owner of more than 24
hectares per CA 141, RA 782, RA 3872,
and PD 1073
Not the owner of more than 24
hectares per CA 141
Not the owner of more than 12
hectares per RA 6490
Not the owner of more than 12
hectares as provided in the 1987
Constitution, reduced to 5
28(DAR Adm. O. No. 13 [1990], item E, part II 29The Philippines classifies its land resources as either public domain (State-owned) or alienable and disposable (A&D). Publicly owned lands (e.g. classified forest lands, mineral lands, national parks) are subject only to usufruct and resource utilization rights under certain conditions while public A&D can be disposed through ownership. Ancestral domains are carved out of the public domain and are issued certificates of ancestral domain (or CADTs). It is possible that ancestral domain areas include privately titled lands. 30 There is a possibility that OCT titled under Handong Titulo of DENR has been covered by DAR for distribution specifically previously issued OCTs whereby maximum land size for disposition (24 hectares) are still based on the provisions of Commonwealth Act 141 as amended.

CARP After 30 Years Draft Final Report
28
hectares in DENR Memo Circular
No. 22, S-1989 in line with the
legislative policy expressed in RA
6657
Occupation
Sec. 44, CA 141- on or prior to July 4,
1926 or payment of the real estate tax
on the land since then
Within six months from the date
of approval of the homestead
application
Sec. 1, RA 782- on or prior to July 4,
1945
RA 3872- on or prior to July 4, 1955
PD 1073- on or prior to June 12, 1945
RA 6940- Continuous occupation for
at least 30 years prior to the
effectivity of the law on April 16, 1990
and payment of the real estate tax
since then
Cultivation
Fully cultivated
Cultivation of 1/5 of the area
applied for within 5 years but in
no case earlier than 1 year after
the date of approval of the
application
Tilting
Application
Cultivation of 1/5 but not earlier
than 1 year
Date/Transfer
None
Covered by CARP
Source: DENR manual of Land Disposition, 2013
The DENR scope was originally 4.5 million hectares but was reduced to only 2.5 million hectares.
The original scope of 4.5 million was reduced after consideration of the following:31 (a) lands under
Presidential Proclamations for use of government agencies such as DND , NHA, etc. (1.067 million
hectares); (b) lands under Proclamations as resettlement and KKK areas that were transferred to DAR
31 Based on DENR documentation and interview with Engr. Henry Pacis, DENR- CARP National Office; Feb 26, 2015.

CARP After 30 Years Draft Final Report
29
(0.597 million hectares); (c) judicially titled lands from 1987 to 1994 per records of the Land Registration
Authority (0.034 million hectares); (d) unclassified forest lands earlier projected to be released as A&D
but have remained forest lands. Moreover, the ISF area under DENR scope covering 1.8 million
hectares32 was not included in the scope since these lands cannot be distributed and titled and have
remained part of forest lands. ISF areas are only subject to lease agreements renewable every 25 years.
Its inclusion in the CARP scope is mainly for support services.
Of the total area committed by DENR to CARP, 99% of area has been distributed to a total of 2.34
million ARBs with an average area per beneficiary of 1.1 hectares (Table 24). DENR expects to complete
the distribution of the remaining 24,000 hectares by end 2015. But it is possible that “new lands” will be
added to the DENR land inventory with the completion of the Cadastral survey. These lands can be
disposed of under DENR regular budgets. So far, studies on the effects of public A&D disposition have
been scarce.
DENR has also committed under CARP funding, Integrated Social forestry (ISF) which are
disposed of only by use through a 25-year lease agreement. ISF areas cover an area of 1.2 million
hectares, which have been fully disposed by lease. Leases were mostly given to People’s Organizations
(POs). Members of the POs are benefited through CARP via support services. As of 2014, support
services to ISF have covered 1.04 million hectares or 87% or target area and benefited 338,808 PO
members. Average land size per ARB is 3.08 hectares.
Public forest lands under lease agreements are also contentious issues because of deeply
entrenched private interest on these lands. For instance, cattle ranches on government land leased by
private firms and timberlands planted to coconuts. Exploitative tenurial relations are occurring in these
types of lands. Pasture lands are part of forest area; once leases expire, these lands are reverted back to
timberland.
DENR has estimated that land for CARP has already been expended and the remaining large
landholdings would likely come from lands held by religious and academic institutions and government
lands such as military reservations.
4.3 CARP Program of Support Services
The DAR CARP program involving land ownership transfer has benefited about 2.8 million
agriculture households mostly in Regions III, NIR and XII (Table 25). The average area per ARB is 1.7
hectares, which is below the target of 3.0 hectares per ARB. ARBs in Regions XII, XIII and VIII received
larger plots, an average land area of 2.0 hectares, compared to other regions.
a. Agrarian Reform Communities (ARCs) and Agrarian Reform Beneficiary Organizations (ARBOs)
A key feature of the CARP is the incorporation of a program of support services for beneficiary
development. The DAR has adopted the Agrarian Reform Community (ARC) concept as the strategy in
the provision of interventions in agrarian reform areas and to ARBs. ARCs are formed through clustering
32 The 1.8 million hectares ISF area was also reduced to 1.2 million hectares since the original estimate committed to CARP included the area of other community based forestry programs that are being supported by other funding administered by the DENR.

CARP After 30 Years Draft Final Report
30
of contiguous agrarian reform barangays. Since ARCs are area-based both ARBs and non-ARBs in the
barangay are benefited from support services that usually includes infrastructure such as farm to market
roads, irrigation and farm facilities. DAR continues to launch new ARCs or expand existing ones to widen
outreach for support services.
As of end 2016, 1.5 million ARBs are already covered by ARCs, with around 1.3 million still to
outside of ARCs (Table 26). Among the regions, the CAR has the highest percentage of ARBs in ARCs;
86% of the ARBs in the region are already in ARCs. Regions I, VII and XIII have more than 70% of ARBs in
ARCs. On the other hand, ARRM and Regions VI and XII are the regions with the lowest percentage of
ARBs are in ARCs.
DAR has also institutionalized farmers organizations or agrarian reform beneficiary organizations
(ARBOs) in both ARC and non-ARC areas. Support services are also channeled to these organizations.
This strategy provided ARBs in non-ARC communities to also have access to support services from the
DAR or the DA. As of end 2016, there are 5,216 ARBOs created wherein 4,402 (84%) are in ARCs (Table
27). The members include both ARBs and non-ARBs.
The DAR strategy on support services is not focused on ARBs alone but is area-based. This
strategy responds to the need for integrated development in agriculture area and support for farmers in
general and not just ARBs or non-ARBs. The division between program for ARBs and non-ARBs with the
increasing focus on support services by the DAR and DA will eventually disappear in the medium-term.
b. Agribusiness Ventures (AVAs)33
Another DAR strategy that is gaining support for agriculture development under an agrarian
reform setting is the development of agribusiness venture agreements or AVAs. The AVAs, which were
recognized through DAR Administrative Order No. 9, Series of 1998, resulted from the need to optimize
the operating size of commercial farms for agricultural production efficiency and to promote security of
tenure and income of the ARBs.
The various types of AVAs are: (a) Joint Venture Arrangement (JVA); (b) Lease Arrangement; (c)
Contract Growing/Growership Arrangement; (d) Management Contract; (e) Production, Processing, and
Marketing Agreements; and (f) Build-Operate-Transfer-Scheme.
Joint Venture Agreement (JVA) is an AVA scheme wherein the ARBs and investors form a joint venture
corporation (JVC) to manage farm operations. The beneficiaries contribute the use of the land held
individually or in common and the facilities and improvements, if any. On the other hand, the investor
furnishes capital and technology for production, processing and marketing of agricultural goods, or
construction, rehabilitation, upgrading and operation of agricultural capital assets, infrastructure and
facilities.
Lease Agreement is an AVA scheme wherein the beneficiaries bind themselves to give the former
landowner or any other investor general control over the use and management of the land for a certain
amount and for a definite period.
33 This section draws some discussions from Pantoja, et al (2017).

CARP After 30 Years Draft Final Report
31
Contract Growing/Growership/Production Arrangement is an AVA scheme wherein the ARBs commit to
produce certain crops which the investor buys at pre-arranged terms (e.g., volume, quality standard,
selling price). This may come in the form of production and processing agreements.
Management Contract is an AVA scheme wherein the ARBs hire the services of a contractor who may be
an individual, partnership or corporation to assist in the management and operation of the farm for the
purpose of producing high value crops or other agricultural crops in exchange for a fixed wage and/or
commission.
Marketing Agreement is an AVA scheme wherein the investor explores possible markets/buyers for the
ARB’s produce and in turn receives commission for actual sales. It is distinct from the direct marketing
arrangement/contracts of ARBs or their cooperative/association wherein the regional/provincial
marketing assistance officer of DAR helps or assists in the sale and marketing of ARBs produce to a
regular market, e, g., institutional buyers such as Cargill Philippines or San Miguel Corporation (SMC) for
yellow/hybrid corn. This arrangement is under the DAR marketing assistance program (MAP) and not
considered as an AVA scheme.
Build-Operate-Transfer (BOT) is an AVA scheme wherein the investor builds, rehabilitates or upgrades, at
his own cost, capital assets, infrastructure and facilities applied to the production, processing and
marketing of agricultural products and operates the same at his expense for an agreed period after which
the ownership thereof is conveyed to the ARBs who own the land where such improvements and
facilities are located.
Under the different AVAs, the corporations which serve as investors are encouraged to enter into
an agreement with individual ARBs or farmer cooperatives and organizations. To reinforce AO No.9,
Series of 1998, DAR AO No. 2, Series of 1999 was issued which provided for the rules and regulations
governing joint economic enterprises in agrarian reform areas.
As of March 4, 2015, DAR has recorded a total of 452 AVAs nationwide, 44% of which are in
CARAGA Region (Table 28). Nearly 92% of these AVAs are located in Mindanao where commercial crop
such as banana are prevalently grown. Congruently, majority (76%) of area involved in these agreements
which total to about 71,330 hectares are in Mindanao with Region XI having the highest share of area
covered at 29%. A total of 59, 195 ARBs are involved in the AVAs, more than a third of whom (34%) are in
Region XI. Region XI is only third in terms of the number of AVAs but due to the large expanse of
plantations particularly on banana and fruit trees, it is not surprising that it ranked first in terms of area
involved and number of ARBs.
Table 29 shows the distribution of the AVAs by crops planted. About 28% of the total area
covered by the AVAs are planted with banana followed by pineapple (27%) and oil palm (24%). These
three crops cover almost 79% of the total area under AVA. However, in terms of number of ARBs
benefited, pineapple ranked first with 19,864 (43.8%) followed by banana with 14,866 (32.7%). Palm oil
on the other hand only benefited 4,019 (9%) ARBs despite covering a large amount of area. Among the
different types of AVAs, around 77% adopted the lease agreement or Land Use Production Agreement
(LUPA). This arrangement covered areas that were planted to sugarcane, banana, pineapple, ube and
palm oil. A relatively large proportion (20%) had contract growing/growership agreements in farms
planted to banana, pineapple, oil palm and tobacco (Table 30).

CARP After 30 Years Draft Final Report
32
c. Sugar Block Farms
Aside from AVAs, Sugarcane Block Farming has been implemented starting in 2012-2013 in
sugarcane areas. The Sugarcane Block Farming was conceptualized as part of the National Convergence
Initiative of the DA, DAR and Sugar Regulatory Authority (SRA). Its main goal is to increase productivity
of sugarcane farms of members of Agrarian Reform Beneficiaries Organizations (ARBOs) such as
cooperatives and farmers’ associations under the Agrarian Reform Community Connectivity Economic
and Support Services (ARCCESS) project that is currently being implemented by the DAR. It also aims to
enhance the skills of the ARBOs in managing agribusiness enterprises. Sugarcane Block Farming have
three expected result which are: (1) reduce cost of production; (2) increase farm productivity from 60 to
75 tons cane per hectare; and (3) establish at least one agribusiness activity per block farm.
The block farming scheme entails consolidation of small farms into 30-50 hectares to take
advantage of plantation-scale production or economies of scale. Farmers, mostly ARBs, with
landholdings of less than two hectares, are encouraged to group their production areas into integrated
farm blocks with small farms being at least 2 kilometers apart. The ARBs retain ownership of the lands
and depending on the arrangement entered into with the ARBOs, they may even be hired as farm hands.
DAR through the ARBOs is tasked to provide the operating expenses in implementing the project as well
as monitor its implementation and fund utilization. It is also expected to extend at least one farm
equipment or common service facility (CSF) to the ARBO which will help increase sugarcane productivity
as well as provide the ARBO with opportunity of having an enterprise by renting out the CSF
For at least two cropping seasons, the farmers will undergo coaching and will be provided
guidance on farm management practices. The profit-sharing arrangement will depend on the agreement
of the officers and members of the ARBO, block farm enrollees or farmers and financiers, if any. The
financing scheme, which may be through partnership, joint venture, contract growing, foreign funding,
loans, etc., will depend on the decision of ARBO officers and members.
Meanwhile, the DA is expected to provide necessary irrigation systems and farm to market roads.
It is also tasked to give starter inputs for the diversification of agricultural production facilities.
The SRA, which is an attached agency of DA, will assist DAR in identifying and validating the block
farm enrollees. It will also provide technical assistance and extension and capacity building programs. It
is likewise expected to provide financing for farm operations, production facilities. Processing
technologies and market linkage in the case of muscovado. Part of the role of the SRA is to manage the
fund released by DAR for operationalizing and monitoring the block farms. Based on the agreement
among the agencies, SRA should prepare the block farm operations manual/business plan and CSF
operations manual. However, most often, DAR had been hiring Business Development Service Providers
to handle these functions.
In 2012, Phase I of the Sugarcane Block Farms had been identified and implemented in 16 farms,
eight of which are in the Visayas and seven, Luzon (Table 31). Phase II was implemented in 2013,
covering 29 farms, 18 of which are in the Visayas while eight are in Mindanao. Being sugarcane
producing areas, most of the block farms are in the Visayas particularly in the provinces of Negros
Occidental and Negros Oriental. Participants in the second phase of the block farming scheme had been

CARP After 30 Years Draft Final Report
33
given access to credit from the Agrarian Production Credit Program (APCP), a credit program
implemented by the DA, DAR and state-owned Land Bank of the Philippines for CARP beneficiaries.
Studies are currently being conducted to assess the effects of support services (e.g. credit) provided to
ARBs under this system.
V. CARP Impact Assessment
The studies that examined the impact of CARP fall into two categories: one, studies that assessed
welfare effects of an integrated package of land tenure improvement and support services and two,
welfare effects of the ownership of land through CARP. The impact methodology used both non-
experimental (e.g., before and after or participant vs nonparticipant analysis) and quasi-experimental
methods that construct counterfactuals.
Recent analysis of CARP impact using non-experimental methods that provided comparison
between ARBs and non-ARBs show positive correlation between ARBs and household income. Barrios, et
al (2015) using 2015 survey of ARBs and non-ARBs noted that being an ARB has positive effects on total
household incomes. 34 He attributed this to better access to various factors of production that lead to
increased total household income. Similar results were reported for ARC and non-ARCs and for ARBs in
non-ARCs. This means that the benefits earned from various interventions in ARC areas could help raise
their total household income. Furthermore, an ARB in ARC areas can generate higher income than non-
ARB in an ARC area. The results however cannot solely be attributed to CARP or to being ARB since there
is no information about the level of incomes and of welfare of the surveyed ARBs and non-ARBs prior to
the intervention.
Similar results were reported by Monsod, et al. (2016) using the non-experimental method. They
also noted the positive association of landownership and household welfare – that is, households who
own land and who, moreover, own land through agrarian reform, have higher predicted welfare and less
probability of being poor. As mentioned by the authors themselves the causality effects between CARP
and welfare improvement cannot be established from this methodology. Thus, both analysis mainly
confirmed that owning land is welfare-enhancing whether the land is obtained through CARP or not.
The results of studies using more rigorous impact methods, whereby counterfactuals are
constructed so that attribution is possible are presented below.
Hayami and Kikuchi, 1982, 2000; Otsuka 1990, Umehara 1997, Deininger 2000 are studies that
assessed the impact of the land reform program during the period 1980 to 1990. These studies cover the
period of implementation of PD27 or the Operation Land Transfer (OLT) scheme which was started in
1972 and continued up to the early years of CARP. The results of the studies showed significantly positive
gains in household incomes and welfare due to OLT. The positive impact was influenced by the timing in
which the land reform program was undertaken. In particular, PD 27 beneficiaries profited hugely from
the reform due to the rapid increase in rice yield made possible by ‘green revolution’ technology (i.e. high
yielding varieties).
34 “total income is the sum of annual income from various components including farm, off-farm, non-farm, remittances, poultry and livestock, AVA, and microenterprise activities (Barrios et al 2015 p 166).”

CARP After 30 Years Draft Final Report
34
APPC (2007) evaluated the impact of CARP covering the period 1990-2000. This study
investigated CARP as an integrated package of interventions covering both land distribution and support
services delivery. In particular, it sought to assess the welfare effects of Agrarian Reform Community
(ARC) strategy, by comparing households in ARC and non-ARC barangays. Methodologically, this involved
identifying a “matched panel” of ARC and non-ARC barangays and, by “double-differencing”, comparing
indicators of average welfare among households in these barangays before and after ARC
implementation. The key findings were: (1) Poverty incidence in Agrarian Reform Community (ARC)
barangays went down slightly more than in non-ARC barangays between 1990 and 2000 (1.4 percentage
point difference); (2) Per capita expenditure increased for both ARC and non-ARC barangays between
1990 and 2000 with per capita expenditure higher in ARC by Php134 at 2003 prices; (3) Households in
ARC barangays enjoyed slightly greater welfare improvements in terms of housing (higher proportion of
houses with strong roofs and strong walls) and educational attainment of members 6 to 24 years old.
In the same study, APPC also analyzed whether land ownership, land ownership through agrarian
reform, and/or residing in an ARC were significant in explaining variations in household level per capita
income, per capita expenditure, and poverty status. The data set was created by merging the 2004
Annual Poverty Indicators Survey (APIS) dataset, the 2000 Census of Population and Housing (CPH) and
the 2006 ARC master list of the DAR. The study reported that the per capita household consumption
expenditures of landowning households are 15% to 17% higher, on average, than those of landless
households who did not benefit from either LTI or ARC components. Having access to land has the same
magnitude of welfare impact, whether it is obtained through CARP or through other means (through
inheritance or through purchase). Comparing ARBs in an ARC and a land-owning non-ARBs in ARC show
that ARBs have higher per capita incomes, higher per capita expenditures and lower probability of being
poor. In particular, the difference in predicted per capita income between ARBs and land-owning non-
ARBs both of which reside in ARCs was 7.5%. The increase implies the combined effects of land tenure
improvement (ARB status) and ARC interventions.
In 2009, the World Bank further examined the performance of CARP by reviewing existing
evidence and extending the earlier impact analysis done by APPC and UPLB-IARDS using updated data. 35
Using the UPLB-IARDS 1990-2000 panel dataset, the study found that average real per capita income
among CARP beneficiaries increased from Php14,625 in 1990 to Php21,903 in 2000. The corresponding
increase for non-CARP beneficiaries was from Php18,025 in 1990 to Php21,575 in 2000. This represented
a 15% difference but was only marginally significant (pvalue 0.15). In terms of poverty dynamics, the new
analysis found that 52% of CARP beneficiaries who were poor in 1990 became non-poor in 2000.
35 The UPLB-IARDS data set was from a micro study conducted by the University of the Philippines Los Baños Foundation and the Institute of Agrarian and Rurban Development Studies (IARDS). It attempted to measure changes in household welfare and productivity from 2000 to 2006 and from 1990 to 2006 due to CARP using household panel data. The initial results of the impact assessment from the dataset was considered flawed. Several researchers (Habito et al., 2003; APPC, 2007; World Bank, 2009) pointed out that IARDS panel dataset is not a true panel due to; (1) the consumption expenditure modules were not consistent across rounds and the items were not sufficiently disaggregated as to provide reliable measures of living standards; (2) income modules, though considerably more detailed, also varied across time. These changes across survey rounds could have resulted in systematic over- or under-estimations of expenditures or income although it is not clear exactly how. The World Bank study utilized the data by limiting the definition of ARB strictly to CARP beneficiaries.

CARP After 30 Years Draft Final Report
35
Meanwhile, 15% of CARP beneficiaries and 22% of non-CARP beneficiaries who were not poor in 1990 fell
into poverty by 2000. These results indicated a positive but modest impact.
The World Bank study also extended the Balisacan and Fuwa (2004) study on the impact of CARP
on poverty by using more recent data on poverty and provincial level disaggregation of CARP
implementation as opposed to regional level in the 2004 Balisacan and Fuwa study. The analytical
framework was retained, which is that growth and poverty reduction was determined by initial
conditions (e.g. income and income inequality, and infrastructure such as road density, electricity, and
irrigation) and policy variables (such as CARP, change in agricultural terms of trade, among others). Two
periods were examined – 1991 to 1997 and 1991 to 2006.
The extension study found that total land distribution performance (CARP accomplishment vis-à-
vis scope) had a significant negative relationship to the rate of change in poverty incidence for the period
1991 to 2006. For the 1991 to 1997 period, it was private land redistribution that had a positive
significant effect on poverty reduction. Specifically, estimates showed that a 10% increase in CARP
performance (for the 1991 to 2006 period) or in private land redistribution (for the 1991 to 1997 period)
increased the rate of poverty reduction by 3 or 2 percentage points. The report noted that CARP could
account for 8% of the average rate of poverty reduction for the period 1991-2006.
In addition, the WB extension study tried to disaggregate the impact of CARP on the rate of
poverty reduction by mode of acquisition. It found that for the period 1991 to 1997, most of the CARP
subcomponents had positive significant impact on poverty reduction, and the estimates were
quantitatively large for Operation Land Transfer (OLT)36 and Compulsory Acquisition (CA). This was not
observed for the period 1991 to 2006 on any of the subcomponents however.
Based on its review of evidence and its own analysis, the WB report concluded that CARP
implementation had “some significantly positive welfare impacts on its beneficiaries”. It stressed the
difficulty of reliably estimating the magnitude of this impact due to data limitations.
Another recent study on CARP impact was done by Monsod, et al. (2016), who constructed a
“matched panel” of ARC and non-ARC barangays, with the barangay as unit of observation. In particular,
the study investigated the effect of the integrated package of interventions from CARP (LTI + ARC).37 The
assessment covers the period 1990-2010, which corresponds to at least two decades of CARP. The
matched panel and required data points were obtained from: the Census of Population and Housing
(CPH) 1990, 2000 and 2010; the Census of Agriculture (CA), 1991 and 2002, which covers agricultural
barangays; and ARC Master List of the Department of Agrarian Reform.38 The key findings of the study
were: (1) the drop in poverty incidence was greater in ARC barangays than in non-ARC barangays in the
overall by 1.2 percentage points. Poverty reduction among ARC households moved faster than among
non-ARC households over the period 2000 to 2010 (by 2.1 percentage points); (2) Per capita expenditure
36 OLT is the distribution of rice and corn lands while CA is the equivalent for non-rice and -corn areas. Both modalities are expropriatory in nature. 37 Since the unit of observation is the barangay, it is possible that the results also capture other support programs by DA, DTI or private sector on households in the area. It is not clear whether the matching of ARCs and non-ARC barangays also controlled for other interventions. 38 The CPH is the official source of information on the size, composition and distribution of the population, the geographic location and characteristics of housing units, and the physical characteristics of the barangays (presence of service facilities, social infrastructures and street patterns)

CARP After 30 Years Draft Final Report
36
increased in both ARC and non-ARC barangays. The improvement was slightly higher in non-ARCs; (3) in
ARC areas, housing and land ownership improved at a faster rate. In non-ARC areas, education
attainment improved at a faster rate; (4) barangay level non-monetary outcomes in ARC and non-ARC
areas moved in the same direction between 1990 and 2010 and changes were not statistically different.
That is, over the 20 years, the absolute percentage point or level change with respect to access to basic
economic and public facilities evens out across the two types of barangays.
Overall, the impact studies show some positive effects of CARP but modest. It is possible that
the effects are muted but until better data can be provided, the magnitude of the impact is debatable.
Also, as reported by Monsod, et al (2016), “there is still a lack of clarity on how or through what channels
agrarian reform interventions may be working” (p.23). It is possible that the welfare effects are indeed
similar whether land is acquired through CARP or inherited or purchased. Moreover, there is no
convincing evidence on whether CARP has achieved its intended outcomes of equity, increase access to
formal credit, increase productivity and investments in agriculture.
VI. CARP Implementing Agencies and Resource Utilization
The CARL provided for the creation of Presidential Agrarian Reform Council (PARC) at the
national level, Provincial Agrarian Reform Coordinating Committee (PARCCOM) at the provincial level and
the Barangay Agrarian Reform Committee (BARC) at the barangay level.
Presidential Agrarian Reform Council. The PARC is the highest policy making body for the CARP.
It is chaired by the President of the Philippines and Vice Chairman is the DAR Secretary. Members of the
PARC include the secretaries of the DENR, Department of Trade and Industry (DTI), Department of Public
Works and Highways (DPWH), Department of Budget and Management (DBM), Department of Interior
and Local Government (DILG), Department of Finance (DOF) and Department of Labor and Employment
(DOLE); the Director General of National Economic Development and Authority (NEDA); president of the
LBP; administrator of the National Irrigation Administration (NIA); three landowner representatives with
one each coming from Luzon, Visayas and Mindanao; and six ARBs representatives (two each from
Luzon, Visayas and Mindanao, with one of the two representatives belonging to cultural minorities).
Executive Committee. An Executive Committee was also created and it is in charge of matters
occurring at PARC. It is composed of heads of DA, DENR, DPWH, DTI, DBM, DOF, LBP, NEDA and
Executive Secretary of the PARC Secretariat. The PARC Secretariat provides general support and
coordinating services, program and project appraisal, evaluation and monitoring of CARP.
Provincial Agrarian Reform Coordinating Committee. The Chairman of the PARCCOM is appointed by the
President of the Philippines, upon recommendation of PARC. Its members include the DAR Provincial
Agrarian Reform Officer (PARO), who acts as executive officer; one representative each from the DA,
DENR and LBP.
Barangay Agrarian Reform Committee. The BARC acts as mediator and conciliator in agrarian
disputes and assists in the identification of qualified beneficiaries and landowners. It also attests to the
accuracy of the parcellary mapping of CARP lands and helps in the initial determination of land values.
The BARC is supposed to coordinate support services delivery and assist farmers in obtaining credit.

CARP After 30 Years Draft Final Report
37
Roles of the CARP implementing agencies (CIAs). The DAR serves as the lead implementing
agency and is in charge of land acquisition and distribution including implementation of non-land transfer
or alternative schemes. It also provides support services such as credit assistance and extension services
(e.g. institutional development, technical assistance to ARBs) and delivery of agrarian justice. In the
delivery of agrarian justice, units of the DAR such as the Provincial Agrarian Reform Adjudication Division
(PARAD) and Regional Agrarian Reform Adjudication Division (RARAD) are involved.
The DENR takes charge of the land survey plan verification & approval and the distribution of
public A&D lands. The LBP is tasked to determine land valuation and landowners’ compensation and
extend credit assistance to ARBs and ARBOs. Provision of agricultural extension services such production
and postharvest technology training, supply of quality farm inputs, market information, production and
post-production facilities are expected from the DA. This government entity also provides agricultural
financing.
The DOLE provides extension services particularly in terms of community organizing for
farmworkers. It also extends infrastructure support (e.g., common service facilities/agro-industrial
prototype projects) and livelihood project services. Just like the DOLE, the DTI also provides livelihood or
enterprise opportunities for ARBs. Meanwhile, the NIA and the DPWH are in charge of constructing
infrastructure projects, i.e. communal irrigation projects and rural roads/bridges, respectively. The Land
Registration Authority (LRA) is mandated to issue decrees of registration and certificates of titles and
register documents, patents and other land transactions for the benefit of ARBs.
The implementation of CARP required a budgetary allocation of P286 Billion for the period 1988
to 2016 or an annual budget of P9.87 Billion (Table 32). Among the CIAs, DAR and LBP got the biggest
chunk of the allocation of the budget. The combined expenditure of both agencies amounted to 89
percent. DAR budget, which accounted for 61 percent of total budget during the period, was used mainly
for program administration of both land tenure improvement and support services component of CARP.
On the other hand, LBP budget which accounted for 28 percent of total budget was mainly utilized for
landowners’ compensation.
The share of LBP is estimated to increase overtime as the remaining lands for land acquisition
and distribution are the lands planted to high value crops especially sugar lands. 39 These lands are also
areas where infrastructure investments have been made (e.g. roads). It is estimated (using average crop
values) that the budget requirement to cover the remaining CARP compensable area is about P73 Billion.
LBP estimates a higher figure of P123 Billion (Table 33).
VII. Conclusions and Forward Options
The accomplishments of CARP in terms of area covered and number of beneficiaries have been
significant. CARP accomplishments represent 70 percent of estimated total non-owner cultivated
agriculture land and 54 percent of total farming households in the country. However, there is evidence
that the program has been poorly targeted in terms of areas covered and beneficiaries. DAR experienced
39 Rejection rate of LOs on LBP compensation recommendation was highest in Negros Occidental.

CARP After 30 Years Draft Final Report
38
difficulty in constructing the land inventory and Masterlist of beneficiaries due to the absence of parcel
based information on land use and ownership and the poor land record system in the country. There is
also no inventory of farmers or tenants in the country. Targeting thus has been largely influenced by
landowners, local officials including DAR officials at the local level. There is lack of priority setting and
coverage was not consistent with areas or provinces where there is concentration of landownership
holdings or where tenancy arrangements are highest. The land tenure improvement was instead carried
out based on expediency. Almost 60% of CARP accomplishments were achieved through voluntary
modes of acquisition, i.e. through VOS and VLT arrangements, whereby the landowner offers the land to
be covered for land reform and usually also identifies beneficiaries of the land. On the other hand, land
distribution was slowest in areas of compulsory acquisition, which usually are the more productive areas.
The cases that were brought to the DAR agrarian justice system reveals the problems that results
from poor targeting and the lack of efficient land record system. First, DAR has to deal with conflicts
between landowner and ARBS due to delays in the implementation of land reform in identified strategic
areas. Second, it has to deal with conflict among ARBs on who is the rightful beneficiary. Third, it has to
deal with cases on cancellation of titles due to coverage of exempt or excluded properties and issuance of
titles to unlawful beneficiaries. These conditions raise doubts on the indefeasibility of titles generated
through the CARP program.
In terms of land valuation, although there were cases where land was paid at prices beyond the
market values; these were isolated cases and was placed under control when Land Bank took the lead in
determining the land valuation based on an agreed valuation formula with the DAR. Overall, there is
weak evidence of overpricing of the land acquired by the government. Total price subsidy to farmers,
which is estimated as the price paid by the government above the capitalized net income of land amount
to about P 13 Billion or 20% of total landowners’ compensation. The difference is largely explained by
changes in zonal values and market value of land overtime. A substantial amount of subsidy comes from
the amortization subsidy to farmers and implicit subsidies such as below market interest rates and the
non-imposition of penalties for delayed payment. The rationale of amortization subsidy is to make
payment affordable to ARBs but even then, collection performance is only about 52%. About 13% of the
accounts have been fully paid but there is also a considerable number of accounts (30%) which are in
arrears (i.e. no payment made for at least three years).
In the case of non-land transfers, the Stock Distribution Option apparently did not benefit most
beneficiaries. With the exception of three SDOs, ten of the 13 corporations with approved SDOs have
petitions for cancellation filed by the beneficiaries.
For leasehold arrangements, there is no significant change in lease tenure between 1991 and
2001. Several studies have reported that share tenancy persist and that the old sharing arrangement
specifically in coconut farms continues to be practiced. This means that the rental rate of 25% of net
produce specified in RA6657 is not being followed.
Total expenditure of CARP from 1987 to 2016 amounted to P286 Billion or an annual average of
P 9.87 Billion. DAR and Land Bank were allotted the biggest chunk of the CARP budget. The combined
expenditure from both agencies amount to 89%. Actual expenses for landowners’ compensation

CARP After 30 Years Draft Final Report
39
amounted to P 64 Billion during the period. It is estimated that the budget needed to complete the
distribution of the remaining LAD balance would be between P 73 billion and P123 billion.
Impact studies of CARP reported some welfare effects but these are muted and are generally
observed among areas where lands covered have higher productivity. It is also not clear through what
channels CARP improved welfare since welfare effects were similar between land owning agricultural
households that acquired land through CARP and those through purchase or inheritance. There is also no
clear evidence whether the objectives of CARP to increase investments in agriculture, increase access to
formal credit of farmers and equity have been achieved.
While the implementation of the program may have been flawed, redoing land reform by
revising the law towards a “genuine” program is unnecessary. Only a few big-sized agriculture lands are
left and the program has been implemented for almost 30 years such that monitoring subsequent
transfers of CARP awarded lands will be tedious and impractical. Land reform as a policy lever to address
inequities and poverty in the agriculture sector has become obsolete. Agricultural households are
investing in education, skills upgrading, overseas work, non-farm assets (e.g. housing). The objectives of
poverty and equity can be achieved through alternative programs that is of lower cost to the
government.
The agrarian sector should instead focus on support programs to modernize agriculture that will
benefit all small farmers (whether ARB or non-ARB). DAR together with DA can support policies and
programs to provide small farms access to value chain; consolidation of farm operations for economies of
scale; and development of social enterprises.
The indefeasibility of CARP issued titles and the stability of property rights in agriculture should
be established by facilitating the resolution of conflicts, title cancellation, default on land payments by
ARBs, and transfers of awarded lands. The issue on landownership concentration can be dealt with
through a progressive land taxation that can be supported by the ongoing improvements and digitization
in land administration at the LRA and the DENR.

CARP After 30 Years Draft Final Report
40
Literature Cited
Adriano, Lourdes (1991). A General Assessment of the Comprehensive Agrarian Reform Program. PIDS
Working Paper Series 91-13. Manila: PIDS
Adriano, F. (2008). CARP Institutional Assessment in a Post-2008 Transition Scenario: Toward a New Rural
Development Architecture. PIDS Discussion Paper 2008-6. Makati City: PIDS
Adriano, F. (2013). "Sustaining the momentum of inclusive growth in the Post-CARP scenario," Integrative
report submitted to the Inter-Agency Committee on Institutional Arrangements for Land Management and
Rural Development.
APPC [Asia-Pacific Policy Center] (2007). CARP Impact Assessment: Study on the Impact of CARP on Poverty
Reduction and Prospects for Long-Term Growth. September 12, 2007.
Balisacan, A. (2007). Agrarian Reform and Poverty Reduction in the Philippines. Paper presented at the Policy
Dialogue on Agrarian Reform Issues in Rural Development and Poverty Alleviation, 30 May 2007, Traders
Hotel, Manila.
Balisacan, A. and N. Fuwa (2004). "Going Beyond Cross-Country Averages: Growth, Inequality and Poverty
Reduction in the Philippines," World Development 32 (November): 1891-1907.
Ballesteros, M. (2010). The Cost of Redistributive Land Reform in the Philippines: Assessment of PD 27 and
RA 6657 (CARL). PIDS Discussion Paper Series No. 2010-09. Makati City: Philippine Institute for Development
Studies.
___________________ and F Cortez (2008). Institutional Assessment in a Post-2008 Transition Scenario:
Implications for Land Administration and Management. PIDS Discussion Paper 2008-7. Manila:PIDS
___________________ and E. Tiamson (2013). "Study of the Institutional Arrangementsfor Post-CARP;
Component 1: Land Administration, Titling and Land Management", unpublished report submitted to the Inter-
Agency Committee on Institutional Arrangements for Land Management and Rural Development headed by
the NEDA
Barrios, E., Lansangan, J. R., Sarte, G. M., Nalica, A., Labina, C., Eustaquio, J., Supranes, M. V., Villejo, S. J.,
Borlongan, M. A., Ragas, R., & Redondo, P. V. (2015). 2015 Survey of Agrarian Reform Beneficiaries. Philippine
Statistical Research and Training Institute.
Besley, T. and M. Ghatak (2010) Property Rights and Economic Development. In Dani Rodrik and Mark
Rosenzweig, editors: Handbook of Development Economics, Vol. 5, The Netherlands: North-Holland, 2010,
pp. 4525-4595
Bravo, M and B Pantoja (1998). Beyond 2000: Assessment of the Economy and Policy Recommendations–
Dealing with Agrarian Reform. PIDS DP 98-09. Manila:PIDS
Bravo, M.R., A.Y. Pacificador, Jr. and B. R. Pantoja (1995) Towards the Development of an Agrarian Reform
Beneficiaries Performance Monitoring and Evaluation (M&E) System. Paper presented during the 8th Regional
Symposium on Research and Development Highlights, 14 September, Sta. Cruz, Laguna.

CARP After 30 Years Draft Final Report
41
Bravo, M.R., A.Y. Pacificador, Jr., B. R. Pantoja and R. T. Bello. 2000. Current State of Agrarian Reform
Beneficiaries: It’s Implications to CARP (ARBs Performance Monitoring and Evaluation (M&E) System: Phase III.
Borras, S. (2005). Can Redistributive Reform Be Achieved via Market-Based Voluntary Land Transfer
Schemes? Evidence and Lessons from the Philippines, Journal of Development Studies 41(1), 90-134.
______, S (2001) State Society relations in Land Reform Implementation in the Philippines. Development
and change 32 (3) p:545-575.
Castaneda, D. (2008). LGU's power to reclassify land helpslandowners evade CARP. Retrieved on 24 April 2017
from http://news.abs-cbn.com/special-report/04/14/08/lgus-power-reclassify-land-helps-landowners-evade-
carp.
De los Reyes, V. (2016). End of term report of Secretary Virgilio de los Reyes: for the term from July 2010 - June
206. Department of Agrarian Report.
Deininger, K. (1999). “Making Negotiated Land Reform Work: initial experience from Colombia, Brazil and
South Africa” World Development. Vol. 27, No. 4. Pp. 651- 672.
Deininger, Klaus, Francisco Lara, Jr., Pedro Olinto and Miet Maertens (2000). “Redistribution, Investment,
and Human Capital Accumulation: The Case of Agrarian Reform in the Philppines. Mimeo. Washington, D.C.:
The World Bank.
Department of Agrarian Reform (1990). DAR Administrative Order No. 13, Series of 1990. Retrieved on 7
December 2017 from http://www.dar.gov.ph/downloads/category/23-issuances-1990
_________________________ (1995). DAR Administrative Order No. 03, Series of 1995. Retrieved on 7
December 2017 from http://www.dar.gov.ph/downloads/category/28-issuances-1995,
_________________________ (2000). An Assessment of the Operationalization of Voluntary Land Transfer
Scheme (VLT)/Direct Payment Scheme (DPS). Quezon City: DAR Policy and Strategic Research Service
Department.
________________________ (2003) CARP Impact Assessment Studies Program. Manila: DAR and FAO.
________________________ (2011). DAR Administrative Order No. 09, Series of 2011. Retrieved on 7
December 2017 from http://www.dar.gov.ph/downloads/category/44-issuances-2011?download=469:ao-no-
09-s-2011-rules-for-the-survey-and-or-field-investigation-of-landholdings-2
________________________ (2012). Case Studies on “Revisiting the Implementation of the Agribusiness
Venture Arrangements (AVAs) Between Agrarian Reform Beneficiaries (ARBs) and the Investors”.
Executive Order No. 406 of 1990. Mandating Certain Departments and Agencies to Align Their Perspective
Programs and Projects with the Comprehensive Agrarian Reform Program, Directing the Department of
Agrarian Reform Beneficiaries Development Through the Provision of Economic and Social Infrastructure
Support, and Providing the Necessary Implementing Mechanisms for the Purpose.

CARP After 30 Years Draft Final Report
42
Fuwa, N. (2000). Politics and Economics of Land Reform in the Philippines: a survey. A background paper
prepared for a World Bank Study, Dynamism of Rural Sector Growth: Policy Lessons from East Asian
Countries.
Gordoncillo, Prudencio (2012). The Economic Effects of the Comprehensive Agrarian Reform Program
(CARP) in the Philippines. Journal of ISAASS, 18,1, p:76-86.
Habito, C.H., R.M. Briones, and E.M. Paterno. 2003. Investment, Productivity and Land Market Impacts of the
Comprehensive Agrarian Reform Program. CARP Assessment Studies. Volume 4. Quezon City: Department of
Agrarian Reform
Hayami, Y., Quisumbing, M.A., and Adriano, L. (1990). Toward an Alternative Land Reform Paradigm: A
Philippine Perspective. Ateneo de Manila University Press.
_________ and M. Kikuchi (1982). Asian Village Economy at the Crossroads: An Economic Approach to
Institutional Change. Tokyo and Baltimore: University of Tokyo Press and the John Hopkins University Press.
______________________ (2000). A Rice Village Saga: Three Decades of Green Revolution in the Philippines.
Lanbum, Boulder, New York: Barnes & Noble, London: McMillan, Philippines: International Rice Research
Institute.
Institute of Agrarian Studies. 1992. Benchmark for the Comprehensive Agrarian Reform Program (CARP).
Iyer, L and N. Maurer (2008). The Cost of Property Rights: Establishing Institutions on the Philippine Frontier
Under American Rule, 1898-1918. Harvard Business School Working Paper 09-023.
Kuri, Prayat K. (2004). Tenancy Relations in Backward Agriculture: A Study in Rural Assam.
Leonen, M. (2008). CARP Institutional Assessment in a Post-2008 Transition Scenario: Reforms for the
Agrarian Justice System. PIDS Discussion Paper Series No. 2008-10. Makati City: Philippine Institute for
Development Studies.
Leong, Benjamin (1992). The Record and Legacy of the Aquino Administration in Agrarian Reform. A Paper
presented at the UP Public Lectures on the Aquino Administration and the Post Edsa Period. University of
the Philippines, Diliman Quezon City 27 January 1992.
Mangahas, M. (1985). "Rural Poverty and Operation Land Transfer in the Philippines." In Strategies for
Alleviating Poverty in Rural Asia. (eds.) Rizwanul Islam. Dhaka and Bangkok: Bangladesh Institute of
Development Studies and International Labor Organization Asian Employment Program. 81.
Meliczek, H. (1999). Issues and Problems Related to Impact Assessment of Agrarian Reform Programmes: The
Philippines Case. Land Reform, Land Settlements, and Cooperatives, 1999(1/2): 63-74
Monsod, T. M., Piza, S. F., & Tutor, M. (2016). Has agrarian reform improved the living standards of
beneficiaries and their communities? An impact assessment of the welfare effects of agrarian reform
covering the period 1990 to 2010. Philippine Center for Economic Development. Study commissioned by
the Department of Agrarian Reform.
Olano, J.N.D. (2002). Land conflict resolution: case studies in the Philippines. In Groppo (Ed.), Land
reform, land settlement and cooperatives. Food and Agriculture Organization of the United Nations.
Retrieved on 25 April 2017 from http://www.fao.org/docrep/005/Y3932T/y3932t07.htm#P9_1990.

CARP After 30 Years Draft Final Report
43
Otsuka, K. (1987). Technical Change and Land Reform Implementation: A Comparative Analysis of Five-Rice
Dependent Villages. Paper presented at the First Workshop on Differential Impact of Modern Rice Technology
on Favorable and Unfavorable Production Environment, 23-25 March 1987, at the International Rice Research
Institute, Los Baños, Laguna.
_________ (1991). “Determinants and Consequences of Land Reform Implementation in the Philippines.”
Journal of Development Economics. 35. Pp. 339-355.
Pantoja, et al. 2014. Agrarian Reform Infrastructure Support Project Phase III (ARSIP III) Baseline Study.
UPLBFI.
Pantoja, et al (2017). Assessment of AVAs and SBF for the Modernization of Agriculture. Final Report
submitted to the Philippine Institute for Development Studies (forthcoming Discussion Paper).
Payne, G., A. Durand-Lasserve and C. Rakodi (2007) “Social and economic impacts of land titling programmes in
urban and peri-urban areas: A review of the literature” Presented at the World Bank Urban Research
Symposium, Washington DC, 14-16 May 2007.
Paderanga, C. Jr. (1987). Review of Land Settlements in the Philippines 1900-1975. Philippine Review of
Economics and Business, 24 (1&2) pp 1-54.
Peñalba, L. M., M. R. Bravo, R. M. Reynoso, G. L. Cuarteros, P. Lopez and F. A. Sanchez, , 1994. An Assessment
of the Implementation of the Stock Distribution Option (SDO) in Selected Corporations, DAR-IAST, UPLB.
Presidential Communications Development and Strategic Planning Office & Department of Agrarian
Reform (2014). Q and A: The Comprehensive Agrarian Reform Program. Retrieved on 24 April 2017
from http://www.gov.ph/2014/06/30/q-and-a-the-comprehensive-agrarian-reform-program/.
Presidential Decree No. 27. Decreeing the Emancipation of Tenants from the Bondage of the Soil, Transferring
to Them the Ownership of the Land They Till and Providing the Instruments and Mechanism Therefor.
Putzel, J. (1992). A Captive Land: the politics of agrarian reform in the Philippines. New York: Monthly Review
Press.
Republic Act No. 1199. Agricultural Tenancy Act of the Philippines of 1954. An Act to Govern the Relations
Between Landholders and Tenants of Agricultural Lands (Leaseholds and Share Tenancy)
Republic Act No. 1400. Land Reform Act of 1955. An Act Defining a Land Tenure policy, Providing for an
Instrumentality to Carry out the Policy, and Appropriating Funds for its Implementation.
Republic Act No. 3844. Agricultural Land Reform Code. An Act to Ordain the Agricultural Land Reform Code
and to Institute Land Reforms in the Philippines, Including the Abolition of Tenancy and the Channeling of
Capital into Industry, Provide for the Necessary Implementing Agencies, Appropriate Funds Therefor and for
Other Purposes.
Republic Act No. 6657. Comprehensive Agrarian Reform Law of 1988. An Act Instituting a Comprehensive
Agrarian Reform Program to Promote Social Justice and Industrialization, Providing the Mechanism for its
Implementation, and for Other Purposes.
Republic Act No. 9700. An Act Strengthening the Comprehensive Agrarian Reform Program (CARP), Extending
the Acquisition and Distribution of All Agricultural Lands, Instituting Necessary Reforms, Amending for the
Purpose Certain Provisions of Republic Act No. 6657, Otherwise Known as the Comprehensive Agrarian Reform
Law of 1988, as Amended, and Appropriating Funds Therefor.

CARP After 30 Years Draft Final Report
44
Umehara, H. (1997). "Sonraku-level demiru Philippine Nochi Kaikaku no Tenmatsu (The Particulars of Agrarian
Reform at the Pilot Village in Central Luzon, Philippines)" in Kosuke Mizuno and Shin'ichi Shigetomi (eds.),
Tonanajia no Keizaikaishu to Tochiseido (Economic Development and Land System in South-East Asia). (in
Japanese) Tokyo: Institute of Developing Economies.
University of the Philippines Los Banos Foundation, Inc. 2007. Second Agrarian Reform Communities
Development Project (ARCDP2) Baseline Survey for 44 New ARCs.
University of the Philippines Los Banos Foundation, Inc. 2010. Second Agrarian Reform Communities
Development Project (ARCDP2) Impact Assessment Study.
Urbis Philippines Inc. 2005. Conduct of a Baseline Study for the Second Agrarian Reform Communities
Development.
World Bank (2008). CARP from the Taxpayer’s Point of View. Revisiting the Agenda on Land Reform and Rural
Development Policy Brief Series Number 3, 2008. Washington, D.C.: The World Bank.
__________ (2009). Land Reform, Rural Development, and Poverty in the Philippines: Revisiting the Agenda.
Technical Working Paper No. 49503. Washington, D.C.: The World Bank.

CARP After 30 Years Draft Final Report
45
Table 1. Initial Scope of CARP LAD Component by Land Type and Phase (as of 1991)
Land Type by Phase Area Number of Beneficiaries
Ha ('000) % No. ('000) %
Natonal 3,820.9 100.00 1,553.5 100.00
Phase I 1,054.8 27.61 631.6 40.66
1. Rice and corn lands 727.8 19.05 522.70 33.65
2. Idle and abandoned lands 250.0 6.54 83.30 5.36
3. Foreclosed, surrendered a and PCGG -sequestered lands 2.5 0.07 0.80 0.05
4. Government-owned agricultural lands 74.5 1.95 24.80 1.60
Phase II 1,184.8 31.01 394.9 25.42
1. Resettlements 478.5 12.52 159.50 10.27
2. Private agricultural lands exceeding 50 ha 706.3 18.49 235.40 15.15
Phase III 1,581.3 41.39 527.0 33.92
1. Private agricultural lands between 5 and 24 has 1,063.6 27.84 354.50 22.82
2. Private agricultural lands between 24 and 50 has 517.7 13.55 172.50 11.10
Source: data adapted from Table 2 in Adriano (1991)
a Philippine Commission for Good Government
b scope of commercial farms was estimated at 35,635 hectares.
CARP implementation on commercial farms was to be implemented starting 1998.

CARP After 30 Years Draft Final Report
46
Table 2. LAD Accomplishment by Region
Region Scope PAL Non-PAL
Non-CARPable Portion
Total Net Area Distributed
% Accomplished
National 5,425,343 2,625,547 2,116,033 81,457 4,823,037 88.9%
CAR 105,774 27,651 74,684 358 102,693 97.1%
I 144,516 118,190 24,855 137 143,182 99.1%
II 417,740 209,022 157,061 7,480 373,562 89.4%
III 449,788 326,464 102,929 8,424 437,817 97.3%
IV-A 218,503 142,763 46,512 9,026 198,302 90.8%
IV-B 190,936 101,573 78,417 7,257 187,247 98.1%
V 413,545 265,975 57,003 4,096 327,075 79.1%
VI 257,651 153,687 67,216 5,404 226,307 87.8%
VII 84,749 38,537 39,089 3,803 81,429 96.1%
NIR 427,656 221,598 70,701 10,077 302,376 70.7%
VIII 494,005 105,493 326,825 1,535 433,852 87.8%
IX 238,273 143,937 84,365 1,112 229,414 96.3%
X 362,166 145,450 193,440 3,796 342,686 94.6%
XI 261,517 173,055 74,980 2,869 250,905 95.9%
XII 731,098 230,233 447,616 8,923 686,773 93.9%
CARAGA 294,654 82,776 187,886 7,131 277,793 94.3%
ARMM 332,773 139,141 82,453 30 221,624 66.6% Source: Author’s presentation of data from DAR PIMD (as of end of 2016)

CARP After 30 Years Draft Final Report
47
Table 3. CARP LAD Accomplishment vs Scope (as of Dec 2016)
Province
Scope (Gross
Area in
hectares)a/
Total LAD Accomplishment ARBs Benefited (head count) LAD Balance
Gross Reformed Area
(Ha)a/
% to
Scope
% to
Outputs Number % to ARBs
Gross
Area
% to
Scope
National 5,423,541 4,823,037 88.9% 100.0% 2,807,108 100.0% 600,504 11.1%
SOP b/ 3,796,479 2,568,009 67.6% 53.2% 1,474,033 52.5% 1,228,470 32.4%
Other Provinces 1,627,062 2,255,028 137.6% 46.8% 1,333,075 47.5% - - Source: Author’s summary of data from DAR PIMD (as of end of 2016)
a/ Gross reformed area refers to total area covered including retained area of landowner. Retained area represents only about 1% of area covered
b/ Strategic Operation Provinces (SOPs) was estimated to represent 70% of scope. It includes:Pangasinan, Kalinga Apayao, Ifugao, Isabela, Nueva Ecija, Pampanga, Batangas, Quezon,
Mindoro Occidental, Sorsogon, Camarines Sur, Antique, Negros Occidental, Bohol, Negros Oriental, Leyte, Western Samar,
Zamboanga del Sur, Bukidnon, Agusan del Sur, Lanao del Norte, South Cotabato, North Cotabato and Maguindanao
Table 4. Pearson Correlation Estimates
Mode of Acquisition Provincial CARP Accomplishment to Agricultural Landholding Gini
Provincial CARP Accomplishment to Ratio of Landless Farmers/Total Farmers
All -0.0901 0.1066
OLT -0.2519 ** 0.3828 ***
GFI -0.0095 0.1089
VOS -0.2245 * 0.0520
CA 0.2795 ** 0.4263 ***
VLT 0.0214 -0.4013 ***
Settlement -0.2346 ** -0.0823
Landed Estates -0.1101 0.3289 ***

CARP After 30 Years Draft Final Report
48
GOL/KKK 0.0873 0.3004 ***
Source: World Bank (2009) pp 82-83 Tables 3-6; 3-7
Table 5. Distribution of CARP Area by Mode and by Period (in hectares)
Land Type/Mode
(1953-1986)
C. Aquino
(1987-1992)
Grand TOTAL
F.Ramos (1993-1998)
J.Estrada/G.Arroyo (1999-2004)
G.Arroyo (2005-2010)
B.Aquino Jr (2011-2016) a/
Total Area (1986-2016)
National 22,439 907,083 1,671,244 631,146 658,027 851,641 4,741,580
PAL (Private Agri Land)
14,955 544,338 839,600 437,385 384,340 404,929 2,625,547
CA
20,073 115,656 84,338 40,992 108,521 369,580
GFI
71,339 51,741 16,174 9,997 22,580 171,831
OLT 14,950
354,005 126,110
30,404 21,101 48,343 594,913
VLT 5 33,399 312,282 134,955 207,528 147,693 835,862
VOS
65,522 233,811 171,513 104,722 77,792 653,360
Non-PAL (non-private agri land)
7,484 362,744 831,643 193,761 273,687 446,714 2,116,033
GOL
145,295 497,156 116,010 177,419 283,724 1,219,604
LES
26,731 25,206 1,726 1,268 27,030 81,961
SETT 7,484 190,718 309,282 76,025 95,001 135,959 814,469
Percent Total Accomplishment (%)
National 100 100 100 100 100 100 100
PAL 67 60 50 69 58 48 55
Non-PAL 33 40 50 31 42 52 45
Percent PAL Accomplishment (%)
PAL 100 100 100 100 100 100 100

CARP After 30 Years Draft Final Report
49
CA - 4 14 19 11 27 14
GFI - 13 6 4 3 6 7
OLT 100 65 15 7 5 12 22
VLT 0 6 37 31 54 36 32
VOS - 12 28 39 27 19 25
Percent Non-PAL Accomplishment Non-PAL 100 100 100 100 100 100 100
GOL - 40 60 60 65 64 58
LES - 7 3 1 0 6 4
SETT 100 53 37 39 35 30 38 Source: DAR MIS, DAR PIMD (as of end of 2016)
a/ period of the implementation of the CARPer Law (RA9700)
CA= compulsory acquisition
GFI = lands owned/foreclosed by government financial institutions
OLT= operation land transfer or lands covered by PD27
VLT = voluntarty land transfer, i.e. direct payment to landowner scheme
VOS= voluntary offer to sell
GOL= government owned landholdings
LES= landed estates
SETT= settlement lands
Table 6. Ecosystem of ARB Lands by Mode of Acquisition
Mode of Acquisition
Lowland irrigated
Lowland non-irrigated
Upland Total Lowland irrigated
Lowland non-irrigated
Upland
VLT/DPS 523 729 417 1669 31.3% 43.7% 25.0%
CA 83 202 174 459 18.1% 44.0% 37.9%
VOS 96 333 298 727 13.2% 45.8% 41.0%
OLT 184 214 242 640 28.8% 33.4% 37.8%
GFI 5 13 24 42 11.9% 31.0% 57.1%
KKK/GOL 1 14 11 26 3.8% 53.8% 42.3%

CARP After 30 Years Draft Final Report
50
SETT 51 64 73 188 27.1% 34.0% 38.8%
LES 8 6 6 20 40.0% 30.0% 30.0%
All Parcels 951 1575 1245 3771 25.2% 41.8% 33.0% Source of Raw Data: 2015 ARB Survey dataset
Table 7. Major Crops on ARB Lands by Ecosystem and Mode of Acquisition
Mode of Acquisition
Lowland Irrigated Lowland Non-irrigated Upland
VLT/DPS Palay, Rice Palay, Banana, Corn Coconut, Palay, Corn
CA Palay, Rice Palay, Banana, Corn Coconut, Corn, Banana
VOS Rice, Sugarcane, Palay Sugarcane, Banana, Rice Corn, Coconut, Sugarcane
OLT Palay, Rice Rice, Corn, Palay Corn, Coconut, Rice
GFI Rice, Calamansi, Palay Rice, Coconut Corn, Coconut
KKK/GOL Rice Rice, Coconut, Banana Sugarcane, Corn
SETT Rice, Palay Corn, Rice, Palay Coconut, Corn, Rice
LES Rice Corn Coconut Source of Raw Data: 2015 ARB Survey dataset
Table 8. LAD Accomplishment by Mode (Collective vs Non-Collective)
Land Type/Mode of Acquisition
Total Accomplishment (in hectares)
Collective CLOA Issued (in hectares)
% to Total Collective CLOA
Issued
Non-collective CLOA Issued (in hectares)
% to Total Collective CLOA
Issued
CA 357,106 143,513 6.6 213,593 8.4
VOS 650,537 405,893 18.7 244,644 9.6
OLT/PD 27 594,175 546 0.0 593,629 23.3
GFI/EO 407/448 171,391 125,446 5.8 45,945 1.8
VLT/DPS 835,561 432,829 20.0 402,732 15.8
Landed Estate 81,494 12,287 0.6 69,207 2.7
SETT 811,242 339,036 15.6 472,206 18.5
KKK/GOL 1,217,339 708,565 32.7 508,774 19.9
Total 4,718,845 2,168,116 100.0 2,550,729 100.0 Source of Data: De los Reyes (2016), Field Operations Office, Department of Agrarian Reform

CARP After 30 Years Draft Final Report
51
Table 9. Inventory of Collective CLOA as of January 1, 2016
Total Area of Collective CLOAs Issued (Total Scope) 2,168,116
Less: Already Subdivided
1,064,746
Not for Subdivision:
Timberlands, Forest, Road, Watershed, etc… 115,816
Co-owners opt not to subdivide (prefer Collective Title) 139,134 254,950
Sub Total: 1,319,696
Balance for Subdivision 848,420
Priority for Subdivision:
LBP Compensable Lands (CA, VOS, OLT, & GFI) 228,604
Non-LBP Comp. Lands (LES, SETT, & KKK/GOL) 350,962 579,566
Non-priority for Subdivision:
Awarded to Farmers Association 22,295
Awarded to Farmers Cooperative 43,406
VLT under Co-ownership 203,153 268,854
TOTAL 848,420 Source of Table: De los Reyes (2016), Field Operations Office, Department of Agrarian Reform
Table 10. Land Bank Compensable CARP Area by Region
Region
Land Bank Compensable Lands Non-LBP Compensable Total LAD Outputs
OLT GFI VOS CA Sub-total % to Total LAD Area
Total of VLT, SETT, LES and
GOL/KKK
% to Total
LAD Area
Total Net Distributed
Area
Total Number of
ARBs
National 594,913 171,831 653,360 369,580 1,871,645 37.7 2,951,896 60.5 4,741,580 2,807,108
CAR 1,299 1,239 1,155 370 4,063 0.1 98,273 2.1 27,652 102,336
I 31,261 1,842 8,943 1,657 43,703 0.9 99,342 2.1 120,159 143,045
II 79,603 9,730 51,109 12,852 153,294 3.2 212,790 4.5 254,871 366,084
III 214,487 6,842 29,695 39,388 290,412 6.1 138,980 2.9 342,710 429,392
IV-A 15,943 1,257 30,714 50,032 97,946 2.1 91,329 1.9 169,670 189,275

CARP After 30 Years Draft Final Report
52
IV-B 15,926 2,760 14,005 21,330 54,021 1.1 125,969 2.7 116,518 179,990
V 51,636 17,886 55,278 49,299 174,099 3.7 148,879 3.1 282,692 322,978
VI 30,914 35,002 36,483 18,712 121,111 2.6 99,794 2.1 173,231 220,905
VII 9,272 2,773 7,776 12,612 32,433 0.7 45,194 1.0 38,550 77,627
NIR 21,105 30,486 117,877 43,532 213,000 4.5 79,700 1.7 309,317 292,700
VIII 20,926 8,373 24,264 33,679 87,242 1.8 345,076 7.3 221,244 432,318
IX 10,672 8,291 18,186 18,195 55,344 1.2 172,957 3.6 165,060 228,301
X 16,965 3,155 18,654 15,002 53,776 1.1 285,115 6.0 251,344 338,891
XI 8,696 7,460 69,444 25,332 110,932 2.3 137,103 2.9 208,680 248,035
XII 34,918 13,970 110,444 15,503 174,835 3.7 503,015 10.6 518,046 677,850
CARAGA 6,545 3,562 31,859 9,862 51,828 1.1 218,835 4.6 102,048 270,663
ARMM 24,744 17,203 27,475 2,224 71,646 1.5 149,948 3.2 215,625 221,594 Source: Author’s summary of data from DAR PIMD (as of end of 2016) Notes: Lands acquired and distributed through VLT are compensable but payment is made by beneficiaries directly to landowners. Lands acquired and distributed through LES are compensable but payment is made by beneficiaries directly to DAR.
Table 11. LBP Compensable CARP Area and Value by Mode of Acquisition
Mode of Acquisition Total CARP Area (Has)
Total Amount Paid (PhP)
Average Value (PhP/ha)
CA (RA6657) 271,388 15,293,342,695 56,352
CA (RA9700) 20,569 2,570,843,385 124,987
OLT (EO228) a/ 126,903 663,305,992 5,227
OLT (RA 6657) 295,110 2,312,963,020 7,838
OLT (RA 9700) 298 2,987,050 10,015
GFIs (RA6657) 3,614 175,473,445 48,553
GFIs (RA9700) 98,585 1,206,531,360 12,238
VOS (RA6657) 636,706 36,926,420,986 57,996
VOS (RA9700) 27,168 3,810,414,396 140,256
LO 11,177 81,858,834 7,324
R3 17,192 80,071,627 4,658
Grand Total 1,508,709 63,124,212,791 41,839.88

CARP After 30 Years Draft Final Report
53
Source: Author’s estimate from LBP claims data as of end 2013
a/ combined codes EO and E9 which refer to OLT claims valued based on PD27 (EO228)
CA (RA6657) – Compulsory Acquisition Funded under RA 6657
CA (RA9700) – Compulsory Acquisition Funded under RA 9700
E4 (GFI RA6657) – EO 407 Funded under RA 6657
E7 (GFI RA9700)– EO 407 Funded under RA 9700
E9 (OLT)– EO 228 Funded under RA 9700
EO (OLT) – EO 228 Funded under RA 6657
PD (OLT) – PD 27 Claims valued based on RA6657- date of taking.
P9 (OLT)– PD 27 Claims Funded under RA 9700
LO – LOI 1180 (Special Acquisition of Hacienda Tabacalera in Ilagan, Isabela)
R3 – RA 3844 Agrarian Code of 1963
Table 12 – Average Land Values by Mode and by Crop
CROP CARP Area
(Hectares)
Percent Distribution
Average Land Value (PhP/Ha)
CA (9700)
CA (RA6657) GFIs (RA6657) GFIs (RA9700) OLT (RA 9700) OLT (RA 6657) VOS (RA9700) VOS (RA6657) All Modes
Rice 475,032 31.5 132,812 57,535 78,822 12,837 8,576 8,125 118,020 69,956 18,679
Corn 139,773 9.3 79,759 29,377 41,594 7,032 8,413 5,540 83,136 38,292 26,013
Banana 6,800 0.5 83,967 263,540 22,871 22,259
124,973 212,155 222,773
Coconut 140,947 9.3 60,438 35,345 47,034 10,130
96,287 39,500 37,004
Rubber 7,663 0.5 41,510 87,318 23,169 11,598
65,116 52,309 57,174
Sugar 56,278 3.7 313,849 103,725 140,760 59,583
307,411 127,697 119,379
Fruit Tree 9,219 0.6 124,425 151,230 66,893 28,336
2,800 165,925 165,355 133,062
Others 107,637 7.1 70,638 41,631 23,757 10,847
7,128 57,165 40,294 39,336
Combined 544,161 36.1 138,433 54,641 57,125 12,474 28,447 6,524 169,016 60,851 56,895
Banana combined with other crops 5,719 0.4 115,214 48,365 17,214 11,320
59,501 84,733 69,426
Coconut Combined with other crops 129,021 8.6 75,575 32,440 41,656 14,205
109,509 35,788 34,581
Corn Combined with other crops 93,107 6.2 80,741 34,099 67,179 7,670
5,449 85,842 42,500 37,930

CARP After 30 Years Draft Final Report
54
Rice Combined with other crops 159,462 10.6 112,087 45,366 68,261 9,607 28,447 6,941 110,827 44,464 33,506
Rubber Combined with other crops 4,813 0.3 63,818 62,064 59,997 8,239
150,679 46,058 48,662
Sugar Combined with other crops 111,544 7.4 268,212 119,337 80,339 37,239
245,021 123,359 134,912
Fruit Tree Combined with other crops 7,379 0.5 137,360 81,272 58,864 16,646
186,206 101,835 92,337
Others Combined with other crops 24,687 1.6 66,614 37,643 31,090 9,778
74,604 36,735 40,406
Idle First 8,429 0.6 37,599 29,319 45,493 10,633
60,907 31,105 31,438
IDLE 21,200 1.4 51,819 19,791 21,431 6,763
9,208 23,362 11,375 14,513
All Crops 1,508,709 100.0 124,987 56,352 48,553 12,238 10,015 7,838 140,256 57,996 41,840
Source: Authors estimate from LBP Claims data as of end 2013
Table 13. National Annual Palay Yield and Land Compensation Values
Year
Yield (cavans/ha/year) Gross Revenue (P/ha) Estimated CNI 6% (P/ha) Land Compensation Values (P/ha) Average Irrigated Rainfed Upland Average Irrigated Rainfed Upland Average Rainfed Irrigated
1993 96.19 111.64 43.71 29.45 8,417 9,769 3,825 2,577 23,170.68 10,529.06 26,892.35 16,381.65
1994 97.21 113.99 43.19 31.92 8,506 9,974 3,779 2,793 23,416.39 10,403.80 27,458.43 15,548.08
1995 93.39 108.4 42.28 30.9 8,172 9,485 3,700 2,704 22,496.21 10,184.60 26,111.88 31,419.08
1996 98.78 114.63 43.22 28.55 8,643 10,030 3,782 2,498 23,794.58 10,411.03 27,612.60 25,330.53
1997 101.61 117.62 42.85 29.78 8,891 10,292 3,749 2,606 24,476.28 10,321.90 28,332.84 29,020.72
1998 90.68 102.91 38.46 32.77 7,935 9,005 3,365 2,867 21,843.41 9,264.42 24,789.43 36,561.24
1999 104.45 118.63 43.60 28.1 9,139 10,380 3,815 2,459 25,160.39 10,502.57 28,576.13 36,241.56
2000 107.71 122.24 44.60 33.45 45,346 51,463 18,777 14,082 124,835.76 51,691.35 141,676.01 89,887.35
2001 110.9 124.95 47.28 35.46 45,303 51,042 19,314 14,485 124,716.67 53,170.46 140,517.11 96,489.96
2002 115.74 129.74 49.57 37.18 51,041 57,215 21,860 16,396 140,515.09 60,180.86 157,511.90 98,649.17
2003 114.06 127.64 50.47 37.85 50,415 56,417 22,308 16,730 138,789.47 61,412.45 155,313.77 105,626.19
2004 120.82 134.77 53.28 39.96 57,087 63,679 25,175 18,881 157,159.82 69,305.37 175,305.65 108,990.62
2005 122.03 136.88 52.7 39.52 63,639 71,383 27,483 20,610 175,195.04 75,659.91 196,514.77 117,202.26
2006 128.25 142.72 56.03 42.02 67,075 74,643 29,304 21,976 184,654.52 80,672.07 205,488.45 123,474.35
2007 131.56 145.59 58.57 43.93 73,739 81,603 32,828 24,623 203,002.02 90,375.71 224,650.84 121,944.03
2008 130.23 143.01 59.68 44.76 92,007 101,037 42,164 31,623 253,293.53 116,075.85 278,150.25 148,426.65

CARP After 30 Years Draft Final Report
55
2009 131.12 179.52 82.73
93,623 128,180 59,066 - 257,740.30 162,606.69 352,873.91 149,151.53
2010 131.50 180.98 82.01
100,924 138,905 62,943 - 277,839.76 173,278.88 382,400.64 131,879.91
2011 134.44 182.61 86.27
91,082 123,719 58,445 - 250,745.32 160,897.66 340,592.98 130,987.09
2012 140.47 192.27 88.66
100,785 137,957 63,613 - 277,458.30 175,125.39 379,791.20 133,976.44
2013 141.60 193.91 89.28
122,695 168,026 77,364 - 337,775.20 212,979.29 462,571.12 122,105.78
2014 160.07 201.05 90.22
160,070 201,050 90,220
440,667.30 248,372.61 553,483.86 153,358.16 Source: Authors estimate from the data of the Bureau Agriculture Statistic;
Note: Yield per cropping from BAS data adjusted to annual yield using crop intensity in irrigated farms
irrigated= 2.27; rainfed =1.46
Upland data from2009 onwards not available
Gross revenue estimated from yield and farmgate price
CNI = capitalized net income at 6% for 30 years. Net income estimated at 20% of gross revenue Excludes landholdings compensated based on PD27/EO228 or RA3844 (EO, E9, LO, R3) Land compensation values estimated from Land Bank data
Table 14. Distribution of CARP Compensable Landholdings by Value and by Crop
Value (P/hectare)
Number of LandHoldings (LH) a/ Total
RICE b/ CORN COCONUT SUGAR BANANA FRUIT TREE RUBBER Combined
Crops IDLE OTHERS No. of LH
% to Total
below 20,000 19,613 5,771 4,959 210 141 175 104 8,722 1,893 3,011 44,599 37.7
20,000-39,999 1,892 4,478 6,156 224 75 166 58 7,307 277 2,163 22,796 19.3
40,000-79,999 5,184 4,034 5,438 918 529 167 150 9,202 189 2,037 27,848 23.5
80,000-119,999 2,427 712 1,267 1,615 203 165 36 4,153 20 566 11,164 9.4
120,000-199,999 2,850 91 165 1,765 72 305 25 3,805 28 282 9,388 7.9
200,000-299,999 160 12 27 365 25 113 12 1,048 11 53 1,826 1.5
300,000-499,999 8 2 4 102 60 56 2 326 6 33 599 0.5
500,000-999,999 3
3 4 37 68
22 1 4 142 0.1
1,000,000 and above 3 1 1 2 1 1
3 1 6 19 0.0
Total number of LH 32,140 15,101 18,020 5,205 1,143 1,216 387 34,588 2,426 8,155 118,381 100 Source: Authors estimate from LBP Claims data as of end 2013

CARP After 30 Years Draft Final Report
56
a/ landholding refers to Landowners lot
b/ excludes 17,783 landholdings valued using EO228 or PD27 valuation formula
Table 15. CARP Land Compensation Subsidy by Program Type (in Million pesos; as of March 30, 2015)
Program Type Land Value Paid to LO
Increase Due to Revaluation/Court
Decision
Land value to be Amortized by Farmers a/
Total Land Price Subsidy
Regular Subsidy
c/
No. of FBs d/
Average Amount to be Amortized per
FB (Pesos)
Land price Subsidy per FB
(in Pesos)
( a ) (b) (c) (d)= {(a) + (b)} - (c) ( e )
PD 27/EO 228 3,228.19 291.07 3,018.32 b/ 500.94 0.00 282,326 10,690.90 1,774.35
RA 6657 54,545.67 2,480.91 44,853.24 12,173.34 6,566.63 577,666 77,645.64 21,073.31
RA 9700 8,659.15 4.84 7,690.57 973.42 1,015.01 38,960 197,396.65 24,985.04
Total Php66,433.01 Php2,776.82 Php55,562.14 Php13,647.70 Php7,581.64 898,952 61,807.68 15,181.79
Source: Authors estimate from LBP Agrarian Reform Receivables System (ARRS) summary tables
a/ Includes ARBs with and without LDIS b/ Inclusive of P1,205.38 Million fully paid accounts prior to system conversion c/ Regular subsidy is subsidy to farmer beneficiary on regular amortization payments d/ Estimated based on average area per FB as follows: (1) 1.5 for PD27 ; (2) 1.8 for RA6657 and 9700
Table 16. Loan Collection Performance of Farmer Beneficiaries (as of March 2015)
Program Type LO Compensation (in
Million pesos)
Amount to be Amortized by Farmer Beneficiaries (in Million pesos) Amount Collected From ARBs (in Million pesos)
Collection Performance (%)
With LDIS Without LDIS
(d) TOTAL
( e ) Principal
(f) Interest
(g) Not Yet Due (h)
FAR (i)
ADC NYD

CARP After 30 Years Draft Final Report
57
Principal (a) Interest
(b)
( c )
Principal P+I
PD27/EO228 3,228.19 1,678.81 1,722.63 90.31
1,769.12 608.98 1,057.50 36.67 457.16
37.64% 49.54%
RA 6657 54,545.67 2,727.25 2,069.97 8,457.14 34,326.14 11,184.39 1,116.98 676.56 1,563.07 2,957.96
62.47% 52.77%
RA 9700 8,659.15 30.34 16.92 544.99 7,128.66 575.33 4.62 2.76 17.10 23.36 45.78% 38.03%
TOTAL 66,433.01 4,436.40 3,809.52 9,092.44 41,454.80 13,528.85 1,730.58 1,736.82 1,616.83 3,438.49 55.30% 51.55%
AOC I 325.24 83.23 47.28 124.53 32.00 207.76 50.17 44.43 57.89 33.64
76.57% 80.94%
AOC II 3,414.32 389.30 357.68 1,382.28 1,214.05 1,771.58 149.74 166.95 186.00 173.87
58.36% 53.88%
AOC III-A 3,335.46 405.07 406.12 1,003.14 606.55 1,408.21 165.58 159.06 261.91 132.14
64.09% 54.66%
AOC III-B 2,637.21 895.28 610.36 1,251.38 800.11 2,146.65 516.56 728.45 334.76 236.13
69.21% 85.84%
AOC VI-A 2,898.04 82.55 71.50 214.61 2,140.64 297.16 32.50 31.31 30.20 143.34
55.61% 51.02%
AOC VI-B 16,228.57 95.26 65.09 331.89 13,385.80 427.15 31.93 37.61 10.48 290.28
40.11% 46.84%
AOC IV 5,388.39 339.49 268.59 845.44 3,221.65 1,184.92 133.94 76.18 164.86 543.20
59.24% 48.51%
AOC V 3,361.40 345.03 249.96 579.13 1,635.47 924.15 102.91 88.17 72.42 189.42
42.00% 39.48%
AOC VII 5,297.39 72.13 50.31 485.72 3,950.69 557.85 16.24 12.60 14.99 129.04
35.85% 31.90%
AOC VIII 1,526.23 43.27 49.71 67.30 1,173.38 110.57 8.98 7.19 7.21 135.39
32.08% 23.34%
AOC IX 1,781.13 85.75 27.38 167.45 1,200.25 253.19 24.62 10.68 15.47 157.02
39.61% 39.49%
AOC X 1,901.23 255.25 181.08 572.84 761.15 828.09 147.46 133.82 113.59 228.06
70.78% 71.80%
AOC XI 6,964.88 501.07 258.53 1,050.46 3,357.84 1,551.52 230.96 99.51 265.68 720.50
64.77% 58.14%
AOC XII 11,373.52 843.74 1,165.92 1,016.29 7,975.23 1,860.03 119.00 140.87 81.39 446.07
21.66% 16.32%
Source: Authors summary of LBP collection data Total number of FBs with LBP = 898,952 = 100%
FBs with Partial Repayment
= 110,851 = 12%
FBs with Due and Collectible Amortization but without Repayment = 117,163 = 13%
FBs with Fully Paid Amortization
= 97,633 = 11%
FBs without LDIS / LAS
= 573,305 = 64%

CARP After 30 Years Draft Final Report
58
Table 17. ARR Accounts in Default by Regional AOCs
(as of May 31, 2015)
# of ARR # of
Amount (P) Average Amount of Arrears per FB
(P) AOC Accounts ARBs Area (Ha) Orig. Principal O/S Balance Arrearages % in Arrears
AOC I 6,961 4,619 4,895 83,423,901 77,634,962 35,113,188 45.23 7,601.90
AOC II 41,563 23,042 33,471 1,248,498,915 1,223,030,769 301,538,837 24.66 13,086.49
AOC III-1 17,796 13,576 22,375 955,598,155 931,533,649 238,848,234 25.64 17,593.42
AOC III-2 34,101 25,187 43,143 1,063,884,235 1,010,437,050 399,773,727 39.56 15,872.22
AO IV 23,087 18,644 28,937 845,961,468 823,795,573 208,973,174 25.37 11,208.60
AOC V 34,057 25,784 43,214 660,937,391 636,847,132 239,792,237 37.65 9,300.04
AOC VIA 9,429 6,316 7,765 204,835,116 198,307,834 50,423,100 25.43 7,983.39
AOC VIB 5,849 4,057 6,447 287,263,794 274,433,244 65,191,111 23.75 16,068.80
AOC VII 9,684 7,040 9,215 391,573,004 386,630,924 49,522,135 12.81 7,034.39
AOC VIII 8,487 5,602 8,061 88,583,278 86,234,892 33,570,163 38.93 5,992.53
AOC IX 4,149 3,098 10,965 199,855,237 193,536,786 60,055,443 31.03 19,385.23
AOC X 14,710 11,331 19,782 444,158,831 421,176,275 114,537,117 27.19 10,108.30
AOC XI 24,312 16,553 26,989 939,992,576 908,515,794 264,298,288 29.09 15,966.79
AOC XII 33,031 28,847 73,341 1,659,715,015 1,633,155,478 722,552,562 44.24 25,047.75
TOTAL 267,216 193,696 338,598 9,074,280,917 8,805,270,362 2,784,189,316 31.62 14,374.02 Source: Authors summary of LBP ARR summary tables
AOCs= agrarian operations center
Default refers to farmer beneficiary accounts with 3 or more annual amortization arrearages
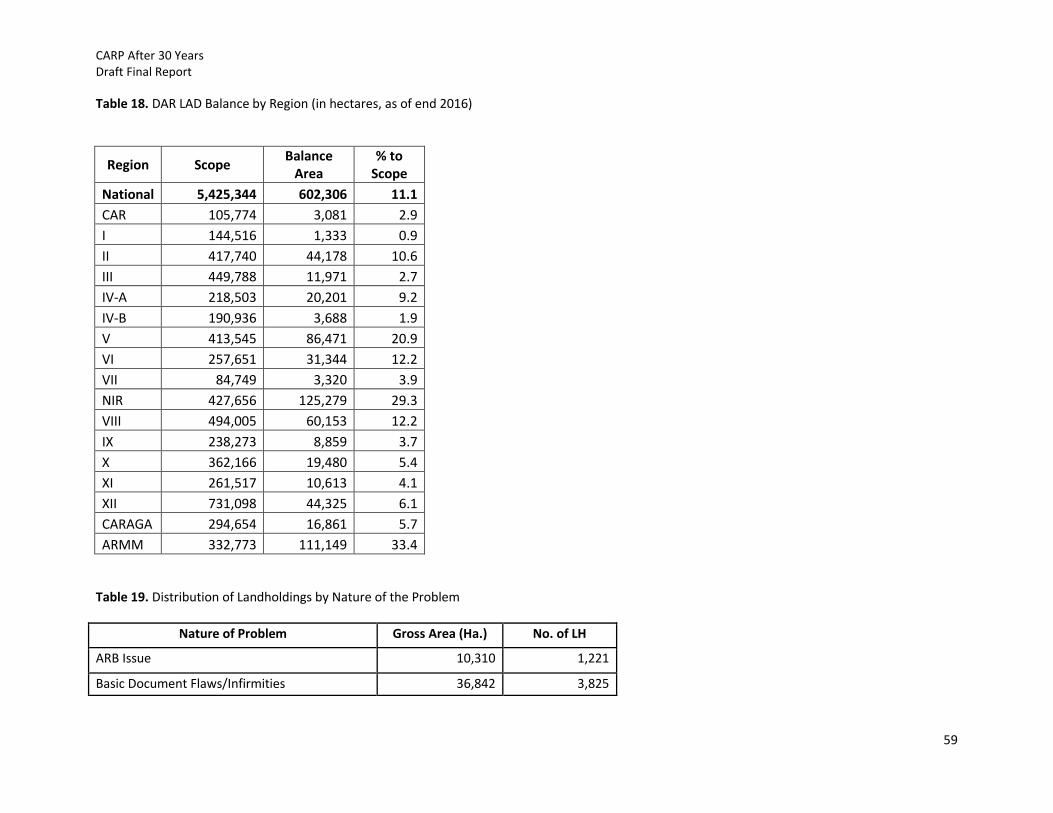
CARP After 30 Years Draft Final Report
59
Table 18. DAR LAD Balance by Region (in hectares, as of end 2016)
Region Scope Balance
Area % to
Scope
National 5,425,344 602,306 11.1
CAR 105,774 3,081 2.9
I 144,516 1,333 0.9
II 417,740 44,178 10.6
III 449,788 11,971 2.7
IV-A 218,503 20,201 9.2
IV-B 190,936 3,688 1.9
V 413,545 86,471 20.9
VI 257,651 31,344 12.2
VII 84,749 3,320 3.9
NIR 427,656 125,279 29.3
VIII 494,005 60,153 12.2
IX 238,273 8,859 3.7
X 362,166 19,480 5.4
XI 261,517 10,613 4.1
XII 731,098 44,325 6.1
CARAGA 294,654 16,861 5.7
ARMM 332,773 111,149 33.4 Table 19. Distribution of Landholdings by Nature of the Problem
Nature of Problem Gross Area (Ha.) No. of LH
ARB Issue 10,310 1,221
Basic Document Flaws/Infirmities 36,842 3,825
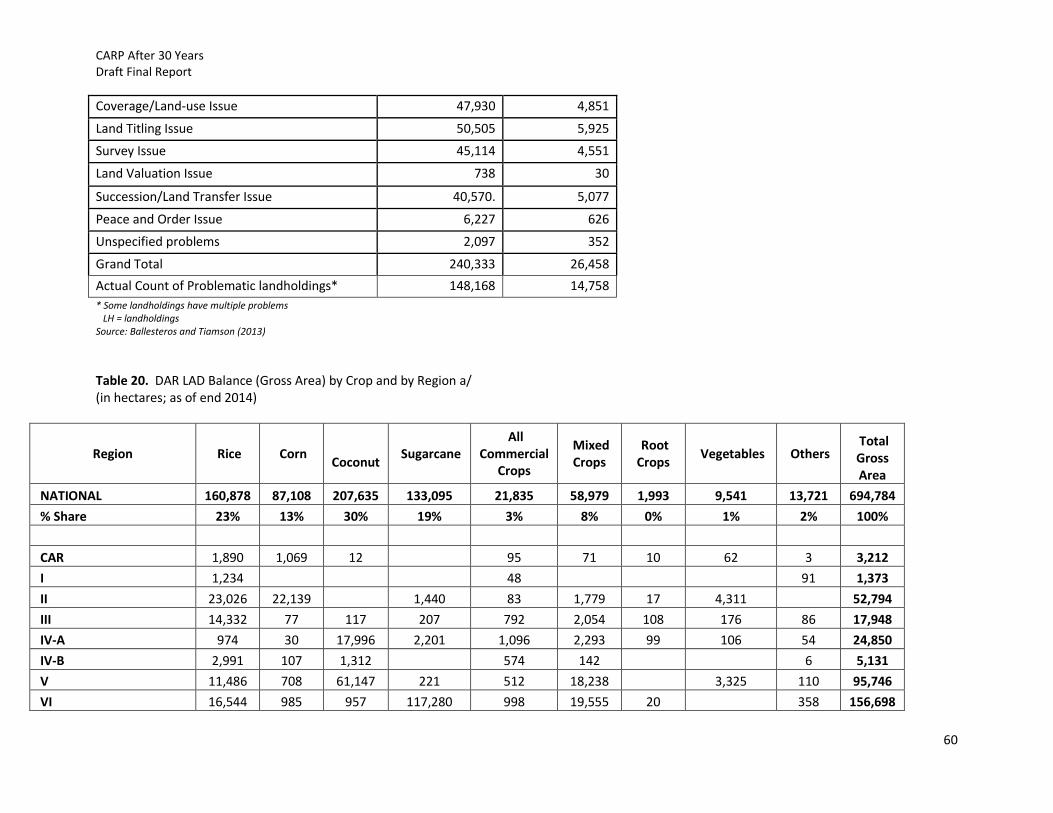
CARP After 30 Years Draft Final Report
60
Coverage/Land-use Issue 47,930 4,851
Land Titling Issue 50,505 5,925
Survey Issue 45,114 4,551
Land Valuation Issue 738 30
Succession/Land Transfer Issue 40,570. 5,077
Peace and Order Issue 6,227 626
Unspecified problems 2,097 352
Grand Total 240,333 26,458
Actual Count of Problematic landholdings* 148,168 14,758
* Some landholdings have multiple problems LH = landholdings Source: Ballesteros and Tiamson (2013)
Table 20. DAR LAD Balance (Gross Area) by Crop and by Region a/ (in hectares; as of end 2014)
Region Rice Corn
Coconut Sugarcane
All Commercial
Crops
Mixed Crops
Root Crops
Vegetables Others Total Gross Area
NATIONAL 160,878 87,108 207,635 133,095 21,835 58,979 1,993 9,541 13,721 694,784
% Share 23% 13% 30% 19% 3% 8% 0% 1% 2% 100%
CAR 1,890 1,069 12
95 71 10 62 3 3,212
I 1,234
48
91 1,373
II 23,026 22,139
1,440 83 1,779 17 4,311
52,794
III 14,332 77 117 207 792 2,054 108 176 86 17,948
IV-A 974 30 17,996 2,201 1,096 2,293 99 106 54 24,850
IV-B 2,991 107 1,312
574 142
6 5,131
V 11,486 708 61,147 221 512 18,238
3,325 110 95,746
VI 16,544 985 957 117,280 998 19,555 20
358 156,698

CARP After 30 Years Draft Final Report
61
VII 2,518 3,912 496 2,514 71 25 11
6,966 16,513
VIII 8,696 1,122 45,328 6,193 489 40 1,330 270 21 63,488
X 3,511 13,162 16,550 1,463 1,141 805 102 52 357 37,142
XI 957 933 8,382 150 1,783 689
74 12,967
XII 19,009 19,926 4,745 1,419 4,251 3,413
36 2,671 55,471
CARAGA 4,726 2,451 8,845
4,848 6,155 250
273 27,548
ARMM 47,609 19,761 33,244 8 4,052 3,720 45 1,204 2,644 112,289 Source: Summaary table from DAR Field Operations data a/ breakdown of LAD balance by crop not available as of end 2016. Table 21. DAR LAD Balance (Gross Area) by Land Size (PAL Only) (in hectares; as of end 2014)
Region/Province > 50 > 24 to 50 > 10 to 24 > 5 to 10 5 and below Total Gross
Area
Total Gross Area (excluding 10 ha
and below)
NATIONAL 191,948 65,606 207,894 164,178 5,946 635,571 465,447
% Share 30% 10% 33% 26% 1% 100%
CAR 294 293 1,213 849 164 2,812 1,799
I 692 107 361 175 12 1,346 1,160
II 15,414 2,361 10,620 17,076 120 45,591 28,395
III 1,625 855 4,143 2,520 148 9,289 6,622
IV-A 8,212 3,415 7,153 5,887 137 24,804 18,779
IV-B 545 437 1,201 1,525 38 3,747 2,183
V 15,874 10,240 32,235 34,864 1,189 94,401 58,349
VI 67,524 26,950 38,252 19,421 1,022 153,168 132,725
VII 6,909 1,243 5,186 2,689 81 16,107 13,338
VIII 8,190 5,455 24,037 23,999 106 61,788 37,683

CARP After 30 Years Draft Final Report
62
IX 1,474 919 6,718 2,466 24 11,600 9,111
X 8,584 2,934 12,218 10,242 357 34,335 23,736
XI 3,742 1,292 4,194 3,555 76 12,860 9,229
XII 5,330 2,613 13,081 14,511 454 35,990 21,024
CARAGA 2,584 483 6,835 10,623 196 20,720 9,902
ARMM 44,954 6,009 40,449 13,777 1,824 107,013 91,412 Source: Author’s summary from DAR Field Operations data Note: Breakdown of LAD balance by size not available in 2016.
Table 22. Distribution of parcels by tenure status, CAF 2002
Tenure Status CAF 1991 CAF 2002
Number of Parcels % to Total Number of Parcels % to Total
Fully owned 2,149,153 44.1 1,513,034 43.8
Tenanted 961,664 19.7 641,209 18.6
Leased/rented 266,983 5.5 196,304 5.7
Rent-free 691,150 14.2 315,924 9.2
Held under CLT/CLOA 143,281 2.9 142,077 4.1
Owner-like Possession Other than CLT/CLOA 586,048 12.0 513,599 14.9
Others 62,423 1.3 39, 583 1.1
Not reported 14,928 0.3 90,037 2.6
Total 4,875,630 100.0 3,451,767 100.0

CARP After 30 Years Draft Final Report
63
Table 23. Approved Stock Distribution Applications, Status Report, as of June 2015
CORPORATION LOCATION REPRESENTA-
TIVE/ DESIGNATION
CROPS PRODUCED
AREA (ha)
NO. OF FWBs
DATE AP-PROVED
STATUS
1 Hacienda Luisita, Inc.
San Miguel, Tarlac
Mr. Pedro Cojuanco, President
sugarcane 4,916 6,296 11 Nov. 1989
SDO revoked; Land Distribution ongoing
2 Archie Fishpond, Inc
Bago City, Negros Occ.
Mr. Arsenio Al Acuna
prawn culture/ sugar
102 155 15 Feb. 1991
Merged as one corporation with AA Acuña Agricultural Corp. as the surviving one. Complete folders pertaining to the Petition for revocation was returned to the DARRO Task Force on SDO for further action. On March 9, 2009, The DARRO Task Force was specifically directed to initiate negotiation between the LO/Corp representative and the FWBs to possibly improve the terms of reference in the Memorandum of Agreement. In compliance thereto, DARRO VI submitted a report on Dec.19,2009 with the following updates:1. FWBs were advised to organize themselves to enable them to comply with the requirements of AO 1, S.2006 on the filling of petition for Revocation of SDO and to enable them to bargain for better benefits and improve the MOA; 2. Joint regional-provincial TFs on SDO shall conduct monitoring of the reorganization of FWBs on the first quarter of 2010.
3 Arsenio Al Alcuna Agricultural Corp.
Cadiz, Negros Occ.
-do- sugarcane 108 93
4 Elenita Agricultural Development Corp.
Brgy. Burgos Cadiz City, Negros Occ.
-do- sugarcane 113 82
5 Ma. Clara Marine Ventures, Inc.
Bago City, Negros Occ.
-do- sugarcane 58 58
6 Palma Kabankalan Agricultural Corp.
Kabankalan-Ilog, Negros Occ.
-do- sugarcane 219 113
7 Tabigue Marine Ventures, Inc
EB Magalona, Negros Occ.
-do- sugarcane 50 64

CARP After 30 Years Draft Final Report
64
CORPORATION LOCATION REPRESENTA-
TIVE/ DESIGNATION
CROPS PRODUCED
AREA (ha)
NO. OF FWBs
DATE AP-PROVED
STATUS
8
Ledesma Hermanos Agricultural Corporation
San Carlos, Negros Occ.
Mr. Julio Ledesma/ Carlos Ledesma, Stockholders
sugarcane
1,024
747
13 May, 1991
On July 28. 2010 the DARPO Task Force on SDO conducted monitoring, field validation and interview at Hacienda Fortuna, Brgy Buluangon, San Carlos City. The corporation allowed the DARPO TFSDO to inspect its books and other financial records. The FWBs affirmed that they are covered by Philhealth, they may avail of dental services which they may reimburse to the corporation upon presentation of receipts. They may avail of free medical consultation at the Nabingalan Planters Association clinic and may also avail of medical loans through the Credit cooperative. They are likewise given housing allowance, SIL, bereavement, maternity and paternity leaves, They receive 13th month pay, milling incentive bonus, pension, retirement and separation pay. The corporation had put up a deep well and toilet facilities for the FWBs. The corporation likewise put up relocation sites for retirees at 150 square meter per retiree. Aside from these, the corporation also extends benefits to the FWBs that were not stipulated in the MOA. 1. Congrits Milling Pa-premyo given in kind- congrits 3-50 kilos to harvesting laborers based on performance. 2. Milling premium of Milling Cabo (P6.00 per day), dispatcher, checker,
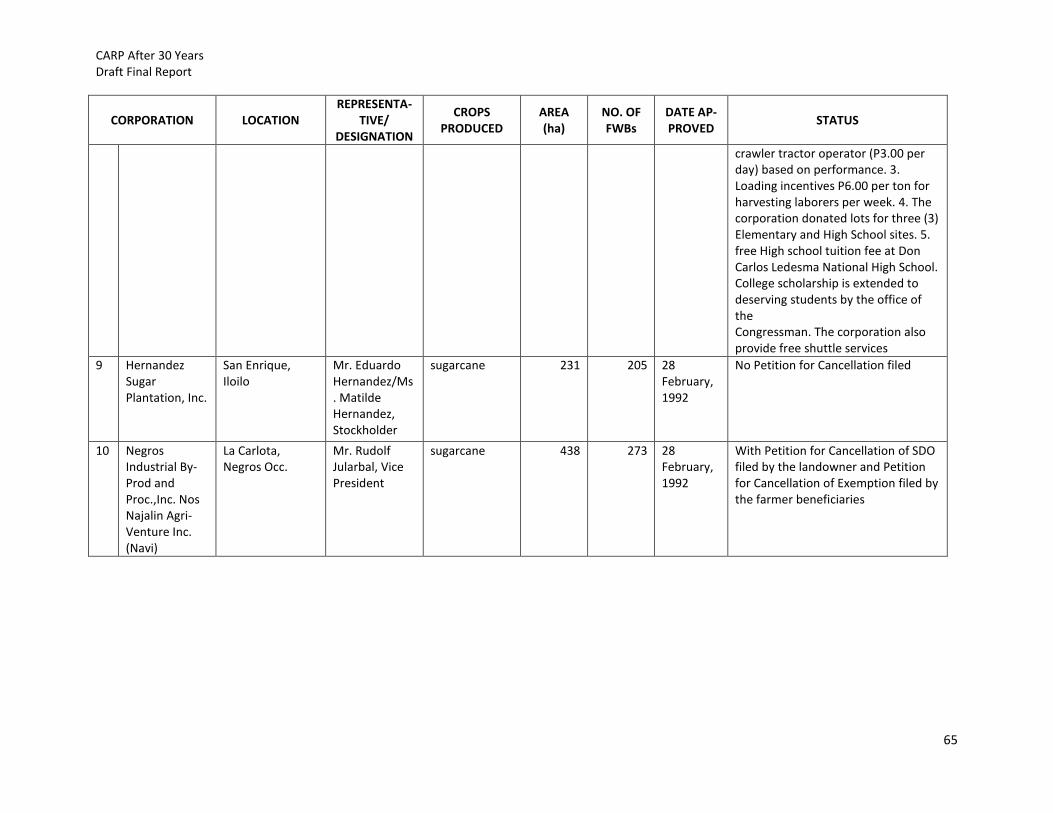
CARP After 30 Years Draft Final Report
65
CORPORATION LOCATION REPRESENTA-
TIVE/ DESIGNATION
CROPS PRODUCED
AREA (ha)
NO. OF FWBs
DATE AP-PROVED
STATUS
crawler tractor operator (P3.00 per day) based on performance. 3. Loading incentives P6.00 per ton for harvesting laborers per week. 4. The corporation donated lots for three (3) Elementary and High School sites. 5. free High school tuition fee at Don Carlos Ledesma National High School. College scholarship is extended to deserving students by the office of the Congressman. The corporation also provide free shuttle services
9 Hernandez Sugar Plantation, Inc.
San Enrique, Iloilo
Mr. Eduardo Hernandez/Ms. Matilde Hernandez, Stockholder
sugarcane 231 205 28 February, 1992
No Petition for Cancellation filed
10 Negros Industrial By-Prod and Proc.,Inc. Nos Najalin Agri-Venture Inc. (Navi)
La Carlota, Negros Occ.
Mr. Rudolf Jularbal, Vice President
sugarcane 438 273 28 February, 1992
With Petition for Cancellation of SDO filed by the landowner and Petition for Cancellation of Exemption filed by the farmer beneficiaries

CARP After 30 Years Draft Final Report
66
CORPORATION LOCATION REPRESENTA-
TIVE/ DESIGNATION
CROPS PRODUCED
AREA (ha)
NO. OF FWBs
DATE AP-PROVED
STATUS
11
Calatrava Negros Occ.
Calatrava, Negros Occ.
Mr. Otto G. Weber, Jr., Corporate Secretary
Sugarcane
174
177
01 Sept, 1992
On October 22, 2010 the recommendation of the DARCO- MCSDO on the Petition of the FWBs for the revocation of the Stock Distribution Option (SDO) was presented to the PARC technical Committee. The PARC Technical committee favorably endorsed the MCSDO's recommendation and agreed to elevate the matter to the PARC Executive Committee.
12
SVJ Farms, Inc
Talisay, Negros Occidental
Ms. Regina Villanueva, Chairman of the Board
sugarcane
170
143
16 Nov. 1992
On March 17. 2015 the recommendation of the DARCO- MCSDO on the Petition of the FWBs for the revocation of the Stock Distribution Option (SDO) was presented to the PARC technical Committee. The PARC Technical committee favorably endorsed the MCSDO's recommendation and agreed to elevate the matter to the PARC Executive Committee.
13
Asia Agro-Industrial Enterprises
Don Marcellino, Davao del Sur
Mr. Henry C. Wee, President and Chairman of the Board
coconut
100
29
26 April, 1994
On March 17. 2015 the recommendation of the DARCO- MCSDO on the Petition of the FWBs for the revocation of the Stock Distribution Option (SDO) was presented to the PARC technical Committee. The PARC Technical committee favorably endorsed the MCSDO's recommendation and agreed to elevate the matter to the PARC Executive Committee.

CARP After 30 Years Draft Final Report
67
CORPORATION LOCATION REPRESENTA-
TIVE/ DESIGNATION
CROPS PRODUCED
AREA (ha)
NO. OF FWBs
DATE AP-PROVED
STATUS
Others: On-going Assessment for SDO Approval
1 14 Colored Corporation
EB Magalona and La Carlota City, Negros Occ.
Mr. Arturo J. Ledesma and Ms. Teresa Barrientos, Authorized Representatives
sugarcane 747 663 Persuant to the agreement during the Dec. 17. 2009 PARC Execom Meeting, site validation and consultation were conducted of Feb.3-4,2010 by the PARC Execom designated Validation Team. Results of site validation/consultation were presented during the PARC Execom Meeting on June 2,2010.
2 Garcona Agro-Industrial Corporation
Caputatan Norte, Medellin, Cebu City
Manuel R. Garcia, President
sugarcane 46 47 With PARC Execom. Motion for reconsideration for the denial of the SDO application filed by GARCOMA is recommended for further denial.
Table 24. DENR Accomplishment on the Disposition of Public lands (July 1987 - December 2014)
ADMINISTRATION
PUBLIC A & D
Accomplishment (ha)
% to Scope No. of ARBs % to Total ARBs Average Area per beneficiary (ha)
Aquino Administration (July 1987-June 1992) 539,086 21.44 244,845 10.44 2.2
Ramos Administration (1992-June 1998) 489,069 19.45 550,783 23.49 0.9
Estrada Administration (July 1998-2000)* 113,383 4.51 139,698 5.96 0.8

CARP After 30 Years Draft Final Report
68
Arroyo Administration (2001-2004)** 352,400 14.01 293,843 12.53 1.2
Arroyo Administration (2005-2010) 589,624 23.45 604,658 25.79 1.0
Aquino Administration (July 2010- Sept 2014) 406,656 16.17 510,798 21.79 0.8
TOTAL 2,490,218 99.03 2,344,625 100 1.1
Scope 2,514,581 100.00 n.a.
n.a
Land Disposition Balance 24,363 0.97
ADMINISTRATION
ISF Areas (CSC/CBFM)***
Accomplishment (ha)
% to Total Accomplishment
No. of ARBs % to Total ARBs Average Beneficiary
area (ha)
Aquino Administration (July 1987-June 1992) 335,053 32.14 152,998 45.16 2.2
Ramos Administration (1992-June 1998) 373,392 35.81 179,607 53.01 2.1
Estrada Administration (July 1998-2000) 334,189 32.05 6,203 1.83 1.8
Arroyo Administration (2001-2004)
Arroyo Administration (2005-2010)
Aquino Administration (July 2010- Sept 2014))
TOTAL 1,042,634 100 338,808 100 3.1
Scope 1,200,000 Source: DENR CARP Office summary tables

CARP After 30 Years Draft Final Report
69
Table 25. Average CARP Area of ARBs by Region (as of 2016)
Region Total Net Area Distributed # of ARBs Average Area per ARB
National 4,741,580 2,807,108 1.69
CAR 102,335 81,318 1.26
I 143,045 118,944 1.20
II 366,082 211,392 1.73
III 429,393 281,125 1.53
IV-A 189,276 123,487 1.53
IV-B 179,991 130,273 1.38
V 322,978 194,583 1.66
VI 220,903 136,634 1.62
VII 77,626 69,067 1.12
NIR 292,299 247,618 1.18
VIII 432,317 195,345 2.21
IX 228,302 130,796 1.75
X 338,890 217,614 1.56
XI 248,035 179,495 1.38
XII 677,849 283,387 2.39
CARAGA 270,662 135,471 2.00
ARMM 221,594 70,559 3.14 Source: Author’s estimate of data from DAR PIMD (as of end of 2016)
Table 26. ARBs in ARC and not in ARC by Region (as of end of 2016)
Region ARBs in ARC a/ ARBs not in ARC Total ARBs
Number % to Total Number % to Total Number % to Total
National 1,506,184 54 1,300,924 46 2,807,108 100
CAR 70,215 86 11,103 14 81,318 100
I 92,542 78 26,402 22 118,944 100

CARP After 30 Years Draft Final Report
70
II 107,338 51 104,054 49 211,392 100
III 155,844 55 125,281 45 281,125 100
IV-A 57,950 47 65,537 53 123,487 100
IV-B 83,454 64 46,819 36 130,273 100
V 85,928 44 108,655 56 194,583 100
VI 55,189 40 81,445 60 136,634 100
VII 51,061 74 18,006 26 69,067 100
NIR 105,193 42 142,425 58 247,618 100
VIII 123,396 63 71,949 37 195,345 100
IX 79,537 61 51,259 39 130,796 100
X 98,384 45 119,230 55 217,614 100
XI 100,111 56 79,384 44 179,495 100
XII 119,808 42 163,579 58 283,387 100
XIII 99,207 73 36,264 27 135,471 100
ARMM 21,027 30 49,532 70 70,559 100 Source: Author’s presentation of data from DAR PIMD (as of end of 2016)
a/ ARC refers to Agrarian Reform Communities
Table 27. ARBOs in ARC by Region (as of end of 2016)
Region ARB0s in ARC a/ ARB0s not in ARC Total ARB0s
Number % to Total Number % to Total Number % to Total
National 4,402 84 814 16 5,216 100
CAR 171 90 20 10 191 100
I 258 95 15 5 273 100
II 206 93 16 7 222 100
III 509 72 201 28 710 100
IV-A 235 91 24 9 259 100
IV-B 147 94 10 6 157 100
V 210 90 23 10 233 100

CARP After 30 Years Draft Final Report
71
VI 118 87 17 13 135 100
VII 214 83 45 17 259 100
NIR 251 76 79 24 330 100
VIII 419 96 16 4 435 100
IX 275 88 39 12 314 100
X 369 90 41 10 410 100
XI 272 85 47 15 319 100
XII 371 67 179 33 550 100
XIII 377 90 42 10 419 100 Source: Author’s presentation of data from DAR PIMD (as of end of 2016)
a/ ARBO refers to Agrarian Reform Beneficiary Organization
Table 28. Agribusiness Venture Arrangements (AVAs) Inventory, as of March 4, 2015*
Region No. of AVAs % to Total Area Involved (Ha) % to Total No. of ARBs % to Total
CAR 11 2.4 1,158.56 1.6 650 1.1
I 2 0.4 110.03 0.2 241 0.4
II 16 3.5 4,351.30 6.1 2,367 4.0
III 4 0.9 776.44 1.1 314 0.5
IV-B 1 0.2 54 0.1 44 0.1
V 2 0.4 5,870.00 8.2 3,125 5.3
VI 1 0.2 4,654.05 6.5 1,756 3.0
IX 7 1.5 1,052.00 1.5 792 1.3
X 93 20.6 6,668.03 9.3 16,012 27.0

CARP After 30 Years Draft Final Report
72
XI 72 15.9 20,863.69 29.2 20,182 34.1
XII 44 9.7 15,394.95 21.6 10,517 17.8
XIII 199** 44.0 10,376.84 14.5 3,205 5.4
Total 452 100.0 71,329.90 100.0 59,195 100.0
Source: SSO ** Individual ARBs counted
Table 29. Area and number of ARBs covered under the Agribusiness Venture Agreement by Crop (as of October 2015)
Crop Area (Ha) % to Total
Area Number of
ARBs % to Total No. of
ARBs
All Banana 14,501.07 27.7 14,866 32.7
Banana 10,452.67 20.0 11,726 25.8
Banana (Cavendish) 3,993.80 7.6 3,054 6.7
Banana (Bongolan, Organic) 54.6 0.1 86 0.2
Oil Palm 12,453.57 23.8 4,019 8.9
Pineapple 14,185.15 27.1 19,864 43.8
Pomelo 92.41 0.2 552 1.2
Sugarcane 3,777.20 7.2 2,619 5.8
Cacao 1,327.71 2.5 888 2.0
Other Crops (Rubber, HVCs, Papaya, Rice, Fruit Tees, etc.) 5,934.16 11.4 2,591 5.7
Total 52,271.28 100.0 45,399 100.0 Source of data: 2015 Inventory of AVAs, DAR

CARP After 30 Years Draft Final Report
73
Table 30. Number and area covered by type of Agribusiness Venture Arrangement (AVA), 2015
Type of Agribusiness Venture Arrangement Number of AVAs Percent to Total AVAs Area Covered (Has.) Percent to Total Area
Lease Agreements 334 77.14 33,016.93 63.16
Lease agreement 222 51.27 22,015.11 42.12
Lease contract 90 20.79 6,570.63 12.57
Leaseback agreement 22 5.08 4,431.19 8.48
Growership Agreements 88 20.32 12,605.26 24.12
Marketing contract 4 0.92 4,458.00 8.53
Growership 33 7.62 4,391.82 8.40
Growership/contract growing 37 8.55 940.12 1.80
Growership/contract growing (agro-forestry) 1 0.23 272.00 0.52
Contract growing 9 2.08 1,246.60 2.38
Banana production purchase agreement 1 0.23 27.00 0.05
Banana supply and marketing agreement 3 0.69 1,269.72 2.43
Other Agreements 11 2.54 6,649.09 12.72
Joint venture agreement 4 0.92 5,602.44 10.72
Marketing with incentives 2 0.46 846.00 1.62
Contract of development agreement 1 0.23 57.40 0.11
Management contract 2 0.46 54.25 0.10
Rice retailing 1 0.23 30.00 0.06
Not indicated 1 0.23 59.00 0.11
Total 433 100.00 52,271.28 100.00 Source: Food and Agriculture Organization of the United Nations, 2016
Table 31. List of Phase I and Phase II Operational Block Farms
Year Location Name of Organization
2012 Magalang, Pampanga Binhi ni Abraham
Balayan, Batangas Lucban MPC
Nasugbu, Batangas Kamahari

CARP After 30 Years Draft Final Report
74
Nasugbu, Batangas Damba
Lian, Batangas Prenza
Pontevedra, Negros Occ. Kauswagan &Gen. Malvar
2013 Magalang, Pampanga PASAMA
Pili, Camarines Sur Had. Salamat
Tampalon, Kabankalan City, Negros Occidental
Minaba MPC
Capiz, Iloilo Vizcaya ARB MPC and Lantagan ARB, MPC
Sta. Catalina, Negros Oriental Manggolod Farmers Mpc
Canlaon City, Negros Occidental Ramrod Agricultural Multi-Purpose Coop. (RAMPUCO)
Caputatan, Medellin, Cebu ANARBA
Ormoc, Kananga, Leyte Boroc Agricultural Producers MPC
Quezon, Bukidnon J.A. Agro Employees Farmers Beneficiaries Livelihood Association
Paniqui, Moncada, Ramos, Anao, Gerona, Tarlac
Northern Cluster Producers Coop (NCPC)
Lauan, Patnongon, and Bugasong, Antique
GMJ ARB Coop and ASSMMSA
Passi, San Enrique, Iloilo JAGUIMITAN-JARBEMCO and MAPILI-CATUBAY
Escalante, Negros Occidental Don Esteban ARB (DEARBA) and Had. Bongco Farmers Ass’n (HABFA)
Cadiz City, Negros Occidental PARAISO Food Workers ARB (El Sansi ARB)
Cadit City Hacienda Bernardita
Talisay City, Negros Occidental CASA MPC
La Carlota, Negros Occidental NARC
Manjuyod, Negros Occidental SYCIP Plantation Farm Workers

CARP After 30 Years Draft Final Report
75
Tanjay, Negros Oriental San Julio Farm Workers MPC
Mabinay, Negros Oriental SAMAC (SUFARMFUCO)
Bais City, Negros Occidental KASFARBECO
Bayawan, Negros Oriental LAPAY (LARBEMCO)
Source: DAR
Table 32. CARP Obligations Incurred (By Expense Class) As of 31 December 2016
In Million Pesos
AGENCY
REPUBLIC ACT NO. 6657 REPUBLIC ACT NO. 8532 REPUBLIC ACT NO. 9700
TOTAL (July 1987 to 1998) (1999 to 2009) (2010 to 2016)
L B P 21,508.16 40,150.33 18,721.42 80,379.90
PS 2,326.49 851.194 - 3,177.69
MOE 2,193.15 2,107.15 5,947.56 10,247.86
LO
Comp. 14,082.22 37,191.99 12,773.86 64,048.06
CO 2,906.30 - - 2,906.30
D A R 17,628.80 78,873.99 79,118.24 175,621.03
Regular 16,964.83 47,027.86 45,526.74 109,519.43
PS 8,236.11 20,723.74 17,185.26 46,145.11
MOE 7,393.74 23,390.87 27,749.93 58,534.54
CO 1,334.98 2,913.25 591.55 4,839.78
Fund 101 - 12,101.41 22,512.67 34,614.08
PS 7,540.29 15,749.77 23,290.06
MOE 4,158.87 6,762.91 10,921.78
CO 402.256 0 402.26
FAPs 663.97 19,744.72 11,078.83 31,487.52
PS - 247.569 89.08 336.65

CARP After 30 Years Draft Final Report
76
MOE 72.425 8,005.16 4,254.32 12,331.91
CO 591.545 11,491.99 6,735.43 18,818.97
D E N R 2,498.78 3,481.34 3,610.44 9,590.56
PS 697.423 947.885 568.33 2,213.64
MOE 1,617.00 2,528.17 3,042.12 7,187.30
CO 184.355 5.281 - 189.64
L R A 495.518 1,057.84 1443.461 2,996.82
PS 354.959 794.01 537.958 1,686.93
MOE 105.217 263.826 905.493 1,274.54
CO 35.342 - - 35.34
DA 2,380.04 - - 2,380.04
PS 299.863 - - 299.86
MOE 1,570.68 - - 1,570.68
CO 509.497 - - 509.50
D P W H 2,663.72 2,607.30 174.796 5,445.82
PS - - - 0.00
MOE - - - 0.00
CO 2,663.72 2,607.30 174.796 5,445.82
N I A 4,087.11 3,194.47 1,242.53 8,524.10
PS 255.185 731.773 376.349 1,363.31
MOE 127.981 175.285 79.234 382.50
CO 3,703.94 2,287.41 786.942 6,778.29
D T I 519.599 577.37 378.148 1,475.12
PS 314.593 405.1 233.345 953.04
MOE 157.774 171.625 144.803 474.20
CO 47.232 0.646 - 47.88
D O L E 7/ 9.544 28.769 17.79 56.10

CARP After 30 Years Draft Final Report
77
PS 2.567 2.696 - 5.26
MOE 6.672 26.073 17.79 50.54
CO 0.304 - - 0.30
T L R C 265.08 - - 265.08
PS - - - 0.00
MOE 265.08 - - 265.08
CO - - - 0.00
Grand Total 52,056.34 129,569.15 104,706.83 286,332.32
PS 12,487.19 32,244.25 34,740.09 79,471.54
MOE 13,509.72 40,827.03 48,904.17 103,240.91
LO
Comp. 14,082.22 37,191.99 12,773.86 64,048.06
CO 11,977.22 19,305.88 8,288.72 39,571.81
Source: DBM GAA
Table 33. Estimated Budget Requirement for LO Compensation by Crop
Crops LAD Balance CARP
Area (Ha) Average Value (P/ha):
2010-2014 Total Requirement (in
Million pesos)
Rice 127,455 130,705 16,659
Corn 66,570 94,087 6,263
Coconut 165,588 98,726 16,348
Sugarcane 115,613 209,998 24,278
All Commercial Crops 15,331 154,038 2,362
Mixed Crops 45,147 104,517 4,719
Others Combined 8,987 88,877 799
Others 12,817 108,534 1,391

CARP After 30 Years Draft Final Report
78
All Crops 567,837 123,685 72,819
LBP Estimate (All Crops) 567,837 216,557 122,969 Source: Author’s estimate from DAR LAD balance and estimated LBP average land prices by crop Notes: LAD balance of CARP Area for Private Agricultural Lands only (as of January 1 2015) Average Land Value (estimated from LBP valuation by crop under RA9700 or CARPer)
FIGURES
Figure 2. LAD Accomplishment by Mode as of January 2016 (Collective vs Non-Collective)
Source of Data: De los Reyes (2016)