Embed Size (px)
Citation preview

C H A P T E R
8
The Computation of Stimulus Valuesin Simple Choice
Antonio Rangel and John A. Clithero
O U T L I N E
Introduction 125
Theory: A Computational Model ofSimple Choice 126
Methodology: How to Identify Stimulus ValueSignals? 128
Evidence: Stimulus Value Signals in BasicValuation Tasks 130
Complication: Attention Modulates theComputation and Comparison of Stimulus Values 137
Theory: How are Stimulus Values Computed? 142
Evidence for a Causal Role of the StimulusValue Signals in vmPFC 144
Conclusions 145What is the Neural Code Used to Represent
Stimulus Values in vmPFC? 145What and How is the Attribute Space Used in
SV Computations? 145Computational Roles of PCC, dlPFC, vSTR
and Amygdala in Simple Choice 145
Acknowledgments 146
References 146
INTRODUCTION
Neuroeconomics combines methods and theoriesfrom neuroscience, psychology, economics, and com-puter science to study three questions: (i) what are thevariables computed by the brain to make different typesof decisions; (ii) how does the underlying neurobiologyimplement and constrain these computations; (iii) whatare the implications of this knowledge for understand-ing behavior and well-being? Neuroeconomics seeks toproduce detailed computational and neurobiologicalaccounts of the choice process that can serve as a com-mon foundation for understanding human behavioracross the natural and social sciences (Clithero et al.,2008; Fehr and Rangel, 2011; Glimcher, 2011; Rangelet al., 2008; Wilson, 1998).
A basic question is how does the brain make simplechoices, such as choosing between an apple and anorange. Much effort has been devoted to studyingwhether the brain makes these choices by computingand comparing value signals, to characterizing the
computational and neurobiological properties of thevarious processes involved, and to understanding howthey influence choices. This research agenda is basedon the belief that simple choice provides a good testbed for the systematic study of neuroeconomic ques-tions, and that some of its essential computational andneurobiological features are likely to be preserved inmore complex decisions. As is illustrated in many ofthe other chapters in this volume, so far this hasproven a reasonably accurate assumption.
Simple choices are more complex and interestingthan they might seem. They involve the parallel compu-tation of several distinct value signals, as well as thedynamic integration and comparison of those value sig-nals in order to elicit the motor response, or movement,necessary to execute the decision (e.g., reach left andgrab the orange, or reach right and grab the apple).
This chapter provides an introduction to what isknown about how the brain computes what are oftencalled stimulus values. There is now some evidencethat during simple choice, the brain computes and
125Neuroeconomics. DOI: http://dx.doi.org/10.1016/B978-0-12-416008-8.00008-5 © 2014 Elsevier Inc. All rights reserved.

represents these stimulus values, a measure of theexpected benefit of consuming the different options,independently of the action costs required to get them.In contrast, action costs measure the effort or unpleas-antness associated with executing an action, indepen-dently of the expected benefits that those actions mightgenerate. For example, if a hungry rat needs to executeten painful nose pokes to get access to a food port, theaction costs are the effort associated with the nosepokes, the stimulus value is the hedonic response fromconsuming the food, and the net value of taking theaction is given by the stimulus values minus the actioncosts. Although stimulus values are only one of severalkinds of value signals hypothesized to be computed atthe time of decision, they have received much attentionbecause there is growing evidence that in many circum-stances they are the key drivers of choice. This occurs,for example, when the action costs associated withacquiring the options are negligible relative to the bene-fits from consuming them, or when the action costs ofthe options under consideration are identical.
The chapter has several goals. First, it provides anintroduction to the study of stimulus valuation forthose new to neuroeconomics. This includes a thoroughreview of the methodological issues involved in identi-fying stimulus value signals in the brain, and someinsights into the relative merits of alternative experi-mental approaches. Second, the chapter provides adiscussion of the research frontier in this area, includ-ing the body of findings for which there is a degreeof consensus, as well as some key areas of disagree-ment. Third, the chapter emphasizes the importance ofcomputational models in neuroeconomics. To make thispoint explicitly, it shows how a fully specified compu-tational model of simple choice is critical for makingsense of seemingly contradictory findings in the litera-ture. It should be noted that many of the issues engagedhere are discussed in further detail in Chapter 22.
It is important to emphasize several limitations inthe scope of the chapter. It discusses computationalmodeling, human functional magnetic resonance imag-ing (fMRI), and non-human primate neurophysiologystudies, but it does not cover related rodent experi-ments. There are, however, several excellent reviewson this topic (McDannald et al., 2012; Schoenbaumet al., 2009). The chapter also does not discuss feedbackand reward learning issues, instead focusing on whathappens at the time of decision, given all precedinglearning. See Chapters 15�18, for value learning. Thechapter only considers choices that are made using thegoal-directed control system, as opposed to the com-peting habitual and Pavlovian controllers. These othertypes of choices are taken up explicitly in Chapter 21.As a result, the chapter only discusses choice situationsthat are not over-trained, in the sense that they are
relatively novel to the subjects. Finally, it should benoted that given the size of the relevant literature, andthe pedagogical aspirations of the chapter, it focuseson depth at the expense of breadth.
THEORY: A COMPUTATIONAL MODELOF SIMPLE CHOICE
Consider the choice task depicted in Figure 8.1A,which illustrates a widely used class of paradigms. Onevery trial the subject is shown a consumption stimulus(for example a tasty food), as well as the amount ofeffort required to get it. In order to get the food the sub-ject might need to squeeze a handgrip (a plastic cylin-der containing an air tube that can be squeezed,compressing the air tube in a way that allows accuratemeasurement of physical effort exerted) with a mini-mum amount of force for a minimum length of time.The subject needs to decide whether he wants to getthe food in exchange for that effort, or get nothing butdo no work. The decision is indicated by a left-hand(5Yes) or right-hand (5No) button press. If the subjectchooses “Yes,” then he needs to carry out the effort inorder to get the consumption item. Subjects are allowedto indicate their choice whenever they are ready.
A large body of behavioral data has shown that thesetypes of tasks lead to psychometric choice curves thatare consistent with the logistic choice model (Luce, 1959;McFadden, 2001). As illustrated in Figure 8.1B, the prob-ability of saying “Yes” increases with the subjectivevalue of the consumption good, and decreases with theaction costs.
Figure 8.1C describes a simple computational modelof the task. It describes the variables that are computedat the time of choice, and how they interact with eachother to affect behavior, without specifying the detailsof how they are implemented in the brain. The modelhas two key components: value signals and a compara-tor process.
Consider the valuation process first. The modelassumes that three distinct value signals are computedfrom the time the choice screen appears to the time adecision is made. First, there are stimulus value (SV)signals that measure the expected subjective value ofconsuming the stimulus, independently of the actionrequired to acquire it. If delivery of the stimulus isprobabilistic or delayed, the SV signal takes this intoaccount, by weighting potential outcomes according totheir probability, and temporally discounting delayedrewards. Thus, an unlikely reward delivered far in thefuture is assigned a lower SV than an otherwise morelikely and proximate one. Similarly, if the action givesthe subject the right to buy the good at a certain price,the price is also part of the SV. Risk, delay, and price
126 8. THE COMPUTATION OF STIMULUS VALUES IN SIMPLE CHOICE
NEUROECONOMICS

are inherent properties of the stimulus, and thus areintegral to the SV computation. Second, there are actioncost (AC) signals that reflect the subjective value of takingthe action required to get the item, independently of thebenefits generated by the stimulus. These values arereferred to as costs, since they often entail effort or pain.Third, there are action value (AV) signals that, by integrat-ing the SV and AC, provide an integrated representationof the value of taking the action, once the costs and bene-fits are taken into account (Rangel and Hare, 2010).
Now think about the comparator process. In a worldwithout noise (a world with no stochasticity in percep-tion or in neural computation), the brain would be ableto precisely measure these three variables, and to reli-ably make the value maximizing decision simply byimplementing the following rule: choose left (5Yes) ifthe reading of the AV signal is positive, and right(5No) otherwise. However, as the literature in percep-tual decision making has shown (Gold and Shadlen,
2007; Heekeren et al., 2008), noise is pervasive in thesetypes of computations, in the sense that SVs, ACs andAVs are measured with noise, which makes the simplevalue maximization rule described before untenable.Instead, a growing body of literature suggests that thebrain has dedicated processes to deal with the problemsintroduced by this noise. In particular, suppose that theinstantaneous AV signals are computed with identicaland independently distributed Gaussian noise. Then, ageneral class of processes known as Drift-DiffusionModels (DDM) implement the optimal statistical solu-tion to this problem, which entails a sequential likeli-hood ratio test. This important class of models arediscussed in more detail in Chapters 3 and 19.
Although multiple flavors of these models have beenproposed, the following simple and popular version(Ratcliff, 1978; Ratcliff and McKoon, 2008) provides ahighly accurate quantitative description of the choiceand reaction time curves generated by simple choice
Common psychometric choice curveCommon choice environment(A) (B)
(C)
50%
Pro
babi
lity
of c
hoos
ing
0 1–2 –1
Stimulus value (rating)2
Yes No
50%
Pro
babi
lity
of c
hoos
ing
2 310
Action cost (effort)4
Stim
ulus
val
ueA
ctio
n co
sts
Time rt
Time rt
No
timert
SVA
SVB
SVC
ACA
ACB
ACC
Act
ion
valu
e
Time rt
AVA
AVB
AVC
Yes
Simple model of comparison of value and cost when making a choice
FIGURE 8.1 (A) A common choice task for subjects in experiments is a simple Yes/No decision. Here, the subject can exert an amount ofeffort (indicated by the green line on the right) and receive an orange (indicated on the left). Responses are provided by button press(left5YES, right5NO). (B) Psychometric choice curves. If choice data are collected and a choice function is estimated assuming a logistic fit,subjects will generally have a probablility of saying “YES” that is increasing in the stimulus value of the orange (orange curve on left), anddecreasing in the action cost of obtaining the orange (green curve on right). (C) A simple choice model that integrates stimulus values andaction costs to compute stimulus values. Consider three different goods, A, B, and C, with different stimulus values and action costs. Oncethey are combined, option A has the greatest action value of the three (given its highest stimulus value and lowest action cost). The modelalso assumes a noisy-drift process (right), whereby a subject’s decision-making process accumulates information until a sufficient threshold(grey lines) is crossed. In this case, the subject chose “YES”.
127THEORY: A COMPUTATIONAL MODEL OF SIMPLE CHOICE
NEUROECONOMICS

tasks (Basten et al., 2010; Gluth et al., 2012; Krajbich andRangel, 2011; Krajbich et al., 2010, 2012; Milosavljevicet al., 2010). A simple DDM assumes that a binarychoice is made by dynamically integrating the noisyAV signals (Figure 8.1C). This leads to an integrated rel-ative decision value signal that measures the estimatedrelative value of the left (5Yes) versus the right (5No)choices. The signal starts at zero and at every instant tevolves according to the formula:
Rt11 5Rt 1 θ ðAVðYesÞ �AVðNoÞÞ1εt; ð8:1Þ
where Rt denotes the level of the signal at instant t (mea-sured from the start of the choice process), θ is a constantthat affects the speed of the process, and εt denotes anindependent and identically distributed error term. Theprocess continues until a pre-specified barrier is crossed:the left (5Yes) action is chosen if the upper barrier at1B is crossed first, and the right (5No) action is chosenif the lower barrier at 2B is crossed first. If the choice of“No” leads to no consumption, we can set AV(No)5 0(since both SV and AC are equal to 0).
This model of the comparator has several importantfeatures. First, since the integrated relative value signalevolves stochastically, choices and reaction times areinherently noisy, as they are in the data. Second, themodel predicts a logistic psychometric choice curve inwhich the probability of left (5Yes) increases with AV(Yes), and reaction times are decreasing on the samevariable. Third, individuals can make mistakes, in thesense of not choosing the best option, but the probabilityof doing so decreases with the barrier size B, the slopeof integration θ, and the strength of the underlying AVsignal. In particular, the relative decision value Rt can bethought of as the accumulated evidence in favor of thehypothesis that the left action is better (when Rt. 0), orthe accumulated evidence in favor of the alternativehypothesis (when Rt, 0). The more extreme these valuesbecome, the less likely it is that the evidence is incorrect.Finally, the probability of making a mistake can be con-trolled by changing the amount of noise in the integra-tion process.
The model of simple choice outlined in this chapteralso states that the three signals are encoded simulta-neously and that the SV and AC only interact whenthey come together to compute the net action values.After the various value signals are computed, they areintegrated by the comparator system until a choice ismade. Thus, the duration of the value computations iscontrolled by the comparator.
It is important to emphasize that there are alterna-tive model specifications of simple choice that,a priori, seem equally plausible. For example, considera version of the model in which AVs are not computedseparately, and instead the SV and ACs are fed
additively into the comparator. This alternative modelgenerates identical behavioral predictions providedthat the weights of the different signals are appropri-ately chosen. A strength of the neuroeconomicapproach is that it allows for empirical tests of differ-ent computational models using neural data: underthe first hypothesis we should find units engaged inAV coding and feeding this information to the com-parator, whereas in the second version we should notfind AV signals, and instead the SV and AC regionsshould interact directly with the comparator network.
The model also highlights an important distinctionbetween pure SV coding activity and areas that pro-vide representations of multiple kinds of value signalsat the same time, often called “multiplexed” signals(Hayden and Platt, 2010; Kennerley et al., 2009). Inparticular, a “pure SV” unit or region is responsive tothe SVs but not to the ACs. In contrast, areas involvedin the representation of AVs, or in the dynamic valuesignals of the comparator, do not entail pure SV codingsince they also represent other computations, such asthe integration of benefits and costs.
Because of the central role of SVs in neuroeconomics,this chapter focuses on the computation of SVs alone, andnot on the computation of ACs, AVs, or how they areintegrated and compared. For reviews of AC and AV cod-ing see Chapter 21 of this volume or (Rangel and Hare,2010; Rushworth et al., 2011; Wallis and Kennerley, 2010).For behavioral and neural evidence related to the driftdiffusion model, or DDM, see Chapter 19 and Basten et al.(2010), Hare et al. (2011b), and Krajbich et al. (2010).
METHODOLOGY: HOW TO IDENTIFYSTIMULUS VALUE SIGNALS?
In order to take the model of simple choice to theneural data using the tools described in Chapter 4, twoadditional things are necessary: a methodology toobtain subject specific measures of the SVs computedin every trial and a theory of how the computationsdescribed above map to neural activity.
Several procedures are widely used in the field toobtain subject- and stimulus-specific measures of SV.One popular option is to obtain an independent mea-sure of the SV taken either before or after the choicetask. This is easily done using liking ratings (“howmuch would you like to get this good at the end of theexperiment?”), or Becker-DeGroot-Marschack (BDM)auctions that provide a monetary and incentive-compatible measure (“how much would you be willingto pay to get this good at the end of the experiment?”)of the value of each item (Becker et al., 1964). Both meth-ods can be used to measure the value of virtually anystimulus, provided that the subjects’ valuations remain
128 8. THE COMPUTATION OF STIMULUS VALUES IN SIMPLE CHOICE
NEUROECONOMICS

sufficiently stable throughout the experiment. A disad-vantage is that it often requires additional data collec-tion dedicated to obtaining these measurements.Another popular option is to estimate SV from thechoice data collected during the experiment itself. Thiscan be done under the maintained hypothesis that indi-vidual choice probabilities are generated by somethinglike a logistic choice model over the SVs and ACs(Luce, 1959; McFadden, 2005). If the number of stimuliis small, or if SVs can be described using a simpleparametric function of a small number of parameters(e.g., prospect theory; Kahneman and Tversky, 1979;Tversky and Kahneman, 1992), this suffices to estimatethe SV of each choice object. The advantage of thismethod is that it does not require additional data collec-tion. The disadvantage is that sometimes the para-meters cannot be estimated with the desired level ofprecision. For this reason, many groups often use ahybrid of the two procedures (Hare et al., 2009) inwhich subjects are asked to indicate their choices usinga five point scale: Strong No, No, Indifferent, Yes,Strong Yes. This allows subjects to simultaneously indi-cate their choice and their valuation for the stimulus, asboth Strong No and No indicate a negative choice, butwith Strong No indicating a lower SV.
The neuroeconomics literature has assumed thatSVs and ACs are encoded either in single neurons, orin populations of neurons within a brain region. Underthis assumption, the firing rate of such units in everytrial, or the activity level of such regions, should beproportional to the subject- and stimulus-specific SVmeasures obtained using the procedures describedabove. This prediction can be tested using single unitneurophysiology, blood-oxygenation-level-dependent(BOLD) signal from fMRI, electroencephalography(EEG), or magnetoencephalography (MEG) to look forneurons or brain regions in which the measures ofneural activity correlate with the inferred SVs.
A very important point is that although this is theempirical test emphasized in most studies, it is not asufficient step to conclude that a brain region encodesSVs � a point stressed with regard to any neural vari-able in Chapter 4. In particular, the following additionaltests are also needed to draw such a conclusion.
First, there are pervasive potential confounds thatneed be ruled out. In most paradigms, SVs are highlycorrelated with a number of other value-related signals(Figure 8.2A). The SV of a trial is often highly correlatedwith a prediction error (PE), which measure unex-pected changes in present and future rewards
(A) Stimulus value and prediction error (B) Stimulus value and stimulus salience
(C) Specification of stimulus value computation time
Rea
ctio
n tim
e
Stimulus value Stimulus value
Neu
ral s
igna
l
Stimulus value
Neu
ral s
igna
l
Mean stimulus value
SV signalPE signal
Stimulus value
Neu
ral s
igna
l
SV signalSalience signal
True SV signalMis-specifed SV signal
Computation of SV
FIGURE 8.2 (A) Stimulus value signals (purple) and prediction errors (blue) can frequently be confounded in a decision-making para-digm. For example, if the decision maker does not know with certainty what their decision will be between, a prediction error can result for“better than average options” or “worse than average options.” (B) Salience and stimulus value can also be confounded, if as is shown,rewards only have a positive valence. (C) Reaction time is also important to include when estimating neural responses to stimulus value, withbias depending upon a positive or negative value. See main text for more details.
129METHODOLOGY: HOW TO IDENTIFY STIMULUS VALUE SIGNALS?
NEUROECONOMICS

(Hare et al., 2008; McClure et al., 2003; O’Doherty et al.,2003; Schultz et al., 1997). This confound arises from thefact that there will be a PE whenever choice optionsare revealed. To see why, note that finding out that thechoice options in a given trial are better (worse) thanaverage is good news because, once the optimal choiceis made, it will lead to better (worse) than averageconsumption. In fact, in some experimental designs PEsare perfectly correlated with the SVs, even if they aredistinct from them under many other conditions. Inother paradigms, exposure to the choice stimuli gener-ate direct emotional or hedonic responses (for example,pictures of attractive faces) that are also correlated with,but distinct from the SVs. These confounds need to beidentified and systematically ruled out. One approachto addressing this confound is to add forced-choicetrials in which the subject is exposed to the same stimu-li, but does not make a choice. This works because SVsignals should be present during free but not forcedchoices, whereas direct affective responses to the stimu-li (that are unrelated to choice) should be present inboth types of trials.
Second, many paradigms confound arousal, motorpreparation, and pure attentional processing with SVs(Maunsell, 2004). This potential confound is especiallyacute in paradigms that use only appetitive or aversivestimuli, but not both. As shown in Figure 8.2B, a goodway to eliminate this confound is to combine appetitiveand aversive stimuli. Such a paradigm helps becauseSV signals are monotonically increasing over the entirevalue range, whereas arousal, motor preparation andattentional signals are U-shaped. Another commonterm for this second type of signal is saliency, whichprovides a measure of the importance of the stimulus.A powerful and provocative illustration of this problemwas provided by a recent study that showed thatelectromyography measures of activity in neck and jawmuscles, which presumably reflect either motor prepa-ration or arousal, are correlated with SV during asimple choice task (Roesch and Olson, 2003). Thus, inthe absence of the controls described here, one woulderroneously conclude that these muscles encode SV.This illustrates the critical importance of systematicallyruling out these types of confounds.
Third, another source of potential confounds is dueto the presence of neurons encoding “multiplexed”value signals (Hayden and Platt, 2010). Neurons encod-ing pure SV signals should not be responsive toinformation about ACs, and should be encoded in stim-ulus space, thus omitting information about the actionsrequired to implement them. This test is important toseparate activity related to multiplexed signals (such asa neuron that encodes AV5 SV2AC, and thus corre-lates with SVs) from activity related to pure SV signals(which correlates with SV but not with AC).
Fourth, the model also generates predictions abouthow SV signals are used in concert with other computa-tions to make a choice. In particular, they predict thatSVs should be passed to areas involved in the computa-tion of AVs, the implementation of the comparator pro-cess, or both. This implies that areas recruited in SVcoding should also exhibit increased functional connec-tivity with areas involved in computing AVs and in thecomparison process at the time of choice. These connec-tivity tests are important because, under the assump-tions of the model, they provide additional evidence insupport of the hypothesis that an area encodes SVs thatare used to guide choices.
Fifth, SV identification requires correctly under-standing the duration of the SV computations(Figure 8.2C). The model predicts that SVs areencoded until a choice is made, and that choice dura-tion is inversely proportional to SV. Many fMRI stud-ies ignore this point and instead model the BOLDresponses under the assumption that the valuationprocess has equal duration for all stimuli. As shownin Figure 8.2C, this biases down the estimates ofstrength of the neural signals, which can result in amistaken failure to identify neural responses associ-ated with the computation of SVs. Thus, an absenceof a finding � if this issue is not resolved � mightcorrespond to incorrectly concluding a neuron orregion does not encode SV.
Sixth, the model of simple choice outlined hereassumes that the SV signals causally influence thechoices that are made, and none of the tests describedabove address this component of the theory. The issueof testing for causality of SVs is thus an important yetdifficult one. The chapter returns to this issue in a latersection.
This section has established that safely concludingthat a neuron or brain region encodes a pure SV signalis a hard problem, requiring much thoughtful experi-mental design and numerous controls. Ideally, everysingle study would be able to address all of them.Historically, this has not been the case, partly becauseof the inherent difficulties, and partly becauseearly research in neuroeconomics has sometimesshowed weaknesses in these methodological issues.Fortunately, however, the body of data available today,taken as a whole, provides all of the necessary checksand, as described in the next section, has led to a robustset of findings regarding the computation of SVs.
EVIDENCE: STIMULUS VALUE SIGNALSIN BASIC VALUATION TASKS
This section describes key studies and findingsregarding the neural basis of SV signals. It focuses
130 8. THE COMPUTATION OF STIMULUS VALUES IN SIMPLE CHOICE
NEUROECONOMICS
on human fMRI work because, as described in thenext section, most existing monkey neurophysiologyexperiments have used tasks that introduce additionaltheoretical and methodological complications that makeit difficult to draw precise conclusions about the valuecomputations taking place.
The studies described below are based on threedifferent variations of the task depicted inFigure 8.1A. Some studies simply ask subjects to pro-vide a value for each stimuli, either using liking rat-ings (Grabenhorst et al., 2010; O’Doherty et al., 2003;Plassmann et al., 2008), or incentive compatible bids(Clithero et al., 2009; De Martino et al., 2009;Plassmann et al., 2007). In either case, the logicbehind the tasks is to induce subjects to activate theSV circuitry without necessarily activating the rest ofthe choice circuitry. (Although there is an unresolvedissue of whether these tasks fully eliminate the com-putations associated with the comparator processsince such tasks still require the brain to select whichbutton to press to report a bid). Other studies haveused a version of the task in which every trial sub-jects choose between the stimulus shown and “get-ting nothing,” and in which the actions required toimplement the choices are button presses with negli-gible and identical costs. In this case, ACs areapproximately zero, AVs are approximately equal toSVs, and SVs are the sole inputs into the comparatorprocess. Finally, a popular class of tasks involveschoices between a reference stimulus that is heldconstant for the entire experiment, and anotheroption that changes every trial. So, again, the choicetask is binary and includes a constant option (like“get nothing”), but now the constant option has somenonzero value. Typically, only the option thatchanges on each trial is displayed (subjects will beshown the reference option at the start of the
experiment and/or intermittently during the experi-ment). Both of the choices have negligible and identi-cal action costs. This design � which holds the SV ofone of the choices constant � is useful because thevariation in neural activity in an area encoding SVs isdriven solely by the varying option. As a result, it ispossible to look for SV signals simply by looking forcorrelates with the varying option.
An initial wave of studies used the methodologydescribed above to identify areas in which neuralresponses at the time of choice, as measured byBOLD fMRI, correlates with measured SVs. We high-light three studies that illustrate the use of the threedifferent types of paradigms. In Plassmann and col-leagues (2007), depicted in Figure 8.3, hungry sub-jects were shown a picture of a familiar food snackon every trial and had to decide how much to bid forthe right to eat that snack food at the end of theexperiment. The bids provide a behavioral measureof the SVs on every trial, since they were elicitedusing the incentive compatible BDM mechanism. Thestudy found that responses in ventromedial prefron-tal cortex (vmPFC) and right dorsal lateral prefrontalcortex (dlPFC) correlated with the bids, but no otherneural correlates of SVs were found. The paper alsoincluded a control to rule out the concern that thesesignals might reflect affective responses to the foods(e.g., arousal) that are correlated but distinct fromSVs. In Kable and Glimcher (2007), depicted inFigure 8.4, subjects were asked to choose betweenpairs of monetary rewards to be delivered with dif-ferent delays, ranging from hours to months. One ofthe options was a constant reference point involvingan immediate payoff. They found that activity invmPFC, ventral striatum (vSTR), and posterior cingu-late cortex (PCC) correlated with the SV of thedelayed varying option. In Tom et al. (2007), depicted
Stimulus value signals for appetitive food items
Trial onset
4sfood item
onset
4–10sblank
4sbidding
1sfeedback
1–15sfixation
Time
Free bid trials Forced bid trials
?
bid S?
+ +
S3 S2
bid S2
2
x = 4 y = 30 z = –18
x = 44 y = 44 z = 18
FIGURE 8.3 An fMRI study ofwillingness-to-pay (WTP). Hungry sub-jects made bids (either free or forcedamounts) on various snack items, whichwere the only available options to eatafter the experiment. The subjectivevalue � measured as WTP � correlatedwith increased activity in both vmPFC(labeled as medial OFC in the paper)and dlPFC. Figures are from Plassmannet al. (2007).
131EVIDENCE: STIMULUS VALUE SIGNALS IN BASIC VALUATION TASKS
NEUROECONOMICS

in Figure 8.5, subjects were shown 50/50 gamblesinvolving both a potential monetary gain and apotential monetary loss, and were asked to choosebetween them and a fixed reference payoff of $0. Thestudy found that a similar area of vmPFC and vSTRcorrelated with the value of the potential gains andlosses. Similar results have been found in dozens offollow-up studies (Hare et al., 2010; Knutson et al.,2007; Peters and Buchel, 2009; Prevost et al., 2010; Wuet al., 2011). Together, these studies provide conver-gent evidence for the hypothesis that the vmPFC isinvolved in the computation of SV signals duringsimple choice.
However, as was emphasized in the previous sec-tion, further tests are necessary to rule out importantconfounds, and to test additional properties of theproposed model of simple choice. First, its needs tobe ruled out that vmPFC responses might reflect
saliency like responses, such as arousal, motor prepa-ration, or attentional modulation. One recent studytested for this confound by showing appetitive andaversive foods, and asking subjects to indicate if theywanted to eat them at the end of the experiment (Littet al., 2011). A randomly selected decision was imple-mented. This design made it possible to dissociate SVsignals (that increase monotonically with value) fromsaliency like signals (that have a U-shape with a min-imum for neutral items). As shown in Figure 8.6, thestudy found that activity in vmPFC and PCC wasconsistent with SV coding, whereas responses in dor-sal anterior cingulate cortex (ACC), insula, supple-mentary motor area (SMA), fusiform gyrus, andprecentral gyrus were consistent with saliency cod-ing. The only area that exhibited a combination of SVand saliency coding was the vSTR. In addition, aclosely related monkey neurophysiology study found
x = –3 y = 5 z = 34
P< 0.00005Subjective value correlation: P < 0.005
$20now
Immediate option(not shown)
$4030 days
Earlyresponse
No response
Response
0 2 4 6 8 10 12 14
Time (s)
Stimulus value signals for delayed monetary rewards
FIGURE 8.4 An fMRI study of delay discounting. Subjects chose between a constant, immediately available amount of money and a largeramount of money available at a future date (left). Areas that correlated with subjective value included vmPFC (sagittal slice), vSTR (coronalslice), and PCC (axial slice). Figures are from Kable and Glimcher (2007).
Reference-dependent stimulus value signalsof expected monetary outcomes
+12 –14 +30 –7Response
interval(3 secs)
VariableISI
(mean 2.6 secs)
10–5
–20
40
Pot
entia
l los
s
Gain/loss matrix
Time
Potential gain 10 20 30 40Potential gain ($)
Pot
entia
l los
s ($
)P
oten
tial l
oss
($)
Ventromedial prefrontal cortex
20
15
10
5
0
10
20
30Striatum
0–5–10–15–20–25
10 20 30 40Potential gain ($)
5
10
15
20
y=12
y=40
L R
FIGURE 8.5 An fMRI study asked subjects to accept or reject50/50 gambles of different positive (green) and negative (red)monetary outcomes. In both vSTR (right, top slice) and vmPFC(right, bottom slice), areas that were conjointly significant forparametric responses to gains and to losses, there was evidence fora neural measure of loss aversion.Data are from Tom et al. (2007).
132 8. THE COMPUTATION OF STIMULUS VALUES IN SIMPLE CHOICE
NEUROECONOMICS

that neurons in vmPFC were consistent with SV cod-ing, but that activity in the premotor cortex wasmore consistent with saliency coding (Roesch andOlson, 2004).
Second, it must be determined whether or not thevmPFC responses might encode highly correlated PEsignals, instead of the SV signals. One studyaddressed this problem by combining a food pur-chasing task with a passive monetary lottery (Hareet al., 2008). As shown in Figure 8.7, at the beginningof each trial subjects were shown a food and a pur-chase price, and had to decide whether or not theywanted to purchase it. At that time they were alsoshown the outcome of an exogenous monetary lot-tery that paid a different random amount every trial.As a result, the PE signal at the time of choice wasproportional to the value of the trial, given by thevalue of the food minus its price plus the outcomeof the lottery for trials in which the item is bought,and to the outcome of the lottery for trials in whichit is not. Since the food and lottery parameters wereselected independently, this made it possible to dis-sociate regions encoding PEs from those encodingSVs. The study found that SVs were reflected invmPFC responses, whereas PEs where reflected inthe activity of the vSTR. A striking pattern in thisliterature is that some studies find that vSTR
responses correlate with SVs, but many others donot. This is puzzling because the PE confound ispresent in virtually every choice task. Further workis necessary to understand the source of this impor-tant inconsistency.
Third, studies have also tested if the vmPFCresponses are modulated by action-related informa-tion, which would be inconsistent with the encodingof a pure SV signal. A recent fMRI study created aparadigm in which subjects were shown the choiceoptions before being shown the movements requiredto obtain them (Wunderlich et al., 2010). This allowedsubjects to choose one of the stimuli withoutknowing which actions they would have to take toimplement that choice. The study found evidence forSV coding in the vmPFC before the action contin-gencies were provided, which suggests that actioninformation is not required for these representations.See Glascher et al. (2009) for additional corroboratingevidence, although it should be noted that thisconclusion is not universally accepted in the neuroe-conomics field.
Fourth, another important property of a SV signal isthat it is a precursor of choice, and thus it should notdepend on the outcome of the decision process.Consistent with this, Hare et al. (2011a) Lim et al.(2011) have shown that the sign and strength of the
Separating value and salience signals
dACC Insula Fusiform
mOFC, rACC, PCCValuation Salience
n.s.
mOFC1.5
1
0.5
Bet
a
0
***
Valuation Salience
n.s.
L-rACC1.5
1
0.5
0
–0.5
Bet
a
–1
***
3
2.5
2
1.5
1
0.5
0
–0.5Valuation Salience
***L-Insula
Bet
a
n.s.
2.5
2
1.5
1
0.5
0
Valuation Salience
***L-Insula
Bet
a
n.s.
Pre-scanningliking rating task
Decision:min{RT, 2s}
(2s-response RT)blank
Mean 4sblank
Time
Eating decisiontask in scanner
Select random trialfor eating/not-eating
Receive selected fooditem (if applicable)(A)
(C)
(B)x=0
z =–0z = –18z = 0
FIGURE 8.6 (A) A simple choice task designed to dissociate stimulus value signals from saliency signals. (B) The study found value-sensitive signals in both medial OFC (mOFC) and the rostral anterior cingulate (rACC), as well as PCC. (C) Saliency correlated significantlywith several distinct regions, including dorsal ACC, insular cortex (insula), and bilateral fusiform gyrus. Images are from Litt et al. (2011).
133EVIDENCE: STIMULUS VALUE SIGNALS IN BASIC VALUATION TASKS
NEUROECONOMICS

vmPFC responses at the time of choice depend on thestimuli being evaluated, but not on which of them ischosen.
Fifth, according to our model, SVs are used asinputs to the comparison process (either directly, orindirectly through the computation of AVs, as shownin Figure 8.1C). As a result, one would expect thatareas involved in SV computations would exhibitincreased functional connectivity with the networkinvolved in the comparison process at the time of mak-ing decisions. Two studies found several pieces of keyevidence consistent with this (Basten et al., 2010; Hareet al., 2011b). In particular, Hare et al. (2011b) arguesthat a brain area involved in implementing the com-parison process must exhibit the following properties:(i) its activity in each trial at the time of choice shouldcorrelate with the total level of activity predicted bythe a neural implementation of the best fitting DDM ofthe task; (ii) it should receive as an input signals fromthe area of vmPFC involved in SV computation; and(iii) it should modulate activity in the motor cortex ina way that is consistent with implementing the choice.The study found that activity in dorsomedial prefron-tal cortex (dmPFC) and the bilateral intraparietal sul-cus (IPS) satisfy the three required properties.
Additional corroborating evidence can be found inthe neurophysiology literature. For example, neuronsin dmPFC have been shown to reflect several differentdecision variables (Kennerley et al., 2009, 2011),making this region ideally qualified to compare theSVs and ACs of different options and select the best
course of action. For further details on the computationand comparison of AV, please refer to Chapter 22.
Jointly, the results described in this section providestrong evidence in support of the hypothesis thatvmPFC responses at the time of making a simplechoice reflect the computation of a SV that is passed(either directly or indirectly through the computationof action values, as in Figure 8.1C) to a comparatorsystem, implemented in areas such as dmPFC and IPS,in order to guide choices.
A significant amount of effort in the field has beendevoted to investigating if these key findings are robustto different specifications of the choice task, and if thesame region of vmPFC encodes the value of differenttypes of stimuli. Although much work remains to bedone, the evidence so far suggests that the findings arequite robust. Consider a handful of examples. Onestudy asked individuals to make choices between a con-stant reference item and three different types of goods:Caltech bookstore paraphernalia, foods, and monetarylotteries (Chib et al., 2009). The data revealed that thesame vmPFC region identified above correlated withthe SVs of the three types of objects (Figure 8.8).Futhermore, the location of the SV signals were thesame regardless of the type of good (food, parapherna-lia or money) used as the constant reference option.Thus, the finding stands even when subjects are notforced to make comparisons to a monetary scale.Further evidence for the stability of the vmPFC valuesignal across stimulus modalities is provided by Levyand Glimcher (2011). Several studies have also shown
4sfood itempresentation
1–10sfixation
GV trial DV trial PE trial
Separating value and prediction error signals
(C)
0.6
(B)(A)
beta
beta
beta
0.40.2
2mOFC cOFC
p < 0.002 p < 0.007
VS
Decision value
Goal value
0.60.40.2
2mOFC cOFC
p < 0.535 p < 0.215
VS
Prediction error
0.60.40.2
2mOFC cOFC
p < 0.469 p < 0.001
VS
FIGURE 8.7 An fMRI study of different value computations. (A) At the beginning of each trials, subjects were shown a food and a pur-chase price and then decided whether or not to purchase. Trials dissociated goal value (GV), decision value (DV), and prediction errors (PE).(B and C) We consider both GV and DV to be stimulus values. The study found that SV where reflected in vmPFC responses (red and yellow),whereas PE where reflected in the activity of the vSTR (green). Data are from Hare et al. (2008).
134 8. THE COMPUTATION OF STIMULUS VALUES IN SIMPLE CHOICE
NEUROECONOMICS

that the vmPFC correlates with SVs during socialdecision making (Hare et al., 2010; Lin et al., 2012).Studies have also shown that vmPFC encodes the over-all SV of the choice options, even in circumstanceswhen they have to be computed by integrating complexinformation (Figure 8.9), such as different reward prob-abilities (Kahnt et al., 2011; Philiastides et al., 2010). TheSV representations in vmPFC have even been shown tobe present when individuals are not explicitly makingchoices and are instead “passively” exposed to thestimuli (Lebreton et al., 2009), sometimes associatedwith the phrase “automatic valuation” (Figure 8.10). Infact, the signals are robust enough to be able to predictsubsequent choices (Levy et al., 2011; Smith et al., 2010;Tusche et al., 2010).
Several papers have also investigated if the samearea of vmPFC encodes the SV of appetitive and aver-sive items using a common scale. This question is moti-vated by the fact that many psychological theoriesassume that choices among appetitive items, sometimescalled approach choice, and choices among aversiveitems, sometimes called avoidance choice, involve sepa-rate systems (Larsen et al., 2004). Under this theory, theapproach system encodes how good a stimulus is, and
thus correlates positively with SVs. In contrast, theaversive system encodes how bad a stimulus is, andthus correlates negatively with SVs. An fMRI studycompared the areas involved in computing the value ofappetitive and aversive food items using a biddingtask, and found that common areas of vmPFC corre-lated positively with the SV of the items, regardless oftheir valence (Plassmann et al., 2010). Related studiesusing multi-attribute monetary stimuli involving gainsand losses suggest that both of them are processed andintegrated in the same area of vmPFC (Basten et al.,2010; Park et al., 2011; Tom et al., 2007). These studiesare important because they show that, at least in thecase of simple choice, the same area of the brain seemsto encode the decision value for both types of choices,thus providing evidence against the hypothesis thatthere are separate appetitive and aversive valuationsystems in goal-directed choice.
Finally, a number of studies also investigated thetiming with which SV signals appear in vmPFC.Behaviorally, one study found that individuals canmake value maximizing choices with above chancereliability in about 300 milliseconds (ms), which impliesthat SVs must be computed faster than this
Money Snacks
+
Trinkets
Stimulus value signals across different reward modalities
Pre-scanning During fMRI scanning
Free response timeBDM auction
2 secbinary choice
I–10 secfixation
$2.35
$0 $1 $2 $3 $4
FIGURE 8.8 An fMRI study of choice across several reward modalities. Subjects were asked to make choices between a constant referenceitem and three different types of goods: Caltech bookstore paraphernalia, foods, and monetary lotteries (top). Importantly, vmPFC identifiedcorrelated with the SVs of the three types of objects (bottom), and the location of the SV signals were the same regardless of the type of good(food, paraphernalia or money) used as the constant reference option. Data are from Chib et al. (2009).
135EVIDENCE: STIMULUS VALUE SIGNALS IN BASIC VALUATION TASKS
NEUROECONOMICS

(Milosavljevic et al., 2011). An EEG and source recon-struction to identify the area of vmPFC associated withthe computation of SVs, and found that a very similararea to the one identified in the fMRI studies exhibitedactivity proportional to the SVs about 400 ms into the
decision process (Harris et al., 2011). Similarly, anotherstudy employed MEG to investigate related questionsand find reliable SV in vmPFC in a similar time scale(Hunt et al., 2012). Finally, another fMRI study investi-gated the duration of the SV signals computed whilesubjects made Yes/No food choices at different exoge-nously imposed speeds (Sokol-Hessner et al., 2012). Theresults suggest that the SV computations in vmPFC anddlPFC were slower in slower trials, even though theadditional computation time had little impact on thequality of the choices.
Although this chapter has demonstrated that SVsappear to reliably be encoded in vmPFC, how precise isthe localization in vmPFC? A careful look at the studiesof SV highlighted in this chapter shows the area ofvmPFC identified in all of these humans studies is fairlyconsistent (Levy and Glimcher, 2012; Roy et al., 2012).Furthermore, although the evidence so far is only corre-lational, the stringent nature of all the additional testsdescribed above provides increased support to thishypothesis. The limited existing evidence on causality,which will be discussed in a later section, is also sup-portive of this conclusion.
These results suggest an anatomical and functionaldissociation between the vmPFC, which is involvedin computing stimulus values, and areas of dmPFCand IPS which are involved in implementing thecomparison process. As depicted in Figure 8.11A, inhumans vmPFC includes regions of medial orbitofron-tal cortex (OFC, areas 11 & 14), as well and part ofventral medial cortex (area 10), but does not includecentral or lateral OFC (areas 13 and 12/47 respectively)(O’Doherty, 2011; Wallis, 2012). Interestingly, vmPFCis reciprocally connected with many areas involved in
500
3000Self-paced
6
4
0
2
8
–10
–10
0
0
10
10
–10 0 10
Outcome value signals from passive exposure to images
+
FIGURE 8.10 Participants in an fMRI experiment provided pleasantness ratings for a range of different stimuli including faces, houses,and paintings, and at the end of the experiment indicated preferences between pairs of images. This value signal � a pleasantness rating �correlated with both vmPFC (sagittal slice) and vSTR (coronal slice). Data are from Lebreton et al. (2009).
Integration of computed stimulus value signals
StimulusDelay
Delay(Response)
++
+
+ –
+F + H
�or X
1.25s 2–4s0.75s
1.5–3.5s0.75s
1.5–3.5s
vmPFC
Responsecues Feedback
ITI
4.5
Z-s
core 2.6
2.6
4.5
R L
Z=-2
FIGURE 8.9 An fMRI study of how the brain integrates complexinformation. On each trial (top), subjects viewed four images of facesand houses, and had to choose whether or not a house or a facewould provide a reward. All stimuli represented probabilistic mone-tary rewards. Only vmPFC showed a signal (bottom) that reflectedthe combination of evidence for face (F) and house (H). Data are fromPhiliastides et al. (2010).
136 8. THE COMPUTATION OF STIMULUS VALUES IN SIMPLE CHOICE
NEUROECONOMICS
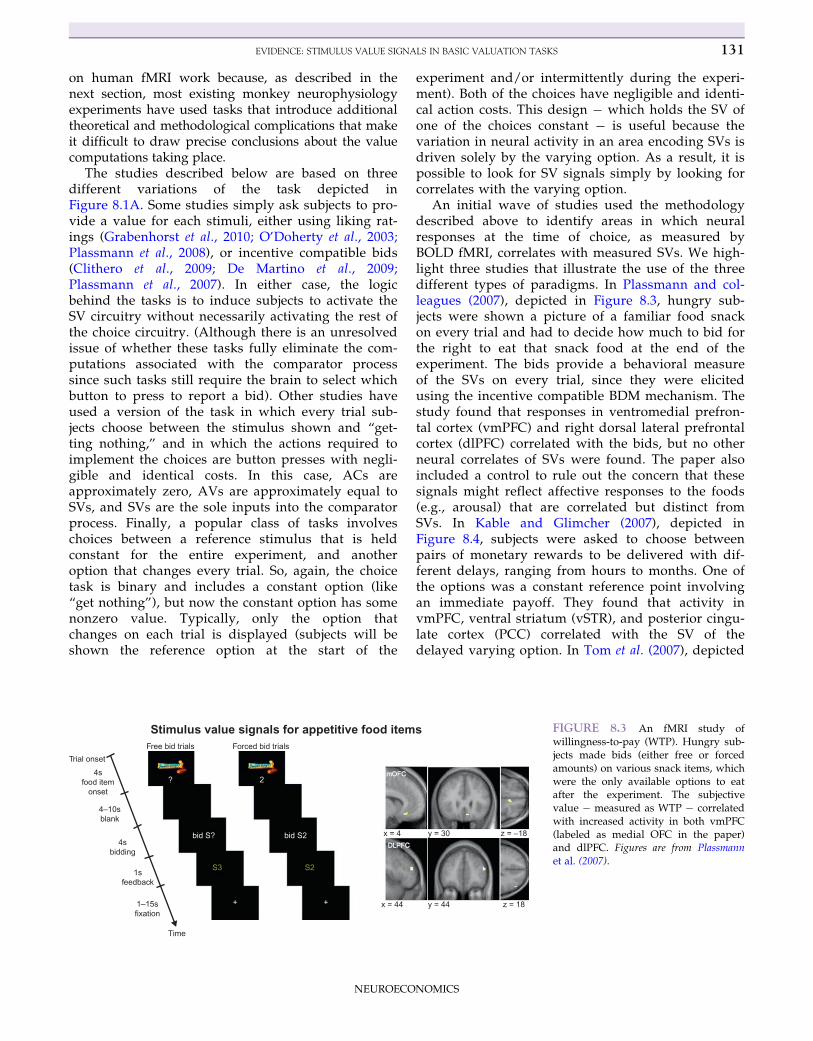
affect and cognition, such as hippocampus, amygdala,hypothalamus, striatum, and other parts of prefrontalcortex (see Chapter 12), but is weakly connected withmotor areas (Carmichael and Price, 1995; Ongur andPrice, 2000). This puts it in a good position to be ableto compute SVs, but not to influence decisions directly.In contrast, the dmPFC (sometimes similar regions arelabeled as areas of dorsal ACC) is heavily inter- con-nected with both supplementary motor areas and areasof vmPFC thought to be involved in valuation, but notwith sensory areas (Beckmann et al., 2009; Picard andStrick, 2001). A recent parcellation of the entire cingu-late cortex (Beckmann et al., 2009) found distinct con-nectivity for regions discussed in this chapter withrespect to SV, primarily clusters 1 and 2, comparedwith other regions potentially involved in AV, namelyclusters 3 through 5 (Figure 8.11B). Another study alsocompleted a functional parcellation of orbitofrontalcortex (OFC), which also includes regions commonlylabeled as vmPFC in studies of SV (Kahnt et al., 2012).This analysis of fMRI data indicated distinct connectiv-ity to regions discussed in this chapter, including IPS,ACC, and PCC (Figure 8.11C).
COMPLICATION: ATTENTIONMODULATES THE COMPUTATION
AND COMPARISON OFSTIMULUS VALUES
Although the model and choice tasks describedabove have been widely used, they do not encompassmany simple choice situations of interest. As an
example, consider the following situation: choosebetween a food shown in the left visual field by press-ing a button with the left hand, and another foodshown in the right visual field by pressing another but-ton with the right hand. This simple example does notcorrespond to any of the previous studies for a simplereason: both options are allowed to vary every period,so that there is no constant reference option.
Moving to this type of choice environment introducestwo important complications. First, suppose that there isrelative SV coding (in the sense that the SV of every itemis encoded as the difference between its value and thatof a reference point, say SVoption � SVreference), as it seemsto be the case from the behavioral (Ericson and Fuster,2011; Kahneman and Tversky, 1979) and neural data(De Martino et al., 2009). Then, it is not obvious which ofthe two options should serve as the reference point fromwhich relative values are computed, since both of themare changing every period. Second, attention is likely tofluctuate among the different items being evaluatedduring the course of the decision, and this might affectthe SV computations. Note that this is not a theoreticalcuriosity, but something that needs to be addressed tounderstand simple choices in the real world, such ashow an individual works through all the options at abuffet table.
Figure 8.12 depicts two binary choice tasks that havebeen repeatedly used in previous studies. InFigure 8.12A, subjects are shown pairs of snack foods,and are free to fixate back-and-forth until they are readyto make a choice by pressing a button (Krajbich et al.,2010). In Figure 8.12B, subjects have to choose betweenthe left and the right options, which are associated with
(B) (C)
AllocortexAgranular cortexDysgranular cortex
Thin, lightly granular cortex
(A)
Cluster 8
Cluster 7
Cluster 1
Cluster 2
Cluster 3
Cluster 4 Cluster 5 Cluster 6
Cluster 9
Orbitofrontal cortex
Functional clusters
Medial frontal cortex
Granular, homotypical cortex
Orbitofrontal cortex
FIGURE 8.11 (A) Anatomy of the human frontal cortex. These archotectonic maps are included to demonstrate the diversity and signifi-cant variability in the structure of neighboring regions in human frontal cortex. Images are from Wise (2008), and a similar figure appears inWallis (2012). (B) A recent study completed a parcellation of human cingulate cortex and medial frontal cortex by using diffusion-weightedmagnetic resonance imaging and probabilistic tractography, demonstrating distinct connectivity within much of human frontal cortex.Importantly, cluster 2 (green) demonstrated strong correspondence to a large literature of reward studies. Data are from Beckmann et al. (2009),and see Rushworth et al. (2011) for additional discussion. (C) Another recent study used resting-state fMRI data to parcellate OFC. Their analysisfound six clusters (inset) with distinct functional connecitivity profiles. Positive connectivity (yellow) was exhibited in all clusters, and nega-tive connectivity was found in some (blue). Note strong connectivity with much of prefrontal cortex, as well as PCC and parts of the striatum.Images are from Kahnt et al. (2012).
137COMPLICATION: ATTENTION MODULATES THE COMPUTATION AND COMPARISON OF STIMULUS VALUES
NEUROECONOMICS

a stochastically evolving probability of paying a reward(Behrens et al., 2007; Boorman et al., 2009). The subjectslearn the probabilities by trial and error, with the size ofthe monetary prize for each option being randomlydrawn each trial from a known distribution. This lastproperty ensures that subjects cannot make a choiceuntil all of the payoff information is provided (Behrenset al., 2007; Boorman et al., 2009).
Both tasks involve binary choices among options thatchange every trial, and action costs that are negligibleand equal across options. The model in Figure 8.13extends the model of simple choice to accommodate theadditional complications. As before, it assumes that SVsand ACs are computed separately, that they are inte-grated into a net AV signal, that the AV signal is passedto the comparator to guide the choice process, that thevalues are computed from the time the options are pre-sented to the time a choice is made, and that value com-putations are made using a relative subjective value(RSV) code. The key difference is in how the referencepoints are selected. The model now assumes that at any
point in time, SVs and ACs encode the value/costof the attended option minus the value/cost of theunattended one. Thus, when the subject looks left, theSV signals encode the value of left minus the value ofright stimuli, and the opposite is true when he looksright. This implies that visual attention at any particularinstant determines the identity of the reference point.One additional assumption is that the SV value of theattended item might be weighted more heavily, so thatthe relative SV signal is given by:
RSVt 5α SVðattended itemtÞ2 SVðunattended itemtÞ:ð8:2Þ
The parameter α measures the strength of the atten-tional bias, with α5 1 denoting the case of no bias.
In the types of tasks studied here, the ACs are iden-tical and negligible, and as a result they can beassumed to be zero. This implies that AVs are directlyproportional to SVs, and that the same attention-basedrelative value code applies there. If this where not thecase, the AC signals would be computed using ananalogous attentionaly modulated relative code.
The model discussed in this section is known as theattentional DDM (aDDM) (Krajbich and Rangel, 2011;Krajbich et al., 2010, 2012), and it assumes that the com-parator process is described by an extension of theDDM. As depicted in Figure 8.13, the model is similarto the basic DDM: it takes the AVs as inputs and inte-grates dynamically subject to some Gaussian noise untilthe accumulated evidence for one of the two responsesbecomes strong enough to cross the pre-specified bar-riers. The key difference is that the accumulator signalinherits the attentional modulation properties of theSVs and AV signals. This implies that the integratedrelative value signal in favor of choosing the left optionover the right option evolves according to:
Rt11 5Rt 1α SVðattended itemtÞ2 SVðunattended itemtÞ1εt;
ð8:3Þ
All other elements of the model remain unchanged(refer to Figure 8.1), and methods for identifying the
Attentional drift-diffusion model of simple choice
Barrier left
Barrier right
Rel
ativ
e de
cisi
on v
alue
Left Right Left
Time
ChooseLeft
FIGURE 8.13 The attentional drift-diffusion model (aDDM) ofchoice, from Krajbich et al. (2010). The model accounts for attentionalshifts that bias the accumulator and comparator introduced inFigure 8.1. In this example, the decision maker ultimately chooses“Left” after the relative subjective value evolves over time, withthe slope of accumulation biased towards the option on which thesubject is fixated. See text for more details.
(A) (B)
2,000 ms(enforced) Free RT 1,000 ms
37
37 63
63
FIGURE 8.12 Two examples of simplechoice environments. Subjects choosebetween (A) two different food items(Krajbich et al., 2010), or (B) two stochasticmonetary rewards (Behrens et al., 2007),where feedback for the correct choice(here, blue) is provided after the choice.
138 8. THE COMPUTATION OF STIMULUS VALUES IN SIMPLE CHOICE
NEUROECONOMICS

other model parameters outlined here and in otherchapters still apply. As in the DDM, the εt term reflectsindependent and identically distributed Gaussiannoise in the integration process.
The model has several novel properties, in additionto those generated by a more standard DDM. First, itmakes strong quantitative predictions about the corre-lation between attention, choices, and reaction times.These predictions can be tested by combining eye-tracking (which provides an instantaneous measure ofvisual attention in the form of the identity of the stim-ulus being fixated), choice and reaction time data. Forexample, it predicts sizable choice biases when α. 1:options that were fixated on more, due to random fluc-tuations in attention, were more likely to be chosen.Using these methods, an eye-tracking study carriedout a systematic test of the extent to which the aDDMmodel can explain these types of patterns, and foundthat it is able to account for them with high quantita-tive accuracy (Krajbich et al., 2010). Second, it predictsthat experimenter induced changes in attention (forexample, through marketing manipulations) shouldbias choices in favor of the most attended option whenits value is positive, but it should have the oppositeeffect when the value is negative. Consistent with thisprediction, several studies have found that it is possi-ble to bias choices through these types of manipua-tions (Armel et al., 2008; Milosavljevic et al., 2010;Shimojo et al., 2003). Third, it predicts that if the fixa-tion process is independent of the value of the stimuli(so that, for example, higher value items are not fix-ated on earlier or longer), and there is an attentionalbias, then there will be a bias towards fixating on thelast option that increases with computation time. Thedata in the paper first outlining the aDDM (Krajbichet al., 2010) exhibits both of these patterns.
This last point is critical for understanding the neuralproperties of the SV signals that one would expect tofind with techniques like fMRI, that have limited tem-poral resolution. The model predicts that in the absenceof an attentional bias (i.e., α5 1 in the aDDM model), theaverage value SV signal in vmPFC over the course of adecision trial should be zero. In this case it would notbe possible to identify the underlying SV signals usingfMRI. In contrast, if there is an attentional bias (i.e.,α, 1), and visual attention is not measured and con-trolled for (as is the case in most studies), the modelpredicts that the measured SV signal would reflect theunderlying attentional bias for the chosen item. In thiscase, activity in a SV coding area would correlate withthe SV of the chosen item minus the SV of the unchosenitem. Since this has been a source of confusion in theliterature, it is important to emphasize that fMRImeasures of the SV signals take this form not becausethey reflect the outcome of the choice process (as has
been argued by Hunt et al., 2012; Jocham et al., 2012), orbecause they actually encode the value of the chosenand unchosen items, but as a consequence of the prop-erties of the underlying data generating process, and ofthe limitations of measuring neural signals with fMRI(which have poor temporal resolution, and thus aver-age activity across fixations).
These limitations point to the value of complement-ing or combining fMRI with methods, such as EEG andMEG, that have better temporal resolution. In the pres-ence of an attentional bias, and as long as attention isnot measured and controlled, the model predicts thatthe SV signal in vmPFC should reflect both the left andright SVs early on, when the attentional bias towardsthe chosen item is low, and gradually switch to reflectthe difference in value between the chosen and theunchosen items as the trial progresses. As long as thesource of the SV signals can be reliably localized usingthese methods (a topic of some controversy, but therehave been some efforts to localize such signals; Harriset al., 2011; Hunt et al., 2012), these temporal propertiesof the signal can be tested using the high temporalresolution measurements provided by EEG or MEG.
One fMRI study carried out a critical test of the roleof visual attention in the computation of SV signals.They asked subjects to perform the binary food choicetask in Figure 8.14A inside the scanner with two impor-tant twists (Lim et al., 2011). First, they exogenously andrandomly manipulated the duration and location offixations. Second, in order to deal with the limited tem-poral resolution of fMRI, the choice process was sloweddown: fixation duration ranged from 1 to 4 seconds,and each item was seen twice before a choice couldbe made. Consistent with the model, they found thatthe activity in the same areas of vmPFC discussedbefore correlated with an attentionally modulated rela-tive code (Figure 8.14A, bottom). The same was true forthe vSTR.
A recent MEG study (Hunt et al., 2012) studied theevolution of the vmPFC responses during the course ofa binary choice, but did not control for visual attention.Also consistent with the predictions of the model, theyfound that activity in this area gradually switched fromreflecting the sum of the SVs to the difference betweenthe value of the chosen and unchosen options.
Several fMRI studies have looked at the valuesignals encoded in various types of binary choices. Forexample, the authors of one fMRI study investigatedthe nature of value coding in the task shown inFigure 8.14B (Boorman et al., 2009). As predicted bythe model describing the role of attention in the com-putation of SV signals, the study found that vmPFCresponses at the time of choice correlated with thevalue difference between the chosen and unchosenitems. Similar results have also been found in other
139COMPLICATION: ATTENTION MODULATES THE COMPUTATION AND COMPARISON OF STIMULUS VALUES
NEUROECONOMICS

fMRI studies comparing SV signals for chosen andunchosen options (FitzGerald et al., 2009; Glascheret al., 2009; Talmi et al., 2009).
A reconsideration of some recent monkey neuro-physiology studies also highlight the importance ofcontrolling for attention. In particular, there are a largenumber of neurophysiology papers that have recordedthe activity of neurons in the central OFC (cOFC;Brodmann’s area 13) during binary decision-makingtasks. (Note that most human fMRI studies referencevmPFC for SV signals, whereas many monkey studiesreport positive results from OFC, a topic of recentdiscussion; Wallis, 2012.) An extremely influentialstudy is Padoa-Schioppa and Assad (2006), which isdepicted in Figure 8.15. Thirsty animals make choicesbetween different amounts of two juices, A and B. Thelocation and amount of the juices changed every trial.Animals indicate their choices through eye-movementswhen prompted to do so. Using the methods describedabove, the authors were able to estimate the SVs of all
of the options. Their key finding was that during theevaluation period the responses of a sizable fractionof neurons in cOFC correlated with either the SVs ofspecific juices, or with the value of the chosen option.(The results in the supplementary materials section ofthat paper suggest that some units might also reflectthe value difference between the chosen and unchosenoptions). This has been widely interpreted as evidencethat single units in the OFC encode the value of thechosen option. However, since the study does not con-trol for visual attention, for the same reasons describedabove, the units reflecting chosen minus unchosenvalues are also consistent with the computation ofattentionally modulated relative value signals. In thecase of thirsty and highly trained animals, it may bethat the attentional bias is particularly strong, whichwould further increase the attentional modulation ofthe chosen option, compared to the unchosen one.Despite this important caveat, the study also provideda separate but criticial insight: the monkey OFC seems
FIGURE 8.14 Implications for chosen value signals with and without accounting for attention. (A) An fMRI study asked subjects to per-form the binary food choice task that exogenously and randomly manipulated the duration and location of fixations (yellow arrows illustratetarget positions). The study found vmPFC correlated with an attentionally modulated relative value (bottom), meaning the same relative value(left minus right) was greater when subjects fixated left (red) than when they fixated right (blue). Data are from Lim et al. (2011). (B) In an fMRIstudy with a task similar to the one shown in Figure 8.12B, subjects chose between two stochastic monetary rewards (top). Time courses reveala positive correlation with the chosen reward and a negative correlation with the unchosen reward in vmPFC. Further, the relative chosenvalue (chosen minus unchosen) was encoded in vmPFC. Data are from Boorman et al. (2009).
140 8. THE COMPUTATION OF STIMULUS VALUES IN SIMPLE CHOICE
NEUROECONOMICS

to contain an equal proportion of neurons involved inabsolute and relative coding. This observation, whichhas also been replicated (Kobayashi et al., 2010), isimportant because it suggests that the OFC might firstcompute the absolute value of the stimuli and then useit to compute a relative and attentionally modulatedrepresentation to be passed to the comparator.
Another important and related study is depicted inFigure 8.16 (Kennerley et al., 2011). Thirsty animalsmade choices between pairs of stimuli that were asso-ciated with different amounts of juice delivered withvarious probabilities, as well as different amounts ofrequired effort (in the form of different numbers oflever presses). Importantly, the lever presses were notpart of the choice process, and in fact were “paid” bythe monkey at a separate time, thus representing anegative attribute of the stimuli, and not an actioncost. Another important feature of their experiment isthat in any given trial the stimuli only differed in oneof the dimensions, and that to make choices non-trivialitems with adjacent values were always paired againsteach other. This last feature is important because itmakes it impossible to distinguish between correla-tions with SVs (which reflect the value of stimuli
independently of the choice made) and chosen values(which reflect the value of the chosen option). A keyfinding of the study is that units in cOFC (area 13)were more likely to be consistent with the encoding ofSV signals. Since the authors did not control for visualattention, the same issues regarding the interpretationof chosen value signals apply here.
An important limitation of the model outlined hereis that it does not provide an explanation of whatdrives the attentional process. One natural hypothesisis that the fixation process is driven in part by theunderlying values of the stimuli. However, the datafrom tests of the aDDM (Krajbich and Rangel, 2011;Krajbich et al., 2010, 2012) suggest that this is not thecase: the fixation process exhibits spatial biases (e.g.,first fixation to the left item are more likely), but isuncorrelated with independently taken measures ofthe SVs. A more subtle version of this hypothesis isthat at any point in time, attention is modulated by thecurrent representation of the raw and integrated sig-nals, such as those present in vmPFC and dmPFC.Testing this theory is difficult because it requiresinstantaneous measures of these signals, but is a criti-cal open question for future research.
100
(A)
(B)
(C)
50
0
0:1 1:21:3 1:1 3:1 3:1 2:1
2:1 4:1 10:10:1 1:3 1:21:1 2:1 3:1 4:1 6:1 2:0 0:1 1:31:2 1:12:1 3:14:1 6:1 2:0
100
50
0
100
50
0
1A = 2.5B 1A = 2.5B 1A = 2.5B
0:1 1:31:2 1:12:1 3:14:1 6:1 2:0
100
50
0
1A = 2.5B
Fixate1.5 s
TasteOfferChosen
Offer on1–2 s delay
GoReaction time
Saccade targets
Value signals in orbitofrontal cortex neurons
0.75 s to juice
0:1
40
30
20
10
01:1 3:1 3:1 2:0
1:2 2:1 4:1
Offers (#B : #A) Offers (#B : #A) Offers (#B : #A) Offers (#B : #A)10:1
40
30
20
10
00:1 1:3 1:21:1 2:1 3:1 4:1 6:1 2:0
10
00:1 1:3 1:21:1 2:1 3:1 4:1 6:1 2:0
10
00:1 1:3 1:21:1 2:1 3:1 4:1 6:1 2:0
90
60
30
00
Offer Juice
Num
ber
of c
ells
01,000 –1,000Time
1,000 ms
offer valueChosen valuetaste
FIGURE 8.15 A neurophysiology study of value signals in OFC. (A) Monkeys chose between different rewards (juices) offered in variableamounts, with different colors paired with different rewards, and the number of squares indicated different magnitudes. (B) Evidence fordifferent neuronal responses to different value signals. A U-shaped relationship for chosen value (left), offer value (middle) that reflectsincreasing magnitude of juice, and taste (right), where the neuronal response is binary depending upon the chosen juice, not the magnitude.(C) Time courses for the different value signals in OFC, indicating that soon after an offer, some OFC neurons encode the offer value (the SVof one juice or the other), some encode chosen value (but see the main text for discussion of attentional effects), and some encode taste. Dataare from Padoa-Schioppa and Assad (2006).
141COMPLICATION: ATTENTION MODULATES THE COMPUTATION AND COMPARISON OF STIMULUS VALUES
NEUROECONOMICS

THEORY: HOWARE STIMULUSVALUES COMPUTED?
The previous findings support the hypothesis thatvmPFC responses at the time of decision encode aSV signal. But this raises another important and rela-tively unexplored question: how are these SV signalscomputed?
One popular theory states that SVs are learnedthrough reinforcement learning and repeated experi-ence with the stimuli, and that the SVs are simplystored in frontal cortex and retrieved at the time ofdecision (see Chapter 15). Although this process islikely to be at work in settings where subjects repeat-edly face a small number of stimuli, it cannot accountfor the fact that humans easily evaluate novel stimuli.
An alternative view is provided by the attribute inte-gration model of SV computation. The model builds onthe fact that most stimuli are complex bundles of morebasic attributes (e.g., foods can be described by a list ofperceptual properties such as size, color, and texture).Using this fact, the model hypothesizes that animalsevaluate any stimulus, novel or not, by learning thevalue of the basic attributes that make up the stimulus
and then integrating those attribute values into anoverall stimulus value at the time of choice.
This model is illustrated in Figure 8.17. Considerthe problem of assigning a value to eating an apple.This consumption act has implications for several basicattributes, or dimensions, such as taste, caloric intake,vitamin and mineral regulation, as well as moreabstract dimensions such as health and self-image.Let di(x) denote the characteristics of stimulus x forattribute i. The model assumes that:
SVðxÞ5X
widiðxÞ; ð8:4Þ
for some set of set of attribute weights wi. In otherwords, the SV is a linear weighted sum of all consid-ered attributes.
The model has interesting properties. First, itimplies that the SVs used to guide choices depend onthe attributes that are assigned for each option at thetime of choice. This implies that the choice processtakes into account the value of an attribute only to theextent that the brain can take it into account in the con-struction of the decision values. Second, it providestwo distinct sources of individual differences: weights
Multiplexing of value signals and rewad history in single neurons
Probability Payoff Effort All three
50
50
0.2
–0.2
–0.4
–0.6
0
0 0.5Time from picture onset (s) Time from picture onset (s)
1.0 1.5
0.2
–0.2
–0.4
–0.6
0
0 0.5 1.0 1.5Trial N
Trial N versusN – 1 overall value
Cor
rela
tion
(r):
N v
ersu
s N
– 1
val
ue
Cor
rela
tion
(r):
N v
ersu
s N
– 2
val
ue
Trial N versusN – 2 overall value
Trial
LPFCOFCACC
LPFC (N = 257)OFC (N = 140)ACC (N = 213)
LPFC versus ACCOFC versus LPFCOFC versus ACC
overallvalue
overallvalue
N and N – 1overall value
Trial N – 1–50
0
Per
cent
age
sele
ctiv
ityP
erce
ntag
e se
lect
ivity
–50
0
50
–50
LPFC
ACCOFC
0
5020
–20–50
0 0
+
–
+
–
Fixation(1 s)
(A) (B)
(C)Choice(1.5 s)
Response(left or right movement)
FIGURE 8.16 A neurophysiology study of value signals in three different regions: lateral prefrontal cortex (lPFC, blue), OFC (green), andACC (yellow). (A) In the task, monkeys made a choice between two stimuli. There were six sets of pictures, each associated with a specificoutcome. The amount of reward (juice) and the probability of receiving a reward, as well the amount of effort required varied across images.Monkeys indicate choices with an eye movement. (B) The bar plots show the prevalence of neurons encoding choice value with a positive ornegative regression coefficient in lPFC, OFC, and ACC. ACC had the largest fraction of multiplexed neurons. (C) Recent value history alsoaffects neuronal firing. The bar plot shows the proportion of neurons encoding the chosen value of the current trial (labeled as N), the previ-ous trial (N2 1), or both. OFC neurons exhibited negative correlation with previous trial value (N2 1, middle), as well as two trials back(N2 2, right), indicating an influence of recent values on current value representation. Data are from Kennerley et al. (2011).
142 8. THE COMPUTATION OF STIMULUS VALUES IN SIMPLE CHOICE
NEUROECONOMICS

might vary because of heterogeneity in preferences foran attribute, or weights might vary because of hetero-geneity in a decision-maker’s perception of thatattribute.
Although much work remains to be done in testingthis component of the computational model, severalstudies have provided supporting evidence for theattribute integration model. One such study looked atdietary choices that involved self-control (Hare et al.,2009). Hungry subjects were asked to make choicesabout which foods they wanted to have as a snack.
Subjects were shown a variety of foods that varied inde-pendently in their healthiness and taste. Prior to thechoice task, taste and health ratings were collected foreach of the foods. As shown in Figure 8.18A, theauthors found activity in the vmPFC correlated withboth attributes. More importantly, the relative weightthat the attributes received in the decision value signalsmeasured in the vmPFC were correlated, across sub-jects, with the weight given to them in the actualchoices made by the same subjects. Interestingly, thestudy also found that health information was
ValueApple
=Value
Sweetness+
ValueCalories
+ValueAcidity
+...
SweetnessValue
sweetness
CaloriesValue
calories
AcidityValueacidity
Simple model of attribute integration for value computation FIGURE 8.17 A simple demonstrationof how the brain might integrate variousattributes of a potential reward (or punish-ment). Here, the decision maker considersthe sweetness, caloric content, and acidityof an apple. That information is integratedinto a value signal for each attribute (mid-dle column, squares). The brain then per-forms computation (not necessarily linear,as the model has assumed here) to com-bine each of the attribute values to arriveat a stimulus value for the apple.Presumably, these attributes could beweighted differently across different con-texts, such as self-control.
(A) (B)Stimulus value computation of different
reward attributes
Modulation of stimulus value computation and
choice behavior
Healthblock
Tasteblock
Decisionblock
Food itemmax 4 sec
Food itemmax 4 sec
Feedback0.5 sec
Fixation4–15 sec
0.8
0.6
0.4
0
Taste rating
SC
Postiveinteraction
Negativeinteraction
NSC
Health rating
–0.2
0.2
0.5
PP
I Bet
a
Bet
a
0
–0.5
SC group NSC group
p < 0.007
FIGURE 8.18 (A) Top: a self-control task that involves three different blocks: rating food items in terms of healthiness, rating food itemsin terms of tastiness, and making decisions about willingness to eat the food items at the end of the experiment. Bottom: the willingness to eatthe food item was correlated with signal in vmPFC. Taste ratings were strongly correlated with vmPFC activity in both individuals who dem-onstrated self control (blue) and those who did not (red), while taste ratings were only correlated with vmPFC activity in those who did notexhibit self control. (B) A connectivity analysis a � psychophysiological interaction � identified a path through which the left dlPFC couldmodulate value computation in the vmPFC. This regulation was present for those displaying self-control (blue), but not for those who’s choicebehavior did not reflect self-control (red). Data are from Hare et al. (2009).
143THEORY: HOWARE STIMULUS VALUES COMPUTED?
NEUROECONOMICS

represented in vmPFC only when a region of left dlPFCwas activated. A functional connectivity analysis(Figure 8.18B) suggested that dlPFC might modulatethe weight placed on different attributes during valuecomputation in OFC. A follow-up study (Hare et al.,2011a) found that exogenously driven increases in theamount of attention paid to the health attributes (byasking subjects to “consider the healthiness” of thefoods) increased the extent to which they were repre-sented in the vmPFC stimulus value signals and thehealthiness of the choices.
Additional evidence for attribute integration comesfrom an fMRI study of charitable decision making(Hare et al., 2010). Subjects were shown descriptionsof different charities and had to decide how muchto donate to them. The study found that vmPFCresponses at the time of decision correlated with behav-ioral measures of the value that a particular subjectassigned to the charities. Moreover, functional connectiv-ity analyses suggest that the vmPFC value signals inte-grated inputs from anterior insula and posterior superiortemporal cortex (pSTC), areas thought to be crucial forsocial cognition. A related study compared the networkinvolved in making equivalent decisions either forone-self or on behalf of another individual (Janowskiet al., 2013). The study found that similar areas of vmPFCencode the SVs in both cases, but that functional connec-tivity between pSTC and vmPFC is critical when makingchoices on behalf of another, but not for self.
EVIDENCE FOR A CAUSAL ROLE OFTHE STIMULUS VALUE SIGNALS
IN vmPFC
Despite the compelling nature of the evidence infavor of the encoding of SV signals in vmPFC, fMRIand neurophysiological measurements are essentiallycorrelational. Just observing that activity in these areasis correlated with SVs is not sufficient to establish thatthey play a causal role in the choice process. This dis-tinction is important because the theories of choicedescribed in this chapter posit a causal role for the SVsignals.
The gold standard for causally linking neural activ-ity to choice behavior would be to precisely manipu-late vmPFC responses at the time of choice and test ifthey lead to changes in the choices that are qualita-tively and quantitatively consistent with the model.A recent study, which combined repetitive transcranialmagnetic stimulation (rTMS) in dlPFC with fMRI, pro-vides preliminary evidence of this type (Baumgartneret al., 2011). The study measures vmPFC responsesat the time of decision by collecting fMRI data immedi-ately after applying rTMS to dlPFC. The results show
that rTMS applied to the right dlPFC diminished theactivation in both dlPFC and vmPFC, as well as thefunctional connectivity between them. Most impor-tantly, this neural change was associated with a consis-tent change in choice behavior.
The only other information currently available regard-ing the causality of the vmPFC SV signals comes fromchoice experiments involving clinical populations withfocal lesions in regions in and around vmPFC, an areathat is sometimes referred to as the ventromedial frontallobe (vmFC). Several hypotheses discussed in this chap-ter with respect to vmPFC function are supported byclinical work. In several studies, individuals with vmFCdamage consistently violate transitivity in simple choiceexperiments (Camille et al., 2011a; Fellows and Farah,2007); individual ability to value-maximize appears to beimpaired with vmFC damage. Similar impairments ofvalue comparison have been seen in macaques, withvmFC lesions leading to more erratic choice behaviorwhen available options are closer in value (Noonan et al.,2010). A similar change in behavior has also been dem-onstrated in intertemporal choice, as damage to vmFC(particularly focal to medial OFC) increased significantlythe preference for small-immediate over larger-delayedrewards, effectively steeper discounting of futurerewards (Sellitto et al., 2010). Still, while these studiesdemonstrate consistent impairment of value-basedchoice across different decision domains, at this pointthe neurology literature does not definitively concludewhether vmFC � including vmPFC � damage impairsthe ability to compute stimulus values, compare stimu-lus values, or both (Fellows, 2011).
Much evidence points to the ACC working in concertwith the vmPFC/OFC to guide value-based behavior,and lesion studies can also contribute to understandingthe complex relationship between these regions, a pointdeveloped in some detail in Chapter 22. While ACCdoes frequently appear to encode value signals, it hasbeen shown that these neurons reflect a multiplexedsignal that integrates different types of information(Hayden and Platt, 2010; Kennerley et al., 2009). Lesionstudies indicate at least two potential relationships.First, lesions in vmPFC/OFC disrupt stimulus�rewardbut not action�reward association, whereas dACClesions (which likely include damage to dmPFC) hadthe opposite effect (Camille et al., 2011b). Second, ACCsulcus lesions in macaques have also been shown toimpair the ability to integrate reward history to appro-priately guide current behavior (Kennerley et al., 2006).A recent analysis of a large set of humans with focallesions (Glascher et al., 2012) also established a causalrelationship linking vmPFC to value-based decisionmaking, and one linking ACC and dlPFC to functionstypically grouped under cognitive control (such asresponse inhibition and task switching).
144 8. THE COMPUTATION OF STIMULUS VALUES IN SIMPLE CHOICE
NEUROECONOMICS

Although this body of literature also appears to beconverging towards a core set of results, the precisemechanisms at work are not yet known. Clearly, as inmost of cognitive neuroscience, much more work hasto be done in probing the causality of the variouscomponents of the neural mechanism of simple choice.Procedures that probe the root of individual differenceswill be crucial, as will cutting-edge methods, such asoptogenetics (Deisseroth, 2011; Fenno et al., 2011),all with computational modeling to test if the causaleffect of these manipulations are consistent with boththe qualitative and the quantitative predictions of thetheory.
CONCLUSIONS
Understanding simple choices is a foundational goalfor neuroeconomics. Simple choices provide the basicframework in which to study the computational andneurobiological basis of decision making. Furthermore,the processes and systems at work in simple choice arelikely to contribute to complex choices, such as thoseinvolving self-control issues, tradeoffs between selfand others, and strategic considerations.
Several pieces of a neural model of simple choiceare now in place. A growing body of data supports thehypothesis that vmPFC encodes SVs at the time ofchoice, that the SV signals use an attention-modulatedrelative subjective value code, and that these valuesare integrated using a comparator processes withcomputational properties that are well-described bythe attentional drift-diffusion model (Krajbich andRangel, 2011; Krajbich et al., 2010). This model providesa firm foundation on which to build our understandingof more complex processes.
Despite the successes in working towards an under-standing of simple choice, neuroeconomics remains ayoung field with many open questions and debates,such as the precise neural mechanisms behind thesecomputations. The good news is further refinements ofthe model described in this chapter are currently beingexplored through application of the methods describedin this book. Many of the open questions outlined herewill be resolved by the time the third edition of thisbook is written.
One of the central messages of this chapter is theimportance of theory and computational modeling.Both of these ingredients are critical for making senseof the body of findings in the domain of simple choice,for helping to design meaningful tests that account forthe limitations of our neural measurement techniques,and for correctly interpreting the data. For example,without a full specification of the valuation and choiceprocess, it would be impossible to untangle why
neural activity in an area encoding relative stimulusvalues � which are a precursor and input to the choiceprocess � might also exhibit neural responses that arecorrelated with the chosen value, which contain post-decision information. The fundamental importance ofcomputational models will only increase as the fieldmoves into more complex forms of choice.
Although the chapter has outlined several pointsof convergence across studies of simple choice, thereremain several pressing questions in the domain ofstimulus valuation and simple choice.
What is the Neural Code Used to RepresentStimulus Values in vmPFC?
Thus far, every well-understood system (e.g., vision)is organized around a code that describes how signalsare attributed to specific neurons, and how the popula-tion activity can be decoded to extract the storedinformation so that it can be used in downstream com-putations. For example, retinotopic maps (in whichreal physical space is represented in the brain using aspatial code) is common in visual sensory and motorsystems. Is the computation of SVs organized around asimilar code? One natural hypothesis is that vmPFCmakes use of an attribute code, so that different unitsrepresent the component of value due to the particularcombination of attributes that they represent, and thatSVs are represented in the population firing rates, andnot on the activity of any single unit. If correct, thiswould help to make sense of the sizable heterogeneityin single unit activity that has been found in singleunit studies (Jenison et al., 2011; Kennerley et al., 2011;Padoa-Schioppa and Assad, 2006).
What and How is the Attribute Space Usedin SV Computations?
As discussed in the previous section, theory andevidence suggest that SVs are computed by identifyingthe attributes of stimuli, evaluating them, and thenintegrating them into a total value representation forthe stimulus. The data suggest that the computation ofsome of these attributes might take place outside ofvmPFC, and those values are then passed to vmPFC tobe integrated into the final SV signal. However, little isknown about what aspect of or how attribute spaceis employed to carry out these operations.
Computational Roles of PCC, dlPFC, vSTRand Amygdala in Simple Choice
Some studies find that neural responses in someareas are correlated with SVs at the time of choice in a
145EVIDENCE FOR A CAUSAL ROLE OF THE STIMULUS VALUE SIGNALS IN VMPFC
NEUROECONOMICS
way that is not easily attributable to arousal, attentional,motor, or prediction error confounds (Litt et al., 2011;Tom et al., 2007). However, in contrast to the vmPFCresponses, which are extremely robust, these otherareas correlate with SVs in some, but not in all para-digms. This suggests that they play a role in simplechoice, but that the computations that they carry outare likely to be different than just encoding SVs. Forexample, a recent model proposed PCC as a regiondetermining the level of internal or external engage-ment, as needed for a current environment (Pearsonet al., 2011). Resolving this puzzle is one of the mostimportant open questions in the domain of simplechoice.
Acknowledgments
This research was supported by the NSF (SES-0851408, SES-0926544,SES- 0850840), NIH (R01 AA018736, R21 AG038866), the Gordon andBetty Moore Foundation, and the Lipper Foundation.
References
Armel, K.C., Beaumel, A., Rangel, A., 2008. Biasing simple choicesby manipulating relative visual attention. Judgment Decis.Making. 3 (5), 396�403.
Basten, U., Biele, G., Heekeren, H.R., Fiebach, C.J., 2010. How thebrain integrates costs and benefits during decision-making. Proc.Natl. Acad. Sci. U.S.A. 107 (50), 21767�21772.
Baumgartner, T., Knoch, D., Hotz, P., Eisenegger, C., Fehr, E., 2011.Dorsolateral and ventromedial prefrontal cortex orchestrate nor-mative choice. Nat. Neurosci. 14 (11), 1468�1474.
Becker, G.M., Degroot, M.H., Marschak, J., 1964. Measuring utilityby a single-response sequential method. Behav. Sci. 9 (3),226�232.
Beckmann, M., Johansen-Berg, H., Rushworth, M.F., 2009.Connectivity-based parcellation of human cingulate cortex and itsrelation to functional specialization. J. Neurosci. 29 (4), 1175�1190.
Behrens, T.E.J., Woolrich, M.W., Walton, M.E., Rushworth, M.F.S.,2007. Learning the value of information in an uncertain world.Nat. Neurosci. 10 (9), 1214�1221.
Boorman, E.D., Behrens, T.E., Woolrich, M.W., Rushworth, M.F.,2009. How green is the grass on the other side? Frontopolar cor-tex and the evidence in favor of alternative courses of action.Neuron. 62 (5), 733�743.
Camille, N., Griffiths, C.A., Vo, K., Fellows, L.K., Kable, J.W., 2011a.Ventromedial frontal lobe damage disrupts value maximizationin humans. J. Neurosci. 31 (20), 7527�7532.
Camille, N., Tsuchida, A., Fellows, L.K., 2011b. Double dissociationof stimulus-value and action-value learning in humans with orbi-tofrontal or anterior cingulate cortex damage. J. Neurosci. 31 (42),15048�15052.
Carmichael, S.T., Price, J.L., 1995. Sensory and premotor connectionsof the orbital and medial prefrontal cortex of macaque monkeys.J. Comp. Neurol. 363 (4), 642�664.
Chib, V.S., Rangel, A., Shimojo, S., O’Doherty, J.P., 2009. Evidencefor a common representation of decision values for dissimilargoods in human ventromedial prefrontal cortex. J. Neurosci. 29(39), 12315�12320.
Clithero, J.A., Carter, R.M., Huettel, S.A., 2009. Local patternclassification differentiates processes of economic valuation.Neuroimage. 45 (4), 1329�1338.
Clithero, J.A., Tankersley, D., Huettel, S.A., 2008. Foundations ofneuroeconomics: from philosophy to practice. PLoS Biol. 6 (11),e298.
De Martino, B., Kumaran, D., Holt, B., Dolan, R.J., 2009. The neurobi-ology of reference-dependent value computation. J. Neurosci. 29(12), 3833�3842.
Deisseroth, K., 2011. Optogenetics. Nat. Methods. 8 (1), 26�29.Ericson, K.M.M., Fuster, A., 2011. Expectations as endowments:
evidence on reference-dependent preferences from exchange andvaluation experiments. Q. J. Econ. 126 (4), 1879�1907.
Fehr, E., Rangel, A., 2011. Neuroeconomic foundations of economicchoice - recent advances. J. Econ. Perspect. 25 (4), 3�30.
Fellows L.K., 2011. The neurology of value. In: Gottfried, J.A. (Ed.),Neurobiology of Sensation and Reward. Boca Raton (FL).
Fellows, L.K., Farah, M.J., 2007. The role of ventromedial prefrontalcortex in decision-making: judgment under uncertainty or judg-ment per se? Cereb. Cortex. 17 (11), 2669�2674.
Fenno, L., Yizhar, O., Deisseroth, K., 2011. The development andapplication of optogenetics. Annu. Rev. Neurosci. 34, 389�412.
FitzGerald, T.H., Seymour, B., Dolan, R.J., 2009. The role of humanorbitofrontal cortex in value comparison for incommensurableobjects. J. Neurosci. 29 (26), 8388�8395.
Glascher, J., Adolphs, R., Damasio, H., et al., 2012. Lesion mappingof cognitive control and value-based decision-making in theprefrontal cortex. Proc. Natl. Acad. Sci. U.S.A. 109 (36),14681�14686.
Glascher, J., Hampton, A.N., O’Doherty, J.P., 2009. Determining arole for ventromedial prefrontal cortex in encoding action-basedvalue signals during reward-related decision-making. Cereb.Cortex. 19 (2), 483�495.
Glimcher, P.W., 2011. Foundations of Neuroeconomic Analysis.Oxford University Press, Oxford.
Gluth, S., Rieskamp, J., Buchel, C., 2012. Deciding when to decide:time-variant sequential sampling models explain the emergenceof value-based decisions in the human brain. J. Neurosci. 32 (31),10686�10698.
Gold, J.I., Shadlen, M.N., 2007. The neural basis of decision-making.Annu. Rev. Neurosci. 30, 535�574.
Grabenhorst, F., Rolls, E.T., Parris, B.A., d’Souza, A.A., 2010. Howthe brain represents the reward value of fat in the mouth. Cereb.Cortex. 20 (5), 1082�1091.
Hare, T.A., Camerer, C.F., Knoepfle, D.T., Rangel, A., 2010. Valuecomputations in ventral medial prefrontal cortex duringcharitable decision-making incorporate input from regionsinvolved in social cognition. J. Neurosci. 30 (2), 583�590.
Hare, T.A., Camerer, C.F., Rangel, A., 2009. Self-control in decision-making involves modulation of the vmPFC valuation system.Science. 324 (5927), 646�648.
Hare, T.A., Malmaud, J., Rangel, A., 2011a. Focusing attention on thehealth aspects of foods changes value signals in vmPFC andimproves dietary choice. J. Neurosci. 31 (30), 11077�11087.
Hare, T.A., O’Doherty, J., Camerer, C.F., Schultz, W., Rangel, A.,2008. Dissociating the role of the orbitofrontal cortex and the stri-atum in the computation of goal values and prediction errors.J. Neurosci. 28 (22), 5623�5630.
Hare, T.A., Schultz, W., Camerer, C.F., O’Doherty, J.P., Rangel, A.,2011b. Transformation of stimulus value signals into motorcommands during simple choice. Proc. Natl. Acad. Sci. U.S.A. 108(44), 18120�18125.
Harris, A., Adolphs, R., Camerer, C., Rangel, A., 2011. Dynamic con-struction of stimulus values in the ventromedial prefrontal cortex.PLoS One. 6 (6), e21074.
146 8. THE COMPUTATION OF STIMULUS VALUES IN SIMPLE CHOICE
NEUROECONOMICS

Hayden, B.Y., Platt, M.L., 2010. Neurons in anterior cingulate cortexmultiplex information about reward and action. J. Neurosci. 30 (9),3339�3346.
Heekeren, H.R., Marrett, S., Ungerleider, L.G., 2008. The neuralsystems that mediate human perceptual decision-making. Nat.Rev. Neurosci. 9 (6), 467�479.
Hunt, L.T., Kolling, N., Soltani, A., Woolrich, M.W., Rushworth, M.F.,Behrens, T.E., 2012. Mechanisms underlying cortical activity duringvalue-guided choice. Nat. Neurosci. 15 (3), 470�476, S471�473.
Janowski, V., Camerer, C., Rangel, A., 2013. Empathic decision-mak-ing involves vmPFC value signals that are modulated by socialprocessing implemented in the IPL. Soc. Cogn. Affect. Neurosci.8 (2), 201�208.
Jenison, R.L., Rangel, A., Oya, H., Kawasaki, H., Howard, M.A.,2011. Value encoding in single neurons in the human amygdaladuring decision-making. J. Neurosci. 31 (1), 331�338.
Jocham, G., Hunt, L.T., Near, J., Behrens, T.E., 2012. A mechanismfor value-guided choice based on the excitation-inhibition balancein prefrontal cortex. Nat. Neurosci. 15 (7), 960�961.
Kable, J.W., Glimcher, P.W., 2007. The neural correlates of subjectivevalue during intertemporal choice. Nat. Neurosci. 10 (12), 1625�1633.
Kahneman, D., Tversky, A., 1979. Prospect theory - analysis of deci-sion under risk. Econometrica. 47 (2), 263�291.
Kahnt, T., Chang, L.J., Park, S.Q., Heinzle, J., Haynes, J.D., 2012.Connectivity-based parcellation of the human orbitofrontal cortex.J. Neurosci. 32 (18), 6240�6250.
Kahnt, T., Heinzle, J., Park, S.Q., Haynes, J.D., 2011. Decoding differ-ent roles for vmPFC and dlPFC in multi-attribute decision-making.Neuroimage. 56 (2), 709�715.
Kennerley, S.W., Behrens, T.E., Wallis, J.D., 2011. Double dissociationof value computations in orbitofrontal and anterior cingulate neu-rons. Nat. Neurosci. 14 (12), 1581�1589.
Kennerley, S.W., Dahmubed, A.F., Lara, A.H., Wallis, J.D., 2009.Neurons in the frontal lobe encode the value of multiple decisionvariables. J. Cogn. Neurosci. 21 (6), 1162�1178.
Kennerley, S.W., Walton, M.E., Behrens, T.E.J., Buckley, M.J.,Rushworth, M.F.S., 2006. Optimal decision-making and the ante-rior cingulate cortex. Nat. Neurosci. 9 (7), 940�947.
Knutson, B., Rick, S., Wimmer, G.E., Prelec, D., Loewenstein, G.,2007. Neural predictors of purchases. Neuron. 53 (1), 147�156.
Kobayashi, S., Pinto de Carvalho, O., Schultz, W., 2010. Adaptationof reward sensitivity in orbitofrontal neurons. J. Neurosci. 30 (2),534�544.
Krajbich, I., Rangel, A., 2011. Multialternative drift-diffusion model pre-dicts the relationship between visual fixations and choice in value-based decisions. Proc. Natl. Acad. Sci. U.S.A. 108 (33), 13852�13857.
Krajbich, I., Armel, C., Rangel, A., 2010. Visual fixations and thecomputation and comparison of value in simple choice. Nat.Neurosci. 13 (10), 1292�1298.
Krajbich, I., Lu, D., Camerer, C., Rangel, A., 2012. The attentionaldrift-diffusion model extends to simple purchasing decisions.Front. Psychol. 3, 193.
Larsen, J.T., McGraw, A.P., Mellers, B.A., Cacioppo, J.T., 2004. Theagony of victory and thrill of defeat: mixed emotional reactions todisappointing wins and relieving losses. Psychol. Sci. 15 (5), 325�330.
Lebreton, M., Jorge, S., Michel, V., Thirion, B., Pessiglione, M., 2009.An automatic valuation system in the human brain: evidencefrom functional neuroimaging. Neuron. 64 (3), 431�439.
Levy, D.J., Glimcher, P.W., 2011. Comparing apples and oranges:using reward-specific and reward-general subjective value repre-sentation in the brain. J. Neurosci. 31 (41), 14693�14707.
Levy, D.J., Glimcher, P.W., 2012. The root of all value: a neural com-mon currency for choice. Curr. Opin. Neurobiol. 22 (6), 1027�1038.
Levy, I., Lazzaro, S.C., Rutledge, R.B., Glimcher, P.W., 2011. Choicefrom non-choice: predicting consumer preferences from blood
oxygenation level-dependent signals obtained during passiveviewing. J. Neurosci. 31 (1), 118�125.
Lim, S.L., O’Doherty, J.P., Rangel, A., 2011. The decision valuecomputations in the vmPFC and striatum use a relative valuecode that is guided by visual attention. J. Neurosci. 31 (37),13214�13223.
Lin, A., Adolphs, R., Rangel, A., 2012. Social and monetary rewardlearning engage overlapping neural substrates. Soc. Cogn. Affect.Neurosci. 7 (3), 274�281.
Litt, A., Plassmann, H., Shiv, B., Rangel, A., 2011. Dissociating valua-tion and saliency signals during decision-making. Cereb. Cortex.21 (1), 95�102.
Luce, R.D., 1959. Individual Choice Behavior; A Theoretical Analysis.Wiley, New York.
Maunsell, J.H., 2004. Neuronal representations of cognitive state:reward or attention? Trends Cogn. Sci. 8 (6), 261�265.
McClure, S.M., Berns, G.S., Montague, P.R., 2003. Temporal predic-tion errors in a passive learning task activate human striatum.Neuron. 38 (2), 339�346.
McDannald, M.A., Takahashi, Y.K., Lopatina, N., Pietras, B.W.,Jones, J.L., Schoenbaum, G., 2012. Model-based learning and thecontribution of the orbitofrontal cortex to the model-free world.Eur. J. Neurosci. 35 (7), 991�996.
McFadden, D., 2001. Economic choices. Am. Econ. Rev. 91 (3),351�378.
McFadden, D.L., 2005. Revealed stochastic preference: a synthesis.Econ. Theor. 26 (2), 245�264.
Milosavljevic, M., Koch, C., Rangel, A., 2011. Consumers can makedecisions in as little as a third of a second. Judgment Decis.Making. 6 (6), 520�530.
Milosavljevic, M., Malmaud, J., Huth, A., Koch, C., Rangel, A., 2010.The drift diffusion model can account for the accuracy andreaction time of value-based choices under high and low timepressure. Judgment Decis. Making. 5 (6), 437�449.
Noonan, M.P., Walton, M.E., Behrens, T.E., Sallet, J., Buckley, M.J.,Rushworth, M.F., 2010. Separate value comparison and learningmechanisms in macaque medial and lateral orbitofrontal cortex.Proc. Natl. Acad. Sci. U.S.A. 107 (47), 20547�20552.
O’Doherty, J., Winston, J., Critchley, H., Perrett, D., Burt, D.M.,Dolan, R.J., 2003. Beauty in a smile: the role of medial orbitofron-tal cortex in facial attractiveness. Neuropsychologia. 41 (2),147�155.
O’Doherty, J.P., 2011. Contributions of the ventromedial prefrontalcortex to goal-directed action selection. Ann. N.Y. Acad. Sci. 1239,118�129.
O’Doherty, J.P., Dayan, P., Friston, K., Critchley, H., Dolan, R.J.,2003. Temporal difference models and reward-related learning inthe human brain. Neuron. 38 (2), 329�337.
Ongur, D., Price, J.L., 2000. The organization of networks within theorbital and medial prefrontal cortex of rats, monkeys andhumans. Cereb. Cortex. 10 (3), 206�219.
Padoa-Schioppa, C., Assad, J.A., 2006. Neurons in the orbitofrontalcortex encode economic value. Nature. 441 (7090), 223�226.
Park, S.Q., Kahnt, T., Rieskamp, J., Heekeren, H.R., 2011.Neurobiology of value integration: when value impacts valuation.J. Neurosci. 31 (25), 9307�9314.
Pearson, J.M., Heilbronner, S.R., Barack, D.L., Hayden, B.Y., Platt, M.L.,2011. Posterior cingulate cortex: adapting behavior to a changingworld. Trends Cogn. Sci. 15 (4), 143�151.
Peters, J., Buchel, C., 2009. Overlapping and distinct neural systemscode for subjective value during intertemporal and riskydecision-making. J. Neurosci. 29 (50), 15727�15734.
Philiastides, M.G., Biele, G., Heekeren, H.R., 2010. A mechanisticaccount of value computation in the human brain. Proc. Natl.Acad. Sci. U.S.A. 107 (20), 9430�9435.
147REFERENCES
NEUROECONOMICS