Embed Size (px)
Citation preview
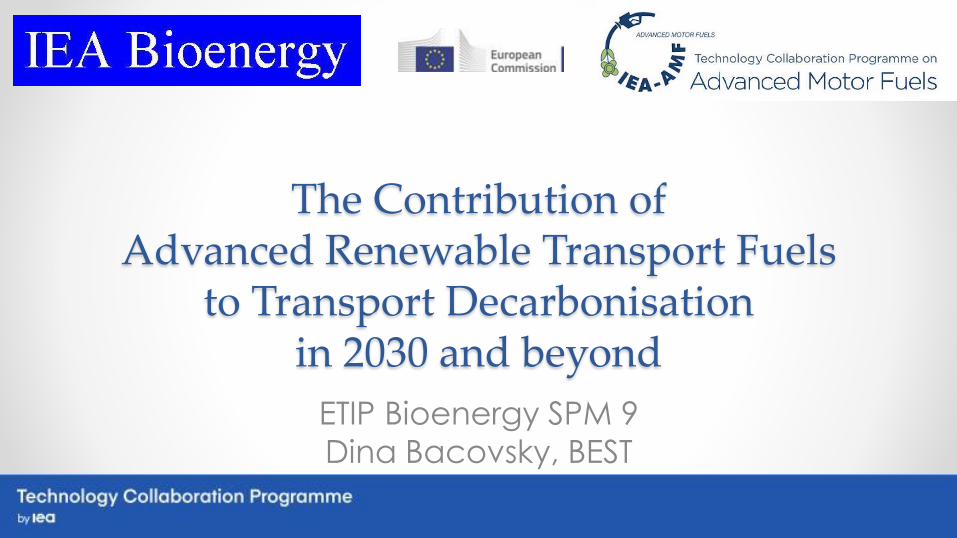
The Contribution of Advanced Renewable Transport Fuels
to Transport Decarbonisationin 2030 and beyond
ETIP Bioenergy SPM 9
Dina Bacovsky, BEST
21.11.2019ETIP Bioenergy SPM 9 2
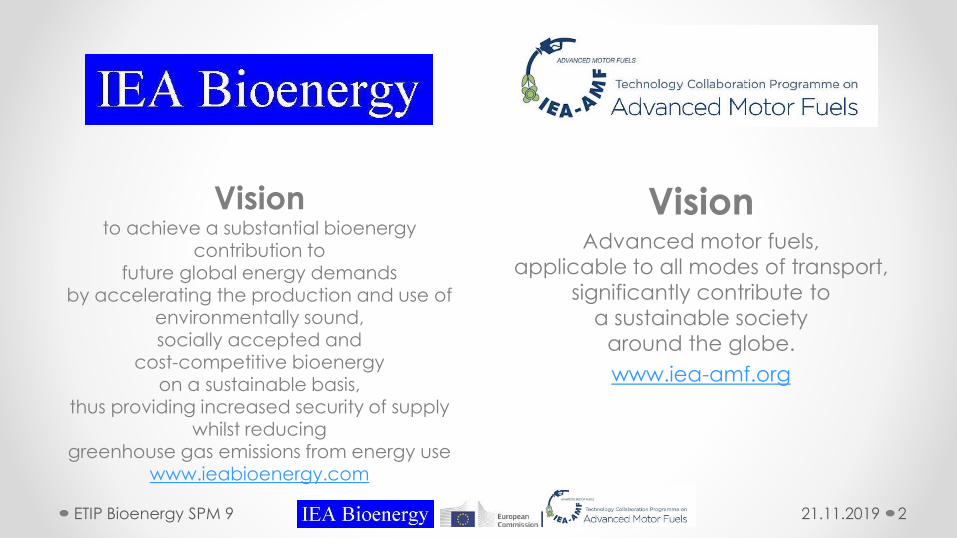
Visionto achieve a substantial bioenergy
contribution to
future global energy demands by accelerating the production and use of
environmentally sound, socially accepted and
cost-competitive bioenergy on a sustainable basis,
thus providing increased security of supply whilst reducing
greenhouse gas emissions from energy usewww.ieabioenergy.com
VisionAdvanced motor fuels,
applicable to all modes of transport,
significantly contribute to
a sustainable society
around the globe.
www.iea-amf.org
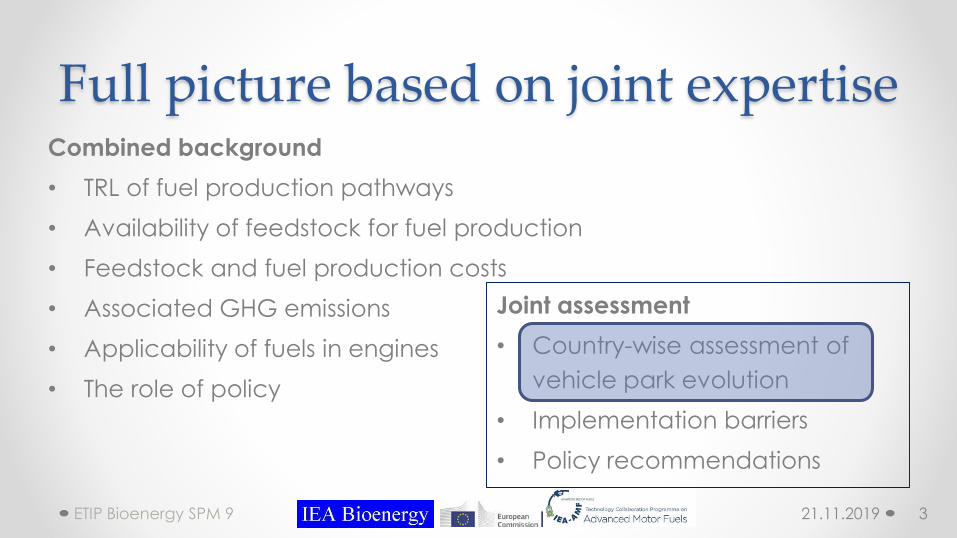
Full picture based on joint expertise
Joint assessment
• Country-wise assessment of
vehicle park evolution
• Implementation barriers
• Policy recommendations
21.11.2019ETIP Bioenergy SPM 9 3
Combined background
• TRL of fuel production pathways
• Availability of feedstock for fuel production
• Feedstock and fuel production costs
• Associated GHG emissions
• Applicability of fuels in engines
• The role of policy
Country-wise assessments
Methodology
21.11.2019ETIP Bioenergy SPM 9 6
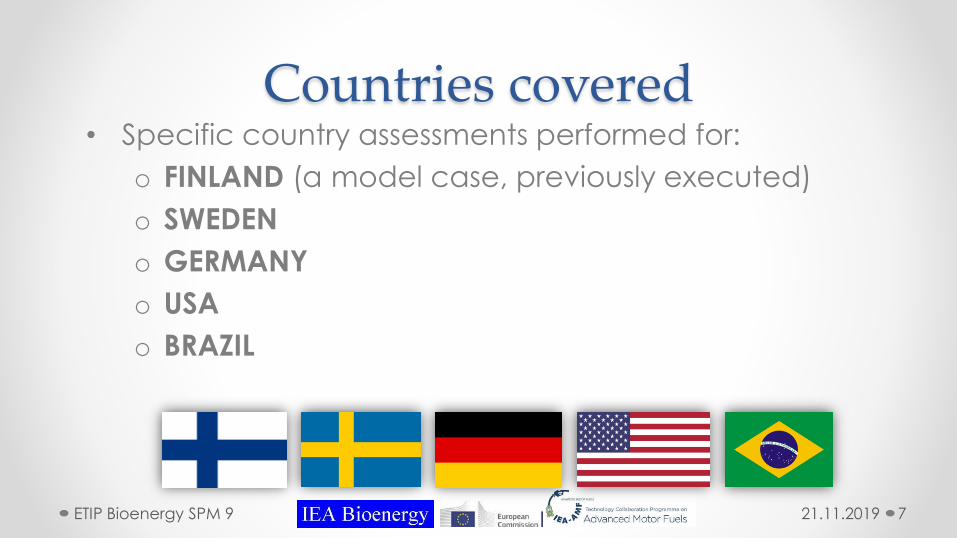
Countries covered• Specific country assessments performed for:
o FINLAND (a model case, previously executed)
o SWEDEN
o GERMANY
o USA
o BRAZIL
21.11.2019ETIP Bioenergy SPM 9 7
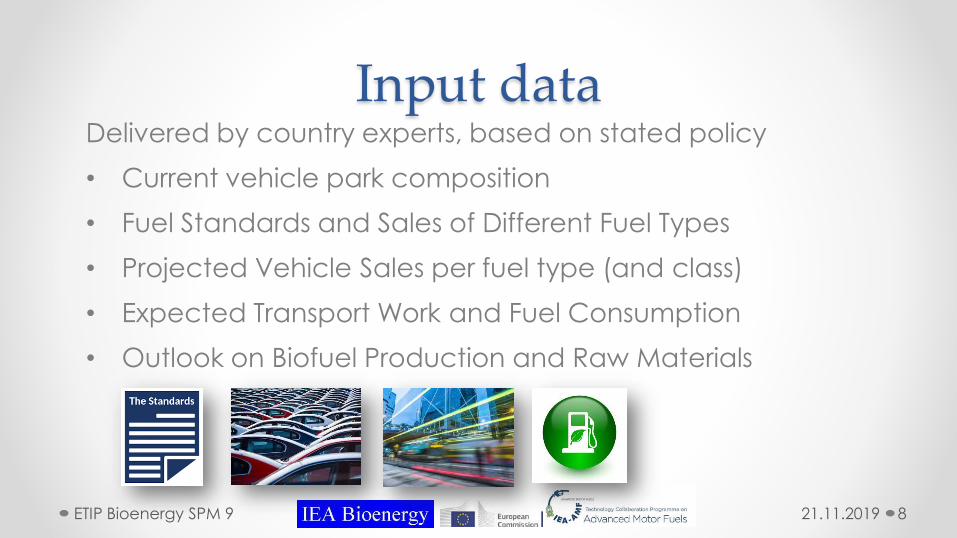
Input dataDelivered by country experts, based on stated policy
• Current vehicle park composition
• Fuel Standards and Sales of Different Fuel Types
• Projected Vehicle Sales per fuel type (and class)
• Expected Transport Work and Fuel Consumption
• Outlook on Biofuel Production and Raw Materials
21.11.2019ETIP Bioenergy SPM 9 8
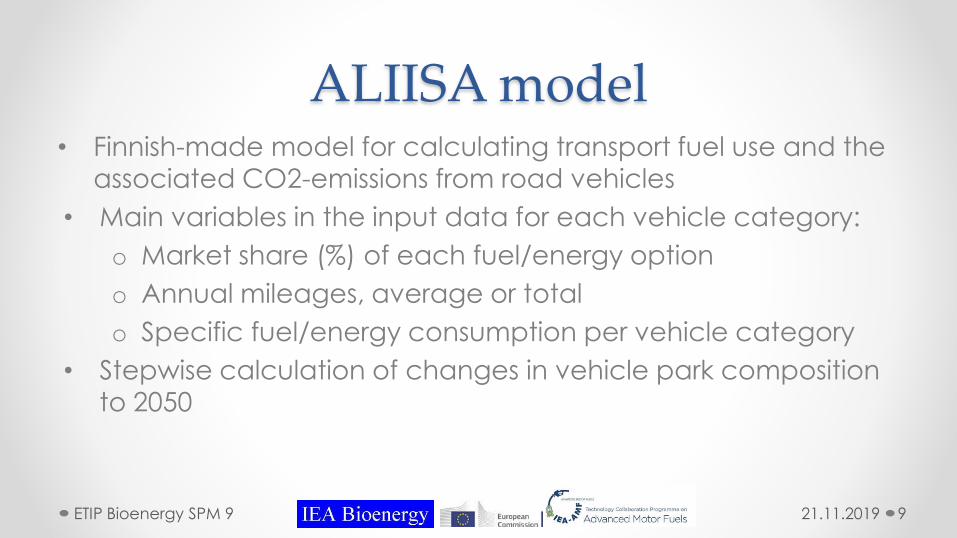
ALIISA model• Finnish-made model for calculating transport fuel use and the
associated CO2-emissions from road vehicles
• Main variables in the input data for each vehicle category:
o Market share (%) of each fuel/energy option
o Annual mileages, average or total
o Specific fuel/energy consumption per vehicle category
• Stepwise calculation of changes in vehicle park composition
to 2050
21.11.2019ETIP Bioenergy SPM 9 9
Options covered
21.11.2019ETIP Bioenergy SPM 9 10
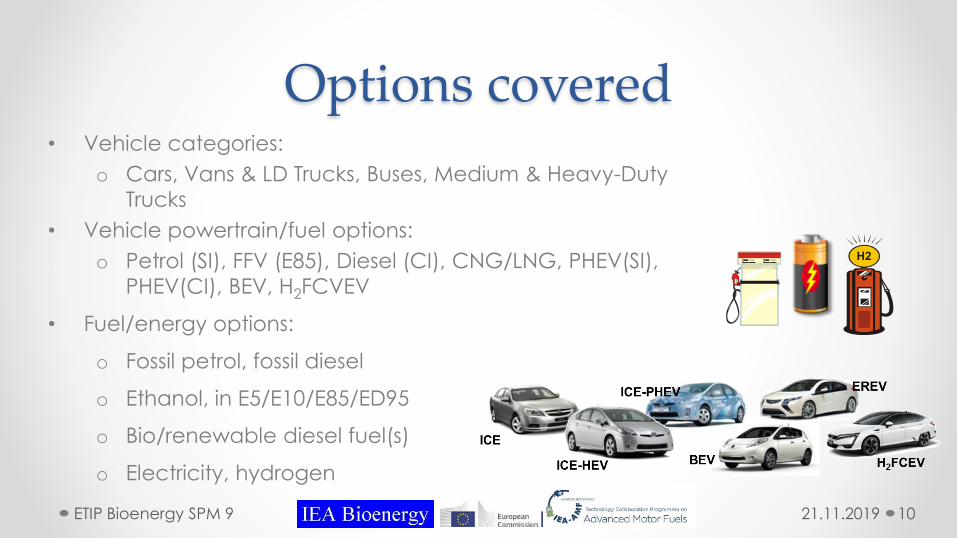
• Vehicle categories:
o Cars, Vans & LD Trucks, Buses, Medium & Heavy-Duty
Trucks
• Vehicle powertrain/fuel options:
o Petrol (SI), FFV (E85), Diesel (CI), CNG/LNG, PHEV(SI),
PHEV(CI), BEV, H2FCVEV
• Fuel/energy options:
o Fossil petrol, fossil diesel
o Ethanol, in E5/E10/E85/ED95
o Bio/renewable diesel fuel(s)
o Electricity, hydrogen
H2

Country-wise assessments
Model case Finland
21.11.2019ETIP Bioenergy SPM 9 11
Finland in a nutshell
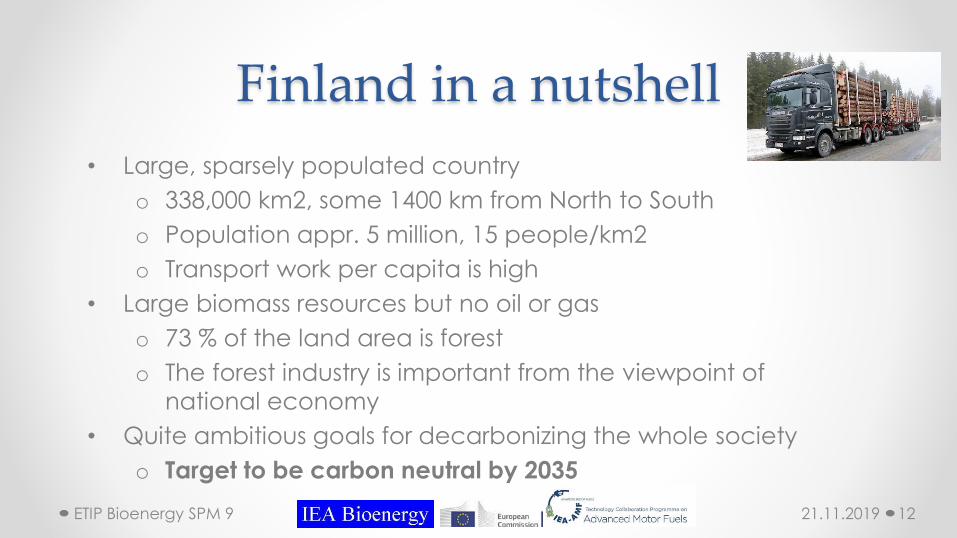
• Large, sparsely populated country
o 338,000 km2, some 1400 km from North to South
o Population appr. 5 million, 15 people/km2
o Transport work per capita is high
• Large biomass resources but no oil or gas
o 73 % of the land area is forest
o The forest industry is important from the viewpoint of
national economy
• Quite ambitious goals for decarbonizing the whole society
o Target to be carbon neutral by 2035
21.11.2019ETIP Bioenergy SPM 9 12
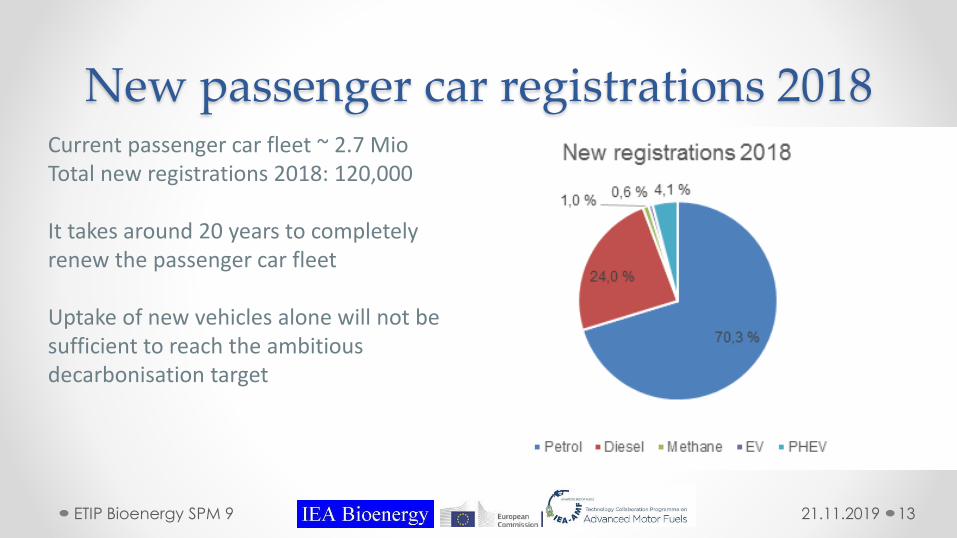
New passenger car registrations 2018
21.11.2019ETIP Bioenergy SPM 9 13
Current passenger car fleet ~ 2.7 MioTotal new registrations 2018: 120,000
It takes around 20 years to completely renew the passenger car fleet
Uptake of new vehicles alone will not be sufficient to reach the ambitious decarbonisation target
2016 national energy and climate strategyThe strategy for 2030 calls for a 50 % reduction of CO2 emissions from transport by 2030, the reference year being 2005.
• Improving the energy efficiency of the transport system
• Improving the energy-efficiency of vehicles
• Replacing oil-based fossil fuels with renewable and/or low emission alternatives
o Increasing the physical share of biofuels (energy content) to 30 %
o Expanding the refuelling infrastructure
o Encouraging the uptake of alternative vehicles:
• 250,000 electric vehicles
• 50,000 gas fuelled vehicles
21.11.2019ETIP Bioenergy SPM 9 14
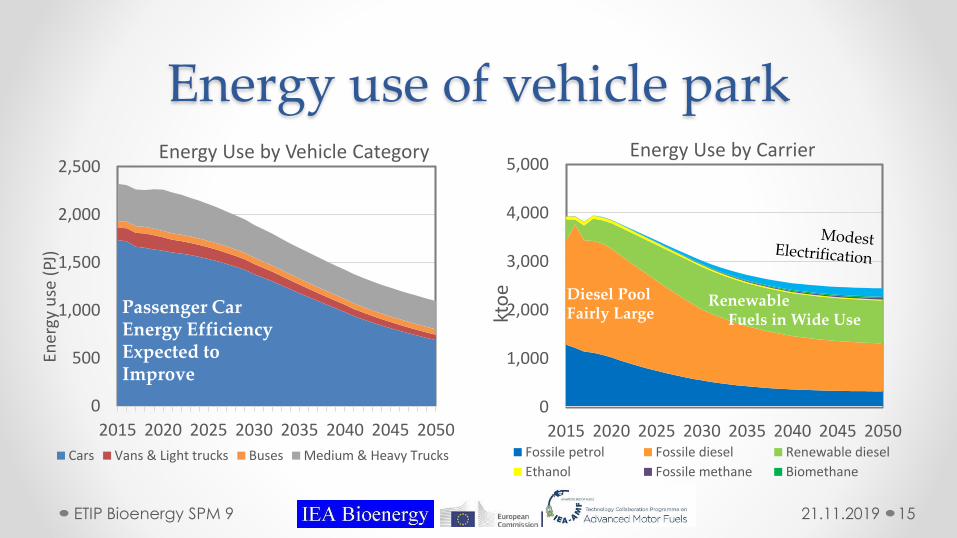
Energy use of vehicle park
21.11.2019ETIP Bioenergy SPM 9 15
0
500
1,000
1,500
2,000
2,500
2015 2020 2025 2030 2035 2040 2045 2050
Ener
gy u
se (
PJ)
Energy Use by Vehicle Category
Cars Vans & Light trucks Buses Medium & Heavy Trucks
0
1,000
2,000
3,000
4,000
5,000
2015 2020 2025 2030 2035 2040 2045 2050
kto
e
Energy Use by Carrier
Fossile petrol Fossile diesel Renewable diesel
Ethanol Fossile methane Biomethane
Passenger CarEnergy EfficiencyExpected to Improve
Diesel PoolFairly Large
RenewableFuels in Wide Use
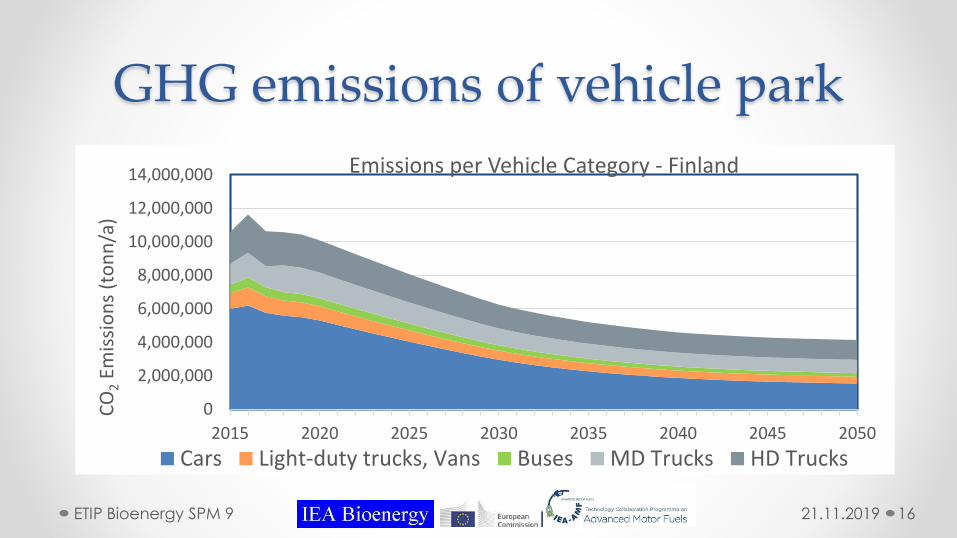
GHG emissions of vehicle park
21.11.2019ETIP Bioenergy SPM 9 16
0
2,000,000
4,000,000
6,000,000
8,000,000
10,000,000
12,000,000
14,000,000
2015 2020 2025 2030 2035 2040 2045 2050
CO
2Em
issi
on
s (t
on
n/a
)
Emissions per Vehicle Category - Finland
Cars Light-duty trucks, Vans Buses MD Trucks HD Trucks
Country-wise assessments
Country comparisons
21.11.2019ETIP Bioenergy SPM 9 17
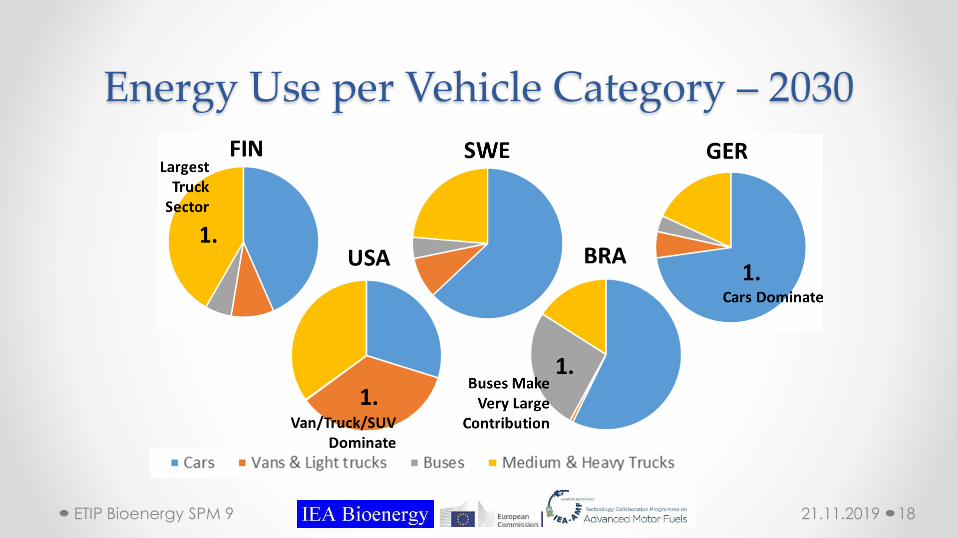
Energy Use per Vehicle Category – 2030
21.11.2019ETIP Bioenergy SPM 9 18
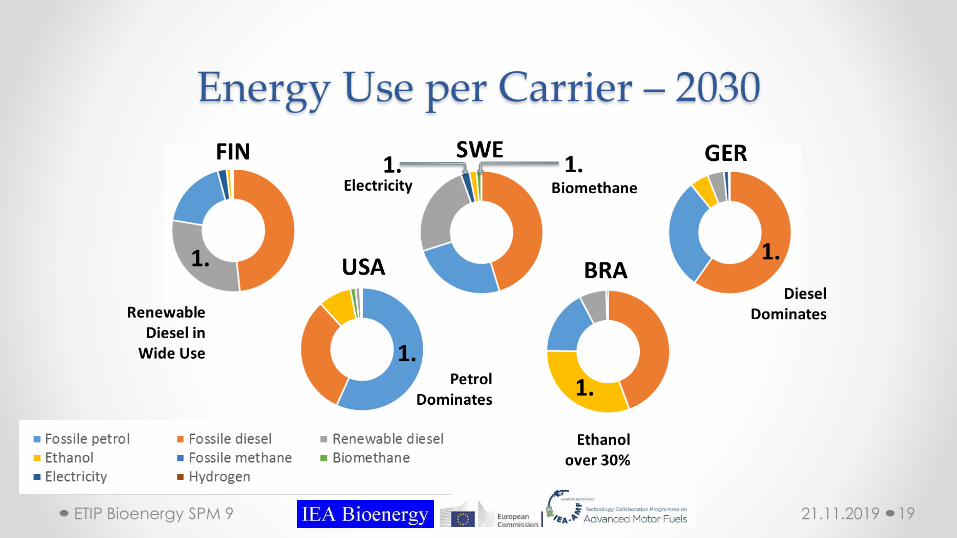
Energy Use per Carrier – 2030
21.11.2019ETIP Bioenergy SPM 9 19
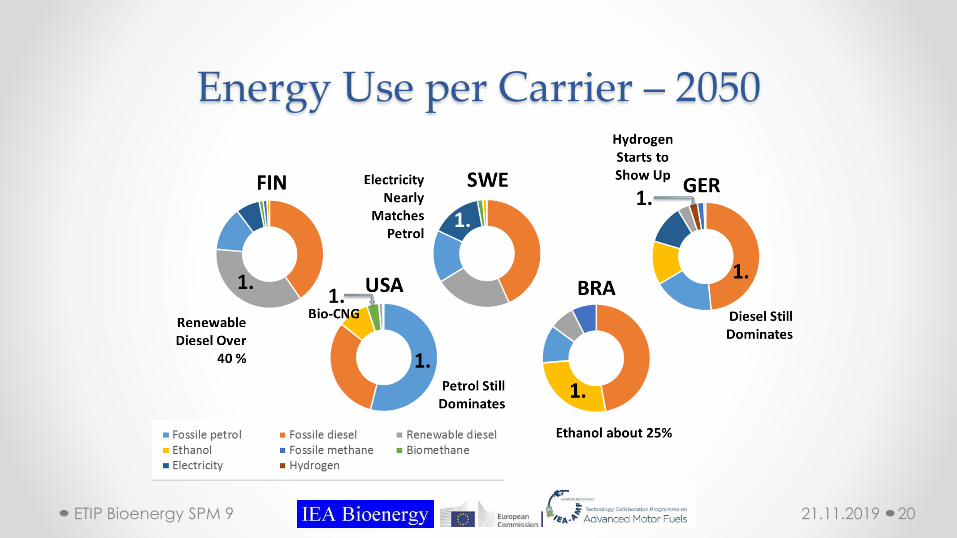
Energy Use per Carrier – 2050
21.11.2019ETIP Bioenergy SPM 9 20
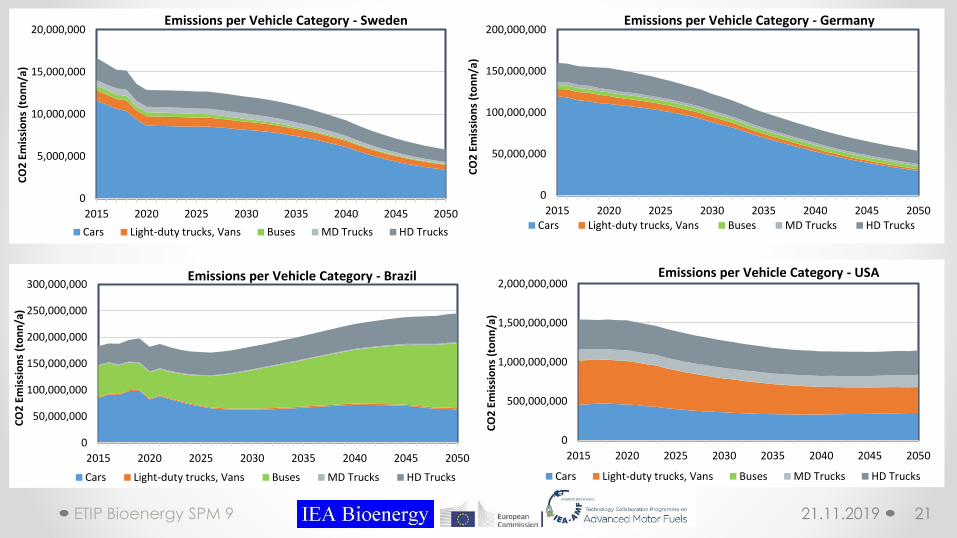
21.11.2019ETIP Bioenergy SPM 9 21
0
5,000,000
10,000,000
15,000,000
20,000,000
2015 2020 2025 2030 2035 2040 2045 2050
CO
2 E
mis
sio
ns
(to
nn
/a)
Emissions per Vehicle Category - Sweden
Cars Light-duty trucks, Vans Buses MD Trucks HD Trucks
0
50,000,000
100,000,000
150,000,000
200,000,000
2015 2020 2025 2030 2035 2040 2045 2050
CO
2 E
mis
sio
ns
(to
nn
/a)
Emissions per Vehicle Category - Germany
Cars Light-duty trucks, Vans Buses MD Trucks HD Trucks
0
500,000,000
1,000,000,000
1,500,000,000
2,000,000,000
2015 2020 2025 2030 2035 2040 2045 2050
CO
2 E
mis
sio
ns
(to
nn
/a)
Emissions per Vehicle Category - USA
Cars Light-duty trucks, Vans Buses MD Trucks HD Trucks
0
50,000,000
100,000,000
150,000,000
200,000,000
250,000,000
300,000,000
2015 2020 2025 2030 2035 2040 2045 2050
CO
2 E
mis
sio
ns
(to
nn
/a)
Emissions per Vehicle Category - Brazil
Cars Light-duty trucks, Vans Buses MD Trucks HD Trucks
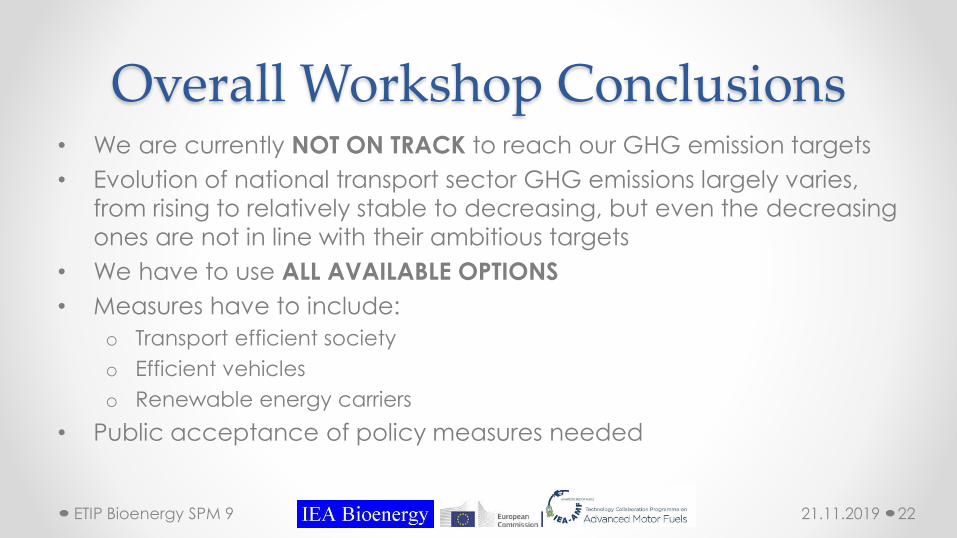
Overall Workshop Conclusions• We are currently NOT ON TRACK to reach our GHG emission targets
• Evolution of national transport sector GHG emissions largely varies,
from rising to relatively stable to decreasing, but even the decreasing
ones are not in line with their ambitious targets
• We have to use ALL AVAILABLE OPTIONS
• Measures have to include:
o Transport efficient society
o Efficient vehicles
o Renewable energy carriers
• Public acceptance of policy measures needed
21.11.2019ETIP Bioenergy SPM 9 22
The Contribution of Advanced Renewable Transport
Fuels to Transport Decarbonisation
in 2030 and beyondMore information: https://iea-amf.org/content/news/TD-WS
Contact: [email protected]