Embed Size (px)
Citation preview
The Contribution of Magazines in Mixed TV-Print Schedules1
by Roland Soong and Michelle de Montigny The paper describes the analysis and interpretation of the results from about 500,000 mixed television-print schedules. The data were obtained by a fusion between the people meter panel and a consumer multi-media/product usage survey in Brazil. With this large body of data, we characterized the unique, exclusive contribution of magazines to the reach/coverage of mixed television/print schedules. 1. Introduction In Brazil, as in many other countries, television accounts for the majority of advertising spending. Yet there is also a healthy and robust magazine industry in Brazil. The largest Brazilian newsweekly, Veja, has a weekly circulation of over 1 million. Given these market conditions, mixed television-print campaigns are common in Brazil, especially for the two largest markets, São Paulo and Rio de Janeiro, so that there is the need to address how to evaluate these schedules in terms of impressions, reach, exposure frequency and so forth. In this paper, we will concentrate on the estimation and study of the net reach ( or coverage) of mixed television-print schedules. 2. Background A mixed television-print schedule consists of insertions in a number of television vehicles plus insertions in a number of print vehicles. If the usage of these media vehicles are independent (loosely speaking, the knowledge that someone uses one media vehicle imparts no information about her usage of other media vehicles), then the net reach of the schedule is easily calculated by the Sainsbury formula (see Rust (1986), p.11): If p1, p2, …, pm are the ratings for the m media vehicles, the net reach is given by (1- (1-p1)(1-p2)…(1-pm)). The independence assumption is also referred to as the assumption of ‘random duplication’. But if the usage of these media vehicles are not interdependent (loosely speaking, the fact that someone uses one media vehicle makes him/her more (or less) likely to use another media vehicle), then the net reach is more difficult to estimate. An accurate reach estimate would require knowledge of the interrelationship among these media vehicles. A minimum requirement seems to be that we should have reasonable estimates of the pairwise duplication between media vehicles (Rust (1986)). At this point, we will review the existing knowledge about the duplication between media vehicles, because it will help us to position our findings. We will also be able to offer our Brazilian results as a contribution to this knowledge base. In the context of a mixed television-print schedule, the between-media vehicle duplications can be classified into three categories: Category 1: Between-television pairs The pioneering approach to the study of duplication between television programs is due to Goodhardt (1966) and Goodhardt and Ehrenberg (1969). The duplicated audience is estimated as the product of the two program ratings multiplied by a constant. The product of the two program ratings is the estimate under the random duplication assumption, and the constant multiplier is an empirically derived adjustment factor.
1 Note: This is a slightly different format of a paper delivered at the ESOMAR/ARF Week of Audience Measurement (WAM) 2002, Cannes, France, June 9-14, 2002.
- 1 -
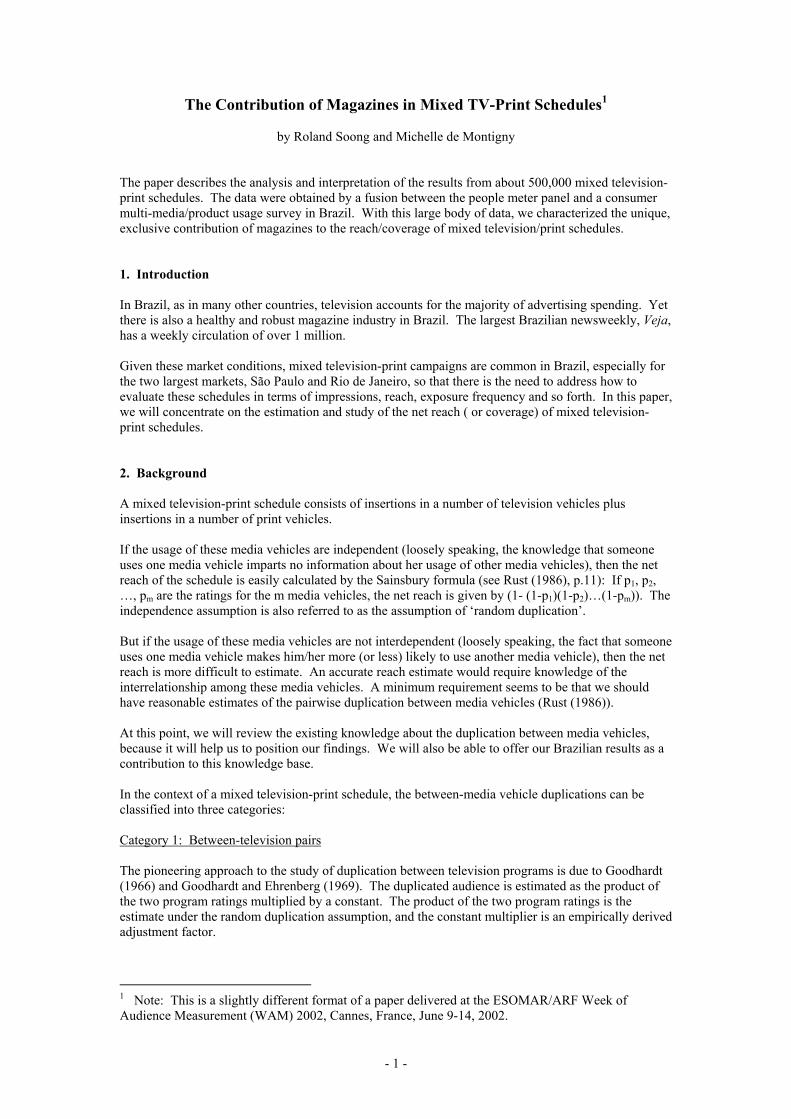
This formulation was accorded the status of a law of nature known as the Duplication of Viewing Law. In latter studies, this constant was not so constant after all, and may differ by time (e.g. time-of-day, day-to-day, week-to-next-week, etc), station (same vs. other), program types (e.g. sports or soap opera), and so on (see Table 6.1 in Rossiter and Danaher (1998)). In Brazil, television is measured by IBOPE using people meter television audience measurement. This system has the capability to deliver ratings on a true real-time basis over the internet. There is no need to use approximate statistical models to estimate the duplication between television programs, since the actual data are available. In this paper, we will use the IBOPE data to calculate those duplications. Brazilian television advertising is dominated by the five broadcast networks. Typically, planning occurs by dayparts (Monday-Saturday 6am-12 noon, 12 noon-6pm, 6pm-10pm, 10pm-2am; Sunday 6am-12 noon, 12 noon-6pm, 6pm-10pm, 10pm-2am) within network. From the Brazil people meter panel for January-September 2001 of 4,182 persons 12 to 64 years old in the cities of Rio de Janeiro and São Paulo, we calculated the audience ratings within and between these network/daypart pairs. Since there are (5 networks) x (8 dayparts) = 40 network/dayparts, we have 40 x 39 / 2 = 780 different network/daypart pairs. Across these network/daypart pairs, the average correlation coefficient between the ratings was 0.199, with a maximum of 0.844 and a minimum of –0.077. Figure 1 below shows the histogram of the correlation coefficients.
Figure 1. Histogram of Correlation Coefficients between Television Network/Dayparts (source: IBOPE Television Audience Measurement)
B etw een-TV netw ork/daypart C orrelation C oefficients
.85
.80
.75
.70
.65
.60
.55
.50
.45
.40
.35
.30
.25
.20
.15
.10
.05
.00
-.05
-.10
200
100
0
For these network/daypart pairs, we calculate our ‘constant’ under the Duplication of Viewing Law as the ratio of the average observed duplication divided by the average ‘duplication’ under the random duplication assumption to be 1.45. As the figure suggests, there is considerable variation within this dataset. If we look at the same network across dayparts, the ‘constant’ is 1.74; for the same network and consecutive dayparts, the ‘constant’ goes up even higher to 1.84. This reflects the ‘inheritance effect’ of television audience flow within the same network (Webster (1985)). For comparison, we note that the original Duplication of Viewing Law provides a constant of 1.0 for programs across different stations and a constant of 1.4 for programs on the same station across days.
- 2 -
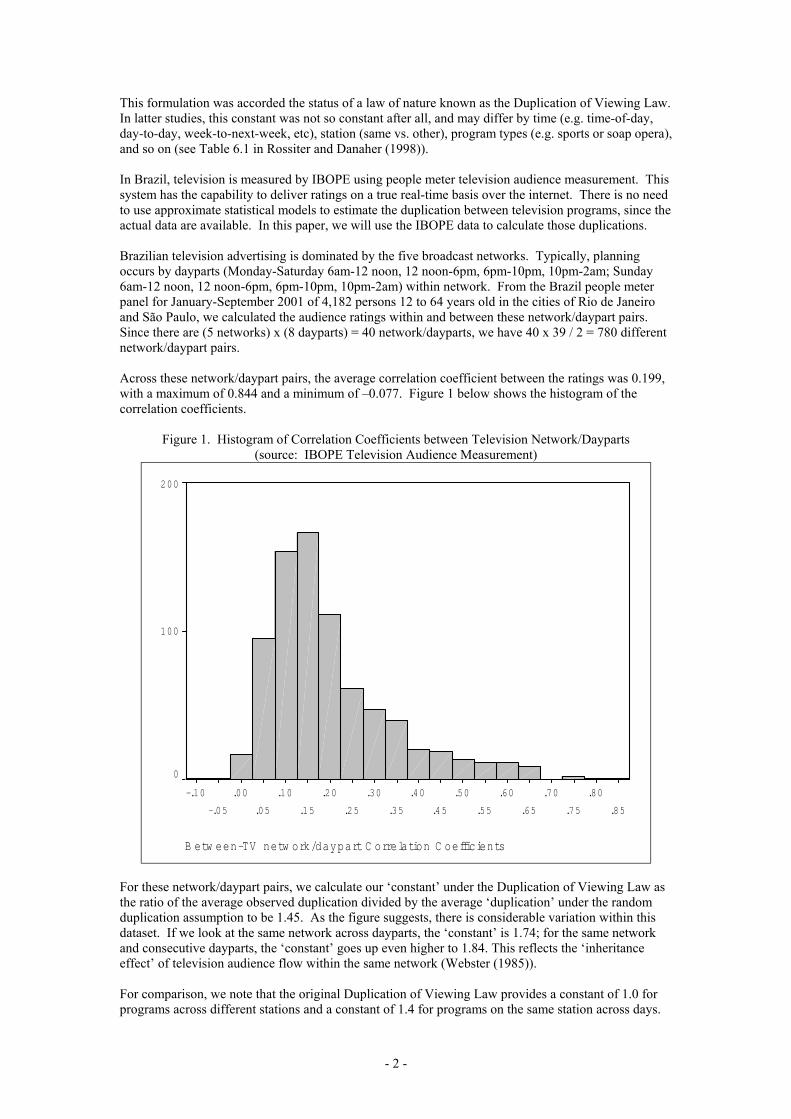
Category 2: Between-magazine pairs In the literature, the statistical modeling of the relationships between magazine pairs has not been studied intensively because the actual information exists in various consumer surveys. For Brazil, we examined the TGI Brasil study titles for 3,072 persons 12 to 64 years old in Rio de Janeiro and São Paulo. We calculated the ratings and duplications among 107 magazines. This means that we have 107 x 106 / 2 = 5,671 pairs of magazines. We found the average correlation coefficient to be 0.039, with a maximum of 0.549 and a minimum of –0.088. Figure 2 below shows the histogram of the correlation coefficients.
Figure 2. Histogram of Correlation Coefficients between Magazines (source: TGI Brasil)
B etw een-m agazine C orrelation C oefficients
.800
.700
.600
.500
.400
.300
.200
.100
.000
-.100
4000
3000
2000
1000
0
The highest positive correlations occurred between pairs such as the two astrology titles Guia Astra and Horoscopo, the teenage titles Capricho and Caricia, the computing titles PC Magazine and PC World, the surfing sport titles Fluir and Hardcore and the Rio de Janeiro-based titles Domingo and Veja Rio. The largest negative correlations occurred between magazines that are targeted to different cities: Canal Extra and Veja Rio from Rio de Janeiro were negatively correlated with Revista da Folha and Veja SP from São Paulo. For all the pairs of magazines, we calculated our ‘constant’ under the Duplication of Viewing Law as the ratio of the average observed duplication divided by the average ‘duplication’ under the random duplication assumption to be 2.56. As the histogram suggests, the duplication is generally random but there are instances when there are significant audience overlaps between similar titles. Category 3: Between television-magazine pairs Rust and Leone (1984) took the Goodhardt-Ehrenberg framework and estimated the duplication as the product of the television program rating and the magazine average audience multiplied by a constant which is the historical overlap between the magazine and the program type of the television program. Even one of the authors himself warned that while it “seems sound conceptually, adequate empirical testing has not been done.” (Rust (1986), p. 20)
- 3 -
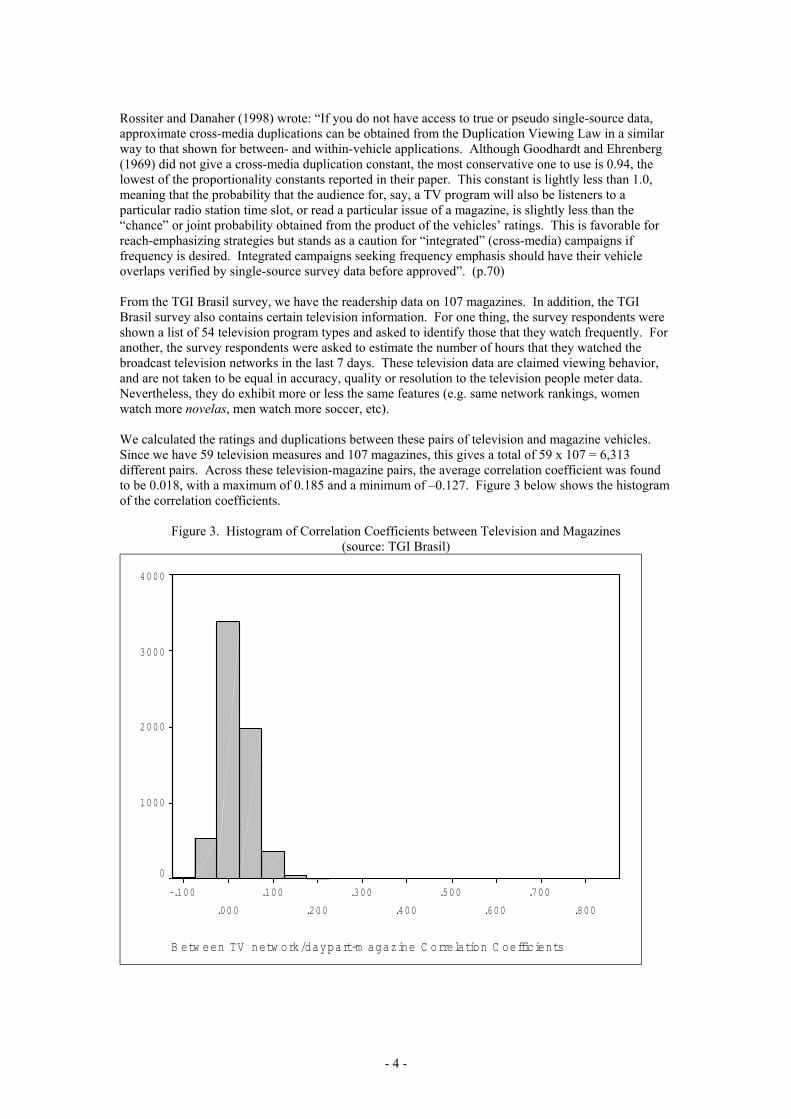
Rossiter and Danaher (1998) wrote: “If you do not have access to true or pseudo single-source data, approximate cross-media duplications can be obtained from the Duplication Viewing Law in a similar way to that shown for between- and within-vehicle applications. Although Goodhardt and Ehrenberg (1969) did not give a cross-media duplication constant, the most conservative one to use is 0.94, the lowest of the proportionality constants reported in their paper. This constant is lightly less than 1.0, meaning that the probability that the audience for, say, a TV program will also be listeners to a particular radio station time slot, or read a particular issue of a magazine, is slightly less than the “chance” or joint probability obtained from the product of the vehicles’ ratings. This is favorable for reach-emphasizing strategies but stands as a caution for “integrated” (cross-media) campaigns if frequency is desired. Integrated campaigns seeking frequency emphasis should have their vehicle overlaps verified by single-source survey data before approved”. (p.70) From the TGI Brasil survey, we have the readership data on 107 magazines. In addition, the TGI Brasil survey also contains certain television information. For one thing, the survey respondents were shown a list of 54 television program types and asked to identify those that they watch frequently. For another, the survey respondents were asked to estimate the number of hours that they watched the broadcast television networks in the last 7 days. These television data are claimed viewing behavior, and are not taken to be equal in accuracy, quality or resolution to the television people meter data. Nevertheless, they do exhibit more or less the same features (e.g. same network rankings, women watch more novelas, men watch more soccer, etc). We calculated the ratings and duplications between these pairs of television and magazine vehicles. Since we have 59 television measures and 107 magazines, this gives a total of 59 x 107 = 6,313 different pairs. Across these television-magazine pairs, the average correlation coefficient was found to be 0.018, with a maximum of 0.185 and a minimum of –0.127. Figure 3 below shows the histogram of the correlation coefficients.
Figure 3. Histogram of Correlation Coefficients between Television and Magazines (source: TGI Brasil)
B etw een TV netw ork/daypart-m agazine C orrelation C oefficients
.800
.700
.600
.500
.400
.300
.200
.100
.000
-.100
4000
3000
2000
1000
0
- 4 -
The largest positive correlations occurred between these pairs: the travel magazine Viagem & Turismo with travel programs; the women’s title Ana Maria with cooking programs; the young female title Tititi with fashion programs; the newsweekly title Epoca with political programs; the teenage title Capricho with music videos. The largest negative correlations occurred between these pairs: the newsweekly Veja with game shows, imported novelas and religious programs, and the women’s title Claudia with sports news and live sport broadcasts. We calculated the ‘constant’ in the Duplication of Viewing Law to be 1.11. We note that the margin of error around this estimate is quite large since this is the result of dividing 0.0668 (which is the average observed duplication) by 0.0600 (which is the average ‘duplication’ under the random duplication assumption). 3. Approaches to evaluating mixed media schedules In the preceding section, we reviewed the existing knowledge about audience duplication, which is augmented by data from our own Brazilian databases. The implication that we draw is that statistical modeling may be subject to large, unknown errors in model specification. Obviously, we would have preferred to have a true single-source database that contains both television viewing and magazine readership information. In that case, mixed media schedules can be evaluated by direct tabulation without any unwarranted or unverifiable assumptions. Unfortunately, such a true single-source database is not easily obtainable. The HomeScan service was an attempt to collect such data (Joyce and Coffey (1993)), but its utility was handicapped by the fact that neither the magazine nor television rating levels matched what were accepted as industry currencies. Nor is the prospect of obtaining a currency-level system likely at all. Contemporary people meter methodology is considered burdensome enough as it is, requiring active compliance by panel members over an extended period of time. It is difficult to imagine an interviewer appearing every three months to administer a readership survey in person to each household member separately before getting product booklets filled out. 4. Data fusion To obtain an approximation to single-source data, without incurring high costs and respondent burden, databases can be merged together by data fusion. To be precise, we define data fusion as the process whereby two or more respondent-level databases are statistically matched so as to produce a ‘single-source’ respondent-level database with data elements from the original databases. Data fusion products appeared first in the United Kingdom and Australia/New Zealand (see, for example, Baker, Harris and O’Brien (1989), Carpenter and Wilcox (1995)). In 2001, we completed the fusion of the Brazilian people meter panel with the TGI Brasil study, and the results that we present today are based upon that fusion. For one database, we have the IBOPE people meter panel, for which there were 4,182 between the ages of 12 to 64 years old persons in the cities of Rio de Janeiro and São Paulo who were intab for one or more days during January-September 2001. For the other database, we have the TGI Brasil study, for which there were 3,072 persons between the ages of 12 to 64 years old persons in the cities of Rio de Janeiro and São Paulo who were interviewed during 2001. There are in fact different strands of data fusion methodology across the world. Our particular method is framed as the transportation problem in operations research, using the well-known stepping-stone algorithm (Hillier and Lieberman (2000)). The key features in this methodology are that the respondents from both databases are retained with their original weights and the original audience ratings are also preserved.
- 5 -
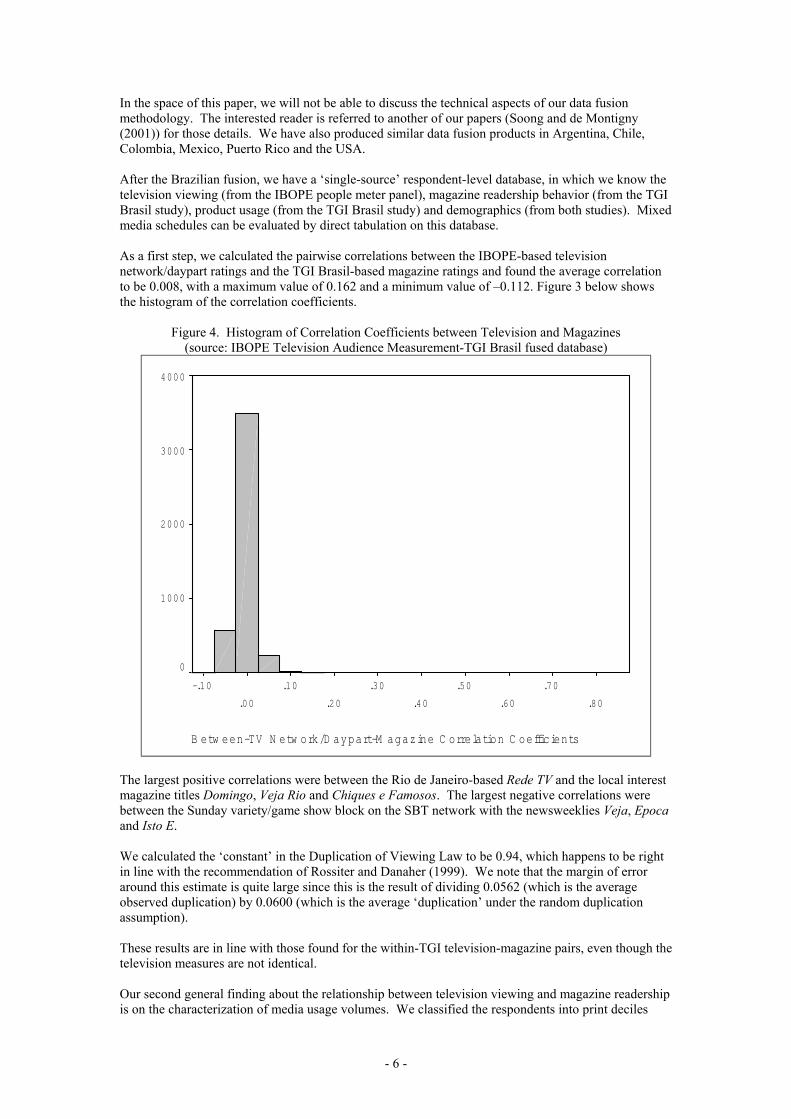
In the space of this paper, we will not be able to discuss the technical aspects of our data fusion methodology. The interested reader is referred to another of our papers (Soong and de Montigny (2001)) for those details. We have also produced similar data fusion products in Argentina, Chile, Colombia, Mexico, Puerto Rico and the USA. After the Brazilian fusion, we have a ‘single-source’ respondent-level database, in which we know the television viewing (from the IBOPE people meter panel), magazine readership behavior (from the TGI Brasil study), product usage (from the TGI Brasil study) and demographics (from both studies). Mixed media schedules can be evaluated by direct tabulation on this database. As a first step, we calculated the pairwise correlations between the IBOPE-based television network/daypart ratings and the TGI Brasil-based magazine ratings and found the average correlation to be 0.008, with a maximum value of 0.162 and a minimum value of –0.112. Figure 3 below shows the histogram of the correlation coefficients.
Figure 4. Histogram of Correlation Coefficients between Television and Magazines (source: IBOPE Television Audience Measurement-TGI Brasil fused database)
B etw een-TV N etw ork/D aypart-M agazine C orrelation C oefficients
.80
.70
.60
.50
.40
.30
.20
.10
.00
-.10
4000
3000
2000
1000
0
The largest positive correlations were between the Rio de Janeiro-based Rede TV and the local interest magazine titles Domingo, Veja Rio and Chiques e Famosos. The largest negative correlations were between the Sunday variety/game show block on the SBT network with the newsweeklies Veja, Epoca and Isto E. We calculated the ‘constant’ in the Duplication of Viewing Law to be 0.94, which happens to be right in line with the recommendation of Rossiter and Danaher (1999). We note that the margin of error around this estimate is quite large since this is the result of dividing 0.0562 (which is the average observed duplication) by 0.0600 (which is the average ‘duplication’ under the random duplication assumption). These results are in line with those found for the within-TGI television-magazine pairs, even though the television measures are not identical. Our second general finding about the relationship between television viewing and magazine readership is on the characterization of media usage volumes. We classified the respondents into print deciles
- 6 -
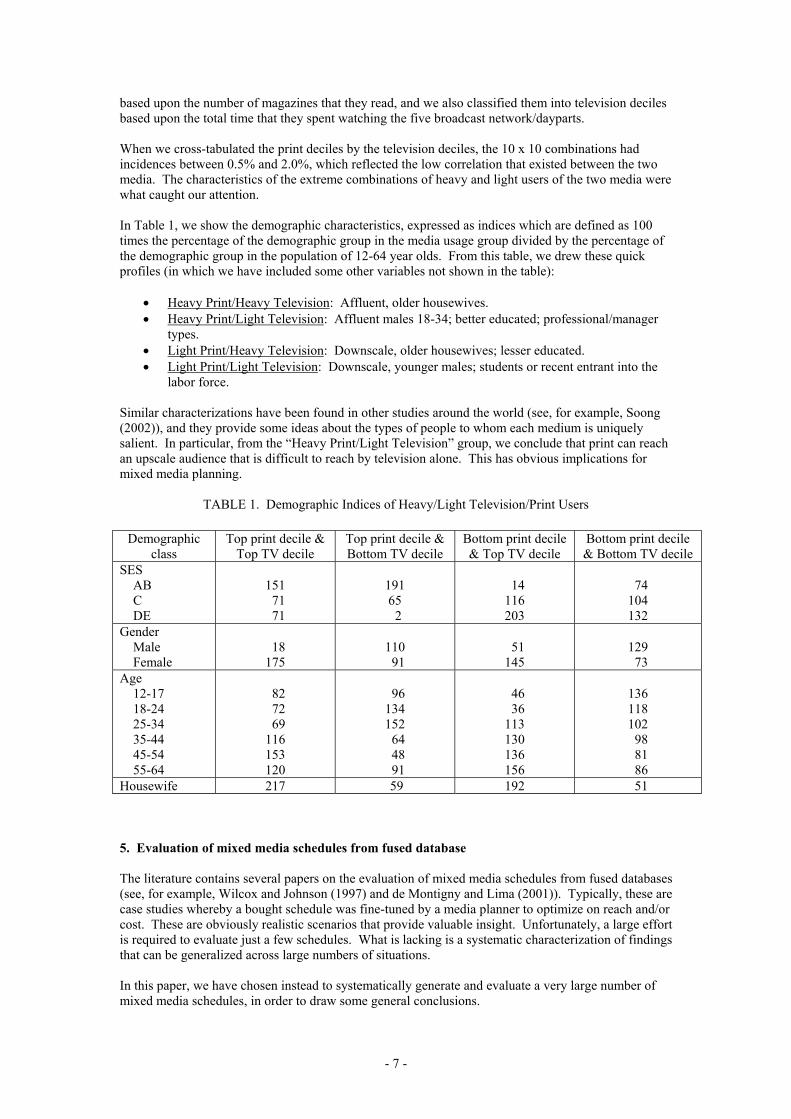
based upon the number of magazines that they read, and we also classified them into television deciles based upon the total time that they spent watching the five broadcast network/dayparts. When we cross-tabulated the print deciles by the television deciles, the 10 x 10 combinations had incidences between 0.5% and 2.0%, which reflected the low correlation that existed between the two media. The characteristics of the extreme combinations of heavy and light users of the two media were what caught our attention. In Table 1, we show the demographic characteristics, expressed as indices which are defined as 100 times the percentage of the demographic group in the media usage group divided by the percentage of the demographic group in the population of 12-64 year olds. From this table, we drew these quick profiles (in which we have included some other variables not shown in the table):
• Heavy Print/Heavy Television: Affluent, older housewives. • Heavy Print/Light Television: Affluent males 18-34; better educated; professional/manager
types. • Light Print/Heavy Television: Downscale, older housewives; lesser educated. • Light Print/Light Television: Downscale, younger males; students or recent entrant into the
labor force. Similar characterizations have been found in other studies around the world (see, for example, Soong (2002)), and they provide some ideas about the types of people to whom each medium is uniquely salient. In particular, from the “Heavy Print/Light Television” group, we conclude that print can reach an upscale audience that is difficult to reach by television alone. This has obvious implications for mixed media planning.
TABLE 1. Demographic Indices of Heavy/Light Television/Print Users
Demographic class
Top print decile & Top TV decile
Top print decile & Bottom TV decile
Bottom print decile & Top TV decile
Bottom print decile & Bottom TV decile
SES AB C DE
151 71 71
191 65 2
14 116 203
74 104 132
Gender Male Female
18 175
110 91
51 145
129 73
Age 12-17 18-24 25-34 35-44 45-54 55-64
82 72 69 116 153 120
96 134 152 64 48 91
46 36 113 130 136 156
136 118 102 98 81 86
Housewife 217 59 192 51 5. Evaluation of mixed media schedules from fused database The literature contains several papers on the evaluation of mixed media schedules from fused databases (see, for example, Wilcox and Johnson (1997) and de Montigny and Lima (2001)). Typically, these are case studies whereby a bought schedule was fine-tuned by a media planner to optimize on reach and/or cost. These are obviously realistic scenarios that provide valuable insight. Unfortunately, a large effort is required to evaluate just a few schedules. What is lacking is a systematic characterization of findings that can be generalized across large numbers of situations. In this paper, we have chosen instead to systematically generate and evaluate a very large number of mixed media schedules, in order to draw some general conclusions.
- 7 -
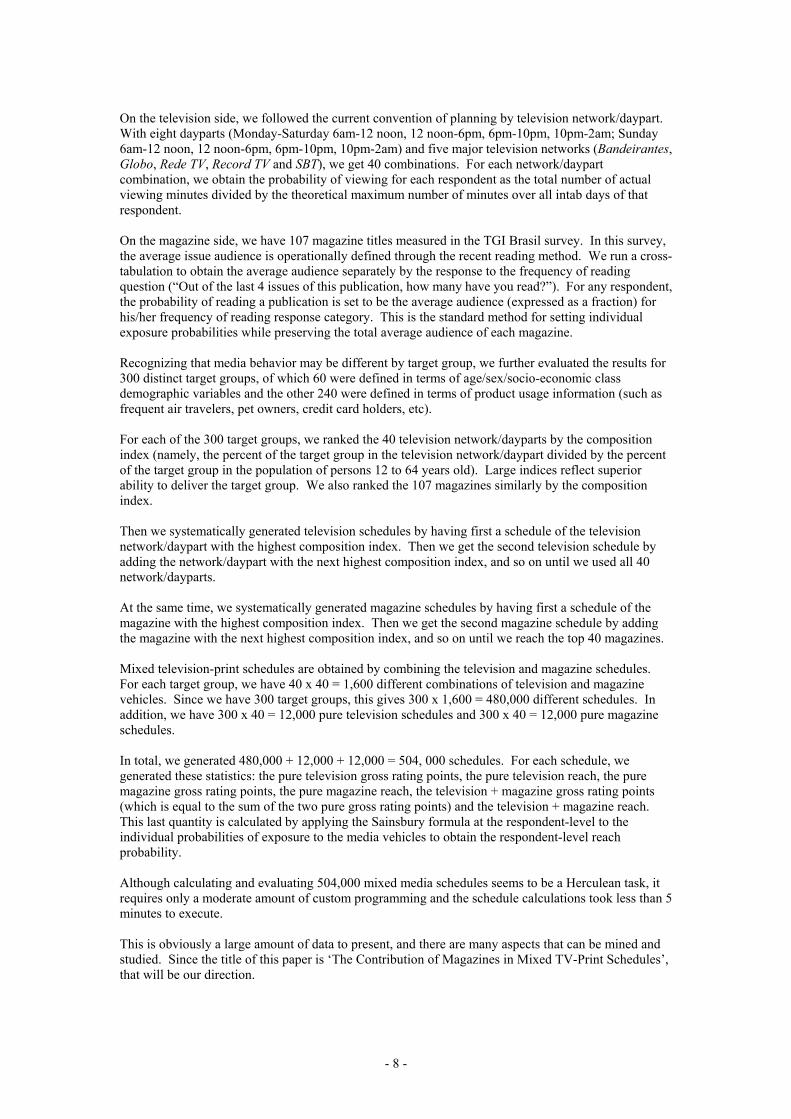
On the television side, we followed the current convention of planning by television network/daypart. With eight dayparts (Monday-Saturday 6am-12 noon, 12 noon-6pm, 6pm-10pm, 10pm-2am; Sunday 6am-12 noon, 12 noon-6pm, 6pm-10pm, 10pm-2am) and five major television networks (Bandeirantes, Globo, Rede TV, Record TV and SBT), we get 40 combinations. For each network/daypart combination, we obtain the probability of viewing for each respondent as the total number of actual viewing minutes divided by the theoretical maximum number of minutes over all intab days of that respondent. On the magazine side, we have 107 magazine titles measured in the TGI Brasil survey. In this survey, the average issue audience is operationally defined through the recent reading method. We run a cross-tabulation to obtain the average audience separately by the response to the frequency of reading question (“Out of the last 4 issues of this publication, how many have you read?”). For any respondent, the probability of reading a publication is set to be the average audience (expressed as a fraction) for his/her frequency of reading response category. This is the standard method for setting individual exposure probabilities while preserving the total average audience of each magazine. Recognizing that media behavior may be different by target group, we further evaluated the results for 300 distinct target groups, of which 60 were defined in terms of age/sex/socio-economic class demographic variables and the other 240 were defined in terms of product usage information (such as frequent air travelers, pet owners, credit card holders, etc). For each of the 300 target groups, we ranked the 40 television network/dayparts by the composition index (namely, the percent of the target group in the television network/daypart divided by the percent of the target group in the population of persons 12 to 64 years old). Large indices reflect superior ability to deliver the target group. We also ranked the 107 magazines similarly by the composition index. Then we systematically generated television schedules by having first a schedule of the television network/daypart with the highest composition index. Then we get the second television schedule by adding the network/daypart with the next highest composition index, and so on until we used all 40 network/dayparts. At the same time, we systematically generated magazine schedules by having first a schedule of the magazine with the highest composition index. Then we get the second magazine schedule by adding the magazine with the next highest composition index, and so on until we reach the top 40 magazines. Mixed television-print schedules are obtained by combining the television and magazine schedules. For each target group, we have 40 x 40 = 1,600 different combinations of television and magazine vehicles. Since we have 300 target groups, this gives 300 x 1,600 = 480,000 different schedules. In addition, we have 300 x 40 = 12,000 pure television schedules and 300 x 40 = 12,000 pure magazine schedules. In total, we generated 480,000 + 12,000 + 12,000 = 504, 000 schedules. For each schedule, we generated these statistics: the pure television gross rating points, the pure television reach, the pure magazine gross rating points, the pure magazine reach, the television + magazine gross rating points (which is equal to the sum of the two pure gross rating points) and the television + magazine reach. This last quantity is calculated by applying the Sainsbury formula at the respondent-level to the individual probabilities of exposure to the media vehicles to obtain the respondent-level reach probability. Although calculating and evaluating 504,000 mixed media schedules seems to be a Herculean task, it requires only a moderate amount of custom programming and the schedule calculations took less than 5 minutes to execute. This is obviously a large amount of data to present, and there are many aspects that can be mined and studied. Since the title of this paper is ‘The Contribution of Magazines in Mixed TV-Print Schedules’, that will be our direction.
- 8 -
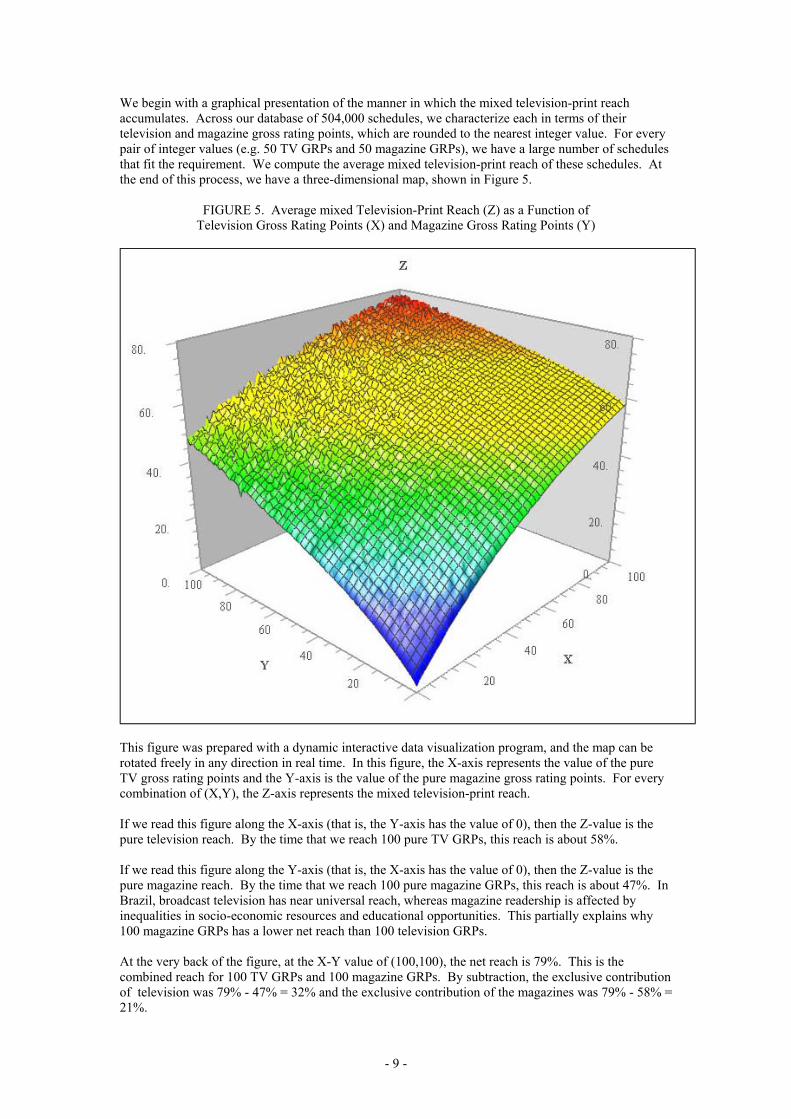
We begin with a graphical presentation of the manner in which the mixed television-print reach accumulates. Across our database of 504,000 schedules, we characterize each in terms of their television and magazine gross rating points, which are rounded to the nearest integer value. For every pair of integer values (e.g. 50 TV GRPs and 50 magazine GRPs), we have a large number of schedules that fit the requirement. We compute the average mixed television-print reach of these schedules. At the end of this process, we have a three-dimensional map, shown in Figure 5.
FIGURE 5. Average mixed Television-Print Reach (Z) as a Function of Television Gross Rating Points (X) and Magazine Gross Rating Points (Y)
This figure was prepared with a dynamic interactive data visualization program, and the map can be rotated freely in any direction in real time. In this figure, the X-axis represents the value of the pure TV gross rating points and the Y-axis is the value of the pure magazine gross rating points. For every combination of (X,Y), the Z-axis represents the mixed television-print reach. If we read this figure along the X-axis (that is, the Y-axis has the value of 0), then the Z-value is the pure television reach. By the time that we reach 100 pure TV GRPs, this reach is about 58%. If we read this figure along the Y-axis (that is, the X-axis has the value of 0), then the Z-value is the pure magazine reach. By the time that we reach 100 pure magazine GRPs, this reach is about 47%. In Brazil, broadcast television has near universal reach, whereas magazine readership is affected by inequalities in socio-economic resources and educational opportunities. This partially explains why 100 magazine GRPs has a lower net reach than 100 television GRPs. At the very back of the figure, at the X-Y value of (100,100), the net reach is 79%. This is the combined reach for 100 TV GRPs and 100 magazine GRPs. By subtraction, the exclusive contribution of television was 79% - 47% = 32% and the exclusive contribution of the magazines was 79% - 58% = 21%.
- 9 -
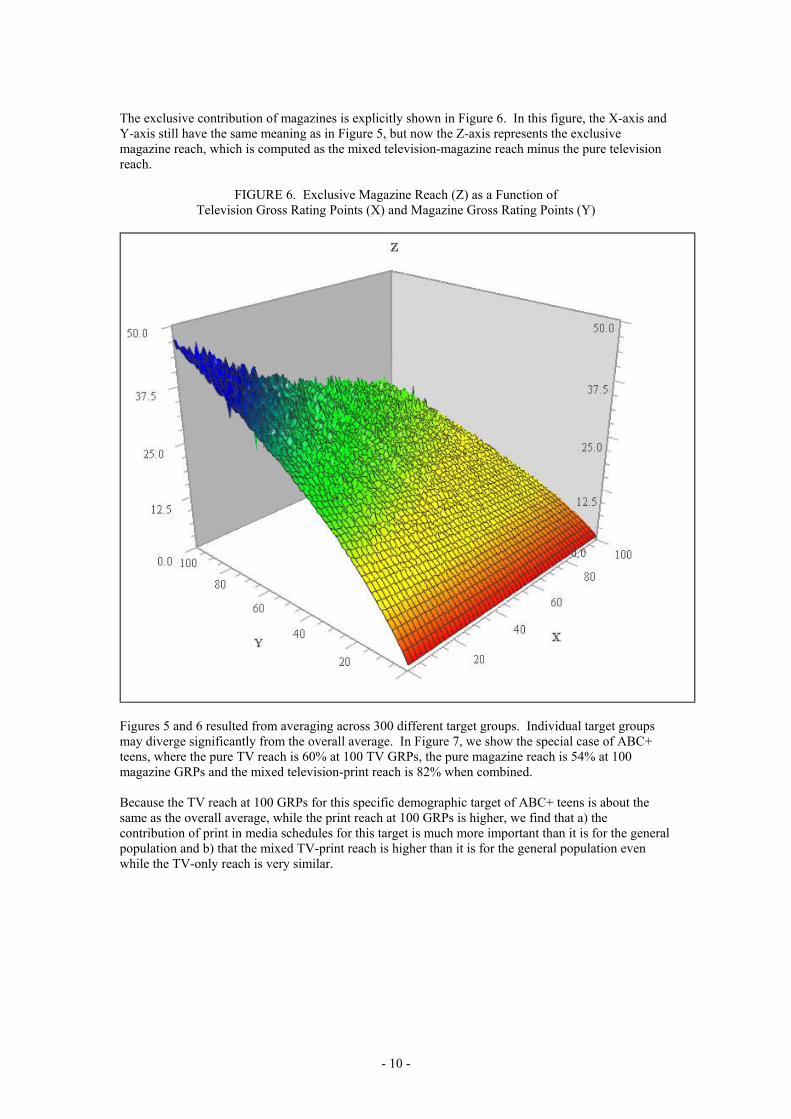
The exclusive contribution of magazines is explicitly shown in Figure 6. In this figure, the X-axis and Y-axis still have the same meaning as in Figure 5, but now the Z-axis represents the exclusive magazine reach, which is computed as the mixed television-magazine reach minus the pure television reach.
FIGURE 6. Exclusive Magazine Reach (Z) as a Function of Television Gross Rating Points (X) and Magazine Gross Rating Points (Y)
Figures 5 and 6 resulted from averaging across 300 different target groups. Individual target groups may diverge significantly from the overall average. In Figure 7, we show the special case of ABC+ teens, where the pure TV reach is 60% at 100 TV GRPs, the pure magazine reach is 54% at 100 magazine GRPs and the mixed television-print reach is 82% when combined. Because the TV reach at 100 GRPs for this specific demographic target of ABC+ teens is about the same as the overall average, while the print reach at 100 GRPs is higher, we find that a) the contribution of print in media schedules for this target is much more important than it is for the general population and b) that the mixed TV-print reach is higher than it is for the general population even while the TV-only reach is very similar.
- 10 -
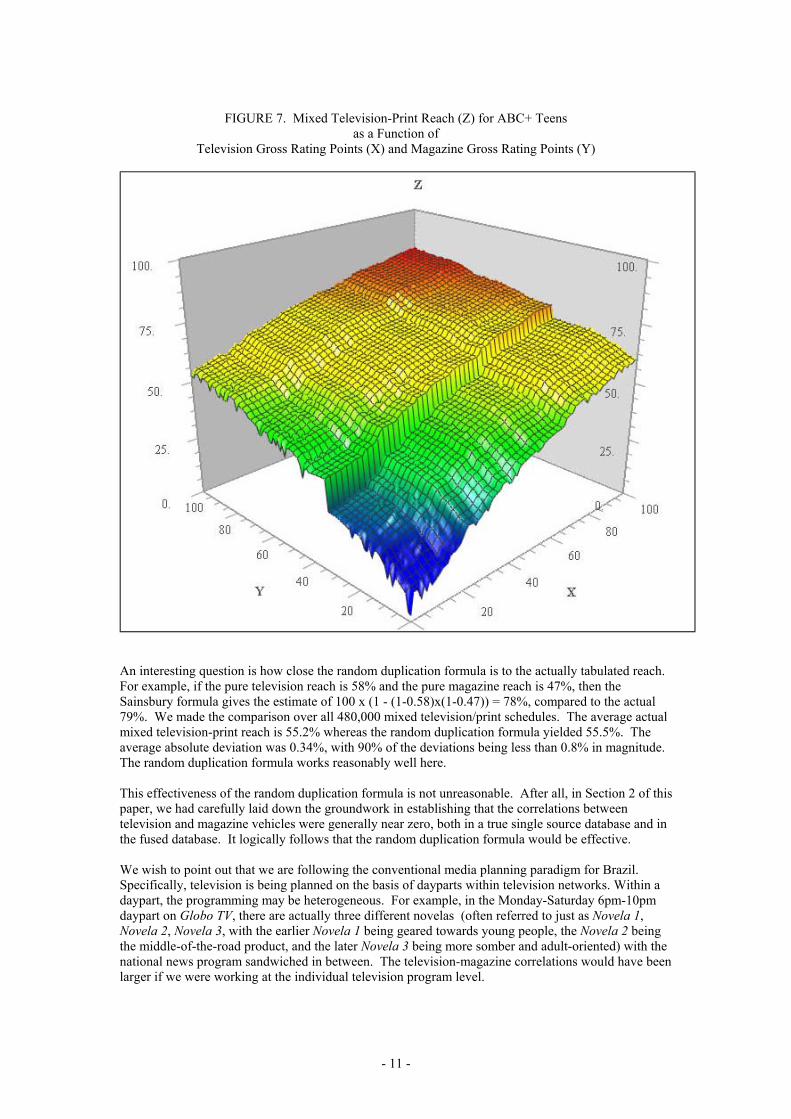
FIGURE 7. Mixed Television-Print Reach (Z) for ABC+ Teens
as a Function of Television Gross Rating Points (X) and Magazine Gross Rating Points (Y)
An interesting question is how close the random duplication formula is to the actually tabulated reach. For example, if the pure television reach is 58% and the pure magazine reach is 47%, then the Sainsbury formula gives the estimate of 100 x (1 - (1-0.58)x(1-0.47)) = 78%, compared to the actual 79%. We made the comparison over all 480,000 mixed television/print schedules. The average actual mixed television-print reach is 55.2% whereas the random duplication formula yielded 55.5%. The average absolute deviation was 0.34%, with 90% of the deviations being less than 0.8% in magnitude. The random duplication formula works reasonably well here. This effectiveness of the random duplication formula is not unreasonable. After all, in Section 2 of this paper, we had carefully laid down the groundwork in establishing that the correlations between television and magazine vehicles were generally near zero, both in a true single source database and in the fused database. It logically follows that the random duplication formula would be effective. We wish to point out that we are following the conventional media planning paradigm for Brazil. Specifically, television is being planned on the basis of dayparts within television networks. Within a daypart, the programming may be heterogeneous. For example, in the Monday-Saturday 6pm-10pm daypart on Globo TV, there are actually three different novelas (often referred to just as Novela 1, Novela 2, Novela 3, with the earlier Novela 1 being geared towards young people, the Novela 2 being the middle-of-the-road product, and the later Novela 3 being more somber and adult-oriented) with the national news program sandwiched in between. The television-magazine correlations would have been larger if we were working at the individual television program level.
- 11 -
6. Discussion We embarked on this set of analyses in order to better understand the exclusive contribution of magazines to the reach of mixed TV-print schedules. Along the way, we have investigated the properties of reach duplication with regard to our data set, and we looked at previous studies that have sought to do the same. We confirmed that intra-media reach duplication is not predictable using the random duplication formula. This is not a problem because typically we have a single source of information for each medium to measure this type of duplication. Our data and previous studies both indicated that intra-media duplication for consecutive TV dayparts within channel is higher than it would be under the random duplication assumption. Our data also showed that the duplication of readership of magazines is higher when the magazines are targeted toward the same or similar audiences. None of this is new information, but it does set the stage for our investigation of inter-media reach duplication, specifically with respect to the reach of mixed media schedules. Going beyond gathering anecdotal evidence from a few case studies, we generated nearly 500,000 mixed media schedules and calculated the standard statistics such as gross rating points and reach. This database is easily the largest of its kind that we are aware of. Our principal results (as shown in Figures 5 and 6) proved without a doubt that magazines do contribute unique and sizeable reach for mixed TV-print schedules. This contribution was demonstrated across all target groups for schedules that included both media. We of course also found that TV contributes unique reach for mixed TV-print schedules. The relative contribution of print to the mixed schedules depended on the target group's use of print in general. In Section 4, we were able to characterize the profiles of heavy/light print/television users. If the target group is a group of heavy print users, then the relative contribution of print to the media mix would be higher. This was concretely illustrated by our example of ABC+ Teens as shown in Figure 7. Of course, the unique contribution of print decreased as TV GRPs were added to the schedule. But the same could be said of TV because the unique contribution of television also decreased as print GRPs (and therefore print reach) were added to the schedule. The "real-life" application of these findings would be to determine which medium would be more cost-effective to use for adding each incremental reach point. There is a point of diminishing returns for both TV and print in any media plan. The definition of the point of diminishing returns will of course differ according to target and according to marketing objectives. If the objective is to have a low CPM and a high reach, then it is clear that a mixed print-TV schedule is superior to either a print-only or TV-only schedule. That is, the cost of adding coverage above the more or less 60% level for a mixed media schedule is lower than that for a single medium schedule. Looked at from a different angle, using more GRPs from a single medium rather than for two media combined will add to the frequency levels but not to the reach levels once the reach curves for the individual medium begin to flatten out. We also showed that the random duplication formula is generally predictive of inter-media reach for most target groups when using broad TV dayparts for major broadcast networks as the unit of analysis. This is true across the average of all of our schedules for all target groups, but it is also true in general for each of the target groups by themselves. This may seem to be counter-intuitive, so we emphasize again that the results here are shown for broad television dayparts, following the current media planning practice. Individual television programs may have higher duplications with specific magazine titles. Also, we believe that including a larger number of print vehicles or TV dayparts in the schedule (a more dispersed schedule of the type used to maximize 1+ reach rather than 3+ reach) serves to dilute the duplication between print and television. The schedules that we created for this analysis were very dispersed at the higher GRP levels (no more than one insertion per magazine, for example). In this sense, the length of the time period for the media plan is very important when analyzing duplication between media. If the plan is for one month, it does not make sense to include more than one insertion per monthly magazine, while it may be more reasonable to include several insertions in a daily novela. Adding these considerations to our analysis could change our results.
- 12 -
Put into context, what we learned is that, in general terms, there is very little variation from random duplication for the mixed-media schedules generated. We know that planners use many sources of information when building media plans. Indices for inter-vehicle duplication across media will probably be used during the media planning process in order to improve upon the media plans depending on specific objectives (Wilcox and Johnson (1997)). In many cases, we believe that this will simply prove what may already be known by the planners through their understanding of the demographic composition of the media users for each vehicle. For example, they will be able to conclusively show that viewers of news programs are more likely to read Veja (high duplication) and less likely to read Capricho (low duplication). And the planners will now know exactly how many readers of Veja are being reached by the news program instead of simply assuming that there is a high degree of duplication. Tools like the TGI-TAM database fusions that produce mixed-media ratings along with multi-media planning systems will enable planners to empirically test their ideas regarding the relative contribution of TV or print in the planning process. Planners will be able to accord the right GRP weight for each medium in order to reach their planning goals in terms of both reach and frequency. The results of these analyses will not be felt until media planners and buyers get these databases and planning tools on their desktops and test the results for themselves. Planners will be able to test multiple schedules using their knowledge of their clients' marketing objectives and come to their own conclusions regarding how print contributes to their mixed TV-print schedules. We are confident that these tools will provide evidence that print provides an important contribution to most media campaigns. We will leave it to our colleagues (Crellin, Rudman and Heath (2002)) presenting at this session to illustrate some practical implications of implementing these tools for media planning and buying in the UK. References: Baker, K., Harris, P. and O’Brien, J. (1989) Data fusion: an appraisal and experimental evaluation.
Journal of the Market Research Society, 31(2), 153-212. Carpenter, R. and Wilcox, S. (1995) Data fusion in the British National Readership Survey – an
experiment. Worldwide Readership Research Symposium VII, Berlin (Germany), 313-328. Crellin, M., Rudman, L. and Heath, M. (2002) Media planning enters the 21st century. WAM Week of
Audience Measurement, Cannes, France, June 2002. de Montigny, M. and Lima, A.L. (2001) Brazil fusion and multi-media duplication. Session Papers,
Worldwide Readership Research Symposium, Venice (Italy), 555-558. Goodhardt, G. J. (1966) The constant in duplicated television viewing. Nature, 212, 1616. Goodhardt, G.J. and Ehrenberg, A.S.C. (1969) Duplication of viewing between and within channels.
Journal of Marketing Research, 6 (May), 169-178. Hillier, F.S. and Lieberman, G.G. (2000) Introduction to Operations Research. McGraw-Hill, New
York. Joyce, T. and Coffey, S. (1993) Sampling considerations with single source data. Session Papers,
Worldwide Readership Symposium, San Francisco, 81-87. Rossiter, J.R. and Danaher, P.J. (1999) Advanced Media Planning. Kluwer Academic Publishers:
Norwell, Massachusetts. Rust, R. (1986) Advertising Media Models: A Practical Guide. Lexington Books: Lexington,
Massachusetts. Rust, R.T. and Leone, R.P. (1984) The mixed media Dirichlet multinomial distribution: a model for
evaluating television-magazine advertising schedules. Journal of Marketing Research, 21, 84-99. Soong, R. (2002) Heavy/light print/television media users. ZonaLatina.com, January 4th, 2002.
(http://www.zonalatina.com/Zldata217.htm). Soong, R. and de Montigny, M. (2001) The anatomy of data fusion. Worldwide Readership Research
Symposium, Venice (Italy), 87-109. Webster, J.G. (1985) Program audience duplication: a study of television inheritance effects. Journal
of Broadcasting and Electronic Media, 29(2), 121-133. Wilcox, S. and Johnson, H. (1997) Multi-media reach and frequency analysis. Session Papers,
Worldwide Readership Symposium, Vancouver, 105-115. The authors: Roland Soong is Chief Technical Officer at Kantar Media Research, USA. Michelle de Montigny is Executive Vice President of Kantar Media Research, USA.
- 13 -