Embed Size (px)
Citation preview
The Contributions of Smallholder Subsistence Agriculture towards Rural
Household Food Security in Maroteng Village, Limpopo Province
By
Kgalema Abbyton Mashamaite
Dissertation
Submitted in Fulfillment of the Requirements for the Degree
Master of Administration
In
Development
In the
Faculty of Management and Law
(School of Economics and Management)
At the
University of Limpopo
Supervisor: Professor J.P. Tsheola
2014
ii
Declaration
I declare that The Contributions of Smallholder Subsistence Agriculture towards
Rural Household Food Security in Maroteng Village, Limpopo Province hereby
submitted to the University of Limpopo, for the degree of Master of Administration
in Development has not previously been submitted by me for a degree at this or any
other university; that it is my own work in design and in execution, and that all material
contained herein has been duly acknowledged.
Mashamaite, K.A. (Mr) 02 April 2014
Signature Date

iii
Acknowledgements
It gives me great pleasure to thank few numbers of people whom this dissertation would
have not been completed without them. I thank Lord Almighty for giving me strength,
guidance and wisdom throughout the course of the study.
Firstly, I wish to extend my sincere special thanks to my supervisor, Professor J.P.
Tsheola, for his guidance, moral support, patience and valuable contribution throughout
the course of this study.
Secondly, I also wish to thank my mother, Ms. G. Mashamaite, for her never ending
support and encouragement, and standing by me during tough times. Thank you, for
your patience and for believing in me, Mother.
Last but not least, I owe a depth of gratitude to the University of Limpopo, in particular
the Department of Development Planning and Management for giving me the
opportunity to further my postgraduate studies.
iv
Dedication
I dedicate this treatise to my late grandmother, Change Christina Mashamaite, whom
passed away in 2005. May her soul rest in peace. I also dedicate this treatise to my
loving mother, Mmashela Grany Mashamaite, my friends and family at large.
v
Abstract
Smallholder subsistence agriculture is regarded as an approach that can be adopted by
poor rural households to meet their food and nutritional requirements. The practice of
smallholder subsistence agriculture is a basis upon which poor households can
enhance their household food security through increased incomes and food supply,
ultimately generating extra income for other household needs. The present study
discusses and analyses the importance of smallholder subsistence agriculture as an
effective method easily available to households residing in rural areas to access food
and incomes for household purposes. Hence, the study seeks to explore and analyses
the role of smallholder subsistence agriculture in contributing to household food security
in rural areas. Both primary and secondary data have been used to analyze the factors
for the purpose of the study. The primary data were collected through a designed
survey questionnaire administered to sampled smallholder subsistence farmers in the
study area. This study used purposive sampling technique, through a transect walk, to
draw households involved in smallholder subsistence agriculture in Maroteng Village.
From the total population in the study area, only 100 households were selected for the
purposes of the study. Both descriptive and qualitative techniques were used to analyze
salient variables of the practice in order to give an insight of the important role the
sector can play in addressing poverty, enhancing incomes and creating employment,
consequently contributing to household food security in rural areas. The study shows
that the participation on smallholder subsistence farming by households in rural areas
could have positive impact on food security situations.
vi
Table of Contents
Item Description Page
Declaration (ii)
Acknowledgements (iii)
Dedication (iv)
Abstract (v)
Table of Contents (vi)
List of Tables (x)
List of Figures (xi)
Acronyms (xiii)
List of Appendices (xiv)
Chapter 1: Introduction and Background of the Study
1.1. Introduction and Background 1
1.2. Statement of the Research Problem 4
1.3. Research Questions 5
1.4. Research Aim and Objectives 6
1.5. Definition of Terms 7
1.6. Research Design and Methodology 8
1.6.1. Research design 8
1.6.2. Study area 11
1.6.3. Kinds of data 12
1.6.4. Target population 12
1.6.5. Sampling design 13
1.6.6. Data collection techniques 14
1.6.7. Data analysis techniques 16
vii
1.6.8. Validity and reliability 17
1.7. Significance of the Study 18
1.8. Ethical Considerations 19
1.9. Structure of the Dissertation 19
1.10. Limitations of the Study 20
Chapter 2: Smallholder Subsistence Agriculture as Household Food Security Strategy: A Review of Literature
2.1. Introduction 22
2.2. Types and Characteristics of Smallholder Subsistence Agriculture 22
2.3. Household Food Security Trends in Rural Areas 25
2.4. Determinants and Indicators of Rural Household Food Security 29
2.4.1. Food availability 30
2.4.2. Food accessibility 30
2.4.3. Food expenditure 31
2.5. Contributions of Smallholder Subsistence Agriculture towards Rural
Household Food Security 32
2.5.1. Increased food supply 34
2.5.2. Increased employment opportunities 35
2.5.3. Food self-provisioning 36
2.5.4. Improved food purchasing power 36
2.5.5. Food poverty alleviation 37
2.6. Conclusion 38
viii
Chapter 3: Smallholder Subsistence and Household Food Security in rural South Africa
3.1. Introduction 39
3.2. Smallholder Subsistence Agriculture in the rural South Africa 39
3.2.1. An overview of smallholder subsistence agriculture in South Africa 40
3.2.2. Agricultural policy frameworks in South Africa 43
3.2.2.1. White Paper on Agriculture (1995) 44
3.2.2.2. Land Policies (1997) 45
3.2.2.3. Strategic Plan for South African Agriculture (2001) 45
3.2.2.4. Trade and Market Liberalisation Policies 46
3.2.2.5. Agriculture Black Economic Empowerment (2007) 47
3.3. Household Food Security in rural South Africa 48
3.3.1. An overview of food security in South Africa 49
3.3.2. The state of household food security in the rural South Africa 50
3.3.3. Policy and legislative frameworks for food security in South Africa 54
3.4. Conclusion 57
Chapter 4: Research Findings, Analysis and Interpretation 4.1. Introduction 58
4.2. Types and Characteristics of Smallholder Subsistence Agriculture in
Maroteng Village 58
4.3. Household Food Security Trends in Maroteng Village 73
4.4. Indicators and Determinants of Household Food Security in Maroteng
Village 80
4.5. Contributions of Smallholder Subsistence Agriculture towards Household
ix
Food Security in Maroteng Village 86
4.6. Conclusion 95
Chapter 5: Research Findings, Conclusions and Recommendations
5.1. Introduction 96
5.2. Summary of the Research 96
5.3. Recommendations 98
5.4. Conclusion 99
List of References 102
x
List of Tables
Description Page
Table 4.1: Types of smallholder subsistence agriculture against age group 60
Table 4.2: Household size of the respondents 62
Table 4.3: Farming area and size 68
Table 4.4: Farm ownership against duration of farming 75
Table 4.5: Level of production and quality of farm produce 77
Table 4.6: Source of household food 80
Table 4.7: Quality of daily meals and level of satisfaction 85
Table 4.8: Number of family members and people employed on the farm 90
Table 4.9: Proportion and utilization of income generated for household
consumption 94
xi
List of Figures
Description Page
Figure 4.1: Age group 59
Figure 4.2: Gender 61
Figure 4.3: Highest level of education 64
Figure 4.4: Employment status 65
Figure 4.5: Monthly income 66
Figure 4.6: Types of smallholder subsistence agriculture 69
Figure 4.7: Type of crop farming 70
Figure 4.8: Reasons for practicing smallholder subsistence agriculture 71
Figure 4.9: Source of irrigation 72
Figure 4.10: Farm operation 73
Figure 4.11: Main production in recent years 76
Figure 4.12: Challenges faced 78
Figure 4.13: Food coping strategies adopted 79
Figure 4.14: Household food expenditure 82
Figure 4.15: Number and type of daily food 83
Figure 4.16: Frequency of daily food taken 84
Figure 4.17: Number of dependents on daily food 84
Figure 4.18: Food production 87
Figure 4.19: Proportion of food production for household consumption 88
xii
Figure 4.20: Proportion sold or given away 89
Figure 4.21: Method of payment for farm labour 91
Figure 4.22: Whom proportion is sold or given away 92
Figure 4.23: Income generated 93
xiii
Acronyms
DFID : Department for International Development
DoA : Department of Agriculture
FAO : Food and Agriculture Organization
GDP : Gross Domestic Product
GHS : General Household Survey
IES : Income and expenditure Survey
IFSS : Integrated Food Security Strategy
RDA : Recommended Daily Allowance
RDP : Reconstruction and Development Programme
SASIX : South African Social Investment Exchange
Stats SA: Statistics South Africa
xiv
List of Appendices
Appendix A: Survey Questionnaire for Maroteng Village 110
1
Chapter 1: Introduction and Background of the Study
1.1. Introduction and Background
Rural households in most developing countries are food insecure and unable to meet
their daily dietary food needs (Averbeke and Khosa, 2007). Reily, Mock, Cogill, Bailey
and Kenefick (1999); Bonti-Ankomah (2001) emphasize that to achieve food security
households should have sufficient availability and adequate access to physical food
supplies through their own production, market or other sources, and that those food
supplies be appropriately utilized to meet the specific dietary needs of individuals. Most
of the rural households in the former homelands have accepted and adopted the
practice of smallholder subsistence agriculture as their primary approach to achieve
household food security and meet their daily dietary food needs (Food and Agriculture
Organization (FAO), 2004; Aliber, 2005). Smallholder subsistence agriculture provide
for food security to rural households by reducing food prices through increased food
supply, generating employment opportunities for the poor; improving household income
and providing food for household consumption (Machethe, 2004; Altman, Hart and
Jacobs, 2009).
Smallholder subsistence production provide for food security of poor households in rural
areas by increasing food supply which reduces food price shocks (Department for
International Development (DFID), 2004; Baiphethi and Jacobs, 2009). Baiphethi and
Jacobs (2009) indicate that smallholder subsistence agriculture accounts for over 90
percent of the food supply in most developing countries. The availability of food at lower
2
prices through increased food supply provides households with the means to access
food in order to meet their dietary food needs hence improving household food security
(FAO, 2003; DFID, 2004; Baiphethi and Jacobs, 2009). Smallholder subsistence
agricultural production can also create employment opportunities for most of the poor
members of the households in most developing countries.
Enhanced smallholder subsistence agricultural development by increasing agricultural
productivity could create both on and off farm employment opportunities for most
household members in rural areas. Increasing agricultural productivity on-farm
increases the demand for labour in preparation, planting, weeding and harvesting in
most smallholder farms (DFID, 2004). According to DFID (2004), smallholder
subsistence farmers are increasingly inclined to substitute hired labour for household
labour as they are getting richer, hence generating greater job opportunities for the
poor. Furthermore, increasing productivity of the smallholder farms also creates new
and income generating off-farm jobs for the poor through the linkages between
agriculture and the wider rural economy. The combination of extra jobs within and
outside smallholder subsistence farming can have positive effects on rural labour
market by improving wages and the ability of the poor to access food from markets
(DFID, 2004).
Smallholder subsistence agriculture is also considered as the greatest contributor
towards household income by up to 40 percent in most developing countries such as
South Africa, which gives poor people the means to access food from the markets
3
(Averbeke and Khosa, 2007). These incomes enhance food purchasing power of most
households in order to meet their daily food needs which consequently enhance
household food security (FAO, 2003; Averbeke and Khosa, 2007). However, there are
few number of smallholder subsistence farmers engaged in the production as a main
source of income due to the fact that they produce mainly for household consumption.
Aliber (2005) indicates that smallholder subsistence agriculture can contribute up to 15
percent of the total household income in rural households which include incomes
derived from the sale of farm produce by households.
While the smallholder subsistence agricultural sector is acknowledged as the primary
route for achieving household food security in poor rural areas, Bonti-Ankomah (2001)
argues that for household food security to be achieved, food must be consistently
available and accessible, and be properly utilized for consumption to meet specific
dietary needs of households. Moreover, for rural households to be food secure, food at
their access should be adequate both in quantity and quality (Bonti-Ankomah, 2001).
Bonti-Ankomah (2001); Hendriks and Msaki (2009) argue that household food security
is achieved when all individuals in a household have physical and also economic
access to sufficient, nutritious, healthy and safe food on daily basis to meet their daily
food dietary needs and preferences. The acknowledgements of smallholder
subsistence agriculture’s contributions in providing food security of households also
exist in Limpopo Province.
4
Oni, Nevamvuni, Odhiambo and Dagada (2003) indicate that smallholder subsistence
agriculture contributed 15.7 percent of the gross geographic product (GGP) in Limpopo
Province, thus ensuring household food security in rural areas. The smallholder
subsistence agricultural sector also provides employment for the economically active
population at smallholder farm level and is regarded as one of the main sources of
income (Oni et al, 2003). The sector employs up to 25 percent of the economically
active population, especially poor members of the households. This chapter provides
the background of the study, and further covers the following sections: statement of the
problem, research question and objectives of the study as well as the methodologies
used to achieve the objectives of the study. The chapter further provides definition of
some of the terms that are used in the study. Lastly, an outline of the study in the form
of chapters is presented. Thus, the study seeks to explore the extent to which
smallholder subsistence agriculture is adopted as the primary strategy for household
food security to meet specified dietary needs, and Maroteng Village will is used as the
case study area.
1.2. Statement of the Research Problem
Most developing countries regard smallholder subsistence agriculture as the most
effective way to fight food insecurity and provide household food security in accordance
with specific dietary needs in rural areas (FAO, 2004; Aliber, 2005). Machethe (2004);
Baiphethi and Jacobs (2009) indicate that the smallholder subsistence agricultural
sector is regarded as the main contributor towards the economy by up to 3 percent of
5
the gross domestic product (GDP), and contributes 7.2 percent of formal employment in
South Africa. However, there is still no consensus on whether the sector is the most
appropriate strategy to achieve household food security in rural areas (Machethe, 2004;
Aliber, 2005). This is evident due to the fact that the majority of the rural households are
still vulnerable to food insecurity and malnutrition which exacerbates food poverty and
hunger (De Klerk, Drimie, Aliber, Mini, Mokoena, Randela, Modiselle, Vogel, Swardt and
Kirsten, 2004; Averbeke and Khosa, 2007). According to Averbeke and Khosa (2007),
approximately 35 percent of the total population in South Africa is classified as
vulnerable to food insecurity and unable to meet their daily dietary food needs. The
vulnerability is most prevalent within households living in rural areas (de Klerk et al,
2004). In light of the above, arises the question, why majorities of the people are still
facing in rural areas household food insecurity and hunger despite much acceptance
and acknowledgement of smallholder subsistence agriculture as an effective approach
to achieve household food security. As such, the study attempts to investigate the
potential role smallholder subsistence agriculture has in uplifting and providing food
security of most rural households.
1.3. Research Questions
The general research question of the study is: how does smallholder subsistence
agriculture contribute towards household food security in rural areas? The following
specific questions have been drawn from the general research question:
6
What are the types and characteristics of smallholder subsistence agriculture in
rural areas?
What are the household food security trends in rural areas?
What are the determinants and indicators of household food security in rural
areas?
What are the contributions of smallholder subsistence agriculture towards
household food security in rural areas?
1.4. Research Aim and Objectives
The aim of the study is to investigate the contributions of smallholder subsistence
agriculture towards household food security in rural areas. The following specific
objectives have been drawn from the aim:
To study the types and characteristics of smallholder subsistence agriculture in
rural areas.
To investigate the trends of household food security in rural areas.
To investigate the determinants and indicators of household food security in rural
areas.
To explore the contributions of smallholder subsistence agriculture towards
achieving rural household food security.
To recommend possible measures to enhance the smallholder subsistence
agriculture towards household food security.
7
1.5. Definition of Terms
Smallholder subsistence agriculture is defined as the production which involves
mainly households producing on relatively small plots of land less than one hectare with
limited resources only for household subsistence or sale (Wenhold, Faber, Averbeke,
Oelofse, Jaarsveld, van Rensburg, van Heerden and Slabbert, 2007).
Food security is defined by Hendriks and Msaki (2009) as a situation whereby all
people have physical, social and economic access to sufficient, nutritious, healthy and
safe food at all times to meet their daily food dietary needs and preferences. Averbeke
and Khosa (2007) indicate that household food security is adequate access by all
household members at all times to safe and nutritious food for a healthy and productive
life. On the other hand, Wenhold et al. (2007:1) shows that ‘food security exists when all
people, at all times, have physical and economic access to sufficient, safe and nutritious
food to meet their dietary needs and food preferences for and active and healthy life’.
The proposed study adopts the definition by both Wenhold et al. (2007) and Hendriks
and Msaki (2009).
Food insecurity is defined as the lack of food security that, at the extreme, is
experienced in the form of hunger (Hendriks, 2005). Bickel, Nord, Price, Hamilton and
Cook (2000) define food insecurity as a situation whereby people have limited access
and availability of adequate, nutritious and safe foods. The proposed study adopts the
definition by Bickel et al (2000).
8
1.6. Research Design and Methodology
This section focuses on the research design and methodology that directs this study.
The purpose of this section is to explain the rationale behind the methodology that was
used, and also indicates how the study was conducted. It further outlines the steps
taken to ensure the collection and analysis of data, study area, validity and reliability,
and ethical consideration of the study.
1.6.1. Research Design
Research design is the plan which provides the overall framework for the collection of
data as well as an outline of detailed steps taken to ensure the success of the study
(Babbie and Mouton, 2001; Leedy and Ormrod, 2001). In essence, it is a logical
sequence that connects empirical data to the initial research questions of the study and
ultimately to the logical conclusions. Hence, the research design aims to help in
achieving the research objectives and answering the research questions of the study. It
also assists in collecting relevant data and how to analyze such data. The research
design is much more than just a work plan because the main purpose is to help avoid
the situation in which the evidence does not address the initial research questions and
objectives of the study (Mouton, 2001). The study adopted correlational research
design.
9
Correlational research is defined as an investigation in which the purpose is to discover
the relationship between two or more variables in order to probe the contributions of
smallholder subsistence agriculture towards food security at household level in rural
areas (Thompson, Diamond, McWilliam, Snyder and Snyder, 2005). The most important
advantage of correlation research is that it allows the exploration of different relations
within the same study. However, the ability of correlation research to examine the
relationships between variables does not imply that one variable causes the other
(Thompson et al, 2005). The study used both the qualitative and quantitative research
approaches in order to achieve the objectives of the study.
The qualitative research approach is an investigation in which data is collected data in
face-to-face situations by interacting with selected individuals in their settings in order to
get different perceptions and experiences about the smallholder subsistence
agriculture’s contributions on providing household food security (McMillan and
Schumacher, 2001). The qualitative approach to the study assisted in answering
questions about the nature of the phenomena with the purpose of describing and
understanding the phenomena from the participants’ point of view (Polit, 2001). This
research approach utilized interviews with participants using a survey questionnaire to
explore and understand their attitudes, opinions, feelings and behaviours of the
participants about the extent of smallholder subsistence agriculture’s contributions
towards providing food security to their respective households. The advantage of the
qualitative approach is that it produces findings which have greater validity and less
artificiality, which allowed the researcher to develop a more accurate understanding of
10
smallholder subsistence agriculture and household food security in the study area
(Chisaka, 2000; Polit, 2001).
The quantitative approach involved the use of numerical measurement and statistical
analyses of the measurements to examine the phenomena under study (Polit, 2001). A
quantitative approach abstracted data from the participants into statistical
representations rather than textual pictures of the phenomenon. One of the limitations of
the quantitative approach is that it may degrade human individuality and the ability to
think. The quantitative approach seeks to establish relationships between two or more
variables, using statistical methods to test the strength and significance of the
relationship between the variables (Denscombe, 1998).
The study employed both qualitative and quantitative research approaches for various
reasons. Firstly, qualitative approach provided an opportunity to understand the
phenomenon from the participants’ perspective (Polit, 2001). Meaning understanding is
acquired by analyzing the participant’s feelings, beliefs, ideas and thoughts (Chisaka,
2000) on the contributions of smallholder subsistence agriculture towards food security.
Secondly, the researcher interacted with the selected individuals in their natural setting
to obtain required data. Thirdly, the study seeks to understand in-depth analyses of the
data collected. Quantitative research method attempts to identify specific variables
within the context of the study. Key quantitative variables for purpose of this study
included food expenditure, size of the farm, income generated, farm labourers and
household income among others. According to Decrop (1999), although both qualitative
11
and quantitative research differs in many ways, they complement each other in various
ways as well.
According to Decrop (1999), the advantages of one method complement those of the
other when these methods are combined making a stronger research design that yield
more valid and reliable findings. This minimizes the inadequacies of individual method.
Both qualitative and quantitative methods make it possible to gather most needed data
to address the research problem and to ensure that the objectives of the study are
successfully achieved.
1.6.2. Study Area
Maroteng Village is situated near Mokopane Town within Mogalakwena Local
Municipality. Mogalakwena Municipality is located in the western quadrant of Limpopo
Province within the Waterberg District Municipality. The area is one of the richest
agricultural areas producing wheat, tobacco, cotton, beef, sorghum, maize, peanuts and
citrus (Mogalakwena Municipality IDP, 2009). The area contributes significantly towards
the activity of agriculture on the local level. Tobacco, cotton, sunflower, sorghum, maize
contribute about 25 percent of the total farm income earned in field crop commodities,
while about 41 percent of the tobacco crop of the province is produced in the area
(Limpopo Department of Economic Affairs and Tourism, 2001). Maroteng Village has
approximately 1000 households (Mogalakwena Municipality IDP, 2009). Majority of the
households practice smallholder subsistence agriculture for various reasons in the study
12
area and there is no exact number of households engaging in smallholder subsistence
agriculture.
1.6.3. Kinds of Data
The study requires observations, opinions and factual data, in order to achieve the
research objectives. Factual data involve information that can be proven to be real and
observable or can be demonstrated while opinions involve ideas, thoughts and beliefs
that are not necessarily based on factual data and have not been proven. Observations
and opinions allowed the researcher to acquire primary data which the researcher might
not have known and observed during the study. These observations and opinions
derived from participants’ perspectives about the contributions of smallholder
subsistence agriculture towards household food security. The primary data were
acquired through the administration of questionnaires from the participants to provide
comprehensive understanding of the trends, indicators and determinants of food
security and the nature of smallholder subsistence agriculture as practiced to provide for
food security.
1.6.4. Target Population
Bless and Higson-Smith (2000); Babbie and Mouton (2001) define population as a set
of elements that the research focuses upon and to which the results obtained by testing
the sample are generalized. The target population, therefore, refers to the entire group
13
in the study area a researcher is interested in and wishes to draw conclusions from. The
target population for the study area was rural households which practiced smallholder
subsistence agriculture in Maroteng Village. These households provided their opinions,
perceptions, experiences and beliefs on smallholder subsistence agriculture and its
contributions towards achieving food security for their households and the community at
large.
1.6.5. Sampling Design
Sampling design is one of the most fundamental elements of data collection for any
scientific research, and plays a critical role in ensuring that data are sufficient to draw
the necessary conclusions. The main purpose of sampling was to achieve
representativeness, meaning the sample should be assembled in such a way that
represents the entire population from which the sample is drawn (Jennings, 2001). The
sampling units for the study were rural households practicing smallholder subsistence
agriculture in Maroteng Village. A sample of 100 rural households was drawn from
approximately 1000 households in Maroteng Village. The total population of Maroteng
Village is too large to be studied in totality. Due to financial and time constraints, the
study limited itself to the sampled households practicing smallholder subsistence
agriculture in the area.
A sample of 100 was taken in order to obtain the precise data needed. Sometimes a
research, such as this study, is conducted in situations that do not permit the kind of
14
probability sampling that is feasible in large scale social surveys. Due to the nature of
the study and the constraints envisaged, the present study opted for a non-probability
sampling technique to select participants to be interviewed. Purposive sampling was
considered to be the ideal method to use in this study because it is suitable for selecting
a sample on the basis of knowledge of the population and purpose of the study. Based
on the main researcher’s knowledge of the area and objectives of the study, the aim
then was to select the widest variety of participants from the study population in order to
test the broad applicability of the research questions. Purposive sampling enabled easy
identification of households involved in smallholder subsistence agriculture by carrying
out a transect walk in the village. This alternating method was used until all the required
100 households practicing smallholder subsistence agriculture had been interviewed.
1.6.6. Data Collection Techniques
The study collected both primary and secondary data to achieve the research objectives
and to answer the research questions. Secondary data was acquired through sources of
evidence including documents, archival materials, published and unpublished articles,
internet sources and books, while primary data were collected through structured
questionnaires. The questionnaires encompass a variety of instruments in which the
respondents respond to written questions to elicit reactions, beliefs, attitudes, opinions,
facts and experiences about the extent of smallholder subsistence agriculture’s
contributions towards food security (Chisaka, 2000). The questionnaire was designed
around the opinion statements (research questions and objectives) as a means of
15
exploring participants’ perceptions of a wide range of smallholder subsistence
agriculture contributions.
The questionnaire included both open-ended and closed-ended questions which were
scaled, ranked and checked. Open-ended questions allowed the participants to give
more in-depth detailed data on the experiences, opinions, beliefs, facts and attitudes
about how smallholder subsistence agriculture contributed in providing food security for
their households. Closed-ended questions, on the other hand, allowed the participants
to choose the answers from the options provided to the questions. The questionnaire
consisted of three parts.
The first section was structured in such a way as to elicit demographic information
regarding the participants’ gender, age, educational type and level, income, household
size, number of dependants, years of farming, purpose of farming, size of the farm,
farming activities and employment. Section two consisted of closed-ended questions to
measure participants’ level of agreement and disagreement with the statement about
the contributions of smallholder subsistence agriculture towards household food security
in rural areas. The section also consisted of questions on the dimensions of food
security such as food expenditure, consumption, access and availability. In section
three, the participants were asked to provide any additional comments, positive or
negative, that they wish to make regarding the nature of smallholder subsistence
agriculture and food security as a way of identifying other inputs and problems not
included in the questionnaire.
16
The questionnaires were distributed to all sampled households engaging in smallholder
subsistence agriculture in the study area, and participants were assisted to complete
the questionnaires where necessary. The study employed two assistants, who know the
area of study, to assist in both approaching the participants to elicit their participation
and in monitoring the administration of the questionnaires.
1.6.7. Data Analysis Techniques
There are two techniques that were used to analyze the collected data in this study,
namely, qualitative and quantitative data analysis techniques. Qualitative research is
characterized by the fact that the results are descriptive in nature, meaning that words
are used rather than numbers to clarify the results of the collected data. Analyzing and
interpreting qualitative data was done by deeply immersing in the questionnaires. Data
was coded in order to develop the interpretations that were written in the final report.
This analysis was organized into relevant themes and patterns to tell a comprehensible
story. These themes and patterns were compared with other theories through inductive
approach. Through inductive approach, the researcher collected data and explored
them to check which themes to concentrate on.
The quantitative data was coded into numerical representations, so that a series of
statistical analysis could be performed using the software package called Statistical
Package for Social Sciences (SPSS). The software package enabled the researcher to
enter and store data, utilize retrieval strategies, engage in statistical analyses and
17
descriptive statistics such as graphs, charts, tables, percentages, frequencies,
averages. The software also assisted the researcher to write the report explaining
clearly and explicitly the data collected about the extent of smallholder subsistence
agriculture’s contributions and the dimensions of food security. Tables and graphs were
used to identify trends, show proportions and the distribution of values and to compare
visually the relationship between smallholder subsistence agriculture and food security.
1.6.8. Validity and Reliability
Welman and Kruger (2001) describe validity as a mechanism that ensured that the
process implemented to collect data, has collected the intended data successfully.
Validity refers to the extent to which an empirical measure adequately reflects the real
meaning of the subject under investigation. To ensure that the data collected are valid in
this study, the following steps were taken. Firstly, an extensive literature review was
done. Secondly, the purpose of the study was clearly explained to the participants.
Lastly, participants were assured anonymity and confidentiality to encourage frankness
during the interviews. These steps ensured that the interviews were conducted under
conditions and in an environment acceptable to the participants, and hence ensured
that the process was trustworthy.
Reliability relates to the consistency of the data to be collected. Reliability is a condition
in which the same results are achieved whenever the same technique is repeated in
one study. This was achieved by, firstly, ensuring the anonymity and confidentiality of
18
the participants so that the participants were able to provide information to be used
strictly for the purpose of the study. Lastly, the utilization of two assistants ensured that
the process of administering the questionnaires run smoothly.
1.7. Significance of the Study
The significance of smallholder subsistence agriculture in the rural economies of the
developing countries has long been recognized. It is generally agreed that smallholder
subsistence agriculture remains crucial in addressing food insecurity in most developing
countries. The smallholder subsistence agricultural sector plays an important role in
terms of its contributions to the gross domestic product (GDP), employment, income
and food supply. Hence, the role of smallholder subsistence agriculture in many
developing countries implies that various developmental activities hinge around the
sector. However, there are still uncertainties about the extent of smallholder subsistence
agriculture’s contributions towards achieving household food security in rural areas due
to lack of more research on the subject. Hence, the proposed study could contribute
towards the existing body of knowledge on the subject and could provide key lessons
and awareness for further investigation on the contributions of smallholder subsistence
agriculture towards food security to policy makers, researchers and practitioners. The
study provides recommendations on how to enhance the contributions of smallholder
subsistence agriculture towards food security in rural areas.
19
1.8. Ethical Considerations
The study used the written and verbal communication, which could involve emotions, to
interact with different rural households, smallholder subsistence farmers and other
relevant stakeholders. As such, the questions asked intended not to harm, discriminate
or invade the privacy of the participants. Participants were not be forced to provide
information against their will or classified according to their race, colour and language.
Hence they were allowed to provide information freely and on a voluntarily basis. The
study ensured and guaranteed that the participants’ identities and information provided
was not be revealed and was only used for the purpose of the study, thus guaranteeing
anonymity and confidentiality. At the centre of the ethics, the study ensured that the
necessary permission and procedures to conduct the study were obtained to ensure
that traditions and beliefs are well respected.
1.9. Structure of the Dissertation
The dissertation consists of five chapters and is structured in the following order:
Chapter 1: The chapter provides the introductory part of the topic which gives the
overview to the research topic and identifies the research problem, aim and objectives,
and the research questions. Finally, the chapter briefly discusses the definition of terms,
research design and methodology to be used, significance of the study and ethical
considerations.
20
Chapter 2: The chapter provides a review of literature from existing sources which
debates merits and demerits of smallholder subsistence agriculture as a contributor
towards rural household food security. The chapter also provides theoretical
background on the dimensions, determinants, indicators and trends related to food
security.
Chapter 3: The chapter presents a broad description of the study area in relation to
smallholder subsistence agriculture and food security. The chapter further provides
background and South Africa’s policy context highlighting some of the policies that
relate to food security and agriculture in particular.
Chapter 4: The chapter presents the analysis and interpretation of acquired data and
the findings emanating from the study.
Chapter 5: This chapter draws up conclusions based on the findings emerging from the
study and also provides possible recommendations to enhance the contributions of
smallholder subsistence agriculture towards food security.
1.10. Limitations of the Study
There are two forms of smallholder subsistence agriculture that exists in South Africa,
namely smallholder subsistence and smallholder commercial agriculture. However, the
study is limited to the problem of household food security within the realm of smallholder
subsistence agriculture only. The study is also limited only to Maroteng Village in
Limpopo Province, where only a small sample was surveyed. Even though the attempts
were made to make the sample as representative of the total population as possible,
21
errors may have still occurred. This may make it difficult to extrapolate the findings from
the study to other areas in the country with similar socio-economic conditions. These
limitations were taken into consideration when conducting the study, which also
experienced financial and time constraints.
22
Chapter 2: Smallholder Subsistence Agriculture as Household Food
Security Strategy: A Review of Literature
2.1. Introduction
The purpose of this chapter is to provide a detailed review of the literature, both national
and international on smallholder subsistence agriculture and household food security.
This chapter provides the types and characterization of the smallholder subsistence
agricultural sector. The global debate on the household food security is elucidated by
providing theoretical frameworks on the trends, determinants and indicators of food
security. The role and contributions of smallholder subsistence agriculture to provide for
household food security in rural areas is also highlighted in this chapter. The last section
provide conclusion of the chapter.
2.2. Types and Characteristics of Smallholder Subsistence Agriculture
The agricultural sector in most developing countries is mainly dominated by smallholder
subsistence agricultural production of crop and livestock as well as poultry and accounts
large proportion of agricultural production primarily for subsistence purposes (Salami,
Kamara and Brixiova, 2010). According to High Level Panel of Experts (HLPE) (2012),
smallholder subsistence farmers, who are mainly trapped in poverty circle, are regarded
as the main producers of the total agricultural products in the world. Furthermore, out of
these farmers some are indirectly involved in the operation and management of the
23
farm units with the support and reliance on family labour rather than hired labour (HLPE,
2012).
Smallholder subsistence agriculture can be defined from different perspectives and
differ from country to country. According to Salami et al (2010) smallholder subsistence
agriculture can be defined on the basis of land, ownership and productivity. Smallholder
subsistence agriculture is defined by HLPE (2012) as farming activity mainly run and
managed by poor households which derives greater part of their incomes from
agriculture and relies heavily on the sector for their household food needs through self
provisioning, remittances and markets. Smallholder subsistence agriculture is defined
by Wenhold et al (2007) as the production which involves mainly households producing
on relatively small plots of land less than one hectare with limited resources only for
household subsistence or sale.
On the other hand, Morton (2007) describes smallholder subsistence agriculture as an
activity with few inputs for the production in which the output is mainly consumed
directly by households and small proportion of the output is only marketed or sold to
generate extra income. Morton (2007: 19680) further state that smallholder subsistence
agriculture is used to denote the activity of self-provisioning with agricultural produce or
a relative move towards such activity. In some cases, smallholder subsistence farmers
mainly use off-farm activities such as remittances and social welfare grants to
supplement their on-farm activities in order to meet their household food needs.
Generally, smallholder subsistence agriculture refers mainly to rural producers in most
24
developing countries who farm on a small piece of land using mainly family labour for
production purposely for household consumption (Morton, 2007). Most of the
descriptions of smallholder subsistence agriculture have similarities and put greater
emphasis on elements such as land size, productivity, labour used and ownership as
well as production type.
Smallholder subsistence farming is one of the dominant agricultural activities with over
80 percent of the land being less than two hectares in most developing countries as well
as average livestock of ten animals (FAO, 2010; Salami et al, 2010; Zhou, 2010). The
smallholder subsistence agriculture is characterized by low levels of productivity, low
quality, lack of market, lack of farm inputs such as credit, labour and technology (Salami
et al, 2010). The sector is regarded as the main livelihood activity for majority of the
people living in rural areas. Majority of people in most developing countries around the
world live in impoverished and underdeveloped rural areas and depend directly or
indirectly mostly on agriculture for their survival.
According to Coetzee (2003), smallholder subsistence farmers derive their livelihoods
by cultivating on small pieces of land and supplementing their income and food supply.
Most households, hence, rely heavily on small plots of land which is less than two
hectares to feed their respective households and grow surplus for sale to generate extra
income which can be used to supplement household needs. As such, majority of the
worlds poorest people living in rural areas regard smallholder subsistence agriculture as
an important approach for them to move out of pervasive food poverty and hunger.
25
Machethe (2004) argues that promoting smallholder subsistence agricultural growth can
be effective strategy to address the challenges of widespread food poverty and income
inequalities consequently providing for food security of most rural households.
According to Carroll, Stern, Zook, Funes, Rastegar, and Lien (2012), there are over 450
million smallholder farms that exists in most developing countries which belongs to more
than two billion people, which include half the world’s undernourished people and the
majority of people living in food poverty. These farmers account for the largest share of
agricultural output in most African countries and South Asia. According to Zhou (2010),
Asia alone account for greater number of smallholder farms, with China comprising of
over 98 percent of smallholder farms, followed by Africa while Latin America has few
number of smallholder farms operated under two hectares of land. In India, smallholder
farms constitute over 85 percent of the total land holdings and about 42 percent of the
total cultivated land is owned by smallholder subsistence farmers, yet contribute
significantly to the national grain production in the country (Zhou, 2010). Most of the
smallholder subsistence farmers focus mostly on the production of food staples such as
maize, vegetables and rice as well as livestock such as cattle, goats, poultry and sheep
among others.
2.3. Household Food Security Trends in Rural Areas
The issue of food security has been critical in many parts of the developing world
(Sowman and Cardoso, 2010). Food security describes a situation in which people do
26
not live in hunger or fear of starvation within and outside their households. According to
FAO (2003) and Kepe and Tessaro (2012), food security exists when all people have
access to sufficient, safe and nutritious food at all times to meet their dietary needs and
food preferences for an active and healthy life. As the food poverty levels rise, the
household food insecurity is worsened. Food insecurity exists when individuals have no
adequate physical, social or economic access to food (FAO, 2010). Households with the
financial resources to escape food poverty suffer rarely from chronic hunger while poor
households not only suffer the most from chronic hunger, but also are the segment of
the population mostly at risk during food shortages and famines (FAO, 2003).
The most significant aspect of empirically and theoretically driven advancement of the
concept of food security is the awareness that food security is no longer seen simply as
a failure of agriculture to produce sufficient food at the national level, but the failure of
livelihoods to guarantee access to sufficient food at the household level (Devereux and
Maxwell, 2003). Khan and Gill (2009:3) and Omotesho et al (2010) note that achieving
food security at national level does not necessarily guarantee food security at provincial,
district or household level and emphasize the disparities that exist among and within
provinces, districts and households of a particular country. For instance, if a household
is food secure that does not mean that each member of the household is food secure
due variations in food distribution that may exist within a household (Khan and Gill,
2009). Hence, the world to be classified as food secure, all individuals at household
level should have access to adequate and nutritious food at all times. As such,
household food availability requires that food be available at all level and at all times.
27
Therefore, it is imperative for poor households to have access to economic
opportunities and resources such as land, technology, credit, education and health care
if food security is to be achieved at household level.
FAO (2003) indicates that over 850 million people around the world are classified as
chronically hungry due to the prevalence of food insecurity. This food situation is
eminent and changes from time to time with the occurrence of imbalances as a result of
problems linked to food shortages, affordability and accessibility. According to
Labadarios et al (2009), food insecurity can be categorised into two, namely chronic or
transitory in which chronic food insecurity relates to higher degree of vulnerability
associated with the consumption of inadequate or poor nutritious diet, ill-health, delayed
development as well as increased infant mortality. Hence, shortage of food compromise
the health and life expectancy of individuals as well as their physical strength which
makes it impossible to live normal healthy life. Consequently, the effects of poor health
among poorer people manifest in various ways and within households, are often
associated with diminished ability to obtain work and to generate income (Labadarios et
al, 2009: 7).
According to FAO (2006) and FAO (2010) the number of people without food remains
high particularly in the developing countries and account 98 percent of the
undernourished people. Undernourishment exists when caloric intake by individuals is
below the minimum required dietary energy. It is further estimated that over 60 percent
of the undernourished people are found in Asia alone while over 30 percent is found in
28
Africa (FAO, 2006). Furthermore, the prevalence of people who are hungrier is greater
in Africa than anywhere in the world with approximately 33 percent. The majority of
these undernourished people live in developing countries. According FAO (2010), the
problem of food insecurity remains persistent with the total number of undernourished
people exceeding one billion globally. This situation of food insecurity has been further
exacerbated by the global food crisis observed recently around the world.
Earl (2011) indicate that globally there is enough production of food but more than one
billion people still suffer from hungry due to their inability to afford food or cannot access
food supplies as a result of rising food prices. FAO (2011) reports that since the global
food crisis the world has observed significant increase in food prices for staple food
such as rice, wheat, maize and soybeans by over an average of 25 percent higher in
December 2010 than in December 2009. Nonetheless, the high number of
undernourished and hungry people is expected to decline as result of greater attention
and interventions to food security around the world. As such, the issue of food security
has since become a pivotal for international community and governments to create
strategies in line with the millennium development goals in order to address food
insecurity and hunger, consequently ensuring food security in most developing
countries (FAO, 2010).
29
2.4. Determinants and Indicators of Household Food Security in Rural Areas
In most analyses of food security conditions in most developing countries, multiple
indicators are used to reflect the various dimensions of the problem (Reily et al, 1999:
35). According to Reily et al (1999) most commonly used indicators of food security
include those related to food production, food availability, food accessesibility, food
consumption, income, food expenditure and nutritional status. Bonti-Ankomah (2001)
also indicates that the determinants of household food security frequently used include
food availability, accessibility and adequacy as well as food expenditure.
The concept of food security point to several elements such as accessesibility,
availability and adequate of food as well as nutrient intake for sustainable health (Reily
et al, 1999; Bickel et al, 2000; Jacobs, 2009). These factors are directly and indirectly
interrelated in that available food must be accessible to households and all members of
the households. Haen et al (2011) also based the measurement of household food
security on undernourishment. According to Haen et al (2011), an individual is classified
to be food insecure when an individual receives less than 2261 kilocalories per day of
the recommended daily allowance (RDA). Food insecurity may be transitory or chronic
in nature while malnutrition is seen as the most serious consequence of food insecurity
in most rural households (Iram & Butt, 2004).
30
2.4.1 Food availability
Bonti-Ankomah (2001); Coates, Frongillo, Roger, Webb, Wilde and Houser (2006);
Nyanga (2012), indicate that food availability refers to the food supply which should be
sufficient in quantity and quality and as well as providing a variety of food choices.
According to Khan and Gill (2009) food availability is when sufficient quantities of food
are available at all times to a household and all individuals of that particular household.
Hence, a household that does not have sufficient food available at their disposal is
classified as food insecure and turns to be more vulnerable to hunger and malnutrition.
Jacobs (2009: 414) suggests that food availability is a weak indicator of the nutrient
content and quality of food consumed and does not provide information on food quality
and nutrient intake.
2.4.2. Food accessibility
Access to food is when a household and all members of the household have enough
resources to acquire food and meet the nutritional requirements and dietary needs of
the household (Khan and Gill, 2009: 1). Therefore, a household to be food secure, food
at their access should be adequate both in quantity and quality at all level and at all
times. Food accessibility, through food production, is one the most important
components of food security to achieve food security at household level (Omotesho et
al, 2010). However, it should be noted that food security at the national level does not
guarantee that all the poor will have access to the food nutrition requirements due to the
31
existing regional, economic and social inequalities (Omotesho et al, 2010). Bonti-
Ankomah (2001) and Omotesho et al (2010) indicates that there may be prevalence of
food insecurity and hunger for some of the rural households due to the fact that they do
not produce sufficient food or do not purchasing power to afford their food needs.
Furthermore, food accessibility is determined by the ability of households to obtain food
from their own production, stocks and market, as well as the availability of resources
which defines the set of productive activities households can pursue in meeting their
food and other material needs (FAO, 2003). Jacobs (2009) argues that household food
security also depends mainly on household income and wealth status which may allow
these households to access food. For instance, a low-income household is more likely
to experience food shortages than a wealthier household because the latter household
will have purchasing power than the former household (Jacobs, 2009).
2.4.3. Food expenditure
Most household expenditure is spent on food. Food expenditure accounts by a large
share of the spending of poor households which makes them relatively more vulnerable
to the impacts of food prices consequently food insecurity (Jacobs, 2009; Reddy and
Moletsane, 2011). According to Bonti-Ankomah (2001), most households in rural areas
typically spend less on food than households in urban areas. This may be true since
most households in rural areas supplement their food expenditure through own food
32
production, however, other households may supplement their food consumption through
markets, remittances, grants and employment.
The size of a household also influences the amount of money spent in acquiring
household food with larger households having relatively lower household food
expenditure than sm0aller households (Bonti-Ankomah, 2001). According to Bonti-
Ankomah (2001), large household means that higher proportion of household
expenditure is allocated to supplement or meet household food needs. This may be due
to the fact that these households have the lowest incomes and are therefore more
vulnerable to food insecurity and malnutrition as well as other famines which may
compromise their well-being.
2.5. Contributions of Smallholder Subsistence Agriculture towards Rural
Household Food Security
The agricultural sector is regarded as the largest contributor to the economies of most
African countries and accounts for over 35 percent of the continents Gross Domestic
Product (GDP) as well as approximately 70 percent of employment (Nyange et al,
2011). Despite these contributions, the agricultural production has drastically declined
by over 2.3 percent over the past two decades in the continent (Nyange et al, 2011). As
such, agriculture is regarded as one of the key sector of economies in most developing
countries. The role of agriculture in the rural economy is generally acknowledged,
however there is still no consensus whether smallholder subsistence agriculture is the
33
most appropriate way to fight food insecurity in most developing countries (de Klerk et
al, 2004; Machethe, 2004; Aliber, 2005; Averbeke and Khosa, 2007).
Machethe (2004) argues that the smallholder subsistence agriculture has the ability to
provide for food security through increased food supply, employment creation and
increased farm income as well as providing for household consumption. Forum on Food
Security in Southern Africa (FFSSA) (2004) argues that agricultural smallholders are
suitable growth drivers with significant effects on food security and market expansion.
Furthermore, expanded cash crop production by smallholder subsistence farmers could
contribute to the growth of rural areas through consumption, labour demand, etc. and to
household food security through generating extra income to buy household food or
other external farm inputs to maximize production.
Machethe (2004: 2) argues that “smallholder subsistence agriculture is simply too
important to employment, human welfare, and political stability in most developing
countries to be either ignored or treated as just another small adjusting sector of a
market economy”. The significance of smallholder subsistence agricultural sector is
recognized on the basis of the sectors contribution on the wellbeing of smallholder
subsistence farmers through food poverty alleviation, household food security,
employment at local, regional or international level. FAO (2004) emphasizes that
smallholder subsistence agriculture is the key to food security in many parts of the
developing world by reducing food prices, creating employment, improving farm income
and increasing wages.
34
According to FAO (2004), experience from other countries indicates that a
comprehensive approach to the provision of support services to achieve growth in the
smallholder subsistence agricultural sector is essential. Hence, the absence of
appropriate farmer support programmes would provide smallholder subsistence farmers
with little chance of escaping food poverty, and the magnitude of agriculture’s role in
creating livelihood opportunities will remain limited. FAO (2008) supports the notion that
agriculture is one of the sectors that can play a significant role towards household food
security. It further states that the majority of people were in direct need of food,
especially in rural areas.
While the smallholder subsistence agricultural sector is acknowledged as the primary
route for achieving household food security in poor rural areas, Bonti-Ankomah (2001)
argues that for food security to exist, food must be consistently available and
accessible, and be properly utilized for consumption to meet specific dietary needs for
households. Bonti-Ankomah (2001) and Hendriks and Msaki (2009) argue that
household food security is achieved when all people have physical and economic
access to sufficient, nutritious, healthy and safe food at all times to meet their daily food
dietary needs and preferences.
2.5.1. Increased food supply
According to DFID (2004), increased food supply provides smallholder subsistence
producers with greater possibilities and provides consumers with more food choices at
35
reasonable prices through reduced food price shocks. On the basis that the majority of
rural people are engaged in smallholder subsistence production, improving the sector
increases the chances of addressing food insecurity and hunger in most rural areas
(Machethe, 2004). However, such an objective can only be attained only if the
smallholder subsistence agricultural sector is more vibrant and productive (Machethe,
2004). Agricultural growth also have the ability to reduce the prevalence of food
shortages at all levels through increased overall supply of food, creation of economic
opportunities for poor people and improved dietary diversity and quality of food
consumed by households (Lyne et al., 2009; Oni et al, 2011).
2.5.2. Increased employment opportunities
The smallholder subsistence agricultural sector has been recognized as one of the most
important sectors in employment creation in most developing countries (Baiphethi and
Jacobs, 2009). Baiphethi and Jacobs (2009) further show that accelerated smallholder
subsistence agricultural production through increased productivity could create jobs for
most household members in rural areas both on and off farm. Increasing agricultural
productivity on-farm increases the demand for labour in preparation, planting, weeding
and harvesting in most smallholder farms (DFID, 2004). According to DFID (2004),
smallholder subsistence farmers are increasingly inclined to substitute hired labour for
household labour as they are getting richer, hence generating greater job opportunities
for the poor.
36
Furthermore, increasing productivity of the smallholder farm also creates new and well-
paying jobs off-farm for the poor through linkages between agriculture and the wider
rural economy (Baiphethi and Jacobs, 2009). The combination of extra jobs within and
outside smallholder subsistence farming can have positive effects on the rural labour
market, pushing up farm wages and improving the ability of the poor to buy and access
food from markets (DFID, 2004).
2.5.3. Subsistence production
According to Kalibwani (2005), most of the smallholder subsistence farmers in
developing countries produce food mainly for subsistence purposes while small
proportions of farm produce are reserved for sale. Due to the fact that most smallholder
subsistence farmers produce mainly for their own consumption, smallholder subsistence
farmers have the potential to produce marketable food surpluses which can enable
households to feed and meet their required food needs (Kalibwani , 2005; SASIX,
2007).
2.5.4. Improved food purchasing power
Smallholder subsistence agricultural production is critical towards achieving household
food security through increased income for the majority of the rural poor which may
provide households with the ability to purchase food from market in order to supplement
and meet their food needs. The sector is regarded as a source of livelihoods for over 70
37
percent of the rural people and provides employment for the majority which
consequently generates income for their household through the sale of some food
surplus (Feynes and Meyer, 2003). Aliber (2005) indicates that agriculture can
contribute by up to 15 percent of the total household income in rural households, while
for the poorest quintile by up to 35 percent. While smallholder subsistence agriculture is
regarded as the greatest contributor towards household income by up to 40 percent in
most developing countries, giving poor people the means to access food from the
markets for household consumption which consequently enhances household food
security (FAO, 2003; Averbeke and Khosa, 2007). These incomes include income
derived from the sale of farm produce by households as well as farm wages which
consequently provide households with the means to buy food surplus from the markets.
2.5.5. Food poverty alleviation
There is no doubt about the potential role of smallholder subsistence agriculture in
alleviating food poverty. Machethe (2004) notes that smallholder subsistence agriculture
is capable of alleviating food poverty in three ways, namely: increased food supply,
employment creation and increased farm income. The Millennium Project Hunger Task
Force (2004) notes that it is conditionally feasible to decrease the proportion of hungry
people by half by 2015 line with the millennium development goals through increasing
agricultural productivity in smallholder farms. Furthermore, improving the performance
of markets is viewed as the key to solving hunger problems in most rural areas of
developing countries. It is generally agreed that such interventions are only viable if
38
policy changes create an enabling context and remove constraints to progress
(Millennium Project Hunger Task Force, 2004).
2.6. Conclusion
This chapter provided a literature review surrounding debates on the roles and
contributions of smallholder subsistence agriculture as a strategy to achieve household
food security in rural areas. However, there is no clear consensus on whether
smallholder subsistence agriculture could the most appropriate way to fight food
insecurity in developing countries. Nevertheless the role of agriculture in the rural
economies is generally acknowledged. The chapter further attempted to explore some
of the global literature on the debates concerning the merits and demerits of smallholder
subsistence agriculture and its contributions towards household food security. The
chapter further reviewed literature on the trends, determinants and indicators of food
security in rural areas of most developing countries. The commonly used determinants
and indicators of food security conditions include food production, food availability, food
accessesibility, food consumption, income, food expenditure and nutritional status of
households. The next chapter provide theoretical background from a South African
perspective.
39
Chapter 3: Smallholder Subsistence Agriculture and Household Food
Security in rural South Africa
3.1. Introduction
Smallholder subsistence agricultural sector in South Africa is regarded as one of the
main livelihood option for the majority of people living in rural areas. As such, the
majority of the poorest people living in rural areas regard smallholder subsistence
agriculture as an important strategy to move out of food poverty, consequently providing
food security for their households. Over and above, the agriculture is one the most
important sector in the South African economy for both social and economic
development as well as household food security in rural areas. This chapter discusses
the nature of smallholder subsistence agriculture and household food security in the
South African perspective. The chapter firstly provides an overview of smallholder
subsistence agriculture in the context of South Africa as well as agricultural policy
context. Furthermore, an overview of household food security in South Africa is
presented in this chapter. The status of household food security as well as the policy
context is elucidated under this chapter.
3.2. Smallholder Subsistence Agriculture in rural South Africa
This section discusses the nature of agriculture in South Africa by providing an overview
and characteristics of the sector as well as the agricultural policy frameworks.
40
3.2.1. An overview of smallholder subsistence agriculture in South Africa
The agricultural sector in South Africa is regarded as highly dualistic comprising of a
smaller number of well resourced commercial sector mainly occupied and run by white
farmers and a large number of poorly resourced smallholder subsistence sector mainly
occupied by black farmers mostly living in the former homelands (Oettle et al., 1998;
OECD, 2006; Oni, n.d; Mudhara, 2010; Chisasa and Makina, 2012). However, there is
no definite agreement about the definition of a smallholder farm. Most definitions point
the issue of farm size and which range from small to large scale (OECD, 2006).
Chamberlin (2008) and Cousins (n.d.) distinguishes smallholder subsistence farming
from commercial farming in terms of the land size, labour intensity and total capital. A
small piece of productive land with limited inputs and capital could be more productive
than a larger land which is less productivity. In most cases smallholder subsistence
agriculture is closely linked with less productive black farmers found mainly in the
former homelands who are unable to produce at commercial level (Chisasa and Makina,
2012). This in turn may create false and wrong impression about the smallholder
subsistence farming sector.
According to the 2007 census on commercial agriculture, there are approximately 60
000 commercial farmers who occupy over 87 percent of the total agricultural land which
produce about 95 percent of the agricultural output in South Africa (Oettle et al., 1998;
Statistics South Africa, 2009). However, the main focus of this study is on the
smallholder subsistence sector. According to Baiphethi and Jacobs (2009), there are
41
more than four million smallholder subsistence farmers occupying about 13 percent of
the total agricultural land in the former homelands. It is worth noting that this dualistic
nature of agricultural sector in South Africa is as a result of the discriminatory laws of
the apartheid government. The sector in South Africa accounts over 2.9 percent of the
total GDP and 10 percent of the formal employment to the country’s economy, which
makes the sector one of the most important sector of the economy because of its
contribution to food security through reduced food prices, employment creation,
increased wages and improved farm income (Oettle, 1998; Statistics South Africa,
2007; Tregurtha and Vink, 2008).
The smallholder subsistence farmers are mainly concentrated in the former homelands
and produce on 13 percent of the total agricultural land in South Africa (Aliber and Hart,
2009; Tscharntke et al., 2012). This sector regarded as impoverished and characterised
by lack of access to low farm inputs such as land and markets as well as low
productivity. According to Aliber and Hart (2009), in 1998 there were approximately 2.1
million smallholder subsistence farmers in the country. Approximately more than 240
000 farmers provide livelihood for more than million of household members and provide
temporary employment for approximately 500 000 people in the country (Aliber and
Hart, 2009:435).
According to Aliber and Hart (2009) approximately three million smallholder
subsistence farmers produce food primarily to meet their household food consumption
needs in South Africa. While smallholder subsistence farmers represents high
42
proportion in agriculture at national level, about one million people engage in
smallholder subsistence agriculture, in which 600 000 of these belongs to rural
households in Limpopo Province (Aliber and Hart, 2009). Out of those engaged in
smallholder subsistence agriculture are characterized by low productivity and
technology, engage mainly for subsistence and operates on a land of less than three
hectares (Machethe et al, 2004). Smallholder subsistence farmers are also
characterized by their unique nature of the location of the operation. Smallholder farms
are mainly located in the former homelands which are less productive and face the risk
of environmental deterioration (Aliber and Hart, 2009).
The agricultural activities in the country range from field crop production to livestock
farming as well as horticulture (Conradie, n.d). According to Conradie (n.d) field crops
mainly cultivated in the country include maize, sugar and wheat while livestock consist
mainly of poultry and beef as well as dairy. On the other hand, horticulture consists
mainly of deciduous fruits, citrus and vegetables. Hendricks and Fraser (2003) and
Conradie (n.d) indicates that 26 percent of the rural households cultivate on 12 percent
the total agricultural land for crop production and 24 percent owns livestock while only
22 percent of which is highly potential arable land in South Africa. Maize is the most
grown crop in the country followed by wheat, sorghum, sugar cane and sunflower. The
country is not self-sufficient in virtually all major agricultural products but is regarded as
a net food producer and exporter. Some smallholder subsistence farmers produce fresh
vegetables and fruits either for household consumption or for sale but in most cases is
for household consumption.
43
3.2.2. Agricultural policy frameworks in South Africa
The agricultural sector in South Africa is shaped by the policy of segregation popularly
known as the apartheid which developed discriminatory policies which limited access of
the black majority to agricultural land, financial and other government services as well
as assistance and (OECD, 2006). These discriminatory policies created wide gap and
inequalities between commercial farming practiced predominantly by white farmers and
smallholder subsistence farming practiced mostly by black farmers (OECD, 2006;
Pauw, 2007). The apartheid policies turned most of the black farmers into labourers with
subsidies channeled only to white farmers and also closing down markets to black
farmers (Pauw, 2007; Mukumbi, 2008). However, the abolishment of apartheid and the
dispensation of new democratic state in 1994 saw the country adopting agricultural
policies aimed at addressing the inequalities and legacies of the apartheid (OECD,
2006). Since then, the agricultural sector in the country has been subjected to greater
policy reforms with the deregulation of domestic markets, liberalisation of foreign trade,
lowering of agricultural support and the land reform.
Most of these policies place much emphasis on the development of smallholder
subsistence agriculture to become more commercial through improved farm inputs such
as advanced technology with the aim of producing for market sale (Oni et al., n.d).
Some of the agricultural policy reforms adopted in recent years since 1994 to address
the past injustices of apartheid include the agricultural white paper, land policies,
strategic plan for South African agriculture, market and trade liberalisation policies,
44
AgriBEE capital markets: agricultural finance, agricultural credit policy, farm input policy,
agricultural labour market reform and skills development, and water supply policy.
3.2.2.1. White Paper on Agriculture (1995)
According to Tregurtha and Vink (2008), the Agricultural White Paper was enacted in
1995 as a broad principles guiding policy development in the sector not as a traditional
policy and its principles originated from the Reconstruction and Development
Programme. The White Paper on Agriculture provides the agricultural sector with pivotal
a role in building a strong economy and addressing the past inequalities through
increased incomes and employment opportunities for the poor in South Africa (Viljoen,
2005). The White Paper identifies the following key agricultural policy goals:
building efficient and internationally competitive agricultural sector
supporting the emergence of a more diverse structure of production with a large
increase in the numbers of successful smallholder subsistence agriculture
enterprises
conserving agricultural natural resources and establish policies and institutions
for sustainable resource use
The paper also identifies core strategies as outlined in the 2001 Agricultural Strategic
Plan, to implement the policy (Viljoen, 2005), namely:
equitable access and participation strategy
a global competitiveness and profitability strategy
45
sustainable resource management strategy
3.2.2.2. Land Policies (1997)
The Land Reform and Redistribution policies were enacted to redress the inequalities in
the allocation of land caused by the apartheid government in order to provide more land
to the previously disadvantaged smallholder subsistence farmers in particular the black
majority in the former homelands through the Land Redistribution of Agricultural
Development programme (LRAD) (Oni et al, n.d). The main aim of LRAD programme is
to provide accessibility of land grants as well as agricultural land mainly to the
previously disadvantaged communities in the country. Some of the objectives
underlying this programme include the improvement of nutrition and incomes of the rural
poor, overcoming the legacy of the past racial discrimination in the farmland ownership,
stimulating growth from agriculture, creating stronger linkages between farm and off-
farm income-generating activities; and facilitating the structural change over the long
run by assisting formerly disadvantaged people who want to establish small and
medium-sized farms among others (Oni et al, n.d).
3.2.2.3. Strategic Plan for South African Agriculture (2001)
The Strategic Plan for Agriculture in South Africa flowed from the collaboration between
the government, commercial farmers’ union, Agriculture South Africa (Agri SA), and the
emerging black farmers’ union, National African Farmers’ Union (Nafu) (Tregurtha and
46
Vink, 2008). According to Tregurtha and Vink (2008:3), the Strategic Plan provided “a
common agricultural perspective to which government and industry could commit their
efforts and resources in its implementation”. The Strategic Plan (2001) identified the
vision for South African agriculture as “united and prosperous agricultural sector” and
the strategic objective as "generate equitable access and participation in a globally
competitive, profitable and sustainable agricultural sector contributing to a better life for
all."
3.2.2.4. Trade and Market Liberalisation Policies
The market was deregulated in the early 1998 with the aim of increasing market access,
promoting market efficiency and optimizing the levels of exports earnings as well as the
promotion of the viability of the agricultural sector (Viljoen, 2005, Tregurtha and Vink,
2008). The immense impact was the extensive deregulation of state agricultural
marketing schemes within the framework of the Marketing Act of 1968 as well as the
large export drives by various sectors, introduction of risk management tools, extreme
managerial burdens on producers and lack of market information (Viljoen, 2005,
Tregurtha and Vink, 2008). However, deregulation of market created opportunities for
emerging and established farmers, forced efficiency and productivity of farmers (Viljoen,
2005).
The enactment of trade policy in South Africa saw the trade restrictions been substituted
by tariffs which were downscaled, on the other hand, market access requirements, such
47
as reduction of support to agriculture became more effective in terms of the Marketing
Act of 1963 after the country became signatory the Marrakech Agreement of 1993
(Viljoen, 2005; OECD, 2006; Tregurtha and Vink, 2008). This saw an increased drive to
regional integration and important trade relations and agreements with other countries
in the international scale.
3.2.2.5. Agriculture Black Economic Empowerment (AgriBEE) (2007)
The adoption of the AgriBEE policy in 2007 came as a result of the problems linked to
market access, access to land, existing infrastructure, inputs, financing, expertise,
training and marketing. However, this problem still persists despite much efforts and the
replacement of the apartheid policy aimed the racial discrimination of black communities
in South Africa. As such, AgriBEE has since become one of the corrective measures to
address the problem of market access in the country. The AgriBEE policy emphasize
that fifty percent of the total agricultural produce sold by retailers in the country must be
procured from the previously disadvantaged farmers or producers by 2017 as a means
of improving market access for previously disadvantaged producers in the country
(Mukumbi, 2008).
The AgriBEE is aimed at setting guidelines for the promotion of enabling environment
conducive for the participation and inclusion of the previously disadvantaged black
farmers in the mainstream agricultural economy (Manona, 2005; Tregurtha and Vink,
2008). As such, the policy is aimed at the redistribution of the agricultural economy
48
among the farmers in South Africa. Hence, it should be noted that the AgriBEE policy is
not just an affirmative action tool aimed at providing special preference to the previously
disadvantaged farmers but an important approach for reengineering the socio-economic
inequalities of the apartheid epoch. The policy is also aimed at merging the two
agricultural sectors, namely commercial and smallholder subsistence, into one unified
sector through increased number of people managing, owning and controlling;
facilitating ownership and management of agricultural enterprises by workers
cooperatives and collective enterprises; human resource and skill development;
achieving equitable representation in all occupational categories and levels of the
workforce, preferential procurement, and investment in agricultural enterprises owned
and managed by black communities (Mukumbi, 2008).
3.3. Household Food Security in the rural South Africa
This section discusses household food security in South Africa. Firstly, a historical
overview of food security in South Africa is presented in order to understand the nature
of food security from a historical perspective. Furthermore, the section provides the
status and challenges of household food security as well as policy framework for food
security in South Africa.
49
3.3.1. An overview of food security in South Africa
South Africa has extremely high levels of absolute poverty, particularly in rural areas, as
compared to other middle income countries around the world (Altman et al., 2009; Earl,
2011). According to DoA (2002), food insecurity in South Africa remained non-existent
among the black majority but the situation changed due to the advent of apartheid in
1948 which created inequalities in the provision or minimal access to education, health
and social services and led to dramatic increase in the poverty level in the rural areas.
The situation was further exacerbated by the creation of homelands at the beginning of
an apartheid era in 1948 (DoA, 2002).
The issue of food security in South Africa is well documented in which majority of the
people were denied their political rights and excluded from participating in the economic
mainstream which led to extreme social inequalities and exclusion before 1994
(Labadarios et al, 2009). These inequalities during the epoch of apartheid were intense
and led to gross human rights violations as well as widespread social and economic
deprivation, including poverty and food insecurity (Labadarios et al, 2009: 11). These
inequalities in access to land, other resources and enactment of policies led to immense
household food insecurity, hunger and malnutrition in rural areas of South Africa (DoA,
2002).
The household food security situation for many poor households in rural areas has not
improved in almost two decades following the end of apartheid and the introduction of a
50
democratic state in 1994 with high recurring levels of unemployment which led to
increased poverty, hunger and malnutrition. The black majorities in the rural areas are
mostly affected and suffer from widespread food poverty while over quarter of the
population in the country is regarded as unemployed and depend mainly on some form
of social welfare grant from government. These rural people are characterized by high
levels of unemployment, increasing poverty, poor services and inadequate social safety
nets and are most likely to suffer the risk of household food insecurity, hunger and
malnutrition.
According to Bonti-Ankomah (2001), the mean energy intake of many rural people is
lower than the Required Daily Allowance (RDA) which exacerbates the incidents of
hunger and malnutrition in the country. Action Aid (2010) indicates that South Africa has
increasing levels of hunger with up to 18 percent of children living in hunger. Bonti-
Ankomah (2001) reports that over 22 percent of children under the age of nine are
stunted due to chronic malnutrition in the country with rural areas in the Bloemfontein
experiencing highest prevalence of stunting rates. Such poor dietary intake and poor
nutritional status compromise physical and mental well-being of the poor who cannot
meet their required dietary needs.
3.3.2. The state of household food security in the rural South Africa
South Africa is regarded as a major role player in the Southern African region and its
food security status is vital to the stability of the whole region (Earl, 2011: 27). Earl
(2011) indicates that out of 196 000 tons of food brought in by the World Food
51
Programme in most parts of the region, 150 000 tons was exported from South Africa.
Thus, the country has a huge responsibility to ensure food security stability in the whole
region as well as national food security (Earl, 2011).
South Africa is largely deemed a food secure nation producing enough staple foods or
having the capacity to import food in order to meet the basic nutritional requirements of
the whole nation but the same cannot be said about households in rural areas (Bonti-
Ankomah, 2001; Du Toit, 2011; Earl, 2011; Koch, 2011). South Africa is regarded as
food self-sufficient in almost all the major food product with the ability to import
shortages when deemed necessary (DoA, 2002; Du Toit, 2011; Koch, 2011). Du Toit
(2011) further reports that the country has been able to meet the food needs from
domestic production over the past years. According to DoA (2002), the country has also
managed to meet the needs for its main staple food with maize by over 100 percent,
wheat by 95 percent, livestock by 96 percent and dairy products by 100 percent from
domestic resources.
Despite the success of food security at the national level and self-sufficiency in food
production, there is still minimal food security at household level in South Africa,
accompanied by considerable levels of household food insecurity. According to DoA
(2002); de Klerk et al (2004); Altman, Hart and Jacobs (2009) approximately 14.3 million
South Africans at household level are vulnerable to food insecurity and remains food
insecure in the modern day. This vulnerability is most prevalent among people living in
the rural areas, especially the former homelands which place food security of the poor
52
under serious threat (de Klerk et al, 2004; Averbeke and Khosa, 2007). These adverse
conditions such as food poverty, food insecurity, hunger and malnutrition have placed
severe pressure on ordinary South African citizens already struggling to meet their basic
household food needs (Labadarios et al, 2009).
Hart et al (2009) and Jacobs (2009) indicate that food insecurity is a serious challenge
that still persists in South Africa despite years of democracy. According to Labadarios et
al (2009: 11) over 57 percent of the population in the country still lives below the poverty
line meaning that they spend some days in a week without food. Du Toit (2011) reveals
that South Africa has been able to meet the food needs of its growing population over
the past years but the food security condition at household level is not the same as at
national level in rural areas of South Africa. Aliber (2009); Hart (2009) and Jacobs
(2009) also reported that about 35 percent of the total population was vulnerable to food
insecurity with women, children and the elderly being the most vulnerable. The General
Household Survey (GHS) reported that over 20 percent of households in South Africa
have inadequate access to food (Stats SA, 2009).
The GHS report further indicates that during 2008, food access problems were mostly
serious in Free State Province, where 33.5 percent of the households have inadequate
food access followed by Kwazulu-Natal with 23 percent, Eastern Cape with 21,4 percent
and Mpumalanga with 21,5 percent. Limpopo and Western Cape had the least food
security problems in 2008 with 11,9 and 14,5 percent respectively (Stats SA, 2009).
Furthermore, one third of all households spent less than R1000 per month on food and
53
only 18 percent spent over R3500 per month (DoA, 2002; Hart, 2009; Jacobs, 2009).
The high unequal income distribution in South Africa means that there are large number
of poor food insecure households which cannot afford to access food.
According to DoA (2002) over 39 percent of the population in South Africa did not
manage to meet the daily energy requirement of 2000 kcal/day. The cause of hunger
and malnutrition in South Africa is not due to the fact that there is shortage of food but
rather inadequate access to sufficient and healthy food at household level. DoA (2002)
argues that food insecurity is not a short term event, but is rather a continuous threat for
more than a third of the population. As a result, food security became one of the top
priorities for government to eradicate food insecurity, hunger and malnutrition through
increased spending on social programmes. Feeding schemes, child support grants, free
health services for children and pregnant and lactating women, pension funds,
provincial public works programmes and community food garden initiatives were all
introduced as ways to improve household food security (DoA, 2002).
However, most of these programmes had unsatisfying results and led to the formulation
of National Food Security Strategy. The vision of the national food security strategy was
to attain universal physical, social and economic access to sufficient, safe and nutritious
food at all times by all citizens in the country in order to meet their dietary and food
preferences for an active and healthy life (DoA, 2002; Hart, 2009). The challenge is
ensuring enough food is available now and in the future in order to ensure access to
sufficient food, optimal choices for nutritious and safe food as well as ensuring adequate
54
social safety nets and food emergency systems. Food insecurity is manifested by
inadequate and unstable food supplies, lack of purchasing power, weak institutional
support networks, poor nutrition, inadequate safety nets, weak food management
systems, unemployment and rising food prices (Koch, 2011).
3.3.3. Policy and legislative frameworks for food security in South Africa
The inability of South Africa to meet basic needs at the household level has its variety of
causes however poverty and hunger are particularly shaped by the apartheid legacy
(DoA, 2002; Koch, 2011). According to Koch (2011) one aspect of the apartheid era
was the deliberate dispossession of assets such as land and livestock from members of
the black majority in the former homelands while denying them opportunities to develop,
access to markets, infrastructure and human capital. Furthermore, until 1985
agricultural policies in South Africa pursued self-sufficiency consequently protecting only
commercial farm production, often at the cost of consumers. This led to a total welfare
loss for the country as a whole. Post-apartheid policies including the Integrated Food
Security Strategy (IFSS), Reconstruction and Development Programme (RDP), Rural
Development Strategy, Land Reform and Redistribution were developed to address the
adverse impact of apartheid. Some of these policies were also aimed at addressing the
challenges of poverty and food insecurity in rural areas.
The right of access to sufficient food is enshrined in section 27 of the South African
Constitution. The Constitution obliges the state to provide legislation and other
supporting measures to ensure that all citizens are enabled to meet their basic food
55
needs (DoA, 2002; Koch, 2011). The advent of democracy in 1994 saw the government
identifying food security as a top priority and has increased spending on social
programmes. Feeding schemes, child support grants, free health services for children
up to 6 years and for pregnant and lactating women, pension funds, provincial public
works programmes and community food garden initiatives were all introduced as ways
to improve household food security (Koch, 2011). The strategic framework for action to
achieve food security was first outlined in the Reconstruction and Development
Programme (RDP) of 1994, which identified food security as a basic human need.
However, most of these programmes had unsatisfactory results. As a result a National
Food Security Strategy was formulated in the year 2000.
In 2000, the government decided to launch an updated national food security strategy to
streamline, harmonise and integrate diverse food security sub-programmes in South
Africa into Integrated Food Security Strategy (IFSS). The vision of the IFSS is to attain
universal and sustainable access to a minimum daily, safe and nutritious food for a
healthy, active and better life for all the people of South Africa (DoA, 2002; Koch, 2011).
One of the main dimensions of the IFSS is to eradicate widespread inequalities and
grinding poverty amongst the majority of households. Poverty is manifested by
inadequate and unstable food supplies, lack of purchasing power, weak institutional
support networks, poor nutrition, inadequate safety nets, weak food management
systems and unemployment (DoA, 2002; Koch 2011). According to Stats SA (2000),
about 35 percent of the total population in South Africa is currently vulnerable to food
insecurity.
56
As a result of the statistical revelation, the South African cabinet announced in 2002,
urgent government measures to reduce the effects of escalating food prices on poverty
stricken and low-income groups, thus giving rise to increased food insecurity. The
government acknowledges that food relief is a short-term response to save lives and
stem chronic food insecurity, hence accepted the necessity of linking the food relief
scheme to medium and long-term self-sufficiency, sustainability and reduced
dependency on food relief by vulnerable communities (DoA 2002). The Agricultural
starter packs (ASP) which is part of food production was introduced for implementation
as a medium measure which complements the first phase, that is to say, food parcel
scheme. According to DoA (2002), the overall objective of the Agricultural starter packs
is to provide the starter up support to newly established and existing expanding
operations to increase and sustain production either for own consumption, employment
and income generation.
In addition, the Department of Agriculture established Special Programme for Food
Security in order to establish short-term food programmes such as food gardens to
augment food shortages in rural households and to sustain long-term food security in
the country (Koch, 2011). There is an absence of legislation which clearly defines the
authority, responsibility, organizational structure and working procedures for the IFSS.
According to Koch (2011), the absence of a food security policy and the inability to get a
bill tabled and passed prevents the government from providing a clear line of authority
and the current IFSS lacks political clout to make immense difference to food security in
South Africa. As a result, food security in South Africa is an issue of critical importance.
57
3.4. Conclusion
This chapter examined the smallholder subsistence agriculture and household food
security within the context of South Africa. The country has a dual agricultural sector
with developed commercial and less developed smallholder sector. Smallholder
subsistence agriculture is regarded as one of the major livelihood activity for the
majority of the people in rural areas and as one of the most important sector of the
economy. The chapter also discussed pieces of legislations and policies of both
smallholder subsistence agricultural sector and food security in South Africa.
Household food security is non-existent for the majority of the people at rural and
household level despite the fact that the country being food secure and self-sufficient in
food production at national level.
58
Chapter 4: Research Findings, Analysis and Interpretation
4.1. Introduction
This chapter presents the results of the analyses of the acquired data. The chapter
begins with the presentation of an analysis of the demographic and socio-economic
characteristics of the smallholder subsistence agriculture in Maroteng Village. Results of
descriptive analysis are also presented. The chapter further presents the analysis and
interpretation of the indicators and determinants of household food security in the study
area. This will be followed by the merits and demerits of smallholder subsistence
agricultural sector which will allow the understanding of the contribution of smallholder
subsistence agriculture towards household food security in Maroteng Village.
4.2. Types and Characteristics of Smallholder Subsistence Agriculture in
Maroteng Village
This section presents the research findings on the demographic and socio-economic
characteristics of the respondents on the phenomenon under study. The section begins
with the demographic characteristics followed by the socio-economic characteristics. In
both cases, summary tables and graphs of respective variables are presented while
detailed analysis and interpretation are made on variables requiring any further
interpretation in order to draw meaning from the responses.
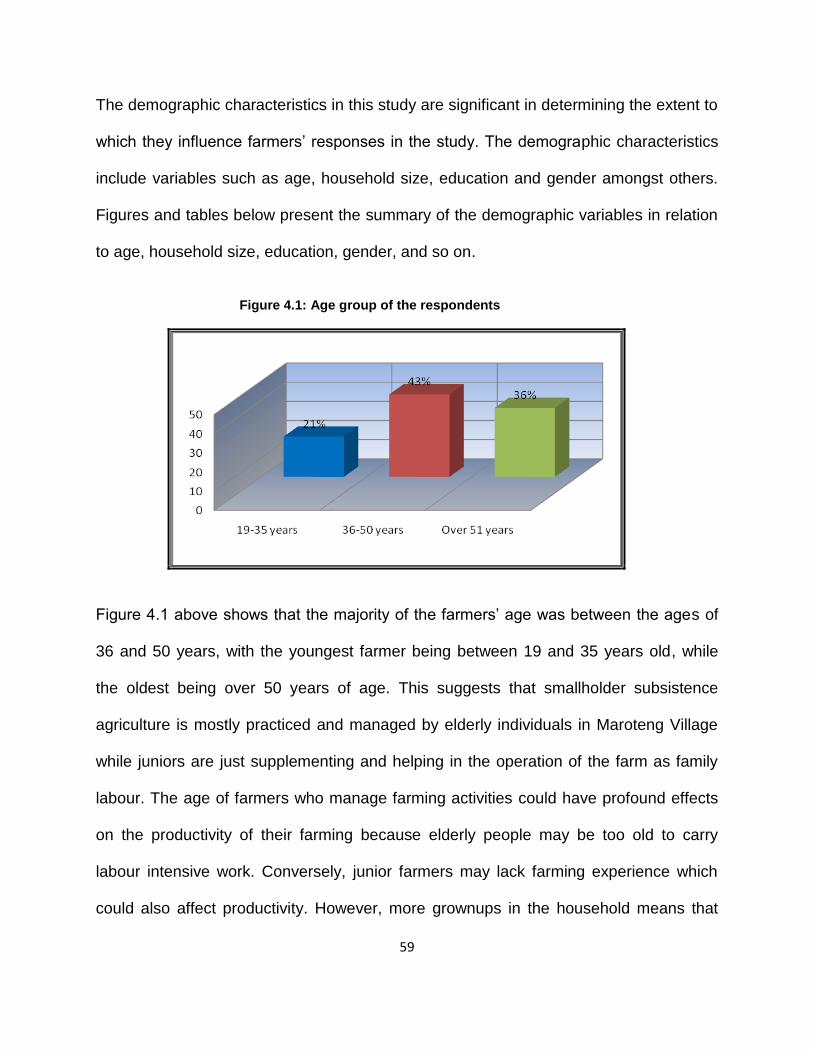
59
The demographic characteristics in this study are significant in determining the extent to
which they influence farmers’ responses in the study. The demographic characteristics
include variables such as age, household size, education and gender amongst others.
Figures and tables below present the summary of the demographic variables in relation
to age, household size, education, gender, and so on.
Figure 4.1: Age group of the respondents
Figure 4.1 above shows that the majority of the farmers’ age was between the ages of
36 and 50 years, with the youngest farmer being between 19 and 35 years old, while
the oldest being over 50 years of age. This suggests that smallholder subsistence
agriculture is mostly practiced and managed by elderly individuals in Maroteng Village
while juniors are just supplementing and helping in the operation of the farm as family
labour. The age of farmers who manage farming activities could have profound effects
on the productivity of their farming because elderly people may be too old to carry
labour intensive work. Conversely, junior farmers may lack farming experience which
could also affect productivity. However, more grownups in the household means that
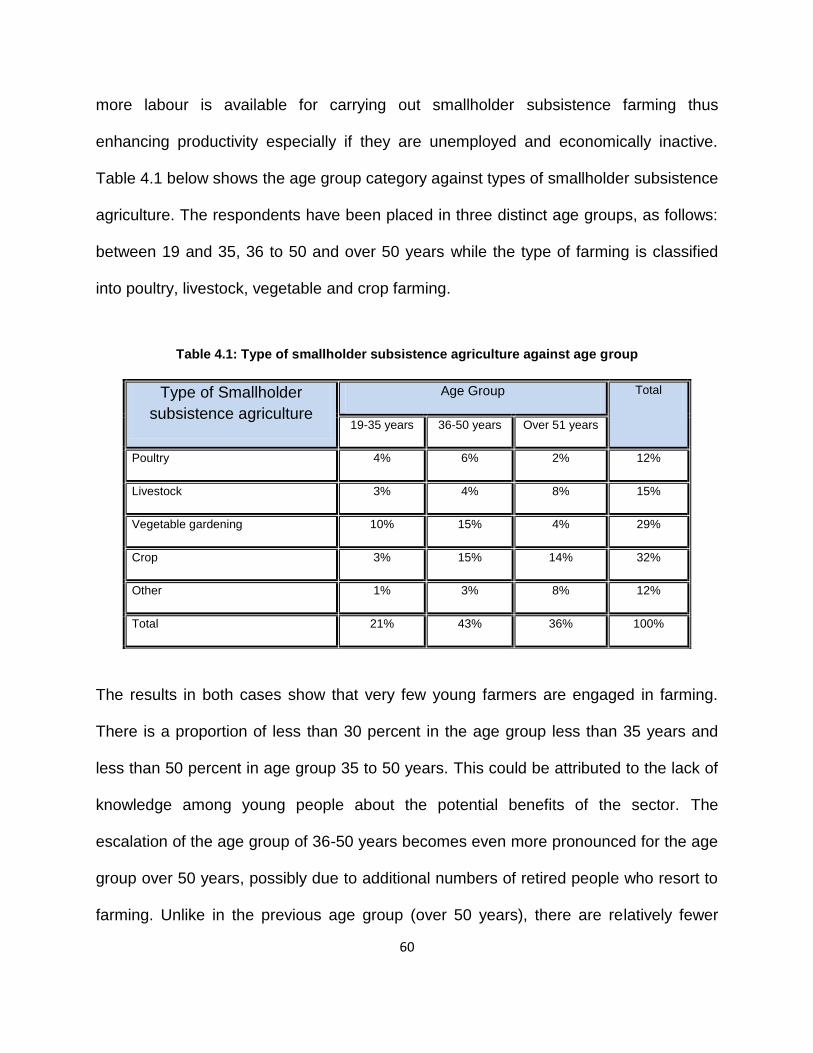
60
more labour is available for carrying out smallholder subsistence farming thus
enhancing productivity especially if they are unemployed and economically inactive.
Table 4.1 below shows the age group category against types of smallholder subsistence
agriculture. The respondents have been placed in three distinct age groups, as follows:
between 19 and 35, 36 to 50 and over 50 years while the type of farming is classified
into poultry, livestock, vegetable and crop farming.
Table 4.1: Type of smallholder subsistence agriculture against age group
The results in both cases show that very few young farmers are engaged in farming.
There is a proportion of less than 30 percent in the age group less than 35 years and
less than 50 percent in age group 35 to 50 years. This could be attributed to the lack of
knowledge among young people about the potential benefits of the sector. The
escalation of the age group of 36-50 years becomes even more pronounced for the age
group over 50 years, possibly due to additional numbers of retired people who resort to
farming. Unlike in the previous age group (over 50 years), there are relatively fewer
Type of Smallholder
subsistence agriculture
Age Group Total
19-35 years 36-50 years Over 51 years
Poultry 4% 6% 2% 12%
Livestock 3% 4% 8% 15%
Vegetable gardening 10% 15% 4% 29%
Crop 3% 15% 14% 32%
Other 1% 3% 8% 12%
Total 21% 43% 36% 100%
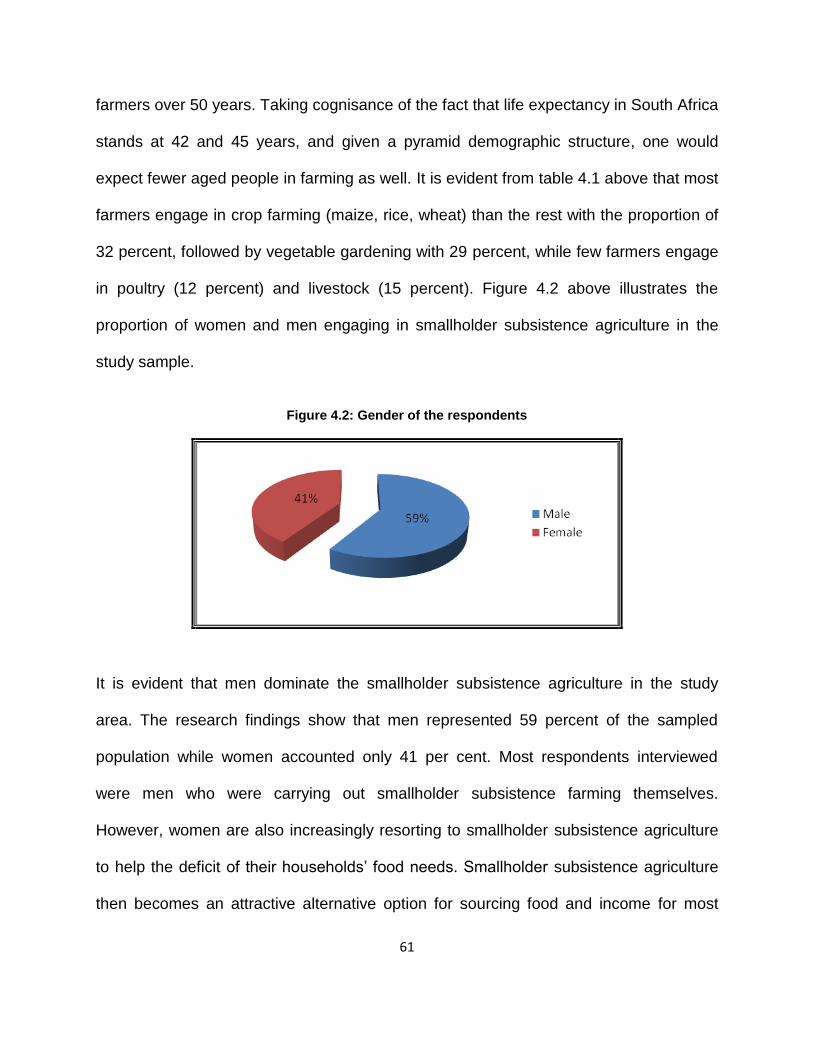
61
farmers over 50 years. Taking cognisance of the fact that life expectancy in South Africa
stands at 42 and 45 years, and given a pyramid demographic structure, one would
expect fewer aged people in farming as well. It is evident from table 4.1 above that most
farmers engage in crop farming (maize, rice, wheat) than the rest with the proportion of
32 percent, followed by vegetable gardening with 29 percent, while few farmers engage
in poultry (12 percent) and livestock (15 percent). Figure 4.2 above illustrates the
proportion of women and men engaging in smallholder subsistence agriculture in the
study sample.
Figure 4.2: Gender of the respondents
It is evident that men dominate the smallholder subsistence agriculture in the study
area. The research findings show that men represented 59 percent of the sampled
population while women accounted only 41 per cent. Most respondents interviewed
were men who were carrying out smallholder subsistence farming themselves.
However, women are also increasingly resorting to smallholder subsistence agriculture
to help the deficit of their households’ food needs. Smallholder subsistence agriculture
then becomes an attractive alternative option for sourcing food and income for most
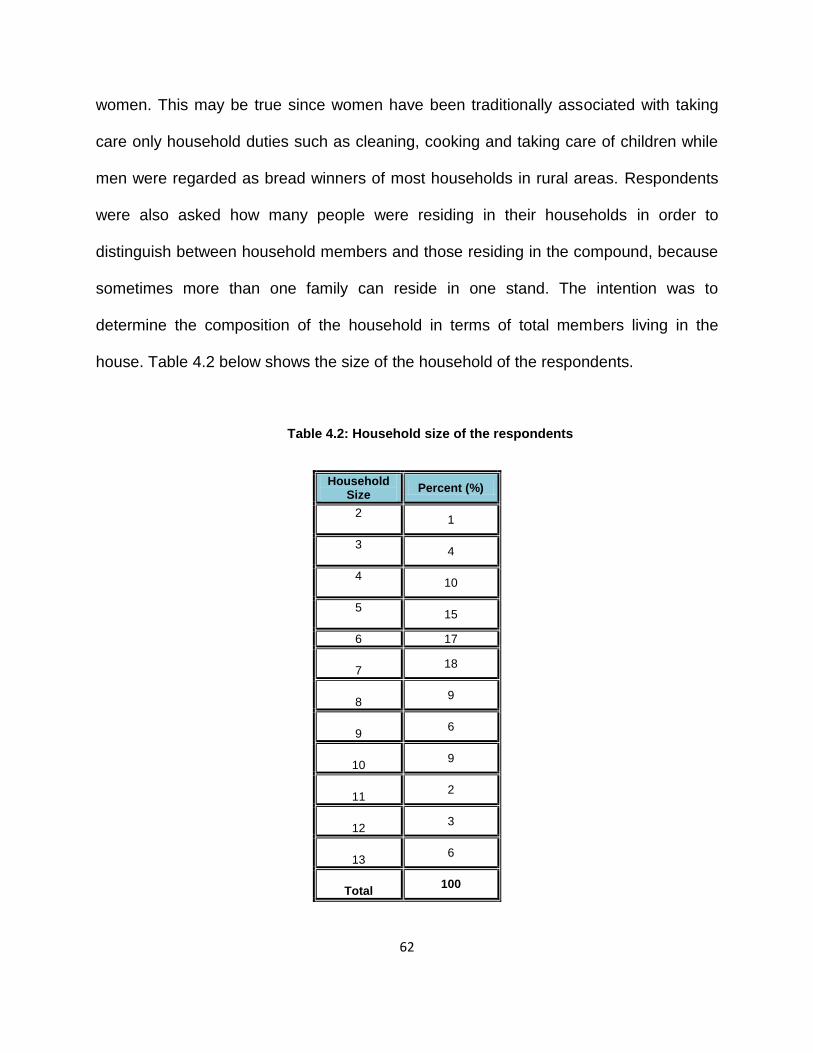
62
women. This may be true since women have been traditionally associated with taking
care only household duties such as cleaning, cooking and taking care of children while
men were regarded as bread winners of most households in rural areas. Respondents
were also asked how many people were residing in their households in order to
distinguish between household members and those residing in the compound, because
sometimes more than one family can reside in one stand. The intention was to
determine the composition of the household in terms of total members living in the
house. Table 4.2 below shows the size of the household of the respondents.
Table 4.2: Household size of the respondents
Household Size
Percent (%)
2
1
3
4
4
10
5
15
6 17
7
18
8
9
9
6
10
9
11
2
12
3
13
6
Total
100
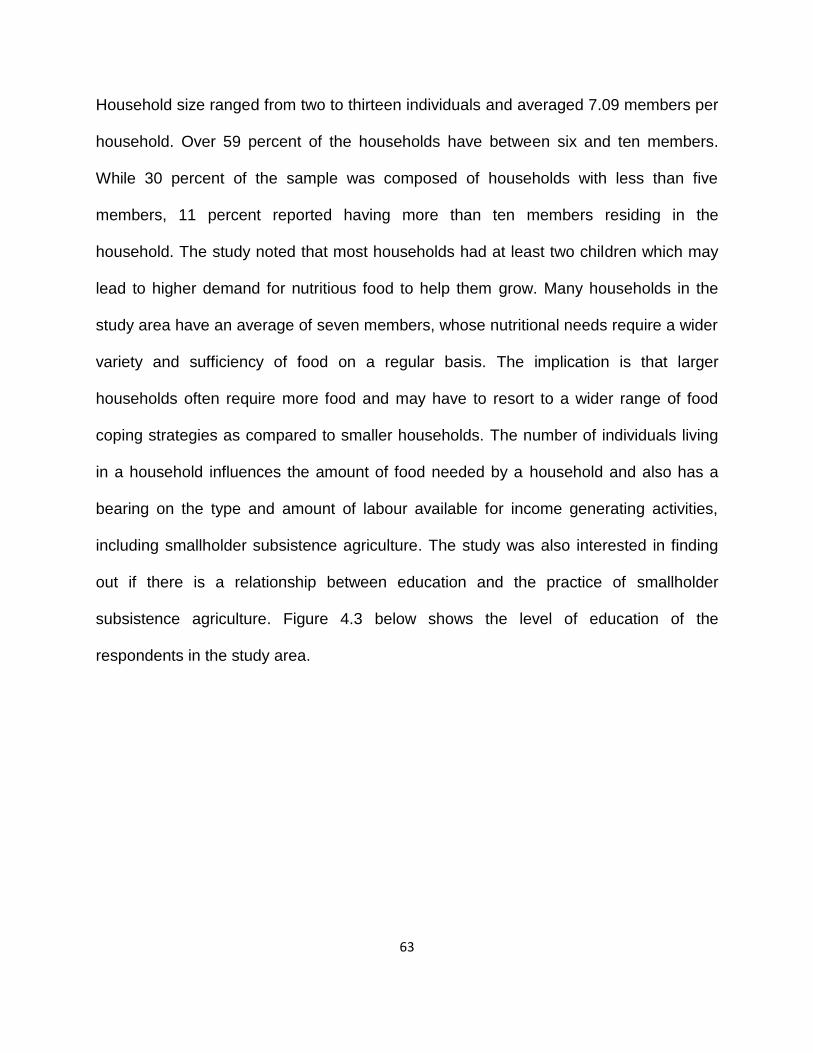
63
Household size ranged from two to thirteen individuals and averaged 7.09 members per
household. Over 59 percent of the households have between six and ten members.
While 30 percent of the sample was composed of households with less than five
members, 11 percent reported having more than ten members residing in the
household. The study noted that most households had at least two children which may
lead to higher demand for nutritious food to help them grow. Many households in the
study area have an average of seven members, whose nutritional needs require a wider
variety and sufficiency of food on a regular basis. The implication is that larger
households often require more food and may have to resort to a wider range of food
coping strategies as compared to smaller households. The number of individuals living
in a household influences the amount of food needed by a household and also has a
bearing on the type and amount of labour available for income generating activities,
including smallholder subsistence agriculture. The study was also interested in finding
out if there is a relationship between education and the practice of smallholder
subsistence agriculture. Figure 4.3 below shows the level of education of the
respondents in the study area.
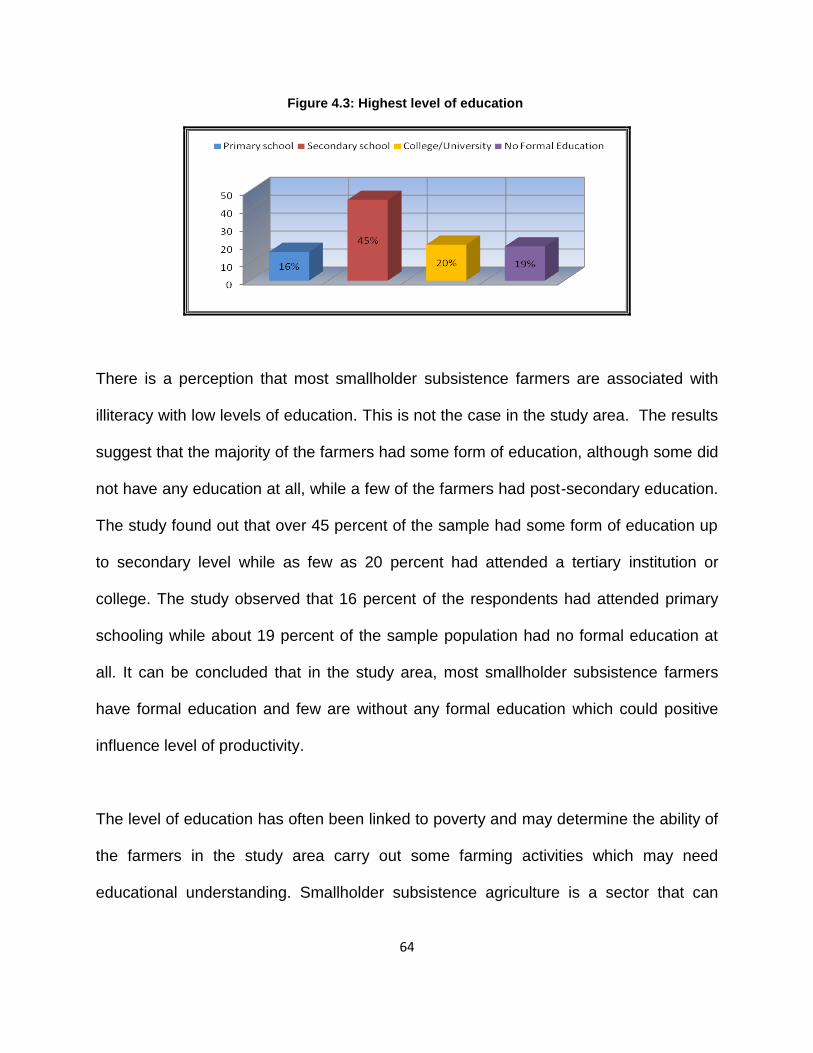
64
Figure 4.3: Highest level of education
There is a perception that most smallholder subsistence farmers are associated with
illiteracy with low levels of education. This is not the case in the study area. The results
suggest that the majority of the farmers had some form of education, although some did
not have any education at all, while a few of the farmers had post-secondary education.
The study found out that over 45 percent of the sample had some form of education up
to secondary level while as few as 20 percent had attended a tertiary institution or
college. The study observed that 16 percent of the respondents had attended primary
schooling while about 19 percent of the sample population had no formal education at
all. It can be concluded that in the study area, most smallholder subsistence farmers
have formal education and few are without any formal education which could positive
influence level of productivity.
The level of education has often been linked to poverty and may determine the ability of
the farmers in the study area carry out some farming activities which may need
educational understanding. Smallholder subsistence agriculture is a sector that can
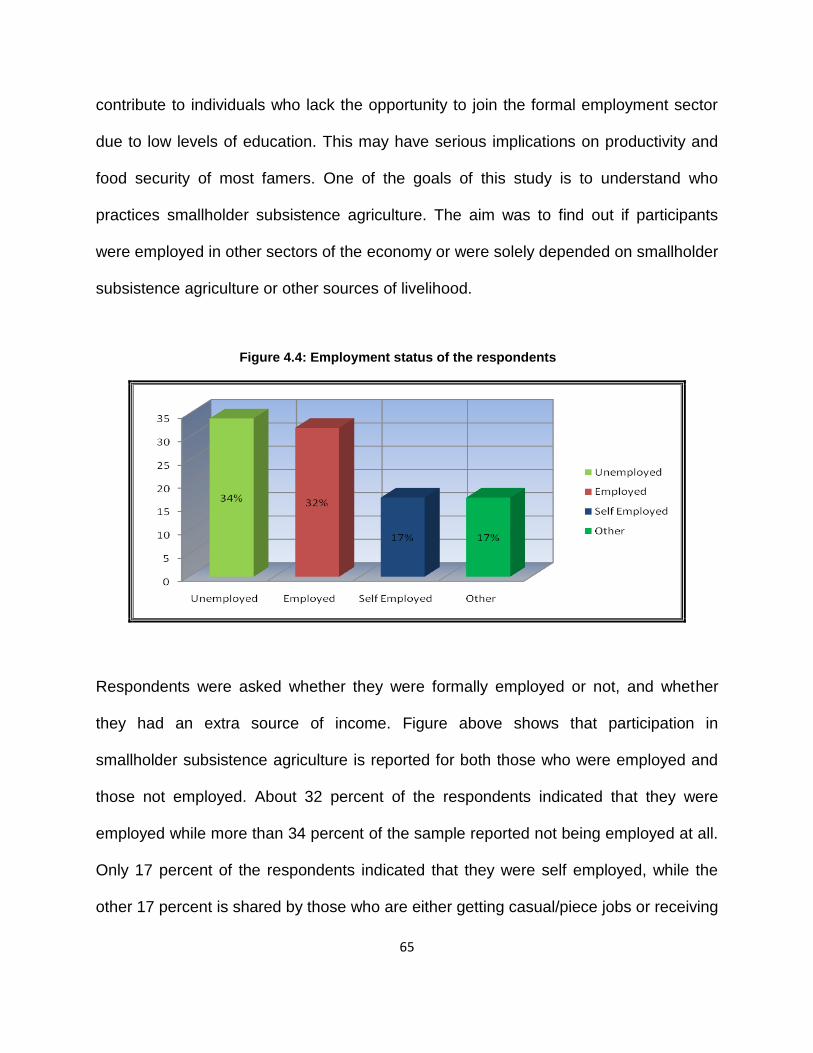
65
contribute to individuals who lack the opportunity to join the formal employment sector
due to low levels of education. This may have serious implications on productivity and
food security of most famers. One of the goals of this study is to understand who
practices smallholder subsistence agriculture. The aim was to find out if participants
were employed in other sectors of the economy or were solely depended on smallholder
subsistence agriculture or other sources of livelihood.
Figure 4.4: Employment status of the respondents
Respondents were asked whether they were formally employed or not, and whether
they had an extra source of income. Figure above shows that participation in
smallholder subsistence agriculture is reported for both those who were employed and
those not employed. About 32 percent of the respondents indicated that they were
employed while more than 34 percent of the sample reported not being employed at all.
Only 17 percent of the respondents indicated that they were self employed, while the
other 17 percent is shared by those who are either getting casual/piece jobs or receiving
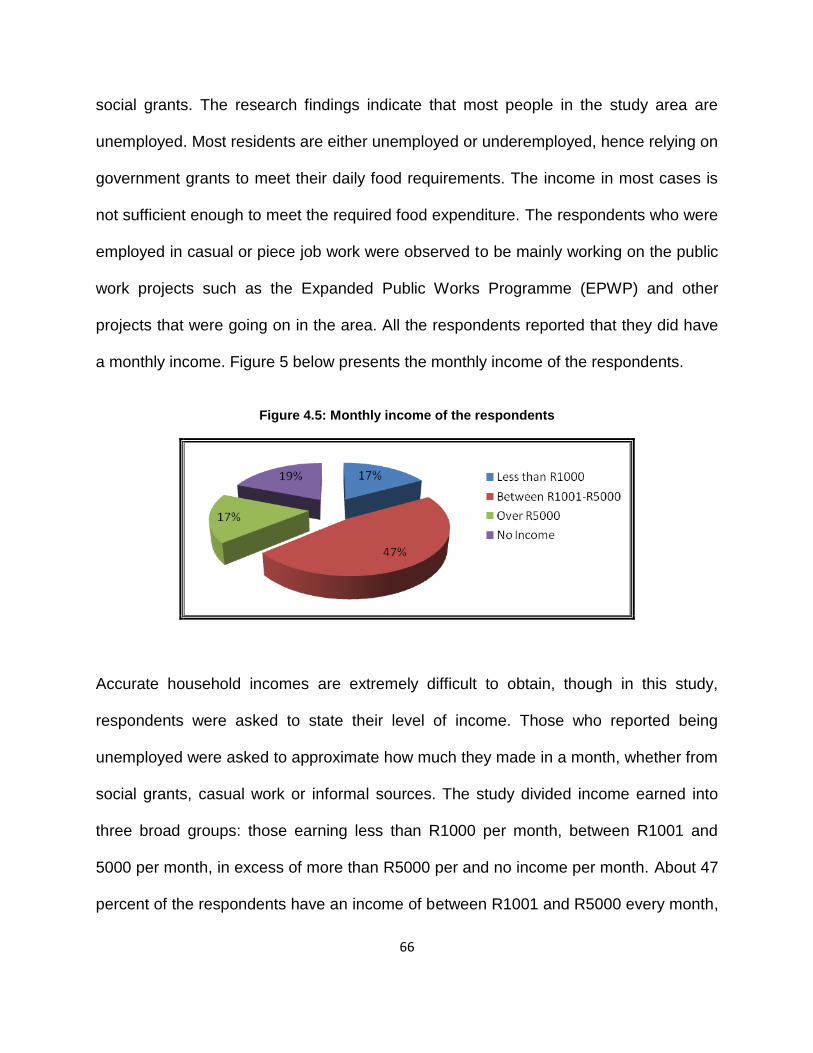
66
social grants. The research findings indicate that most people in the study area are
unemployed. Most residents are either unemployed or underemployed, hence relying on
government grants to meet their daily food requirements. The income in most cases is
not sufficient enough to meet the required food expenditure. The respondents who were
employed in casual or piece job work were observed to be mainly working on the public
work projects such as the Expanded Public Works Programme (EPWP) and other
projects that were going on in the area. All the respondents reported that they did have
a monthly income. Figure 5 below presents the monthly income of the respondents.
Figure 4.5: Monthly income of the respondents
Accurate household incomes are extremely difficult to obtain, though in this study,
respondents were asked to state their level of income. Those who reported being
unemployed were asked to approximate how much they made in a month, whether from
social grants, casual work or informal sources. The study divided income earned into
three broad groups: those earning less than R1000 per month, between R1001 and
5000 per month, in excess of more than R5000 per and no income per month. About 47
percent of the respondents have an income of between R1001 and R5000 every month,
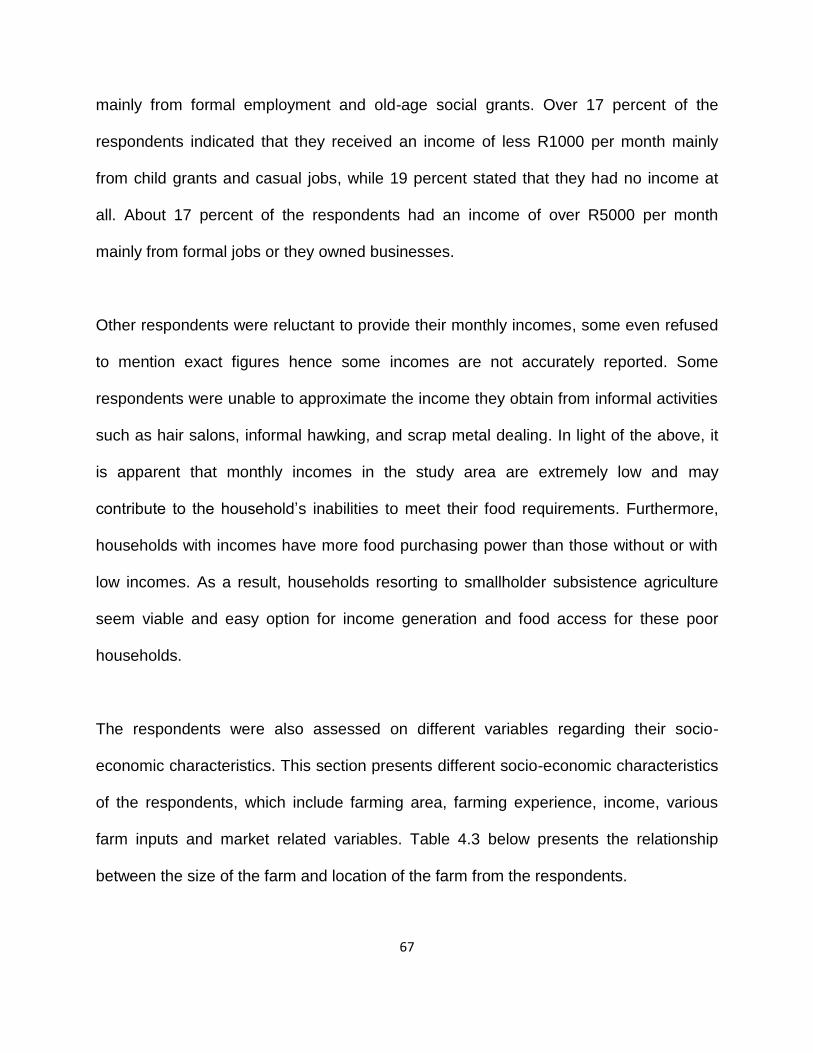
67
mainly from formal employment and old-age social grants. Over 17 percent of the
respondents indicated that they received an income of less R1000 per month mainly
from child grants and casual jobs, while 19 percent stated that they had no income at
all. About 17 percent of the respondents had an income of over R5000 per month
mainly from formal jobs or they owned businesses.
Other respondents were reluctant to provide their monthly incomes, some even refused
to mention exact figures hence some incomes are not accurately reported. Some
respondents were unable to approximate the income they obtain from informal activities
such as hair salons, informal hawking, and scrap metal dealing. In light of the above, it
is apparent that monthly incomes in the study area are extremely low and may
contribute to the household’s inabilities to meet their food requirements. Furthermore,
households with incomes have more food purchasing power than those without or with
low incomes. As a result, households resorting to smallholder subsistence agriculture
seem viable and easy option for income generation and food access for these poor
households.
The respondents were also assessed on different variables regarding their socio-
economic characteristics. This section presents different socio-economic characteristics
of the respondents, which include farming area, farming experience, income, various
farm inputs and market related variables. Table 4.3 below presents the relationship
between the size of the farm and location of the farm from the respondents.
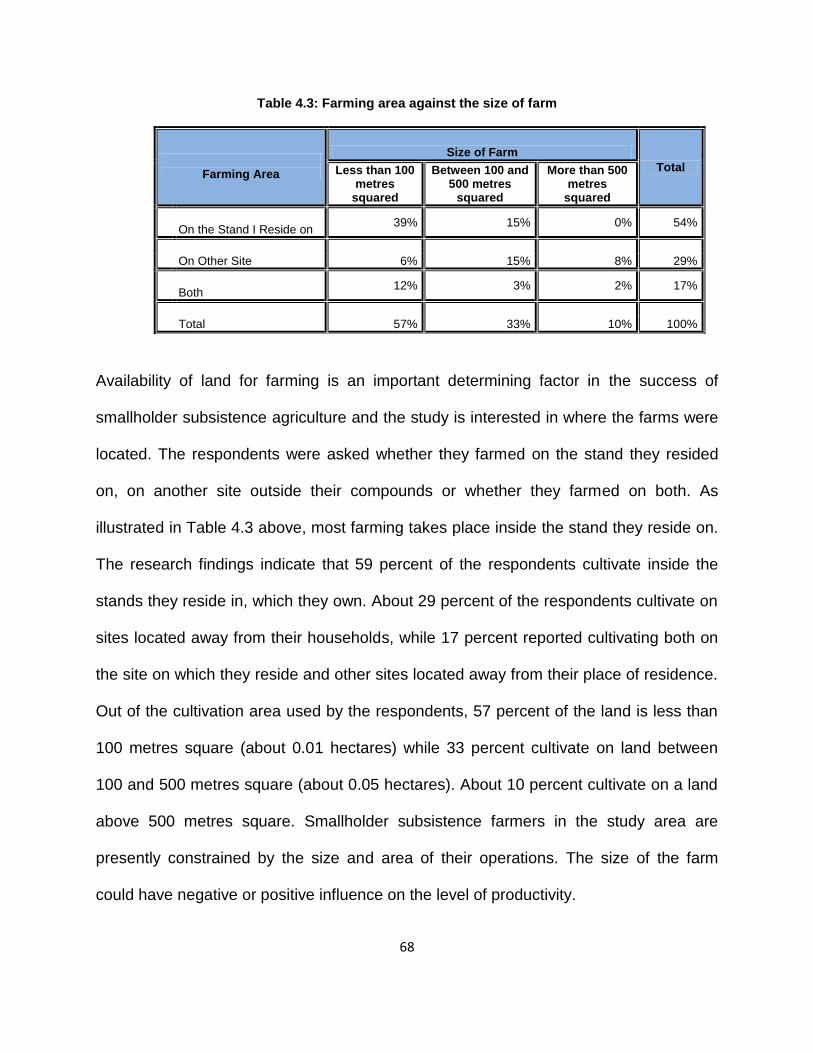
68
Table 4.3: Farming area against the size of farm
Availability of land for farming is an important determining factor in the success of
smallholder subsistence agriculture and the study is interested in where the farms were
located. The respondents were asked whether they farmed on the stand they resided
on, on another site outside their compounds or whether they farmed on both. As
illustrated in Table 4.3 above, most farming takes place inside the stand they reside on.
The research findings indicate that 59 percent of the respondents cultivate inside the
stands they reside in, which they own. About 29 percent of the respondents cultivate on
sites located away from their households, while 17 percent reported cultivating both on
the site on which they reside and other sites located away from their place of residence.
Out of the cultivation area used by the respondents, 57 percent of the land is less than
100 metres square (about 0.01 hectares) while 33 percent cultivate on land between
100 and 500 metres square (about 0.05 hectares). About 10 percent cultivate on a land
above 500 metres square. Smallholder subsistence farmers in the study area are
presently constrained by the size and area of their operations. The size of the farm
could have negative or positive influence on the level of productivity.
Farming Area
Size of Farm
Total Less than 100 metres
squared
Between 100 and 500 metres
squared
More than 500 metres
squared
On the Stand I Reside on
39% 15% 0% 54%
On Other Site 6% 15% 8% 29%
Both
12% 3% 2% 17%
Total 57% 33% 10% 100%
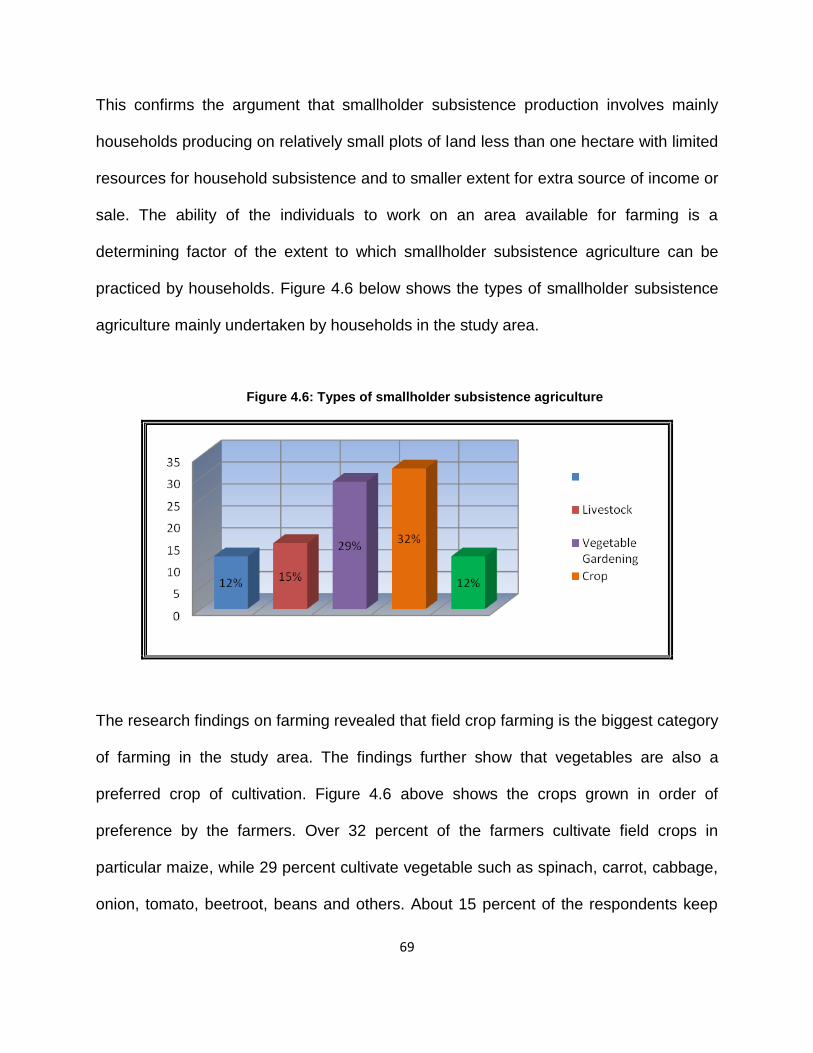
69
This confirms the argument that smallholder subsistence production involves mainly
households producing on relatively small plots of land less than one hectare with limited
resources for household subsistence and to smaller extent for extra source of income or
sale. The ability of the individuals to work on an area available for farming is a
determining factor of the extent to which smallholder subsistence agriculture can be
practiced by households. Figure 4.6 below shows the types of smallholder subsistence
agriculture mainly undertaken by households in the study area.
Figure 4.6: Types of smallholder subsistence agriculture
The research findings on farming revealed that field crop farming is the biggest category
of farming in the study area. The findings further show that vegetables are also a
preferred crop of cultivation. Figure 4.6 above shows the crops grown in order of
preference by the farmers. Over 32 percent of the farmers cultivate field crops in
particular maize, while 29 percent cultivate vegetable such as spinach, carrot, cabbage,
onion, tomato, beetroot, beans and others. About 15 percent of the respondents keep
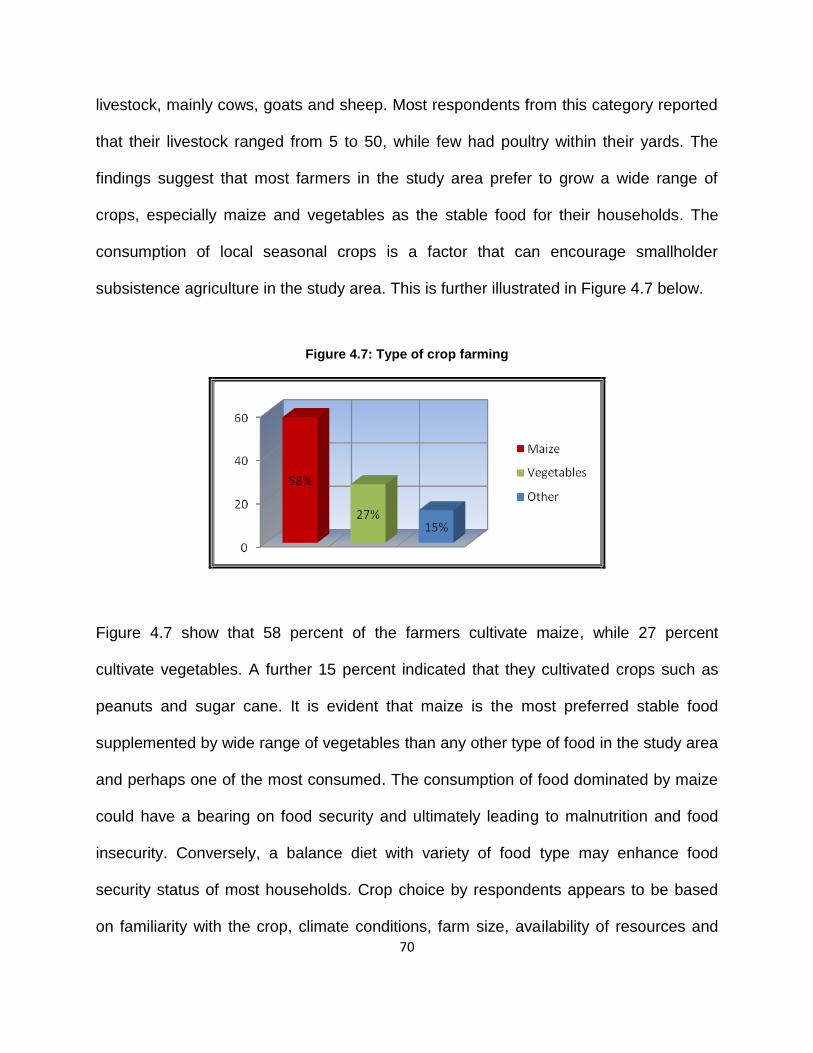
70
livestock, mainly cows, goats and sheep. Most respondents from this category reported
that their livestock ranged from 5 to 50, while few had poultry within their yards. The
findings suggest that most farmers in the study area prefer to grow a wide range of
crops, especially maize and vegetables as the stable food for their households. The
consumption of local seasonal crops is a factor that can encourage smallholder
subsistence agriculture in the study area. This is further illustrated in Figure 4.7 below.
Figure 4.7: Type of crop farming
Figure 4.7 show that 58 percent of the farmers cultivate maize, while 27 percent
cultivate vegetables. A further 15 percent indicated that they cultivated crops such as
peanuts and sugar cane. It is evident that maize is the most preferred stable food
supplemented by wide range of vegetables than any other type of food in the study area
and perhaps one of the most consumed. The consumption of food dominated by maize
could have a bearing on food security and ultimately leading to malnutrition and food
insecurity. Conversely, a balance diet with variety of food type may enhance food
security status of most households. Crop choice by respondents appears to be based
on familiarity with the crop, climate conditions, farm size, availability of resources and
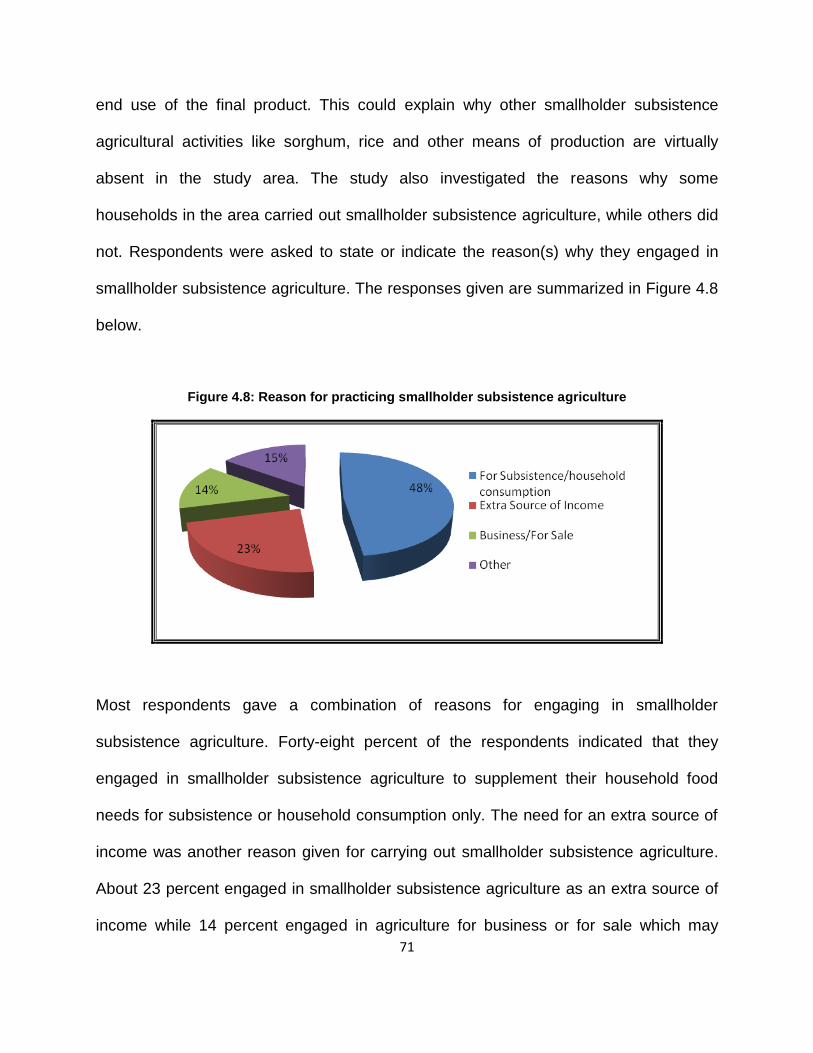
71
end use of the final product. This could explain why other smallholder subsistence
agricultural activities like sorghum, rice and other means of production are virtually
absent in the study area. The study also investigated the reasons why some
households in the area carried out smallholder subsistence agriculture, while others did
not. Respondents were asked to state or indicate the reason(s) why they engaged in
smallholder subsistence agriculture. The responses given are summarized in Figure 4.8
below.
Figure 4.8: Reason for practicing smallholder subsistence agriculture
Most respondents gave a combination of reasons for engaging in smallholder
subsistence agriculture. Forty-eight percent of the respondents indicated that they
engaged in smallholder subsistence agriculture to supplement their household food
needs for subsistence or household consumption only. The need for an extra source of
income was another reason given for carrying out smallholder subsistence agriculture.
About 23 percent engaged in smallholder subsistence agriculture as an extra source of
income while 14 percent engaged in agriculture for business or for sale which may
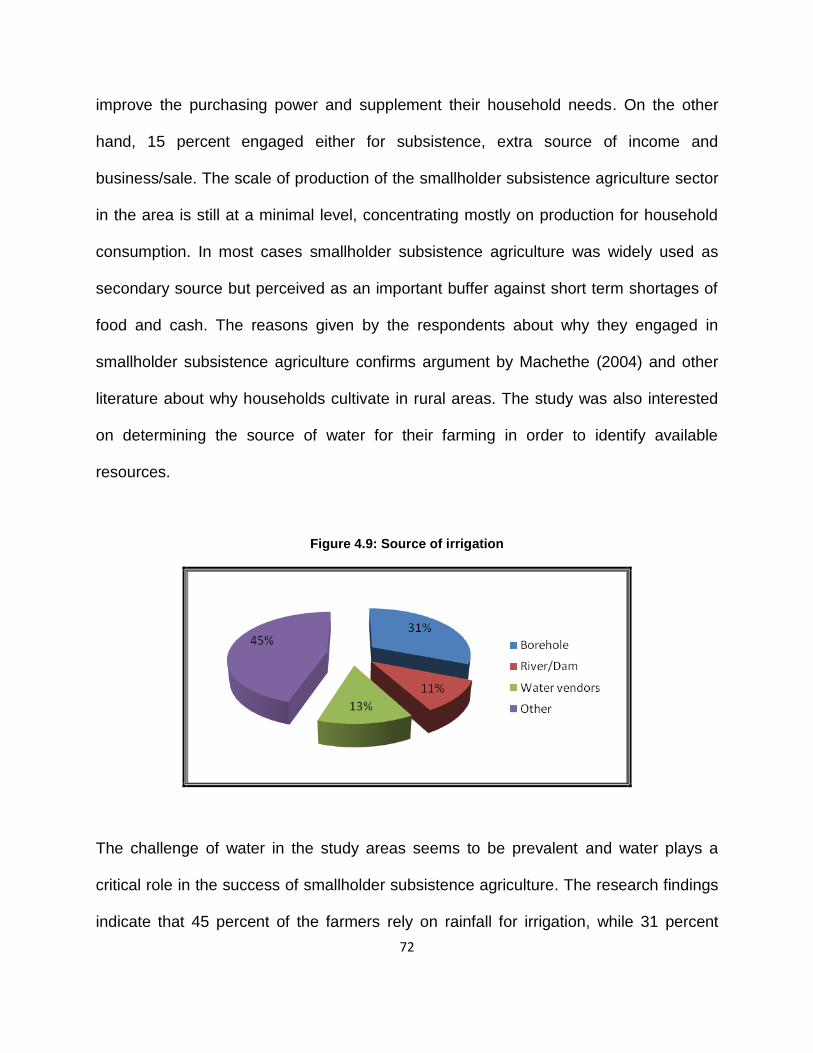
72
improve the purchasing power and supplement their household needs. On the other
hand, 15 percent engaged either for subsistence, extra source of income and
business/sale. The scale of production of the smallholder subsistence agriculture sector
in the area is still at a minimal level, concentrating mostly on production for household
consumption. In most cases smallholder subsistence agriculture was widely used as
secondary source but perceived as an important buffer against short term shortages of
food and cash. The reasons given by the respondents about why they engaged in
smallholder subsistence agriculture confirms argument by Machethe (2004) and other
literature about why households cultivate in rural areas. The study was also interested
on determining the source of water for their farming in order to identify available
resources.
Figure 4.9: Source of irrigation
The challenge of water in the study areas seems to be prevalent and water plays a
critical role in the success of smallholder subsistence agriculture. The research findings
indicate that 45 percent of the farmers rely on rainfall for irrigation, while 31 percent
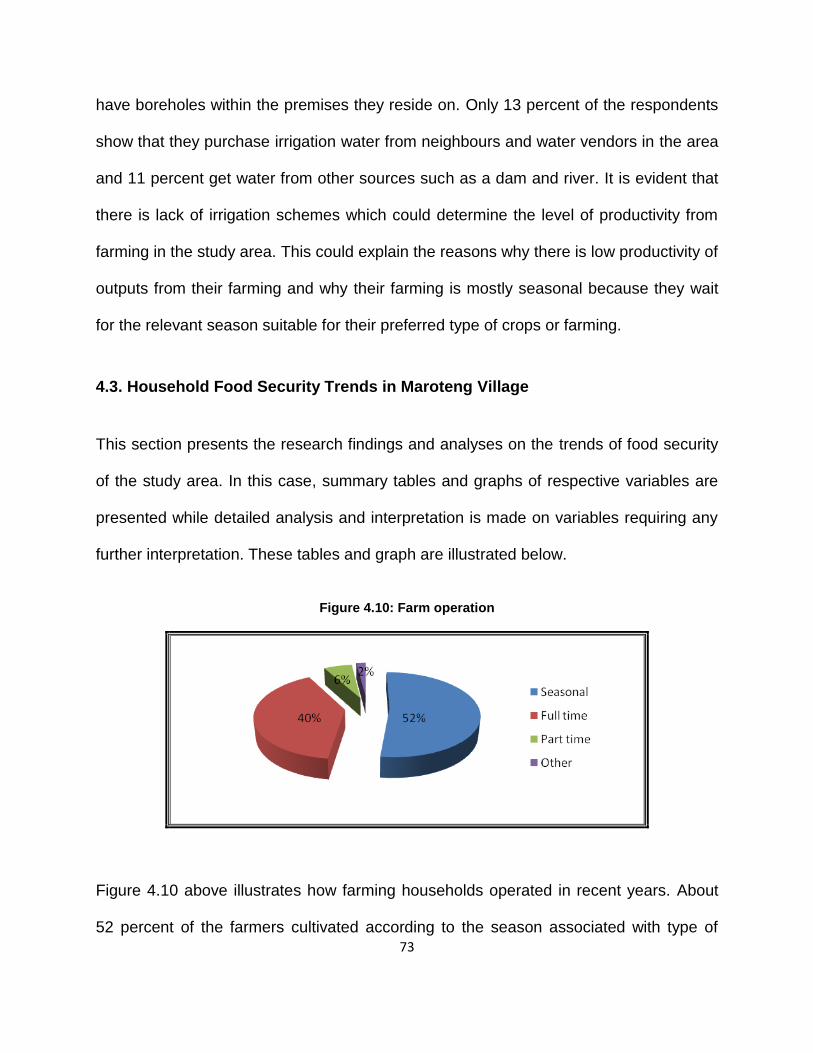
73
have boreholes within the premises they reside on. Only 13 percent of the respondents
show that they purchase irrigation water from neighbours and water vendors in the area
and 11 percent get water from other sources such as a dam and river. It is evident that
there is lack of irrigation schemes which could determine the level of productivity from
farming in the study area. This could explain the reasons why there is low productivity of
outputs from their farming and why their farming is mostly seasonal because they wait
for the relevant season suitable for their preferred type of crops or farming.
4.3. Household Food Security Trends in Maroteng Village
This section presents the research findings and analyses on the trends of food security
of the study area. In this case, summary tables and graphs of respective variables are
presented while detailed analysis and interpretation is made on variables requiring any
further interpretation. These tables and graph are illustrated below.
Figure 4.10: Farm operation
Figure 4.10 above illustrates how farming households operated in recent years. About
52 percent of the farmers cultivated according to the season associated with type of
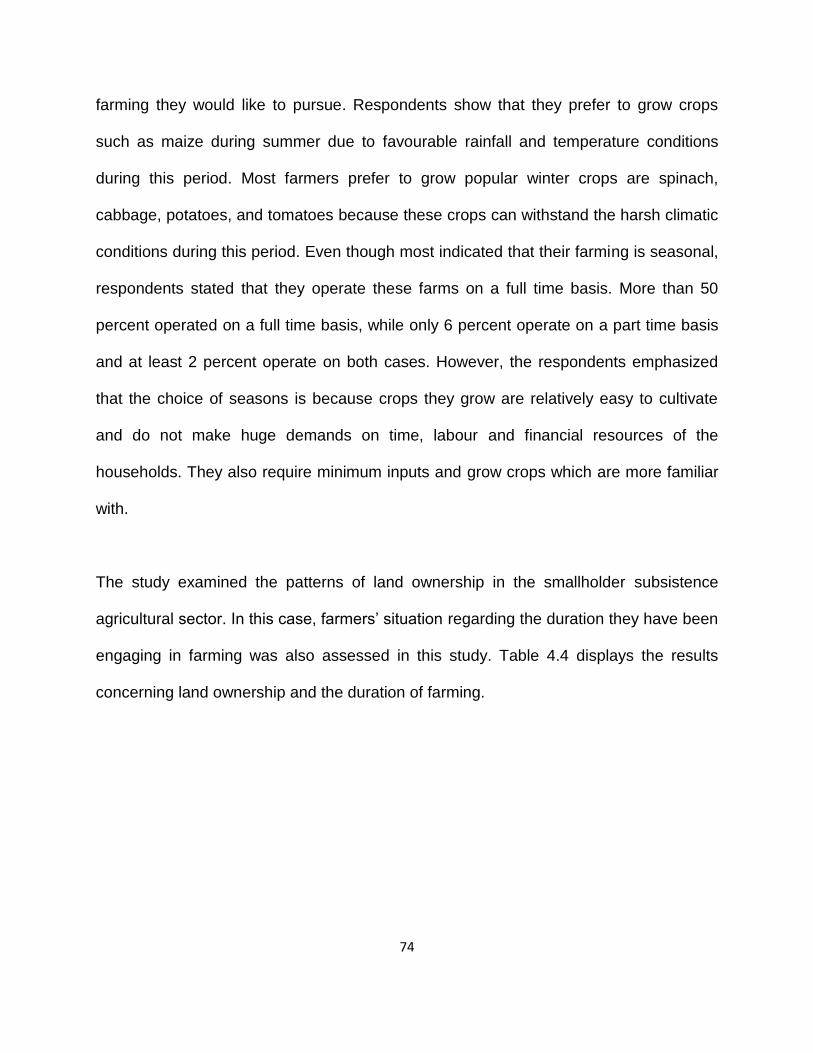
74
farming they would like to pursue. Respondents show that they prefer to grow crops
such as maize during summer due to favourable rainfall and temperature conditions
during this period. Most farmers prefer to grow popular winter crops are spinach,
cabbage, potatoes, and tomatoes because these crops can withstand the harsh climatic
conditions during this period. Even though most indicated that their farming is seasonal,
respondents stated that they operate these farms on a full time basis. More than 50
percent operated on a full time basis, while only 6 percent operate on a part time basis
and at least 2 percent operate on both cases. However, the respondents emphasized
that the choice of seasons is because crops they grow are relatively easy to cultivate
and do not make huge demands on time, labour and financial resources of the
households. They also require minimum inputs and grow crops which are more familiar
with.
The study examined the patterns of land ownership in the smallholder subsistence
agricultural sector. In this case, farmers’ situation regarding the duration they have been
engaging in farming was also assessed in this study. Table 4.4 displays the results
concerning land ownership and the duration of farming.
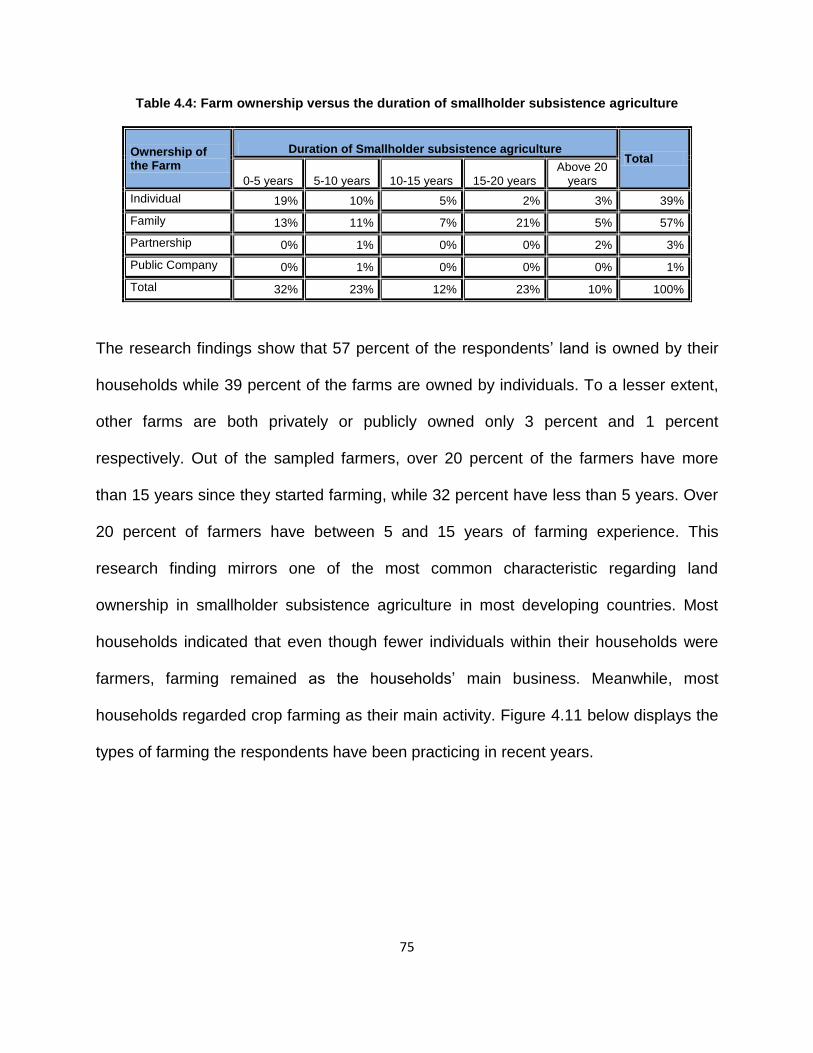
75
Table 4.4: Farm ownership versus the duration of smallholder subsistence agriculture
Ownership of the Farm
Duration of Smallholder subsistence agriculture Total
0-5 years 5-10 years 10-15 years 15-20 years Above 20
years
Individual 19% 10% 5% 2% 3% 39%
Family 13% 11% 7% 21% 5% 57%
Partnership 0% 1% 0% 0% 2% 3%
Public Company 0% 1% 0% 0% 0% 1%
Total 32% 23% 12% 23% 10% 100%
The research findings show that 57 percent of the respondents’ land is owned by their
households while 39 percent of the farms are owned by individuals. To a lesser extent,
other farms are both privately or publicly owned only 3 percent and 1 percent
respectively. Out of the sampled farmers, over 20 percent of the farmers have more
than 15 years since they started farming, while 32 percent have less than 5 years. Over
20 percent of farmers have between 5 and 15 years of farming experience. This
research finding mirrors one of the most common characteristic regarding land
ownership in smallholder subsistence agriculture in most developing countries. Most
households indicated that even though fewer individuals within their households were
farmers, farming remained as the households’ main business. Meanwhile, most
households regarded crop farming as their main activity. Figure 4.11 below displays the
types of farming the respondents have been practicing in recent years.
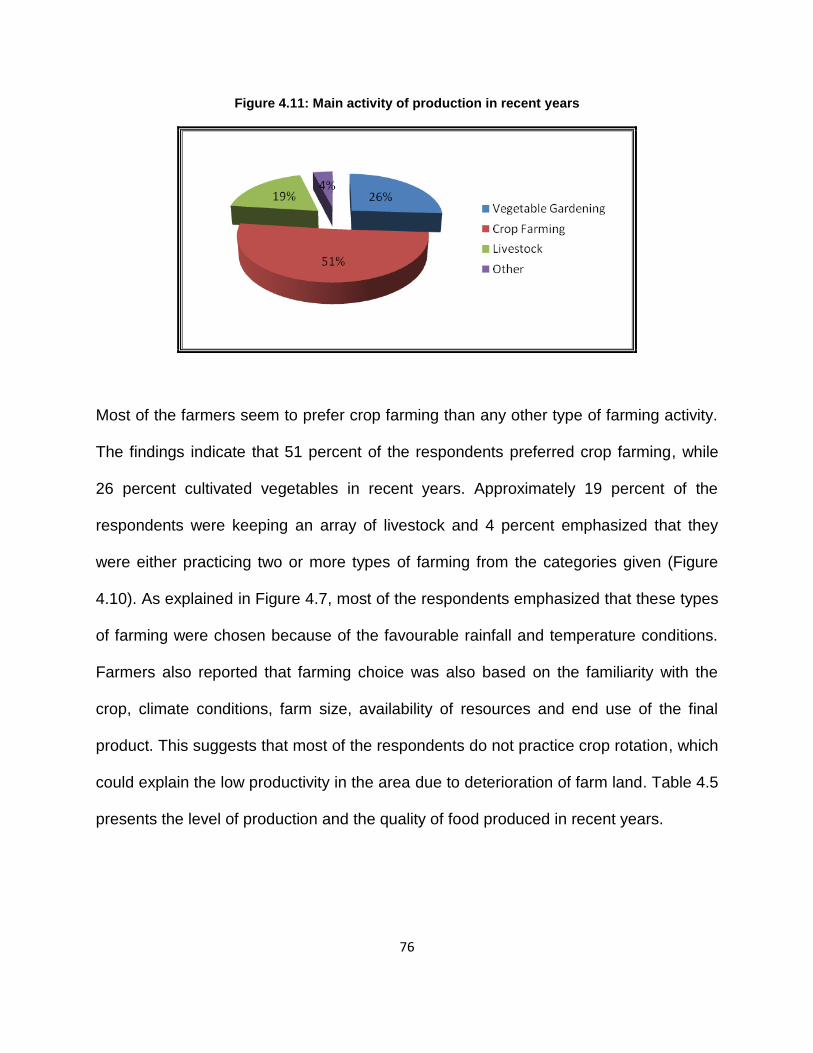
76
Figure 4.11: Main activity of production in recent years
Most of the farmers seem to prefer crop farming than any other type of farming activity.
The findings indicate that 51 percent of the respondents preferred crop farming, while
26 percent cultivated vegetables in recent years. Approximately 19 percent of the
respondents were keeping an array of livestock and 4 percent emphasized that they
were either practicing two or more types of farming from the categories given (Figure
4.10). As explained in Figure 4.7, most of the respondents emphasized that these types
of farming were chosen because of the favourable rainfall and temperature conditions.
Farmers also reported that farming choice was also based on the familiarity with the
crop, climate conditions, farm size, availability of resources and end use of the final
product. This suggests that most of the respondents do not practice crop rotation, which
could explain the low productivity in the area due to deterioration of farm land. Table 4.5
presents the level of production and the quality of food produced in recent years.
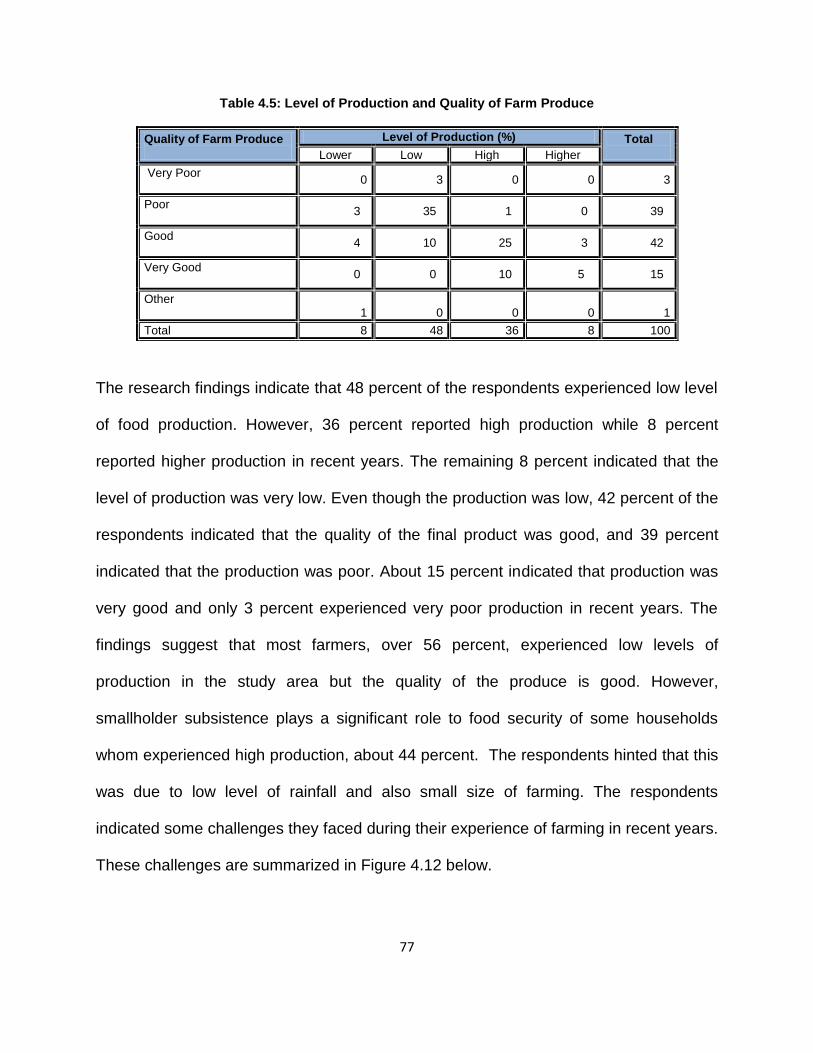
77
Table 4.5: Level of Production and Quality of Farm Produce
The research findings indicate that 48 percent of the respondents experienced low level
of food production. However, 36 percent reported high production while 8 percent
reported higher production in recent years. The remaining 8 percent indicated that the
level of production was very low. Even though the production was low, 42 percent of the
respondents indicated that the quality of the final product was good, and 39 percent
indicated that the production was poor. About 15 percent indicated that production was
very good and only 3 percent experienced very poor production in recent years. The
findings suggest that most farmers, over 56 percent, experienced low levels of
production in the study area but the quality of the produce is good. However,
smallholder subsistence plays a significant role to food security of some households
whom experienced high production, about 44 percent. The respondents hinted that this
was due to low level of rainfall and also small size of farming. The respondents
indicated some challenges they faced during their experience of farming in recent years.
These challenges are summarized in Figure 4.12 below.
Quality of Farm Produce
Level of Production (%) Total Lower Low High Higher
Very Poor
0 3 0 0 3
Poor
3 35 1 0 39
Good
4 10 25 3 42
Very Good
0 0 10 5 15
Other 1
0
0
0
1
Total 8 48 36 8 100
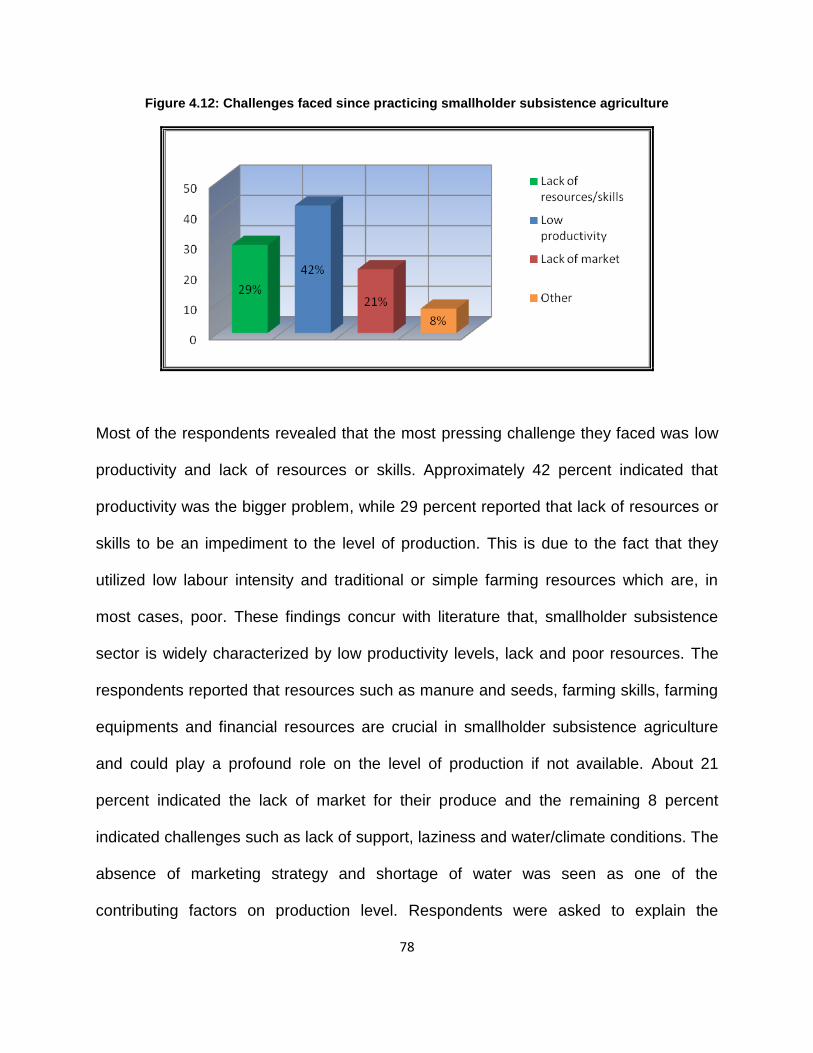
78
Figure 4.12: Challenges faced since practicing smallholder subsistence agriculture
Most of the respondents revealed that the most pressing challenge they faced was low
productivity and lack of resources or skills. Approximately 42 percent indicated that
productivity was the bigger problem, while 29 percent reported that lack of resources or
skills to be an impediment to the level of production. This is due to the fact that they
utilized low labour intensity and traditional or simple farming resources which are, in
most cases, poor. These findings concur with literature that, smallholder subsistence
sector is widely characterized by low productivity levels, lack and poor resources. The
respondents reported that resources such as manure and seeds, farming skills, farming
equipments and financial resources are crucial in smallholder subsistence agriculture
and could play a profound role on the level of production if not available. About 21
percent indicated the lack of market for their produce and the remaining 8 percent
indicated challenges such as lack of support, laziness and water/climate conditions. The
absence of marketing strategy and shortage of water was seen as one of the
contributing factors on production level. Respondents were asked to explain the
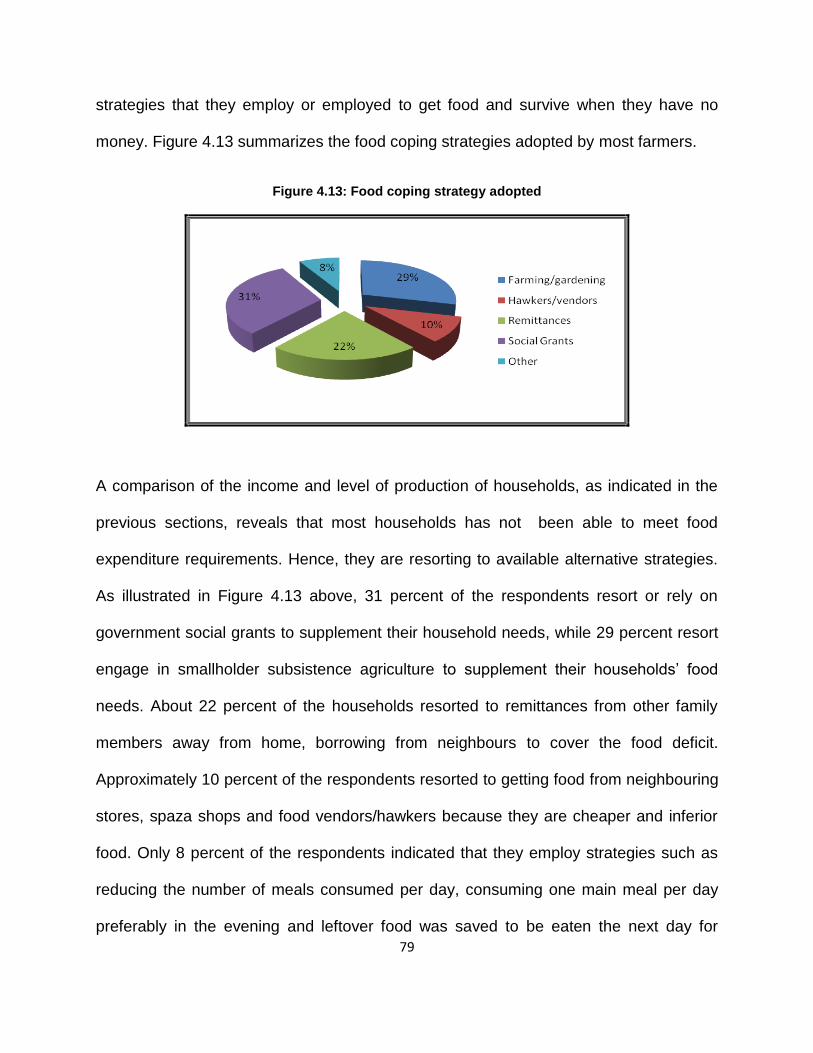
79
strategies that they employ or employed to get food and survive when they have no
money. Figure 4.13 summarizes the food coping strategies adopted by most farmers.
Figure 4.13: Food coping strategy adopted
A comparison of the income and level of production of households, as indicated in the
previous sections, reveals that most households has not been able to meet food
expenditure requirements. Hence, they are resorting to available alternative strategies.
As illustrated in Figure 4.13 above, 31 percent of the respondents resort or rely on
government social grants to supplement their household needs, while 29 percent resort
engage in smallholder subsistence agriculture to supplement their households’ food
needs. About 22 percent of the households resorted to remittances from other family
members away from home, borrowing from neighbours to cover the food deficit.
Approximately 10 percent of the respondents resorted to getting food from neighbouring
stores, spaza shops and food vendors/hawkers because they are cheaper and inferior
food. Only 8 percent of the respondents indicated that they employ strategies such as
reducing the number of meals consumed per day, consuming one main meal per day
preferably in the evening and leftover food was saved to be eaten the next day for
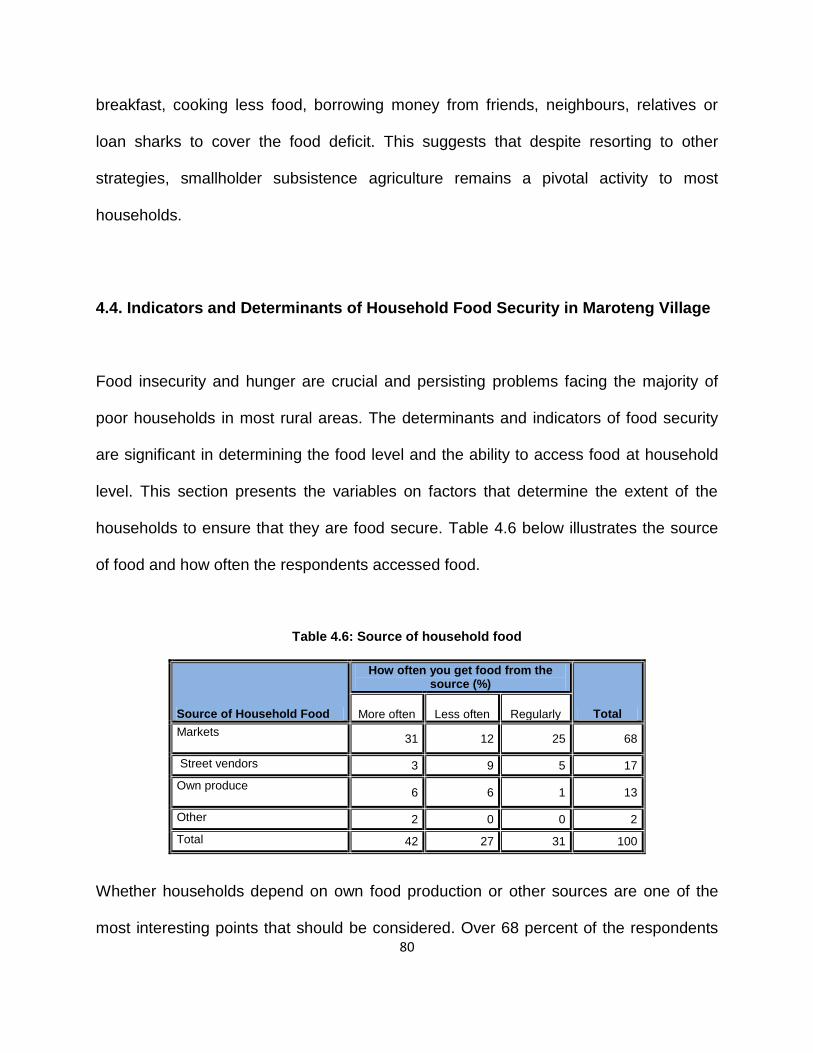
80
breakfast, cooking less food, borrowing money from friends, neighbours, relatives or
loan sharks to cover the food deficit. This suggests that despite resorting to other
strategies, smallholder subsistence agriculture remains a pivotal activity to most
households.
4.4. Indicators and Determinants of Household Food Security in Maroteng Village
Food insecurity and hunger are crucial and persisting problems facing the majority of
poor households in most rural areas. The determinants and indicators of food security
are significant in determining the food level and the ability to access food at household
level. This section presents the variables on factors that determine the extent of the
households to ensure that they are food secure. Table 4.6 below illustrates the source
of food and how often the respondents accessed food.
Table 4.6: Source of household food
Source of Household Food
How often you get food from the source (%)
Total More often Less often Regularly
Markets
31 12 25 68
Street vendors 3 9 5 17
Own produce
6 6 1 13
Other 2 0 0 2
Total 42 27 31 100
Whether households depend on own food production or other sources are one of the
most interesting points that should be considered. Over 68 percent of the respondents
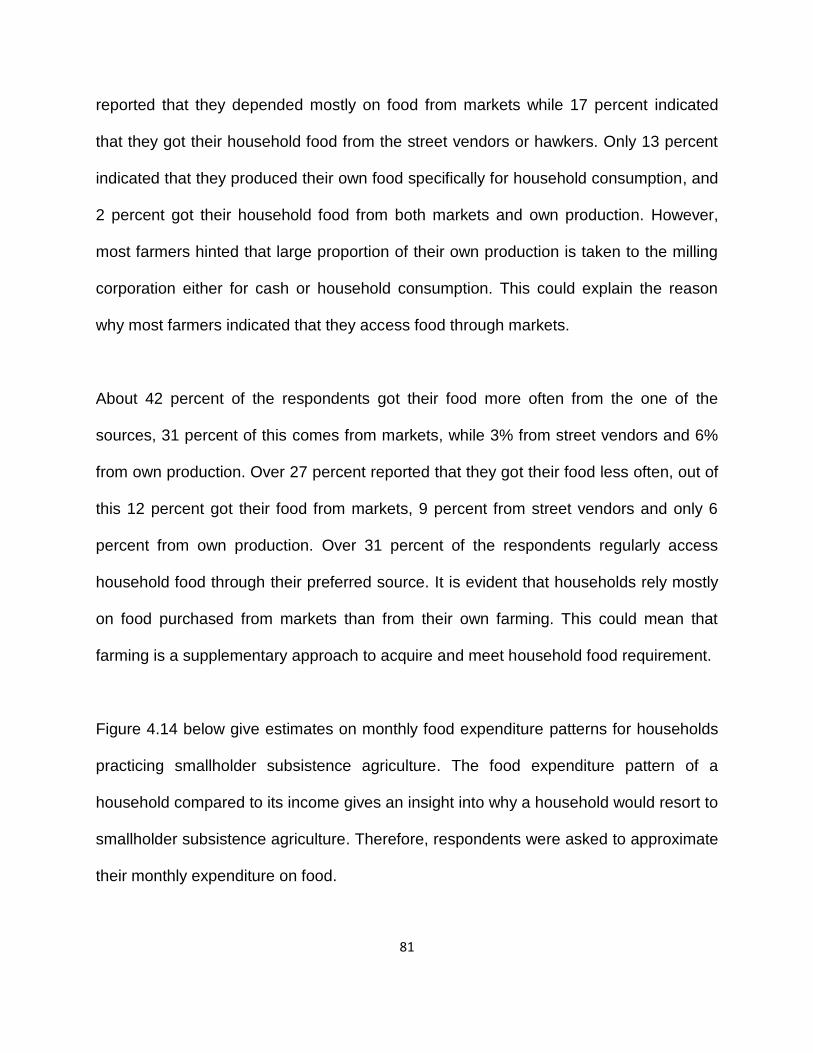
81
reported that they depended mostly on food from markets while 17 percent indicated
that they got their household food from the street vendors or hawkers. Only 13 percent
indicated that they produced their own food specifically for household consumption, and
2 percent got their household food from both markets and own production. However,
most farmers hinted that large proportion of their own production is taken to the milling
corporation either for cash or household consumption. This could explain the reason
why most farmers indicated that they access food through markets.
About 42 percent of the respondents got their food more often from the one of the
sources, 31 percent of this comes from markets, while 3% from street vendors and 6%
from own production. Over 27 percent reported that they got their food less often, out of
this 12 percent got their food from markets, 9 percent from street vendors and only 6
percent from own production. Over 31 percent of the respondents regularly access
household food through their preferred source. It is evident that households rely mostly
on food purchased from markets than from their own farming. This could mean that
farming is a supplementary approach to acquire and meet household food requirement.
Figure 4.14 below give estimates on monthly food expenditure patterns for households
practicing smallholder subsistence agriculture. The food expenditure pattern of a
household compared to its income gives an insight into why a household would resort to
smallholder subsistence agriculture. Therefore, respondents were asked to approximate
their monthly expenditure on food.
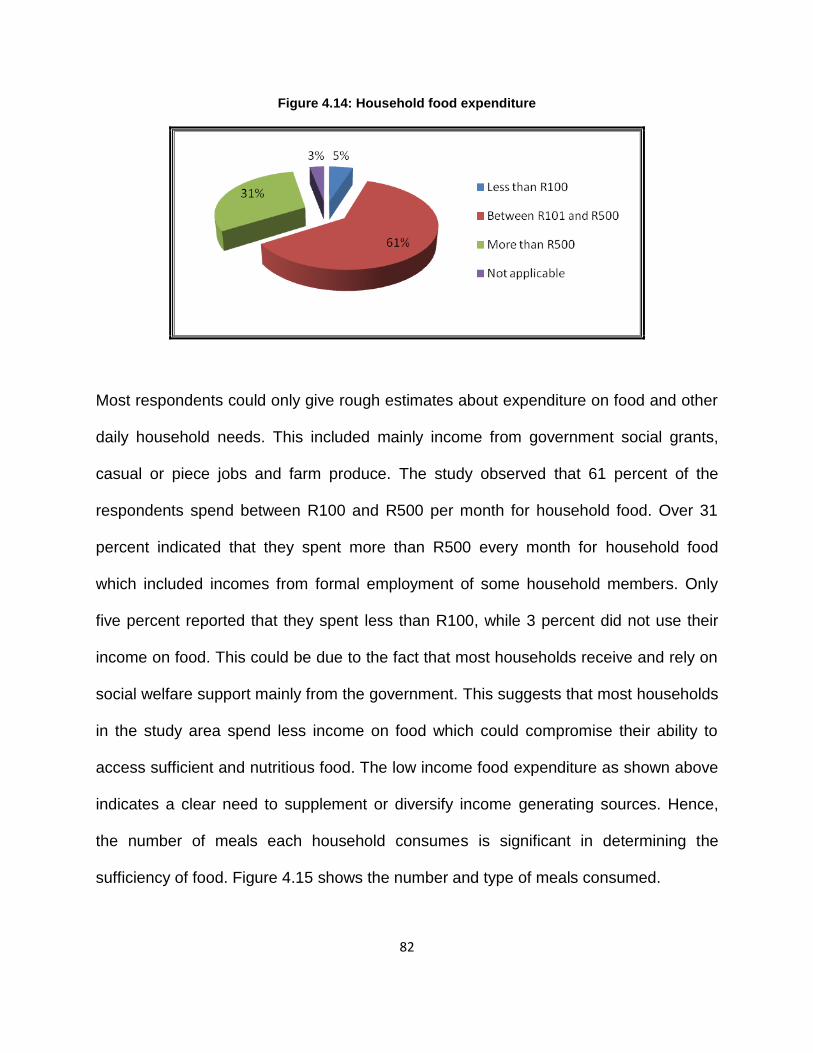
82
Figure 4.14: Household food expenditure
Most respondents could only give rough estimates about expenditure on food and other
daily household needs. This included mainly income from government social grants,
casual or piece jobs and farm produce. The study observed that 61 percent of the
respondents spend between R100 and R500 per month for household food. Over 31
percent indicated that they spent more than R500 every month for household food
which included incomes from formal employment of some household members. Only
five percent reported that they spent less than R100, while 3 percent did not use their
income on food. This could be due to the fact that most households receive and rely on
social welfare support mainly from the government. This suggests that most households
in the study area spend less income on food which could compromise their ability to
access sufficient and nutritious food. The low income food expenditure as shown above
indicates a clear need to supplement or diversify income generating sources. Hence,
the number of meals each household consumes is significant in determining the
sufficiency of food. Figure 4.15 shows the number and type of meals consumed.
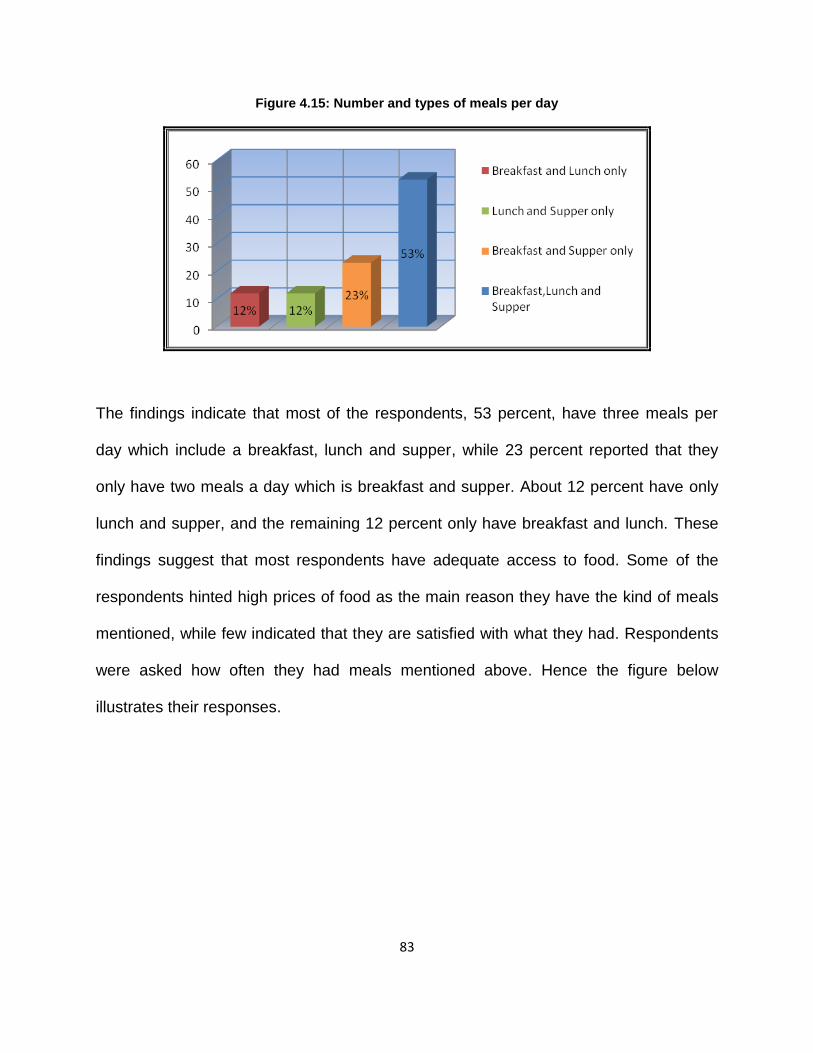
83
Figure 4.15: Number and types of meals per day
The findings indicate that most of the respondents, 53 percent, have three meals per
day which include a breakfast, lunch and supper, while 23 percent reported that they
only have two meals a day which is breakfast and supper. About 12 percent have only
lunch and supper, and the remaining 12 percent only have breakfast and lunch. These
findings suggest that most respondents have adequate access to food. Some of the
respondents hinted high prices of food as the main reason they have the kind of meals
mentioned, while few indicated that they are satisfied with what they had. Respondents
were asked how often they had meals mentioned above. Hence the figure below
illustrates their responses.
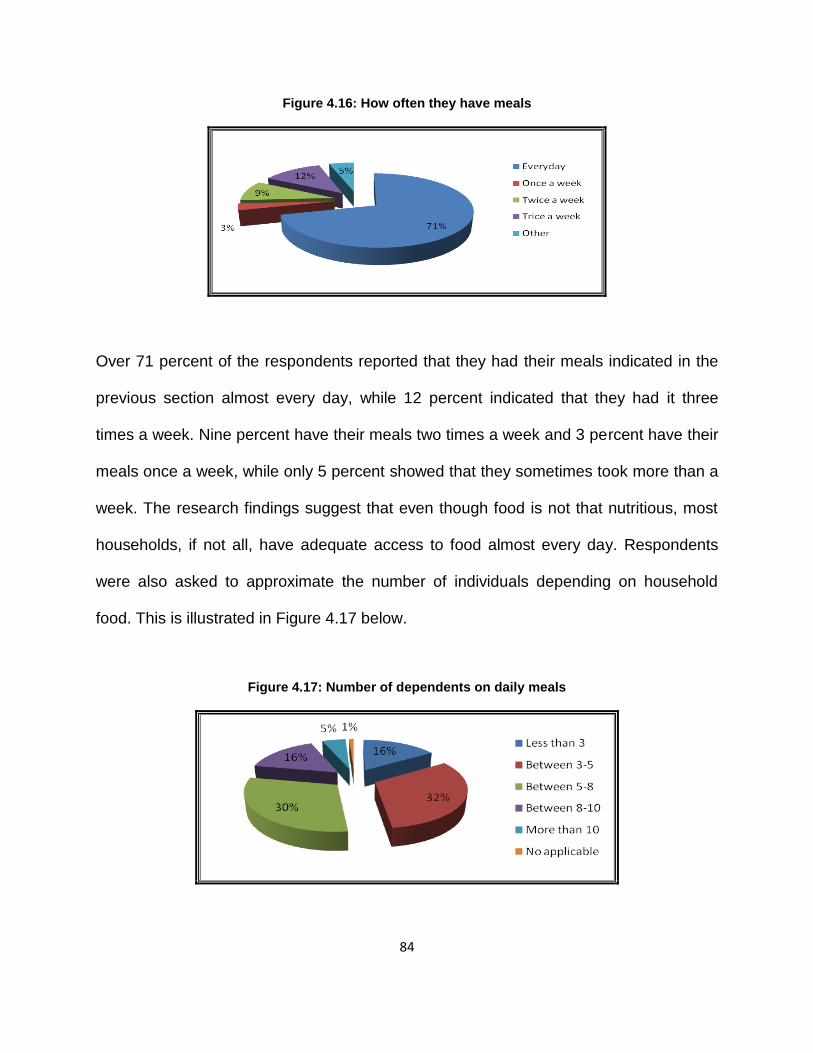
84
Figure 4.16: How often they have meals
Over 71 percent of the respondents reported that they had their meals indicated in the
previous section almost every day, while 12 percent indicated that they had it three
times a week. Nine percent have their meals two times a week and 3 percent have their
meals once a week, while only 5 percent showed that they sometimes took more than a
week. The research findings suggest that even though food is not that nutritious, most
households, if not all, have adequate access to food almost every day. Respondents
were also asked to approximate the number of individuals depending on household
food. This is illustrated in Figure 4.17 below.
Figure 4.17: Number of dependents on daily meals
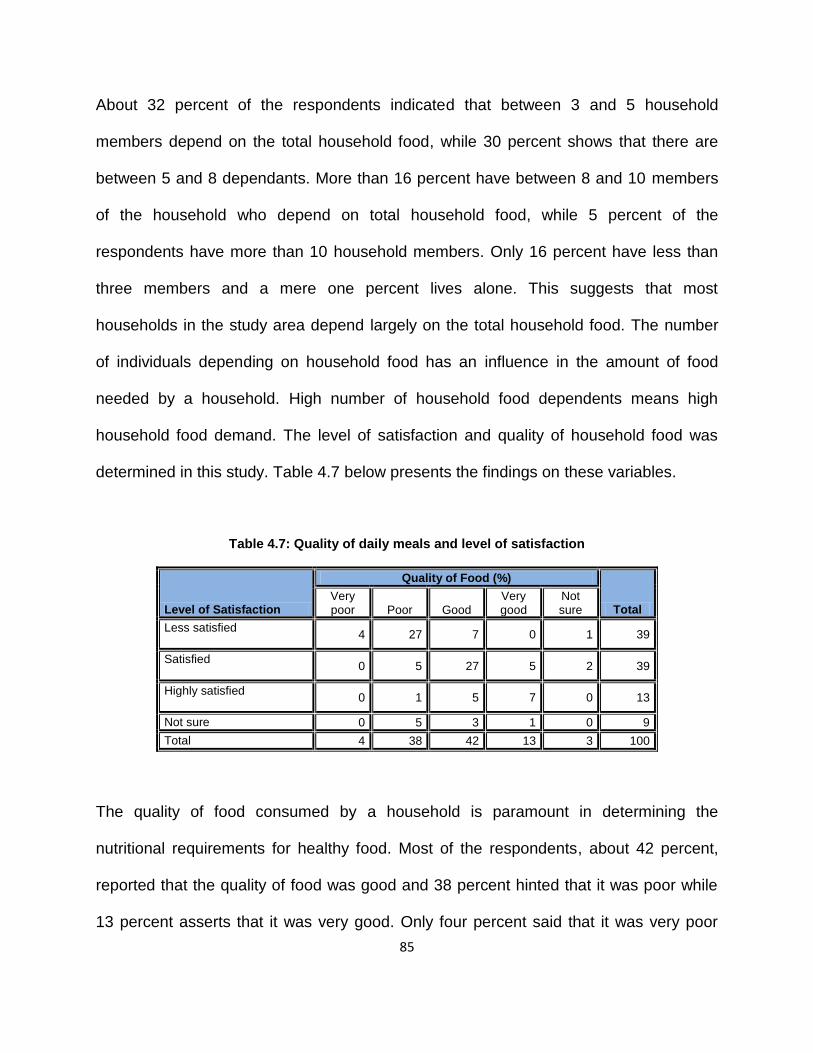
85
About 32 percent of the respondents indicated that between 3 and 5 household
members depend on the total household food, while 30 percent shows that there are
between 5 and 8 dependants. More than 16 percent have between 8 and 10 members
of the household who depend on total household food, while 5 percent of the
respondents have more than 10 household members. Only 16 percent have less than
three members and a mere one percent lives alone. This suggests that most
households in the study area depend largely on the total household food. The number
of individuals depending on household food has an influence in the amount of food
needed by a household. High number of household food dependents means high
household food demand. The level of satisfaction and quality of household food was
determined in this study. Table 4.7 below presents the findings on these variables.
Table 4.7: Quality of daily meals and level of satisfaction
Level of Satisfaction
Quality of Food (%)
Total Very poor Poor Good
Very good
Not sure
Less satisfied
4 27 7 0 1 39
Satisfied
0 5 27 5 2 39
Highly satisfied
0 1 5 7 0 13
Not sure 0 5 3 1 0 9
Total 4 38 42 13 3 100
The quality of food consumed by a household is paramount in determining the
nutritional requirements for healthy food. Most of the respondents, about 42 percent,
reported that the quality of food was good and 38 percent hinted that it was poor while
13 percent asserts that it was very good. Only four percent said that it was very poor
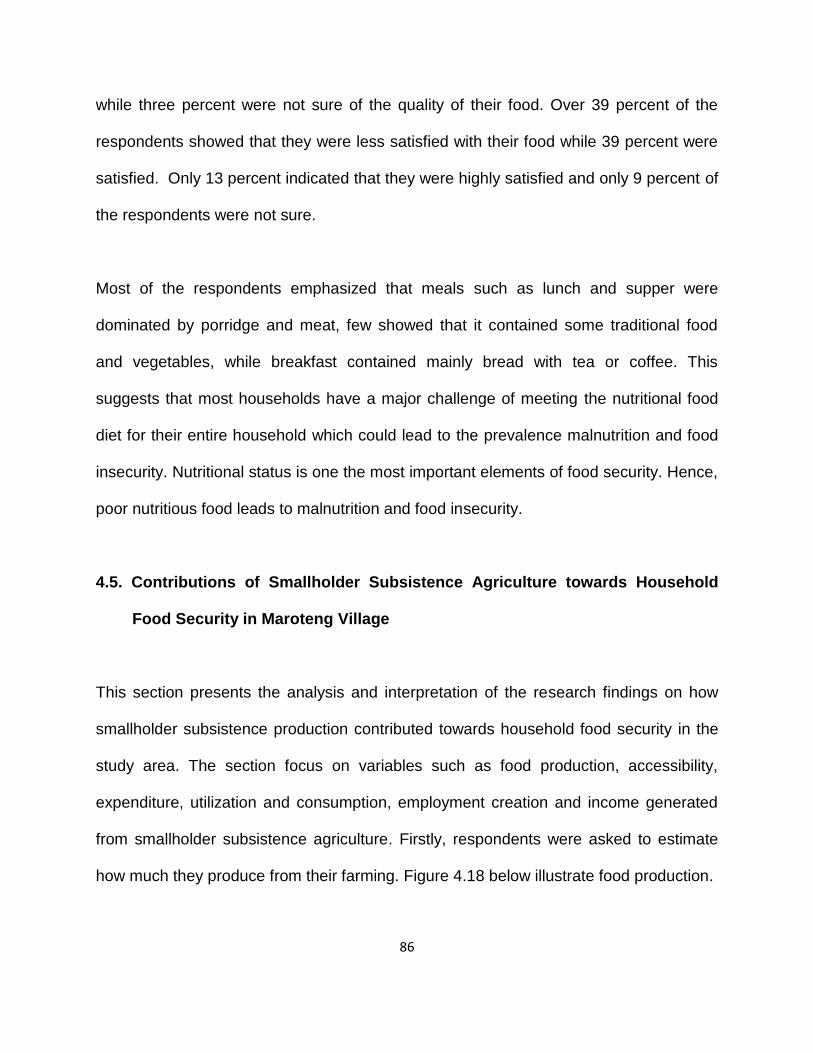
86
while three percent were not sure of the quality of their food. Over 39 percent of the
respondents showed that they were less satisfied with their food while 39 percent were
satisfied. Only 13 percent indicated that they were highly satisfied and only 9 percent of
the respondents were not sure.
Most of the respondents emphasized that meals such as lunch and supper were
dominated by porridge and meat, few showed that it contained some traditional food
and vegetables, while breakfast contained mainly bread with tea or coffee. This
suggests that most households have a major challenge of meeting the nutritional food
diet for their entire household which could lead to the prevalence malnutrition and food
insecurity. Nutritional status is one the most important elements of food security. Hence,
poor nutritious food leads to malnutrition and food insecurity.
4.5. Contributions of Smallholder Subsistence Agriculture towards Household
Food Security in Maroteng Village
This section presents the analysis and interpretation of the research findings on how
smallholder subsistence production contributed towards household food security in the
study area. The section focus on variables such as food production, accessibility,
expenditure, utilization and consumption, employment creation and income generated
from smallholder subsistence agriculture. Firstly, respondents were asked to estimate
how much they produce from their farming. Figure 4.18 below illustrate food production.
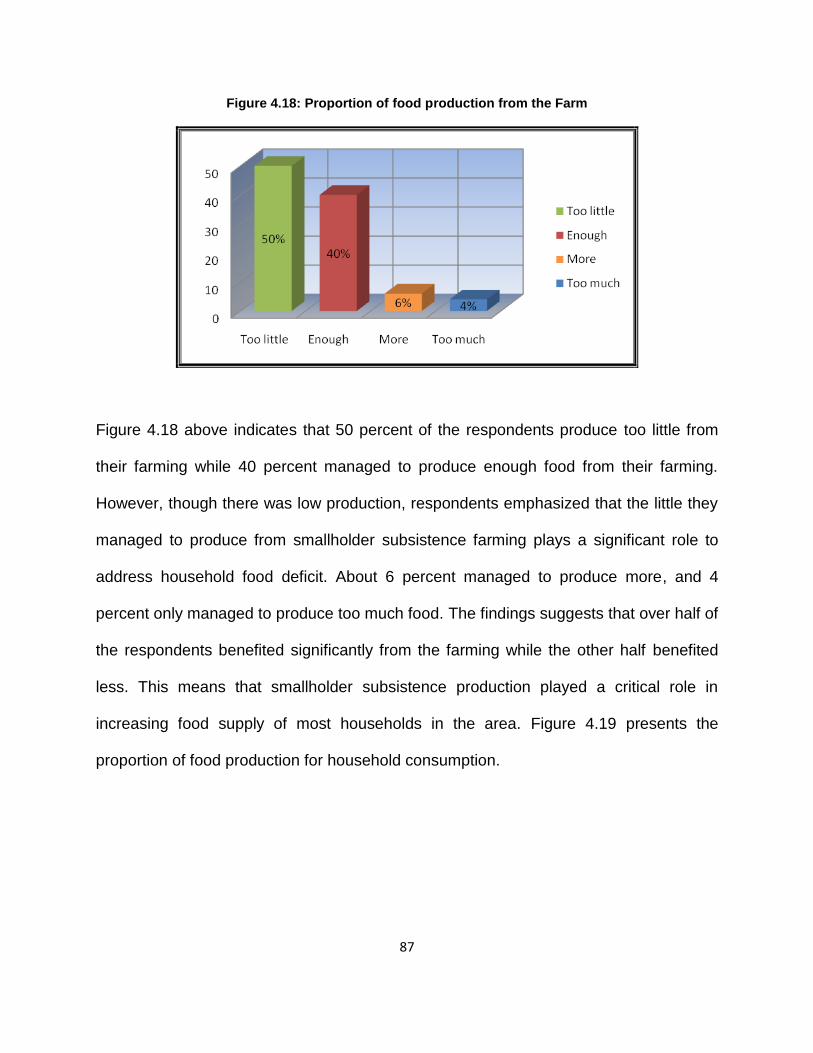
87
Figure 4.18: Proportion of food production from the Farm
Figure 4.18 above indicates that 50 percent of the respondents produce too little from
their farming while 40 percent managed to produce enough food from their farming.
However, though there was low production, respondents emphasized that the little they
managed to produce from smallholder subsistence farming plays a significant role to
address household food deficit. About 6 percent managed to produce more, and 4
percent only managed to produce too much food. The findings suggests that over half of
the respondents benefited significantly from the farming while the other half benefited
less. This means that smallholder subsistence production played a critical role in
increasing food supply of most households in the area. Figure 4.19 presents the
proportion of food production for household consumption.
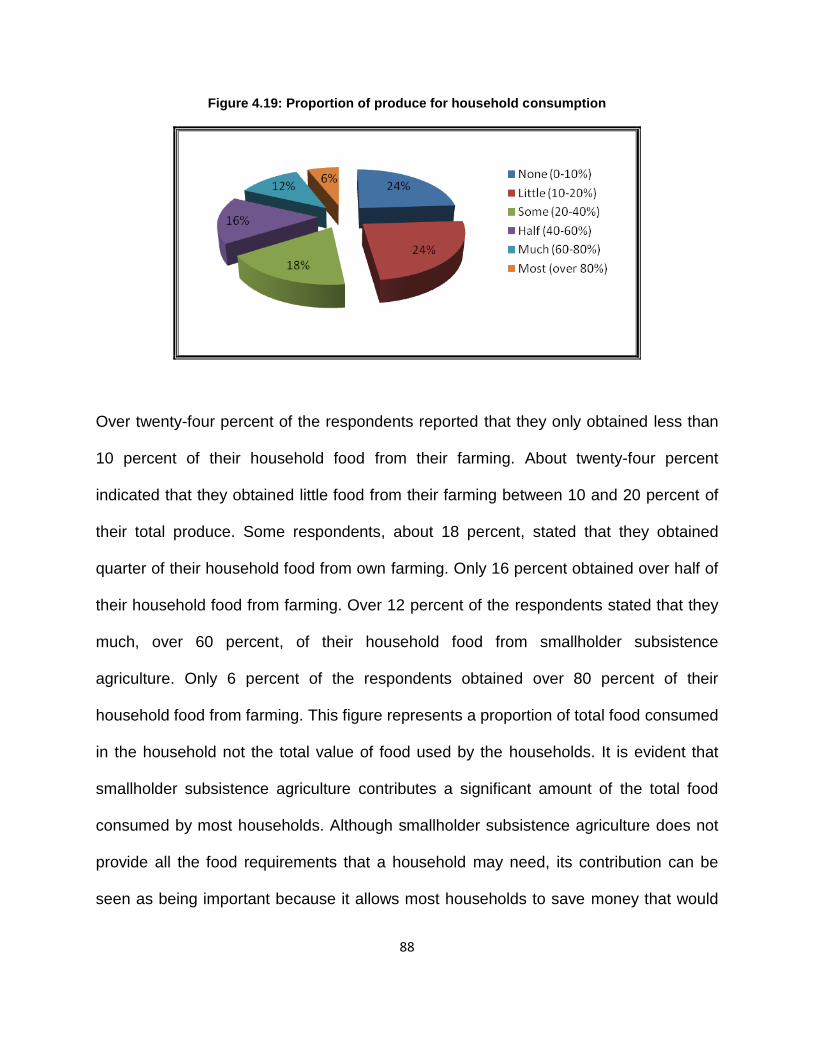
88
Figure 4.19: Proportion of produce for household consumption
Over twenty-four percent of the respondents reported that they only obtained less than
10 percent of their household food from their farming. About twenty-four percent
indicated that they obtained little food from their farming between 10 and 20 percent of
their total produce. Some respondents, about 18 percent, stated that they obtained
quarter of their household food from own farming. Only 16 percent obtained over half of
their household food from farming. Over 12 percent of the respondents stated that they
much, over 60 percent, of their household food from smallholder subsistence
agriculture. Only 6 percent of the respondents obtained over 80 percent of their
household food from farming. This figure represents a proportion of total food consumed
in the household not the total value of food used by the households. It is evident that
smallholder subsistence agriculture contributes a significant amount of the total food
consumed by most households. Although smallholder subsistence agriculture does not
provide all the food requirements that a household may need, its contribution can be
seen as being important because it allows most households to save money that would
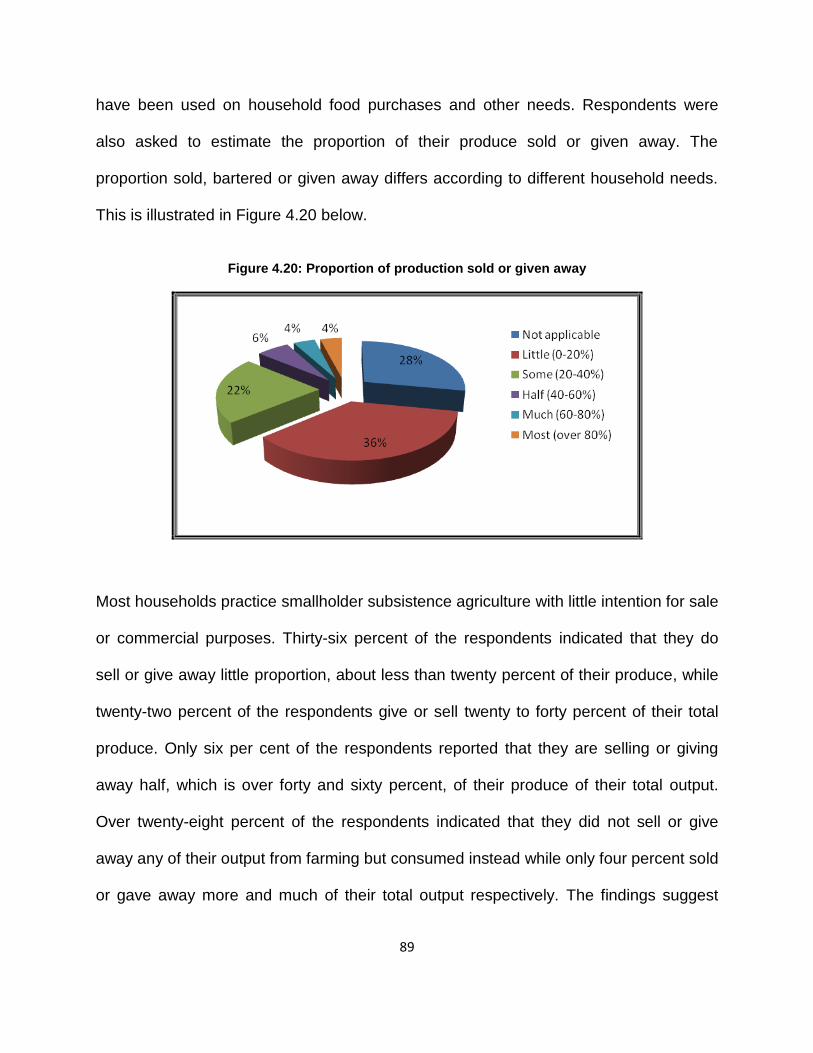
89
have been used on household food purchases and other needs. Respondents were
also asked to estimate the proportion of their produce sold or given away. The
proportion sold, bartered or given away differs according to different household needs.
This is illustrated in Figure 4.20 below.
Figure 4.20: Proportion of production sold or given away
Most households practice smallholder subsistence agriculture with little intention for sale
or commercial purposes. Thirty-six percent of the respondents indicated that they do
sell or give away little proportion, about less than twenty percent of their produce, while
twenty-two percent of the respondents give or sell twenty to forty percent of their total
produce. Only six per cent of the respondents reported that they are selling or giving
away half, which is over forty and sixty percent, of their produce of their total output.
Over twenty-eight percent of the respondents indicated that they did not sell or give
away any of their output from farming but consumed instead while only four percent sold
or gave away more and much of their total output respectively. The findings suggest
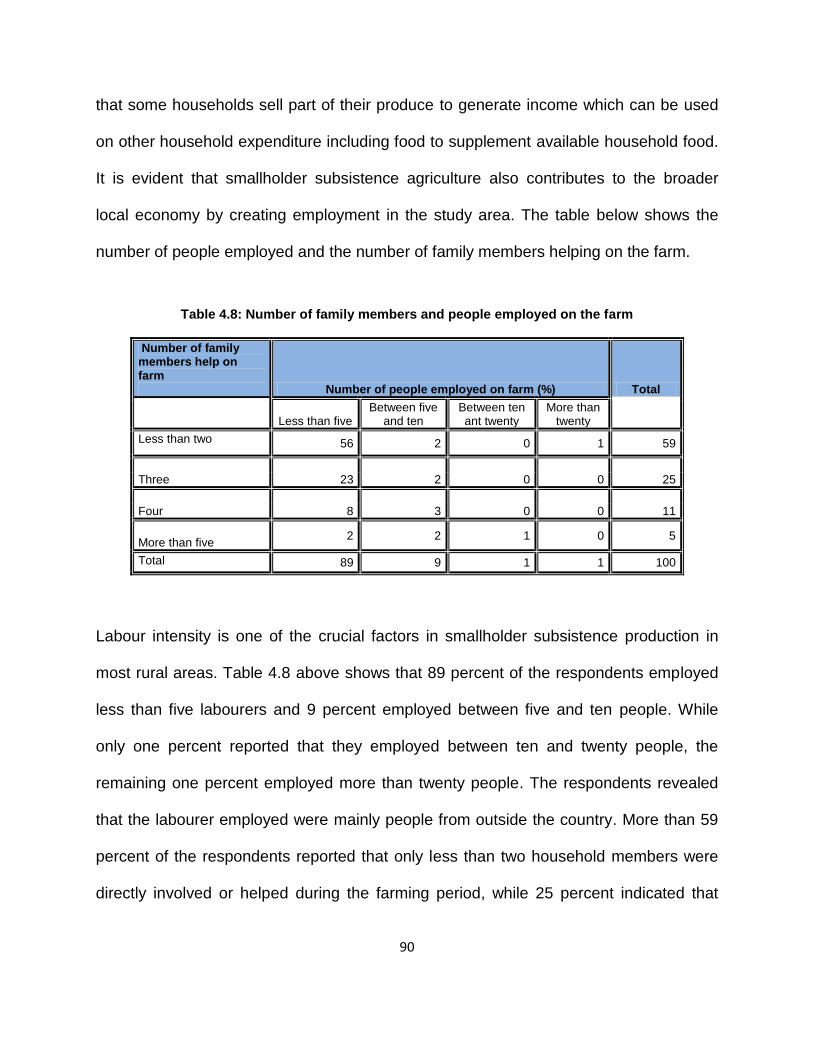
90
that some households sell part of their produce to generate income which can be used
on other household expenditure including food to supplement available household food.
It is evident that smallholder subsistence agriculture also contributes to the broader
local economy by creating employment in the study area. The table below shows the
number of people employed and the number of family members helping on the farm.
Table 4.8: Number of family members and people employed on the farm
Number of family members help on farm Number of people employed on farm (%) Total
Less than five Between five
and ten Between ten ant twenty
More than twenty
Less than two 56 2 0 1 59
Three
23 2 0 0 25
Four
8 3 0 0 11
More than five
2 2 1 0 5
Total 89 9 1 1 100
Labour intensity is one of the crucial factors in smallholder subsistence production in
most rural areas. Table 4.8 above shows that 89 percent of the respondents employed
less than five labourers and 9 percent employed between five and ten people. While
only one percent reported that they employed between ten and twenty people, the
remaining one percent employed more than twenty people. The respondents revealed
that the labourer employed were mainly people from outside the country. More than 59
percent of the respondents reported that only less than two household members were
directly involved or helped during the farming period, while 25 percent indicated that
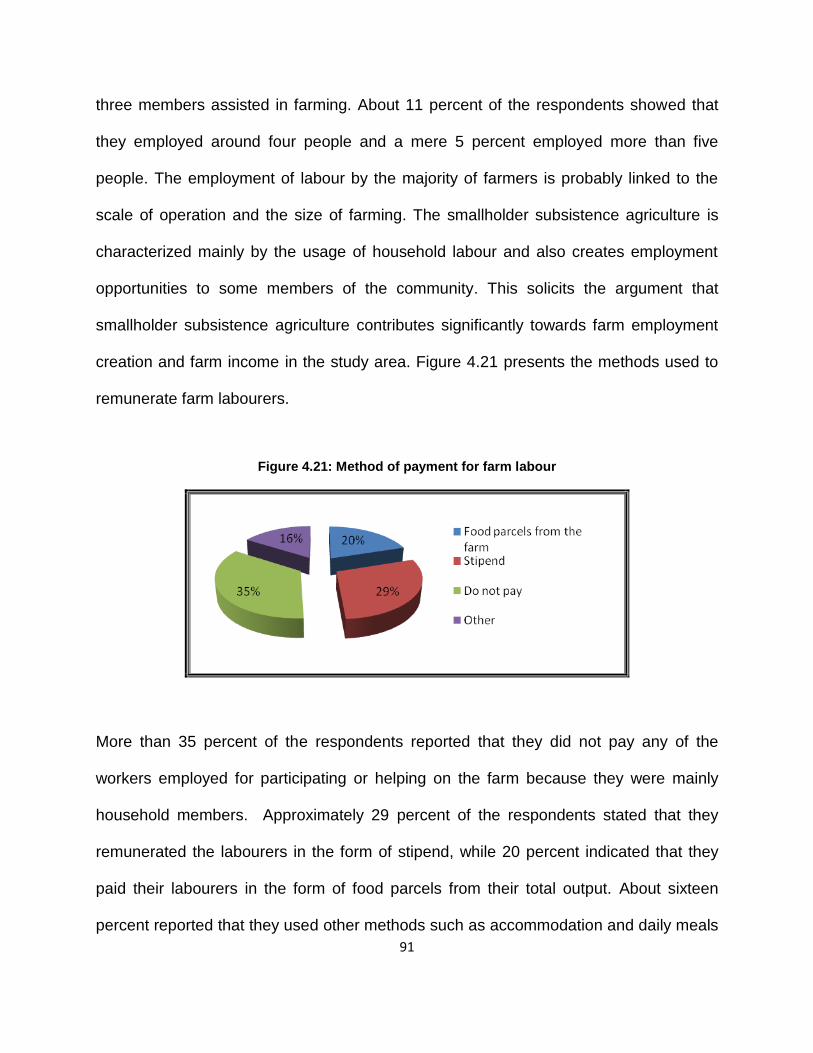
91
three members assisted in farming. About 11 percent of the respondents showed that
they employed around four people and a mere 5 percent employed more than five
people. The employment of labour by the majority of farmers is probably linked to the
scale of operation and the size of farming. The smallholder subsistence agriculture is
characterized mainly by the usage of household labour and also creates employment
opportunities to some members of the community. This solicits the argument that
smallholder subsistence agriculture contributes significantly towards farm employment
creation and farm income in the study area. Figure 4.21 presents the methods used to
remunerate farm labourers.
Figure 4.21: Method of payment for farm labour
More than 35 percent of the respondents reported that they did not pay any of the
workers employed for participating or helping on the farm because they were mainly
household members. Approximately 29 percent of the respondents stated that they
remunerated the labourers in the form of stipend, while 20 percent indicated that they
paid their labourers in the form of food parcels from their total output. About sixteen
percent reported that they used other methods such as accommodation and daily meals
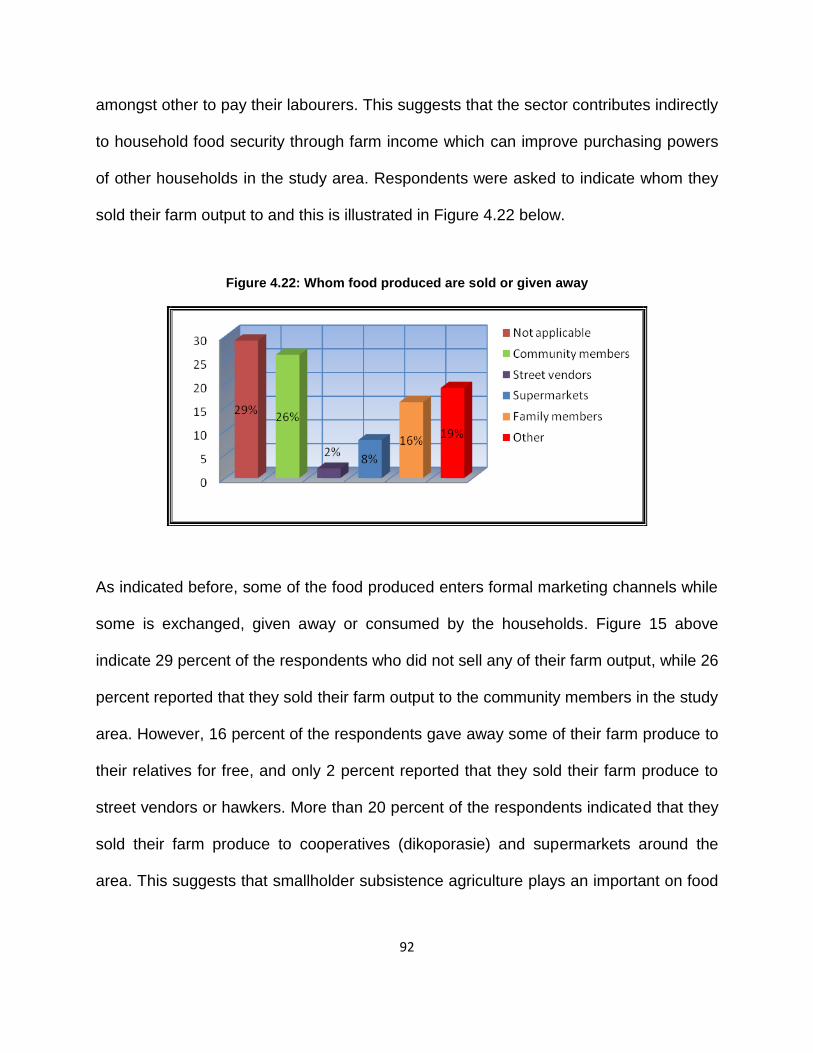
92
amongst other to pay their labourers. This suggests that the sector contributes indirectly
to household food security through farm income which can improve purchasing powers
of other households in the study area. Respondents were asked to indicate whom they
sold their farm output to and this is illustrated in Figure 4.22 below.
Figure 4.22: Whom food produced are sold or given away
As indicated before, some of the food produced enters formal marketing channels while
some is exchanged, given away or consumed by the households. Figure 15 above
indicate 29 percent of the respondents who did not sell any of their farm output, while 26
percent reported that they sold their farm output to the community members in the study
area. However, 16 percent of the respondents gave away some of their farm produce to
their relatives for free, and only 2 percent reported that they sold their farm produce to
street vendors or hawkers. More than 20 percent of the respondents indicated that they
sold their farm produce to cooperatives (dikoporasie) and supermarkets around the
area. This suggests that smallholder subsistence agriculture plays an important on food
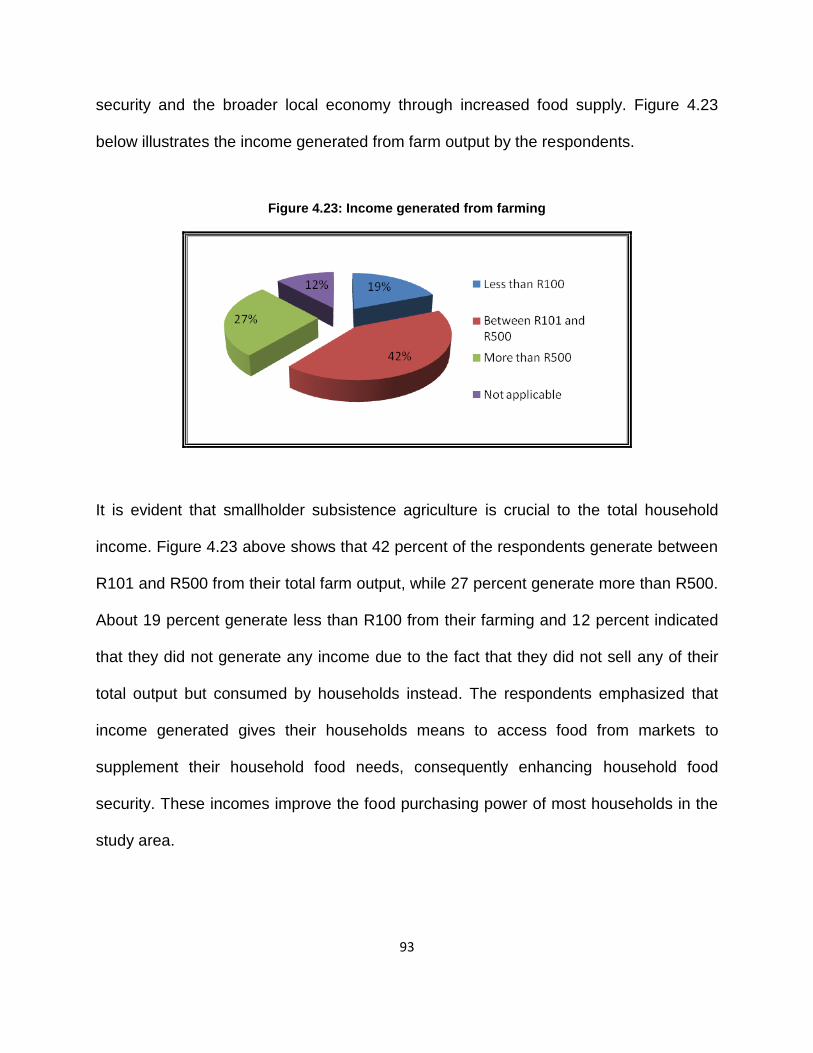
93
security and the broader local economy through increased food supply. Figure 4.23
below illustrates the income generated from farm output by the respondents.
Figure 4.23: Income generated from farming
It is evident that smallholder subsistence agriculture is crucial to the total household
income. Figure 4.23 above shows that 42 percent of the respondents generate between
R101 and R500 from their total farm output, while 27 percent generate more than R500.
About 19 percent generate less than R100 from their farming and 12 percent indicated
that they did not generate any income due to the fact that they did not sell any of their
total output but consumed by households instead. The respondents emphasized that
income generated gives their households means to access food from markets to
supplement their household food needs, consequently enhancing household food
security. These incomes improve the food purchasing power of most households in the
study area.
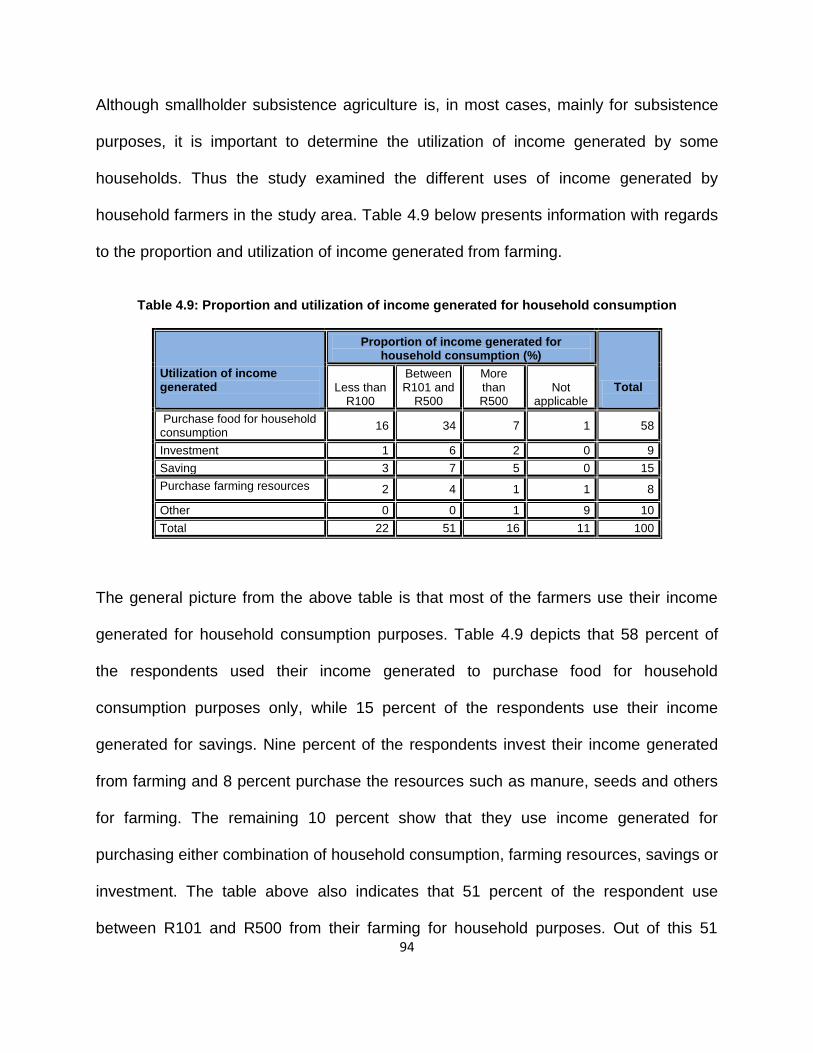
94
Although smallholder subsistence agriculture is, in most cases, mainly for subsistence
purposes, it is important to determine the utilization of income generated by some
households. Thus the study examined the different uses of income generated by
household farmers in the study area. Table 4.9 below presents information with regards
to the proportion and utilization of income generated from farming.
Table 4.9: Proportion and utilization of income generated for household consumption
Utilization of income generated
Proportion of income generated for household consumption (%)
Total
Less than R100
Between R101 and
R500
More than R500
Not applicable
Purchase food for household consumption
16 34 7 1 58
Investment 1 6 2 0 9
Saving 3 7 5 0 15
Purchase farming resources 2 4 1 1 8
Other 0 0 1 9 10
Total 22 51 16 11 100
The general picture from the above table is that most of the farmers use their income
generated for household consumption purposes. Table 4.9 depicts that 58 percent of
the respondents used their income generated to purchase food for household
consumption purposes only, while 15 percent of the respondents use their income
generated for savings. Nine percent of the respondents invest their income generated
from farming and 8 percent purchase the resources such as manure, seeds and others
for farming. The remaining 10 percent show that they use income generated for
purchasing either combination of household consumption, farming resources, savings or
investment. The table above also indicates that 51 percent of the respondent use
between R101 and R500 from their farming for household purposes. Out of this 51
95
percent, 24 percent indicated that income generated was used for household food
consumption. Twenty-one percent of the respondents reported that they used less than
R100, while 16 percent used more than R500 from of income generated from their
respective farming. About 11 percent of the respondents reported that they did not use
any of the income generated due to the fact that they did not generate any income from
farm output. Income generated from producing their own food can be utilized for other
household needs and supplement available food.
4.6. Conclusion
The chapter provided the typology of smallholder subsistence agriculture and household
food security in Maroteng Village. It has also described and analyzed the main attributes
and the role of the practice of smallholder subsistence agriculture towards food security
at household level in the study area. The low level of production in the area limits the
scope of smallholder subsistence agriculture, preventing access to nutritious food that
can be accessed reasonably. Although, smallholder subsistence farmers in the study
area still depend on markets to meet and supplement most of their household food
needs, the sector provides a significant amount of the food consumed by households as
well as incomes. The result is that availability of income generated improves their
purchasing power to access household food and for other household uses. This help
ease the food poverty conditions of most households involved in the practice. Hence,
the need to sensitize more households interested in smallholder subsistence agriculture
is paramount if food security problems are to be solved.
96
Chapter 5: Summary, Conclusions and Recommendations
5.1. Introduction
The analysis carried out in the previous chapter presented the findings emanated from
the study which elicit the extent of smallholder subsistence agriculture’s role in
contributing to household food security. Meanwhile, the main aim of this chapter is to
provide summary of the research findings, conclusion and recommendations to the
entire study.
5.2. Summary of the Research
The general objective of the study was to investigate the contributions of smallholder
subsistence agriculture in providing household food security in Maroteng Village. The
attributes and dynamics of smallholder subsistence agriculture need to be understood
by all households involved in the sector to advance the sector as a possible solution to
food insecurity and low incomes as well as unemployment prevalent in the study area.
Understanding the nature of smallholder subsistence agricultural sector can assist to
popularize the sector among households not currently participating in the sector which
can be significant for the growth and development of the sector. The study employed
the survey technique for data collection and analysis using a questionnaire. The study
utilized purposive sampling and a transect walk to choose a population sample.
97
Descriptive and qualitative methods were used to analyze and present the research
findings.
The study was based in Maroteng Village, Limpopo Province which is an informal
settlement with poor living conditions. The area is characterized by widespread food
poverty and food insecurity which makes it difficult for most households to prevail under
such conditions. The study area is occupied by households with low income, while
employment and other opportunities are at a minimal. It is an area that characterizes
most rural informal settlements and reflects conditions faced by many other South
Africans in rural areas. These households experience difficulties in accessing food for
their respective households with such conditions.
These rural households have to depend on incomes from other sources to meet their
daily household food requirements. This food sometimes is not sufficient and nutritious
enough to meet their food needs. Smallholder subsistence agriculture is an easy food
coping strategy option for most low income families in Maroteng Village in order to cover
their food needs deficit and diversify their livelihood options under conditions of
persistent economic uncertainty and threats such as unemployment and declining
purchasing power. Smallholder subsistence agriculture has often been viewed as a
relevant strategy in response to improving their household food situation.
98
5.3. Recommendations
Recommendations on how to enhance the contributions of smallholder subsistence
agriculture towards food security at household level in rural areas are discussed below.
Some of the initiatives aimed at promoting smallholder subsistence agricultural
development and food security could be put in place. Recommendations are discussed
as follows:
There is a need to provide rural household farmers with agricultural development
support, especially financial and farm inputs which would enhance and raise their
smallholder subsistence agricultural productivity. This is imperative due to the
fact that most household farmers in rural areas still depend on traditional
methods, if not any, for agricultural purposes which sometimes affect the level of
productivity. High level of productivity would provide these farmers with extra
incomes, which will ultimately improve their food purchasing power.
Smallholder subsistence agricultural growth cannot be achieved without access
to farmer support services. With adequate access to farmer support services
such farm credits, farm inputs and skills development as well as other resources,
smallholder subsistence farmers can significantly increase their agricultural
productivity and production.
99
In this report, it was indicated that smallholder subsistence agriculture has a vital
role to play in the fight against hunger and malnutrition, and ultimately in
improving household food security. The field of food security and studies within
the politics of food are relatively recent areas of research in the country. This
present lot of opportunities for further research in this area. Thus, studies which
determine conclusively whether smallholder subsistence agriculture has better
nutritional benefits at household level should be undertaken at a broader level.
It was observed that most smallholder subsistence farmers still do not manage to
meet their recommended dietary and nutritional requirements despite the fact
that they have increased access to these foods through production. Hence, there
is a need for nutrition and dietary education to households in order get better
results from smallholder subsistence agriculture. Nutrition and dietary education
is necessary in order to translate own food production into dietary intakes which
could have an impact in the areas of improved production and increased
consumption of micronutrient foods, diversified diet, increased income from food
production and capacity building at household level.
5.4. Conclusion
Smallholder subsistence agriculture has an important role to play in most households’
food security in the Maroteng Village. However, the sector still has a long way to go in
order to achieve food security at household level in the country’s poor rural areas. The
100
sector provides food security of most rural households in three ways. Firstly, the sector
provides food for household consumption through increased household food supply
which would otherwise be unaffordable to many households and by saving and utilizing
income generated from their farming activity to supplement other household needs
including food in Maroteng Village. However, food consumed by most households
seems not to be nutritious which compromise their well-being thereby leading to the
prevalence of malnutrition and food insecurity in the study area. Secondly, the sector
helps relieve food poverty and hunger conditions for most households through farm
produce channeled to markets which could be affordable to most households in
Maroteng Village. Lastly, the sector provides farm employment to some of the
individuals in rural areas which would provide incomes for their households,
consequently enhancing their purchasing power to access food from external sources.
Despite some significant contributions made by smallholder subsistence agriculture on
household food security in Maroteng Village, some households failed to meet their
household food needs due to low productivity and poor resources as well as lack of
proper farm inputs. Nonetheless, the sector has great potential in enhancing food
security at household level. For this objective to be achieved, the sector should be
considered a central part of agricultural policy development in the country. Smallholder
subsistence agriculture needs to be viewed in a broader context not only as a need or
strategy to survive by the poor but as an activity that can generate high income and
provide employment as well as improving food supply. Hence, the sector should be
considered as an activity producing beyond just subsistence by most households in

101
rural areas. However salient characteristics of smallholder subsistence agriculture as a
household food security strategy have not been fully understood and analyzed. Though
the smallholder subsistence agricultural sector contributes to households and nutritional
food security, informal employment creation and diversification of diets, the sector still
remains widely marginalized.
102
List of References
Action Aid. (2010). Who’s really fighting hunger? Hunger Free Score Card, 14
September 2010.
Aliber, M. (2005). Synthesis of the 2005 development report: Overcoming
underdevelopment in South Africa’s second economy. Pretoria: Human Sciences
Research Council.
Aliber, M. (2009). Exploring Statistics South Africa’s national household surveys as
sources of information about food security and subsistence agriculture. Centre
for Poverty Employment and Growth. Pretoria: Human Sciences Research
Council.
Aliber, M. & Hart, T.G.B. (2009). Should subsistence agriculture be supported as a
strategy to address rural food insecurity. Agrekon, 48(4), 434-458.
Altman, M, Hart T.GB & Jacobs, P.T. (2009). Household food security in South Africa.
Agrekon, 48(4).
Averbeke, W. & Khosa, T.B. (2007). The contribution of smallholder subsistence
agriculture to the nutrition of rural households in semi-arid environment in South
Africa. Water South Africa, 33(3), 413-418.
Babbie, E. & Mouton, J. (2001). The practice of social research. Cape Town: Oxford
University Press.
Baiphethi, M.N. & Jacobs, P.T. (2009). The contribution of subsistence farming to food
security in South Africa. Agrekon, 48(4), 459-482.
Bickel, G., Nord, M., Price, C., Hamilton, W. & Cook, J. (2000). Guide to measuring
household food security, revised edition. Alexandria: United States Department
of Agriculture, Food and Nutrition Service.
Bless, C. & Higson-Smith, C. (2000). Fundamentals of social research methods: an
African perspective, 3rd edition. Cape Town: Zebra Publications.
Bonti-Ankomah, S. (2001). Addressing food security in South Africa. The National
Institute for Economic Policy. Paper presented at the South African Regional and
Poverty Network (SARPN) conference on Land Reform and Poverty Alleviation in
103
Southern Africa. The National Institute for Economic Policy. Pretoria: South
Africa, 4-5 June 2001.
Carroll, T., Steyn, A., Zook, D., Funes, R., Rastegar, A. & Lien, Y. (2012). Catalyzing
Smallholder subsistence agricultural Finance. Dalberg Global Development
Advisors.
Chamberlin, J. (2008). Defining smallholder subsistence agriculture in Ghana.
International Food Policy Research Institute Discussion Paper 00823.
Development Strategy and Governance, IFPRI.
Chisaka, C. (2000). Gathering and analysis of data using qualitative research methods
in education. Paper presented at Conference held at Rand Afrikaans University,
South Africa, 24-26 July 2000.
Chisasa, J. & Makina, D. (2012). Trends in credit to smallholder subsistence farmers in
South Africa. International Business and Economics Research Journal, 11(7).
Coates, J., Frongillo, E.A., Roger, B.L., Webb, P., Wilde, P.E. & Houser, R. (2006).
Commonalities in the experiences of household food security across cultures:
What are measures missing? The Journal of Nutrition, 136(5), 1438-1448.
Coetzee, G. (2003). Agricultural finance in South Africa, In: L. Nieuwoudt & J.
Groenewald (Eds.). The challenge of change: Agriculture, land and the South
African economy. Pietermaritzburg: University of Natal Press.
Conradie, B. (n.d). Surveying commercial and subsistence agriculture. School of
Economics, University of Cape Town. Cape Town: UCT.
De Klerk M., Drimie S., Aliber M., Mini S., Mokoena R., Randela R., Modiselle S., Vogel
C., Swardt C. & Kirsten, J. (2004). Food security in South Africa: Key policy
issues for the medium term. Pretoria: Human Sciences Research Council.
Decrop, A. (1999). Qualitative research methods for the study of tourist behavior. In
Pizam & Mansfield. (Eds.). Consumer behaviour in travel and tourism.
Binghampton, New York: The Hawthorn Hospitality Press.
Denscombe, M. (1998). The good research guide for small-scale social research
projects. London: Open University Press.
104
Department of Agriculture (DoA). (2001). The strategic plan for South African
Agriculture. Pretoria: Department of Agriculture.
Department of Agriculture South Africa (DoA). (2002). The integrated food security
strategy for South Africa. Pretoria: Department of Agriculture.
Department for International Development (DFID). (2004). Agriculture, hunger and food
security. London: Department for International Development.
Devereux, S. & Maxwell, S. (2003). Food security in sub-Saharan Africa. London:
Instructional Design and Technology Group (IDTG) Publishing.
Du Toit, D.C. (2011). Food security. Department of Agriculture, Economic Services
Directorate, Pretoria.
Earl, A. (2011). Solving the food security crisis in South Africa: How food gardens can
alleviate hunger amongst the poor. Masters report.
Food and Agriculture Organization. (2003). The state of food insecurity in the world:
Monitoring progress towards the world food summit and Millennium Development
goals. Rome: FAO.
Food and Agricultural Organization. (2004). The state of food security in the world.
Washington DC: FAO.
Food and Agriculture Organization. (2006). The state of food insecurity in the world.
Rome: FAO.
Food and Agricultural Organization. (2008). Boosting food production in Africa’s
“breadbasket areas”: New collaboration among Rome-based United Nations
Agencies and Alliance for a Green Revolution in Africa (AGRA). Rome: FAO.
Food and Agricultural Organization. (2010). The State of Food Insecurity in the World: Addressing food insecurity in protracted crises. Rome: FAO.
Food and Agricultural Organization (2011). The State of Food Insecurity of the World:
How does international price volatility affect domestic economies and food
security? Rome, Italy: FAO, WFP, IFAD.
Feynes, T. & Meyer, N. (2003). Structure and production in South African agriculture. In
L. Nieuwoudt & J. Groenewald (Eds.). The challenge of change: Agriculture, land
and the South African economy. Pietermaritzburg: University of Natal Press.
105
Haen, H., Klasen, S. & Quaim, M. (2011). What do we really know? Metrics for food
insecurity and under-nutrition. Food Policy, 36: 760-769.
Hart, T. (2009). Food security review: South Africa and Southern Africa. Centre for
Poverty Employment and Growth. Pretoria: Human Sciences Research Council.
Hendricks, F. & Fraser, G. (2003) Obstacles to agricultural development in the
communal areas of the Eastern Cape. Report for the Eastern Cape provincial
growth and development plan.
Hendriks SL (2005). The challenges facing empirical estimation of household food
(in)security in South Africa. Development Southern Africa, 22(1): 103-123.
Hendriks, S.L. & Msaki, M.M. (2009). The impact of smallholder commercialization of
organic crops on food consumption patterns, dietary diversity and consumption
elasticities. Agrekon, 48(2): 184-199.
High Level Panel of Experts, (2012). Climate change and food security. A report by the
High Level Panel of Experts on Food Security and Nutrition. World Food
Security. Rome: HLPE.
Jacobs, P.T. (2009). The status of household food security targets in South Africa.
Agrekon, 48(4), 410-433.
Jennings, G. (2001). Tourism research, 2nd edition. Australia: John Wiley and Sons
Kalibwani, F. (2005). Food security in southern Africa: Current status, key policy
processes and key players at regional level. Promoting the use of CSOs’
evidence in policies for food security: An action research project in Southern
Africa.
Kepe, T. & Tessaro, D. (2012). Integrating food security with land reform: a more
effective policy for South Africa. Policy Brief no. 4. Centre for International
Governance Innovation-Africa Initiative, Canada.
Koch, J. (2011). The food security policy context in South Africa. Country Study.
International Policy Centre for Inclusive Growth, United Nations Development
Programme.
Labadarios, D., Swart, R., Maunder, E.M.W., Kruger, H.S., Gericke, G.J., Kuzwayo,
P.M.N., Ntsie, P.R., Steyn, N.P., Schloss, I., Dhansay, M.A., Jooste, P.L. &
106
Dannhauser, A. (2008). Executive summary of the national Food Consumption
Survey Fortification Baseline (NFCS-FB) South Africa, 2005. South African
Journal of Clinical Nutrition, 21(3), 247–300.
Leedy, P & Ormrod, J., (2004). Practical Research: Planning and Design (International
Edition or 8th Edition). New Jersey: Pearson Merrill Prentice Hall, Upper Saddle
River.
Leen, M. (2002). Hunger in a world of plenty: An ethical challenge in a globalizing world.
An Irish Quarterly Review, 91(361).
Limpopo Department of Economic Affairs and Tourism. (2001). Towards an alignment
of the provincial Growth and Development Strategy with Integrated Development
Plans. Waterberg District Summit Report, Polokwane.
Lyne, M.C., Hendricks, S.L. & Chitja, J.M. (2009). Agricultural growth and food security.
In Hendricks, S.L. & Lyne, M.C. (ed). Does food security improve when
smallholders access a niche market? Lessons from the Embo community in
South Africa. African Centre for Food Security: University of KwaZulu Natal.
Machethe, C.L. (2004). Agriculture and poverty in South Africa: Can agriculture reduce
poverty. Paper presented at the Overcoming Underdevelopment Conference
held in Pretoria, 28-29 October 2004.
Machethe, C.L, Mollel, N.M, Ayis, K., Mashatola, M.B., Anim, F.D.K., & Vanasche, F.
(2004). Smallholder irrigation and agricultural development in the Olifants River
food security issues. WRC Report no.1050/1/04. Pretoria: WRC.
Manona, S.S. (2005). Smallholder subsistence agriculture as local economic
development strategy in rural South Africa: exploring prospects in Pondoland,
Eastern Cape. Masters Thesis. Faculty of Economic and Management Sciences,
University of Western Cape.
McMillan, J.H. & Schumacher, S. (2001). Research in education: A conceptual
introduction, 5rd edition. New York: Longman.
Millennium Project Hunger Task Force. (2004). Halving hunger by 2015: A framework
for action. Interim report, Millennium Project, New York.
107
Mogalakwena Municipality. (2009). Integrated Development Plan (IDP) Document.
Developmental Services Directorate, Mogalakwena Municipality.
Morton, J.F. (2007). The impact of climate change on smallholder and subsistence
agriculture. Proceedings of the National Academic Sciences, 104 (50) 19680–
19685.
Mouton, J. (2001). How to succeed in your Masters and Doctoral studies: A South
African guide resource book. Pretoria: Van Schaik.
Mudhara, M. (2010). Smallholder subsistence agriculture in South Africa: A diagnosis
of bottlenecks and public policy options. Conference paper presented at
‘Overcoming inequality and structural poverty in South Africa: Towards inclusive
growth and development’, Johannesburg, 20-22 September 2010.
Mukumbi, K. (2008). South Africa’s agriculture broad based black economic
empowerment policy: implications from a domestic content model. Masters
Thesis. Department of Agricultural, Food and Resource Economics, Michigan
State University.
Nyanga, P.H. (2012). Food security, conservation agriculture and pulses: Evidence from
smallholder subsistence farmers in Zambia. Journal of Food Research, 1(2).
Nyange, N.E., Kingamkono, R.R., Kullaya, A.K. & Mneney, E.E. (2011). Biotechnology
for sustainable agriculture, food security and poverty reduction in Africa. Access
Not Excess ed Charles Pasternak, Chapter 3, 19-30. Smith-Gordon.
Oettle, N., Fakir, S., Wentzel, W., Giddings, S. & Whiteside, M. (1998). Encouraging
sustainable smallholder subsistence agriculture in South Africa. Environment and
Development Consultancy Ltd.
Organisation for Economic Co-operation and Development. (2006). Review of
Agricultural Policies in South Africa. Policy Brief, 1-8. OECD Observer.
Omotesho, O.M., Adewumi, M.O. & Fadimula, K.S. (2010). Food security and poverty of
the rural households in Kwara State, Nigeria. Libyan Agriculture Research Center
Journal International, 1(1), 56-59.
Oni, S.A., Nevamvuni, A.E., Odhiambo, J.J.O. & Dagada, M.C. (2003). Study of
agricultural industry in the Limpopo Province: Executive Summary. Limpopo
108
Province: Department of Agricultural Economics and Extention: Centre for Rural
Development.
Oni, S.A., Maliwichi, L.L. & Obadire, O.S. (2011). Assessing the contribution of
smallholder irrigation to household food security, in comparison to dry-land
farming in Vhembe District of Limpopo Province, South Africa. Africa Journal of
Agricultural Research, 6(10), 2188-2197.
Oni, S.A., Nevamvuni, A.E., Odhiambo, J.J.O. & Dagada, M.C. (n.d.). Study of
agricultural industry in the Limpopo Province: Executive Summary. Limpopo
Province: Department of Agricultural Economics and Extention: Centre for Rural
Development.
Pauw. (2007). Agriculture and poverty: Farming for food or farming for money?
Agrekon, 46 (2), 195-218.
Polit, D.E. (2001). Essentials of qualitative research, 3rd edition. New York: Eippincott,
Williams and Wilkins.
Reddy, V. & Moletsane, R. (2011). The gendered dimensions of food security in South
Africa: a review of the literature. Pretoria: HSRC.
Reily, F., Mock, N., Cogill, B., Bailey, L. & Kenefick, E. (1999). Food security indicators
and framework for use in the monitoring and evaluation of food aid programmes.
Washington, DC: United State Agency for International Development.
Salami, A., Kamara, A.B., & Brixiova, Z. (2010). Smallholder subsistence agriculture in
East Africa: Trends, Constraints and Opportunities. Working Paper Series No.
105. African Development Bank: Tunis.
South African Social Investment Exchange (SASIX). (2007). Food security projects.
www.sasix.co.za. Accessed: 20-09-2010.
Sowman, M. & Cardoso P. (2010). Small-scale fisheries and food security strategies in
countries in the Benguela Current Large Marine Ecosystem (BCLME) region:
Angola, Namibia and South Africa. Marine Policy, 34: 1163-1170.
Statistics South Africa [Stats SA] (2000). Measuring poverty in South Africa. Pretoria:
Stats SA.
109
Statistics South Africa. (2007). Income and Expenditure Survey 2005/06. Pretoria: Stats
SA.
Statistics South Africa. (2009). Census of commercial agriculture 2007. Pretoria: Stats
SA.
Thompson et al. (2005). Evaluating the quality of evidence from correlational research
for evidence-based practice. Council for Exceptional Children, 71(2), 181-194.
Tregurtha and Vink. (2008). Review of agricultural policies and support instruments
1994-2007. Presidency Fifteen Year Review Project.
Tscharntke, T., Clough, Y., Wanger, T.C., Jackson, L., Motzke, I., Perfecto, I.,
Vandermeer, J. & Whitbread, A. (2012). Biological Conservation: (in press).
Viljoen, M.F. (2005). South African Agricultural Policy 1994 to 2004: Some reflections.
Agrekon, 44 (1), 1-16.
Welman, J. C. & Kruger, S. J. (2001), Research Methodology - for the Business and
Administrative Sciences, 2. ed, Oxford University Press Southern Africa, Cape
Town, South Africa.
Wenhold, F.A.M., Faber, M., Averbeke, W., Oelofse, A., Jaarsveld, P., van Rensburg,
W.S.J., van Heerden, I. & Slabbert, R. (2007). Linking smallholder subsistence
agriculture and water to household food security and nutrition. Water South Africa,
33(3): 321-336.
Zhou, Y. (2010). Smallholder subsistence agriculture, Sustainability and the Syngenta
Foundation. Syngenta Foundation for Sustainable Agriculture.
110
Appendix A: Survey Questionnaire for Maroteng Village
Survey Questionnaire for Maroteng Village
The Questionnaire is designed to survey smallholder subsistence farmers for Master of Administration in Development entitled “The Contributions of Smallholder subsistence agriculture towards Household Food Security in Maroteng Village, Limpopo Province, South Africa”
This research paper is registered with the University of Limpopo, Turfloop Campus Faculty of Management Science and Law, School for Economics and Management, Department of Development Planning and Management
The questionnaire is designed to collect information on the opinions of individuals. Please assist by providing information required in this questionnaire. The responses will be kept strictly confidential, strictly only for the purposes of this study hence we guarantee you anonymity.
Thank you in anticipation for your participation in this study
Section A: Demographic Profile
1. Where do you originally come from? …………………………
2. Gender of the Farmer: [ ] Male [ ] Female
3. Are you the head or the main provider of this household? [ ] Yes [ ] No
4. What is your age group? [ ] Under 18 years [ ] 19 – 35years [ ] 36 – 50 years [ ] Over 51 years
5. Indicate the highest level of education obtained. [ ] Primary school [ ] Secondary school [ ] College/ University [ ] No formal education
6. What is the size of the household? …………………………
111
7. What is your employment status? [ ] Unemployed [ ] Employed [ ] Self Employed [ ] Other……….
8. What is your monthly income? [ ] Less than R1000 [ ] Between R1001and R5000 [ ] Over R5000 [ ] No income
9. What is your extra source of income? [ ] No source [ ] Remittances [ ] Social grants [ ] Farming [ ] Other……….........
10. How much do you spend on food monthly? [ ] Less than R500 [ ] Between R500 and R1000 [ ] More than R1000
Section B: Types and Characteristics of Smallholder subsistence agriculture
11. What kind of smallholder subsistence agriculture do you practice? [ ] Poultry [ ] Livestock [ ] Vegetable gardening [ ] Crop [ ] Other…………………….......
12. Where is your farm situated? [ ] On the stand I reside on [ ] On another site [ ] Both [ ] Other………………...
13. What is the total size of the farm in square metres (m2)? [ ] Less than 100m2
[ ] Between 100m2 and 500m2 [ ] More than 500m2
14. Why do you engage in smallholder subsistence agriculture? [ ] For subsistence/household consumption [ ] Extra source of income [ ] Business/for sale [ ] Other ……………
15. What is the ownership of the farm? [ ] Individual [ ] Family [ ] Partnership [ ] Public Company [ ] Private Company [ ] Public Corporation [ ] Close Corporation
16. How long have you been practicing smallholder subsistence agriculture? [ ] 0-5 Years [ ] 5-10 Years [ ] 10-15 Years [ ]15-20 Years [ ] Above 20 Years [ ]
17. How is the farm operating? [ ] Seasonal [ ] Full time [ ] Part time [ ] Other …
18. If you keep livestock, please list the type of livestock kept and the number of each.
19. If engaging in crop farming, what do you plough? [ ] Maize [ ] Rice [ ] Sorghum [ ] Vegetables [ ] Other ………………
20. What is the source of your irrigation water? [ ] Borehole [ ] River/Dam [ ] Water vendor [ ] Other…………………………
112
21. How many days a week do you engage in farming? [ ] One day [ ] Two-Four days [ ] More than five days [ ] Not applicable
Section C: Household Food Security Trends
22. What was your main activity of production? [ ] Vegetable gardening [ ] Crop farming [ ] Livestock [ ] Other ………………………
23. What was the level of production? [ ] Lower [ ] Low [ ] High [ ] Higher [ ] Other
24. What has been the quality of your products or produce? [ ] Very poor [ ] Poor [ ] Good [ ] Very good [ ] Not applicable [ ] Other …………………..
25. What was the purpose of practicing your farming? [ ] Household consumption/subsistence [ ] For sale/business [ ] Extra source of income [ ] Other...
26. What challenges have you faced or experienced since practicing smallholder subsistence agriculture?
[ ] Lack of resources/skills [ ] Low productivity [ ] Lack of market [ ] Other………..
27. Which food coping strategy do you adopt when you have no food and no money to buy food? [ ] Farming/gardening [ ] Hawker/vendor [ ] Remittances [ ] Social grants [ ] Other …………………………
Section D: Determinants of Household Food Security
28. How do you get food? [ ] Markets [ ] Street vendor [ ] Own produce [ ] Other……
29. How often do you get food from the above mentioned option? [ ] More often [ ] Less often [ ] Regularly [ ] Other………………………..
30. If you buy food, how much do you spend? [ ] Less than R100 [ ] Between R101 and R500 [ ] More than R500 [ ] Not Applicable
31. If you produce own food, how much do you harvest or produce? [ ] Too Little [ ] Little [ ] Enough [ ] Too Much [ ] Not Applicable
113
32. What proportion of household food do you obtain from the farm? [ ] None(0 – 10%) [ ] Little (10 – 20%) [ ] Some (20 – 40%) [ ] Half (40 – 60%) [ ] Much (60 – 80%) [ ] Most (Over 80%)
33. What is the quality of food you produce? [ ] Very poor [ ] Poor [ ] Good [ ] Very good [ ] Not sure
34. What is your level of satisfaction with production? [ ] Less satisfied [ ] Satisfied
[ ] Highly satisfied [ ] Not sure [ ] Other…………………
Section E: Indicators of Household Food Security
35. How many meals do you usually have each day? [ ] Breakfast only [ ] Breakfast and lunch only [ ] Lunch only [ ] Lunch and supper only [ ] Breakfast and supper only [ ] Breakfast, lunch and supper [ ] Nothing to eat
36. How many members of the family depend on your daily meal? [ ] Less than 3 [ ] 3-5 [ ] 5-8 [ ] 8-10 [ ] More than 10 [ ] Not applicable
37. How much does daily meal cost? [ ] Less than R20 [ ] Between R20 and R50 [ ] Between R50 and R80 [ ] More than R80 [ ] Not sure [ ] Not applicable
38. What kind of meal do you have for breakfast? [ ] Tea only [ ] Tea and Bread only
[ ] Beacon and eggs with cold drink/tea [ ] Bread and cold drink [ ] Not applicable [ ] Other
39. What kind of meal do you have for lunch? [ ] Pap and vleis [ ] Vegetable salad [ ] Rice and vleis [ ] Other ………………………..
40. What kind of meal do you have for supper? [ ] Pap and vleis [ ] Vegetable salad [ ] Rice and vleis [ ] Other ………………………..
41. How often do you eat the kind of meals mentioned above? [ ] Every day [ ] Once a week [ ] Twice a week [ ] Thrice a week [ ] Other ………………..
42. How do you get those foods? [ ] Home cooked [ ] Neighbours [ ] Family members [ ] Events [ ] Other ……………
114
Section F: Contributions of Smallholder subsistence agriculture towards Household Food Security
43. How much did you produce or harvest recently from practicing smallholder subsistence agriculture? [ ] Too little [ ] Enough [ ] More [ ] Too much
44. What proportion of produce from the farm you obtained is for household consumption? [ ] None (0 – 10%) [ ] Little (10 – 20%) [ ] Some (20 – 40%) [ ] Half (40 – 60%) [ ] Much (60 – 80%) [ ] Most (Over 80%)
45. If you sell or give away any of the products that you grow, what is the proportion you sell or give away? [ ] Not applicable [ ] Little (0 – 20%) [ ] Some (20 – 40%) [ ] Half (40 – 60%) [ ] Much (60 – 80%) [ ] Most (Over 80%)
45. To whom do you sell or give away your products? [ ] Not applicable [ ] Community members [ ] Street vendors [ ] Supermarkets [ ] Family members [ ] Not applicable [ ] Other…………………..
46. How many family members are employed or help on your farm? [ ] Less than two [ ] Three [ ] Four [ ] More than five
47. How many people do you employ or help on your farm?
[ ] Less than five [ ] Between five and ten [ ] Between ten and twenty [ ] More than twenty
48. How do you pay them? [ ] Food parcels from the farm [ ] Stipend [ ] Do not pay [ ] Other………
49. How much income (in rand) do you generate the practicing smallholder subsistence agriculture? [ ] Less than R100 [ ] Between R101 and R500 [ ] More than R500 [ ] Not applicable
50. What do you do with income generated? [ ] purchase food for household consumption [ ] Investment [ ] Saving [ ] purchase farming resources [ ] Other ………
51. How much of the income generated do you use for household food consumption? [ ] Less than R100 [ ] Between R101 and R500 [ ] More than R500 [ ] Not applicable
Section G: Recommendations
52. What kind of support do you need to enhance and ensure sustainability of smallholder subsistence agriculture? [ ] Technical [ ] Financial [ ] Skill development [ ] Other …
115
53. Where or who do you think should provide the support mentioned above? [ ] Private sector [ ] Government [ ] NGO’s [ ] Other …………………………
54. What kind of constraints do you encounter when practicing smallholder subsistence agriculture?
[ ] Technical [ ] institutional [ ] Not sure [ ] Other ……………………....
55. What would you say about the current nature of smallholder subsistence agriculture?
……………………………………………………………………………………………………
Thank you for your cooperation and support.