Embed Size (px)
Citation preview
The Cost of Teacher Turnover in Five School Districts: A Pilot Study
By
Gary Barnes, Ph.D. Consultant
National Commission on Teaching and America’s Future
Edward Crowe, Ph.D. Senior Consultant
National Commission on Teaching and America’s Future
Benjamin Schaefer Program Manager
National Commission on Teaching and America’s Future
This research was supported by Rockefeller Foundation Grants #2003WC097 & 2004WC129, along with Joyce Foundation Grant #29542 and Spencer Foundation Grant #200700049. Opinions in this paper reflect those of the National Commission on Teaching and America’s Future and do not necessarily reflect those of the granting agencies.
Abstract
In this paper, we report the results of a pilot study of the cost of teacher turnover in five school districts. We examine the rate of turnover, the relationship between turnover and teacher and school characteristics, and the costs associated with recruiting, hiring, and training replacement teachers. We find evidence that turnover costs, although difficult to quantify, are significant at both the district and the school level. We also find that teachers left high minority and low performing schools at significantly higher rates. This has implications for the differential impact of the costs of teacher turnover on high-need schools. The relationship between teacher turnover and other school and teacher characteristics varied across the five school districts.
Contents
Page
Executive Summary ...................................................................................................... 4
The Case …................................................................................................................... 7
The Study .................................................................................................................... 11
The Process ................................................................................................................. 17
Teachers ...................................................................................................................... 19
Results …………............................................................................................. 23
Schools ........................................................................................................................ 33
Results ............................................................................................................. 37
Regression Analysis .................................................................................................... 50
Results ............................................................................................................. 56
Costs ………………………………………………………………………………... 69
Analysis of Turnover Costs …………………………………………………. 82
Cost Implications ……………………………………………………………. 85
Lessons Learned …………………………………………………………………….. 88
Recommendations ………………………………………………………………….. 90
References …………………………………………………………………………... 94
4
Executive Summary The Cost of Teacher Turnover Low performing schools rarely close the student achievement gap because they never close the teaching quality gap – they are constantly rebuilding their staff. An inordinate amount of their capital – both human and financial – is consumed by the constant process of hiring and replacing beginning teachers who leave before they have mastered the ability to create a successful learning culture for their students.
Student achievement suffers, but high turnover schools are also extremely costly
to operate. Trapped in a chronic cycle of teacher hiring and replacement these schools drain their districts of precious dollars that could be better spent to improve teaching quality and student achievement.
Several previous studies have attempted to estimate the costs, but the majority of
the studies have not been based on actual cost data from specific districts. Instead the previous studies relied on turnover formulas derived from industry to estimate turnover costs in education. The size of these estimates is staggering. But because these estimates are not derived from a detailed analysis of actual school data, and because they do not provide school leaders with the specific management tools they could use to control costs, the findings of these previous studies have been downplayed by policymakers.
To overcome these problems, the National Commission on Teaching and
America’s Future (NCTAF) conducted a pilot study of actual cost data. The study provides school leaders with a detailed picture of the recruitment, hiring, and replacement costs in five school districts. The Study
NCTAF’s pilot study quantifies the real costs of teacher turnover in five school
districts. These districts, Chicago Public Schools (IL), Milwaukee Public Schools (WI), Granville County Schools (NC), along with Jemez Valley Public Schools and Santa Rosa Public Schools (NM), represent a range of communities, large and small, urban and rural. The study is summarized in the findings and recommendations below. The data collection and analysis protocol that was used in this study was the basis for the development of the NCTAF Teacher Turnover Cost Calculator that other schools and districts can use to estimate the costs they incur each year when teachers leave [www.nctaf.org]. Key Findings
1. The costs of teacher turnover are substantial. In both small and large districts, the study found that the costs of recruiting, hiring, and training a replacement teacher are substantial. In Granville County, North Carolina, the cost of each teacher who left the district was just under $10,000. In a small rural district

5
such as Jemez Valley, New Mexico, the cost per teacher leaver is $4,366. In Milwaukee, the average cost per teacher leaver was $15,325. In a very large district like Chicago, the average cost was $17,872 per leaver. The total cost of turnover in the Chicago Public Schools is estimated to be over $86 million per year. It is clear that thousands of dollars walk out the door each time a teacher leaves.
2. Teacher turnover undermines at-risk schools. Low school performance and high poverty were correlated with high teacher turnover in both in the Milwaukee and Chicago Public Schools.
3. At-risk schools spend scarce dollars on teacher turnover. Low performing, high minority, and high poverty schools expend scarce resources on teacher turnover. Because teacher attrition rates in these at-risk schools are chronically high, turnover costs become a drain on already scarce resources that could otherwise be invested to improve teaching effectiveness and student growth.
4. At-risk schools could recoup funds by investing in teacher retention. An up-front investment in retaining teachers can reduce teacher turnover, and thus reduce the costs associated with teacher turnover. For example, Chicago Public Schools lose $17,872 on every teacher who leaves the district. By implementing an effective retention strategy, such as a high quality induction program at a cost of $6,000 per teacher, Chicago could reduce teacher turnover and save millions of dollars.
5. Turnover costs can be identified, aggregated, and analyzed. Teacher turnover can be calculated and the costs associated with teacher turnover can be aggregated. When combined, this information allows districts to analyze which teachers are leaving, from where they are leaving, and how to invest in teacher retention in order to reduce turnover costs.
6. District data systems are not designed to control the costs of turnover. Rather than providing access to relevant information, most district data systems stand as formidable obstacles to managing and controlling turnover. The costs of turnover are hidden in mounds of teacher records, school data, and district financial information. Without new, coherent data systems that break down the silos of existing systems, calculating the full cost of teacher turnover is difficult for many districts Recommendations
1. Invest in new teacher support and development Comprehensive induction programs have been proven to increase teacher retention and improve student achievement. The costs of such programs could be offset by the savings achieved through decreases in the costs of turnover.
6
2. Target comprehensive retention strategies to at-risk schools Teachers leave at-risk (low-income, high-minority, low-performing) schools at high rates. Retention initiatives in these schools have the greatest potential for a high return on investment, both in terms of resources and school performance.
3. Track teacher turnover and its costs annually In order to make sound decisions, school leaders and policymakers need data on teacher turnover and its costs. By tracking teachers and costs year by year, school leaders and policymakers will be able to determine where to invest in teacher retention and the impact of these investments.
4. Amend NCLB to hold school leaders accountable for turnover and its costs To ensure that every child has access to a school with a rate of teacher attrition and experience that is comparable to all other schools served by its local education agency, each local and state education agency should be required to publicly report the distribution of qualified teachers, the average years of teaching experience in each school, the annual rate of teacher and principal attrition, and the cost of that attrition for each school it serves.
5. Upgrade district data systems Most districts have huge collections of data on the cost elements associated with teacher turnover, but the current data systems stand in the way of accurate and timely analysis. Coherent data systems should be created to house cost data in a way that is easily accessible and analyzable. Teacher turnover data should be added to current systems and should be included in the design of new systems. With easily accessible data, districts could begin to analyze and manage teacher turnover and its costs. Robust data systems that provide sufficient information about teacher effectiveness in specific schools will also enable district human resource departments to be increasingly accountable for the retention of high quality teachers. The Teacher Turnover Cost Calculator
Using the data collection and analysis protocol from this study, NCTAF has created a Teacher Turnover Cost Calculator to make these findings accessible to school leaders and members of the public. Using the NCTAF Teacher Turnover Cost Calculator, educators and members of the public can estimate the dollars spent on teacher turnover for a specific school or school district anywhere in the country. The Calculator contains enough background information on this tool to enable school leaders to design and conduct their own detailed turnover cost analyses. NCTAF’s Teacher Turnover Cost Calculator can be found at www.nctaf.org. At the site, NCTAF will host a Wiki for discussion and comparison of costs that have been calculated by users in communities around the country.
7
The Cost of Teacher Turnover Study examined teacher turnover and its costs in
five school districts: Chicago Public Schools (CPS), Milwaukee Public Schools (MPS),
Granville County Schools (GCS), Jemez Valley Public Schools (JVPS), and Santa Rosa
Public Schools (SRPS). The goals of the study were to assist school leaders and inform
policymakers by testing the feasibility of collecting actual turnover costs and providing a
sense of the magnitude of these costs. This paper examines prior work on the cost of
turnover, reports the results of the study, and presents several implications and
recommendations based on the findings.
THE RATIONALE
In recent years compelling evidence has emerged that teacher turnover is a
significant problem affecting school performance and student achievement (Grissmer and
Kirby, 1987 and 1997; Ingersoll, 2001). Drawing on the Schools and Staffing Survey
(SASS) from the National Center on Education Statistics (NCES), the National
Commission on Teaching and America’s Future (NCTAF) reported in 2003 that
approximately a third of America’s new teachers leave teaching sometime during their
first three years of teaching; almost half leave during the first five years. In many cases,
keeping our schools supplied with qualified teachers is comparable to trying to fill a
bucket with a huge hole in the bottom. Teaching is increasingly an “occupation with
relatively high flows in, through, and out of schools” (NCTAF, 2003, 21-40).
Equally evident from the data is the differential impact of teacher turnover on
schools (Center for the Future of Teaching and Learning, 2001; NCTAF, 2003).
NCTAF’s analysis of the SASS data found that teacher turnover is almost a third higher
in low-income urban school districts (NCTAF, p. 28). Further confirmation of the
relationship between teacher turnover and school characteristics comes from the largest
analysis of school-level turnover conducted to date. The Southeast Center for Teaching
Quality (SECTQ) used employment and teacher turnover data for 270,000 teachers in
over 7,000 schools across five states - every school and every classroom teacher in those
states. SECTQ found that “the highest rate of teacher turnover occurs in schools where
75% or more of the student body is eligible” for free and reduced price meals (SECTQ,
8
2003). For high poverty schools, the teacher turnover rate was 5.5% above the average.
The same multi-state analysis of 7,000 schools found teacher turnover rates higher at
low-performing schools than in other schools. For schools with low pupil achievement,
the teacher turnover rate was 5.6% above the average. While the SECTQ study
determined that teacher turnover varies with school performance, other studies establish a
clearer link between teacher turnover and student achievement.
The NCTAF and SECTQ studies measured the impact of student performance on
teacher turnover at the school level. Recent studies have supported the connection
between student performance and teacher turnover. In a study of Texas students and
teachers in grades 4-8, Hanushek et al. (2004) reported that the teachers in lower
achieving schools tended to leave at higher rates than teachers in higher achieving
schools. The study included hundreds of thousands of teachers and more than fifty
thousand pupils and found that “teaching lower achieving students is a strong factor in
decisions to leave Texas public schools, and the magnitude of the effect holds across the
full range of teacher experience” (Hanushek, Kain, and Rivkin, 2004). This is not just a
U.S. phenomenon. A large-scale study of teacher turnover in Norway reported that
teachers of lower performing students were more likely to move or leave teaching (Falch
and Ronning, 2005, 14).
These studies suggest that lower student achievement leads to higher teacher
turnover. What about the impact of teacher turnover on student achievement? Studies of
“teacher effects” demonstrate a strong relationship between teaching and student
achievement gains (Sanders and Rivers, 1996; Wright, Horn and Sanders, 1997; Mendro,
Jordan, Gomez, Anderson, and Bembry, 1998; Rivkin, Hanushek and Kain, 2005). These
studies also argue that teacher effectiveness improves with experience during the early
years of a teacher’s career (McCaffrey, Koretz, Lockwood, and Hamilton, 2003; Rivkin
et al., 2005; Skolnik et al., 2002). Based on this research, it stands to reason that student
achievement will suffer when students are continually faced with a parade of
inexperienced teachers. In a vicious cycle, teacher turnover lowers student achievement,
and lower student achievement leads to teacher turnover.
In addition to impacting student achievement, teacher turnover forces school
districts and states to spend money on recruiting, hiring, and training replacements. While
9
it makes intuitive sense that high teacher turnover has significant financial consequences
for the education system, there are few studies of what it costs to lose teachers. A key
question is whether the costs associated with teacher turnover can, in fact, be identified
and measured in a consistent manner. This question is the focus of the Cost of Teacher
Turnover Study.
Most studies of teacher turnover costs have produced estimates that are quite
large, ranging from 20 percent to 200 percent of the leaving teacher’s salary (Table 1).
However, because these estimates are based on incomplete methodologies, and because
the estimates vary so widely, they have had little practical utility for policymakers. A
recent—and welcome exception—is a 2006 paper by Shockley and his colleagues on the
costs of teacher turnover in two Florida school districts.1 For the most part, though,
teacher turnover costs have only recently been a focus of education researchers.
A Texas analysis is the first large scale study to have addressed the topic of
teacher turnover costs by using actual data on the rate of teacher turnover in public
schools (Texas Center for Educational Research, 2000). The study was flawed, however,
because it used an industrial model to estimate costs in schools, and because it failed to
account fully for costs in its more in-depth study of three school districts. A Chicago
study used three models for estimating teacher turnover costs, where the actual teacher
turnover data was available for sixty-four elementary schools (ACORN, 2004). None of
the models used actual costs, however, and the assumptions for estimating costs under
each model produced widely varying results. A third study of turnover costs – based on a
formula and not actual cost calculations – was produced by Breaux and Long (2003). The
study drew on the work of human resource specialists in industry and concluded that the
loss of a teacher costs nearly 2.5 times the teacher’s initial salary in recruitment,
personnel expenditures and lost productivity. In a 2005 policy brief on turnover costs, the
Alliance for Excellent Education tapped a US Department of Labor estimate “that
attrition costs an employer 30% of the leaving employee’s salary”. The Alliance
estimated national teacher turnover costs at $4.9 billion, only about twice as high as the
upper bound for the Texas report of annual costs for Texas alone.
1 Shockley, R., Guglielmino, P., and Watlington, E. (2006). The Costs of Teacher Attrition.
10
Table 1: Summary of Results from Earlier Reports and Studies
Study Area
Number of
Teachers
Reported Turnover
Rate Claimed Cost of
Teacher Turnover Claimed Cost per Turnover
Texas Center for Educational
Research (2000)
Texas Public
Schools 258,000 15.5% Model 1: $329M
Model 2: $2.1B Model 1: $8,227 Model 2: $52,513
Chicago ACORN (2003)
64 Chicago Public
Schools
2377 22.9%
Model 1: $ 5.6M Model 2: $42.2M Model 3: $34.7M
Model 1: $10,294 Model 2: $77,574 Model 3: $63,787
Breaux & Wong (2003) Nation
Model 1: 2.5 x initial salary Model 2: 1.75 x initial salary
Alliance for Excellent
Education (2005) Nation 2,998,795 13.1% $4.9B $12,546
Shockley et al. (2006)
2 Florida districts
Broward: 1206
St. Lucie: 320
Broward: 7.25%
St. Lucie: 16.4%
Broward: $15.3M St. Lucie: $1.48M
Broward: $12,652 St. Lucie: $4,631
The most recent study of turnover costs is the only one that appears to make use
of real cost data (instead of estimates derived from other fields). Shockley and his
colleagues (2006) conducted a study of teacher turnover in two countywide Florida
school districts. Broward County, where Fort Lauderdale is located, had a one-year
turnover rate of 7.25% and an average cost of turnover per teacher of $12,652. St. Lucie,
on the other hand, had annual one-year turnover of 16.4% and a cost per teacher of
$4,631. The authors explain the differential turnover costs this way: “A possible
explanation … is the infrastructure investment that the Broward County School System is
making in their teacher/induction support system” (Shockley et al., 2006, 6). This is a
plausible and highly interesting association of induction, lower turnover, and higher costs
per teacher. The paper does not discuss directly the cost of induction, but the authors did
collect detailed expenditure information from the two districts (personal communication,
Sept. 14, 2006).
11
These studies have made contributions by establishing the possible scope and
scale of teacher turnover costs, but important empirical work remains to be done. Since
many of the approaches estimate teacher turnover costs using either borrowed, but
untested, formulas, or calculate turnover costs from incomplete data on actual costs, work
on the cost of teacher turnover must move to the next level by implementing a protocol
for collecting actual turnover cost data. Shockley and his Florida colleagues have made
an important contribution here. It seems reasonable to think that accurate data on the true
magnitude of turnover costs will provide district and state policymakers with a strong
basis for data-based decisions that help them to manage the costs of turnover.
THE STUDY
To strengthen the existing knowledge base, NCTAF conducted a cost of teacher
turnover study in five school districts. The study sought to determine how several
variables impact teacher turnover and attempted to calculate actual district costs
associated with teacher turnover. To accomplish these goals, we first developed a
working definition of teacher turnover, cost categories associated with turnover, and
several hypotheses.
Defining teacher turnover
The starting point for this and other research on teacher turnover is a clear
definition of what is meant by the term. In 2003-04, NCTAF worked with a national
research panel through a project funded by the Rockefeller Foundation to develop a
working definition of teacher turnover. This definition builds on the work of Richard
Ingersoll (Ingersoll, 2001 and 2003; Ingersoll and Smith, 2003) and on the analyses and
policy recommendations made by NCTAF in its 2003 report, No Dream Denied: A
Pledge to America’s Children. The definition of teacher turnover has three dimensions:
• Within-District Movers: Teachers employed in a classroom teaching role in a
school in Year 1 (e.g., 2002-03) who are employed as classroom teachers at a
12
different school in the same district in Year 2 (e.g., 2003-04), constitute a group
defined as “cross-school, within-district movers”;
• Cross-District Movers: Teachers employed in a classroom teaching role in a
school in Year 1 who are employed as classroom teachers at a different school
and a different district in Year 2, are described by NCTAF as “cross-school,
cross-district movers”;
• Leavers: Teachers employed in a classroom-teaching role in a school in Year 1
and not employed as classroom teachers in any district in Year 2 are described as
“leavers”.
Different researchers utilize different combinations of these three groups. Krieg’s
analysis of teacher turnover and pupil achievement in Washington State focuses only on
teachers who leave the profession (Krieg, 2004). Feng’s study of public school teachers
in Florida describes the same kinds of teacher turnover employed by this paper (Feng,
2005, 2), but concentrates on leavers because “migration does not represent a net loss in
the total supply of public school teachers” (Feng, 3). Scafidi and his colleagues make the
same choice in their Georgia study of whether teachers leave the classroom for higher
paying jobs (Scafidi et al., 2003). Like Ingersoll (2003), we define teacher turnover as the
combined total of those who move and those who leave, although our base of reference in
defining these measures is the individual district. Thus we define movers as within-
district movers only, and leavers as those who leave the district, whether to teach in
another school outside the district or to leave teaching altogether. Like Ingersoll, we
reason that movers and leavers have the same impact on the specific school whose
employment they depart from, whether or not they exit the profession.
Cost categories
In initial work with the national research panel, NCTAF identified eight cost
elements that must be considered when examining the actual cost of teacher turnover.
These cost elements were refined during discussions with the participating school
13
districts. Some costs are direct expenditures (e.g., advertising, recruiting, and hiring
incentives). Others derive from the proportional value of time spent by school or district
administrators interviewing teacher candidates, doing outplacement, and so on. Similarly,
the locus of costs varies by the nature of the activity. Some costs occur at the school
level, while others occur at the district level (Hertert, 1995; Miles and Roza, 2002). The
eight cost categories are:
1. Recruitment and Advertising, including the cost of advertising space, the cost of
travel to job fairs and interview sites, the design of advertising formats, website
design and development costs, posting information on recruitment websites,
responding to inquiries from prospective candidates, coordinating recruitment
activities with state programs, working with teacher preparation programs to
identify strong candidates, training student teachers, special costs associated with
overseas recruiting, etc.
2. Special Incentives, including signing bonuses, payment of moving expenses,
salary supplements, housing allowances, rent subsidies, relocation bonuses, day
care subsidies, reduced teaching loads, etc.
3. Administrative Processing of new hires and costs associated with separation,
including criminal background checks, health record checks, reference checks,
meeting with candidates and members of search committees, completing
affirmative action paperwork, corresponding with applicants, drafting letters of
acceptance/rejection, setting up interview and visitation schedules, purchasing
equipment for digital fingerprinting, archiving teacher records, adding new
teachers to payroll and benefit programs, conducting exit surveys, removing
teachers from payroll and health plans, processing refunds of retirement
contributions that may be due, etc.
4. Training for New Hires, including introducing new hires and teacher transfers to
school goals and governance procedures; integrating new hires into the
community of other teachers, staff, parents, and students; explaining benefit
programs; conducting tours of facilities and school resources; etc.
14
5. Training for First-Time Teachers, including mentoring programs and related
forms of structured induction, stipends for mentors, payments to substitutes who
replace mentors with reduced teaching loads, travel to training sessions, etc.
6. Training for All Teachers, including instruction on the goals and specific
elements of the state’s testing programs, training mentor teachers, workshops and
professional development activities, salaries for substitutes used to cover for
teachers at training activities, tuition and fees reimbursements, travel to
professional meetings, etc.
7. Learning Curve, including the cost to student learning at the school that results
from having new teachers each year and from having a teaching staff with little
experience.
8. Transfer, including paperwork to change a teacher’s school sites, time and effort
spent matching a teacher with a new school, salaries for substitutes used to cover
for teachers who transfer during the school year, etc.
While some costs, such as recruitment, are only incurred when a teacher leaves
the district, other costs are incurred for both movers and leavers. For instance, school-
based orientation programs for new hires are necessary for all new teachers, even if they
move from one school in a district to another school in the same district. This is not true
of professional development costs at the district level. Movers carry their professional
development training from one school to another and such a move does not cost the
district additional professional development funds, although changes in teaching
assignments and other activities unique to a new school may alter the nature and content
of professional development that teachers will require. The cost categories are more rigid
than the reality at the school and district level, and this presented a challenge to collecting
accurate costs.
Hypotheses The literature on teacher turnover discussed earlier supports the view that teacher
turnover has significant learning and monetary costs for school districts. Drawing on
previous work, therefore, the NCTAF study tested the following hypotheses:

15
1. Turnover costs can be identified, aggregated, and analyzed at the district and
school level. Previous efforts have attempted to estimate the costs of teacher
turnover. Few school districts or states currently have the tools to track their
teacher turnover; fewer still have the tools to track or control their turnover costs.
As a result, the data and tools needed to understand how a school district’s
financial resources could be saved through reductions in the incidence and costs
of teacher turnover, and redirected to investments in teacher support systems,
simply do not exist. This pilot study examined the process of collecting and
making sense of turnover costs.
2. Turnover costs will vary by school type (urban/rural, rich/poor, high
achieving/low achieving). This hypothesis drove the selection of school and
district sites for the data collection and analysis—explained in the next section of
this paper. We expect that turnover costs are lowest in suburban schools, but it is
not entirely clear whether to expect urban turnover costs to be higher or lower
than those in rural schools and districts. At the school level, the study tests the
argument that turnover costs are higher in urban schools, higher in poor schools
(as measured by student participation in the school lunch program), and higher in
low-achieving schools.
3. Higher performing schools will have lower levels of teacher turnover, and
conversely, lower performing schools will have higher levels of teacher
turnover. Even after controlling for a wide variety of school, teacher, and context
variables, studies by Hanushek et al. and others find a strong “rookie teacher”
effect. Teachers in their first few years of teaching do not perform as well as
teachers with a few years experience. This indicates that schools with high
turnover and high percentages of new teachers will have lower student
achievement than schools with less new teachers. The NCTAF study design
includes low- and high-performing schools, calculates their respective turnover
rates, and measures the costs per teacher and per school.

16
4. Schools with higher turnover rates will have correspondingly higher costs of
turnover. Although this is a logical expectation, the nature and strength of the
relationship have not been tested. School-level data on turnover cost permit us to
test this hypothesis.
Because of the size of the pilot study and data limitations discussed in this report, we
were not able to adequately test all of the hypotheses. For instance, the pilot study
contained only urban and rural districts. The absence of suburban districts meant that we
could not test the variance of turnover costs across urban, suburban, and rural districts.
Key Findings
Through our work with the five school districts, several things have become clear:
1. Turnover costs can be identified, aggregated, and analyzed, but current data
systems make this process a difficult one.
This report will provide a sense of the costs of teacher turnover, the shortcomings of
district data capacity, and the need for improvements in this capacity so that the impact of
teacher turnover can be measured and understood.
2. The costs of teacher turnover are substantial, in some cases at a level that
surprised district leaders.
Through the process of determining the cost of turnover, district leaders realized the wide
ranging impact of teacher turnover. Prior to the study, districts did not know what
teachers were leaving or how this turnover impacted district resources.
3. A correlation exists between teacher turnover and school characteristics such
as student achievement and race.
We delve into the process and the results that led to these findings, and then discuss the
implications for school leaders and policymakers.
17
THE PROCESS
The five study sites include two urban school districts (Chicago Public Schools
(CPS) and Milwaukee Public Schools (MPS)), one countywide suburban district
(Granville County Schools (GCS)), and two quite small rural districts (Jemez Valley
Public Schools (JVPS) and Santa Rosa Public Schools (SRPS)). With the active
participation of officials from each district, three databases were created to house data on
teachers, schools, and costs.
The first of the three databases houses information on individual teachers. This
Teacher Database includes a teacher identifier to link with district databases. The
second database, the Schools Database, holds information on each school in the study.
We also have obtained the numerical school identification codes for each school in all
five districts. This identifier links each school to the federal Common Core of Data
(CCD) at the National Center for Education Statistics (NCES). CCD is a source of a wide
range of information about each school. The third database, the Costs Database, contains
the disaggregated components of turnover costs. Sorted by cost category, the database
permits project researchers to derive total annual costs of turnover at the school and
district level. It also enables various other calculations important to the determination of
turnover costs.
Data Collection
By design, the three databases permit turnover rates and turnover costs to be
measured in a common way, and identify key variables that would explain differences in
rates and costs within and among districts. Researchers and district personnel began
collecting data in the spring of 2005. Data on costs were collected for the 2003-04 fiscal
year. Because resources expended in the 2003-04 year were based on turnover that
occurred in the previous year, the data on teachers and schools were collected for the
2002-03 and 2003-04 school years. The overarching goal was to collect the most recent
data available without having to rush the normal data collection cycles of the schools and
districts.
18
While this decision ensured that the data of interest would be potentially available
at the district level, it did not mean that all of the data would be available according to
common definitions and accessible in the formats sought. For that reason, the decision
was made to visit each district in order to discuss the definitions, formats and
idiosyncrasies of the local data. Pre-data collection visits were conducted to all five
districts over a two-month period. Discussions typically involved the chief human
resources officer, the accountability officer, a researcher or data director, and other key
district level leaders. In Granville County, the district superintendent and the chief
financial officer were both included, a decision that in hindsight suggests boosted support
for the project and commitment to complete all of the various data collection tasks.
Instructions for the data collection reflected the protocols and definitions agreed to during
the site visits, and were distributed after the district meetings.
The results of the data collection were impacted by the structure of the pilot study
in several ways. First, the study examined one year of data. There may be variation from
one year to the next in terms of teacher turnover and costs, and the study simply provides
a snapshot of each of the five districts. Second, the rural districts are very small and this
must be kept in mind when interpreting the data. For instance, JVPS had one reading
teacher in 2002-03. The turnover rate will either be zero or 100 percent depending on the
decision of the sole reading teacher. This turnover rate is important to JVPS, but the
sample size is too small to allow for meaningful generalizations. The issues of a data
snapshot and small rural sample size arise throughout our discussion of the data.
It bears underscoring that the purpose of the CTT study in its first phase was to
demonstrate the feasibility of collecting requisite data at the district level. Therefore, the
process of collecting the data is as important, if not more important, than the results. This
is evident from several of our findings and recommendations, which are directed at
making the calculating of teacher turnover and its costs more efficient, accurate, and
systematic. With the data districts were able to provide, we draw preliminary conclusions
about the extent of turnover, the factors that influence it, and the costs associated with it.
This report is an examination of what we learned, but it is also a preview of what school
leaders and policymakers could learn from analyzing the costs of teacher turnover. We
first present the results of the data on teachers, schools, and costs, and then discuss the
19
implications of these results. We begin with a discussion of the data collected on
teachers.
TEACHERS
Districts provided individual teacher identifiers that were used to link records
from 2002-03 to 2003-04. NCTAF and district staff shared an understanding that no
individual data would be released; that all analyses would present data only in aggregate
form; and that individually identifiable data would be destroyed at the conclusion of the
study.
Turnover was defined as being employed by a particular school as a teacher in the
base year of 2002-03, but not in the follow-up year record for 2003-04. At the school
level, therefore, turnover is the sum of within-district movers and out-of-district leavers.
This means that turnover for the district was calculated as the sum of the number of
teachers who turned over at each school in the district. All districts submitted data that
permitted the calculation of turnover rates. Unlike the other districts, CPS included both
full and part-time teachers at the district level in its data submission. While all of the CPS
teachers were labeled as full-time, a comparison with New Teacher Center data from CPS
revealed that over 1,400 of the teachers were actually part-time. When examining the
CPS teacher data, it is important to keep in mind that it includes both full and part-time
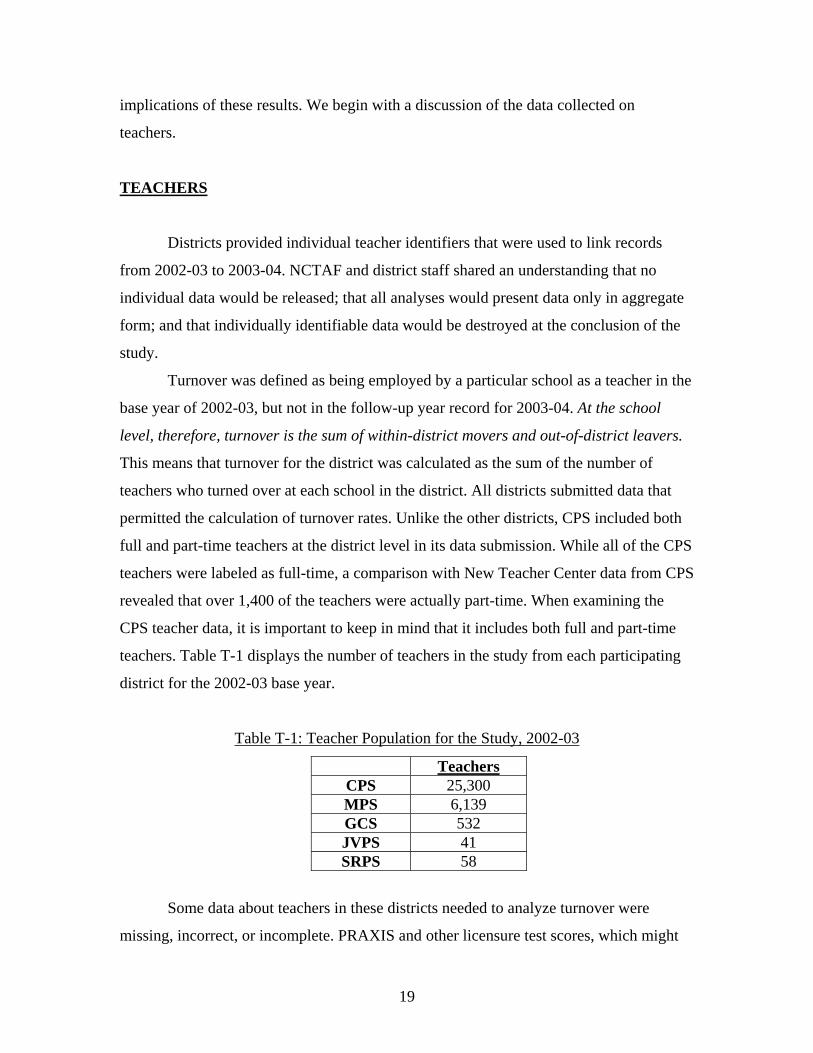
teachers. Table T-1 displays the number of teachers in the study from each participating
district for the 2002-03 base year.
Table T-1: Teacher Population for the Study, 2002-03
Teachers CPS 25,300 MPS 6,139 GCS 532 JVPS 41 SRPS 58
Some data about teachers in these districts needed to analyze turnover were
missing, incorrect, or incomplete. PRAXIS and other licensure test scores, which might
20
be viewed as measures of teacher quality, were not available from any of the five district
files even though district officials during local site visits with NCTAF staff had generally
believed that they were probably available somewhere in their records. During site visits,
district officials were certain that other measures of teacher quality such as the
undergraduate or graduate grade point averages were certainly not available and therefore
were not part of the data request. Thus, the district level data contained no information on
common measures of teacher quality.
The CTT project also sought data on turnover by teaching field in order to see
whether turnover in mathematics, science, special education, and foreign language are
higher than in other fields. Because licensure areas and subject assignment codes varied
widely in how they were captured by district data sets, participating districts defined 12
aggregated categories, and a 13th “other” category.
Districts were asked to report each teacher’s areas of licensure/endorsement and
subject areas taught, using these categories. Recognizing that teachers often have
multiple endorsements and teaching assignments, space was provided for up to three
fields for each variable. In addition, space for up to two college majors was provided.
This data collection strategy produced three measures of a teacher’s field: area of
endorsement, subject of teaching assignment, and college major.
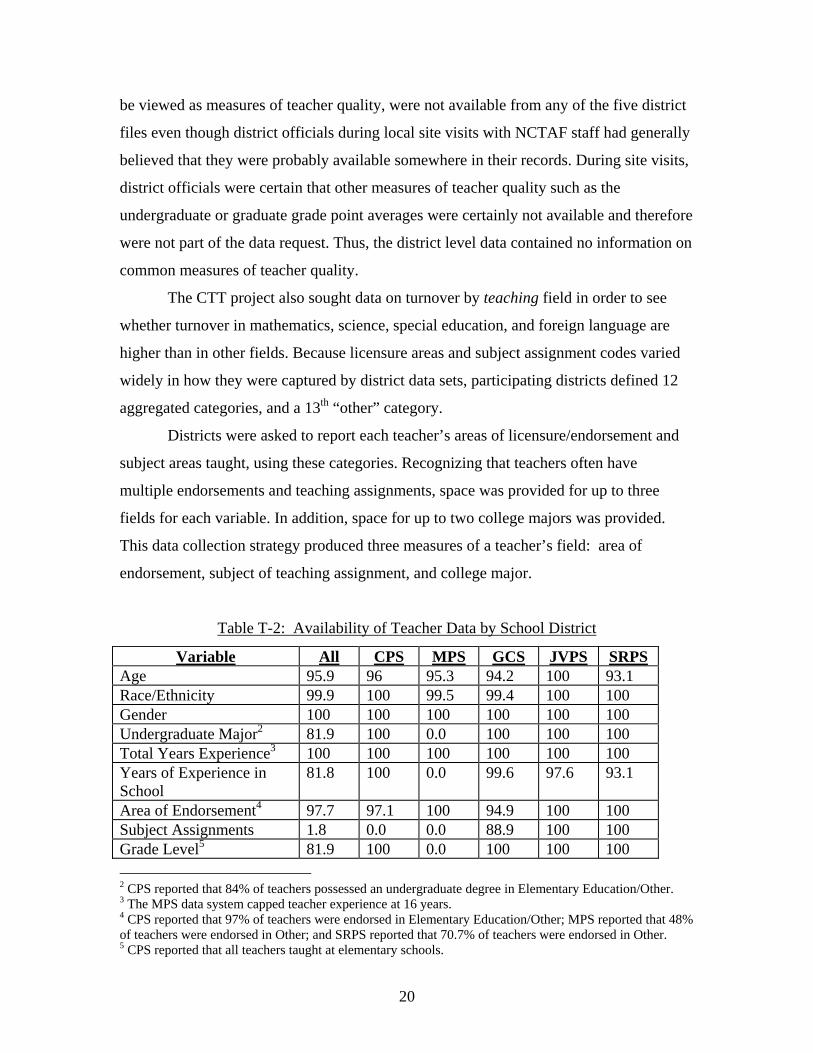
Table T-2: Availability of Teacher Data by School District
Variable All CPS MPS GCS JVPS SRPS Age 95.9 96 95.3 94.2 100 93.1 Race/Ethnicity 99.9 100 99.5 99.4 100 100 Gender 100 100 100 100 100 100 Undergraduate Major2 81.9 100 0.0 100 100 100 Total Years Experience3 100 100 100 100 100 100 Years of Experience in School
81.8 100 0.0 99.6 97.6 93.1
Area of Endorsement4 97.7 97.1 100 94.9 100 100 Subject Assignments 1.8 0.0 0.0 88.9 100 100 Grade Level5 81.9 100 0.0 100 100 100 2 CPS reported that 84% of teachers possessed an undergraduate degree in Elementary Education/Other. 3 The MPS data system capped teacher experience at 16 years. 4 CPS reported that 97% of teachers were endorsed in Elementary Education/Other; MPS reported that 48% of teachers were endorsed in Other; and SRPS reported that 70.7% of teachers were endorsed in Other. 5 CPS reported that all teachers taught at elementary schools.

21
Mentoring Role6 81.9 100 0.0 100 100 100 Own Classroom 1.9 0.0 0.0 95.3 100 100 Highly Qualified (NCLB Requirement)7
20.7 0.0 100 85.3 100 0.0
Highest Earned Degree 99.6 99.6 100 98.3 100 100
Student Contacts/week 1.8 0.0 0.0 99.1 95.2 0.0 Salary/Comp 100 100 100 100 100 100 Licensure Test Scores 0.0 0.0 0.0 0.0 0.0 0.0
Table T-2 shows significant gaps in data provided for field of study and subject
assignment. For example, in the case of the undergraduate major, MPS had no data to
report, while CPS reported (erroneously, we surmise) that 84 percent of their teachers had
majored in elementary education or in “other”. Similarly, the two urban districts were
unable to report the subject assignments of their teachers. In order to deal with flaws in
the data related to teaching and licensure fields in the multivariate analysis, the NCTAF
staff created a teaching field variable for any teacher whose record included any data on
teaching assignment, licensure/endorsement area, or major field of study.
Districts reported partially incomplete or inaccurate data for other teacher
variables, such as whether teachers were serving as a mentor, whether they were highly
qualified, whether they taught in their own classroom, or what grade level they taught. As
a result, the study cannot incorporate these measures of interest into our analysis of
turnover rates and costs. MPS was not able to provide data on any of these variables
while CPS had no information on whether teachers were highly qualified (data were not
available in 2002-03 and 2003-04) or had their own classroom, and they reported all
teachers as teaching at the elementary level and as having no mentoring role. Thus, the
largest districts could not provide good and complete data on any of these four variables.
During early discussions with district-level personnel, each variable was
identified as a possible influence on teacher turnover. District-level staff agreed to
provide as much of the data as their data systems could provide. What Figure 3 makes
clear is that their data systems either did not contain the data, or they could not provide
easy access to the data. CPS, for example, reported that they stored personnel data in 38
6 CPS reported no mentors. 7 MPS reported that all teachers were highly qualified under the No Child Left Behind Act.
22
separate “program level” databases that, for the most part, were kept isolated and were
often restricted to subgroups of employees. Even though this urban district was installing
a new integrated personnel system that would tap some of their old legacy data systems,
they mostly looked forward to having better data. Given all of the missing data for MPS,
it is clear that their systems were even more limited, given the data requirements of the
study. By contrast, Table T-2 indicates that data on teachers’ age, race/ethnicity, gender,
and highest earned degree were available and reliable.
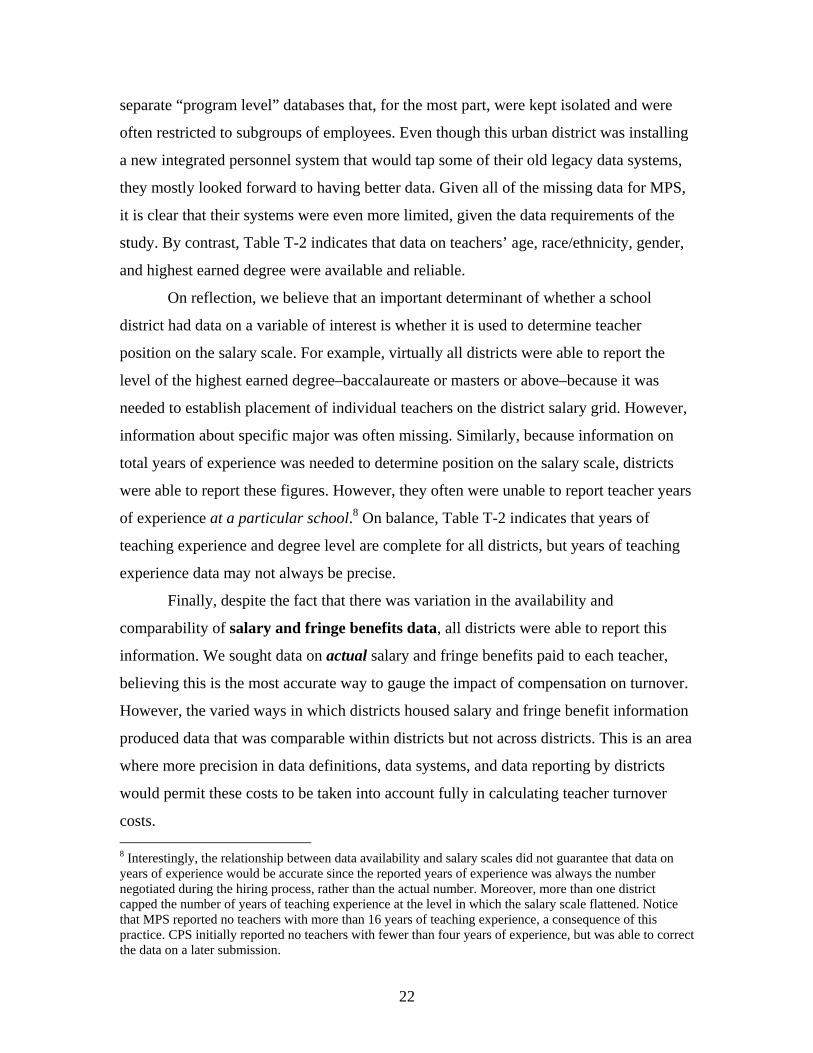
On reflection, we believe that an important determinant of whether a school
district had data on a variable of interest is whether it is used to determine teacher
position on the salary scale. For example, virtually all districts were able to report the
level of the highest earned degree–baccalaureate or masters or above–because it was
needed to establish placement of individual teachers on the district salary grid. However,
information about specific major was often missing. Similarly, because information on
total years of experience was needed to determine position on the salary scale, districts
were able to report these figures. However, they often were unable to report teacher years
of experience at a particular school.8 On balance, Table T-2 indicates that years of
teaching experience and degree level are complete for all districts, but years of teaching
experience data may not always be precise.
Finally, despite the fact that there was variation in the availability and
comparability of salary and fringe benefits data, all districts were able to report this
information. We sought data on actual salary and fringe benefits paid to each teacher,
believing this is the most accurate way to gauge the impact of compensation on turnover.
However, the varied ways in which districts housed salary and fringe benefit information
produced data that was comparable within districts but not across districts. This is an area
where more precision in data definitions, data systems, and data reporting by districts
would permit these costs to be taken into account fully in calculating teacher turnover
costs. 8 Interestingly, the relationship between data availability and salary scales did not guarantee that data on years of experience would be accurate since the reported years of experience was always the number negotiated during the hiring process, rather than the actual number. Moreover, more than one district capped the number of years of teaching experience at the level in which the salary scale flattened. Notice that MPS reported no teachers with more than 16 years of teaching experience, a consequence of this practice. CPS initially reported no teachers with fewer than four years of experience, but was able to correct the data on a later submission.
23
Results
Our analysis of the teacher data starts with descriptive statistics and bivariate
relationships between turnover and each teacher variable of interest (see Figure 3), and
then proceeds to multivariate analyses employing Ordinary Least Squares (OLS) and
Logistic Regressions. In all cases, we use data from 2002-03, the baseline year for our
calculations of teacher turnover and the cost of turnover. Of the teacher variables, low
levels of teacher experience were closely correlated with high rates of teacher turnover.
The other teacher variables provide interesting information about the teacher workforce
in the five districts but were not found to be correlated with teacher turnover.
Teacher Turnover
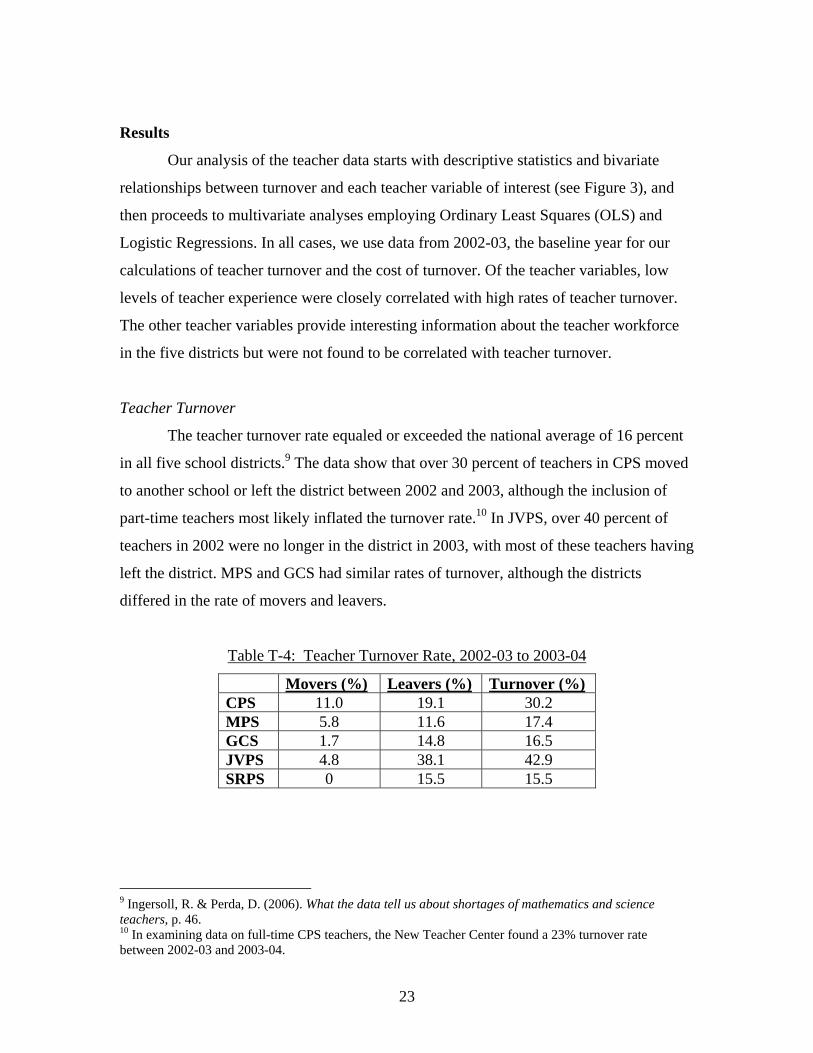
The teacher turnover rate equaled or exceeded the national average of 16 percent
in all five school districts.9 The data show that over 30 percent of teachers in CPS moved
to another school or left the district between 2002 and 2003, although the inclusion of
part-time teachers most likely inflated the turnover rate.10 In JVPS, over 40 percent of
teachers in 2002 were no longer in the district in 2003, with most of these teachers having
left the district. MPS and GCS had similar rates of turnover, although the districts
differed in the rate of movers and leavers.
Table T-4: Teacher Turnover Rate, 2002-03 to 2003-04
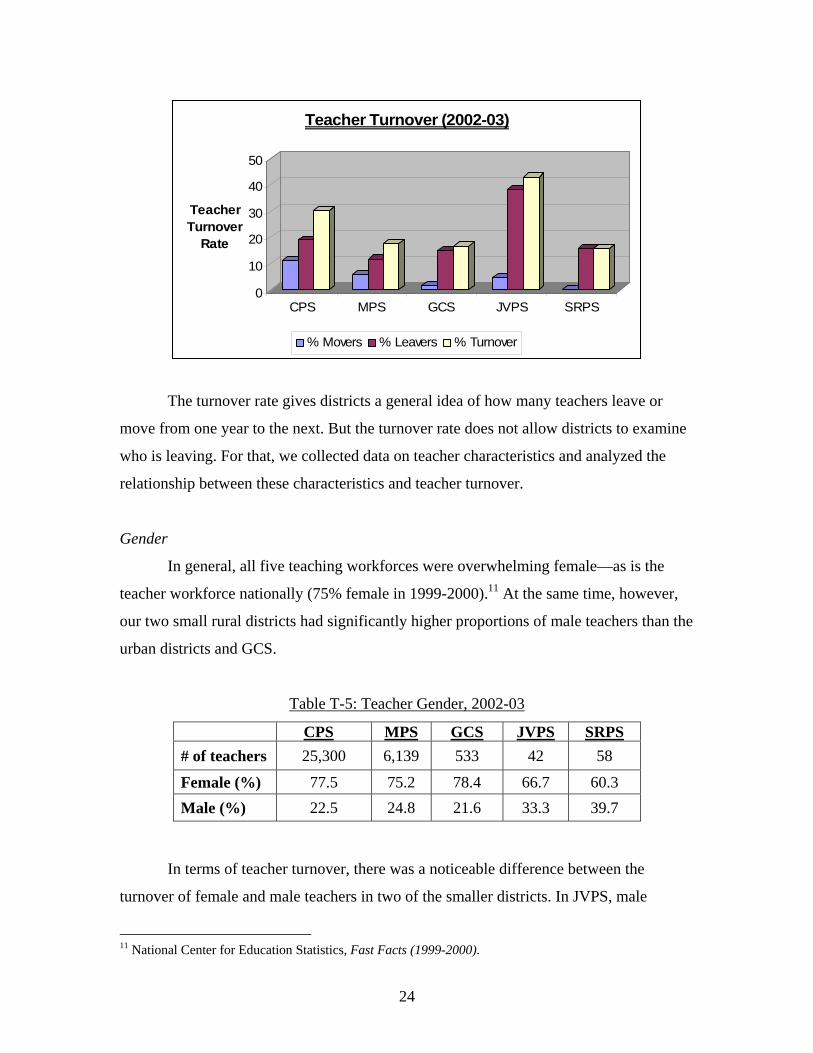
Movers (%) Leavers (%) Turnover (%) CPS 11.0 19.1 30.2 MPS 5.8 11.6 17.4 GCS 1.7 14.8 16.5 JVPS 4.8 38.1 42.9 SRPS 0 15.5 15.5
9 Ingersoll, R. & Perda, D. (2006). What the data tell us about shortages of mathematics and science teachers, p. 46. 10 In examining data on full-time CPS teachers, the New Teacher Center found a 23% turnover rate between 2002-03 and 2003-04.
24
0
10
20
30
40
50
Teacher Turnover
Rate
CPS MPS GCS JVPS SRPS
Teacher Turnover (2002-03)
% Movers % Leavers % Turnover
The turnover rate gives districts a general idea of how many teachers leave or
move from one year to the next. But the turnover rate does not allow districts to examine
who is leaving. For that, we collected data on teacher characteristics and analyzed the
relationship between these characteristics and teacher turnover.
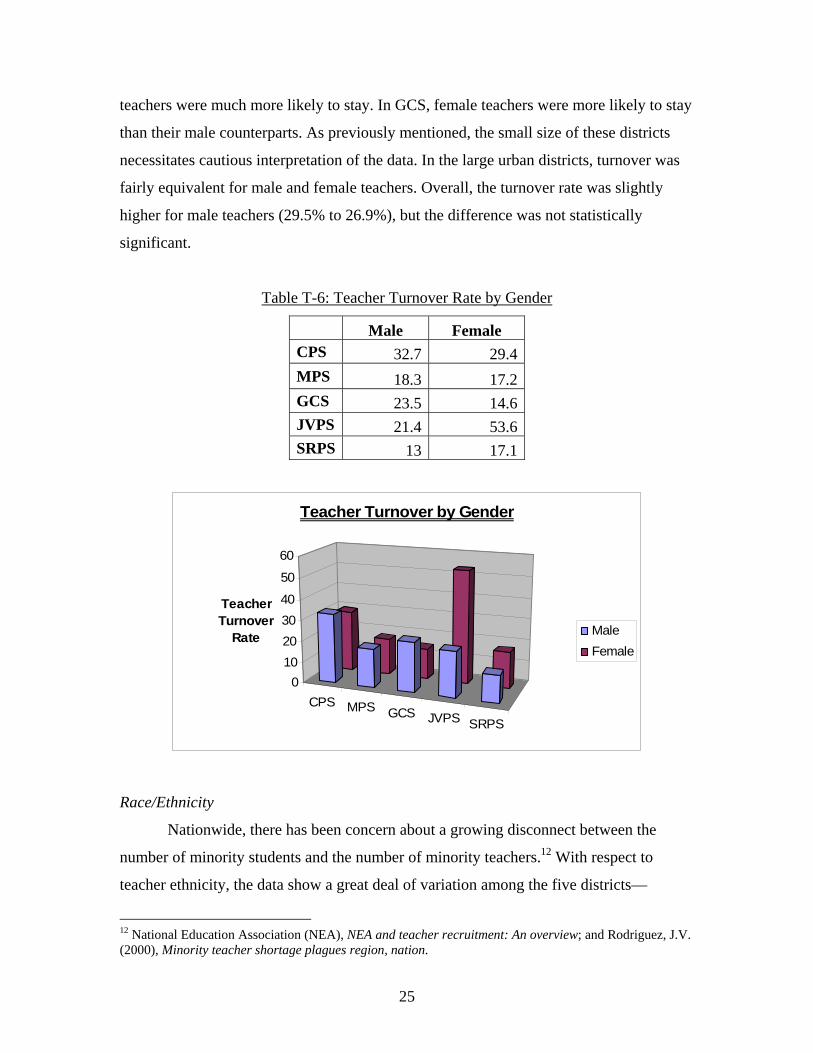
Gender
In general, all five teaching workforces were overwhelming female—as is the
teacher workforce nationally (75% female in 1999-2000).11 At the same time, however,
our two small rural districts had significantly higher proportions of male teachers than the
urban districts and GCS.
Table T-5: Teacher Gender, 2002-03
In terms of teacher turnover, there was a noticeable difference between the
turnover of female and male teachers in two of the smaller districts. In JVPS, male
11 National Center for Education Statistics, Fast Facts (1999-2000).
CPS MPS GCS JVPS SRPS # of teachers 25,300 6,139 533 42 58
Female (%) 77.5 75.2 78.4 66.7 60.3 Male (%) 22.5 24.8 21.6 33.3 39.7
25
teachers were much more likely to stay. In GCS, female teachers were more likely to stay
than their male counterparts. As previously mentioned, the small size of these districts
necessitates cautious interpretation of the data. In the large urban districts, turnover was
fairly equivalent for male and female teachers. Overall, the turnover rate was slightly
higher for male teachers (29.5% to 26.9%), but the difference was not statistically
significant.
Table T-6: Teacher Turnover Rate by Gender
Male Female CPS 32.7 29.4MPS 18.3 17.2GCS 23.5 14.6JVPS 21.4 53.6SRPS 13 17.1
CPS MPS GCS JVPS SRPS
010203040
50
60
Teacher Turnover
Rate
Teacher Turnover by Gender
MaleFemale
Race/Ethnicity
Nationwide, there has been concern about a growing disconnect between the
number of minority students and the number of minority teachers.12 With respect to
teacher ethnicity, the data show a great deal of variation among the five districts—
12 National Education Association (NEA), NEA and teacher recruitment: An overview; and Rodriguez, J.V. (2000), Minority teacher shortage plagues region, nation.
26
although again, the small size of the two rural districts suggests caution in interpreting
these data.
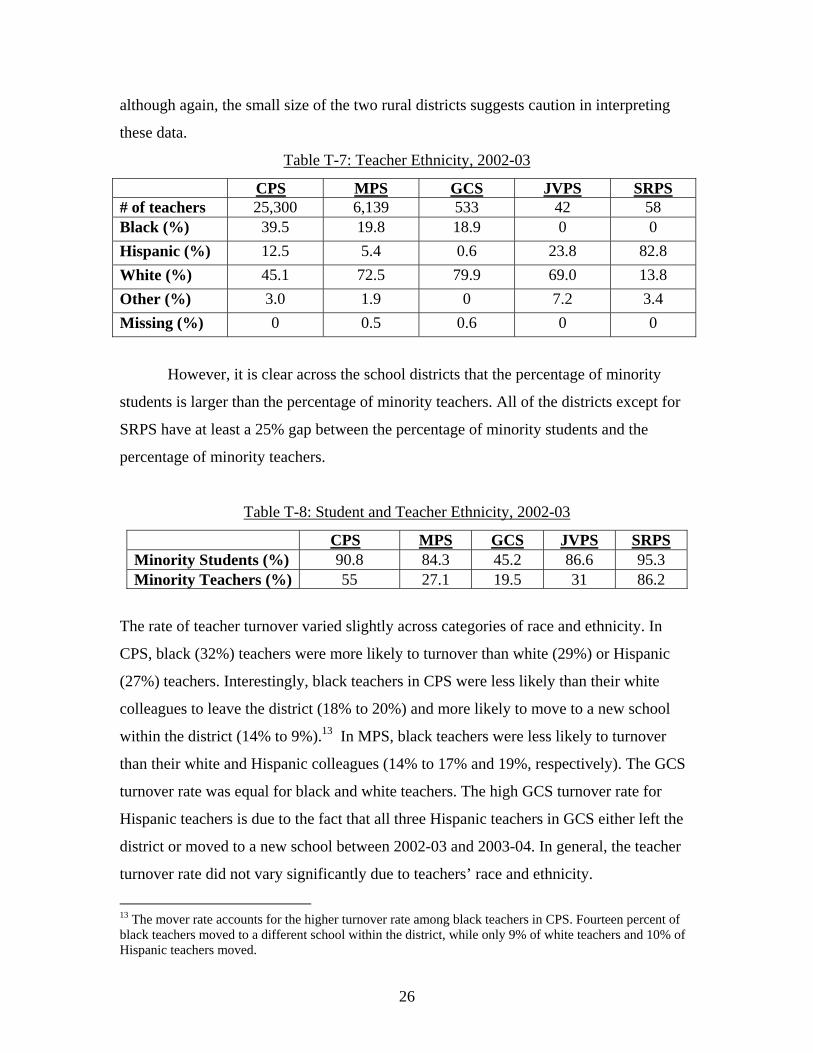
Table T-7: Teacher Ethnicity, 2002-03
CPS MPS GCS JVPS SRPS # of teachers 25,300 6,139 533 42 58 Black (%) 39.5 19.8 18.9 0 0 Hispanic (%) 12.5 5.4 0.6 23.8 82.8 White (%) 45.1 72.5 79.9 69.0 13.8 Other (%) 3.0 1.9 0 7.2 3.4 Missing (%) 0 0.5 0.6 0 0
However, it is clear across the school districts that the percentage of minority
students is larger than the percentage of minority teachers. All of the districts except for
SRPS have at least a 25% gap between the percentage of minority students and the
percentage of minority teachers.
Table T-8: Student and Teacher Ethnicity, 2002-03
CPS MPS GCS JVPS SRPS Minority Students (%) 90.8 84.3 45.2 86.6 95.3 Minority Teachers (%) 55 27.1 19.5 31 86.2
The rate of teacher turnover varied slightly across categories of race and ethnicity. In
CPS, black (32%) teachers were more likely to turnover than white (29%) or Hispanic
(27%) teachers. Interestingly, black teachers in CPS were less likely than their white
colleagues to leave the district (18% to 20%) and more likely to move to a new school
within the district (14% to 9%).13 In MPS, black teachers were less likely to turnover
than their white and Hispanic colleagues (14% to 17% and 19%, respectively). The GCS
turnover rate was equal for black and white teachers. The high GCS turnover rate for
Hispanic teachers is due to the fact that all three Hispanic teachers in GCS either left the
district or moved to a new school between 2002-03 and 2003-04. In general, the teacher
turnover rate did not vary significantly due to teachers’ race and ethnicity.
13 The mover rate accounts for the higher turnover rate among black teachers in CPS. Fourteen percent of black teachers moved to a different school within the district, while only 9% of white teachers and 10% of Hispanic teachers moved.
27
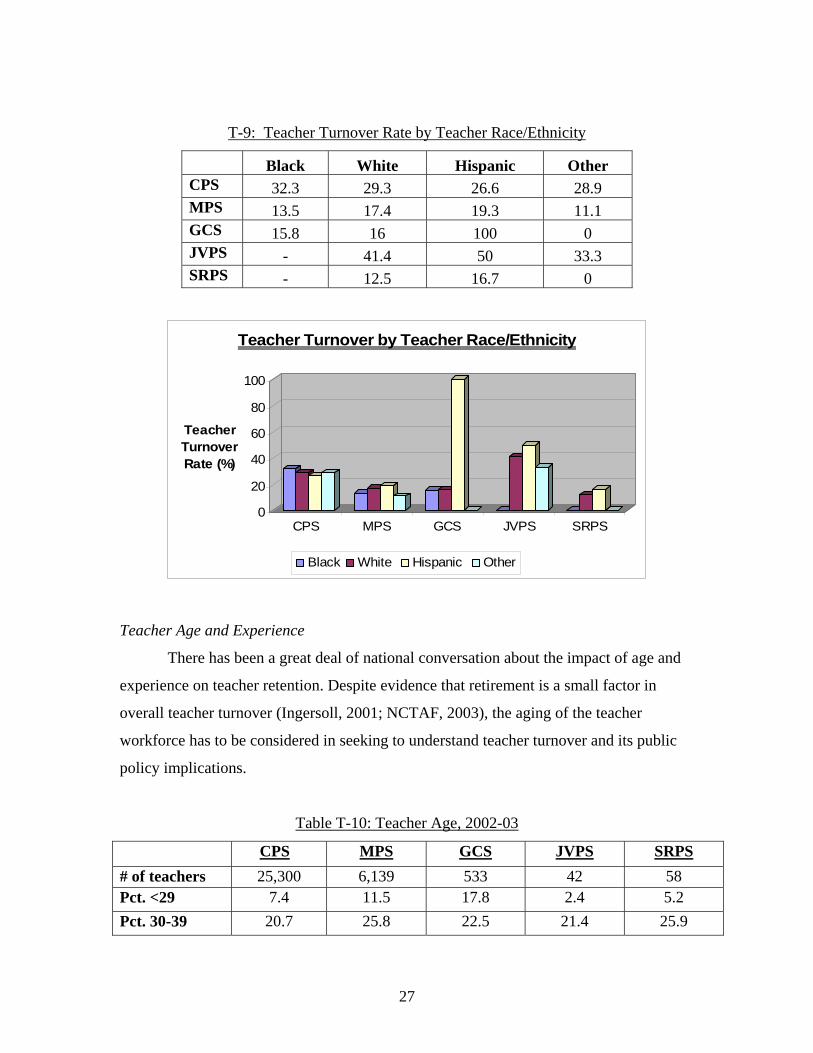
T-9: Teacher Turnover Rate by Teacher Race/Ethnicity
Black White Hispanic Other CPS 32.3 29.3 26.6 28.9 MPS 13.5 17.4 19.3 11.1 GCS 15.8 16 100 0 JVPS - 41.4 50 33.3 SRPS - 12.5 16.7 0
0
20
40
60
80
100
Teacher Turnover Rate (%)
CPS MPS GCS JVPS SRPS
Teacher Turnover by Teacher Race/Ethnicity
Black White Hispanic Other
Teacher Age and Experience
There has been a great deal of national conversation about the impact of age and
experience on teacher retention. Despite evidence that retirement is a small factor in
overall teacher turnover (Ingersoll, 2001; NCTAF, 2003), the aging of the teacher
workforce has to be considered in seeking to understand teacher turnover and its public
policy implications.
Table T-10: Teacher Age, 2002-03
CPS MPS GCS JVPS SRPS # of teachers 25,300 6,139 533 42 58 Pct. <29 7.4 11.5 17.8 2.4 5.2 Pct. 30-39 20.7 25.8 22.5 21.4 25.9
28
Pct. 40-49 16.4 21.8 23.6 21.4 36.2 Pct. 50-59 33.6 30.0 22.5 38.1 20.7 Pct. >60 18.0 6.1 7.7 16.7 5.2 Pct. Missing 4.0 4.7 5.8 0 6.9
T-11: Teacher Turnover Rate by Teacher Age
<= 29 30-39 40-49 50-59 >= 60 CPS 39.9 36.4 26.5 21.9 38.5MPS 19.4 17 12.9 18.4 29.1GCS 30.5 18.3 8.7 11.7 22JVPS 0 55.6 44.4 37.5 42.9SRPS 0 0 19 33.3 33.3
0
10
20
30
40
50
60
Teacher Turnover Rate (%)
CPS MPS GCS JVPS SRPS
Teacher Turnover by Teacher Age
<= 29 30-39 40-49 50-59 >= 60
In addition to having few teachers in general, both of the small rural districts have
very few teachers under the age of 30. Therefore, it is not surprising that the turnover
levels in the rural districts were nonexistent for young teachers. In terms of teacher age,
the urban districts and GCS had similar patterns of turnover. The youngest and the oldest
teachers left at the highest rates, while middle aged teachers were most likely to stay.
The high turnover of young teachers indicates that a relationship exists between
turnover and teacher experience. To examine this relationship, school districts reported
data on total teaching experience and for teaching experience at the current school
(Table T-12). Clearly, the teaching population has moved from school to school during
29
their careers—with only about half of total teaching experience taking place in the school
where they were employed in 2002-03. In CPS, the differential between school and
overall teaching experience was even larger. This large differential could be the result of
two factors: the movement of experienced teachers from other districts and the
movement of experienced teachers from school to school within CPS.
Table T-12: Total and School Teaching Experience, 2002-0314
CPS MPS GCS JVPS SRPS
Average Teaching Experience 12.6 8.7 12.3 12.3 12.3
Average Teaching Experience at Current School
3.5 - 6.7 5.6 7.1
Table T-13: Teacher Experience, 2002-03
CPS MPS GCS JVPS SRPS
<1 year (%) 7.1 9.6 7.9 2.4 5.2
1-3 years (%) 17.0 17.9 17.4 14.7 5.2
4-5 years (%) 7.3 10.0 9.2 12.2 12.1
6-10 years (%) 22.0 18.3 15.6 17.1 29.3
11-20 years (%) 20.2 44.2 26.1 36.6 24.1
>21 years (%) 26.4 0 23.8 17.1 24.1
Table T-12 shows the distribution of teachers by level of total teaching
experience. A comparison of Tables T-10 and T-13 shows a slight disconnect in the
expected relationship between age and teaching experience. We might have expected to
see roughly the same proportions of teachers younger than 30 who also had fewer than
five years of teaching experience. In fact, however, this is not the case. For instance, 31
percent of CPS teachers had five years of experience or less but only eight percent of 14 Certain districts (such as MPS) cap the amount of experience that will be recognized for teachers transferring from other districts. In addition, districts sometimes offer a “bump” on the salary schedule (and a subsequent bump in the recorded experience level) in order to recruit teachers. This means that district files on teacher experience contain data about individual teachers that may not match actual teaching experience. At the same time, the distortions between actual and recorded teaching experience are systematic within each district, not random—for the reasons discussed. This suggests that comparisons of teacher experience and turnover rates within districts can be instructive.
30
CPS teachers were under the age of 30. Similarly, 37 percent of MPS teachers had five
years of experience or less but only 12 percent of MPS teachers were under the age of 30.
This disparity is most likely due to mid-career changers, most of whom are older than 30
and enter the profession with little teaching experience.
T-14: Teacher Turnover Rate by Teacher Experience
0-5 yrs 6-10 yrs 11-20 yrs >20 yrs CPS 37 25.7 23.1 31.1 MPS 18.8 14.5 17.6 - GCS 29.9 13.3 3.6 13.4 JVPS 50 57.1 33.3 42.9 SRPS 7.7 11.8 21.4 21.4
0102030405060
Teacher Turnover Rate (%)
CPS MPS GCS JVPS SRPS
Teacher Experience
Teacher Turnover by Teacher Experience
0-5 6-10 11-20 >20
In terms of turnover by teacher experience, the small rural districts show a great
deal of variation, while the larger districts follow a similar pattern. The small amount of
data from a single year makes analysis of the rural districts difficult, but it does appear
that JVPS struggled to retain teachers with less than 10 years experience and SRPS
struggled to retain experienced teachers. In the larger districts, teachers with five or less
years of experience turned over at the highest rate. CPS also lost a high percentage of
teachers with twenty or more years of experience. Presumably this turnover is mainly due
to retirement, but the data did not allow analysis of turnover decisions. The graph of MPS
turnover clearly shows the impact of the way MPS caps experience at 16 years. We
31
presume that the turnover for teachers with 11 to 20 years of experience would be lower,
and the turnover for teachers with 20 years or more would be higher, if the experience
level of teachers was not capped at 16 years in MPS’s data system. Despite this data
quirk, it is clear that teacher turnover is highest among teachers with little teaching
experience.
Teacher Licensure
Information about teacher turnover, age, and experience can allow school districts
to target retention strategies at populations that are more likely to leave. Similarly, data
on teacher turnover and teacher licensure provide districts with information on the types
of teachers leaving the district. Nationally, there has been great concern over high teacher
turnover and teacher shortages in licensure areas such as math, science, and special
education.
Table T-15: Teacher Distribution by License Area, 2002-03
CPS MPS GCS JVPS SRPS
# of Teachers 25,300 6,139 533 42 58
Biology (%) 0 3.5 2.1 6.6 3.9
Physical Science (%) 0 1.1 1.5 0 1.6
Math (%) 0 3.5 5.9 2.2 2.4
Social Studies (%) 0 9.7 7.7 3.3 7.9
English/Language Arts (%) 0 5.5 9.1 8.8 4.7
Foreign Language (%) 0 2.3 0.5 5.5 3.1
Special Education (%) 0 15.0 9.5 8.8 7.1
Reading (%) 0 2.0 3.5 4.4 1.6
Fine Arts/ Music (%) 0 5.3 3.5 7.7 3.9
Health/Physical Education (%) 0 1.8 2.9 3.3 5.5
Vocational (%) 0 1.8 4.5 6.6 0.8
Elementary Education (%) 40.3 17.9 39.9 19.8 25.2
All Other (%) 57.8 30.4 6.4 23.1 32.3
32
Missing (%) 1.9 0 3.1 0 0
Licensure Areas
0
10
20
30
40
50
60
CPS MPS GCS JVPS SRPS
% of Teachers
Biology Phys Science Math Soc StudiesEnglish Foreign Languages Spec Ed ReadingFine Art Health/Phys Ed Vocational Elem EdOther
Unfortunately, the large urban districts were unable to accurately report the
licensure areas of their teachers, as evidenced by the large percentage of teachers in the
“Other” category. In the rural districts, the small number of teachers made analysis by
licensure area difficult. In GCS, the teacher turnover for different licensure areas is
revealing. Although special education is often referred to as a high demand, high turnover
area, GCS retained their special education teachers at a relatively high rate. However, the
district lost a high percentage of foreign language (2 of 5 teachers) and math (7 of 23)
teachers.
33
0
5
10
15
20
25
30
35
40
Teacher Turnover Rate (%)
Life Sci
PhysSci
Math Social Sci
L.A. Foreign Lang
SPED Reading FineArts
VocEd
Elem Ed
Other
GCS Teacher Turnover by Licensure Area
The difference between local and national trends in turnover highlights the
importance of districts examining actual local data on teacher turnover. The lack of
accurate licensure data in the urban districts indicates that these districts may not
currently have the capacity to conduct such analyses. The lack of such data precludes any
findings as to the overall relationship of teacher licensure and teacher turnover.
Summary
Teacher turnover was significant in all five school districts, but the turnover rate
varied greatly across the districts and across teacher characteristics. Of the characteristics
studied, teacher experience had the largest impact on teacher turnover, with new teachers
leaving at significantly higher rates than experienced teachers. The study also brings to
light the lack of accurate data on certain teacher characteristics, such as licensure area,
licensure test scores, and subject assignments. In order to generate an accurate picture of
which teachers are leaving, school districts will need to collect and analyze these
variables.
Schools
34
To test the hypothesis that teacher turnover is influenced by school characteristics,
researchers and district officials identified and collected data on 12 school variables.15
We describe an expected effect as positive if increases in the school variable are
associated with increases in teacher turnover; negative if increases in the school variable
are associated with decreases in teacher turnover; and neutral if the school variable can
not increase or decrease. With school type and geographic setting, teacher turnover can
only vary with changes to the variable. For these variables, we describe the expected
relationship in more detail. The twelve school-level variables and their expected effects
on teacher turnover are listed below:
1. Performance level of students as measured by the State’s end-of-grade and end-
of-course testing program16 – negative;
2. School type (elementary including K-8; middle; secondary) – neutral (higher
teacher turnover in middle schools than in elementary or secondary schools);
3. Geographic setting (urban, rural, suburban) – neutral (higher teacher turnover in
rural and urban schools than in suburban schools);
4. Total school enrollment (used to derive school size variable) – positive;
15 School-level data on grade range, geographic setting, enrollment, school lunch rate, and race/ethnic composition of the student body (elements 2, 3, 4, 5, and 8) were drawn from the Common Core of Data (CCD) collected by the U.S. Department of Education for each public school in the United States. This information can be accessed through the National Center for Education Statistics (NCES) and was extracted from that file unless a district provided its own data on the variables. Data on the remaining seven variables were to be provided directly by each district. 16 Defining standardized pupil achievement categories proved challenging. First, states differ in the performance tests and in the school performance categories that they use. Districts were reluctant to classify schools as “high” or “low” performing when these were not categories explicitly recognized in their state’s testing and assessment programs. In addition, districts expressed a desire to assign performance levels based on both current test score levels and improvement in test scores, measures that could, and often did, move in opposite directions. Moreover, no district was able to provide school performance rankings for their schools. Given these difficulties, it was decided that the districts would provide current mean test scores for schools and that NCTAF staff would convert them to performance categories for the purpose of this study only. This was done by arraying the average test scores of schools in each district in descending order and then designating those at or below the 16th percentile of this distribution as “low” performing, and those at or above the 84th percentile as “high” performing. These percentiles correspond to the tails of a normal distribution that begin one standard deviation from the mean. It is believed that they correspond roughly to the categories typically used in state testing programs: “below expectation” and “exceeds expectation.” Thus schools in the “below” category were treated as low performing, and schools in the “above” category were treated as high performing. Our two rural districts were too small to employ this method, and so they are not included in analyses of the relationship between pupil achievement and teacher turnover.
35
5. School lunch participation rate (percentage of students eligible for free or reduced
price lunch) – positive;
6. Principal tenure (years served by a school’s current principal) – negative;
7. Principal count (number of principals employed by the school over the last ten
years) – positive;
8. Student body percentages in each race/ethnic category (in order to calculate the
percent minority at each school) – positive for teachers in schools with high
minority populations;
9. Limited English proficiency percentage for the student body – positive;
10. Special education student percentage of the student body – positive;
11. Student stability rate (defined as the percentage of all students who were enrolled
in both semesters) – negative; and
12. Annual attendance rate of all students during the school year – negative.
Expectations about the affects of some of these school variables may require elaboration.
For example, variables 6 and 7 address the common view that stable leadership in a
school creates a positive working condition that is conducive to teacher retention, but we
have not seen this tested in earlier studies. Our hope was that we could combine these
two variables to form a categorical variable that would rate principal turnover as high,
medium or low, but our inability to collect data on both of these variables in all districts
made this problematic.
Our hypothesis about schools with large numbers of students with limited English
proficiency or with disabilities (variables 9 and 10) was that they would be more difficult
for regular teachers to teach and would therefore be more conducive to teacher attrition.
Similarly, we believed that schools with low student attendance rates, or high turnover of
students during the year, would discourage their teachers and lead them to leave or move
to another school. Variables 11 and 12, both of which are part of NCLB data collection,
were therefore included to capture these effects.
In terms of school performance and turnover, we felt that teachers would be more
likely to leave schools in which student performance was relatively low. We also thought
that teachers would be more likely to leave schools with higher minority populations
36
based on earlier studies. We also decided to test whether the race of the teacher and the
race of the students impacted teacher turnover. We therefore constructed a categorical
variable for each teacher that took the value “1” if the majority race/ethnicity of students
at the school matched that of the teacher; it took the value of “0” otherwise. We called
this variable “racial concordance.”
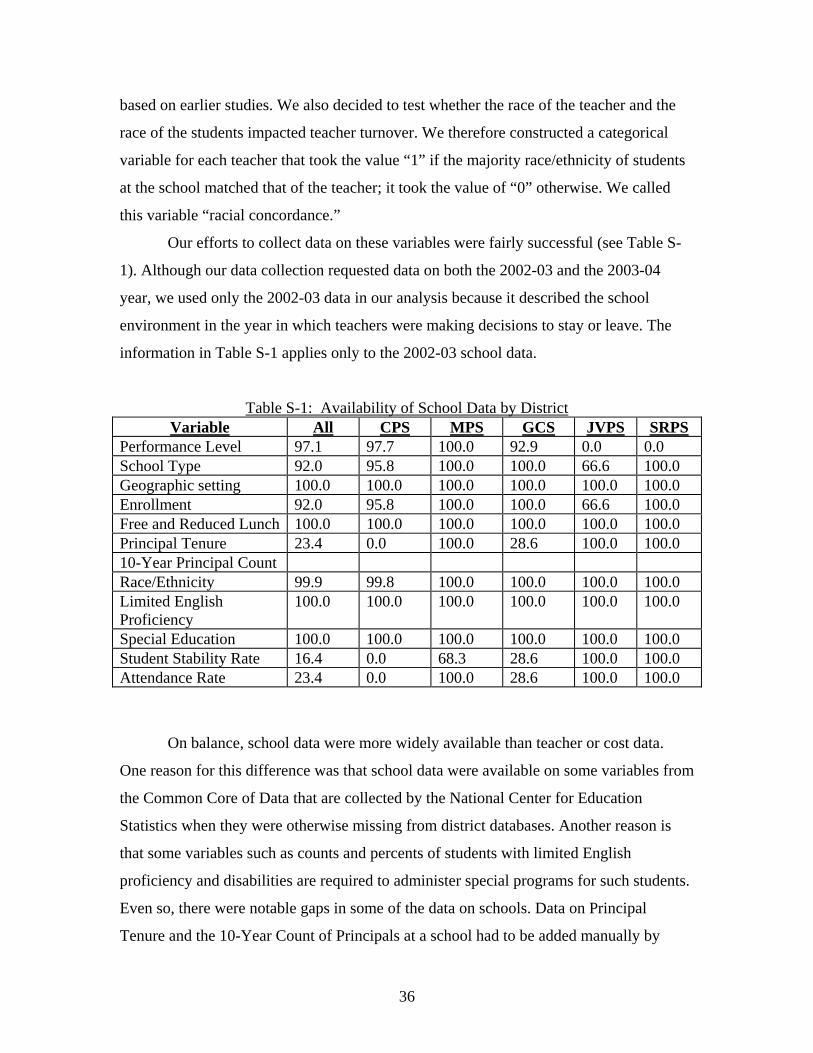
Our efforts to collect data on these variables were fairly successful (see Table S-
1). Although our data collection requested data on both the 2002-03 and the 2003-04
year, we used only the 2002-03 data in our analysis because it described the school
environment in the year in which teachers were making decisions to stay or leave. The
information in Table S-1 applies only to the 2002-03 school data.
Table S-1: Availability of School Data by District Variable All CPS MPS GCS JVPS SRPS
Performance Level 97.1 97.7 100.0 92.9 0.0 0.0 School Type 92.0 95.8 100.0 100.0 66.6 100.0 Geographic setting 100.0 100.0 100.0 100.0 100.0 100.0 Enrollment 92.0 95.8 100.0 100.0 66.6 100.0 Free and Reduced Lunch 100.0 100.0 100.0 100.0 100.0 100.0 Principal Tenure 23.4 0.0 100.0 28.6 100.0 100.0 10-Year Principal Count Race/Ethnicity 99.9 99.8 100.0 100.0 100.0 100.0 Limited English Proficiency
100.0 100.0 100.0 100.0 100.0 100.0
Special Education 100.0 100.0 100.0 100.0 100.0 100.0 Student Stability Rate 16.4 0.0 68.3 28.6 100.0 100.0 Attendance Rate 23.4 0.0 100.0 28.6 100.0 100.0
On balance, school data were more widely available than teacher or cost data.
One reason for this difference was that school data were available on some variables from
the Common Core of Data that are collected by the National Center for Education
Statistics when they were otherwise missing from district databases. Another reason is
that some variables such as counts and percents of students with limited English
proficiency and disabilities are required to administer special programs for such students.
Even so, there were notable gaps in some of the data on schools. Data on Principal
Tenure and the 10-Year Count of Principals at a school had to be added manually by
37
some districts, and could not be reported by others. The same was true for the Student
Stability Rate and the Attendance Rates. This meant that data on Principal Tenure and the
10-Year Count of Principals were not available for any of the schools in the CPS district,
and for only 28.6 percent of the schools in the GCS district. Similarly, the performance
level data for JVPS and SRPS schools was not available in a format that could be
compared to data from the other districts. Consequently it was not available for these two
districts.
Although the gaps in the data collection are relatively minor when compared to
the gaps in teacher data, they have significant consequences for our ability to conduct
multivariate analyses on turnover rates in each district. Missing variables mean that
models to explain turnover rates are modified to fit the available data, a procedure that
leads to specification error in the estimates of variable affects. While every statistical
model is subject to some specification error, the problem is made worse when variables
shown to be significant predictors for one model (district) are missing in another. This
means that readers should be cautious in interpreting the “relationships” between
turnover rates and our teacher and school variables.
Results
The school data allowed for analysis of teacher turnover in relation to school
level, performance, percent minority, percent limited English proficiency (LEP), percent
free and reduced lunch (FRL), percent special education (SPED), and school size.
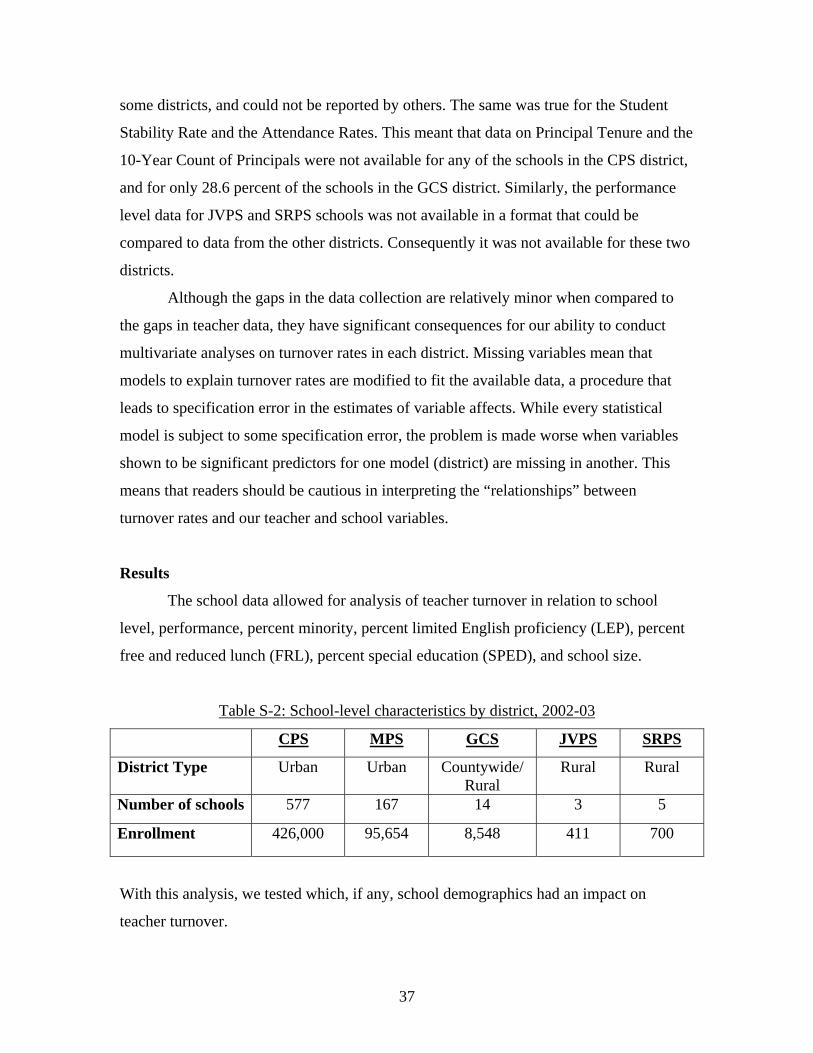
Table S-2: School-level characteristics by district, 2002-03
CPS MPS GCS JVPS SRPS
District Type Urban Urban Countywide/ Rural
Rural Rural
Number of schools 577 167 14 3 5
Enrollment 426,000 95,654 8,548 411 700
With this analysis, we tested which, if any, school demographics had an impact on
teacher turnover.
38
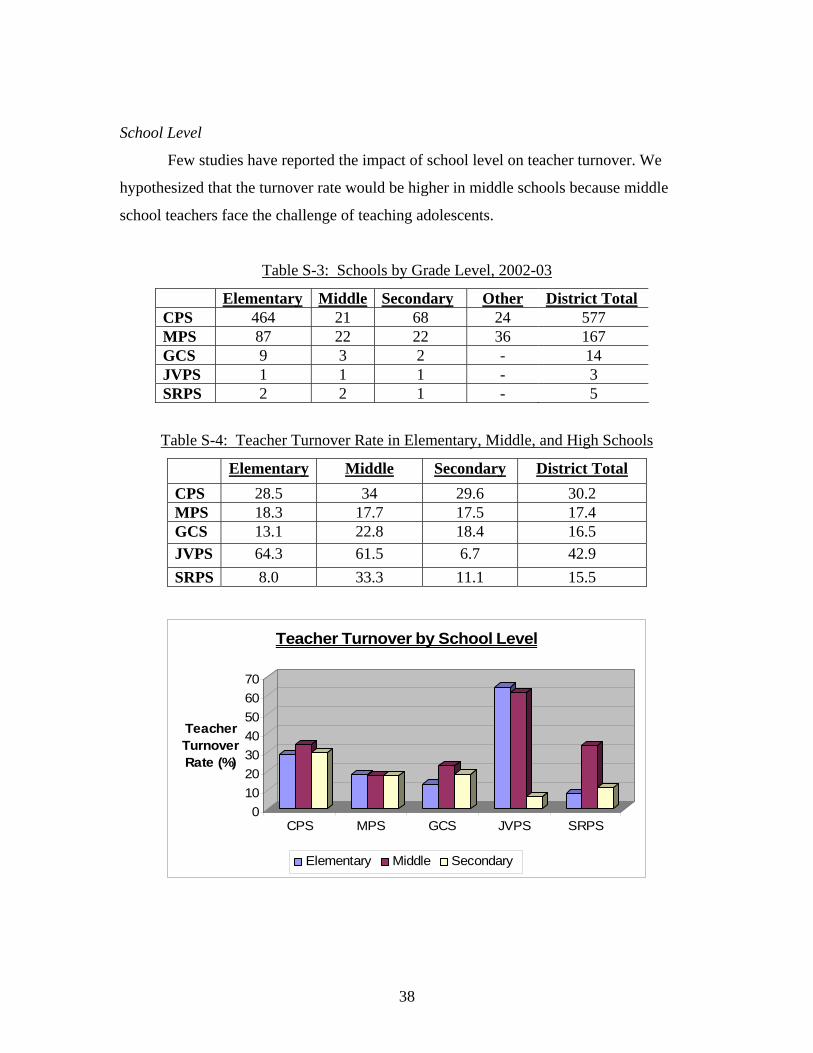
School Level
Few studies have reported the impact of school level on teacher turnover. We
hypothesized that the turnover rate would be higher in middle schools because middle
school teachers face the challenge of teaching adolescents.
Table S-3: Schools by Grade Level, 2002-03
Elementary Middle Secondary Other District Total CPS 464 21 68 24 577 MPS 87 22 22 36 167 GCS 9 3 2 - 14 JVPS 1 1 1 - 3 SRPS 2 2 1 - 5
Table S-4: Teacher Turnover Rate in Elementary, Middle, and High Schools
Elementary Middle Secondary District Total CPS 28.5 34 29.6 30.2 MPS 18.3 17.7 17.5 17.4 GCS 13.1 22.8 18.4 16.5 JVPS 64.3 61.5 6.7 42.9 SRPS 8.0 33.3 11.1 15.5
010203040506070
Teacher Turnover Rate (%)
CPS MPS GCS JVPS SRPS
Teacher Turnover by School Level
Elementary Middle Secondary

39
In CPS and GCS, middle schools were the most prone to turnover; they came in
second highest for MPS. While the turnover rates in JVPS are amazingly high for
elementary and middle schools, these should be viewed with caution because there is
only one school in each category for this district. The small size does not minimize the
impact of these rates of turnover on the schools themselves or on the pupils enrolled in
them. Relative to scale, it creates the same difficulties for administrators, other teachers,
and children. Recall that we have included two rural districts in this pilot study to
understand the extent and dynamics of teacher turnover (and its associated costs) for rural
schools. A good deal of anecdotal evidence from policymakers and school administrators
from these districts suggests the JVPS and SRPS experience are widespread across the
country.
Poverty
Previous studies have found that high poverty at a school is associated with high
teacher turnover.17 A commonly used measure of the level of poverty at a school is the
percentage of students receiving free or reduced lunch (FRL). In order to analyze the
relationship between poverty and teacher turnover, we divided schools into three
categories:
• Low Poverty (less than 50% FRL students)
• Medium Poverty (between 50% and 75% FRL students)
• High Poverty (more than 75% FRL students)
A breakdown of the number of schools in each category can be seen in Table S-5.
Table S-5: Number of Schools by % of FRL Students, 2002-03
Low Poverty Medium Poverty High Poverty CPS 49 56 472 MPS 25 48 94 GCS 8 5 1
17 Ingersoll, R. (2001). Teacher turnover and teacher shortages: An organizational analysis, p. 516.
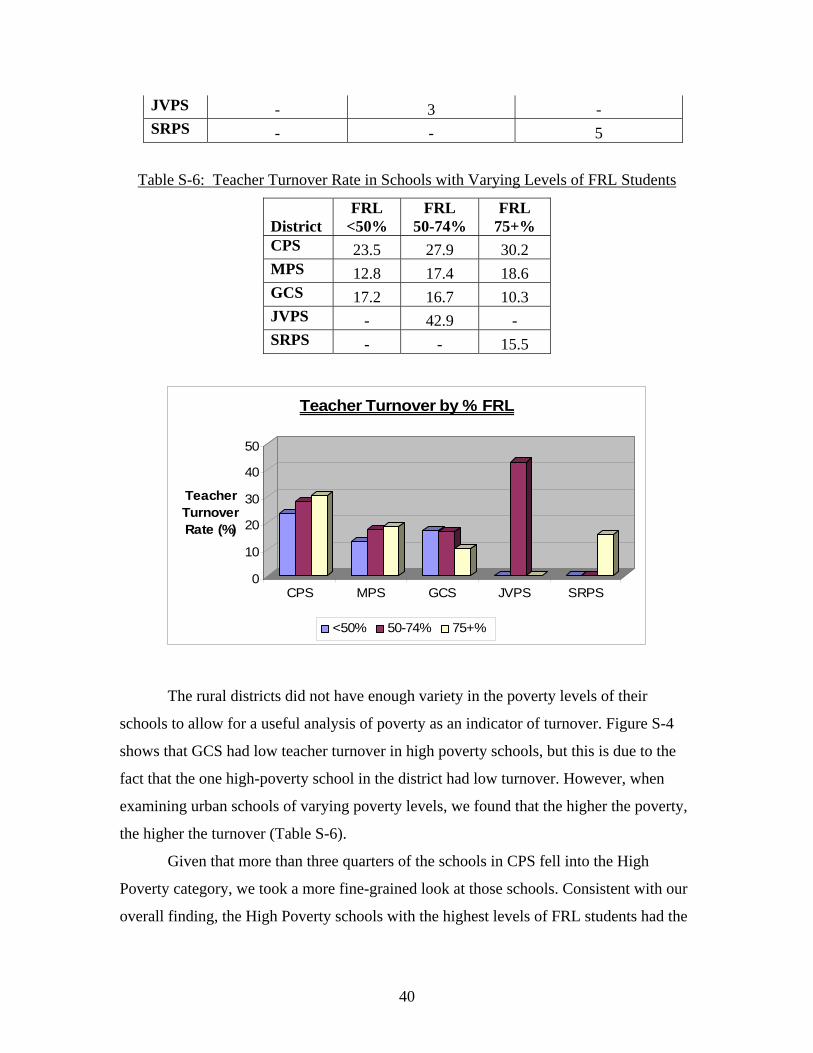
40
JVPS - 3 - SRPS - - 5
Table S-6: Teacher Turnover Rate in Schools with Varying Levels of FRL Students
District FRL
<50% FRL
50-74% FRL
75+% CPS 23.5 27.9 30.2 MPS 12.8 17.4 18.6 GCS 17.2 16.7 10.3 JVPS - 42.9 - SRPS - - 15.5
0
10
20
30
40
50
Teacher Turnover Rate (%)
CPS MPS GCS JVPS SRPS
Teacher Turnover by % FRL
<50% 50-74% 75+%
The rural districts did not have enough variety in the poverty levels of their
schools to allow for a useful analysis of poverty as an indicator of turnover. Figure S-4
shows that GCS had low teacher turnover in high poverty schools, but this is due to the
fact that the one high-poverty school in the district had low turnover. However, when
examining urban schools of varying poverty levels, we found that the higher the poverty,
the higher the turnover (Table S-6).
Given that more than three quarters of the schools in CPS fell into the High
Poverty category, we took a more fine-grained look at those schools. Consistent with our
overall finding, the High Poverty schools with the highest levels of FRL students had the
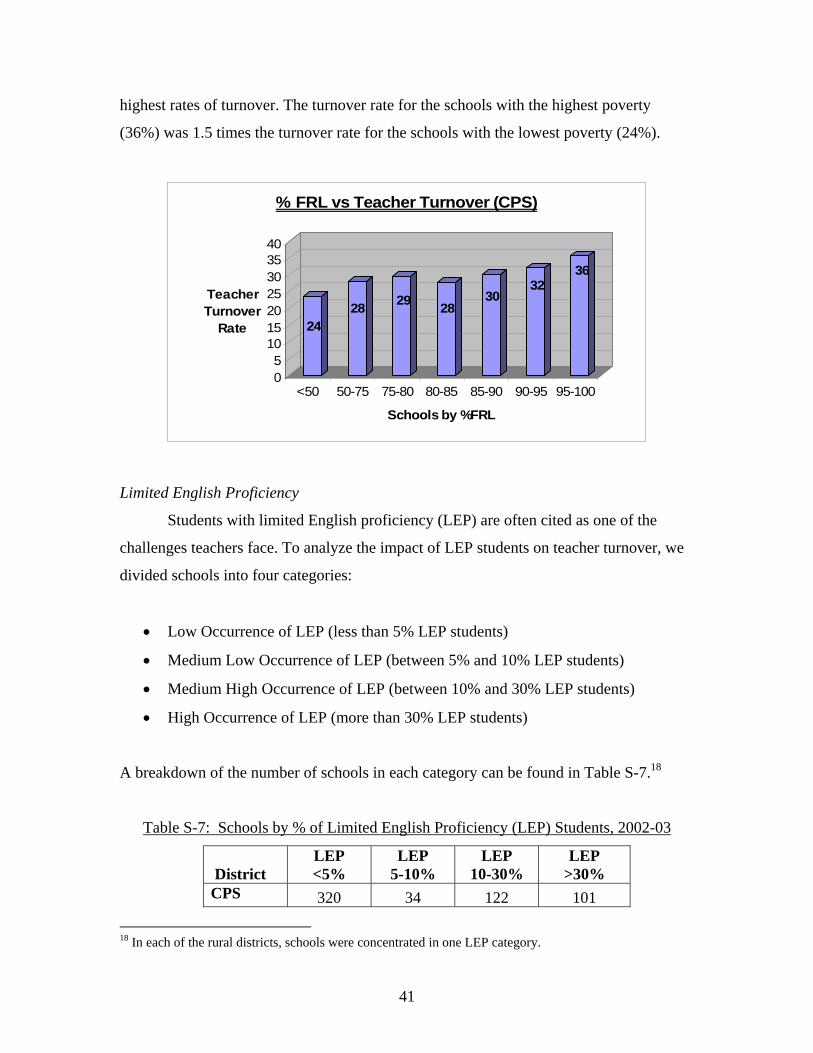
41
highest rates of turnover. The turnover rate for the schools with the highest poverty
(36%) was 1.5 times the turnover rate for the schools with the lowest poverty (24%).
2428 29 28
3032
36
05
10152025303540
Teacher Turnover
Rate
<50 50-75 75-80 80-85 85-90 90-95 95-100
Schools by %FRL
% FRL vs Teacher Turnover (CPS)
Limited English Proficiency
Students with limited English proficiency (LEP) are often cited as one of the
challenges teachers face. To analyze the impact of LEP students on teacher turnover, we
divided schools into four categories:
• Low Occurrence of LEP (less than 5% LEP students)
• Medium Low Occurrence of LEP (between 5% and 10% LEP students)
• Medium High Occurrence of LEP (between 10% and 30% LEP students)
• High Occurrence of LEP (more than 30% LEP students)
A breakdown of the number of schools in each category can be found in Table S-7.18
Table S-7: Schools by % of Limited English Proficiency (LEP) Students, 2002-03
District LEP <5%
LEP 5-10%
LEP 10-30%
LEP >30%
CPS 320 34 122 101
18 In each of the rural districts, schools were concentrated in one LEP category.
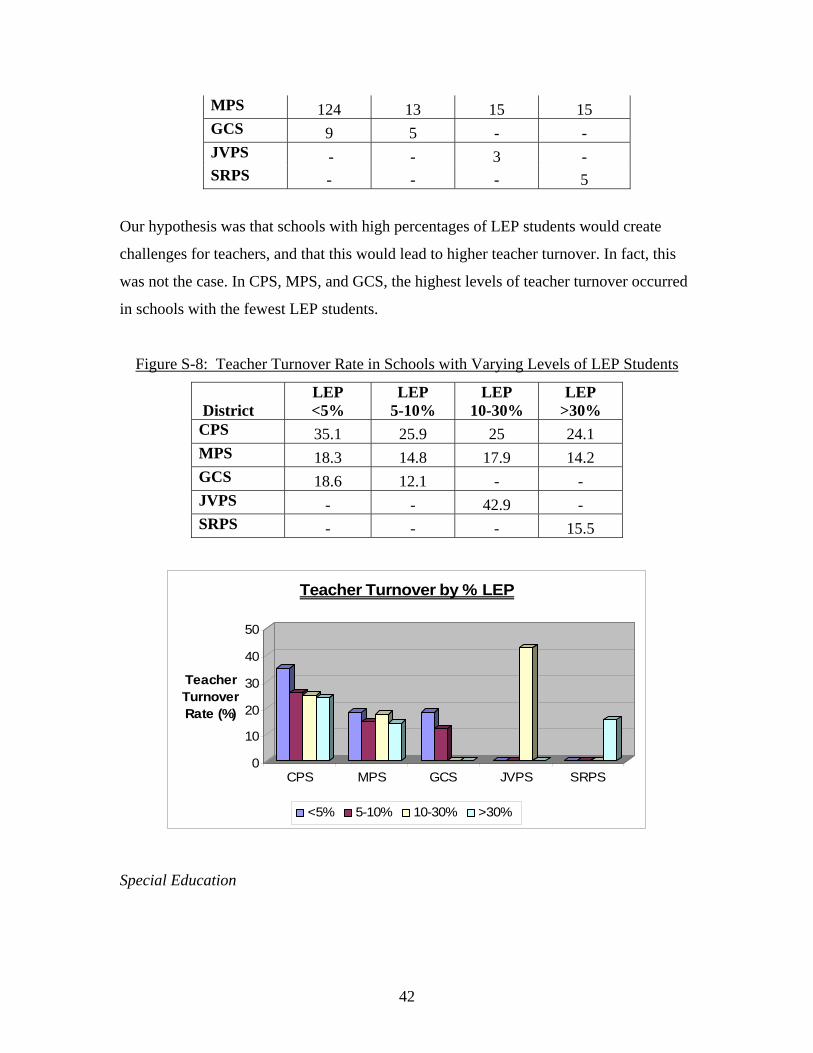
42
MPS 124 13 15 15 GCS 9 5 - - JVPS - - 3 - SRPS - - - 5
Our hypothesis was that schools with high percentages of LEP students would create
challenges for teachers, and that this would lead to higher teacher turnover. In fact, this
was not the case. In CPS, MPS, and GCS, the highest levels of teacher turnover occurred
in schools with the fewest LEP students.
Figure S-8: Teacher Turnover Rate in Schools with Varying Levels of LEP Students
District LEP <5%
LEP 5-10%
LEP 10-30%
LEP >30%
CPS 35.1 25.9 25 24.1 MPS 18.3 14.8 17.9 14.2 GCS 18.6 12.1 - - JVPS - - 42.9 - SRPS - - - 15.5
0
10
20
30
40
50
Teacher Turnover Rate (%)
CPS MPS GCS JVPS SRPS
Teacher Turnover by % LEP
<5% 5-10% 10-30% >30%
Special Education
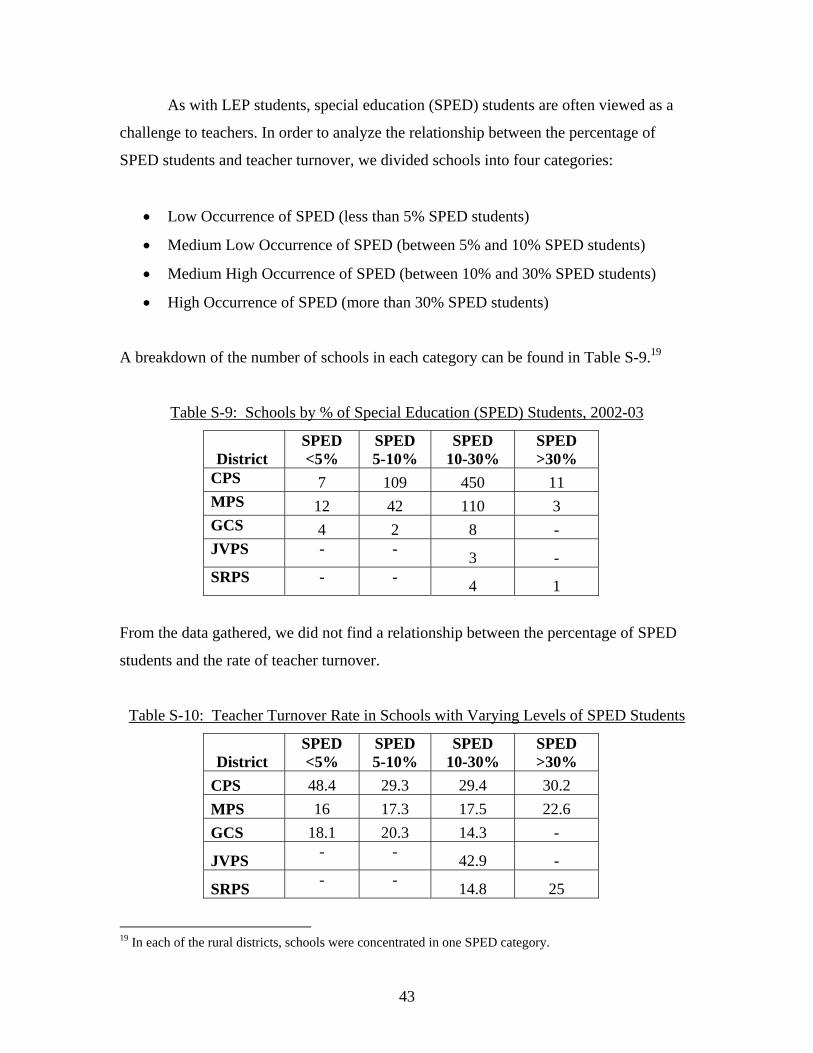
43
As with LEP students, special education (SPED) students are often viewed as a
challenge to teachers. In order to analyze the relationship between the percentage of
SPED students and teacher turnover, we divided schools into four categories:
• Low Occurrence of SPED (less than 5% SPED students)
• Medium Low Occurrence of SPED (between 5% and 10% SPED students)
• Medium High Occurrence of SPED (between 10% and 30% SPED students)
• High Occurrence of SPED (more than 30% SPED students)
A breakdown of the number of schools in each category can be found in Table S-9.19
Table S-9: Schools by % of Special Education (SPED) Students, 2002-03
District SPED <5%
SPED 5-10%
SPED 10-30%
SPED >30%
CPS 7 109 450 11 MPS 12 42 110 3 GCS 4 2 8 - JVPS - - 3 - SRPS - - 4 1
From the data gathered, we did not find a relationship between the percentage of SPED
students and the rate of teacher turnover.
Table S-10: Teacher Turnover Rate in Schools with Varying Levels of SPED Students
District SPED <5%
SPED 5-10%
SPED 10-30%
SPED >30%
CPS 48.4 29.3 29.4 30.2 MPS 16 17.3 17.5 22.6 GCS 18.1 20.3 14.3 -
JVPS - - 42.9 -
SRPS - - 14.8 25
19 In each of the rural districts, schools were concentrated in one SPED category.
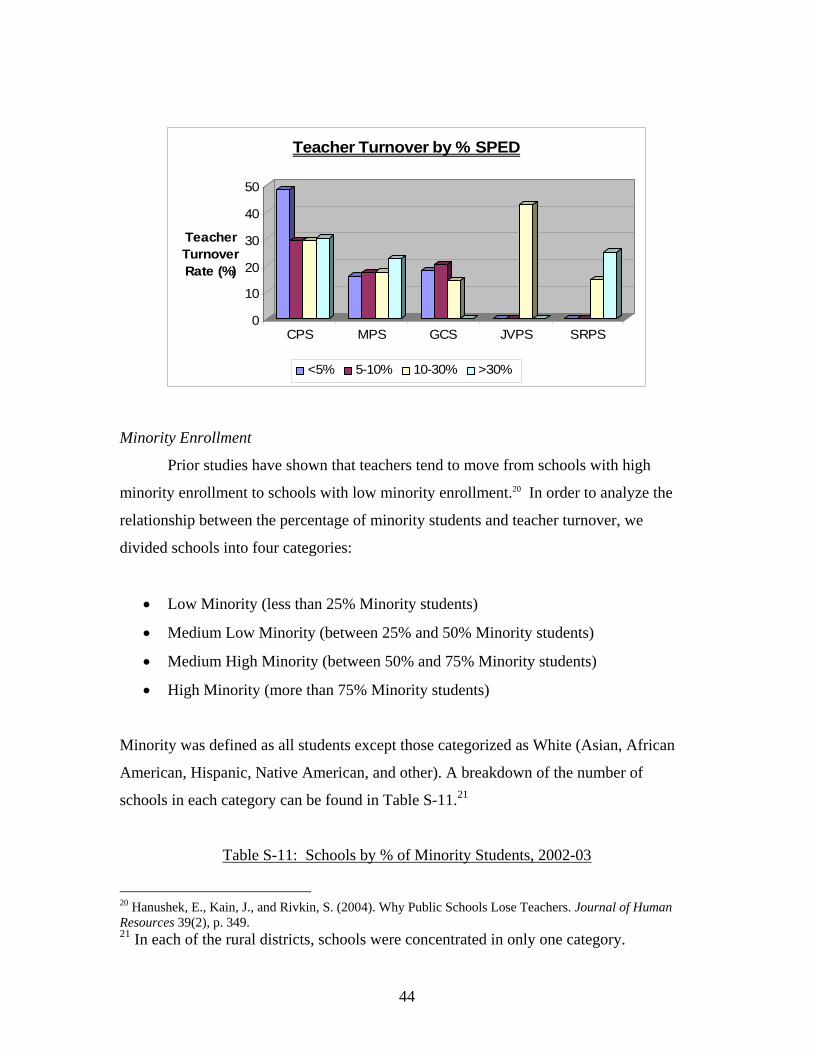
44
0
10
20
30
40
50
Teacher Turnover Rate (%)
CPS MPS GCS JVPS SRPS
Teacher Turnover by % SPED
<5% 5-10% 10-30% >30%
Minority Enrollment
Prior studies have shown that teachers tend to move from schools with high
minority enrollment to schools with low minority enrollment.20 In order to analyze the
relationship between the percentage of minority students and teacher turnover, we
divided schools into four categories:
• Low Minority (less than 25% Minority students)
• Medium Low Minority (between 25% and 50% Minority students)
• Medium High Minority (between 50% and 75% Minority students)
• High Minority (more than 75% Minority students)
Minority was defined as all students except those categorized as White (Asian, African
American, Hispanic, Native American, and other). A breakdown of the number of
schools in each category can be found in Table S-11.21
Table S-11: Schools by % of Minority Students, 2002-03
20 Hanushek, E., Kain, J., and Rivkin, S. (2004). Why Public Schools Lose Teachers. Journal of Human Resources 39(2), p. 349. 21 In each of the rural districts, schools were concentrated in only one category.
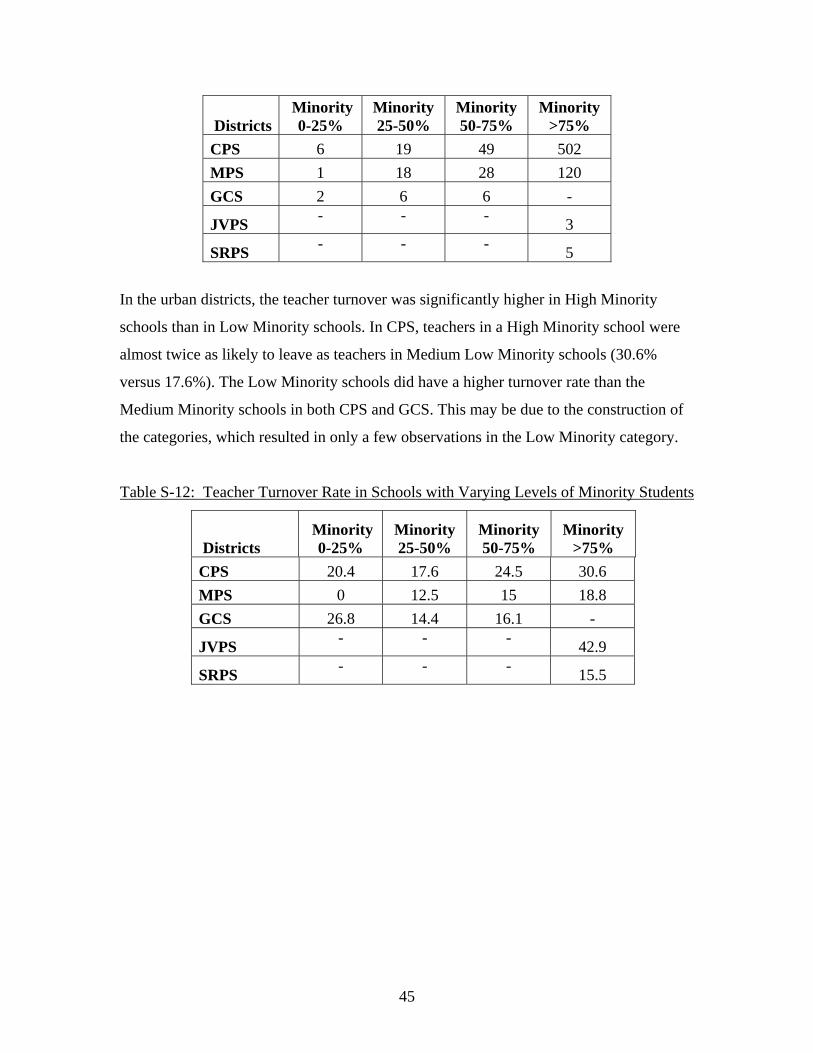
45
Districts Minority
0-25% Minority 25-50%
Minority 50-75%
Minority >75%
CPS 6 19 49 502 MPS 1 18 28 120 GCS 2 6 6 -
JVPS - - - 3
SRPS - - - 5
In the urban districts, the teacher turnover was significantly higher in High Minority
schools than in Low Minority schools. In CPS, teachers in a High Minority school were
almost twice as likely to leave as teachers in Medium Low Minority schools (30.6%
versus 17.6%). The Low Minority schools did have a higher turnover rate than the
Medium Minority schools in both CPS and GCS. This may be due to the construction of
the categories, which resulted in only a few observations in the Low Minority category.
Table S-12: Teacher Turnover Rate in Schools with Varying Levels of Minority Students
Districts Minority
0-25% Minority 25-50%
Minority 50-75%
Minority >75%
CPS 20.4 17.6 24.5 30.6 MPS 0 12.5 15 18.8 GCS 26.8 14.4 16.1 -
JVPS - - - 42.9
SRPS - - - 15.5
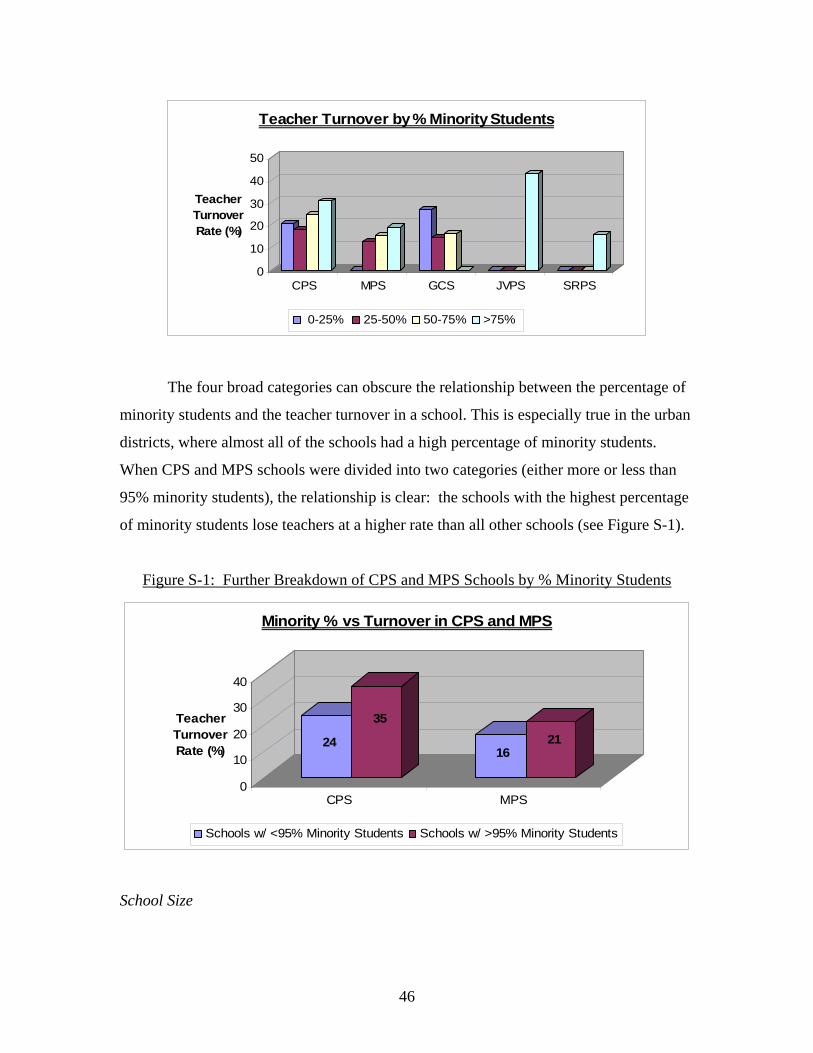
46
0
10
20
30
40
50
Teacher Turnover Rate (%)
CPS MPS GCS JVPS SRPS
Teacher Turnover by % Minority Students
0-25% 25-50% 50-75% >75%
The four broad categories can obscure the relationship between the percentage of
minority students and the teacher turnover in a school. This is especially true in the urban
districts, where almost all of the schools had a high percentage of minority students.
When CPS and MPS schools were divided into two categories (either more or less than
95% minority students), the relationship is clear: the schools with the highest percentage
of minority students lose teachers at a higher rate than all other schools (see Figure S-1).
Figure S-1: Further Breakdown of CPS and MPS Schools by % Minority Students
24
35
1621
0
10
20
30
40
Teacher Turnover Rate (%)
CPS MPS
Minority % vs Turnover in CPS and MPS
Schools w/ <95% Minority Students Schools w/ >95% Minority Students
School Size
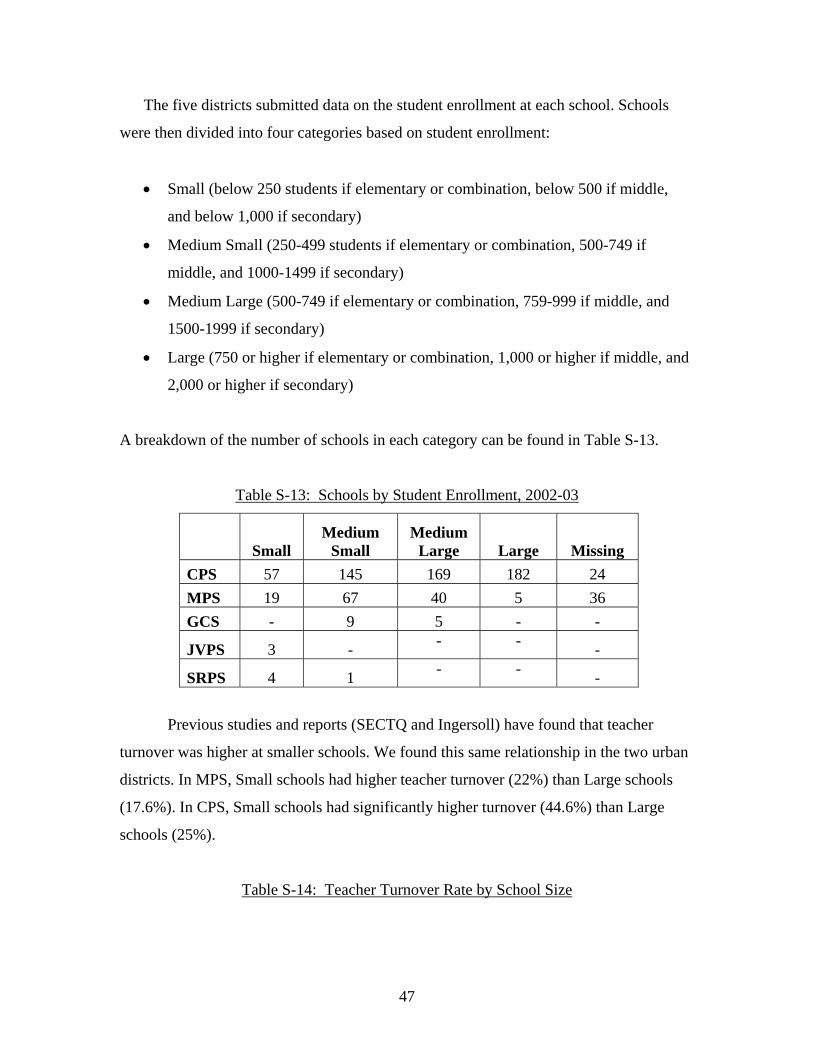
47
The five districts submitted data on the student enrollment at each school. Schools
were then divided into four categories based on student enrollment:
• Small (below 250 students if elementary or combination, below 500 if middle,
and below 1,000 if secondary)
• Medium Small (250-499 students if elementary or combination, 500-749 if
middle, and 1000-1499 if secondary)
• Medium Large (500-749 if elementary or combination, 759-999 if middle, and
1500-1999 if secondary)
• Large (750 or higher if elementary or combination, 1,000 or higher if middle, and
2,000 or higher if secondary)
A breakdown of the number of schools in each category can be found in Table S-13.
Table S-13: Schools by Student Enrollment, 2002-03
Small Medium
Small Medium
Large Large Missing CPS 57 145 169 182 24 MPS 19 67 40 5 36 GCS - 9 5 - -
JVPS 3 - - - -
SRPS 4 1 - - -
Previous studies and reports (SECTQ and Ingersoll) have found that teacher
turnover was higher at smaller schools. We found this same relationship in the two urban
districts. In MPS, Small schools had higher teacher turnover (22%) than Large schools
(17.6%). In CPS, Small schools had significantly higher turnover (44.6%) than Large
schools (25%).
Table S-14: Teacher Turnover Rate by School Size
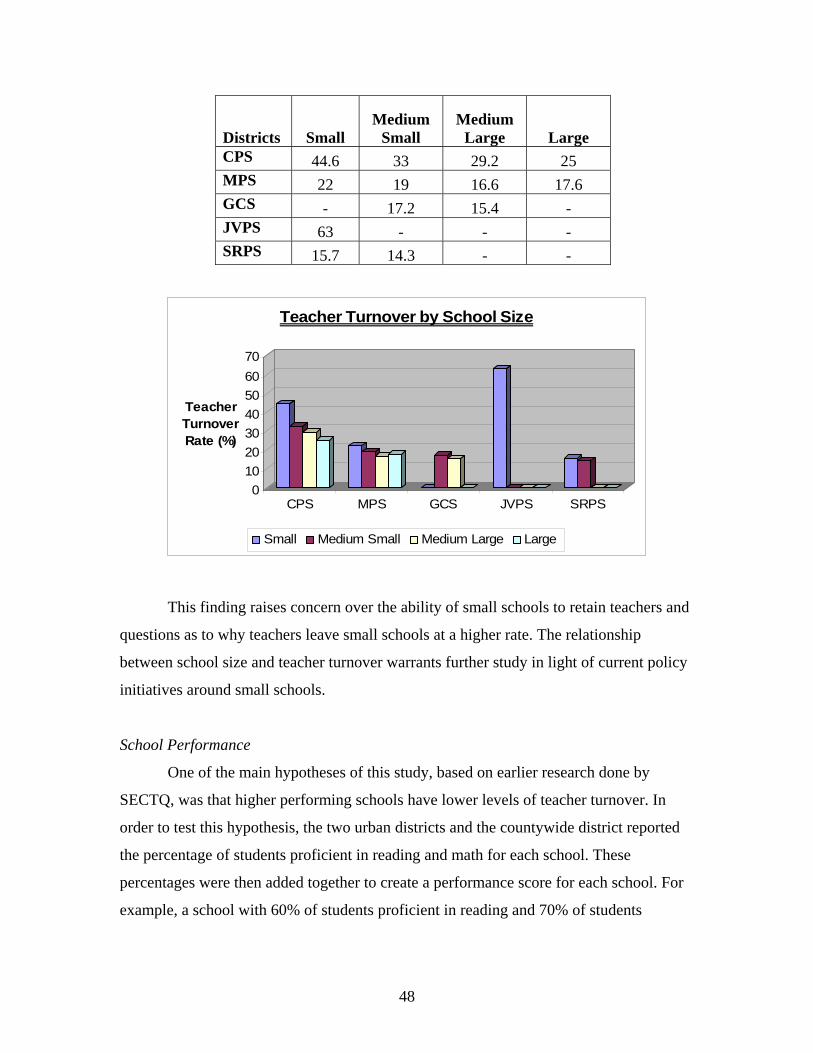
48
Districts Small Medium
Small Medium
Large Large CPS 44.6 33 29.2 25 MPS 22 19 16.6 17.6 GCS - 17.2 15.4 - JVPS 63 - - - SRPS 15.7 14.3 - -
010203040506070
Teacher Turnover Rate (%)
CPS MPS GCS JVPS SRPS
Teacher Turnover by School Size
Small Medium Small Medium Large Large
This finding raises concern over the ability of small schools to retain teachers and
questions as to why teachers leave small schools at a higher rate. The relationship
between school size and teacher turnover warrants further study in light of current policy
initiatives around small schools.
School Performance
One of the main hypotheses of this study, based on earlier research done by
SECTQ, was that higher performing schools have lower levels of teacher turnover. In
order to test this hypothesis, the two urban districts and the countywide district reported
the percentage of students proficient in reading and math for each school. These
percentages were then added together to create a performance score for each school. For
example, a school with 60% of students proficient in reading and 70% of students
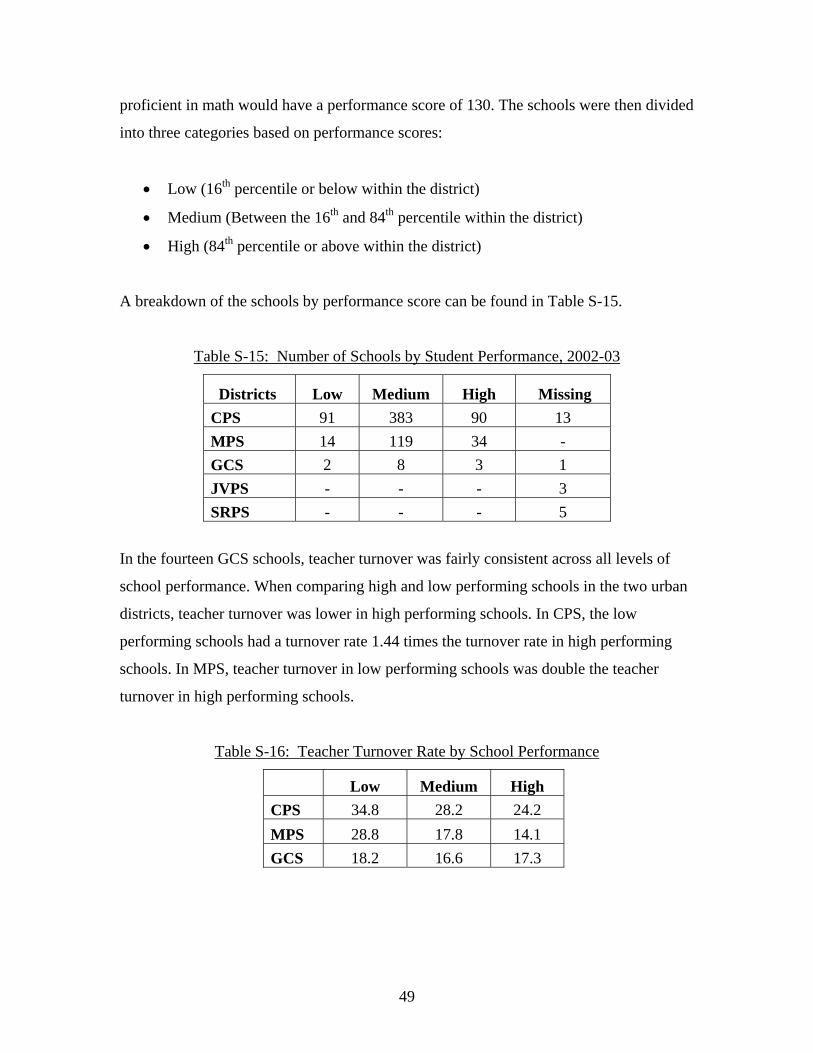
49
proficient in math would have a performance score of 130. The schools were then divided
into three categories based on performance scores:
• Low (16th percentile or below within the district)
• Medium (Between the 16th and 84th percentile within the district)
• High (84th percentile or above within the district)
A breakdown of the schools by performance score can be found in Table S-15.
Table S-15: Number of Schools by Student Performance, 2002-03
Districts Low Medium High Missing CPS 91 383 90 13 MPS 14 119 34 - GCS 2 8 3 1 JVPS - - - 3 SRPS - - - 5
In the fourteen GCS schools, teacher turnover was fairly consistent across all levels of
school performance. When comparing high and low performing schools in the two urban
districts, teacher turnover was lower in high performing schools. In CPS, the low
performing schools had a turnover rate 1.44 times the turnover rate in high performing
schools. In MPS, teacher turnover in low performing schools was double the teacher
turnover in high performing schools.
Table S-16: Teacher Turnover Rate by School Performance
Low Medium High CPS 34.8 28.2 24.2 MPS 28.8 17.8 14.1 GCS 18.2 16.6 17.3
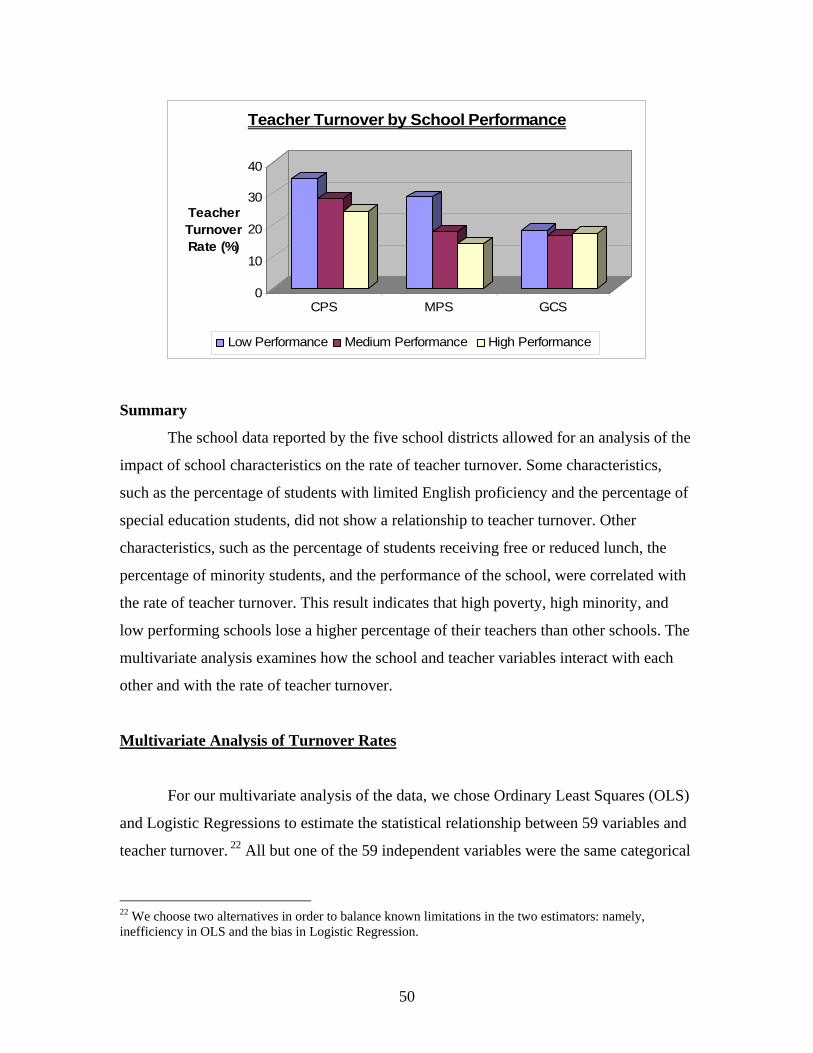
50
0
10
20
30
40
Teacher Turnover Rate (%)
CPS MPS GCS
Teacher Turnover by School Performance
Low Performance Medium Performance High Performance
Summary
The school data reported by the five school districts allowed for an analysis of the
impact of school characteristics on the rate of teacher turnover. Some characteristics,
such as the percentage of students with limited English proficiency and the percentage of
special education students, did not show a relationship to teacher turnover. Other
characteristics, such as the percentage of students receiving free or reduced lunch, the
percentage of minority students, and the performance of the school, were correlated with
the rate of teacher turnover. This result indicates that high poverty, high minority, and
low performing schools lose a higher percentage of their teachers than other schools. The
multivariate analysis examines how the school and teacher variables interact with each
other and with the rate of teacher turnover.
Multivariate Analysis of Turnover Rates
For our multivariate analysis of the data, we chose Ordinary Least Squares (OLS)
and Logistic Regressions to estimate the statistical relationship between 59 variables and
teacher turnover. 22 All but one of the 59 independent variables were the same categorical
22 We choose two alternatives in order to balance known limitations in the two estimators: namely, inefficiency in OLS and the bias in Logistic Regression.
51
variables presented earlier in the bivariate analysis.23 Although there were often notable
differences among districts, our statistically significant findings (at a .10 level of
significance) were that turnover probabilities were higher for math teachers, but not for
science or special education teachers. Turnover probabilities were higher for teachers
with less than five, and more than 20, years of experience, and for teachers in their 20s,
30s, 50s and 60s. Turnover probabilities were higher for teachers who taught in schools
with high minority populations, but only in the urban school districts. Turnover
probabilities were also higher for teachers in schools with low academic performance and
for those with high student turnover during the year. They were lower in secondary
schools, higher in small schools, and lower in schools with low principal turnover.
Surprisingly, we found no evidence that teacher turnover was higher in high poverty
schools, even though our bivariate analysis had contained some evidence of such an
association. We also found that schools with higher percentages of special education and
limited English proficiency students were less likely than others to experience teacher
turnover.
Ordinary Least Squares (OLS) and Logistic Regressions
Bivariate analysis of the teacher and school variables reveals associations with
turnover rates that may change when multiple sets of teacher and school variables are
considered at the same time in a single multivariate analysis. The advantage of
conducting such an analysis is that it permits a researcher to consider the effect of
individual variables on turnover rates while holding the effects of other variables
constant. Multivariate analysis thus improves the researcher’s ability to isolate and clarify
the effects of individual variables. The “dependent” variable is dichotomous, i.e. set to
“0” or “1” depending on whether a teacher moved or left his or her teaching position at a
school between 2002-2003 and 2003-2004. The “independent” variables are the teacher
and school variables. The dependent variable has a value of ‘1’ for teachers who left, and
a value of ‘0’ for those who remained teaching at the same school for both study years.
23 The one addition was “racial concordance”, which measures the probability a teacher will turn over if the teacher’s race/ethnicity matches that of the school’s largest racial/ethnic group.
52
Thus, both the OLS and the Logistic regression estimate the probability that a teacher
will leave or move from the school in which he or she was employed in 2002-03.
In order to allow for the likelihood that these multivariate relationships vary
across districts and also to take into account the absence of data on some variables in
each district, we have performed regression analysis on each of the districts separately.
An advantage of this approach is that it allows us to consider the effects of all variables
for which districts were able to provide solid data. It also prevents the data from the two
larger school districts from unduly influencing the estimation of variable effects (98% of
the teachers in the study were employed by the two large urban districts). Finally, it
permits us to make comparisons across the very different districts that participated in the
study.
In our original data collection from districts, several “independent variables” were
first collected as continuous variables and then converted to categorical variables in order
to simplify the presentation of bivariate tables and graphs. An example of this is the
variable birth date, which could be expressed either as a continuous variable – age – or as
a set of age categories, such as “younger than 30”, “30 but younger than 40”, etc. We
entered these variables in our regressions as age categories in order to be able to compare
their effects in bivariate and multivariate analyses. We did it also to allow for the
possibility that the relationship between turnover and the continuous variable is not a
simple linear one throughout the range of data on the independent variable, something we
think is more likely than not with certain variables (e.g., teacher age, years of teaching
experience, percent of students on Free and Reduced Lunch program). Another advantage
to using categorical variables is that interpretation of regression coefficients, i.e. the
effects of the variables, is often simpler and more intuitive than in their continuous form.
A disadvantage of representing these variables as categorical variables (instead of
continuous variables) is that they consume additional “degrees of freedom” that may be
needed to find statistically significant relationships between turnover and each variable.
We think this problem is negligible for all districts except the two smallest districts
whose data have been combined to avoid the problem.24
24 The two smallest districts were located in the same state and thus bear many similarities.
53
Readers should be aware that for purely statistical reasons, categorical variables
used in regression must be interpreted against a “norm” or reference group. Thus, the
effect on turnover of being “younger than 30 years old” is an amount that is relative to
the amount associated with being in the “norm” or reference group. The choice of the
“norm” or reference group is purely a matter of convenience. For the analyses that
follow, we explain the reference group category for each independent variable to enable
readers to interpret the findings.
Finally, it should be noted that the unit of analysis in each of the multiple
regression equations estimated in this study is the individual teacher (and his or her
action to move or leave) and not a group of teachers (and the percentage of teachers who
move or leave). This means that the data values of all school variables were the same for
each of the teachers employed by the school. This does not affect the interpretation of the
school effects or teacher effects. Table R-1 below presents the list of the variables used in
each of the regressions.
Table R-1: Turnover Rate Regression Variables
Variable Categories Norm/ Reference Category
District(s) Omitted from the Analysis
Teacher Variables Gender Male, Female Female Age <30, 30-39, 40-49,50-59,>60 40-49 Race/Ethnicity African/American, American
Indian, Asian/Pacific Islander, Hispanic, Caucasian
Caucasian
Highest Earned Degree
Masters or Above, Baccalaureate Baccalaureate
Teaching Field Life/Biol. Sc., Phys./Earth Sc., Math, Soc. Sc., English/Lang. Arts, Foreign Lang., Sp. Ed., Reading, Fine Arts/Music, Health/PE, Voc. Ed., Elem Ed., “Other”
Elem. Ed.
Total Years Teaching Experience
0, 1, 2, 3, 4-5, 6-10, 11-20, >20 11-20
Relative Salary & Benefits
% of District Mean Salary and Benefits
N/A
54
Teacher Mentoring Role
Mentor, Mentee, None None CPS, MPS, All
Does Teacher Have Own Classroom?
Yes, No Yes CPS, MPS, JVPS, SRPS, All
School Variables School Type Elementary, Middle, Secondary Elem. % in Free/Reduced Lunch Program
<50, 50<75, 75<95, 95 or more <50 MPS, JVPS, SRPS
% with Limited English Proficiency
<5, 5<10, 10<30, 30 or more <5 JVPS, SRPS
% in Special Ed programs
<5,5<10, 10<30, 30 or more
<5 JVPS, SRPS
Race/Ethnicity Concordance
Yes, No No
Pupil % Minority (non-Caucasian)
<50, 50<75, 75<95, 95+ <50
School size Small, Medium Small, Medium Large, Large
Small JVPS, SRPS, GCS
Principal Turnover High, Medium, Low High CPS, GCS, All Student Academic Performance
Low, Medium, High High JVPS, SRPS
Student Stability Rate
<70%, 70-90, 90+ 95+ CPS, JVPS, SRPS, GCS, All
Attendance Rate <85, 85-95, 95+ 95+ CPS, GCS, All
As Table R-1 reveals, each district regression contained nine generic teacher
variables, one of which was continuous (relative salary and benefits) and the rest
categorical, and 11 school variables, all of which were categorical. Not all variables were
available for each district; the last column in Table R-1 shows which districts were
missing any of the 20 variables used in the study. Counting all of the categorical variables
separately, the regressions could contain a maximum of 59 variables.
Not all of the variables collected on teachers and schools could be included in the
regression analysis. Variables with no variation in data values, those with mostly missing
values, and those with erroneous values were deleted because they could not contribute to
55
the statistical “explanatory power” of the regressions.25 An example of a variable with no
variation in its values was the one that indicated whether a teacher was a full-time or part-
time employee of the district (all teachers were coded as full-time employees in each
district). An example of a variable with obviously erroneous values was the one that
indicated whether a teacher met the NCLB standard to be “highly qualified” in 2002-03
(the districts reported that virtually all of the teachers met the standard). A variable with
mostly missing values was the student stability rate – an estimate of the percentage of
students who remained in school for the rest of the school year following their initial
enrollment. Only one district was able to report on this variable.
Partial Effects
The coefficients that are presented in the tables that follow represent the partial
effects of changing each independent variable by one unit while holding all other
independent variables constant. Since all but one of the independent variables used in the
regressions are categorical, they necessarily vary by one unit, depending on whether a
teacher falls into that category. Thus the partial effects may be interpreted as the change
in the probability of “turning over” given that a teacher is in the relevant category–all
other variables being held constant. The probability of “turning over” refers to individual
outcomes, not to a district’s overall turnover rate. The partial effects are always relative
to the “norm” or “reference” group for the generic variable. For example, a coefficient
equal to +.03 for the variable “Age<30” would indicate that a teacher who is less than 30
years old, is 3 percentage points more likely to turn over than a teacher who is in his or
her 40s (the norm or reference group) – all other variables being equal.
Similarly, a coefficient equal to +.05 for the variable “Performance Low” would
indicate that a teacher who worked in a school in which students’ academic performance
on state tests was low would be 5 percentage points more likely to turn over in his or her
position than a teacher who worked in a school whose students’ academic performance
on state tests was high (the norm or reference group) – all other things being equal. The 25 The loss of variables with missing, erroneous, and identical values caused the number of teacher observations used in district regressions to be lower than the counts used in some of the aforementioned bivariate analyses and lower still than the counts of teachers in the original data submissions from the districts.
56
reader is reminded here that the choice of reference groups is arbitrary: had they been
reversed for school performance, a value of -.05 would indicate that teachers in high
performing schools are 5% less likely to turn over than teachers in a low performing
school. Keep in mind that these probabilities are about teachers in specific groups, not the
overall rate of turnover for a school or a district.
Finally, the partial effects of all variables in logistic regressions are evaluated at
the mean turnover rate for all teachers, and the estimated partial effect is the product of
this turnover rate, the complement of the turnover rate, and the estimated coefficient for
the variable in the logistic regression. The products of the turnover rates and their
complements are shown in Table R-1. Partial effects are shown in succeeding tables.
Results
With 59 independent variables to consider in estimating the probability of teacher
turnover, we have chosen, for the sake of manageability, to present our results in clusters
of related independent variables. For each of five clusters, we present the partial effects
from the OLS and Logistic regressions for each of the four districts. Only partial effects
that were statistically significant (at the .10 level) are presented since, by definition, other
partial effects cannot be judged to be different from zero. Thus, the tables that follow
present our findings on the variables that appear to have influenced teachers’ turnover
decisions in each district. The independent variables in each cluster are:
• Teaching field variables (Table R-2);
• Age, work experience, and highest earned degrees of teachers (Table R-3);
• Race/ethnicity and gender of the teacher and the percent minority of the student
body at the school (Table R-4);
• School characteristics, including school size and type, academic performance of
students at the school, student attendance rate, student stability rate, the
proportions of students with limited English deficiency or special education
needs, and the level of principal turnover at the school (Table R-5); and
57
• Other independent variables including whether the teacher served as a mentor or
mentee in 2002-03, whether the teacher had his or her own classroom, and the
teacher’s relative compensation (Table R-6).
We turn first to the results on the teaching field variables.
Teaching Fields
Recall that the teaching field variables are 13 generic categories (including
“other”) to which districts were asked to cross-walk their state-specific licensure and
teaching assignment codes. In addition, major field of study data were also cross-walked
into the same categories. The data collected from the districts had major omissions: the
urban districts were not able to provide teaching assignment data; licensure fields were
disproportionately reported as being either elementary or “other” in our largest school
district and were frequently missing in the other districts; and major field data were often
missing. We therefore created a composite measure of teaching field in which the teacher
was assumed to have a field if he or she had a licensure area, teaching assignment or
major field that had been cross-walked to our generic field. While this approach helped to
address the problem of missing data, it did not yield a single unique teaching field for
each teacher (on average, each teacher had roughly two fields identified by this method),
nor did it assure that the field identified was accurate and current, or that the teacher was
actually teaching in that field during the 2002-03 year. It did, however, allow us to
address analytically the question of whether a teacher with some expertise in a field was
more or less likely to turn over. We expected to find that teachers in shortage areas such
as math, the sciences, and special education were more likely to turn over. Our results are
reported in Table R-2.
The data seem to confirm that mathematics was a significantly higher turnover
field in three of the four districts. Teachers with expertise in mathematics were 4.2 to
29.3 percentage points more likely to leave their positions than were teachers with
expertise in elementary education (the reference field). The results were not uniform,
however. Milwaukee math teachers, by contrast, were roughly six percentage points less
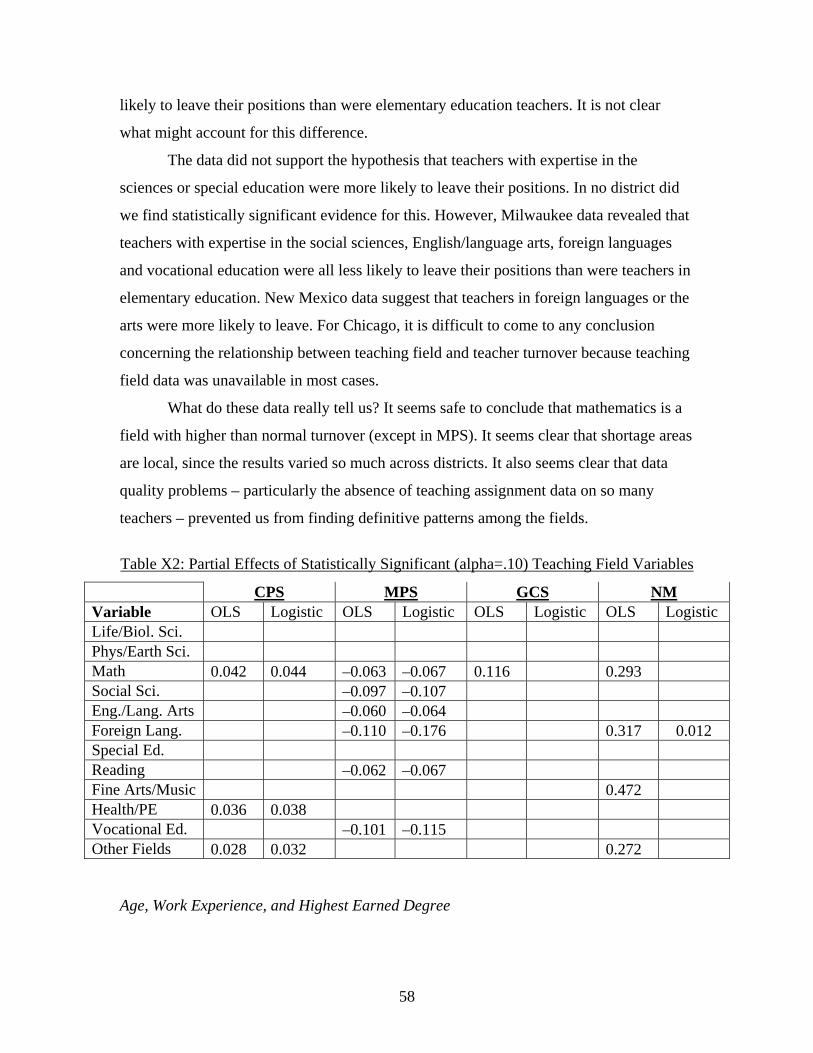
58
likely to leave their positions than were elementary education teachers. It is not clear
what might account for this difference.
The data did not support the hypothesis that teachers with expertise in the
sciences or special education were more likely to leave their positions. In no district did
we find statistically significant evidence for this. However, Milwaukee data revealed that
teachers with expertise in the social sciences, English/language arts, foreign languages
and vocational education were all less likely to leave their positions than were teachers in
elementary education. New Mexico data suggest that teachers in foreign languages or the
arts were more likely to leave. For Chicago, it is difficult to come to any conclusion
concerning the relationship between teaching field and teacher turnover because teaching
field data was unavailable in most cases.
What do these data really tell us? It seems safe to conclude that mathematics is a
field with higher than normal turnover (except in MPS). It seems clear that shortage areas
are local, since the results varied so much across districts. It also seems clear that data
quality problems – particularly the absence of teaching assignment data on so many
teachers – prevented us from finding definitive patterns among the fields.
Table X2: Partial Effects of Statistically Significant (alpha=.10) Teaching Field Variables
CPS MPS GCS NM Variable OLS Logistic OLS Logistic OLS Logistic OLS Logistic Life/Biol. Sci. Phys/Earth Sci. Math 0.042 0.044 –0.063 –0.067 0.116 0.293 Social Sci. –0.097 –0.107 Eng./Lang. Arts –0.060 –0.064 Foreign Lang. –0.110 –0.176 0.317 0.012 Special Ed. Reading –0.062 –0.067 Fine Arts/Music 0.472 Health/PE 0.036 0.038 Vocational Ed. –0.101 –0.115 Other Fields 0.028 0.032 0.272
Age, Work Experience, and Highest Earned Degree
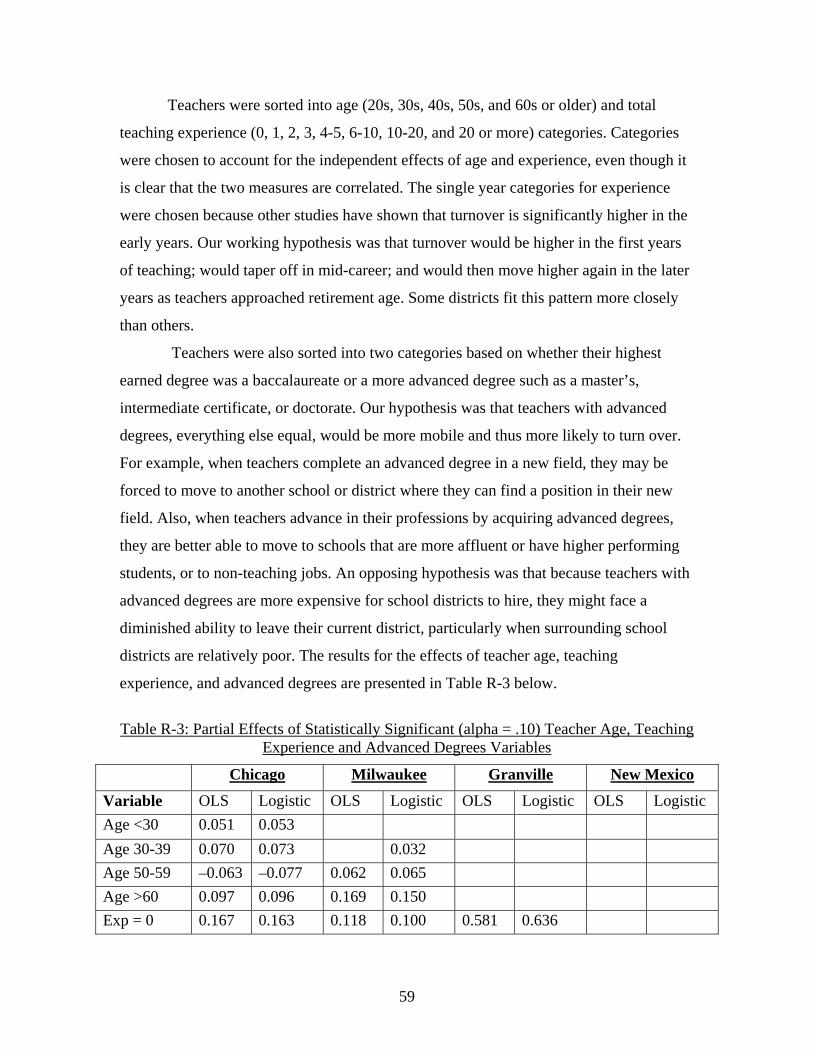
59
Teachers were sorted into age (20s, 30s, 40s, 50s, and 60s or older) and total
teaching experience (0, 1, 2, 3, 4-5, 6-10, 10-20, and 20 or more) categories. Categories
were chosen to account for the independent effects of age and experience, even though it
is clear that the two measures are correlated. The single year categories for experience
were chosen because other studies have shown that turnover is significantly higher in the
early years. Our working hypothesis was that turnover would be higher in the first years
of teaching; would taper off in mid-career; and would then move higher again in the later
years as teachers approached retirement age. Some districts fit this pattern more closely
than others.
Teachers were also sorted into two categories based on whether their highest
earned degree was a baccalaureate or a more advanced degree such as a master’s,
intermediate certificate, or doctorate. Our hypothesis was that teachers with advanced
degrees, everything else equal, would be more mobile and thus more likely to turn over.
For example, when teachers complete an advanced degree in a new field, they may be
forced to move to another school or district where they can find a position in their new
field. Also, when teachers advance in their professions by acquiring advanced degrees,
they are better able to move to schools that are more affluent or have higher performing
students, or to non-teaching jobs. An opposing hypothesis was that because teachers with
advanced degrees are more expensive for school districts to hire, they might face a
diminished ability to leave their current district, particularly when surrounding school
districts are relatively poor. The results for the effects of teacher age, teaching
experience, and advanced degrees are presented in Table R-3 below.
Table R-3: Partial Effects of Statistically Significant (alpha = .10) Teacher Age, Teaching
Experience and Advanced Degrees Variables
Chicago Milwaukee Granville New Mexico
Variable OLS Logistic OLS Logistic OLS Logistic OLS Logistic Age <30 0.051 0.053 Age 30-39 0.070 0.073 0.032 Age 50-59 –0.063 –0.077 0.062 0.065 Age >60 0.097 0.096 0.169 0.150 Exp = 0 0.167 0.163 0.118 0.100 0.581 0.636
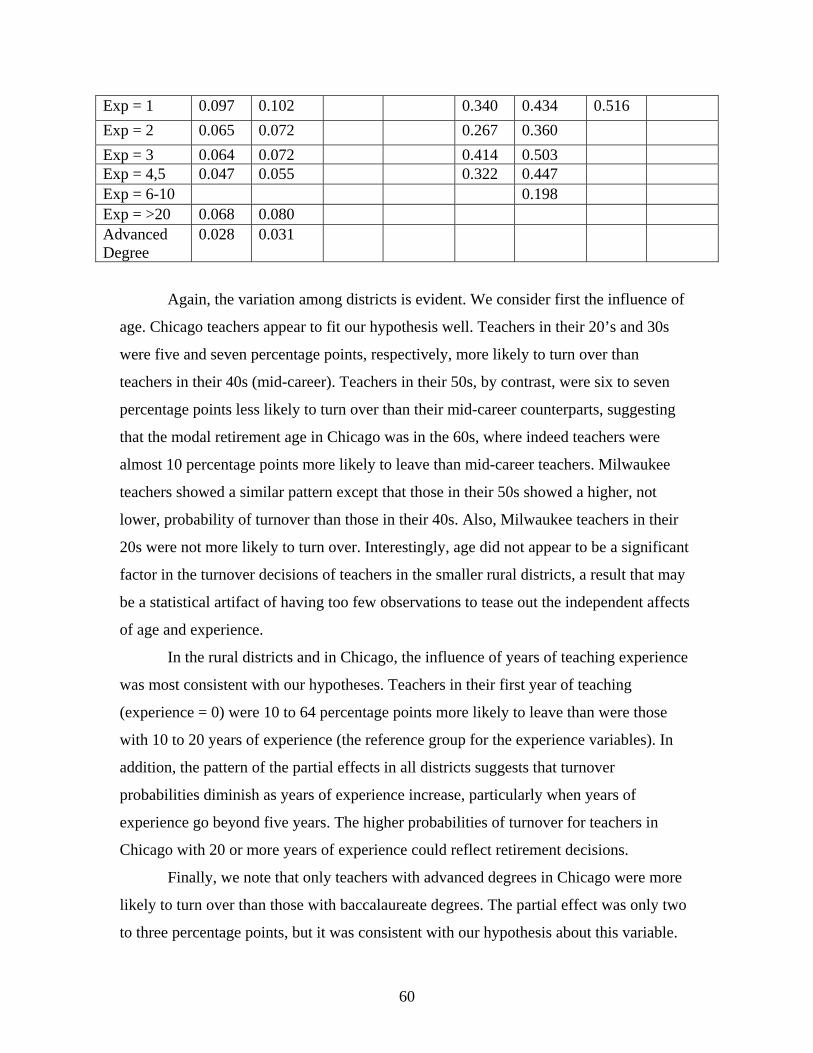
60
Exp = 1 0.097 0.102 0.340 0.434 0.516 Exp = 2 0.065 0.072 0.267 0.360 Exp = 3 0.064 0.072 0.414 0.503 Exp = 4,5 0.047 0.055 0.322 0.447 Exp = 6-10 0.198 Exp = >20 0.068 0.080 Advanced Degree
0.028 0.031
Again, the variation among districts is evident. We consider first the influence of
age. Chicago teachers appear to fit our hypothesis well. Teachers in their 20’s and 30s
were five and seven percentage points, respectively, more likely to turn over than
teachers in their 40s (mid-career). Teachers in their 50s, by contrast, were six to seven
percentage points less likely to turn over than their mid-career counterparts, suggesting
that the modal retirement age in Chicago was in the 60s, where indeed teachers were
almost 10 percentage points more likely to leave than mid-career teachers. Milwaukee
teachers showed a similar pattern except that those in their 50s showed a higher, not
lower, probability of turnover than those in their 40s. Also, Milwaukee teachers in their
20s were not more likely to turn over. Interestingly, age did not appear to be a significant
factor in the turnover decisions of teachers in the smaller rural districts, a result that may
be a statistical artifact of having too few observations to tease out the independent affects
of age and experience.
In the rural districts and in Chicago, the influence of years of teaching experience
was most consistent with our hypotheses. Teachers in their first year of teaching
(experience = 0) were 10 to 64 percentage points more likely to leave than were those
with 10 to 20 years of experience (the reference group for the experience variables). In
addition, the pattern of the partial effects in all districts suggests that turnover
probabilities diminish as years of experience increase, particularly when years of
experience go beyond five years. The higher probabilities of turnover for teachers in
Chicago with 20 or more years of experience could reflect retirement decisions.
Finally, we note that only teachers with advanced degrees in Chicago were more
likely to turn over than those with baccalaureate degrees. The partial effect was only two
to three percentage points, but it was consistent with our hypothesis about this variable.
61
Teacher Race/Ethnicity and Gender and Schools’ Minority and Poverty Populations
In federal and state data collections involving race/ethnicity of teachers and
students, individuals are assigned to one of the following categories: Black/African-
American, Asian American/Pacific Islander, Hispanic, Native American, and
White/Caucasian. Our data collection included the race/ethnicity of the teacher and the
race/ethnicity breakdowns of each school’s enrollment. It also included the percentage of
the students at each school that participated in the free or reduced-price school lunch
(FRL) program. This percentage was our measure of school poverty. The regressions
entered the teacher’s race/ethnicity as one of four categorical variables (reference group
was White/Caucasian); the student body’s race/ethnicity (the percent non-white) as
categorical variables, and the percentage of FRL participants as categorical variables (see
Table R-1). The racial composition and poverty status of the student bodies varied
significantly across districts. In most Chicago and Milwaukee schools, the majority race
was Black/African-American; in Granville County schools it was White/Caucasian; in
Jemez Valley schools it was Native American; in Santa Rosa schools it was Hispanic.
Many Chicago and Milwaukee schools exceeded 95 percent non-white and 95 percent
FRL participants. Few Asian American/Pacific Islanders were enrolled in any of our
study districts. Therefore, percent minority at a school largely meant the percentage of
enrolled students who were African-American, Native American, or Hispanic.
Given these variations in school populations, we chose our school minority
categories in a way that allowed us to test the hypotheses that teacher turnover was
highest in schools that were heavily minority or high poverty. We chose the category
“below 50%” as our reference group and we defined groups of minority and FRL
students as 50-75%, 75-95%, and 95% or higher. These categories provided a fairly
balanced distribution of schools among categories in Chicago and Milwaukee, but were
less balanced in the case of the New Mexico districts, and not at all appropriate for the
schools in Granville County. Therefore, the Granville County schools were assigned to
the following categories: below 25 percent minority, 25-50, and 50-75, since no schools
exceeded 75 percent minority. The reference group was the “<25” group. The same
categories were used for their percentages of FRL students. In contrast to the Granville
62
County schools, the New Mexico districts had no schools in the bottom two minority and
FRL categories. These gaps limited our ability to determine the effects of these variables
in the rural districts because there was just too little variation among the schools. These
gaps are apparent in the results that are presented in Table R-4.
Our hypotheses about the effects of these variables were: 1) minority-race
teachers and male teachers may be more heavily recruited and therefore more tempted to
leave their positions than are majority-race and/or female teachers; 2) teachers of all
race/ethnicities are more likely to leave positions at schools that have high populations of
FRL and minority students. As a corollary to these two, we attempted to test a third
hypothesis that a teacher is more likely to be retained at a school in which the
race/ethnicity of the majority of students is the same as the teacher’s. We tested this third
hypothesis by creating a categorical variable (“racial concordance”) that was equal to one
when the teacher’s race/ethnicity matched that of the school’s largest racial/ethnic group
(zero otherwise).
Table R-4: Partial Effects of Teacher Race/Ethnicity and Gender and Schools’ Percentage
Minority and Percentage Free and Reduced-Price Lunch (FRL)
Chicago Granville Milwaukee New Mexico Variable OLS Logistic OLS Logistic OLS Logistic OLS Logistic Male 0.024 0.026 African American
N/A N/A
Asian American N/A N/A Native American
N/A N/A
Hispanic 0.024 0.027 N/A N/A Pct. Min 25<50 N/A N/A N/A N/A –0.185 N/A N/A Pct. Min 50<75 0.036 0.051 –0.320 –0.419 N/A N/A Pct. Min 75<95 0.039 0.055 0.063 0.064 N/A N/A N/A N/A Pct. Min 95 + 0.075 0.096 0.101 0.098 N/A N/A –0.803 Pct. FRL 50<75 0.042 0.044 0.341 N/A N/A Pct. FRL 75<95 N/A N/A N/A N/A Pct. FRL 95 + N/A N/A N/A N/A Racial Concordance
–0.036
–0.040
63
The partial effects in Table X4 show mixed support for our hypotheses. In the
Chicago data, there is evidence that male and Hispanic teachers leave their position with
higher probability than their reference groups. Similarly, the Chicago data suggest that
teachers in schools with higher minority population also leave at higher rates, and the
effects are proportional to the percentage of minority students at the school. Milwaukee
showed a similar, although weaker, pattern in its data. Finally, Chicago data suggest that
racial concordance is associated with a 3.6 percentage point decrease in the probability of
turnover.
One the other hand, teachers in Granville County and the New Mexico school
districts appear to follow a different pattern of decreasing turnover rates in schools that
have higher minority populations. These results may be statistical anomalies that result
from too few observations on schools (a total of 22 schools in the rural districts) and too
little variation within district in the categories of minority percentages. Even so, the
results are consistent with the bivariate data presented earlier.
Finally, the data present no support for the hypothesis that teacher turnover is
significantly higher at high poverty schools. This contrasts somewhat with the bivariate
analysis presented earlier.
School Variables
Our data collection included variables on some standard school variables (size26
and level) and some customized school variables that included:
• Academic performance of students on State tests,
• Student attendance rate and student stability rate (following the NCLB
definitions),
• Proportions of students with limited English Proficiency (LEP) or special
education needs (SPED), and
26 School size categories: elementary schools were small, medium small, medium large and large according to whether their enrollments were below 250, 250-499, 500-749, 750 and higher; middle and junior high schools were small, medium small, medium large and large according to whether their enrollments were below 500, 500-749, 750-999, 1000 or higher; and secondary schools were small, medium small, medium large and large according to whether their enrollments were below 1000, 1000-1499, 1500-1999, 2000 or higher.
64
• Level of principal turnover at the school.27
We use “N/A” in Table R-5 to indicate when a school district was not able to provide
data on a customized variable or when there was insufficient variation in data values to
include a variable in the regression. An example of the latter is the school size variable
for Granville County: the district data set contained no large or small schools.
In terms of the standard variables of school size and school level, we were not
sure what impact they would have on teacher turnover. Among the customized variables,
we hypothesized that teachers in schools with large populations of LEP or SPED students
would be more likely to turnover because such students can be more challenging to teach
in mainstreamed settings. We also expected that teachers in relatively low performing
schools would be more likely to turnover. Finally, we hypothesized that teachers who
taught in schools with unstable numbers of students, either by virtue of low attendance
rates among a stable population of students or high transfer rates in and out (measured by
our student stability rate), would also be more likely to turnover.
We should note that our school variables are only proxies for working conditions
faced by individual teachers because they are school-level data and not classroom-level
data. This is an important point to keep in mind as one considers the partial effects shown
in Table R-5 below. For example, a school with high percentages of LEP or SPED
students may teach more of these students in separate classes, and fewer in mainstreamed
classes. The school may be able to hire more bilingual and special education teachers to
offer specialized instruction. For most regular classroom teachers at such a school, the
challenge of teaching students with special learning needs may actually be lessened rather
than increased, and the relationship to teacher turnover may be negative rather than
positive. Interestingly, the data on teachers in Milwaukee and Chicago display these
patterns.
27 Principal turnover: low if the district had a principal who has served at least three years and if the district had no more than two principals during the last ten years; high if the principal had served less than two years and if the district had had at least four principals over the last ten years; and medium for other combinations. Only Milwaukee and the New Mexico districts were able to provide the data on this variable for most of their schools.
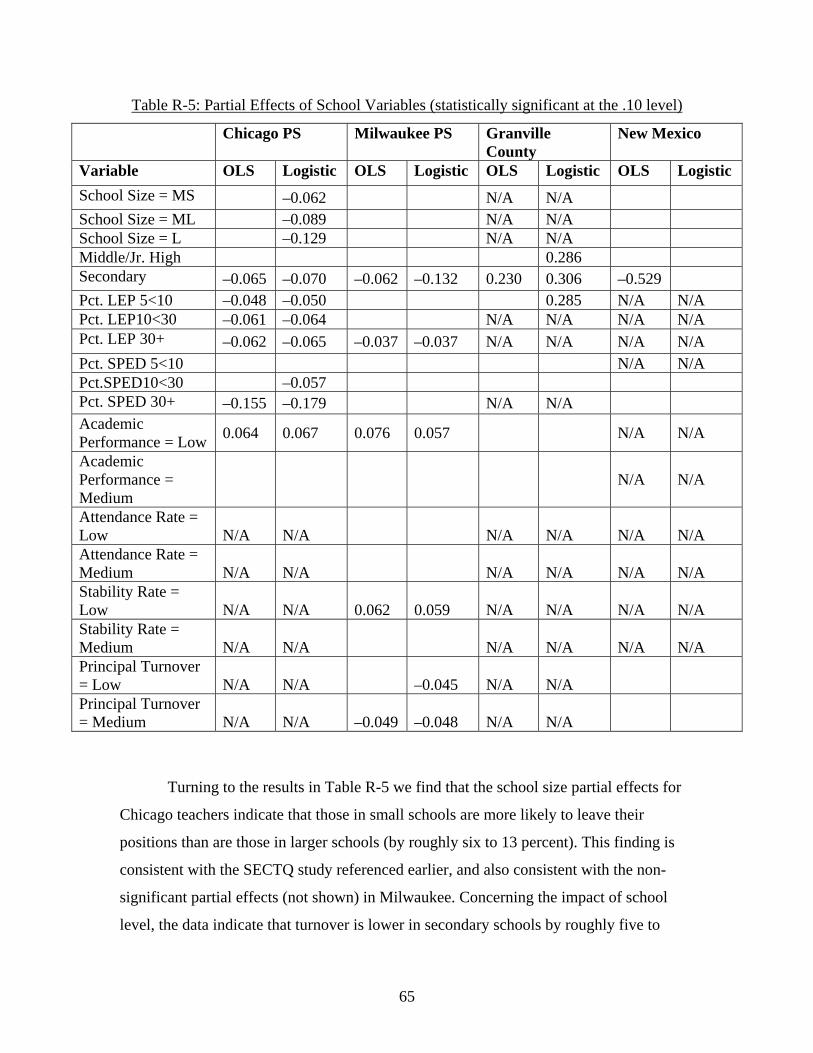
65
Table R-5: Partial Effects of School Variables (statistically significant at the .10 level)
Chicago PS Milwaukee PS Granville County
New Mexico
Variable OLS Logistic OLS Logistic OLS Logistic OLS Logistic School Size = MS –0.062 N/A N/A School Size = ML –0.089 N/A N/A School Size = L –0.129 N/A N/A Middle/Jr. High 0.286 Secondary –0.065 –0.070 –0.062 –0.132 0.230 0.306 –0.529 Pct. LEP 5<10 –0.048 –0.050 0.285 N/A N/A Pct. LEP10<30 –0.061 –0.064 N/A N/A N/A N/A Pct. LEP 30+ –0.062 –0.065 –0.037 –0.037 N/A N/A N/A N/A Pct. SPED 5<10 N/A N/A Pct.SPED10<30 –0.057 Pct. SPED 30+ –0.155 –0.179 N/A N/A Academic Performance = Low 0.064 0.067 0.076 0.057 N/A N/A
Academic Performance = Medium
N/A N/A
Attendance Rate = Low
N/A
N/A
N/A N/A
N/A
N/A
Attendance Rate = Medium
N/A
N/A
N/A N/A
N/A
N/A
Stability Rate = Low
N/A
N/A
0.062
0.059
N/A
N/A
N/A
N/A
Stability Rate = Medium
N/A
N/A
N/A N/A
N/A
N/A
Principal Turnover = Low
N/A
N/A
–0.045 N/A
N/A
Principal Turnover = Medium
N/A
N/A
–0.049
–0.048
N/A
N/A
Turning to the results in Table R-5 we find that the school size partial effects for
Chicago teachers indicate that those in small schools are more likely to leave their
positions than are those in larger schools (by roughly six to 13 percent). This finding is
consistent with the SECTQ study referenced earlier, and also consistent with the non-
significant partial effects (not shown) in Milwaukee. Concerning the impact of school
level, the data indicate that turnover is lower in secondary schools by roughly five to
66
seven percentage points in Milwaukee and Chicago public schools, but higher in the
secondary schools of Granville County, a finding that may have more to do the county’s
proximity to the rapidly growing Wake County schools (Raleigh and surrounding towns)
than to conditions in Granville County. By contrast, Granville’s middle school teachers
are more likely to leave their positions, even though teachers in the other districts were
not.
One of our more puzzling findings was that schools with higher percentages of
LEP students had lower turnover in the urban districts. In CPS, schools with higher
percentages of SPED students also had lower turnover. These results contradict our
hypothesis that high percentages of LEP and SPED students would create challenges and
lead to high teacher turnover. There are many possible explanations for these results,
from the possibility that LEP and SPED students help retain teachers to the problematic
matching of school-level characteristics with individual teacher decisions. Further study
is needed to look more closely at the relationship between LEP and SPED students and
teacher turnover.
We had limited data on which to estimate the partial effects of student stability,
attendance rates, and the extent of principal turnover. Despite this limitation, the effects
from the Milwaukee schools were largely what we had hypothesized. MPS schools with
low rates of student stability were six percentage points more likely to lose teachers than
were those with high rates. MPS attendance rates, by contrast, appear not to have
influenced teacher turnover rates, but principal turnover was a significant factor and in
the direction that we hypothesized. Our data suggest that MPS schools that can stabilize
principal leadership can expect to reduce teacher turnover by roughly five percentage
points.
Finally, we observe that schools with low academic performance on State tests
have higher rates of teacher turnover by six to seven percentage points per year,
everything else equal. This result applies to teachers in the Milwaukee and Chicago
Public Schools, about 98% of our sample. The finding has particular significance because
our ranking of schools was done in districts that were large enough to validate our
ranking procedure.
67
Remaining Variables Including Relative Compensation
Our data collection included three other independent variables of interest: 1)
whether the teacher served as a mentor or mentee in 2002-03; 2) whether the teacher had
his or her own classroom; and 3) the teacher’s total monetary compensation.
Unfortunately, only Granville County was able to provide data on the first two variables,
and Milwaukee Public Schools provided salary and fringe benefit data that appeared
“high” in comparison to the other districts. We report below on our results for these three
variables.
Our hypothesis about the first two variables was that mentor teachers, because of
their heightened level of engagement, and mentee teachers, because of their heightened
level of support, would be less likely to leave their positions than other teachers.
Similarly, we hypothesized that teachers who had their own classrooms, rather than only
having “art on the cart” space, would be more likely to leave their positions. We found no
support for either hypothesis in our regressions on Granville County teachers.
Our hypothesis about teacher compensation was that higher levels of
compensation, everything else equal, would be associated with lower levels of turnover.
To test this hypothesis, we considered adjusting compensation figures for differences in
the cost of living in each district, but given the large sizes and similar geographic and
economic settings of the Milwaukee and Chicago school districts, we decided against this
step. An additional problem needed to be overcome: the data from Milwaukee showed an
average compensation level of more than $70,000, a figure that was $20,000 more than
the average in any of our other districts (the large difference was probably due to the way
Milwaukee calculated the value of it fringe benefits – as 62% of salary – a figure that
seemed high). In order to express our compensation figures on a common scale, we chose
to express salary and compensation as a percentage of the district average. By so doing,
we sought to adjust for both the differences in the costs of living and differences in the
way that benefits were created. Our relative compensation figures were expressed as
percentages with values such as 10% or 110% of the district average. Since the variable
expressed the compensation figure as a percentage of the district’s mean compensation,
the partial effect is interpreted as the change in the probability of turnover given a one-
percentage point change in relative compensation (see Table R-6).
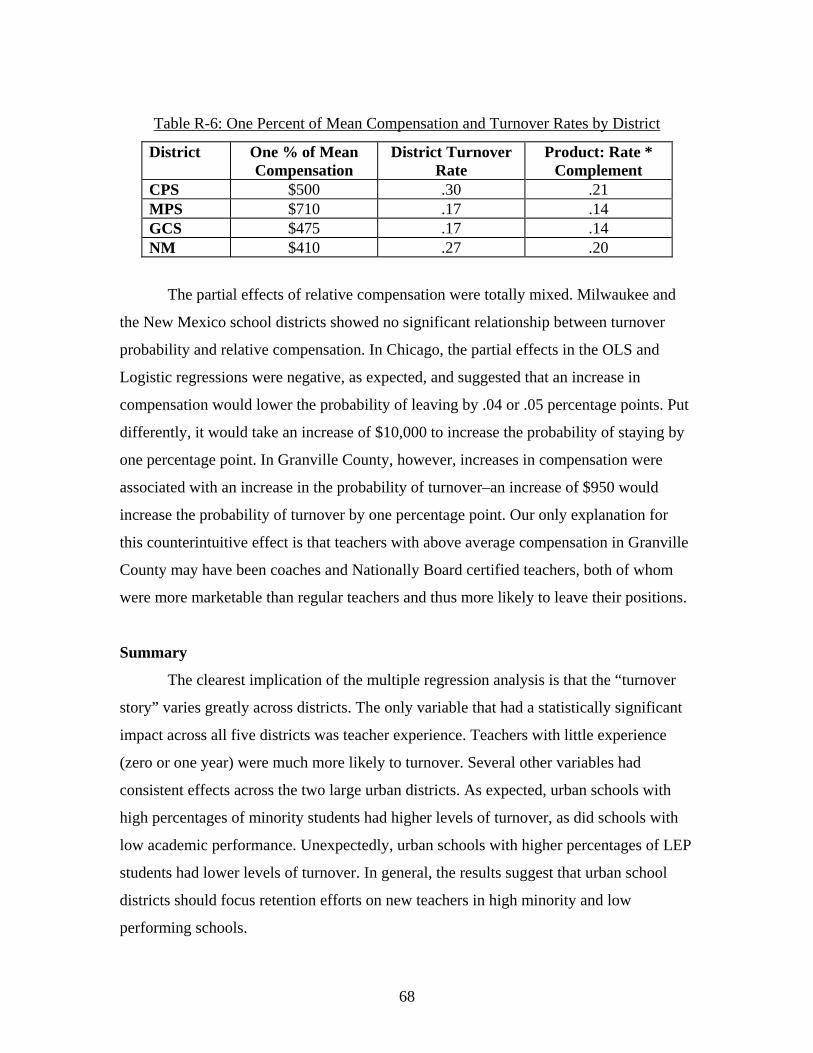
68
Table R-6: One Percent of Mean Compensation and Turnover Rates by District
District One % of Mean Compensation
District Turnover Rate
Product: Rate * Complement
CPS $500 .30 .21 MPS $710 .17 .14 GCS $475 .17 .14 NM $410 .27 .20
The partial effects of relative compensation were totally mixed. Milwaukee and
the New Mexico school districts showed no significant relationship between turnover
probability and relative compensation. In Chicago, the partial effects in the OLS and
Logistic regressions were negative, as expected, and suggested that an increase in
compensation would lower the probability of leaving by .04 or .05 percentage points. Put
differently, it would take an increase of $10,000 to increase the probability of staying by
one percentage point. In Granville County, however, increases in compensation were
associated with an increase in the probability of turnover–an increase of $950 would
increase the probability of turnover by one percentage point. Our only explanation for
this counterintuitive effect is that teachers with above average compensation in Granville
County may have been coaches and Nationally Board certified teachers, both of whom
were more marketable than regular teachers and thus more likely to leave their positions.
Summary
The clearest implication of the multiple regression analysis is that the “turnover
story” varies greatly across districts. The only variable that had a statistically significant
impact across all five districts was teacher experience. Teachers with little experience
(zero or one year) were much more likely to turnover. Several other variables had
consistent effects across the two large urban districts. As expected, urban schools with
high percentages of minority students had higher levels of turnover, as did schools with
low academic performance. Unexpectedly, urban schools with higher percentages of LEP
students had lower levels of turnover. In general, the results suggest that urban school
districts should focus retention efforts on new teachers in high minority and low
performing schools.

69
The variation of the results across districts points to the need for districts to track
and analyze teacher turnover and important teacher and school variables. While the
turnover of science and special education teachers may be a problem nationally, science
and special education teachers did not leave the five study districts at a higher rate than
elementary school teachers. Granville County is an example of a district that can use
analyses of local data to target interventions. The data indicate that teacher experience
was a major factor in teacher turnover and that teaching field was not a factor at all. GCS
should focus retention efforts on teachers in their first year, regardless of teaching field.
Basing interventions on national data may lead a district to attack a problem it does not
have or to ignore a local factor that is key to retaining teachers.
Costs
Districts were asked to measure costs at the district and the school level that could
then be tied to the teacher turnover data. At both the district and school level, districts
attempted to collect costs in eight categories:
• Recruitment
• Hiring
• Administrative Processing
• Training for First-Time Teachers (Induction)
• Training for New Hires (Orientation)
• Training for All Teachers (Professional Development)
• Learning Curve
• Transfer
These categories were designed for two reasons: to help districts identify costs
tied to turnover and to assist with the allocation of costs. For example, all new teachers in
a school participated in orientation activities. However, only first-time teachers
participated in induction activities. Therefore, training costs for first-time teachers
(induction) were allocated based on the number of leavers in a district. Training costs for
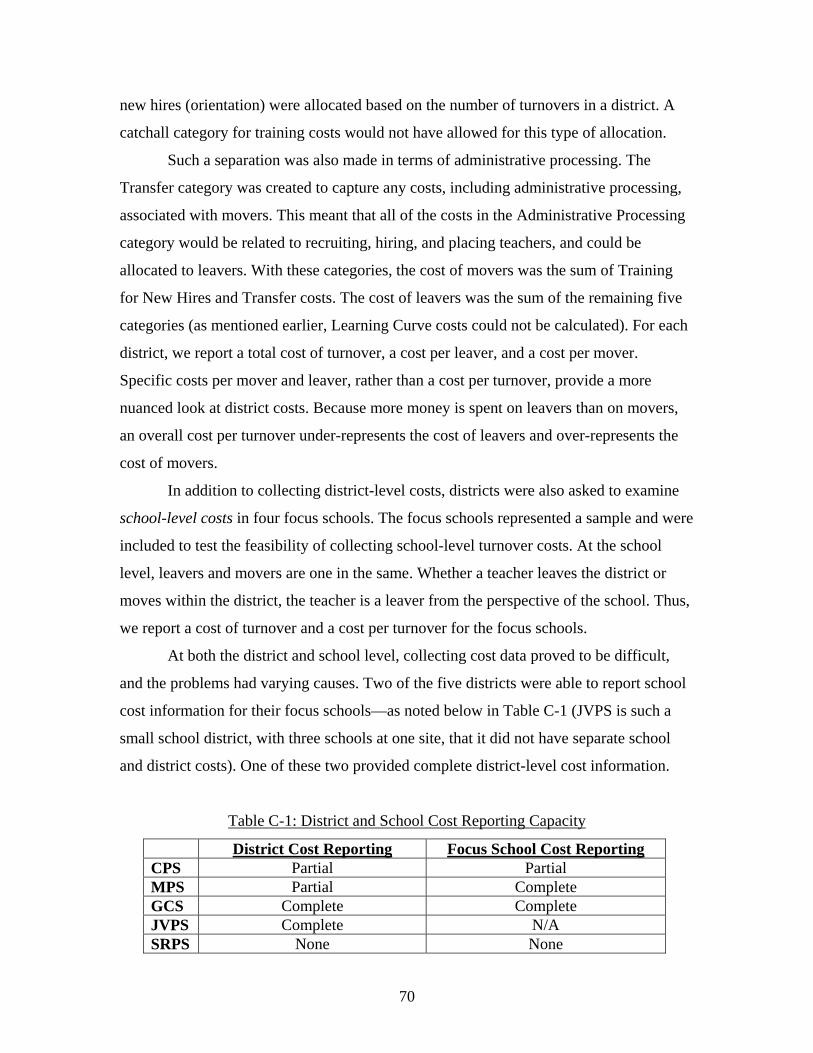
70
new hires (orientation) were allocated based on the number of turnovers in a district. A
catchall category for training costs would not have allowed for this type of allocation.
Such a separation was also made in terms of administrative processing. The
Transfer category was created to capture any costs, including administrative processing,
associated with movers. This meant that all of the costs in the Administrative Processing
category would be related to recruiting, hiring, and placing teachers, and could be
allocated to leavers. With these categories, the cost of movers was the sum of Training
for New Hires and Transfer costs. The cost of leavers was the sum of the remaining five
categories (as mentioned earlier, Learning Curve costs could not be calculated). For each
district, we report a total cost of turnover, a cost per leaver, and a cost per mover.
Specific costs per mover and leaver, rather than a cost per turnover, provide a more
nuanced look at district costs. Because more money is spent on leavers than on movers,
an overall cost per turnover under-represents the cost of leavers and over-represents the
cost of movers.
In addition to collecting district-level costs, districts were also asked to examine
school-level costs in four focus schools. The focus schools represented a sample and were
included to test the feasibility of collecting school-level turnover costs. At the school
level, leavers and movers are one in the same. Whether a teacher leaves the district or
moves within the district, the teacher is a leaver from the perspective of the school. Thus,
we report a cost of turnover and a cost per turnover for the focus schools.
At both the district and school level, collecting cost data proved to be difficult,
and the problems had varying causes. Two of the five districts were able to report school
cost information for their focus schools—as noted below in Table C-1 (JVPS is such a
small school district, with three schools at one site, that it did not have separate school
and district costs). One of these two provided complete district-level cost information.
Table C-1: District and School Cost Reporting Capacity
District Cost Reporting Focus School Cost Reporting CPS Partial Partial MPS Partial Complete GCS Complete Complete JVPS Complete N/A SRPS None None
71
Before examining the reported costs in relation to turnover, it is important to
provide a clear sense of what each district was and was not able to report. We describe
the status of cost data collection by district to make it clear to readers the data upon
which our cost calculations and analyses were based. In addition, since the study is a
feasibility pilot, we use this section to illustrate how district cost reporting either limits or
augments the ability to paint a complete picture of teacher turnover costs.
As expected, the rural school districts had to collect the information by hand at
the district and the school level. This process included surveys of district staff and school
principals. By way of contrast, it was thought that the large databases in the urban
districts would facilitate collection of cost information. Unfortunately, costs in the urban
school districts were not documented in any systematic way. Unlike the rural districts, in
which the small numbers of schools made it possible to hand collect data, the urban
districts struggled to determine actual costs of teacher turnover. The costs were often
spread across up to 50 different departments within the district. And instead of
quantifying the time cost of a few employees, as in the rural districts, the urban districts
were faced with the task of quantifying the time costs of hundreds of employees. Such
accounting is possible but would require a concerted effort by district leaders to track
costs and improved data systems.
District data systems lacked the ability to produce all the information needed to
calculate the cost of teacher turnover. Existing district financial management systems
could not generate the requested cost information. In the large urban districts, the
existence of data silos was a substantial obstacle. These systems were designed to collect
data for specific purposes, such as payroll, retirement, and school and classroom
assignments.28 These different purposes often distorted the data, and the silos were often
incompatible.
28 For example, districts maintain information on teacher years of experience for payroll purposes. In MPS, teachers achieve the highest level of pay at 16 years of experience. Therefore, the data system stops counting years of experience at this point: no teacher in this system is on record as having more than 16 years of experience. This variance between stored data and actual teacher experience impacts any research on the turnover of veteran teachers, and it complicates any attempt to calculate the average experience of teachers in a school.
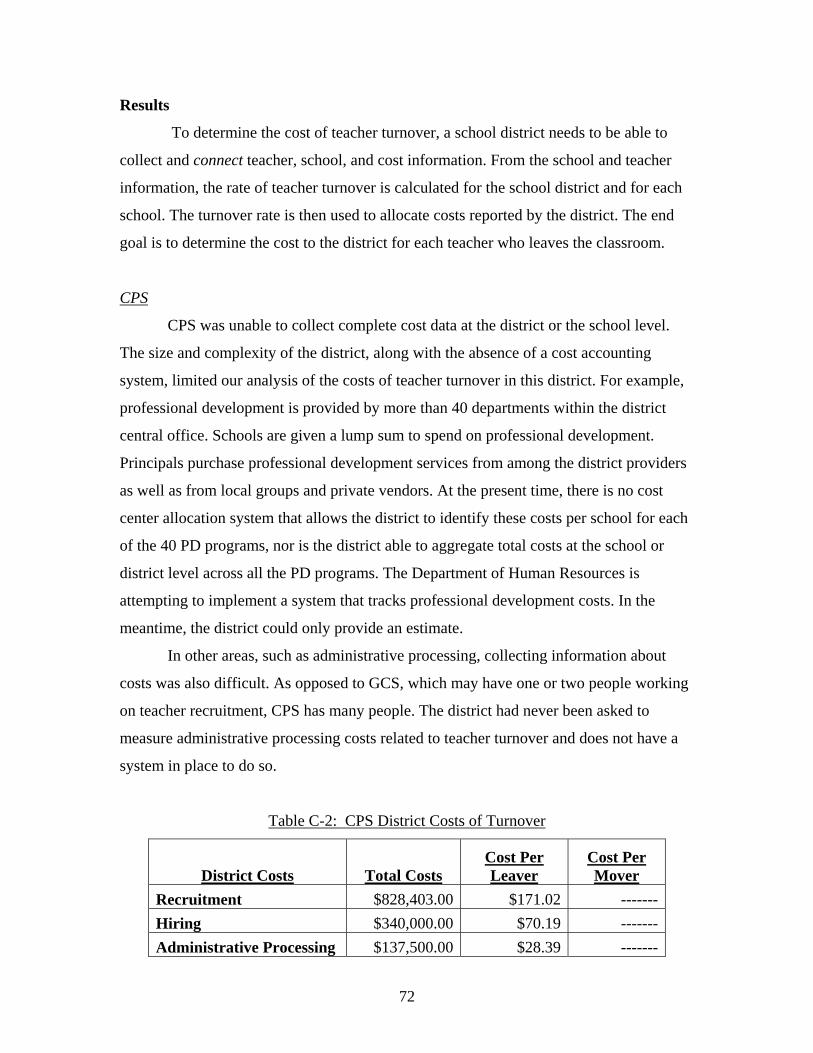
72
Results
To determine the cost of teacher turnover, a school district needs to be able to
collect and connect teacher, school, and cost information. From the school and teacher
information, the rate of teacher turnover is calculated for the school district and for each
school. The turnover rate is then used to allocate costs reported by the district. The end
goal is to determine the cost to the district for each teacher who leaves the classroom.
CPS
CPS was unable to collect complete cost data at the district or the school level.
The size and complexity of the district, along with the absence of a cost accounting
system, limited our analysis of the costs of teacher turnover in this district. For example,
professional development is provided by more than 40 departments within the district
central office. Schools are given a lump sum to spend on professional development.
Principals purchase professional development services from among the district providers
as well as from local groups and private vendors. At the present time, there is no cost
center allocation system that allows the district to identify these costs per school for each
of the 40 PD programs, nor is the district able to aggregate total costs at the school or
district level across all the PD programs. The Department of Human Resources is
attempting to implement a system that tracks professional development costs. In the
meantime, the district could only provide an estimate.
In other areas, such as administrative processing, collecting information about
costs was also difficult. As opposed to GCS, which may have one or two people working
on teacher recruitment, CPS has many people. The district had never been asked to
measure administrative processing costs related to teacher turnover and does not have a
system in place to do so.
Table C-2: CPS District Costs of Turnover
District Costs Total Costs Cost Per Leaver
Cost Per Mover
Recruitment $828,403.00 $171.02 -------Hiring $340,000.00 $70.19 -------Administrative Processing $137,500.00 $28.39 -------
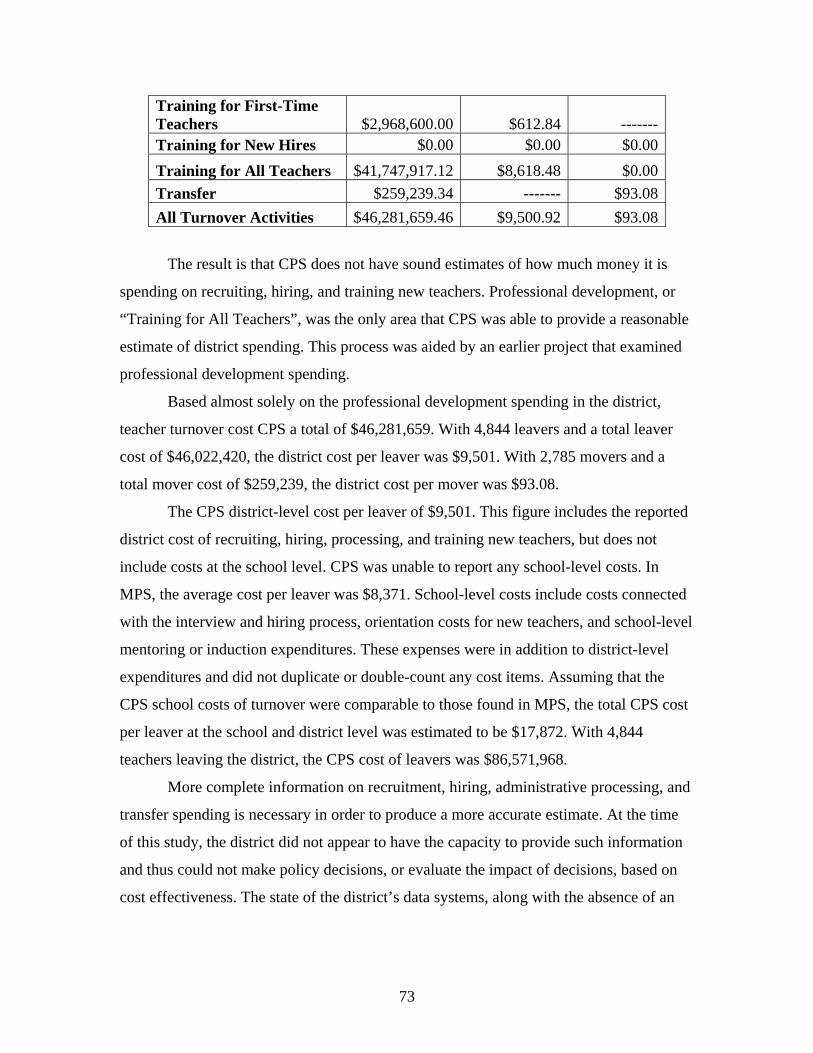
73
Training for First-Time Teachers $2,968,600.00 $612.84 -------Training for New Hires $0.00 $0.00 $0.00Training for All Teachers $41,747,917.12 $8,618.48 $0.00Transfer $259,239.34 ------- $93.08All Turnover Activities $46,281,659.46 $9,500.92 $93.08
The result is that CPS does not have sound estimates of how much money it is
spending on recruiting, hiring, and training new teachers. Professional development, or
“Training for All Teachers”, was the only area that CPS was able to provide a reasonable
estimate of district spending. This process was aided by an earlier project that examined
professional development spending.
Based almost solely on the professional development spending in the district,
teacher turnover cost CPS a total of $46,281,659. With 4,844 leavers and a total leaver
cost of $46,022,420, the district cost per leaver was $9,501. With 2,785 movers and a
total mover cost of $259,239, the district cost per mover was $93.08.
The CPS district-level cost per leaver of $9,501. This figure includes the reported
district cost of recruiting, hiring, processing, and training new teachers, but does not
include costs at the school level. CPS was unable to report any school-level costs. In
MPS, the average cost per leaver was $8,371. School-level costs include costs connected
with the interview and hiring process, orientation costs for new teachers, and school-level
mentoring or induction expenditures. These expenses were in addition to district-level
expenditures and did not duplicate or double-count any cost items. Assuming that the
CPS school costs of turnover were comparable to those found in MPS, the total CPS cost
per leaver at the school and district level was estimated to be $17,872. With 4,844
teachers leaving the district, the CPS cost of leavers was $86,571,968.
More complete information on recruitment, hiring, administrative processing, and
transfer spending is necessary in order to produce a more accurate estimate. At the time
of this study, the district did not appear to have the capacity to provide such information
and thus could not make policy decisions, or evaluate the impact of decisions, based on
cost effectiveness. The state of the district’s data systems, along with the absence of an
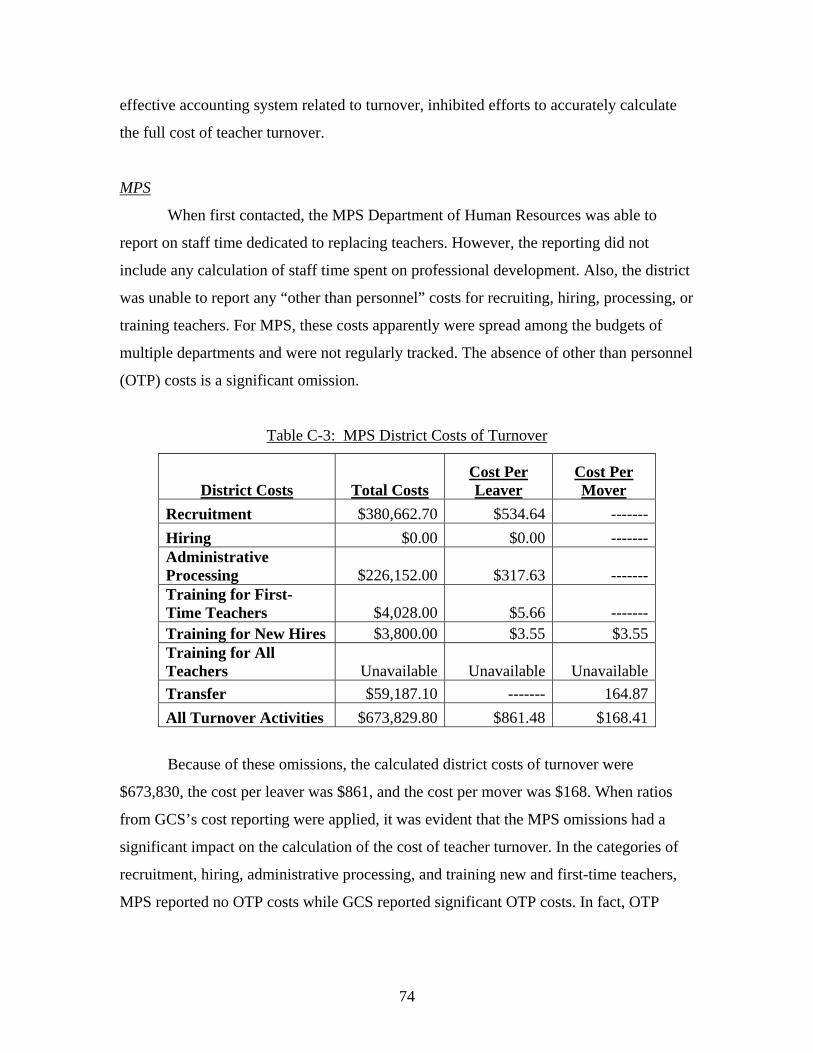
74
effective accounting system related to turnover, inhibited efforts to accurately calculate
the full cost of teacher turnover.
MPS
When first contacted, the MPS Department of Human Resources was able to
report on staff time dedicated to replacing teachers. However, the reporting did not
include any calculation of staff time spent on professional development. Also, the district
was unable to report any “other than personnel” costs for recruiting, hiring, processing, or
training teachers. For MPS, these costs apparently were spread among the budgets of
multiple departments and were not regularly tracked. The absence of other than personnel
(OTP) costs is a significant omission.
Table C-3: MPS District Costs of Turnover
District Costs Total Costs Cost Per Leaver
Cost Per Mover
Recruitment $380,662.70 $534.64 ------- Hiring $0.00 $0.00 ------- Administrative Processing $226,152.00 $317.63 ------- Training for First-Time Teachers $4,028.00 $5.66 ------- Training for New Hires $3,800.00 $3.55 $3.55 Training for All Teachers Unavailable Unavailable Unavailable Transfer $59,187.10 ------- 164.87 All Turnover Activities $673,829.80 $861.48 $168.41
Because of these omissions, the calculated district costs of turnover were
$673,830, the cost per leaver was $861, and the cost per mover was $168. When ratios
from GCS’s cost reporting were applied, it was evident that the MPS omissions had a
significant impact on the calculation of the cost of teacher turnover. In the categories of
recruitment, hiring, administrative processing, and training new and first-time teachers,
MPS reported no OTP costs while GCS reported significant OTP costs. In fact, OTP
75
costs accounted for more than 75% of GCS total turnover costs in these categories. The
costs included such expenditures as:
• Advertising;
• Reference checks;
• Testing reimbursement; and
• Recruiting trip costs such as airfare, rental cars, and registration fees.
Using MPS personnel costs and ratios from GCS cost reporting, the MPS cost per leaver
more than tripled. When the absence of OTP costs was combined with the absence of any
costs for hiring or professional development, it is clear that the cost per leaver in MPS is
significantly higher than $861.
Participating districts, especially MPS and CPS, found it difficult to divide
turnover costs into the seven cost categories. In a district like MPS, one person was in
charge of recruiting, hiring, and training speech and school psychologists; breaking this
salary into distinct cost categories proved challenging. In addition, grants received by the
district often stretched across several of the cost categories. In an attempt to ascertain a
more accurate MPS cost of teacher turnover, we requested a line item breakdown of
spending on turnover-related activities. The district reported spending $2,274,754 on
recruiting, hiring, and supporting new teachers. The district reported spending
$23,080,000 on teacher training.29 Based on these costs and the number of teacher
leavers, the MPS cost per leaver equals $6,954.
In addition to the district costs, schools expend resources in order to replace
departing teachers. Through a partnership with the Wisconsin Center for Education
Research (WCER), eight MPS schools reported costs related to teacher turnover.
Anthony Milanowski of WCER conducted surveys of eight MPS principals (2 high
schools, 2 middle schools, and 4 elementary of K-8 schools). The principals were asked
to estimate the number of hours involved in replacing teachers. These hours were then
29 Discussions with Rob Baxter, MPS Department of Human Resources, April-May 2007.
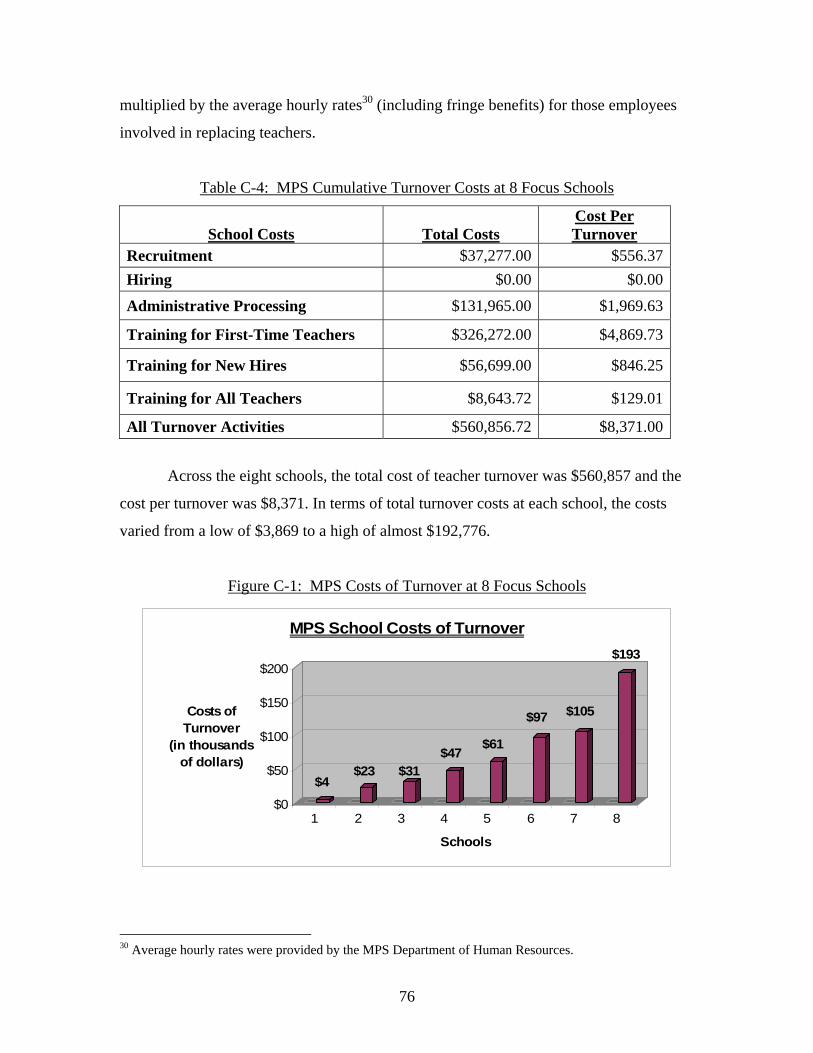
76
multiplied by the average hourly rates30 (including fringe benefits) for those employees
involved in replacing teachers.
Table C-4: MPS Cumulative Turnover Costs at 8 Focus Schools
School Costs Total Costs Cost Per Turnover
Recruitment $37,277.00 $556.37 Hiring $0.00 $0.00
Administrative Processing $131,965.00 $1,969.63
Training for First-Time Teachers $326,272.00 $4,869.73
Training for New Hires $56,699.00 $846.25
Training for All Teachers $8,643.72 $129.01
All Turnover Activities $560,856.72 $8,371.00
Across the eight schools, the total cost of teacher turnover was $560,857 and the
cost per turnover was $8,371. In terms of total turnover costs at each school, the costs
varied from a low of $3,869 to a high of almost $192,776.
Figure C-1: MPS Costs of Turnover at 8 Focus Schools
$4$23 $31
$47$61
$97 $105
$193
$0
$50
$100
$150
$200
Costs of Turnover
(in thousands of dollars)
1 2 3 4 5 6 7 8
Schools
MPS School Costs of Turnover
30 Average hourly rates were provided by the MPS Department of Human Resources.
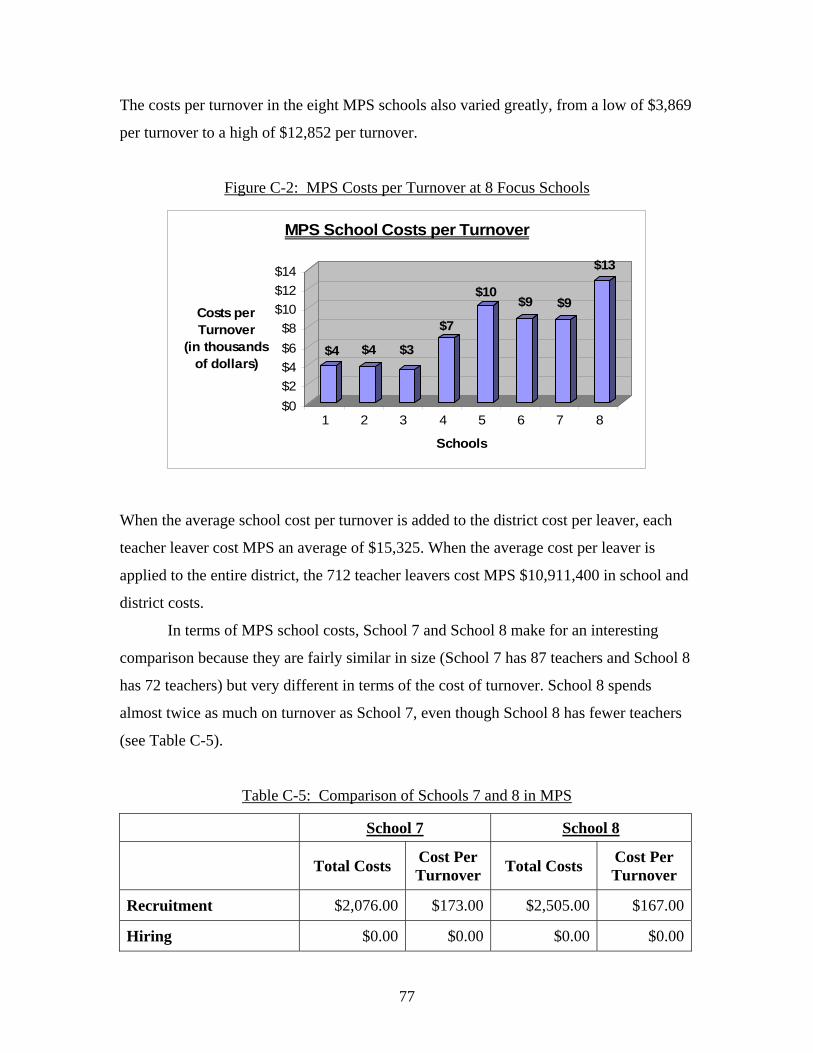
77
The costs per turnover in the eight MPS schools also varied greatly, from a low of $3,869
per turnover to a high of $12,852 per turnover.
Figure C-2: MPS Costs per Turnover at 8 Focus Schools
$4 $4 $3
$7
$10$9 $9
$13
$0$2$4$6$8
$10$12$14
Costs per Turnover
(in thousands of dollars)
1 2 3 4 5 6 7 8
Schools
MPS School Costs per Turnover
When the average school cost per turnover is added to the district cost per leaver, each
teacher leaver cost MPS an average of $15,325. When the average cost per leaver is
applied to the entire district, the 712 teacher leavers cost MPS $10,911,400 in school and
district costs.
In terms of MPS school costs, School 7 and School 8 make for an interesting
comparison because they are fairly similar in size (School 7 has 87 teachers and School 8
has 72 teachers) but very different in terms of the cost of turnover. School 8 spends
almost twice as much on turnover as School 7, even though School 8 has fewer teachers
(see Table C-5).
Table C-5: Comparison of Schools 7 and 8 in MPS
School 7 School 8
Total Costs Cost Per Turnover Total Costs Cost Per
Turnover
Recruitment $2,076.00 $173.00 $2,505.00 $167.00
Hiring $0.00 $0.00 $0.00 $0.00
78
Administrative Processing $7,464.00 $622.00 $25,305.00 $1,687.00
Training for First-Time Teachers $76,812.00 $6,401.00 $163,725.00 $10,915.00
Training for New Hires $18,720.00 $1,560.00 $0.00 $0.00
Training for All Teachers $185.40 $15.45 $1,240.65 $82.71
All Turnover Activities $105,257.40 $8,771.45 $192,775.65 $12,851.71
Total Teachers 86 72
Total Turnover 12 15
Turnover Rate 14% 21%
Why does teacher turnover carry a higher cost for School 8? The first reason is that
School 8 has higher turnover. School 8 lost 21% of its teachers between 2002-03 and
2003-04. If School 8 reduced teacher turnover to equal the rate at School 7 (14%), School
8 would spend about $64,000 less on teacher turnover, cutting its losses by one third.
The relatively large investments in training for first-time teachers and
administrative processing also contributed to School 8’s high cost of teacher turnover. It
is possible that School 8 is administratively inefficient or that the school operates a
relatively expensive and ineffective mentoring program. Accurate annual turnover and
cost data allows School 8 to compare its costs and turnover with the costs and turnover of
other MPS schools.
GCS
GCS was able to report costs for the district and for four focus schools. Of all the
districts, GCS took the closest look at actual time and money spent to recruit, hire, and
train new teachers. In the district office, employees estimated the amount of time spent on
turnover-related activities. GCS also analyzed the amount of money spent on OTP costs
such as background checks and assistance with day care expenses. At the school level,
GCS asked four schools to estimate the time and money that each dedicated to turnover-
related activities. In all of this work, the district personnel were guided by the data
collection protocol developed collaboratively by NCTAF and the five districts.
79
GCS spent a total of $502,959 on teacher turnover. This cost includes recruiting,
hiring, and training replacements for teachers who left the district between 2002-03 and
2003-04 (Figure C-8 summarizes the GCS cost information).
Table C-6: GCS Costs of Turnover
District Costs Total Costs Cost Per Leaver
Cost Per Mover
Recruitment $124,465.79 $1,575.52 ------- Hiring $170,444.34 $2,157.52 ------- Administrative Processing $53,976.90 $683.25 ------- Training for First-Time Teachers $16,843.47 $213.21 ------- Training for New Hires $96,147.34 $1,092.58 $1,092.58 Training for All Teachers $40,381.63 $511.16 ------- Transfer $700.00 ------- $77.78 All Turnover Activities $502,959.17 $6,233.24 $1,170.36
With 79 leavers and a total leaver cost of $492,426, the district cost per leaver
was $6,233. The 9 movers and total mover costs of $10,533 resulted in a cost per mover
of $1,170. These costs do not include state costs or school-level costs. As Figure C-8
shows, most of the cost of turnover was due to teachers leaving the district, rather than
teachers moving from one school to another within the district. The brunt of the costs of
movers appears to be incurred at the school level, where a mover must be oriented to
his/her new position and a new file must be established.
Figure C-3: Focus School Costs of Turnover in GCS
80
$13
$29
$44 $45
$0
$10
$20
$30
$40
$50
Costs of Turnover
(in thousands of dollars)
1 2 3 4
Schools
Costs of Turnover at GCS Focus Schools
Figure C-4: Focus School Cost per Turnover in GCS
$2
$6
$4 $3
$0$1$2$3
$4$5$6
Costs per Turnover
(in thousands of dollars)
1 2 3 4
Schools
Cost per Turnover at GCS Focus Schools
School-level turnover costs in the four GCS focus schools ranged from $13,108 to
$44,558 (Figure C-3). Interestingly, School 2 had a significantly higher per turnover cost,
but a significantly lower total cost of turnover, than School 4. This is due to the fact that
School 2’s turnover rate was 13%, while the turnover rate at Schools 4 was 22%. School
2 spent twice as much per teacher as School 4 on training new hires, which may explain
why fewer teachers left School 2 (see Table C-7).
Table C-7: Costs per Turnover at Schools 2 and 4
81
School 2 School 4 Recruitment $628.50 $553.92 Hiring $0.00 $0.00 Administrative Processing $0.00 $0.00
Training for First-Time Teachers $359.22 $264.48 Training for New Hires $4,572.57 $2,346.89
Training for All Teachers $325.54 $262.24 All Turnover Activities $5,885.82 $3,427.53 Teachers 40 59
Turnovers 5 13 Turnover Rate 12.5% 22.0%
On average, the cost per leaver across the four GCS schools was $3,642. If this
school cost average is applied across all of the schools in the district and combined with
the district-level cost per leaver, the cost per leaver (at the district and school level)
equals $9,875 (district cost = $6,233; school cost = $3,642). The total cost of leavers at
the district and school level equals $780,125.
JVPS
JVPS was able to report costs for the entire district. This information, like most of
the teacher and school data, was collected by hand as opposed to being recovered from a
database. The small size of the district, in particular the fact that all three schools and the
district office are located at the same site, lent simplicity to the task of tracking
recruitment, administrative processing, training, and transfer costs.
Using the cost information provided by JVPS, the total turnover cost to the district
was $71,124. With 16 leavers and a total leaver cost of $69,853, the district cost per
leaver was $4,366. With 2 Movers and a total Mover cost of $1,271, the district cost per
mover was $635 (Table C-7).
Table C-7: JVPS District Turnover Costs
District Costs Total Costs Cost Per Leaver
Cost Per Mover
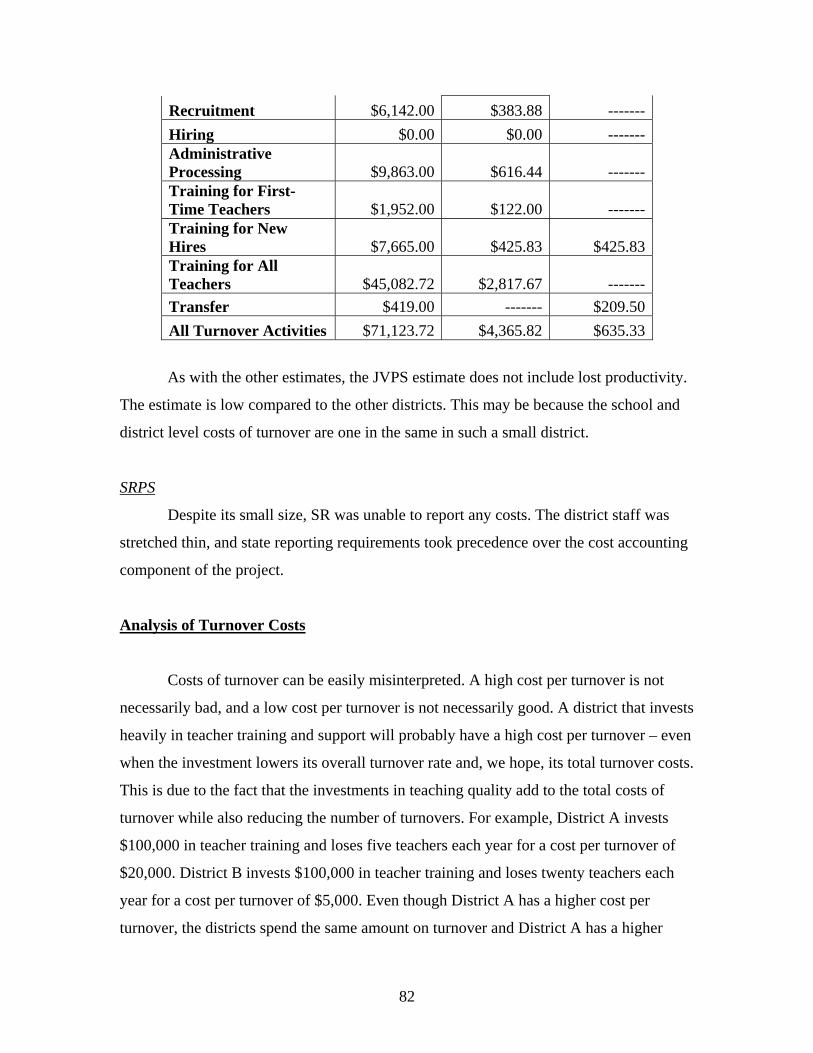
82
Recruitment $6,142.00 $383.88 ------- Hiring $0.00 $0.00 ------- Administrative Processing $9,863.00 $616.44 ------- Training for First-Time Teachers $1,952.00 $122.00 ------- Training for New Hires $7,665.00 $425.83 $425.83 Training for All Teachers $45,082.72 $2,817.67 ------- Transfer $419.00 ------- $209.50 All Turnover Activities $71,123.72 $4,365.82 $635.33
As with the other estimates, the JVPS estimate does not include lost productivity.
The estimate is low compared to the other districts. This may be because the school and
district level costs of turnover are one in the same in such a small district.
SRPS
Despite its small size, SR was unable to report any costs. The district staff was
stretched thin, and state reporting requirements took precedence over the cost accounting
component of the project.
Analysis of Turnover Costs
Costs of turnover can be easily misinterpreted. A high cost per turnover is not
necessarily bad, and a low cost per turnover is not necessarily good. A district that invests
heavily in teacher training and support will probably have a high cost per turnover – even
when the investment lowers its overall turnover rate and, we hope, its total turnover costs.
This is due to the fact that the investments in teaching quality add to the total costs of
turnover while also reducing the number of turnovers. For example, District A invests
$100,000 in teacher training and loses five teachers each year for a cost per turnover of
$20,000. District B invests $100,000 in teacher training and loses twenty teachers each
year for a cost per turnover of $5,000. Even though District A has a higher cost per
turnover, the districts spend the same amount on turnover and District A has a higher
83
retention rate. The cost per turnover can not simply be compared from district to district
without taking a closer look at the data behind the costs.
In addition to being misinterpreted, there are a number of complications with the
calculation of turnover costs. We acknowledge and address some of these complications
here.
Retirement
The cost of teacher turnover due to retirement is viewed as an expected cost.
Every school system has teachers that decide to retire, and this is not seen as a decision
that can be influenced by policy. To a certain extent, this is true. However, teachers often
decide to teach beyond retirement age. Others decide to retire early. Such decisions are
influenced by working conditions, which are amenable to policy. This study does not
differentiate between costs of teacher turnover based on teachers’ reasons for leaving.
This would be an area ripe for qualitative study.
Fixed Costs
Fixed costs are expenses whose total does not change in proportion to the activity
of a business. For example, a school district must pay rent and utility bills irrespective of
the amount of teacher turnover. By examining specific programs and activities in the
various cost categories, we have attempted to focus on costs that are not fixed, but are
likely to vary according to numbers of teachers who must be recruited, trained, or placed.
Many costs only seem fixed because human resource departments are not agile enough to
adjust spending based on decreases in teacher turnover. For instance, a school district
with 2,000 teacher leavers might need 10 full-time recruiters to fill the open positions. If
the district was able to decrease the number of leavers to 1,000, the district could
theoretically fill the open positions with five recruiters. Such an adjustment in personnel,
and the subsequent cost savings, relies on certain flexibility in the district.
Teacher Salary Differential
The difference in salary between a departing teacher and the replacement teacher
was not included in our analysis. Milanowski and his colleagues did take these
84
differentials into account in their study of Milwaukee teacher turnover.31 They also made
estimates of the “learning curve loss” resulting from turnover, finding that these
estimated costs, when combined with the cost elements in our study, outweighed any
savings from teacher salary differentials.
The potential savings from the salary differential between a veteran departing
teacher and a beginning replacement teacher are substantial. However, the nature of the
data provided by participating school districts did not allow us to calculate the difference
between the salaries of departing and replacement teachers. It appears that the savings
from salary differential may be limited for two reasons:
• Beginning teachers leave before they reach the higher salary levels that would
create a salary differential large enough to offset the other costs of loss and
replacement. The higher turnover rates of relatively new and inexperienced
teachers suggest that in high turnover districts and schools, there often is a narrow
gap between compensation for leavers and their replacements.
• Veteran teachers are not always replaced by beginning teachers. Replacement
teachers could be as high on the salary scale as the departing teachers. District
transfer policies, generally governed by seniority, muddy the waters when it
comes to generalizing about the salary savings implications of turnover.
In addition, salary differential in the five study districts only impacts the district’s bottom
line.32 Because of salary averaging, individual schools do not save money by limiting
teacher salaries.
Teacher Productivity
Unfortunately, no measure of teacher productivity was available in the five
districts. The data systems did not connect teachers with their students, which would have
31 Milanowski, A. and Odden, A. (2007), pp. 10-11. 32 Roza, M., and Hill, P. (2004). How within district spending inequities help some schools to fail. In Dianne Ravitch (Ed.), Brookings Papers on Education Policy: 2004. Washington, DC: Brookings Institution Press.
85
allowed a comparison of the value added by departing and replacement teachers. A recent
cost-benefit study of an induction program found that the estimated cost savings from
increased teacher productivity far outweighed the cost savings from reduced teacher
turnover.33 Increased teacher productivity resulted in 47 percent of the total cost savings
associated with the induction program, while reduced teacher turnover only accounted for
17 percent of the cost savings. This finding suggests that teacher productivity is a
substantial factor in calculations of the cost of turnover.
Productive Turnover
Some teacher turnover is beneficial. Schools that are able to replace a poor
teacher with an effective teacher will increase teacher productivity. Schools also want to
avoid becoming stagnant environments immune to fresh ideas and approaches. Most
businesses aim to maintain a healthy level of turnover. High performing schools in the
five districts appear to have achieved a relatively healthy level of teacher turnover. In the
low performing, high poverty, and high minority schools, replacing large portions of the
teacher workforce each year appears to be both a symptom and one of the many causes of
poor working conditions. Only when teacher and student data are linked can the relative
cost-benefit calculus of particular incidents of teacher turnover be evaluated.
Cost Implications
In the district that reported the most robust cost figures (GCS), the district cost per
leaver amounted to:
• $6,233 (district costs only)
• $3,642 (school costs only)
• $9,875 (district and school costs)
33 Villar, A. and Strong, M. (2007). Is Mentoring Worth the Money? A Benefit-Cost Analysis and Five-year Rate of Return of a Comprehensive Mentoring Program for Beginning Teachers, p. 35.
86
The district cost and the district plus school cost are within the range of Shockley et al.’s
findings in two Florida districts (one district spent $4,000 per turnover and the other
district spent $12,000 per turnover). The district plus school cost per leaver is similar to
the oft-cited Department of Labor estimate.34 The Department of Labor estimates that
attrition costs an employer 30% of the leaving employee’s salary (30% of the average
GCS salary was $10,740 in 2002-03). It is important to remember that our cost estimates
leave out several important factors such as costs at the state and federal level; the costs of
multiple turnovers of a teaching position in one year; and the costs of lost productivity.
Despite these omissions, the district cost estimates provide education leaders with
a starting point for examining investments in teacher retention. GCS lost 79 of its 533
teachers (14.8%) between the 2002-03 and 2003-04 school years. Based on the cost
estimates, the cost of this turnover at the district and school levels was $780,125. In an
effort to increase retention, GCS might decide to invest $100,000 in an induction
program. Table C-13 below illustrates the scenarios that might result.
The hypothetical district investment in an induction program must be added to the
total cost of turnover, but may be offset by cost savings from an increase in retention.
Smith and Ingersoll (2004) demonstrate the effects of various forms of induction on new
teacher retention. The most well-developed induction program is associated with a 50%
decline in new teacher turnover, according to Smith and Ingersoll.35 With a $100,000
investment in induction and a 50% reduction in new teacher leavers, the total cost of
leavers would rise to $179,000 and the cost per turnover would rise to $22,375 (Table C-
8).
Table C-8: Investments in Retention and Costs of Turnover
Cost of New Teacher Leavers
(School and District)
New Teacher Leavers
Cost per Leaver (School and District)
Currently $158,000 16 $9,875
$100,000 investment; $179,000 8 $22,375
34 Alliance for Excellent Education (2005). Teacher Attrition: A Costly Loss to the Nation and to the States, p. 6. 35 Ingersoll, R. & Smith, T. (2004). What are the effects of induction and mentoring on beginning teacher turnover?, p. 705.
87
50% reduction in new teacher leavers
With a 50% reduction in new teacher leavers, the district would spend a total of
$21,000. In return, the district would have a $100,000 induction program, a more stable
workforce, and increased student learning (research shows that new teachers who
participate in an induction program are more effective than new teachers who do not).36
As this analysis illustrates, the benefits of calculating the costs of turnover extend
beyond determining costs and possible interventions. The annual calculation of turnover
and costs allows a school district to evaluate the impact of interventions. If an induction
program did not lessen turnover, the district could reinvest the money in bonuses for high
turnover fields and then measure the impact of the bonuses.
It is also important to keep in mind that our cost calculations are based upon one
year of data and would be more meaningful if based upon trend data. When using one
year of data, fluctuations in turnover and costs could lead to unsound investments.
However, the cost data indicate that a sound investment in teacher retention, in addition
to increasing workforce stability and giving teachers a chance to develop professionally,
can pay for itself through cost savings.
In the Chicago Public Schools, the cost per leaver at the school and district level
totaled $17,872. With 4,844 teachers leaving the district, the CPS costs of leavers was
$86,571,968. How could CPS invest in teacher retention, and what impact would this
investment have on the costs of turnover in the district? CPS could implement a high-
quality induction program for new teachers in the highest turnover schools; 119 schools
had teacher turnover equal to or greater than 40%. On average, these schools were forced
to replace more than half of their teachers, and this churn was just one of the challenges
they faced. The highest turnover schools had higher percentages of free and reduced
lunch and minority students, and lower school performance (Table C-8).
Table C-8: Highest Turnover CPS Schools vs. All CPS Schools
Teacher School FRL Minority
36 Villar, A. (2004). Measuring the Benefits and Costs of Mentor-Based Induction: A Value-Added Assessment of New Teacher Effectiveness Linked to Student Achievement, p. 36.
88
Turnover Rate
Performance (out of 200)
Students Student Population
Highest Turnover Schools 52% 64 88% 98% All CPS Schools 30% 82 84% 91%
In the fall of 2002, the 119 highest turnover schools hired 448 teachers with no
prior teaching experience. In the summer of 2003, 218 of these teachers left CPS at a cost
to the district of $3,896,096. In an attempt to increase retention of new teachers, CPS
could implement a high quality induction program in its 119 highest turnover schools.
The estimated cost per year of a high quality induction program is $6,000 per teacher per
year. The total cost of implementing a high quality induction program for the 448
teachers with no prior experience would be $2,688,000 in the first year. The most well-
developed induction program is associated with a 50% decline in new teacher turnover.37
If the CPS induction program cut new teacher turnover in half in the highest turnover
schools, the schools and the district would spend $4,636,048 on new teacher turnover in
the 119 schools, including the cost of the induction program. Implementing a
comprehensive induction program in these schools would only cost the district $750,000
more than it is currently spending on teacher turnover due to the increase in teacher
retention.
Lessons Learned Through our work with the five school districts, several things have become clear:
1. Turnover costs can be identified, aggregated, and analyzed, but current
school district data systems make this process a difficult one. Our experience is that
district commitment to collecting and reporting teacher turnover costs must start with an
acknowledgement that the yearly churn of teachers hurts a school district’s bottom line in
two ways: higher costs and lower student achievement. Such an acknowledgement is
needed to garner the commitment necessary to determine the costs of teacher turnover.
Currently, the costs are hidden in mounds of teacher, school, and costs data. Instead of 37 Ingersoll, R. & Smith, T. (2004), What are the effects of induction and mentoring on beginning teacher turnover?, p. 705.
89
acting as facilitators, data systems often stand as a formative obstacle to mining the data
for answers. Without new data systems that break down the silos of the old systems,
calculating the cost of teacher turnover will require the cooperation of district leaders
across departments. Moving forward in this regard is fundamentally a policy question,
not a technical one.
New data systems hold the promise of integrated and easily accessible data. Such
data could, with proper analysis, allow districts to allocate resources based on specific
costs and benefits. However, these systems will only be able to integrate the data that
districts collect. To manage teacher turnover and its costs, districts must ensure that key
data is collected, such as:
• Subject area(s) taught
• Licensure areas
• The school assignment of each teacher each year
• Teacher experience (overall and at the current school)
• The cost of recruiting, hiring, and placing a teacher
• The cost of orientation, mentoring, induction, and professional
development
• The cost of turnover at several focus schools
Combined with data on school characteristics, this data will enable districts to pinpoint
areas of high turnover and to implement and evaluate cost effective interventions.
2. When a teacher leaves a district, the costs of recruiting, hiring, and training
a replacement teacher are substantial. In GCS, the school and district costs per turnover
totaled over $9,000. In MPS, each turnover cost a school an average of over $8,000. In
CPS, each leaver cost the district over $8,000 in professional development resources
alone. Based on what the district did report in terms of professional development, and
accounting for the missing CPS data with costs reported by GCS, the CPS district-level
cost per leaver was $13,650. When school costs were added to the district-level costs, the
CPS cost of teacher turnover was estimated to be between $76 and $128 million per year.
90
Due to limitations of the study and the district data systems, these calculations do not take
into account what may be the largest cost of teacher turnover: lost productivity. Despite
this omission, it is clear that thousands of dollars walk out the door each time a teacher
leaves a district.
3. Teachers walk out of certain doors at higher rates. More teachers walk out of
the doors of schools that have high poverty, high minority, and/or low performing student
populations. These factors were correlated with high teacher turnover in both of the urban
school districts.
4. The correlation of these factors with high teacher turnover means that low
performing, high minority, and high poverty schools spend more money on teacher
turnover than high performing, low minority, and low poverty schools. For example,
low performing schools in MPS had twice the turnover rate as high performing schools.
With an average school cost per turnover of over $8,000, low performing schools are
spending much needed resources on replacing and retraining teachers. In two schools of
55 teachers each (the average school size in MPS), a low performing school would spend
$67,000 more than a high performing school. This difference in cost is substantial,
especially considering additional district costs and the impact of high turnover on student
achievement.
The data reported by the district allowed for the aforementioned key findings, and
the data collection process allowed districts to take a closer look at teacher turnover and
its costs. Participating districts took a close look at how many teachers were leaving,
which teachers were leaving, and from which schools they were leaving. GCS was
surprised to find that more than a third of new teachers left after one year. The district
had worked hard to recruit, hire, place, and support these new teachers, only to see a third
walk out the door and create new vacancies that needed to be filled. GCS also discovered
many hidden costs associated with teacher turnover. Prior to the data collection process,
the district equated the cost of teacher turnover with its recruitment budget. Upon closer
examination, the cost of social events for new hires, reference checks, and mentor
91
training were all driven by the churn of teacher turnover. Even the recruitment budget
failed to account for all of the recruitment-related costs associated with teacher turnover.
Recruitment fairs cost more than paying for a table and driving to the fair. These events
required planning time from administrators and substitutes to cover for the teachers that
attended the fairs. A closer, more nuanced look at both turnover and its costs provided
GCS with a deeper understanding of the scope and consequences of teacher turnover.
Recommendations
Based on our findings, we recommend that districts and states take the following actions:
1. Track teacher turnover and its costs annually
Prior to this project, none of the five participating school districts tracked teacher
turnover and its costs. The data collected by the districts allowed for analysis of which
teachers were leaving, from where teachers were leaving, and how much money was
walking out the door each time a teacher left. However, this data only provided a
snapshot of the teacher turnover and cost situation in each district. In order to make
informed decisions, districts and states need to analyze trends in the data over time. By
tracking teachers and costs year by year, school leaders and policymakers will be able to
determine where to invest in teacher retention, how much to invest, and the impact of
these investments.
2. Upgrade district data systems
Districts collect an overwhelming amount of data on teachers, schools, and students.
Unfortunately, most of this data is not used to inform decisions that impact student
learning. The data is underused for three reasons:
• Current data systems stand in the way of accurate and timely analysis.
• Districts do not collect the necessary data, and
• Districts and states do not invest enough resources into data-based
decision making.
92
Data-based decision-making has become an effective method for improving classroom
teaching; it will be as effective in improving district management of human resources. In
order to facilitate data-based decision-making at the district level, data systems must:
• Examine the relationship between teacher and school characteristics and teacher
turnover;
• Measure data over time in order to highlight trends;
• Take a comprehensive look at the data, rather than measuring a particular
program; and
• Allow for data sharing across districts.
Such data systems, along with training in how to collect and analyze data, will allow
education leaders to track and manage teacher turnover and its costs.
3. Invest in new teacher support and development
Induction programs that focus on improving instruction and teacher effectiveness have
been proven to increase retention and improve student achievement. In an analysis of
national data, Ingersoll and Smith (2004) found that a comprehensive induction program
cut the new teacher turnover rate in half. In a cost-benefit analysis of a high quality
induction program, Villar and Strong (2007) reported that the students of new teachers
who experienced strong induction “in general, achieve in patterns that mirror the
achievement rates of students assigned to more experienced mid-career teachers.”38 The
costs of such programs will at least be partially offset by increases in teacher retention
and subsequent decreases in the costs of turnover. It is very possible that a district could
save money by investing in an effective induction program.
4. Target retention strategies at high-need schools
38 Villar, A. and Strong, M. (2007). Is Mentoring Worth the Money? A Benefit-Cost Analysis and Five-year Rate of Return of a Comprehensive Mentoring Program for Beginning Teachers, p. 35.
93
Teachers leave high-need schools (high poverty, high minority, low performing) at
damaging rates. The constant churn of the teaching staff in these schools costs a lot of
money and hurts student learning. By directing retention strategies to high-need schools,
districts and states can give these schools an opportunity to build a rich learning
environment. Retention initiatives in these schools have the greatest potential for a high
return on investment, both in terms of money and school performance.
94
REFERENCES
Alliance for Excellent Education (2005). Teacher Attrition: A Costly Loss to the Nation and to the States. Retrieved from http://www.all4ed.org/publications/TeacherAttrition.pdf#search=%22alliance%20for%20excellent%20education%20cost%20of%20turnover%22 Association of Community Organizations for Reform Now [ACORN] (2004). Where Have All the Teachers Gone? The Costs of Teacher Turnover in ACORN Neighborhood Schools in Chicago. Retrieved from www.acorn.org/index.php?id=315. Breaux, A., and Wong, H. (2003). How to Train, Support and Retain New Teachers. Mountain View, CA: Harry Wong Publishing. Center for the Future of Teaching and Learning [CFTL] (2001). Teaching and California’s Future: The Status of the Teaching Profession, 2001. Retrieved from www.cftl.org. Falch, T. and Ronning, M. (2005). The Influence of Student Achievement on Teacher Turnover. CESifo Working Paper No. 1469. Retrieved from http://opus.zbw-kiel.de/volltexte/2005/3305/pdf/cesifo1_wp1469.pdf. Feng, L. (2005). Hire Today, Gone Tomorrow: The Determinants of Attrition among Public School Teachers, Ph.D. dissertation, Florida State University Tallahassee, FL. Grissmer, D., and Kirby, S. (1997). Teacher turnover and teacher quality. Teachers College Record, 99, 45-56. Hanushek, E., Kain, J., and Rivkin, S. (2004). Why Public Schools Lose Teachers. Journal of Human Resources 39(2), pp. 326-354. Hertert, L. (1995). Does equal funding for districts mean equal funding for classroom students? Evidence from California. In Lawrence O. Picus and James L. Wattenbarger (Eds.), Where Does the Money Go? Resource Allocation in Elementary and Secondary Schools. Thousand Oaks, CA: Corwin Press, pp. 71-84. Ingersoll, R. (2001). Teacher Turnover and Teacher Shortages: An Organizational Analysis. American Educational Research Journal, 38(3), 499-534. Ingersoll, R. (2003). Is There Really a Teacher Shortage? Seattle, WA: Center for the Study of Teaching and Policy. Retrieved from http://www.ctpweb.org.
95
Ingersoll, R. and Perda, D. (2006). What the data tell us about shortages of mathematics and science teachers, presented at the NCTAF Symposium on the Scope and Consequences of K12 Science and Mathematics Teacher Turnover. Retrieved January, 2007 from http://www.nctaf.org/documents/WhattheDataTellsUs_001.pdf. Ingersoll, R. and Smith, T. (2003). The Wrong Solution to the Teacher Shortage. Educational Leadership, 60(8), 30-33. Ingersoll, R. and Smith, T. (2004). What are the effects of induction and mentoring on beginning teacher turnover? American Educational Research Journal, Vol. 41, No. 3, pp. 681-714. Kane, T., Rockoff, J., and Staiger, D. (2006). What Does Certification Tell Us about Teacher Effectiveness?: Evidence from New York City. Cambridge, MA: National Bureau of Economic Research. Krieg, J. (2004). Teacher Quality and Attrition. Bellingham, WA: College of Business Economics. Retrieved from http://www.cbe.wwu.edu/Krieg/Econ.%20Documents/Teacher%20Quality%20Attrition%20EER%20Final.pdf. McCaffrey, D.F., Lockwood, J.R., Koretz, D.L., and Hamilton, L.S. (2003). Evaluating Value-Added Models for Teacher Accountability. Santa Monica, CA: RAND. Mendro, R., Jordan, H., Gomez, E., Anderson, M., and Bembry, K. (1998). An application of multiple linear regression in determining longitudinal teacher effectiveness. Paper presented at the 1998 Annual Meeting of the AERA, San Diego, CA. Milanowski, A. and Odden, A. (2007). A New Approach to the Cost of Teacher Turnover. Center on Reinventing Public Education, Working Paper 13. Retrieved April, 2007 from http://www.schoolfinanceredesign.org/pub/pdf/wp13_milanowskiodden.pdf. National Center for Education Statistics, Fast Facts (1999-2000). Retrieved January, 2007 from http://nces.ed.gov/fastfacts/display.asp?id=28. National Commission on Teaching and America’s Future [NCTAF]. (2003). No Dream Denied: A Pledge to America’s Children. Washington, DC: Author. Available online at www.nctaf.org. National Education Association (NEA), NEA and teacher recruitment: An overview. Retrieved January, 2007 from http://www.nea.org/student-program/about/overview.html. Rivkin, S. G., Hanushek, E. A., and Kain, J. F. (2005). Teachers, schools and academic achievement. Econometrica, 73(2), 417-458.
96
Rodriguez, J.V. (2000). Minority teacher shortage plagues region, nation. Southwest Education Development Laboratory, SEDLetter Volume XII Number 2. Retrieved January, 2007 from http://www.sedl.org/pubs/sedletter/v12n02/7.html. Roza, M., and Hill, P. (2004). How within district spending inequities help some schools to fail. In Dianne Ravitch (Ed.), Brookings Papers on Education Policy: 2004. Washington, DC: Brookings Institution Press. Sanders, W.L. and Rivers, J.C. (1996). Cumulative and residual effects of teachers on future student academic achievement. Knoxville, TN: University of Tennessee Value-Added Research Center. Scafidi, B., Sjoquist, D. and Stinebrickner, T. (2003). The Relationship between school characteristics and teacher mobility. Working paper. Shkolnik, J., Hikawa, H., Suttorp, M., Lockwood, J.R., Stecher, B., and Bohrnstedt, G. (2002). Appendix D: The Relationship between teacher characteristics and student achievement in reduced-size classes: A study of 6 California districts. In G. Bohrnstedt & B. Stecher (Eds.), What We Have Learned About Class Size Reduction in California: Technical Appendix. Sacramento, CA: California Department of Education, pp. D1–D22. Shockley, R., Guglielmino, P., and Watlington, E. (2006). The Costs of Teacher Attrition. Presented at the International Congress for School Effectiveness and Improvement, Fort Lauderdale, Florida. Retrieved from http://www.leadership.fau.edu/ICSEI2006/Papers/Shockley%20Guglielmino%20and%20Watlington.pdf. Southeast Center for Teaching Quality [SECTQ]. (2003). “The Teaching Quality Indicators Project: Better Data for Better Teaching Quality.” Retrieved from www.teachingquality.org. Texas Center for Educational Research [TCER]. (2000). The Cost of Teacher Turnover. Austin, TX: Texas State Board for Educator Certification. Villar, A. (2004). Measuring the Benefits and Costs of Mentor-Based Induction: A Value-Added Assessment of New Teacher Effectiveness Linked to Student Achievement. Paper presented at the 2004 Annual Meeting of the American Education Research Association. Wright, S.P., Horn, S.P., and Sanders, W.L. (1997). Teacher and classroom context effects on student achievement: Implications for teacher evaluation. Journal of Personnel Evaluation in Education, 11, 57–67.
97
Authors’ Acknowledgements
The authors wish to acknowledge Tom Carroll, NCTAF President, for his leadership and guiding vision; George Ann Rice for her dedication to, and leadership of, the Cost of Teacher Turnover study; former NCTAF staff member Kelly Green for her guidance of the study; and NCTAF Chief Operating Officer Karen Smith for her thoughtful reviews.
We also wish to thank school leaders in Chicago, Illinois; Milwaukee, Wisconsin; Granville, North Carolina; Jemez Valley, New Mexico; and Santa Rosa, New Mexico for their leadership, participation, and cooperation in this study.
Special thanks also go to those individuals who served on the Advisory Committee: Eric Hanushek, Karen Hawley-Miles, Richard Ingersoll, Lawrence Picus, Jennifer Rice, Marguerite Roza, and John Yinger.
This paper was written and produced through the support of the Joyce Foundation, the Spencer Foundation, and the Rockefeller Foundation. Opinions in this paper reflect those of the National Commission on Teaching and America’s Future and do not necessarily reflect those of the granting agencies.
The full text of this paper is available through NCTAF’s website: www.nctaf.org. The website also provides additional resources related to the cost of teacher turnover, including the Teacher Turnover Cost Calculator. Using the NCTAF Cost Calculator, educators and members of the public can estimate the dollars spent on teacher turnover for a specific school or school district anywhere in the country. The Calculator contains enough background information on this tool to enable school leaders to design and conduct their own detailed turnover cost analyses. NCTAF’s Teacher Turnover Cost Calculator can be found at www.nctaf.org. At the site, NCTAF will host a Wiki for discussion and comparison of costs that have been calculated by users in communities around the country. We encourage you to use the Wiki to provide feedback on how to improve the calculator.
Gary Barnes Edward Crowe Benjamin Schaefer
------------------------------------------------------------------------------------------------------------ The National Commission on Teaching and America’s Future (NCTAF) is a nonprofit, nonpartisan advocacy organization dedicated to providing every child with competent, caring, qualified teachers in schools organized for success. With a network of 25 partner states and links to professional educational organizations across the nation, NCTAF provides leadership for innovation and improvement in teaching and learning in America’s schools. NCTAF’s work is supported by grants from philanthropic organizations listed at www.nctaf.org. The analysis, recommendations, and opinions in this report are solely the responsibilities of the authors. --------------------------------------------------------------------------------------------------------------------------------- Portions of this report may be reproduced without permission, provided that acknowledgement is given to the “National Commission on Teaching and America’s Future.” Limited permission also is granted for larger portions to be reproduced by nonprofit and public agencies and institutions only, solely for noncommercial purposes and provided that acknowledgement as expressed above is prominently given. Reproduction or storage in any form of electronic retrieval system for any commercial purpose is prohibited without the express written permission of the authors.