Embed Size (px)
Citation preview

European Scientific Journal September 2013 edition vol.9, No.25 ISSN: 1857 – 7881 (Print) e - ISSN 1857- 7431
357
THE CRUCIAL ROLE OF INTERNAL COMMUNICATION AUDIT TO IMPROVE
INTERNAL AND GENERAL MARKET ORIENTATIONS
Joao M. S. Carvalho, PhD University Institute of Maia, Portugal
Abstract This research shows the importance of an internal communication (IC) audit in order to know what to do to improve internal and general market orientations (IMO and MO). A triangulation approach – interviews, questionnaires and critical incident analysis – was performed at a Higher Education Institution. In the literature, there is a lack of this kind of joint analysis of these constructs using a case study mixed method approach. The results show a clear and direct relationship among the different levels of IC, IMO, and MO, which have consequences in job satisfaction. All internal stakeholders (managers, teachers, non-academic staff and students) agree with the need of establishing formal rules and procedures to regulate communication access and flow. With this robust and complete diagnosis one can know in what ways can be improved the internal organizational communication, which is an essential basis to have greater IMO and MO. These orientations will be reflected in improved job satisfaction and better results for the organization.
Keywords: Communication audit, Higher Education, internal communication, internal market orientation, market orientation Introduction
Internal communication (IC) is known to be one of the main problems which affects overall performance and stakeholders’ satisfaction in any organisation. Therefore, it is expected that Higher Education Institutions (HEI) have the same difficulties. It is common to assume if a manager receives any type of information then everyone will know about it. Internal communication is quite often undervalued by managers because they consider written policies and procedures to be a sign of bureaucracy and this may result many times in misunderstood communication (McNamara, 2002).

European Scientific Journal September 2013 edition vol.9, No.25 ISSN: 1857 – 7881 (Print) e - ISSN 1857- 7431
358
The need for more and better communication and feedback interaction is crucial in any thriving organisation. Assessing IC allows one to evaluate satisfaction considered to be an important indicator of organisational stability and functioning (Downs & Hazen, 1977; Downs & Adrian, 2004). A communication audit, as suggested by many authors (e.g. Goldhaber, 1993; Hargie & Tourish, 1993, 2000; Hargie, Tourish & Wilson, 2002; Quinn & Hargie, 2004) provides the necessary diagnosis not only to achieve better internal market orientation (IMO) but also improved job satisfaction. Though the study of IC involves the dissemination of intelligence and in some way interfunctional coordination, it also helps to understand what happens when information is collected and its responsiveness. These are dimensions of IMO and MO, thus the study of IC allows a more in-depth study on IMO and MO, which is fundamental to achieve better organisational performance (e.g. Lings & Greenley, 2009).
The present case study involves a HEI, where a communication audit was performed. Several tools were used to assess information quality and quantity, quickness and preferred channels, plus IMO and MO. This approach cross validates the results, and gives a greater insight of what happens and what solutions are needed to enhance IC. Literature Review Internal and general market orientations
The concept of IMO considers organisations as markets and employees as internal customers (Berry, 1981). It also assesses the way organisations operate an internal marketing philosophy (Gounaris, 2006; Lings, 1999; Lings & Greenley, 2005). IMO is based on the concept of MO which was first proposed by Shapiro (1988) and later operationalized by Narver and Slater (1990), Kohli and Jaworski (1990) and Lambin (1996), among others. According to these authors, market orientation is defined as the planning and implementation of activities and offers which satisfy the present and latent needs and wishes of all organisational stakeholders (Carvalho, 2004). One assess internal and general market orientations by their behavioural dimensions: generation of market intelligence by formal and informal means; internal dissemination of market intelligence, by formal and informal methods; and response to market intelligence, developing and implementing actions to satisfy market needs (Kohli & Jaworski, 1990; Kohli, Jaworski & Kumar, 1993; Lings, 2004; Lings & Greenley, 2005), with interfunctional coordination (Lambin, 1996; Narver & Slater, 1990). There is an apparent relationship between information flow and interfunctional coordination to indicate the integration and collaboration of various functional areas within an organisation. To improve communication and information flow allows to better meet the organisation’s goals (Narver & Slater, 1990), and to create a superior value to clients (Deng & Dart, 1994).

European Scientific Journal September 2013 edition vol.9, No.25 ISSN: 1857 – 7881 (Print) e - ISSN 1857- 7431
359
There is much empirical research regarding MO as one can see in extensive literature reviews (Cano, Carrilat & Jaramillo, 2004; Carvalho, 2004; Ellis, 2006; Kirca, Jayachandran & Bearden, 2005; Shoham, Rose & Kropp, 2005). Despite being relatively under-researched (Naude, Desai & Murphy, 2003), IMO has recently become a concern for several researchers (e.g. Lings, 2004; Lings & Greenley, 2005; Tortosa, Moliner & Sánchez, 2009).
Moreover, it is very important to analyse the way organisations deal with IC (Ahmed & Rafiq, 2003) to facilitate the identification of internal and external customers’ needs as well as generate the appropriate response to such needs. If employees are able or prepared to communicate with each other, then there are conditions for better interfunctional coordination (Naude et al., 2003). One must go deeper and study the implementation of MO at the level of the organisation’s processes (Beverland & Lindgreen, 2007; Gebhardt, Carpenter & Sherry Jr., 2006; Golann, 2006). Therefore, this research is concerned with the collection of information and communication flow in an organisation as a vital process to achieve a MO.
There is a positive influence of IMO on employee job satisfaction (Ahmed, Rafiq & Saad, 2003; Gounaris, 2008; Lings, 2004; Tortosa et al., 2009); on employee motivation (Lings & Greenley, 2009); on the practice of internal marketing (Gounaris, 2008); on successful implementation of business strategies (Conduit & Mavondo, 2001; Lings, 2004); on service effectiveness (Lings, Beatson & Gudergan, 2008); on employees becoming more customer minded (Goebel et al., 2004); on external market orientation and financial performance (Lings & Greenley, 2009); and on customer satisfaction and perceived quality of service of organisational performance (Tortosa et al., 2009; Lings & Greenley, 2009).
There are a few studies in university environment (e.g. Gregory, 2008; Hammond & Harmon, 2005; Hammond, Harmon & Webster, 2007; Hammond, Webster & Harmon, 2006, 2009; Webster, Webster & Hammond, 2008), showing the importance of planned strategic marketing, IC and MO in HEI, as well as the improvement of organisational performance at all levels (e.g. student enrolment; retention rate; future perspectives for alumni; rankings by external organisations; and overall performance).
In conclusion, to achieve better organisational performance one needs to develop IMO and MO, which depends on a suitable communication system. Then, the level of accuracy and quality of information within an organisation is one of the most important aspects for the analysis of such strategic orientations (Naude et al., 2003).

European Scientific Journal September 2013 edition vol.9, No.25 ISSN: 1857 – 7881 (Print) e - ISSN 1857- 7431
360
Internal communication Greenbaum (1974) defined organisational communication as a system
in terms of purpose (to achieve organisational goals), operational procedures (the use of functional communication networks, and the adoption of suitable communication policies and activities), and structure (organisation unit, functional communication networks, and communication policies and activities).
Internal communication helps to convert information into action but relevant content must be provided so that people may analyse and test it, as well as share ideas and have feedback (Quirke, 2008). Unfortunately, communication continues to be neglected by managers who always believe there is enough communication in their sector(s). It is crucial to have motivated employees, who work together with good interfunctional coordination, aiming to achieve organisational goals (Cornelissen, 2008). To accomplish all this, an organisation must invest in effective information systems, which can render favourable and quicker organisational change, more flexibility and innovation processes, better quality of decision making, better knowledge sharing, and a more motivated workforce (Quirke, 2008).
An organisation can also benefit from the enhancement of information and communication technologies (ICT) that allows the development of market orientation capabilities (Borges, Hoppen & Luce, 2009), a consequence of IMO (Lings & Greenley, 2009). However, one must be aware, as Sharif (2008) has shown, that ICT can be data-centric and sales-oriented instead of customer-centric and market-oriented.
There are many studies concerning the quality of IC, defined as the extent to which members of an organisation perceive that communication flow occurs in a timely manner and is relatively accurate, relevant, clear, and effective (Goebel et al., 2004). Research shows that there is a positive impact on: customer orientation and service performance (Clampitt & Downs, 1993; Downs & Adrian, 2004; Goebel et al., 2004; Hargie & Tourish, 2000); employee job satisfaction, commitment and work motivation (Gregson, 1990; Mathieu & Zadjac, 1990; Orpen, 1997; Pettit, Goris & Vaught, 1997); the adjustment of an employee’s behaviour towards organisational objectives (Boswell & Boudreau, 2001; Guest & Conway, 2002); organisational efficiency and effectiveness (Chen, 2008; Clampitt & Downs, 1993; Tourish & Hargie, 1998); and employee engagement (Thomson & Hecker, 2000).
Several audits have shown that poor interdepartmental communication generates feelings of isolation and dissatisfaction, which in turn are correlated with low levels of engagement in the decisions making process (Hargie & Tourish, 2000). Hence, it is highly important to assess the quality of internal information, as a previous condition for IMO and MO.

European Scientific Journal September 2013 edition vol.9, No.25 ISSN: 1857 – 7881 (Print) e - ISSN 1857- 7431
361
Methodology I chose a 20 year old private university institution to study IC, IMO
and MO. There are currently over 5,000 students, 260 teachers and 65 non-academic staff. The growth of this HEI has placed greater demand on management and IC.
To accurately assess the present communication performance at this HEI, a communication audit took place to determine people’s perception about strengths and weaknesses of IC; quality and quantity of information received from several sources; how fast the communication flow is; and what the preferences are in terms of communications channels.
There is a consensus related to the use of a triangulation approach (Dickson, Rainey & Hargie, 2003a, 2003b; Hargie & Tourish, 2000; Quinn & Hargie, 2004) based on structured face-to-face interviews, communication audit questionnaires, and critical incident analysis.
I decided to interview the main management staff (Goldhaber, 1993; Millar & Gallagher, 2000). They not only answered 18 questions, which assessed their opinion about IC, but also filled a questionnaire with 28 items about MO. Twelve of them are both senior managers and owners of the HEI, while 16 are directors and middle managers.
I also invited by e-mail all teachers, non-academic staff, and the 1,015 students attending the last curricular year of 1st Cycle degrees, to answer a questionnaire that also included the description of critical communicational incidents. They could answer by two means, via e-mail (revealing one’s identity), or by closed envelope to assure confidentiality. The respondents were 111 students, which means close to 11% of the selected population; 41 teachers (15.8% of the population), and 8 non-academic staff members (12.3% of the population). This questionnaire includes a communication audit for all, and an IMO scale for teachers and non-academic staff.
To carry out the critical incident analysis, all managers, teachers, non-academic staff and students were asked to recall details of a communication incident, which they thought best represented communication within the organisation, whether be it positive or negative (Flanagan, 1954).
One used a qualitative method focused on interviews and critical incident analysis, along with a quantitative method that evaluates the perceptions about IC, IMO and MO.
The following steps were adopted so as to conduct the communication audit (Hargie & Tourish, 1993; Tourish & Hargie, 1998): - A meeting was organised with the senior management of the HEI. The
importance, rationale and methodology of communication audit were outlined and explained, and a formal authorization to run this kind of research was requested and approved. This consent was formally transmitted to all staff in writing and signed by the Board.

European Scientific Journal September 2013 edition vol.9, No.25 ISSN: 1857 – 7881 (Print) e - ISSN 1857- 7431
362
- After several pre-tests of research instruments, data was collected from the interviews and questionnaires to examine perceptions of communication effectiveness in general terms. One also requested internal stakeholders to report examples of good or bad communication incidents, and to give some idea on how to enhance communication flow.
- Data were analysed using content analysis, descriptive statistics, and adequate statistical tests.
- An extensive report was presented to the senior managers and academic community.
Measures of internal and general market orientations To assess MO one used an enhanced version of a validated scale
(Carvalho, 2004), which is based on the work of several authors (e.g. Deng & Dart, 1994; Deshpandé, Farley & Webster, 1993; Jaworski & Kohli, 1993; Kohli, Jaworski & Kumar, 1993; Lambin, 1996; Matsuno & Mentzer, 2000; Narver & Slater, 1990). Several items were divided, so as to know what the organisations do in relation to specific stakeholders, both in formal and informal ways.
The questionnaire to managers seeks to assess MO, and each of the 28 items was answered on a 4 point scale: 1 = No, never; 2 = Rarely; 3 = Frequently; 4 = Yes, always; and it also was possible to answer NA = Not applicable or I don’t know. Items 1 to 8 measure information generation (α = 0.78); 9 to 14 information dissemination (α = 0.71); 15 to 20 interfunctional coordination (α = 0.72); and 21 to 28 organisational responsiveness (α = 0.81). The overall MO score (α = 0.87) is computed by averaging the mean scores of the four dimensions.
I also adapted 15 questions of the IMO scale for employees (Lings & Greenley, 2005), to measure the perception of teachers and non-academic staff about this issue. Each question was answered on a 4 point scale: 1 = I strongly disagree; 2 = I disagree; 3 = I agree; 4 = I strongly agree. Questions 1 to 4 measure informal information generation (α = 0.92); 5 to 7 formal information generation (α = 0.91); 8 to 11 information dissemination (α = 0.93); and 12 to 15 responsiveness (α = 0.93). The overall IMO score (α = 0.97) is computed by averaging the mean scores of the four dimensions. This scale presents a good reliability, i. e. a Cronbach’s alpha above 0.9; convergent validity, measured by the average variance explained of each dimension that explicates more than 50% of the variance in the data, and by the strong correlations among dimensions; and discriminant validity, measured by the average variance explained of each dimension that is greater than the square of the interfactor correlations (Fornell & Larcker, 1981), and by the lower correlations with other measures of internal communication.

European Scientific Journal September 2013 edition vol.9, No.25 ISSN: 1857 – 7881 (Print) e - ISSN 1857- 7431
363
Measures of internal communication To assess IC, I used the interviews made to managers and
questionnaires filled out by employees (teachers and non-academic staff), and students. This assessment includes questions concerning quality, quantity, responsiveness, quickness/promptness, and preferences related to communication behaviours, as well as employee job satisfaction. A content analysis was used to analyse the interview records and proposals related to the improvement of IC.
Based in the work of Downs and Hazen (1977), Goldhaber (1993), Millar and Gallagher (2000), Downs and Adrian (2004), McNamara (2002), and Quirke (2008), we established a set of 18 questions for the interviews to managers aimed at obtaining their opinion about IC.
To evaluate IC satisfaction, a questionnaire was used based on those created by ICA (International Communication Association; Goldhaber, 1993; Hargie and Tourish, 2000; Downs and Adrian, 2004) and CSQ (Communication Satisfaction Questionnaire) from Downs and Hazen (1977). The quality of information includes the evaluation of the content, relevance, clearness, accuracy, and promptness. Table 1 shows the distribution of questions in both types of questionnaire: employees (E), and students (S).
Table 1 Topics of each questionnaire
Questionnaire Number of questions
Sections Type of answer E S A. Personal information Open 4 4 B. Strengths and weaknesses Open 2 2 C. How do you feel about the quality of information you are receiving? 1 – Dissatisfaction; 2 – Little satisfaction;
3 – Some satisfaction; 4 – Great satisfaction;
NA – Not applicable or I don´t know
16 10
D. How do you feel about the quality of information you are receiving from the following sources?
8 9
E. How much information are you receiving through these channels?
1 – None; 2 – Little; 3 – Some; 4 – Many; NA – Not applicable or I don’t know 10 12
F. How do you feel about the quality of information you are sending?
1 – Dissatisfaction; 2 – Little satisfaction; 3 – Some satisfaction; 4 – Great
satisfaction; NA – Not applicable or I don´t know
7 3
G. How do you feel about the action taken on information you are sending? 8 5
H. How quickly do you get information from the following sources?
1 – I don’t obtain any; 2 – Rarely on time; 3 – Mostly on time; 4 – Always on time;
NA – Not applicable or I don’t know 8 9
I. Communication experience: describe a negative or positive internal communication experience.
Open 1 1
J. Suggestions for making communication better. Open 1 1
K. I am satisfied with my job. 1 – No; 2 – In part; 3 – Yes; NA – Not applicable or I don’t know 1 0

European Scientific Journal September 2013 edition vol.9, No.25 ISSN: 1857 – 7881 (Print) e - ISSN 1857- 7431
364
Results and Analysis Characterization of the samples
We had 111 answers from students attending 3rd year 1st Cycle degrees [(66 female (59.5%) and 45 male (40.5%)]. Their ages range from 19 to 44, with a mean of 24.7 years, a standard deviation of 5.8 years, and 62.1% of the sample varies between 20 and 23 years of age. Seventy students attend day classes (63.1%) and 41 evening classes (36.9%). In the employee sample, there are 41 teachers (24 male and 17 female), and 8 non-academic staff (5 male, and 3 female). The age of teachers varies between 22 and 78, with a mean of 40.8 years and a standard deviation of 11.9 years. Non-academic staff, all of whom work full time, range between 31 and 68 years of age, with a mean of 42.4 years, and a standard deviation of 12.4 years. Teachers are divided in two groups, 17 belong to permanent staff and 24 do not. This sample represents in detail the proportions that exist in terms of gender, age and professional status at the HEI. All the middle (16) and senior managers (11) were invited to be interviewed and to answer the questionnaire. Strengths and weaknesses
The main strengths for most students are friendliness, empathy, humbleness and honesty (18% of the answers; 37% of students); quickness, promptness, truthfulness, knowledge, availability, clarity, conviction, and certainty (18%; 37%); use of e-mail (16.2%; 33.3%); face-to-face contact (11.7%; 24.1%); bulletin boards and posters (9%; 18.5%); the HEI site (9%; 18.5%); others (7.2%; 15%); intranet (6.3%; 13.3%); and telephone (4.5%; 9.3%). In what concerns weaknesses, students pointed out lack of commitment of some staff, contempt, arrogance, indifference, and lack of respect (31.4% of the answers; 52.4% of students); flexibility, quality of information, and know-how (30.5%; 50.8%); used communication channels, location of posters, tardiness in answering the telephone, internal publications, and meetings (17.1%; 28.6%); delay in responding to requests (9.5%; 15.9%); others (7.6%; 12.7%); and evening schedule of the general administrative office (3.8%; 6.3%).
For the majority of employees, the main strengths are the use of e-mail (16.3% of the answers; 40.5% of workers); face-to-face contact (16.3%; 40.5%); straightforwardness, truthfulness, honesty, clarity, objectivity, rigour, seriousness, competence, professionalism, and care (15.4%; 38.1%); education, good relationship, proximity, and friendliness (11.5%; 28.6%), used communication channels (11.5%; 28.6%); telephone assistance (9.6%; 23.8%); openness of senior management, availability to improve (8.7%; 21.4%); accessibility and general availability (6.7%; 16.7%); and mail (3.8%; 9.5%). In relation to weaknesses, they pointed out the lack of communication planning, disorganisation, lack of procedures, rigour and

European Scientific Journal September 2013 edition vol.9, No.25 ISSN: 1857 – 7881 (Print) e - ISSN 1857- 7431
365
homogeneity, and untimely communication (26.4%; 55.9%); delay in replying to requests, non-compliance to deadlines, insufficient and unclear communication (23.6%; 50%); heavy hierarchy, rigid decision making, excess formality and bureaucracy, centralised information, unilateral decisions, lack of personal contact, authoritarianism, and uneasiness in expressing oneself (22.2%; 47.1%); absence of communicating decisions, lack of institutional feedback, non-communicated information to all those interested and information blocked by intermediaries (15.3%; 32.4%); deficient e-mails and call for meetings, bulletin boards and written information flow (12.5%; 26.5%).
Question 13 of the interview to managers indicates what they believe to be the main strengths: informality, accessibility and proximity (72.2% of the answers; 48.1% of managers); information technologies (16.7%; 11.1%); well defined and stable hierarchy structure (5.6%; 3.7%); and respect for one another (5.6%; 3.7%). The weaknesses refer to internal communication in general and lack of formally stipulated rules and procedures (41.7% of the 48 answers; 74.1% of managers); excess informality (27.1%; 48.1%); lack of organisation and articulation between sectors/departments (18.8%; 33.3%); managers do not undertake their responsibilities (4.2%; 7.4%); not enough meetings (4.2%; 7.4%); excess bureaucracy (2.1%; 3.7%); and excessive centralization (2.1%; 3.7%).
The results are very consistent among the three internal stakeholders. There are more answers regarding weaknesses than strengths. Human relationships seem to be the main strength and also the main weakness because there is an excess of informality. There are many situations in which formal regulations and procedures should be imperative to comply with. This gives all the members of the academic community more certainty so as to have enough relevant information to make their own decisions. Quality of information received, sent, and response to it
The percentages of the mean scores obtained (Table 2), show results under 75%, which was considered by the Board as the borderline between insufficient and fair performance for an organisation that aims at improving the quality of its activities and services. All these differences are statistically significant.
This fact is reinforced by the 79.8% of total critical incidents that are related and considered negative by managers, employees and students. Moreover, 88.9% of the middle and senior managers say they only receive information if they ask for it or they need much more information than they normally receive. Only 3 managers (11.1%) said that the necessary information and that received is balanced. This result is also consistent with the mentioned weaknesses of internal communication and the response to question 18 in the interview to managers where they were asked to give a

European Scientific Journal September 2013 edition vol.9, No.25 ISSN: 1857 – 7881 (Print) e - ISSN 1857- 7431
366
qualitative grade to internal communication. Consequently, all of them assessed it below Good (minus), equivalent to the 75% limit previously mentioned.
Table 2 Percentual mean values about information quality
Satisfaction with… Percentual mean values t test in relation to 75%
Employees Students Employees Students …information quality received from… 60.2% 58.0% p < .001 p < .001
…information quality sent by… 65.7% 51.2% p < .01 p < .001 …the answers obtained by… 64.9% 48.6% p < .01 p < .001
Quality and quickness/promptness of information sources
The analysis of quality and quickness/promptness of information sources (Table 3) shows that students place people before any entity by a relative proximity order. Surprisingly, the Board and Student Union are in the last positions.
Table 3 Student opinion about the quality and quickness of information sources Sources Percentual mean values
Quality Quickness Colleagues 76.0% 82.0% Teachers 71.2% 73.6% Non-academic staff 60.6% 48.6% Services 54.1% 42.3% Head of department 51.9% 47.3% 1st Cycle coordinator 49.8% 44.8% Academic committees 47.1% 44.7% Board 46.7% 47.2% Student union 38.8% 35.1%
Note that most of the sources, except for colleagues and teachers, have
low percentage means in both quality and quickness/promptness. These results show that there is a significant margin regarding progression to achieve better internal communication.
The same analysis carried out to employees (Table 4) also shows there is a better opinion concerning the people who are closer to the employees. Nevertheless, percentual means are low in relation to managers, academic committees and staff from other departments/sectors. This shows there is a similar difficulty in information dissemination.

European Scientific Journal September 2013 edition vol.9, No.25 ISSN: 1857 – 7881 (Print) e - ISSN 1857- 7431
367
Table 4 Employee opinion about the quality and quickness of information sources
Sources Percentual mean values
Quality Quickness Subordinates 76.2% 80.0% Immediate supervisor 71.3% 77.0% Close colleagues 70.3% 78.3% Middle managers 64.0% 60.8% Academic committees 62.6% 61.8% Senior managers 59.8% 55.6% People from other sectors that provide services to us 56.6% 60.2% Colleagues from other departments 47.0% 55.9%
Quantity of information received and preferred communication channels
Table 5 shows the ranking of communication channels for students and employees in terms of the amount of information received. Surprisingly, meetings with 1st Cycle coordinators are very rare and the amount of information received by students is very low. The other sources, assessed by students, have the expected results, this is, good percentual means in contacting colleagues and teachers face-to-face and in relation to the HEI site. The existence of an institutional e-mail address, which is not used very often by students, explains the low percentual score compared with first place in the employee ranking. In general, face-to-face contact is a source of much information which prevails in the internal communication, consequently showing the predominance of informality at this HEI.
Table 6 shows the first 9 preferences of employees and students in terms of information channels. The ranking was constructed by the choice of 3 main channels weighted by the respective number of responses.
Note that students consider the HEI site as the most preferred communication channel while employees consider it the least, but face-to-face contact and e-mail are important to both. The HEI invests a lot of money in internal publications like information brochures though it seems they are not very useful for internal stakeholders. It is crucial to further invest in making the site more user-friendly and interesting as well as encouraging the academic community to use e-mail as the main communication channel.

European Scientific Journal September 2013 edition vol.9, No.25 ISSN: 1857 – 7881 (Print) e - ISSN 1857- 7431
368
Table 5 Ranking channels by the amount of information received
Students Percentual mean Employees Percentual
mean Face-to-face contact with colleagues 77.8% E-mail 79.2%
Face-to-face contact with teachers 75.4% Face-to-face contact with
colleagues in my work sector 71.0%
HEI site 75.2% Face-to-face contact with supervisors 70.3%
Bulletin boards and posters 67.9% Intranet 65.9% E-mail 64.4% HEI site 64.5% Intranet 60.0% Meetings 60.6% Face-to-face contact with non-academic staff 51.9% HEI’s communications 60.4%
Internal publications 46.8% Written communications from supervisors 53.8%
HEI’s communications 46.3% Bulletin boards and posters 52.9% Meetings with 1st Cycle coordinator 31.3% Phone calls from supervisors 48.5%
Internal publications 48.1%
Face-to-face contact with colleagues from other sectors 45.5%
Table 6 Ranking of preferred information channels
Ranking Students Employees 1 HEI site Face-to-face contact with supervisors 2 Face-to-face contact with teachers E-mail
3 E-mail Face-to-face contact with colleagues in my work sector
4 Face-to-face contact with colleagues HEI’s communications 5 Bulletin boards and posters Phone calls from supervisors 6 Intranet Meetings with my supervisor 7 Internal publications Intranet
8 Face-to-face contact with non-academic staff Bulletin boards and posters
9 HEI’s communications HEI site Managers’ opinions
The first two questions in the interview identify the manager and his/her position.
Question 3: which issues regarding organisation are the most important to you at this moment? The main concerns of managers are the reorganisation of competences and delegation (13.7% of all answers, and 37% of managers), the statutes of teachers and non-academic staff careers (11% ; 29.6%), the rules of internal procedures and their communication (9.6% ; 25.9%), strategic planning (8.2% ; 22.2%), employee motivation and satisfaction (6.8% ; 18.5%), internal communication (6.8% ; 18.5%), and another 19 less mentioned concerns. In conclusion, though most of these

European Scientific Journal September 2013 edition vol.9, No.25 ISSN: 1857 – 7881 (Print) e - ISSN 1857- 7431
369
concerns are very crucial to the communication environment, managers are conscious about the organisational aspects which must be enhanced.
Question 4: what type of decisions do you make? In general, most decisions are made on the basis of the established functions and statutes. In some cases, the lack of clear description and attribution of functions disrupts one’s activity and intervention capacity.
Question 5: what kind of information do you need to undertake such decisions? Question 6: who should you receive information from? Question 7: what kind of information do you really receive and from whom? The joint analysis of these questions is summarized on a scale (Table 7).
The answers show some dissatisfaction with the disorganisation of information flow. They reveal that it is difficult to obtain information promptly and that it is important to establish rules and procedures which allow constant and periodic flow of relevant information for decision processes.
Table 7 Relation between the need to ask for information and that received automatically
Scale Nº answers % of answers Only receives important information to make decisions if it is asked for 8 29.6
Asks for information more than what is received automatically 16 59.3
There is an equilibrium between asked information and that which is received automatically 3 11.1
Asks for information less than what is received automatically 0 0
Always receives important information automatically to make decisions 0 0
Question 8: which formal and informal communication channels do
you normally receive information from? Question 9: are there formal templates associated to information flow? Twenty four managers have the perception that formal documents are the main channel of information flow (30.8% of responses; 88.9% of respondents). However, there is no formal template document for the majority of situations. Informality prevails and is considered good, though there are communication problems because it is excessive. This is why informal face-to-face contact and e-mail appears ex-aequo in second place (each with 26.9% of responses, and 77.8% of respondents). Telephone services, meetings and the HEI site have little choice and together represent only 15.4% of responses and 4.4% of respondents.
Question 10: is there an established regularity to receive information? Only 8 managers (29.6%) mentioned situations of regularity concerning relevant information. It is important to increment the programmed

European Scientific Journal September 2013 edition vol.9, No.25 ISSN: 1857 – 7881 (Print) e - ISSN 1857- 7431
370
information flow so as to allow its promptness and availability without the need to request it.
Question 11: are there formal or informal policies which state guidelines to obtaining information in the organisation? It is important to refer to one of the managers responses:
There are internal rules for document classification and in some cases there are defined deadlines but few people comply in spite of having formation about procedures. One lacks norms to regulate information flow. The organisation of services must be changed. People are isolated in their specialized functions. Bureaucracy, in some situations, is exaggerated. Note that 44.4% (12 cases) say that there are no internal
communication policies. Nine managers (33.3%) refer that policies are essentially informal while six (22.2%) state that, in some cases, there are communication norms.
Question 12: should some of the policies be improved, changed or abandoned? Twelve managers (44.4%) believe new ones should be created; eight (29.6%) mentioned adding other important ones and improving those that already exist; five (18.5%) said they should be changed; and two (7.4%) concur that the existing ones should remain.
Question 13: which are the main communicational strengths and weaknesses in the organisation? The results of the answers are present in section “Strengths and weaknesses”.
Question 14: is there a system or formal process that encourages sharing internal information? The large majority of managers (24; 88.9%) responded “no” while reinforcing the idea that there is no formal internal communication system that promotes and/or rewards information sharing in a simpler manner. As one manager said: “this situation has already occurred with the internal evaluation process and fortunately it has contributed to the consciousness of this need”.
Three managers gave different answers: one referred that the structure of the HEI site was an attempt to make information sharing easier but this is not quite true; another said that there is an informal process of sharing information; and another stated that the existence of formal meetings allowed information sharing but because they are infrequent between different sectors/departments, normal information flow is not satisfactory. Nevertheless, they all agree that the absence of a more formal internal communication policy, which guides appropriate behaviour, harms the organisation and its development, as well as job satisfaction of internal stakeholders.
Question 15: how do you encourage people to contribute with new ideas? Most managers say that they are open to new ideas (56.4% of

European Scientific Journal September 2013 edition vol.9, No.25 ISSN: 1857 – 7881 (Print) e - ISSN 1857- 7431
371
answers; 81.5% of respondents). However, there are 12 managers (30.8%; 44.4%) who are more active and request and stimulate new ideas. Five other answers are slightly different: two managers (5.1%; 7.4%) share information and ask questions; another two do not feel the need; and one embraces new projects. In general, managers are open minded and this explains why this HEI has the capacity to adapt to new legislation and overcome challenges that have arisen within Higher Education System.
Question 16: is there any type of map explaining the internal communication network? The answers to this question were a unanimous, “no”.
Question 17: what would you like to be done in order to improve information flow? Managers suggested 16 actions, employees 40 and students 9. It is not the aim of this paper to present such ideas. However, it is consensual that HEI needs a set of formal rules and procedures based on a clear flowchart and description of all functions that lead to a map of internal communication flow. The use of new information technologies is indispensable not only to achieve better results but also to control the system and indicate the access levels of relevant information according to each person/position. Meetings should also be held more frequently so as to allow a process of strategic reflection and greater compliance with responsibilities.
Question 18: how would you evaluate internal communication? Table 8 shows the median as “sufficient” but, as this communication audit has shown, this result is not satisfactory. This HEI aims at and needs to achieve a good and solid internal communication flow as a priority to leverage the behaviours of internal and external market orientations. And with these strategic orientations, all organisational performance levels may be improved.
Table 8 Qualitative evaluation of internal communication
Qualitative grades Nº answers % of respondents
Cumulative % of respondents
Bad 2 7.4 7.4 Insufficient 5 18.5 25.9 Sufficient (minus) 5 18.5 44.4 Sufficient 9 33.3 77.8 Sufficient (plus) 2 7.4 85.2 Good (minus) 4 14.8 100
Internal and general market orientations
Forty-seven employees responded to the questions linked to IMO. In general, the medians of the items clearly show the insufficiencies in this orientation. The calculation of means and standard deviations was possible by adding several ordinal items which represent dimensions of the construct (Table 9). Thus, formal information generation has a worse result compared
European Scientific Journal September 2013 edition vol.9, No.25 ISSN: 1857 – 7881 (Print) e - ISSN 1857- 7431
372
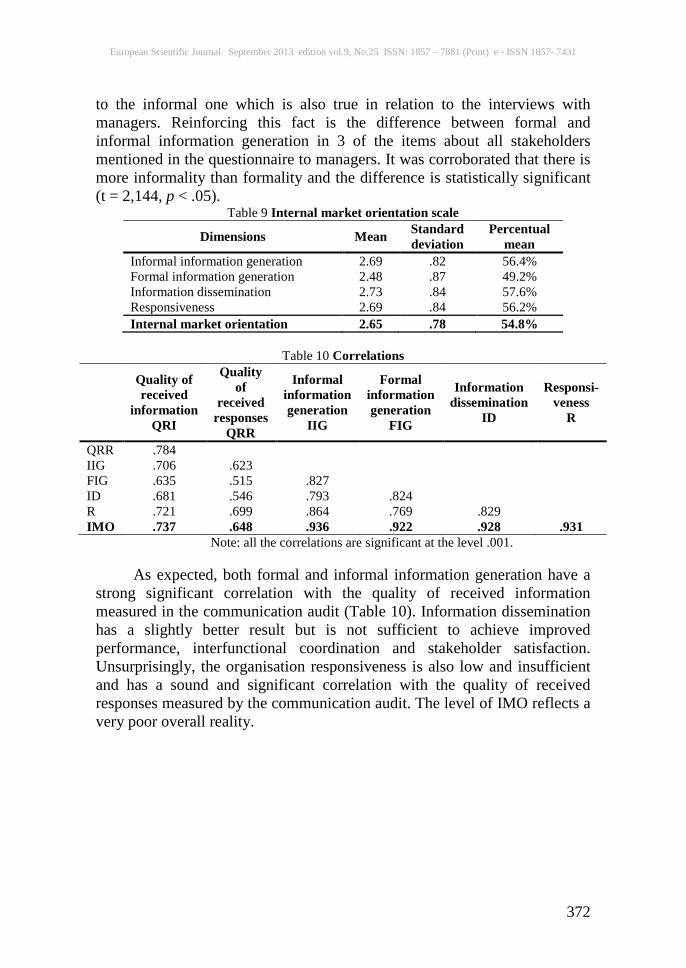
to the informal one which is also true in relation to the interviews with managers. Reinforcing this fact is the difference between formal and informal information generation in 3 of the items about all stakeholders mentioned in the questionnaire to managers. It was corroborated that there is more informality than formality and the difference is statistically significant (t = 2,144, p < .05).
Table 9 Internal market orientation scale
Dimensions Mean Standard deviation
Percentual mean
Informal information generation 2.69 .82 56.4% Formal information generation 2.48 .87 49.2% Information dissemination 2.73 .84 57.6% Responsiveness 2.69 .84 56.2% Internal market orientation 2.65 .78 54.8%
Table 10 Correlations
Quality of received
information QRI
Quality of
received responses
QRR
Informal information generation
IIG
Formal information generation
FIG
Information dissemination
ID
Responsi-veness
R
QRR .784 IIG .706 .623 FIG .635 .515 .827 ID .681 .546 .793 .824 R .721 .699 .864 .769 .829 IMO .737 .648 .936 .922 .928 .931
Note: all the correlations are significant at the level .001.
As expected, both formal and informal information generation have a strong significant correlation with the quality of received information measured in the communication audit (Table 10). Information dissemination has a slightly better result but is not sufficient to achieve improved performance, interfunctional coordination and stakeholder satisfaction. Unsurprisingly, the organisation responsiveness is also low and insufficient and has a sound and significant correlation with the quality of received responses measured by the communication audit. The level of IMO reflects a very poor overall reality.

European Scientific Journal September 2013 edition vol.9, No.25 ISSN: 1857 – 7881 (Print) e - ISSN 1857- 7431
373
Table 11 t tests for the equality of means Job satisfaction N Mean Standard deviation Significance
Quality of received information In part 15 2.225 .468 p < .001 Yes 31 3.098 .569
Quality of received responses In part 14 2.508 .554 p < .001 Yes 27 3.179 .558
Informal information generation In part 14 2.286 .458 p < .01 Yes 31 2.944 .833
Formal information generation In part 14 2.048 .537 p < .01 Yes 31 2.720 .899
Information dissemination In part 14 2.393 .535 p < .01 Yes 31 2.920 .872
Responsiveness In part 14 2.393 .663 p < .05 Yes 31 2.863 .856
IMO In part 14 2.280 .495 p < .01 Yes 31 2.862 .796
We have asked employees about their opinion towards job satisfaction. There was one who did not answer, another one is not at all satisfied, 15 are partly satisfied while 32 stated they are, in general, satisfied with their job. By assessing the quality of information received and the level of IMO between the two groups (the single “no” response was omitted from this analysis), we verify that there are significant statistic differences (Table 11), which corroborate the importance of IC and IMO regarding job satisfaction.
Considering that managers established 75% as a minimum acceptable level, we tested the percentual levels obtained in the evaluation of IMO and its dimensions compared to such objective and concluded that all dimensions are statistically significant (p < .001).
Table 12 Market orientation scale
Dimensions Mean Standard deviation
Percentual mean
Generation of information 2.48 .38 49.4% Dissemination of information 2.08 .30 35.9% Interfunctional coordination 1.86 .45 28.8% Responsiveness 2.41 .39 47.1% Market orientation 2.21 .28 40.3%
When comparing the answers of employees to the IMO scale and the
answers by managers to the MO scale (Table 12), we have lower average scores in the latter, all of which are below 50%. This is important because the insufficient level of MO is worse when one assesses it in relation to all stakeholders. These results confirm that IC is one of the most important factors to improving MO which brings about better organisational performance placing job satisfaction as one of its internal indicators.
Interfunctional coordination and information dissemination are the dimensions with lower average scores. This confirms that there are IC

European Scientific Journal September 2013 edition vol.9, No.25 ISSN: 1857 – 7881 (Print) e - ISSN 1857- 7431
374
problems which can and should be improved by the establishment of formal rules and procedures so as to lead to an on-going and changing process. On the other hand, the very low score in interfunctional coordination informs us that internal organisation can be explained in great part due to the difficulties with IC flow along with organisational responsiveness. Critical incident analysis
The 3rd tool to audit IC has given us a good insight of the existing problems within some sectors/departments at HEI. There were 119 critical incidents reported: 95 (79.8%) negative situations concerning difficulties, delays, no replies and communication inefficiencies and 24 (20.2%) situations related to positive results of communication flow.
The main problems take place with vertical communication (74.7%): between senior management and teachers, non-academic staff and students (22 cases); services, teachers and students (20); 1st Cycle coordinators and students (16); general administrative office and students (8); lack of respect towards hierarchy (4); and lack of planning and prompt information requests (3). There are also problems with horizontal communication (12.6%): within departments (4 cases); between teachers and the post-graduate office (2); among senior managers at HEI (2); between teachers and students (2); and lack of formal communication regulations (2). Other communication problems affecting everyone (10,5%) are: lack of documents for making decisions in academic committees (2 cases); information sources with different statistic values (1); lack of clarity of service functions (1); lack of information control (1); lack of IT use (1); lack of communication with alumni (1); lack of registering decisions made in meetings with 1st Cycle coordinators (1); important information missing on the HEI site (1); and lack of communication at the reception to Erasmus students (1).
The positive critical incidents in vertical communication are (62.5%) related to senior management (4 cases), general administrative office (3), teachers (3), services (3), and 1st Cycle coordinators (2). In horizontal communication (37.5%) the positive situations refer to the Psychology Department (3 cases), non-academic staff (2), services (2), among students (1), and among teachers (1).
This tool specifies examples which indicate not only where IC problems occur but confirms what is acknowledged by the questionnaires and interviews as well as helps validate conclusions. Conclusions
The communication audit which has taken place at this HEI helped one realize that IC needs to be improved to achieve higher levels of internal and general market orientations, which can lead to better organisational performance and job satisfaction. It was consensual that a minimum percentual value of 75% in all variables would be required, and it was found

European Scientific Journal September 2013 edition vol.9, No.25 ISSN: 1857 – 7881 (Print) e - ISSN 1857- 7431
375
that most of them are below that mark with statistically significant differences.
The IC at HEI presents the same poor results in all the instruments of analysis (interviews, questionnaires, and critical incidents) and across internal stakeholders (managers, employees, and students). The use of the triangulation method helps to cross-validate the research results, and gives a greater insight to what is happening within the organisation.
The main problem is the excess of informality in many communicative situations which should have a more formal approach, so that all people can have the correct information.
The IC weakness is reflected in IMO and MO. There are statistically significant correlations between these constructs and information quality, quantity, response and quick measures of communication flow. As expected, when there is deficient IC, the levels of job satisfaction and IMO and MO are also lower. This is, IC, as part of those strategic orientations, is obviously an essential pre-condition to improve them, and achieve better individual, collective and organisational performance. Thus, an improved IC and a good internal organisation, with clear functions and responsibilities, and attentiveness towards all organisational stakeholders, are needed to enhance IMO, MO, and organisational success. References: Clancy, Tom, Carl Stiner, and Tony Koltz. Shadow Warriors: Inside the Special Forces. New York: Putnam, 2002. Cohen, Andrew, and J.L. Granatstein, eds. Trudeau's Shadow: The Life and Legacy of Pierre Elliott Trudeau. Toronto: Random, 1998. Meidenbauer, Jörg, ed. Discoveries and Inventions: From Prehistoric to Modern Times. Lisse: Rebo, 2004. Puzo, Mario. The Family: A Novel. Completed by Carol Gino. New York: Harper, 2001. Rowling, J.K. Harry Potter and the Chamber of Secrets. New York: Scholastic, 1999 Ahmed, P., and Rafiq, M. Internal Marketing Issues and Challenges. European Journal of Marketing, 37(9): 1177-1186, 2003. Ahmed, P., Rafiq, M., and Saad, N. Internal Marketing and the Mediating Role of Organisational Competencies. European Journal of Marketing, 37(9): 1221-1241, 2003. Berry, L. The Employee as a Customer. Journal of Retail Banking, 3: 33-44, 1981. Beverland, M., and Lindgreen, A. Implementing Market Orientation in Industrial Firms: A Multiple Case Study. Industrial Marketing Management, 36(4): 430–442, 2007.

European Scientific Journal September 2013 edition vol.9, No.25 ISSN: 1857 – 7881 (Print) e - ISSN 1857- 7431
376
Borges, M., Hoppen, N., and Luce, F. Information Technology Impact on Market Orientation in e-business. Journal of Business Research, 62: 883-890, 2009. Boswell, W., and Boudreau, J. How Leading Companies Create, Measure and Achieve Strategic Results through Line of Sight. Management Decision, 39(10): 851-860, 2001. Cano, C., Carrilat, F., and Jaramillo, F. A Meta-Analysis of the Relationship Between Market Orientation and Business Performance: Evidence from Five Continents. International Journal of Marketing Research, 21(2): 179-200, 2004. Carvalho, J. Orientação de Mercado e Desempenho. PhD Dissertation, Faculty of Economics of University of Porto, 2004. Chen, N. Internal/Employee Communication and Organisational Effectiveness: A Study of Chinese Corporations in Transition. Journal of Contemporary China, 17(54): 167–189, 2008. Clampitt, P., and Downs, C. Employee Perceptions of the Relationship Between Communication and Productivity: A Field Study. The Journal of Business Communication, 30(1): 5-28, 1993. Conduit, J., and Mavondo, F. How Critical Is Internal Customer Orientation to Market Orientation?. Journal of Business Research, 51: 11−24, 2001. Cornelissen, J. Corporate Communication. A Guide to Theory and Practice, 2nd ed. London: Sage, 2008. Deng, S., and Dart, J. Measuring Market Orientation: A Multi-factor, Multi-item Approach. Journal of Marketing Management, 10: 725-742, 1994. Deshpandé, R., Farley, J., and Webster Jr., F. Corporate Culture, Customer Orientation and Innovativeness in Japanese Firms: A Quadrad Analysis. Journal of Marketing, 57(January): 23-37, 1993. Dickson, D., Rainey, S., and Hargie, O. Communicating sensitive business issues: Part 1. Corporate Communications: An International Journal, 8(1): 35-43, 2003a. Dickson, D., Rainey, S., and Hargie, O. Communicating sensitive business issues: Part 2. Corporate Communications: An International Journal, 8(2): 121-127, 2003b. Downs, C., and Adrian, A. Assessing Organisational Communication – Strategic Communication Audits. New York: The Guilford Press, 2004. Downs, C., and Hazen, M. A Factor Analytic Study of Communication Satisfaction. The Journal of Business Communication, 14(3): 63-73, 1977. Downs, C., Hydeman, A., and Adrian, A. Auditing the Annual Business Conference of a Major Beverage Company. In O. Hargie & D. Tourish (Eds), Handbook of Communication Audits for Organisations (pp. 272-290). London: Routledge, 2000.

European Scientific Journal September 2013 edition vol.9, No.25 ISSN: 1857 – 7881 (Print) e - ISSN 1857- 7431
377
Ellis, P. Market Orientation and Performance: A Meta-Analysis and Cross-National Comparisons. Journal of Management Studies, 43(5): 1089-1107, 2006. Flanagan, J. The Critical Incident Technique. Psychological Bulletin, 51: 327-357, 1954. Fornell, C., and Larcker, D. Structural Equation Models with Unobservable Variables and Measurement Error: Algebra and Statistics. Journal of Marketing Research, 18(February): 39-50, 1981. Gebhardt, G., Carpenter, G., and Sherry Jr., J. Creating a Market Orientation: A Longitudinal Multifirm Grounded Analysis of Cultural Transformation. Journal of Marketing, 70(4): 37–55, 2006. Goebel, D., Marshall, G., and Locander, W. An Organisational Communication-Based Model of Individual Customer Orientation of Nonmarketing Members of a Firm. Journal of Strategic Marketing, 12. 29–56, 2004. Golann, B. Achieving Growth and Responsiveness: Process Management and Market Orientation in Small Firms. Journal of Small Business Management, 44(3): 369–385, 2006. Goldhaber, G. Organisational Communication, 6th ed., Madison, Wis.: WCB Brown and Benchmark, 1993. Gounaris, S. Internal-market orientation and its measurement. Journal of Business Research, 59(4): 432-448, 2006. Gounaris, S. The Notion of Internal Market Orientation and Employee Job Satisfaction: Some Preliminary Evidence. Journal of Services Marketing, 22(1): 68-90, 2008. Greenbaum, H. The Audit of Organisational Communication. The Academy of Management Journal, 17(4): 739-754, 1974. Gregory, D. Communicating in a Crisis: A Risk Management Issue?. Journal of Business Continuity & Emergency Planning, 3(1): 31-37, 2008. Gregson, T. The separate constructs of communication satisfaction and job satisfaction. Educational and Psychological Measurement, 51: 39-48, 1990. Guest, D., and Conway, N. Communicating the Psychological Contract: An Employer Perspective. Human Resource Management Journal, 12(2): 22-38, 2002. Hammond, K., Harmon, H., and Webster, R. University Performance and Strategic Marketing: An Extended Study. Marketing Intelligence & Planning, 25(5): 436-459, 2007. Hammond, K., Webster, R., and Harmon, H. Market Orientation, Top Management Emphasis, and Performance Within University Schools of Business: Implications for Universities. Journal of Marketing Theory and Practice, 14(1): 69-85, 2006.

European Scientific Journal September 2013 edition vol.9, No.25 ISSN: 1857 – 7881 (Print) e - ISSN 1857- 7431
378
Hammond, K., Webster, R., and Harmon, H. The Impact of Market Orientation Toward Student/Faculty Ratios on Performance Excellence in the Case of AACSB – International Member School. Academy of Marketing Studies Journal, 13(2): 45-58, 2009. Hargie, O., and Tourish, D. Assessing the Effectiveness of Communication Audit Approach. Health Service Management Research, 6(4): 276-285, 1993. Hargie, O., and Tourish, D. Handbook of Communication Audits for Organisations. London: Routledge, 2000. Hargie, O., Tourish, D., and Wilson, N. Communication audits and the effects of increased information: A follow-up study. Journal of Business Communication, 39: 414-436, 2002. Kirca, A., Jayachandran, S., and Bearden, W. Market Orientation: A Meta-Analytic Review and Assessment of Its Antecedents and Impact on Performance. Journal of Marketing, 69(April): 24-41, 2005. Kohli, A., and Jaworski, B. Market Orientation: The Construct, Research Propositions and Managerial Implications. Journal of Marketing, 54(April): 1-18, 1990. Kohli, A., Jaworski, B., and Kumar, A. MARKOR: A Measure of Marketing Orientation. Journal of Marketing Research, 30(November): 467-477, 1993. Lambin, J.-J. The Misunderstanding About Marketing: Today, Marketing Is Too Important To Be Left to the Sole Marketing Function. An Empirical Study in the Private Insurance Sector. CEMS Business Review, 1(1/2): 37-56, 1996. Lings, I. Balancing Internal and External Market Orientation. Journal of Marketing Management, 15(4): 239-263, 1999. Lings, I. Internal Market Orientation: Construct and Consequences. Journal of Business Research, 57(4): 405−415, 2004. Lings, I., Beatson, A., and Gudergan, S. The Impact of Implicit and Explicit Communications on Frontline Service Delivery Staff. The Service Industries Journal, 28(10): 1431–1443, 2008. Lings, I., and Greenley, G. Measuring Internal Market Orientation. Journal of Service Research, 7(3): 290-306, 2005. Lings, I., and Greenley, G. The Impact of Internal and External Market Orientations on Firm Performance. Journal of Strategic Marketing, 17(1): 41-53, 2009. Mathieu, J., and Zadjac, D. A review and meta-analysis of the antecedents, correlates, and consequences of organisational commitment. Psychological Bulletin, 108: 171-194, 1990. Matsuno, K., and Mentzer, J. The Effects of Strategy Type on the Market Orientation-Performance Relationship. Journal of Marketing, 64(October): 1-16, 2000.

European Scientific Journal September 2013 edition vol.9, No.25 ISSN: 1857 – 7881 (Print) e - ISSN 1857- 7431
379
McNamara, C. Nuts and Bolts Guide to Leadership and Supervision in Business. Authenticity Consulting, LLC, 2002. Millar, R., and Gallagher, M. The Interview Approach. In O. Hargie and D. Tourish (Eds). Handbook of Communication Audits for Organisations (pp. 66-84). London: Routledge, 2000. Narver, J., and Slater, S. The Effect of a Market Orientation on Business Profitability. Journal of Marketing, 54(October): 20-35, 1990. Naude, P., Desai, J., and Murphy, J. Identifying the Determinants of Internal Marketing Orientation. European Journal of Marketing, 37(9): 1205-1220, 2003. Orpen, C. The interactive effects of communication quality and job involvement on managerial job satisfaction and work motivation. Journal of Psychology, 131: 519-522, 1997. Pettit, J., Goris, J., and Vaught, B. An examination of organisational communication as moderator of the relationship between job performance and job satisfaction. Journal of Business Communication, 34: 81-98, 1997. Quinn, D., and Hargie, O. Internal Communication Audits: A Case Study. Corporate Communications: An International Journal, 9(2): 146-158, 2004. Quirke, B. Making the Connections, Using Internal Communication to Turn Strategy into Action, 2nd ed., Farnham: Gower Publishing Limited, 2008. Shapiro, B. What the Hell Is Market Oriented?. Harvard Business Review, 66(November-December): 119-125, 1988. Sharif, K. Impact of information and communication technologies on sales representative internal and external relationships — A study of the UK pharmaceutical sector. Journal of Medical Marketing, 8(4): 341–355, 2008. Shoham, A., Rose, G., and Kropp, F. Market Orientation and Performance: A Meta-Analysis. Marketing Intelligence & Planning, 23(5): 435-454, 2005. Thomson, K., and Hecker, L. Value-adding communication: innovation in employee communication and internal marketing. Journal of Communication Management, 5(1): 48-58, 2000. Tortosa, V., Moliner, M., and Sánchez, J. Internal Market Orientation and its Influence on Organisational Performance. European Journal of Marketing, 43(11/12): 1435-1456, 2009. Tourish, D., and Hargie, O. Auditing Staff-Management Communication in Schools: A Framework for Evaluating Performance. International Journal of Educational Management, 12(4): 176-182, 1998. Webster, R., and Hammond, K. Does a Market Orientation Strategy Exist Toward Business School Students? A View from Three Levels of Academic Administrators. Academy of Marketing Studies Journal, 12(2): 19-33, 2008. Webster, R., Hammond, K., and Harmon, H. Comparing Market Orientation Culture of Businesses and Schools of Business: An Extension and Refinement. Psychological Reports, 96(2): 377-382, 2005.


![[COMM] Internal Communication policies](https://img.pdfslide.net/doc/110x75/546b12d8af795954498b6f38/comm-internal-communication-policies.jpg)