Embed Size (px)
Citation preview
The Crystallization of
Poly(ethylene terephthalate) Studied by
Thermal Analysis and FTIR Spectroscopy
ZIYU CHEN
A thesis submitted to the
University of Birmingham
For the degree of
Doctor of Philosophy
School of Metallurgy and Materials
College of Engineeting and Physical Sciences
University of Birmingham
December 2012

University of Birmingham Research Archive
e-theses repository This unpublished thesis/dissertation is copyright of the author and/or third parties. The intellectual property rights of the author or third parties in respect of this work are as defined by The Copyright Designs and Patents Act 1988 or as modified by any successor legislation. Any use made of information contained in this thesis/dissertation must be in accordance with that legislation and must be properly acknowledged. Further distribution or reproduction in any format is prohibited without the permission of the copyright holder.

i
Synopsis
This thesis concerns the thermal behaviour and properties, isothermal
crystallization kinetics and seeded crystallization study of poly(ethylene
terephthalate) (PET) using thermal analysis Fourier transform infrared spectroscopy
(TA-FTIR), two-dimensional infrared correlation spectroscopy (2D-FTIR) and
differential scanning calorimetry (DSC).
TA-FTIR has been used to characterize phase transitions by a change in the
absorbance or peak position with temperature in thermal cycling. It provides more
information in assigning the phase transition temperature to an individual chain
segment rather than other TA techniques. It also observes two different types of
thermal behaviours, Type I and Type II, of the functional groups during thermal
treatment.
The most significant achievement of this project assign to find out that the
carbonyl stretching band has an amorphous band at 1727 cm-1
in the melt and a
crystalline band at 1717 cm-1
by TA-FTIR. It was then successfully analyzed by 2D
correlation spectroscopy and presented “angel” pattern and two cross peaks on
synchronous and asynchronous correlation spectra respectively.
ii
The isothermal crystallization kinetics of PET were measured from 230 to
240oC by FTIR focusing on the carbonyl ester group. The deconvolution of the 1727
and 1717 cm-1
overlapping absorption bands makes it possible to analyze the kinetics
of both primary and secondary crystallization by Avrami equations. The Avrami
exponents n were determined as 2.0 for primary and 1.0 for secondary process.
Melting behaviour studies were carried out by DSC observing that crystallinity,
melting temperature and calculated lamellar thickness of PET increase with the
extending time period of isothermal crystallization in secondary process.
Seeded crystallization provides for the possibility of crystallizing polymers at
higher temperatures, even located in the normal melting temperature region, to
produce greater lamellae thicknesses and higher melting temperature and to consider
the effect of this morphology on their mechanical and physical properties. However,
the mechanism of growth rate of seeded crystallization is questionable that requires
further research.

iii
Acknowledgement
Firstly, I sincerely appreciate my supervisors Prof. James N. Hay and Dr. Michel J.
Jenkins. I am deeply indebted their patient guidance, profound expertise and wisdom
throughout these years. They were always willing to answer my questions, provide
valuable advice and support in difficulty during the study. I feel extremely honoured to
work under their great guidance. Without their help and support, this work would never
have been accomplished.
I would like to give a very special thanks to Mr. Frank Biddlestone for his technical
support. His broad experience, logical way of thinking and constructive comment has
been of great value for me in doing the experimental part of the research.
I am deeply grateful to all my colleagues and friends for supports, sharing their
knowledge and precious friendship that made my life in UK enjoyable in these years.
Especially to Dr. Abdul G. AL Lafi, Dr Samsudin S. Amril, Dr. Jin Tang, Dr. ZhenHua
Hu and Dr. DeJing Kong.
The most important, I would above all like to thank my parents. Their endless love,
support and truth is my motivity helping me through the time of this degree and I can
never thank them enough. Finally to my fiancée Yi Huang, thank you for your love,
understanding, encouragement that support me over this period.

iv
Contents
CHAPTER ONE: INTRODUCTION ...................................................................... 1
1.1 POLY (ETHYLENE TEREPHTHALATE) ................................................................................................... 1
1.1.1 Production of PET ........................................................................................................... 2
1.1.2 Commercial Uses of PET. ............................................................................................... 3
1.2 KINETICS OF POLYMER CRYSTALLIZATION .......................................................................................... 5
1.2.1 Polymer crystallization .................................................................................................. 5
1.2.2 Nucleation. ..................................................................................................................... 6
1.2.3 Crystal Growth. .............................................................................................................. 9
1.2.4 The temperature Dependence of Growth Rate........................................................... 10
1.2.5 The Avrami Equation. .................................................................................................. 15
1.3 MORPHOLOGY OF CRYSTALLINE POLYMERS .................................................................................... 16
1.3.1 Single crystals .............................................................................................................. 16
1.3.2 Spherulites ................................................................................................................... 18
1.4 THE MELTING OF POLYMERS. ....................................................................................................... 22
1.5 AIMS AND OBJECTIVES OF THE PROJECT. ........................................................................................ 24
CHAPTER TWO: MATERIALS, EXPERIMENTAL TECHNIQUES AND
PROCEDURES ........................................................................................................ 26
26
2.1 MATERIALS. .............................................................................................................................. 26
2.1.1 Poly(ethylene terephthalate) (PET). ............................................................................ 26
2.2 EXPERIMENTAL TECHNIQUES AND PROCEDURES. .............................................................................. 27
2.2.1 Infrared Spectroscopy. ................................................................................................. 27
2.2.1.1 Introduction ........................................................................................................................... 27
2.2.1.2 Experimental Procedures. ...................................................................................................... 31
2.2.1.3 Peak Resolution in a FTIR Spectrum. ...................................................................................... 35
2.2.2 Differential Scanning Calorimetry (DSC). .................................................................... 40
2.2.2.1 Introduction. .......................................................................................................................... 40
v
2.2.2.2 Experimental Procedures. ...................................................................................................... 42
2.2.3 Hot-stage Microscopy. ................................................................................................. 45
2.2.3.1 Optical Microscopy. ............................................................................................................... 45
2.2.3.2 Hot-stage Microscopy. ........................................................................................................... 45
2.2.3.3 Experimental Procedures. ...................................................................................................... 46
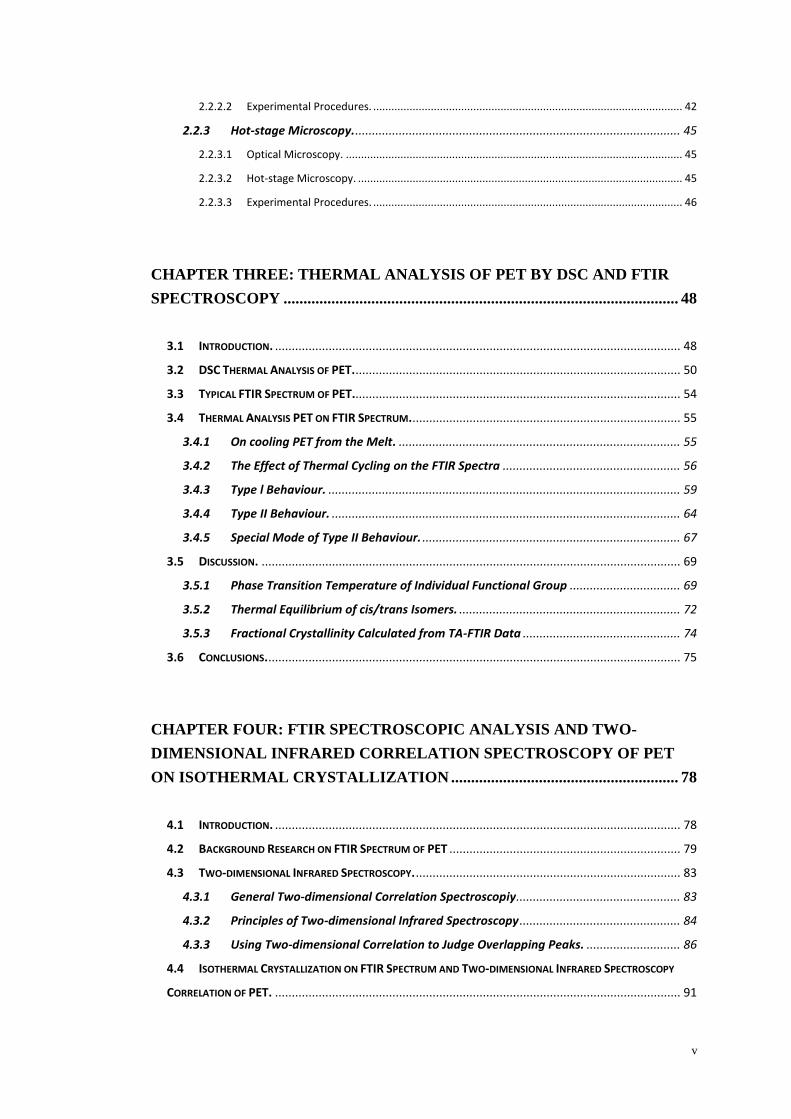
CHAPTER THREE: THERMAL ANALYSIS OF PET BY DSC AND FTIR
SPECTROSCOPY ................................................................................................... 48
3.1 INTRODUCTION. ......................................................................................................................... 48
3.2 DSC THERMAL ANALYSIS OF PET. ................................................................................................. 50
3.3 TYPICAL FTIR SPECTRUM OF PET.................................................................................................. 54
3.4 THERMAL ANALYSIS PET ON FTIR SPECTRUM. ................................................................................ 55
3.4.1 On cooling PET from the Melt. .................................................................................... 55
3.4.2 The Effect of Thermal Cycling on the FTIR Spectra ..................................................... 56
3.4.3 Type l Behaviour. ......................................................................................................... 59
3.4.4 Type II Behaviour. ........................................................................................................ 64
3.4.5 Special Mode of Type II Behaviour. ............................................................................. 67
3.5 DISCUSSION. ............................................................................................................................. 69
3.5.1 Phase Transition Temperature of Individual Functional Group ................................. 69
3.5.2 Thermal Equilibrium of cis/trans Isomers. .................................................................. 72
3.5.3 Fractional Crystallinity Calculated from TA-FTIR Data ............................................... 74
3.6 CONCLUSIONS. ........................................................................................................................... 75
CHAPTER FOUR: FTIR SPECTROSCOPIC ANALYSIS AND TWO-
DIMENSIONAL INFRARED CORRELATION SPECTROSCOPY OF PET
ON ISOTHERMAL CRYSTALLIZATION ......................................................... 78
4.1 INTRODUCTION. ......................................................................................................................... 78
4.2 BACKGROUND RESEARCH ON FTIR SPECTRUM OF PET ..................................................................... 79
4.3 TWO-DIMENSIONAL INFRARED SPECTROSCOPY. ............................................................................... 83
4.3.1 General Two-dimensional Correlation Spectroscopiy ................................................. 83
4.3.2 Principles of Two-dimensional Infrared Spectroscopy ................................................ 84
4.3.3 Using Two-dimensional Correlation to Judge Overlapping Peaks. ............................ 86
4.4 ISOTHERMAL CRYSTALLIZATION ON FTIR SPECTRUM AND TWO-DIMENSIONAL INFRARED SPECTROSCOPY
CORRELATION OF PET. ......................................................................................................................... 91
vi
4.4.1 Isothermal Crystallization on FTIR. ............................................................................. 91
4.4.2 Overview of 2D-Correlation of Main Region 1800~650 cm-1
. ..................................... 92
4.4.3 Methylene and Aromatic Stretching Region – 3500~2800 cm-1
. ................................ 95
4.4.4 The Carbonyl Stretching Region – 1800~1650 cm-1
. ................................................. 101
4.4.5 The Region 1600~1400 cm-1
....................................................................................... 105
4.4.6 The Region 1420~1320 cm-1
....................................................................................... 110
4.4.7 The Region 1320~1200 cm-1
....................................................................................... 113
4.4.8 The Region 1150~1050 cm-1
....................................................................................... 116
4.4.9 1050~990 cm-1
Region. .............................................................................................. 119
4.4.10 1000~750 cm-1
Region. ............................................................................................... 122
4.4.11 760~690 cm-1
Region. ................................................................................................. 124
4.5 CONCLUSIONS. ......................................................................................................................... 127
CHAPTER FIVE: THE KINETICS OF CRYSTALLIZATION OF POLY
(ETHYLENE TEREPHTHALATE) AS MEASURED BY FTIR
SPECTROSCOPY ................................................................................................. 131
5.1 INTRODUCTION. ....................................................................................................................... 131
5.2 RESULTS AND DISCUSSION. ........................................................................................................ 132
5.2.1 Changes in FTIR Spectrum of PET on Crystallization. ................................................ 132
5.2.2 The Self-Consistency of the Measurements. ............................................................. 138
5.2.3 Isotherm Crystallization Rate Study from FTIR Spectroscopy. ................................. 140
5.2.4 Secondary Crystallization. ......................................................................................... 149
5.2.5 The Temperature Dependence of the Crystallization. .............................................. 153
5.2.6 Research the Crystallization Behaviour by band at 1340 cm-1
. ................................ 155
5.3 CONCLUSIONS. ......................................................................................................................... 157
CHAPTER SIX: MELTING BEHAVIOUR AND SEEDED
CRYSTALLIZATION OF PET ........................................................................... 161
6.1 INTRODUCTION ........................................................................................................................ 161
6.2 BANKS AND SHARPLES’ MODEL OF SEEDED CRYSTALLIZATION ........................................................... 162
6.3 THE EFFECT OF CRYSTALLIZATION TEMPERATURE ON MELTING. ........................................................ 167
6.4 THE EFFECT OF CRYSTALLIZATION TIME ON MELTING BEHAVIOUR..................................................... 169
6.5 SEEDED CRYSTALLIZATION AS MEASURED BY DSC. ......................................................................... 172
6.6 LAMELLAR THICKNESS OF PET. ................................................................................................... 177
vii
6.7 SEEDED CRYSTALLIZATION AS STUDIED BY FTIR SPECTROSCOPY. ....................................................... 180
6.8 DISCUSSION. ........................................................................................................................... 183
6.9 SEEDED CRYSTALLIZATION ON HOT-STAGE MICROSCOPY. ................................................................ 187
6.10 CONCLUSION ............................................................................................................................ 191
CHAPTER SEVEN: CONCLUSION AND FUTURE WORK ......................... 193
7.1 CONCLUSION. .......................................................................................................................... 193
7.2 FUTURE WORK. ....................................................................................................................... 202
REFERENCE ......................................................................................................... 205
APPENDIX ............................................................................................................. 219
viii
List of Figures
Figure 1.1: The Chemical Repeat Unit of Poly(ethylene terephthalate). .................. 2
Figure 1.2: Chemical Structure of BHET. ................................................................ 2
Figure 1.3: Polymerization of Ethylene Terephthalate. ............................................ 2
Figure 1.4: Types of Crystal Nuclei.......................................................................... 7
Figure 1.5: Schematic Representation of Variation of Free Energy with Nucleus
Size for the Formation of a Stable Polymer Crystal Nucleus. .................................. 9
Figure 1.6: Model of the Growth Front. ................................................................. 10
Figure 1.7: Laurizen-Hoffman Model. ................................................................... 13
Figure 1.8: Three Regimes in the Nucleation. ........................................................ 14
Figure 1.9: Schematic Structure of Spherulites, Lamellae with Regular and
Irregular Chain Folds and Switchboard Lamellae. ................................................. 18
Figure 1.10: Optical Micrograph of Polymer Spherulites. ..................................... 20
Figure 1.11: Five Stages in the Formation of a Spherulite from Packing of
Lamellae.................................................................................................................. 21
Figure 2.1: A Diagram of the Michelson Interferometer. ....................................... 31
Figure 2.2: Nicolet Spectrophotometer, model Magna IR 8700. ............................ 32
Figure 2.3: Use “Find Peaks” Function of Omnic (A). First Time to Run Omnic
“Fix Peaks” Function (B). Lock the Position of Main Peaks and Reduce the
Number of Small Peaks (C). Rerun Omnic “Fix Peaks” Function (D). Adjust the

ix
Half Wave Width and Lorentzian Shape of Peaks then Repeat “Fix Peaks”
Function (E).
. .......................................................................................................................... 37-39
Figure 2.4: Spectrum of Isothermal Crystallization on FT-IR at 234 oC at 75
Minute Showing How the Overlapped Peaks is Divided. ...................................... 39
Figure 2.5: A Schematic Diagram of DSC System. ............................................... 40
Figure 2.6: The Perkin-Elmer DSC-7 and TAC 7/DZ. ........................................... 44
Figure 2.7: The Hot-stage Chamber with Optical Microscope. .............................. 46
Figure 3.1: Trans-2-Butene and Cis-2-Butene Structure. ....................................... 51
Figure 3.2: The DSC Analysis of PET. .................................................................. 51
Figure 3.3: The Relative Enthalpy Change on Heating and Cooling PET. ............ 53
Figure 3.4: The FTIR Spectrum of Amorphous PET, 1.5 µm Thick Film. ............ 55
Figure 3.5: Changes in the FTIR Spectra of Amorphous PET on Crystallization on
Cooling from 270 to 160oC. .................................................................................... 56
Figure 3.6: The Development of the Absorbances of the Bands in the Region
1350-1600 cm-1
with Temperature on Heating and Cooling. ................................. 57
Figure 3.7: A 3D Representation of the Region 1480-1600 cm-1
with Temperature
on Heating and Cooling. ......................................................................................... 58
Figure 3.8: The Change in Absorbance of the Trans Isomer at 1470 cm-1
with
Temperature Showing the Glass Transition Temperature, Tg, Cold Crystallization
Temperature, Tc1, and Melting Point, Tm on Heating and the Crystallization
Temperature, Tc2, on Cooling. ................................................................................ 61
Figure 3.9: The Change in Absorbance of the Cis Isomer at 1350 cm-1
with
Temperature Showing the Glass Transition Temperature, Tg, Cold Crystallization
x
Temperature, Tc1, and Melting Point, Tm, on Heating and the Crystallization
Temperature, Tc2, on Cooling. ................................................................................ 63
Figure 3.10: The Change in Absorbance of 1410 cm-1
Band with Temperature. ... 65
Figure 3.11: The Change in Peak Position of the 1410 cm-1
Band with
Temperature. ........................................................................................................... 66
Figure 3.12: The Change in Absorbance of with Temperature and on
Crystallization and Manelting at 1575 and 1505 cm-1
. ........................................... 68
Figure 3.13: Simulation of Type II Behaviour Generated from Summing a Pair
of Type I Bands at 1575 and 1505 cm-1
. ................................................................. 69
Figure 3.14: Ratio of Constant of 1470 and 1450 cm-1
Against Temperature. ....... 73
Figure 4.1: Synchronous (B) and Asynchronous (C) Two-Dimensional Correlation
Spectra Based on Two Overlapping Bands Changing Intensity in Opposite
Directions (A). ........................................................................................................ 87
Figure 4.2: Synchronous (B) and Asynchronous (C) Two-Dimensional Correlation
Spectra Based on Single Peaks Shifting Coupled with Intensity Changes (A). ..... 89
Figure 4.3: Selected FTIR Spectra of PET on Isothermal Crystallization at 234 oC
for 1000 Minutes. .................................................................................................... 92
Figure 4.4: Two-Dimensional Synchronous (A) and Asynchronous Correlation (B)
Spectra of the Region 1800-650 cm-1
. ............................................................... 94-95
Figure 4.5: Changes in Absorption in the Region 3500-2800 cm-1
with Time at 234
oC (A). Two-Dimensional Synchronous and Asynchronous (C) Correlation
Spectra of the Region 3620-3360 cm-1
(B & C) and 3100-2800 cm-1
(D & E). 96-98
Figure 4.6: Changes in Carbonyl Absorption with Time at 234 oC (A). Three and
Two-Dimensional Synchronous (B & C) and Asynchronous (D & E) Correlation
xi
Intensity Contour Map of the Carbonyl Absorption Band in Region
1800-1650 cm-1
. ............................................................................................. 102-104
Figure 4.7: Intensity Changes in Region 1600-1420 cm-1
Associated with the
Development of Crystallinity with Time (A). Two-Dimensional Synchronous
and Asynchronous Correlation Spectra in the Region 1590-1480 cm-1
(B & C) and
1490-1420 cm-1
(D & E) ................................................................................ 107-109
Figure 4.8: Intensity Changes in Region 1420-1320 cm-1
Associated with the
Development of Crystallinity with Time (A). Two-Dimensional Synchronous (B)
and Asynchronous(C) Correlation Spectra in the Region 1420-1320 cm-1
. .. 112-113
Figure 4.9: Changes in Intensity in the Region 1320-1200 cm-1
with Time (A).
Two-Dimensional Synchronous (B) and Asynchronous (C) CorrelationSpectra in
the Region 1320-1220 cm-1
with Time. ......................................................... 114-115
Figure 4.10: Changes in Peak Intensity with Time in the Region 1150-1050 cm-1
(A). Two-Dimensional Synchronous (B) and Asynchronous (C) Correlation
Spectra in the Region 1150-1050 cm-1
. ......................................................... 117-118
Figure 4.11: Change in Intensity of the PET Spectrum in Region 1050-990 cm-1
with Time (A). Two-Dimensional Synchronous (B) and Asynchronous (C) Spectra
of the Region 1050-990 cm-1
. ........................................................................ 120-121
Figure 4.12: Change in Intensity in Region 1000-750 cm-1
with Time (A).
Two-Dimensional Synchronous (B) and Asynchronous (C) Spectra of the Region
990-760 cm-1
. ................................................................................................. 123-124
Figure 4.13: Changes in Region 750-690 cm-1
with Time (A). Synchronous (B) and
Asynchronous (C) Correlation Spectra of the Region 750-690 cm-1
............. 125-126
xii
Figure 5.1: Changes to the shape and intensity of the Carbonyl Absorption Band
with time at 236oC. ............................................................................................... 134
Figure 5.2: Deconvolution of the Carbonyl Absorption Band into Crystalline and
Amorphous Absorption Bands At Time t (A)and Peak Changes (B) with Time
at 236oC. ............................................................................................................... 135
Figure 5.3: The Increase in Crystalline Absorbance of the Carbonyl Band at
1717 cm-1
with Time and the Dependence of the Relative Absorbance of the
Amorphous Band at 1727 cm-1
as a Function of Logarithm of Time Over the
Range of Crystallization Temperatures from 230-240 oC. ................................... 137
Figure 5.4: The Correlation between Absorbance of the Crystalline Band at
1717 cm-1
and the Fractional Crystallinity as Defined by the Absorbance of the
Amorphous Band at 1727 cm-1
. ............................................................................ 139
Figure 5.5: The Dependence of the Fractional Crystallinity and Amorphous
Content as a Function of Logarithm of Time over the Range of Crystallization
Temperatures Calculated from the Crystalline Band at 1717 cm-1
(A) and
Amorphous Band at 1727 cm-1
(B).. ...................................................................... 142
Figure 5.6: Analysis of the Primary Process to Determine Optimum Value by the
Effect of the Induction Time, ti (A) and Xp, inf (B); Xp,inf (C)and ti (D) on the Degree
of Fit. ............................................................................................................. 143-144
Figure 5.7: SEM Image of Thin Film Samples without Etching (A) and Etched
Samples Crystallized in DSC (B). ........................................................................ 146
Figure 5.8: Best Fit of n Values. ........................................................................... 148
Figure 5.9: Nucleation Control of Primary Crystallization. ................................. 149
Figure 5.10: The Fit of the Secondary Crystallization to an Avrami Equation (A).
The Temperature Dependence of Secondary Crystallization (B). ................. 151-151
Figure 5.11: Dependence of Half-lives on Degree of Super-cooling. .................. 155
xiii
Figure 5.12: Comparison the Changing Tendency of 1717 and 1340 cm-1
during
Isothermal Crystallization at 240 oC . ................................................................... 156
Figure 6.1: A Schematic of Seeded Crystallization. ............................................. 164
Figure 6.2: Microcopy Photo of PE Seeded Crystallization. ................................ 166
Figure 6.3: The Effect of Crystallization Temperature on Melting Range (A).
Hoffman-Week’s plot for PET (B). ...................................................................... 168
Figure 6.4: The Effect of Time on the Melting of PET crystallized at 228 oC. .... 169
Figure 6.5: The Effect of Time on the Melting of PET crystallized at 234oC ...... 170
Figure 6.6: Changes in Melting Points with Time ................................................ 171
Figure 6.7: The Effect of log (time) on the Heat of Fusion on Crystallizing at 228
and 234 oC. ........................................................................................................... 172
Figure 6.8: Melting Endotherm of Seeded Crystallization of PET Samples. Red
Dotted Curve for Crystallized at 234 oC for 50 min. Crystallized at 234
oC for
50min. and Heated to 250 oC (A) and 252
oC (B) and Held there for 1.5 to 950 min.
.............................................................................................................................. 174
Figure 6.9: The Variation of Melting Point with Time. Partial Melting at
250/252 oC. ........................................................................................................... 175
Figure 6.10: The Increase in Heat of Fusion with log (time) on Heating to
250/252 oC. ........................................................................................................... 176
Figure 6.11: Increase in Number of Repeat Unit in the Average Lamellae with
Time at Different Crystallization Temperatures. .................................................. 178
Figure 6.12: Increase in Number of Repeat Unit in the Largest Lamellae with Time
at Different Crystallization Temperatures. ........................................................... 179
xiv
Figure 6.13: The Change in Absorbance of Carbonyl Bands with Log (Time/ min)
Crystallization at 234 oC for 50 min and then at 244
oC. ..................................... 182
Figure 6.14: The Change in Absorbance of Carbonyl Bands with Log (Time/ min)
Crystallized at 234oC for 50 min and then at 250
oC. ........................................... 183
Figure 6.15: Fit of the Avrami Equation to the Development of Crystallinity with
Time for the Seeded Crystallization. .................................................................... 185
Figure 6.16: Dependence of Composite Rate Constant on Crystallization
Temperature. ......................................................................................................... 186
Figure 6.17: The Dependence of Composite Rate Constant (Z /s-n
) on the Amount
of Residual Crystallinity. ...................................................................................... 187
Figure 6.18: Hot-stage Microscopy Image of Seeded Crystallization of PET.
Crystallization at 234oC for 50 min (A), Partial Melting at 252
oC (B),
Seeded Crystallization at 252oC for 1000 min (C) and Cool Back to Room
Temperatture (D) ........................................................................................... 189-190
xv
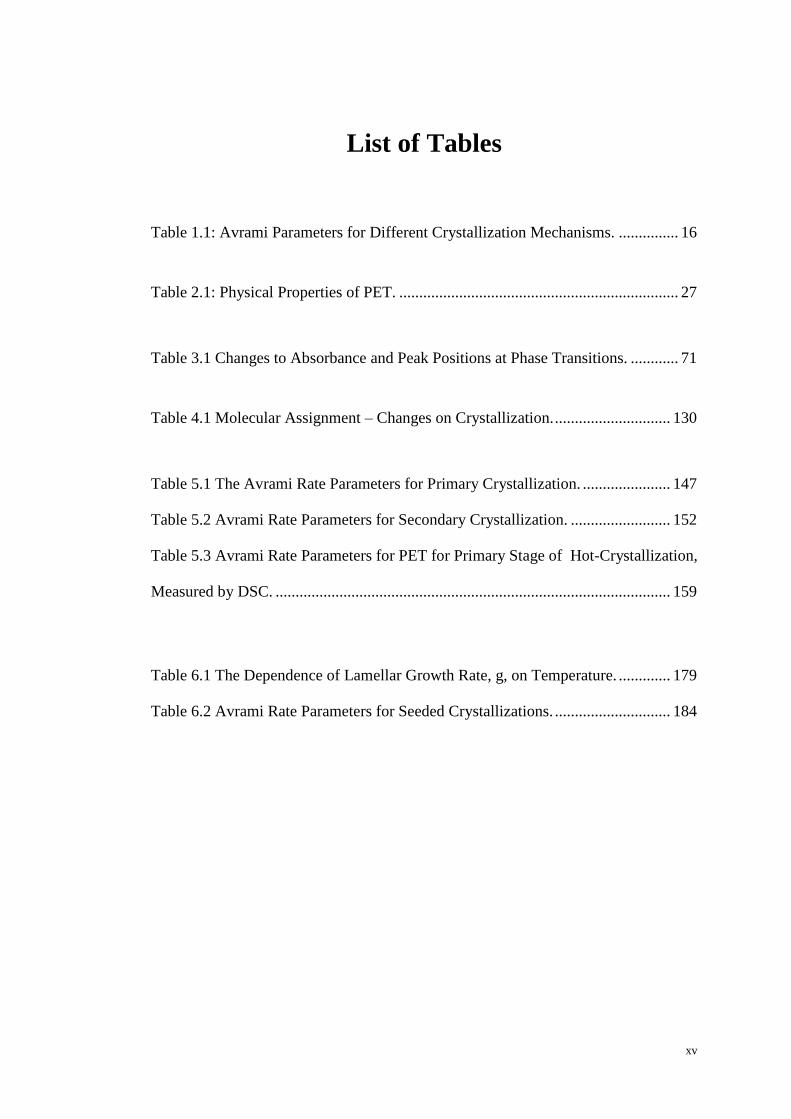
List of Tables
Table 1.1: Avrami Parameters for Different Crystallization Mechanisms. ............... 16
Table 2.1: Physical Properties of PET. ...................................................................... 27
Table 3.1 Changes to Absorbance and Peak Positions at Phase Transitions. ............ 71
Table 4.1 Molecular Assignment – Changes on Crystallization. ............................. 130
Table 5.1 The Avrami Rate Parameters for Primary Crystallization. ...................... 147
Table 5.2 Avrami Rate Parameters for Secondary Crystallization. ......................... 152
Table 5.3 Avrami Rate Parameters for PET for Primary Stage of Hot-Crystallization,
Measured by DSC. ................................................................................................... 159
Table 6.1 The Dependence of Lamellar Growth Rate, g, on Temperature. ............. 179
Table 6.2 Avrami Rate Parameters for Seeded Crystallizations. ............................. 184
xvi
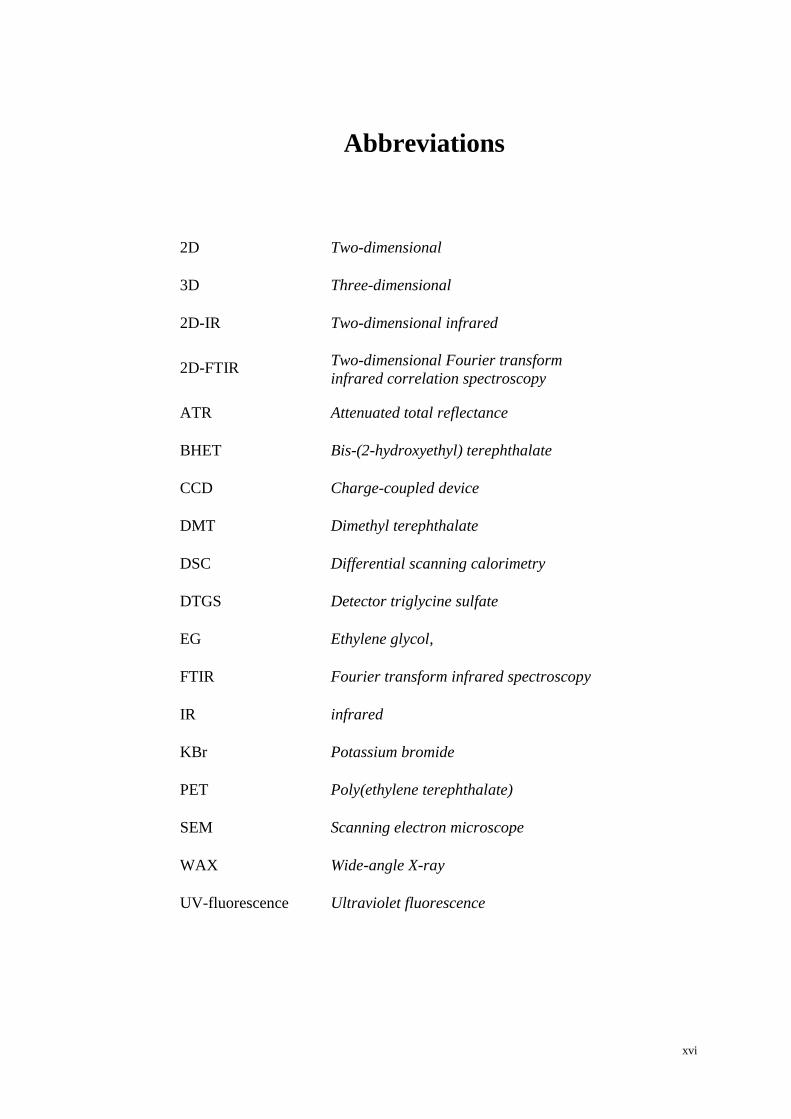
Abbreviations
2D Two-dimensional
3D Three-dimensional
2D-IR Two-dimensional infrared
2D-FTIR Two-dimensional Fourier transform
infrared correlation spectroscopy
ATR Attenuated total reflectance
BHET Bis-(2-hydroxyethyl) terephthalate
CCD Charge-coupled device
DMT Dimethyl terephthalate
DSC Differential scanning calorimetry
DTGS Detector triglycine sulfate
EG Ethylene glycol,
FTIR Fourier transform infrared spectroscopy
IR infrared
KBr Potassium bromide
PET Poly(ethylene terephthalate)
SEM Scanning electron microscope
WAX Wide-angle X-ray
UV-fluorescence Ultraviolet fluorescence
xvii
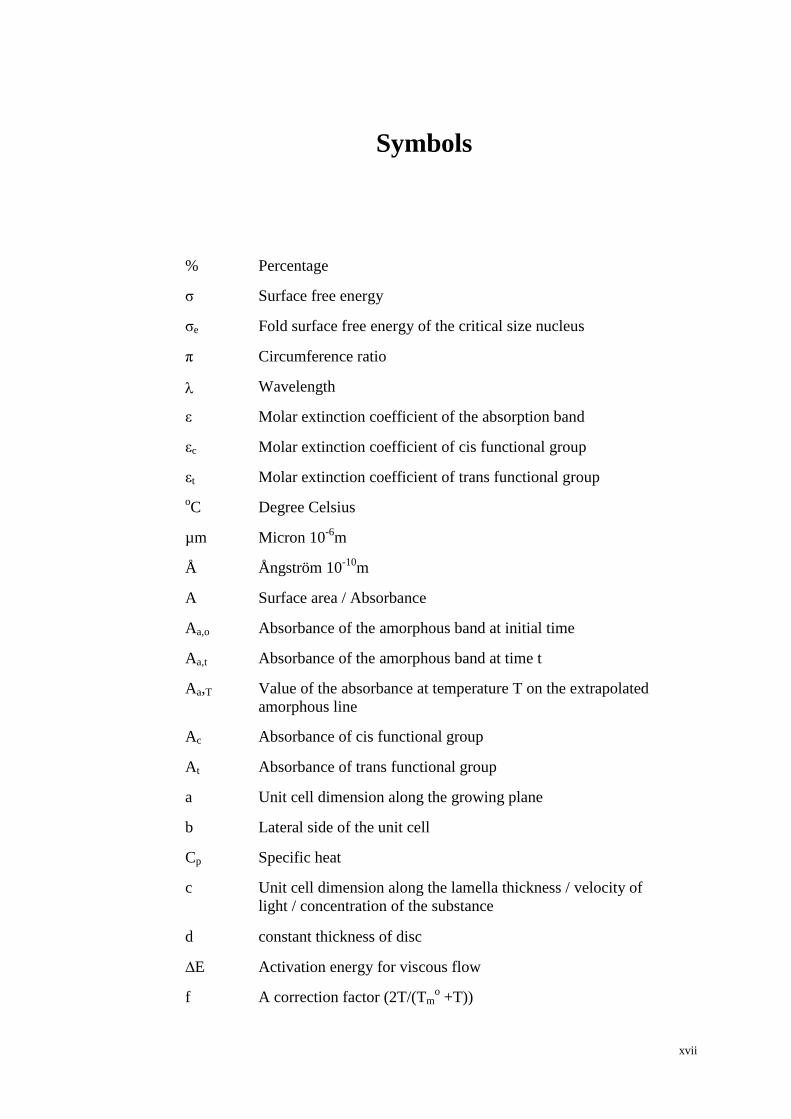
Symbols
% Percentage
σ Surface free energy
σe Fold surface free energy of the critical size nucleus
π Circumference ratio
Wavelength
ε Molar extinction coefficient of the absorption band
εc Molar extinction coefficient of cis functional group
εt Molar extinction coefficient of trans functional group
oC Degree Celsius
µm Micron 10-6
m
Å Ångström 10-10
m
A Surface area / Absorbance
Aa,o Absorbance of the amorphous band at initial time
Aa,t Absorbance of the amorphous band at time t
Aa,T Value of the absorbance at temperature T on the extrapolated
amorphous line
Ac Absorbance of cis functional group
At Absorbance of trans functional group
a Unit cell dimension along the growing plane
b Lateral side of the unit cell
Cp Specific heat
c Unit cell dimension along the lamella thickness / velocity of
light / concentration of the substance
d constant thickness of disc
∆E Activation energy for viscous flow
f A correction factor (2T/(Tmo +T))
xviii
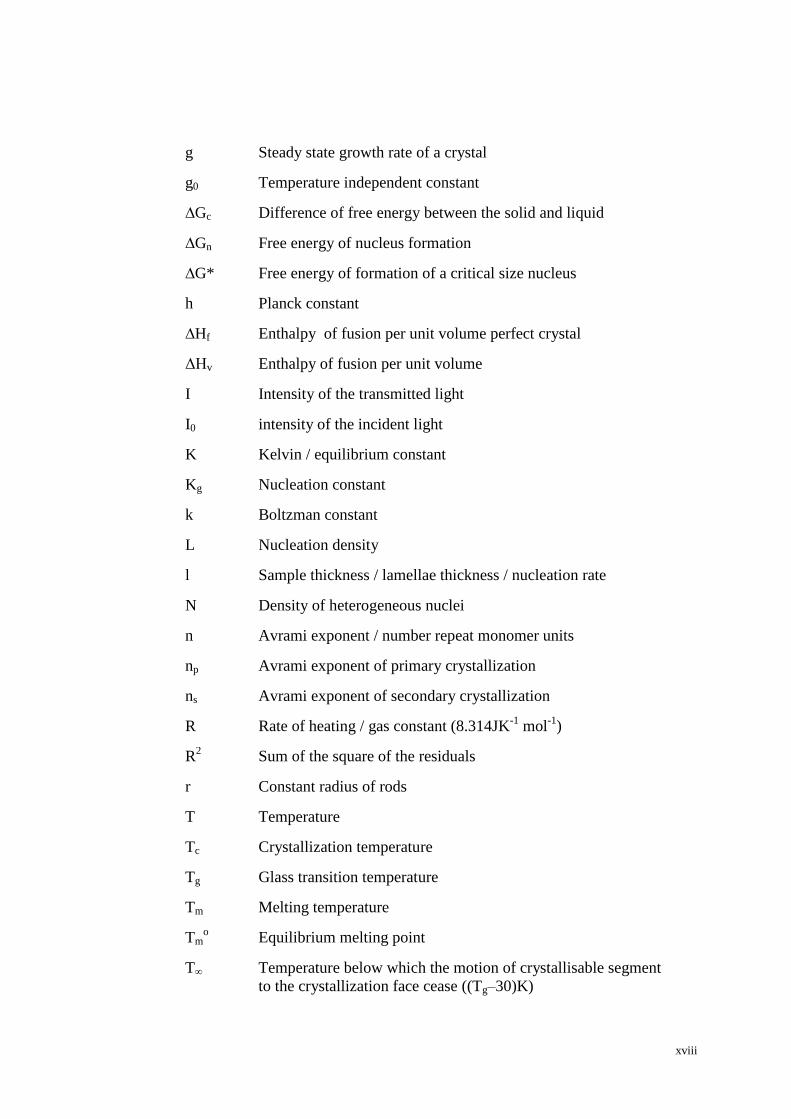
g Steady state growth rate of a crystal
g0 Temperature independent constant
∆Gc Difference of free energy between the solid and liquid
∆Gn Free energy of nucleus formation
∆G* Free energy of formation of a critical size nucleus
h Planck constant
∆Hf Enthalpy of fusion per unit volume perfect crystal
ΔHv Enthalpy of fusion per unit volume
I Intensity of the transmitted light
I0 intensity of the incident light
K Kelvin / equilibrium constant
Kg Nucleation constant
k Boltzman constant
L Nucleation density
l Sample thickness / lamellae thickness / nucleation rate
N Density of heterogeneous nuclei
n Avrami exponent / number repeat monomer units
np Avrami exponent of primary crystallization
ns Avrami exponent of secondary crystallization
R Rate of heating / gas constant (8.314JK-1
mol-1
)
R2 Sum of the square of the residuals
r Constant radius of rods
T Temperature
Tc Crystallization temperature
Tg Glass transition temperature
Tm Melting temperature
Tmo Equilibrium melting point
T∞ Temperature below which the motion of crystallisable segment
to the crystallization face cease ((Tg–30)K)
xix
t Time
ti Induction time
tp,f, Time corresponding to the value of Xp,f
t1/2 Half-life of crystallization
∆T Degree of supercooling (∆T = Tmo – Tc)
W Wavenumber
Xa Amorphous weight fraction,
Xa,t Amorphous weight fraction at time t
Xc Crystalline weight fraction
Xc,t Fractional crystallinity at time t
Xp,t, Fractional crystallinity developed at time t of primary process
Xp, inf Fractional crystallinity developed at the end of primary process
Xp,f Residual crystallinity left after partial melting
Xs,f Final crystallinity achieved by the seeded crystallization
Xs.∞ Fractional crystallinity at the end of secondary process
Xt Fractional crystallinity
ν Frequency
U* Activation energy for viscous flow (6300 J/mol)
Z Composite rate constant
Zp Composite rate constant of primary crystallization
Zs Composite rate constant of secondary crystallization /
composite rate constant of seed crystallization

1
Chapter One
Introduction
1.1 Poly(ethylene terephthalate)
Poly(ethylene terephthalate), PET, is a well established engineering polymer
used in the manufacture of fibres, films, tapes, and bottles as well as in moulding
powders and the production of composite materials. Amorphous, un-oriented PET is
of little commercial interest because of its poor mechanical properties, higher gas
permeation, lower dimensional stability and higher extensibility. The physical and
mechanical properties of PET, however, can be significantly improved by
crystallization and orientation. Modification of the microstructure can be achieved by
changing the crystallization rate, the extent of crystallinity and orientation. The
degree and quality of crystallinity have long been recognized as having a dominant
influence upon the properties of PET.

2
Figure 1.1 The Chemical Repeat Unit of Poly(ethylene terephthalate).
1.1.1 Production of PET
There are several current manufacturing techniques used to produce PET. One
of the commonest is synthesizing it from dimethyl terephthalate, DMT, and ethylene
glycol, EG, by transesterification [1, 2], carried out with a catalyst, to produce bis-(2-
hydroxyethyl) terephthalate, (BHET), i.e.
Figure 1.2 Chemical Structure of BHET.
and by subsequent condensation steps BHET reacts further to produce oligomers and
then polymers of ethylene terephthalate by the elimination of ethylene glycol units.
Figure 1.3 Polymerization of Ethylene Terephthalate.
3
Catalysts used in the condensation reaction are usually blends of antimony
trioxide with manganese acetate, calcium acetate, zinc acetate or cobalt acetate. The
amount of catalyst is controlled to 0.01-0.05% of the mass of DMT. It has been
reported [3] that the first step is catalyzed mainly by the acetates and the second step
by the antimony trioxide. A by-product of the first step, methanol, is kept to a
minimum and distilled from the reactor.
The initial product is then heated under reduced pressure to eliminate ethylene
glycol. The viscous molten mass is extruded using nitrogen pressure from the
reaction vessel in the form of a ribbon at about 275oC and is quenched with cold
water. The amorphous ribbon is broken into small pieces mechanically or further
fabricated into moulding pellets [4].
1.1.2 Commercial Uses of PET.
PET is of great commercial importance, being produced with one of the highest
tonnage of all polymer products in the world. It is a hard, stiff, strong, dimensionally
stable material that absorbs very little water and is used in the production of synthetic
fibre, textiles and fabrics [5]. Synthetic fibres have been produced for many years
with some of the most famous commercial names, such as Dacron, Trevira and
Terylene. Although in comparison with natural fibres such as cotton, linen and hemp,
4
PET fabrics have a somewhat synthetic feel athough they do have the advantage of
better crease and wrinkle resistance. However, PET is widely mixed with natural
fibres to produce a product with the advantages of both fibres.
With the properties being lightweight, strong and transparent when oriented
amorphous along with excellent barrier properties for oxygen and carbon dioxide
PET has increasingly dominated the bottle market for carbonated soft drinks and
bottled water [5, 6]. For similar reasons it has been used for manufacturing food
container and packaging material. With increasing recycling of PET bottle and
container many of the initial criticisms of the use of such an expensive material as
PET has been silenced and accounts for the increasing consumption of the polymer
worldwide [7].
The biaxially orientated and thermally stabilized films of PET have found an
important commercial market for capacitors, graphics, film base and recording tapes
etc [5]. In recent years, PET has increasingly been used in manufacturing fibre
reinforced composites and with high tensile fibres should find important applications
in the defence industry for body protection applications.
5
1.2 Kinetics of Polymer crystallization
1.2.1 Polymer crystallization
Crystallization process involves the transformation of a liquid phase into a
crystalline phase associated with partial alignment of its molecular chains. It
normally happens in the temperature range between the glass transition temperature,
Tg, and the melting point of the polymer. In this temperature region the chain
segments are sufficiently mobile to adopt the required conformations for
crystallization, i.e. trans conformation. Below Tg, the conformational motion is
frozen but becomes highly mobile above Tm [8].
Generally, bulk crystallized polymer can attain 10-80% crystallinity and is
considered to be semi-crystalline. The crystallization abilities depend on the polymer
tacticity, the stiffness of the chain, bulkiness, polarity of side groups and
microstructure of polymers. External factors also affect the overall rate of
crystallization and degree of crystallinity, such as cooling rate, nucleating agents,
orientation and drawing rate in the melt [8]. Polymer chains with symmetrical
structure or a high degree of stereoregularity and strong polar interactions are more
readily crystallized while atactic, branched, cross-linked polymer chains or those
containing impurities groups such as comonomer units will retard the crystallization
process [8].
6
1.2.2 Nucleation.
When a molten polymer is cooled the polymer chains tend to align and form
small ordered regions, called nuclei, within the disordered melt. The spontaneous
process of forming an ordered domain is called homogeneous nucleation and refers
to the first act of developing a new phase from another phase. The ordering process
can occur on the surface of heterogeneous particles, e.g. dust and other solid
impurities and this is referred to as heterogeneous nucleation. Heterogeneous
nucleation is thermodynamically more favorable than homogeneous and occurs at
lower degree of super-cooling than homogeneous as a result it is the most commonly
encountered form of nucleation in polymer crystallization.
The initial production of the nucleus is called primary nucleation but growth
occurs by nucleation of layers on the surface by the formation of secondary and
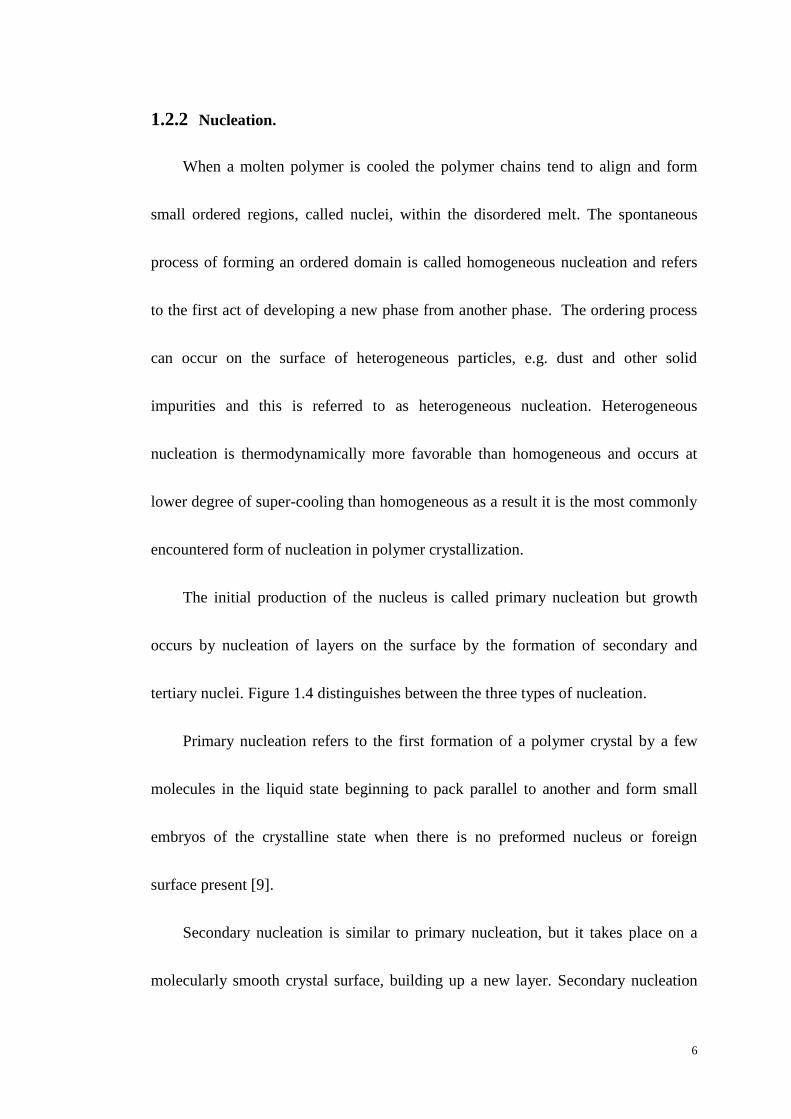
tertiary nuclei. Figure 1.4 distinguishes between the three types of nucleation.
Primary nucleation refers to the first formation of a polymer crystal by a few
molecules in the liquid state beginning to pack parallel to another and form small
embryos of the crystalline state when there is no preformed nucleus or foreign
surface present [9].
Secondary nucleation is similar to primary nucleation, but it takes place on a
molecularly smooth crystal surface, building up a new layer. Secondary nucleation
7
has a lower free energy of formation than primary since it has a lower surface area to
volume ratio and will develop at lower degree of super-cooling.
Tertiary nucleation occurs along an existing crystal edge and involves two
neighbouring surfaces of a crystal. It has the lowest free energy barrier to growth as
the two crystal faces provide a sufficient number of irregularities to be new
crystallization sites.
Figure 1.4 Types of Crystal Nuclei.
Crystallization is unable to start in the melt unless the temperature of the melt, T,
drops below the melting point, Tm, and there is some supercooling, ΔT = Tm - T,
The free energy of formation of the nucleus,
∆𝐺𝑛𝑢𝑐𝑙𝑒𝑖 = ∆𝐺𝑐 + Σ𝜎𝐴 (1.1)
8
contains two competing free energy terms, ∆Gc and ΣσΑ. The first is the volume
free energy difference between the solid (nuclei) and liquid. Below the melting
point this is negative in value as the free energy of the melt is greater than that of
the crystal and also increases with decreasing temperature. The second is the
surface free energy, σ, multiplied by the surface area, A, and is always positive in
value. σ and A are the surface free energy derived from the various crystal surface
present and the corresponding surface area. The production of a surface between the
melt and the nucleus requires the expenditure of the surface free energy and is
proportional to the surface area. Accumulating more molecules to the crystal causes
the decrease in free energy proportional to the volume of the nucleus. Depending on
the geometric shape of the nucleus, the volume term will eventually dominate over
the surface and a point is reached, called the critical size when further accumulation
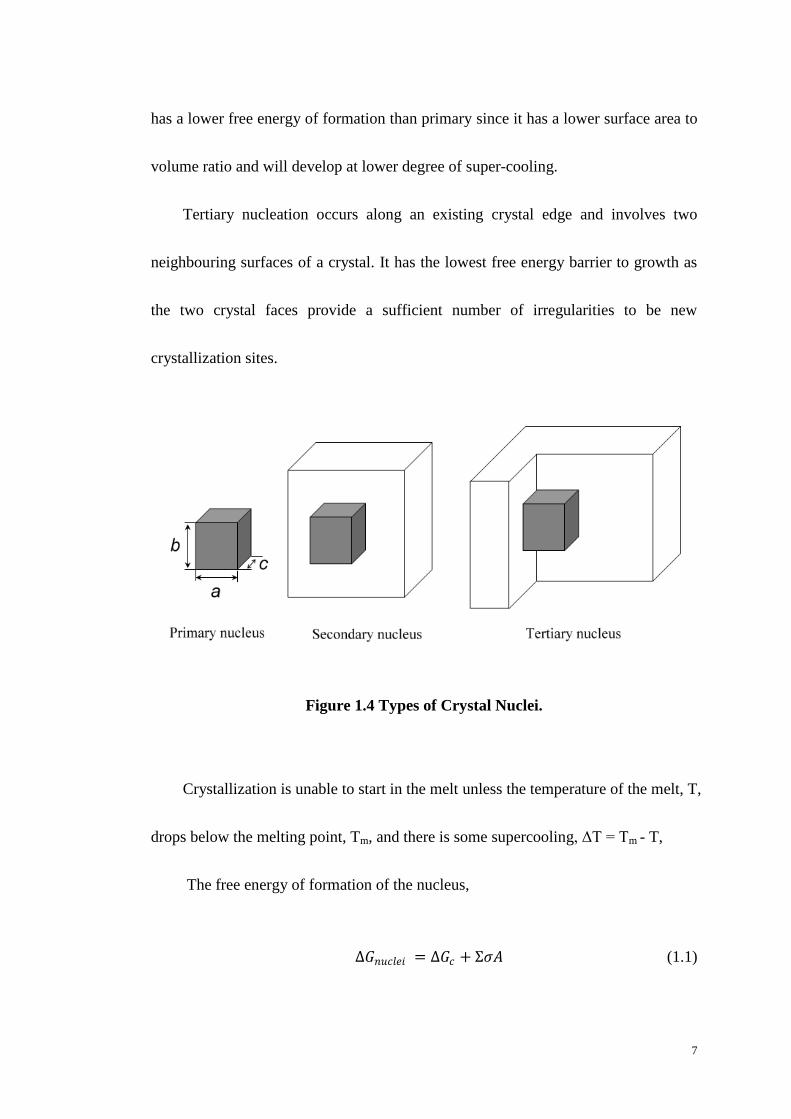
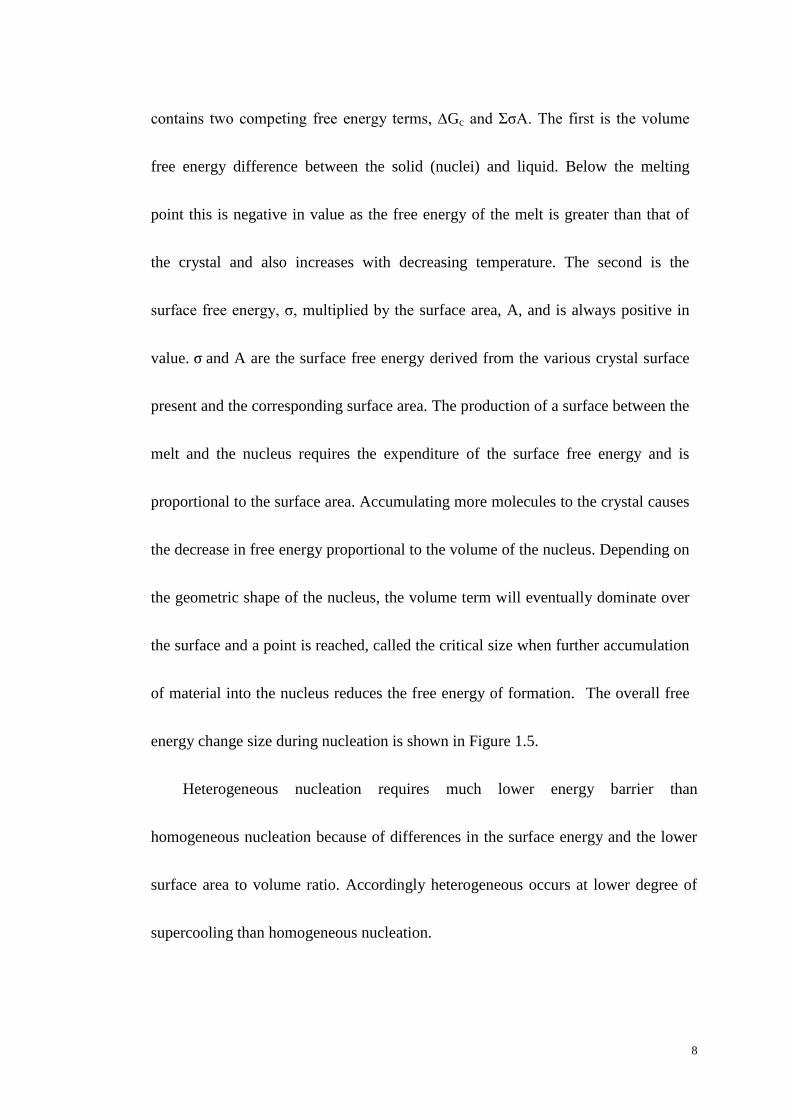
of material into the nucleus reduces the free energy of formation. The overall free
energy change size during nucleation is shown in Figure 1.5.
Heterogeneous nucleation requires much lower energy barrier than
homogeneous nucleation because of differences in the surface energy and the lower
surface area to volume ratio. Accordingly heterogeneous occurs at lower degree of
supercooling than homogeneous nucleation.
9
Figure 1.5 Schematic Representation of Variation of Free Energy with Nucleus
Size for the Formation of a Stable Polymer Crystal Nucleus [8].
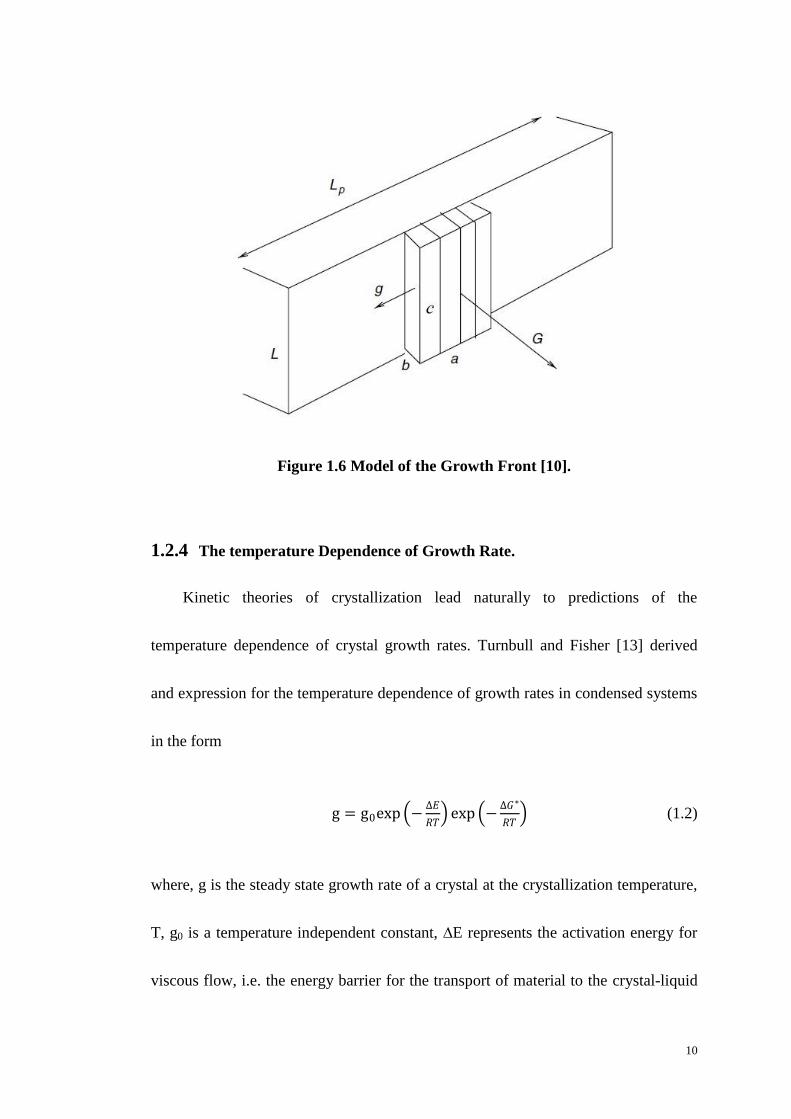
1.2.3 Crystal Growth.
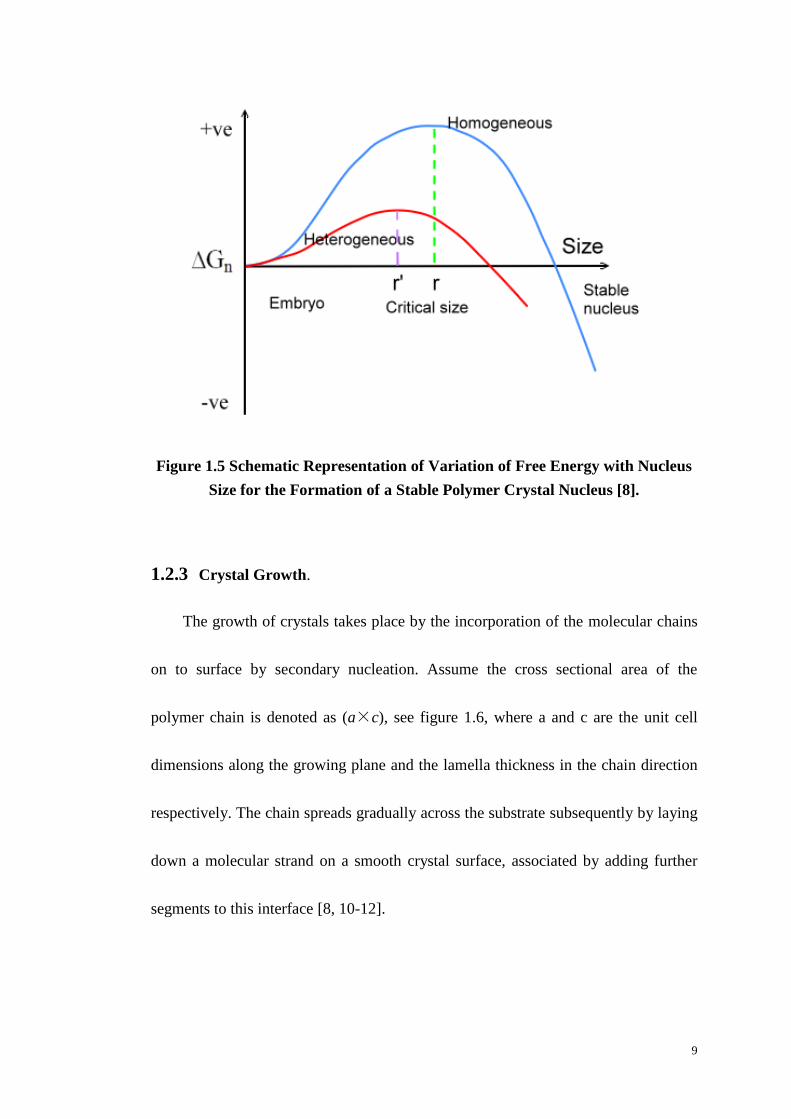
The growth of crystals takes place by the incorporation of the molecular chains
on to surface by secondary nucleation. Assume the cross sectional area of the
polymer chain is denoted as (a×c), see figure 1.6, where a and c are the unit cell
dimensions along the growing plane and the lamella thickness in the chain direction
respectively. The chain spreads gradually across the substrate subsequently by laying
down a molecular strand on a smooth crystal surface, associated by adding further
segments to this interface [8, 10-12].
10
Figure 1.6 Model of the Growth Front [10].
1.2.4 The temperature Dependence of Growth Rate.
Kinetic theories of crystallization lead naturally to predictions of the
temperature dependence of crystal growth rates. Turnbull and Fisher [13] derived
and expression for the temperature dependence of growth rates in condensed systems
in the form
g = g0exp −∆𝐸
𝑅𝑇 exp −
∆𝐺∗
𝑅𝑇 (1.2)
where, g is the steady state growth rate of a crystal at the crystallization temperature,
T, g0 is a temperature independent constant, ∆E represents the activation energy for
viscous flow, i.e. the energy barrier for the transport of material to the crystal-liquid
11
interface, ∆G* is free energy of formation of a critical size nucleus and R is the gas
constant (8.314 JK-1
mol-1
). At low crystallization temperatures close to the Tg, the
first term is dominant and the crystal growth rate is determined by chain diffusion to
the growth front. At much higher temperatures close to Tm, the second term is the
primary factor and nucleation is the controlling factor. The growth rate g of a crystal
has a bell shaped dependence on temperature as predicted by Gibbs Thomson
equation [14].
Hoffman and Lauritzen [8, 15-22] have modified the Turnbull-Fisher equation
for polymer crystallization and describe the temperature dependence of linear growth
rate as
g = g0exp −𝑈∗
𝑅 𝑇𝑐−𝑇∞ exp −
𝐾g
𝑇 ∆𝑇 ƒ (1.3)
where, g is the crystal growth rate, g0 is the jump rate pre-exponential constant,
i.e. kT/h; U* is the activation energy for the transport of crystallizing units across the
liquid-solid interfaces (assigned a value of 6300 Jmol-1
by Hoffman); T is the
crystallization temperature; T∞ is the hypothetical temperature where segmental
chain motion ceases (usually assumed to be equivalent to (Tg–30) K); ∆T is the
degree of supercooling, equal to (Tmo – Tc); f is a correction factor which reflects the
12
reduction in the latent enthalpy of fusion, ∆hf as temperature is decreased given by
2T/(Tmo +T); Tm
o is the equilibrium melting point.
Kg is the nucleation constant whose value depends on the type of nucleation
adopted and includes molecular structure information, i.e.
𝐾g =𝑛𝑏𝜎 𝜎𝑒𝑇𝑚
𝑜
∆𝐻ƒ𝑘
(1.4)
where b is the lateral side of the unit cell; k is Boltzman constant; ∆Hf is the heat of
fusion per unit volume perfect crystal; σ and σe are the lateral and fold surface free
energy of the critical size nucleus respectively. The value of n depends on the
nucleation regime as defined by Hoffman and Lauritzen [15, 23, 24]. Accordingly,
the dependence of the radial growth of spherulites on the degree of supercooling, ∆T,
were analyzed by Eq.[1.4], assuming that the fold length is the same and it grew at
the same rate as the radial expansion of the spherulite; there was no imperfect growth
of crystal face and no crystal thickening.
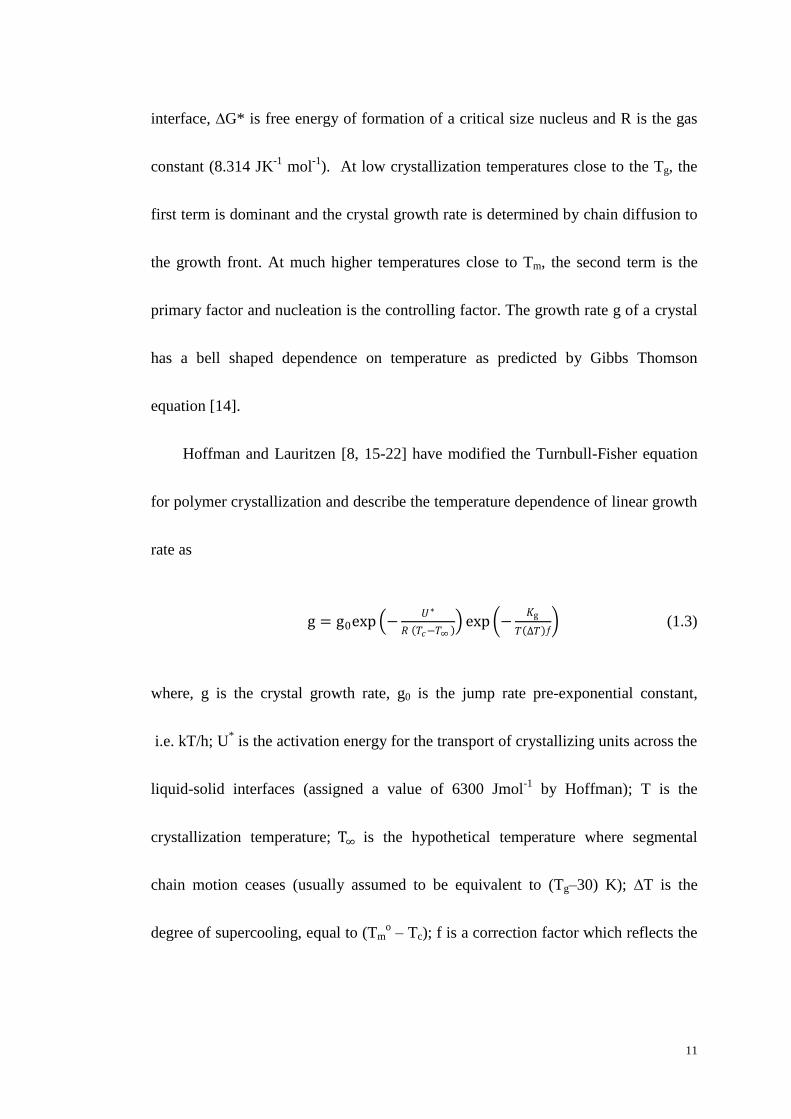
Base on these assumptions, Lauritzen and Hoffman created three regimes to
describe three different nucleation mechanisms according to the relative rates of the
secondary nucleation on the surface and extension of the polymer chain growth along
the surface after nucleation has occurred. The three regimes are designated I, II and
III, as shown in Figure 1.7.
13
Figure 1.7 Laurizen-Hoffman Model [10].
Regime I occurs when the degree of supercooling is small and the rate of
nucleation is low compared to the rate of covering the surface. In this case,
secondary nucleation dominates linear growth. In other word, the crystal growth rate
is significantly greater than secondary nucleation rate. Once a single surface nucleus
has formed, the chains will be fully incorporated on to the growing crystal surface
before another nucleus occurs (figure 1.7B). The n value in Eq.[1.4] is 4.
Regime II occurs at higher supercooling and when the crystal growth rate
becomes comparable to or smaller than the secondary nucleation rate, i.e. the
extension rate of the polymer folding along the surface is approximately equal with
the secondary nucleation rate. Each crystal surface will experience some covering
due to nucleation and these formed nuclei will have time to cover the remainder of
the surface. The value of n is equal to 2.
14
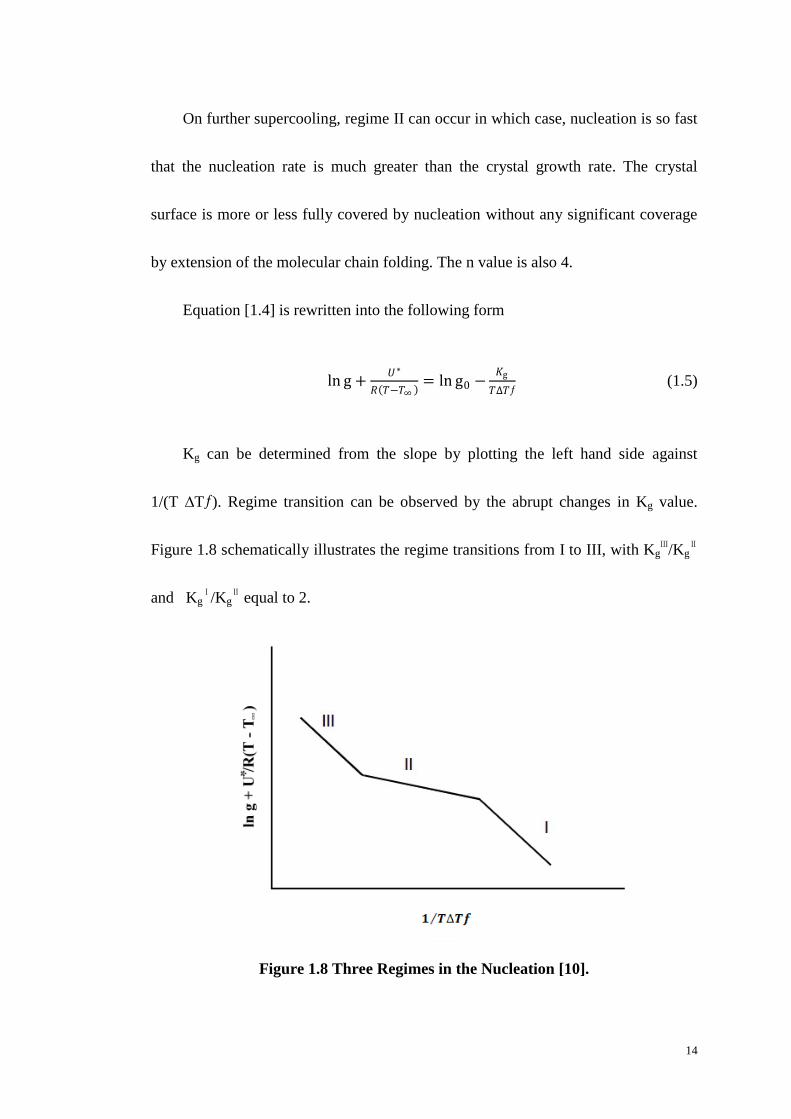
On further supercooling, regime II can occur in which case, nucleation is so fast
that the nucleation rate is much greater than the crystal growth rate. The crystal
surface is more or less fully covered by nucleation without any significant coverage
by extension of the molecular chain folding. The n value is also 4.
Equation [1.4] is rewritten into the following form
ln g +𝑈∗
𝑅 𝑇−𝑇∞ = ln g0 −
𝐾g
𝑇∆𝑇ƒ (1.5)
Kg can be determined from the slope by plotting the left hand side against
1/(T ∆Tƒ). Regime transition can be observed by the abrupt changes in Kg value.
Figure 1.8 schematically illustrates the regime transitions from I to III, with KgⅢ/Kg
Ⅱ
and KgⅠ/Kg
Ⅱ equal to 2.
Figure 1.8 Three Regimes in the Nucleation [10].
15
1.2.5 The Avrami Equation.
The kinetics of phase change on crystallization has been described by the
Avrami model [25, 26]. Many people research on it [27-34] in which the approach
has been highly successful in describing crystallization of polymers [35]. The model
relates the fractional crystallinity to time [25, 26, 36], such that
1 − Xt = exp (−Ztn) (1.6)
In which Xt is the fractional crystallinity, which has developed at time t, Z is a
composite rate constant incorporating nucleation and growth characteristics. The
Avrami exponent, n, is a constant depending on the crystallization mechanism and
the geometry of the growing crystal. Table 1.1 lists the corresponding expressions for
the listed mechanisms n and Z below [8, 35].
However, the Avrami equation has many limitations. The variation in the
crystalline density within the spherulite boundary throughout the crystallization
process give fractional n values and this value assumed to be constant in the Avrami
equation. In addition to assuming random nucleation in a super cooled melt, Avrami
equation was derived with the following assumption [8, 35, 37]:
1. The rates of nucleation and growth are constant with time.
2. Only primarily and no secondary crystallization process is present
16
3. The volume of the system remains constant during crystallization.
4. When crystallites impinge with one another growth ceases.
5. The crystallites keep their shape in one, two or three dimension (rods, discs or
sphere, respectively) until impingement take place.
6. There is no induction time before crystallization.
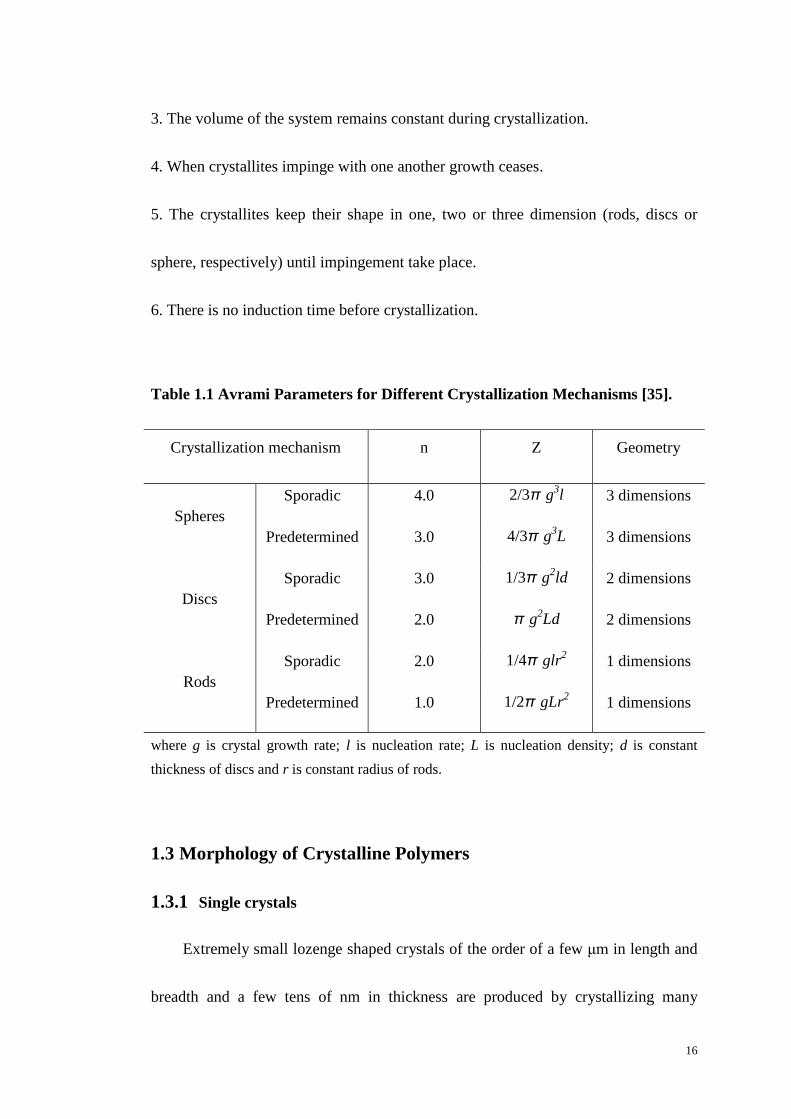
Table 1.1 Avrami Parameters for Different Crystallization Mechanisms [35].
Crystallization mechanism n Z Geometry
Spheres
Sporadic 4.0 2/3π g3l 3 dimensions
Predetermined 3.0 4/3π g3L 3 dimensions
Discs
Sporadic 3.0 1/3π g2ld 2 dimensions
Predetermined 2.0 π g2Ld 2 dimensions
Rods
Sporadic 2.0 1/4π glr2 1 dimensions
Predetermined 1.0 1/2π gLr2 1 dimensions
where g is crystal growth rate; l is nucleation rate; L is nucleation density; d is constant
thickness of discs and r is constant radius of rods.
1.3 Morphology of Crystalline Polymers
1.3.1 Single crystals
Extremely small lozenge shaped crystals of the order of a few μm in length and
breadth and a few tens of nm in thickness are produced by crystallizing many

17
polymers from dilute solutions. These crystals has a unique morphology in that the
polymer chains lie parallel to the thickness of the lamellae and since the extended
chain length is many times the thickness of the lamellae the polymer molecules has
to fold regularly backwards and forwards across the lamellae thickness. The chains
are observed to fold by adjacent re-entry into the crystal and a very regular fold
surface is produced. Using this as a model for the lamellae produced from melt
crystallized polymers three structures have been adopted for the lamellae crystallized
from the melt [38].
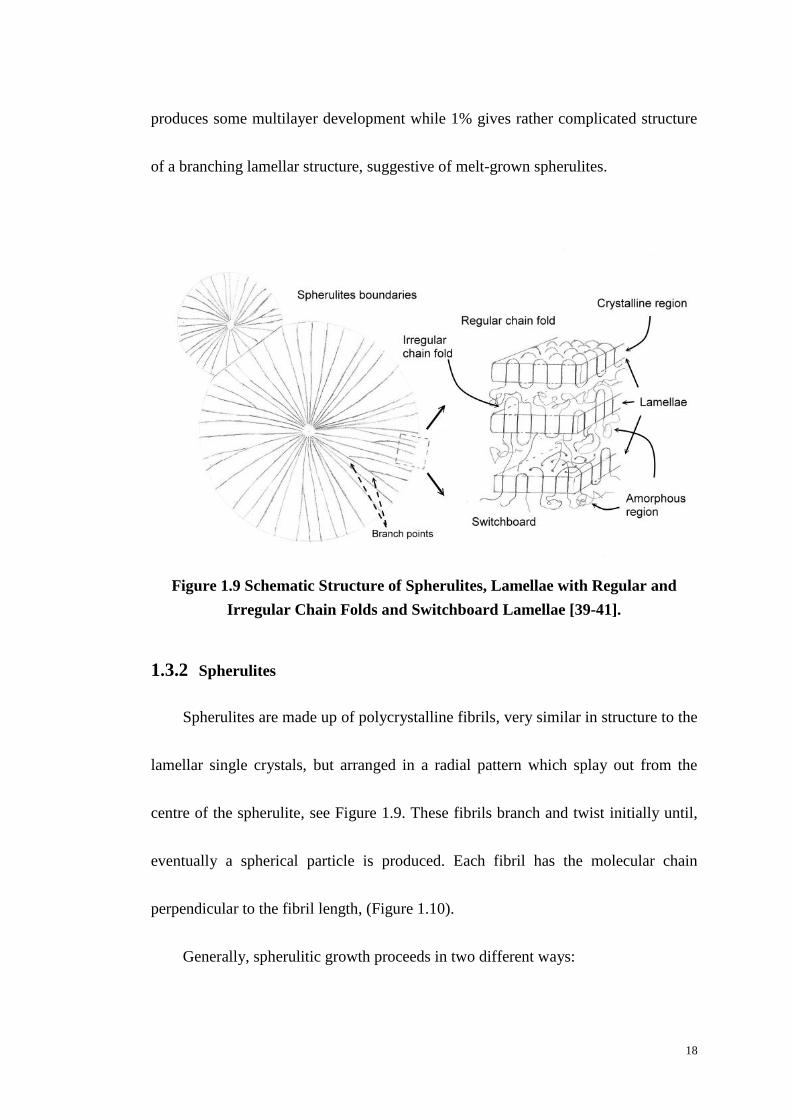
(a) The regular model, with adjacent re-entry folds; (Figure 1.9 upper right)
(b) The irregular model, with some limited amount of adjacent re-entry fold
(Figure 1.9 right mid) and
(c) The switchboard model, with non-adjacent re-entry folds and an amorphous
layer on either side of the lamellae. (Figure 1.9 lower right)
The fold length increases with increasing crystallization temperature, or
decreasing supercooling and also increasing pressure. Usually, the thicknesses of the
lamellae are of the order of 10 nm, whereas the other dimensions of the lamella are
very larger, typically of the order of several μm.
It is normally the case that the more dilute solutions produce the least
complicated crystal. Concentration of 0.01% usually gives monolayers, 0.1%
18
produces some multilayer development while 1% gives rather complicated structure
of a branching lamellar structure, suggestive of melt-grown spherulites.
Figure 1.9 Schematic Structure of Spherulites, Lamellae with Regular and
Irregular Chain Folds and Switchboard Lamellae [39-41].
1.3.2 Spherulites
Spherulites are made up of polycrystalline fibrils, very similar in structure to the
lamellar single crystals, but arranged in a radial pattern which splay out from the
centre of the spherulite, see Figure 1.9. These fibrils branch and twist initially until,
eventually a spherical particle is produced. Each fibril has the molecular chain
perpendicular to the fibril length, (Figure 1.10).
Generally, spherulitic growth proceeds in two different ways:
19
(a) Primary crystallization. The spherulite is considered to grow from an initial
fibril, or lamella, produced as a primary nucleus. Crystal growth is favoured along
the crystallographic a and b axis of the unit cell and is restricted in the c axis to a few
nm such that the nucleus grows into a thin fibre or sheet. Branching occurs
repeatedly at the growth fronts and a branching lamellar structure is produced. These
branches bend and twist as they grow, and also branch further to produce a spherical
boundary growing radial from the initial primary nucleus. The final result is the
production of spherical particles which develop radially outwards from the nucleus
until stopped by impinging with neighbouring particles.
(b) Secondary crystallization. This process is growth by filling in the interstices
between the lamellae, transforming a portion of the remaining amorphous material
between the lamellae and thickening the lamellae or producing new lamellae between
the original lamellae. The two effects must be reflected in the isothermal growth
kinetics and the relative importance of the two depends on the constitution of the
melt and thermal history.

20
Figure 1.10 Optical Micrograph of Polymer Spherulites
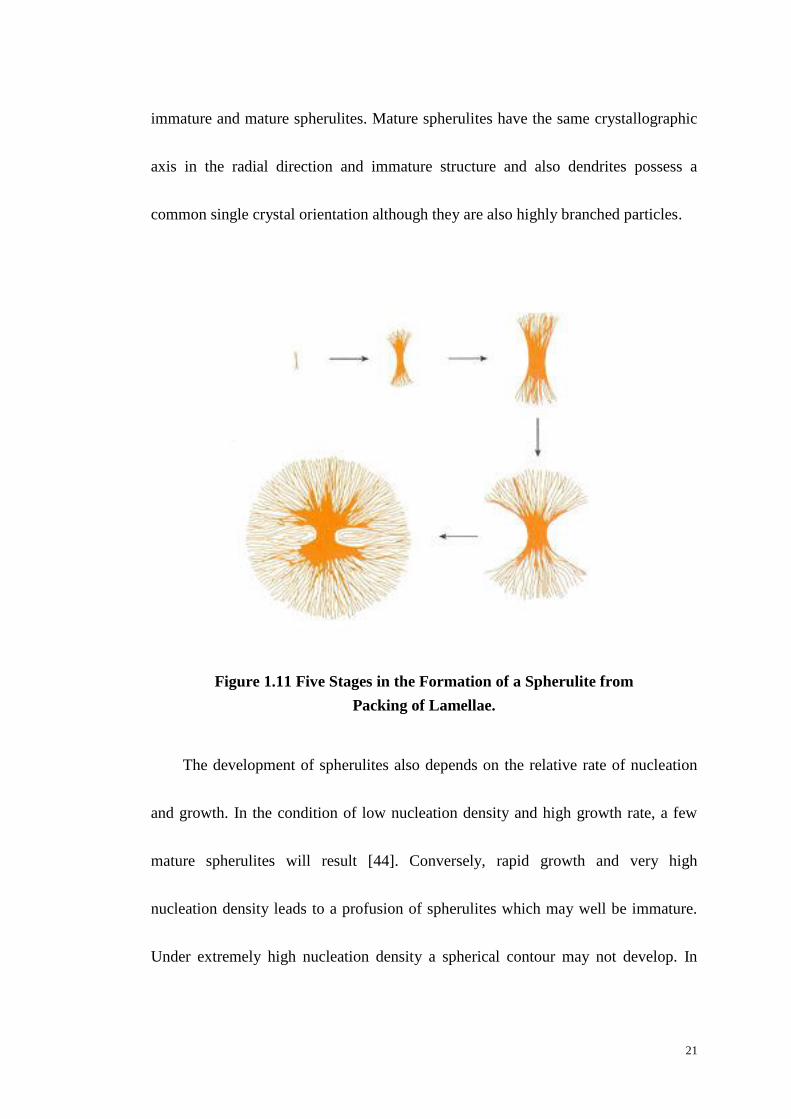
Figure 1.11 depicts the development of a spherulite at various stages in its
growth. The growth of a spherulite initially begins with a bundle of lamellae, which
evolves into a sheaf. The sheaf keeps growing and spreading laterally by branching,
of the lamellae until it ultimately develops a spherical contour [42]. Growth of the
spheres continues radially until the spherulite impinges with its neighbours when it
stops at the point of contact.
Most spherulites viewed under polarized light exhibit Maltese cross
birefringence which is evidence for the above radiating lamellar structure. The
Maltese cross indicates that the spherulite has radial symmetry [43], see Figure 1.13.
The initial and final stages in the development of a spherulite are referred to as
21
immature and mature spherulites. Mature spherulites have the same crystallographic
axis in the radial direction and immature structure and also dendrites possess a
common single crystal orientation although they are also highly branched particles.
Figure 1.11 Five Stages in the Formation of a Spherulite from
Packing of Lamellae.
The development of spherulites also depends on the relative rate of nucleation
and growth. In the condition of low nucleation density and high growth rate, a few
mature spherulites will result [44]. Conversely, rapid growth and very high
nucleation density leads to a profusion of spherulites which may well be immature.
Under extremely high nucleation density a spherical contour may not develop. In
22
polymers spherulite diameters are normally in the range 0.5 to 1000 μm and are
observable with a light microcope.
Polymers crystallized from flowing melt or drawn solid produces deformed
spherulites or a micro-fibril texture. Preferential growth along the flow or stress
direction lead to the growth of fibrils or shish-kebabs [45] and the morphology is
sensitive to the rate of flow or strain [46]. Correspondingly, in the absence of flow or
strain growth occurs freely in all directions producing a spherulitic morphology. In
the presence of flow or applied strain the crystallization mechanism changes
progressively, from spherulites, to deformed spherulites oriented in the flow
direction, to micro-fibrillar with the molecular chains aligned in the flow direction
through an intermediate stage in which shish-kebabs are produced. The exact
structure of the microfibrils and their growth mechanism are controversial [47] in
that both chain-folded and chain-extended [9, 46] shish-kebabs structure [48] have
been invoked.
1.4 The Melting of Polymers.
Unlike small organic molecules which have a precise melting point, polymers
melt over a broad temperature range that varies with the crystallization temperature
or thermal history. The lamellar crystals are extremely thin and the thickness

23
determines their thermal stability and since the crystallization temperature or
annealing temperature determines the thickness of the crystal; the melting point
varies with crystallization temperature and thermal history. Conventionally the
temperature corresponding to the last trace of crystallinity is taken to be the melting
point of the polymer crystallized at the crystallization temperature [12] and this
reflects the thicker lamellae present in the sample as they are able to persist to a
higher melting point than thinner ones.
The equilibrium melting temperature, Tom, is defined as the melting temperature
of lamellar crystals which are infinitely thick and their melting temperature is not
suppressed by surface energy terms [49]. However, as a chain-folded lamellar crystal
grows with a finite thickness during the crystallization process, Tom is not able to be
directly measured by experiment and has to be determined by extrapolation of
experimentally observed melting temperatures. Establishment of the degree of
supercooling and (∆T = Tom ― Tc) and determination of T
om help to understand the
temperature dependence of the crystallization rates.
The most common way to determine Tom was proposed by Hoffman and Weeks
[12]. They derived a relationship between melting point, Tm, and crystallization
temperature, Tc, which enables Tom to be determined from the observed melting point,
Tm,
24
Tm = Tmo 1 − 1 2𝛽 + Tc 2𝛽 (1.7)
where 𝛽 = (𝜎𝑒 𝑙 𝜎 𝑙𝑒) and σ is the fold surface free energy, l is the lamellae
thickness and the subscript e refers to equilibrium conditions. Under ideal condition
without any re-crystallization or annealing during melting, 𝛽 is equal to 1.0 and a
plot of Tm against Tc is linear with a slope of 1/2𝛽. This line interpolates to the
equilibrium condition of Tm = Tc at Tom, but only with a slope of 0.5. Eq.[1.7] was
derived on the basis that no annealing or secondary crystallization has occurred
during the crystallization or subsequent heating to melting.
1.5 Aims and Objectives of the Project.
PET occupies a unique position in the study of polymer crystallization kinetics
as it was one of the first polymers to be studied by dilatometry and the crystallization
– time data interpreted in terms of the Avrami equation [50], as the growth of
spherulites. Since then it has been widely studied by many other techniques, WAX
diffraction, IR spectroscopy and more recently DSC [51-70]. The amount of interest
in the crystallization behaviour of this polymer reflects its commercial importance
and the realization that material properties are closely associated with the degree of
crystallinity. This research project focuses on the use of a variety of analytical
25
techniques to obtain a deeper understanding the thermal behaviour of PET and the
effect on material and physical properties.
Thermal analysis Fourier transform infrared spectroscopy (TA-FTIR) has been
utilized to examine the thermal behaviour of PET at the molecular level of individual
functional groups during heating and cooling.
Fourier transform infrared spectroscopy (FTIR) combined with a novel analysis
technique of two-dimensional infrared correlation spectroscopy (2D-FTIR) will be
applied to present the close view of thermal behaviour of PET in non-isothermal and
isothermal crystallization. These analyses will help to explore the crystallization
kinetics of PET, particular by the secondary crystallization process and will be
compared with the traditional analysis by differential scanning calorimetry (DSC).
Isothermal and seeded crystallization will be explored using DSC and FTIR
spectroscopy to study the effect of temperature and time on the melting behaviour.
The secondary crystallization of PET will be more extensively studied than
previously with the object of determining its mechanism. Several other
characterization techniques, such as hot-stage optical microscopy and scanning
electron microscopy (SEM) will be used for a better understanding of the overall
crystallization mechanism.
26
Chapter Two
Materials, Experimental Techniques
and Procedures
2.1 Materials.
2.1.1 Poly(ethylene terephthalate) (PET).
Poly(ethylene terephthalate), PET, films, thickness 1.5, 6 and 13 μm, were
supplied by Goodfellow Co., UK, and used as received. Commercial Laser PET with
a number average molecular weight of 16 kg mol-1
and polydispersity of 2.2 was
supplied by DuPont Chemical Co. as moulding pellets.
All samples were dried in a vacuum oven at 100 C for 12 hours before use.
Disc specimens, 5.0 mm in diameter and 1.5 mm in thickness were cut from moulded
sheets and used for all DSC.
27
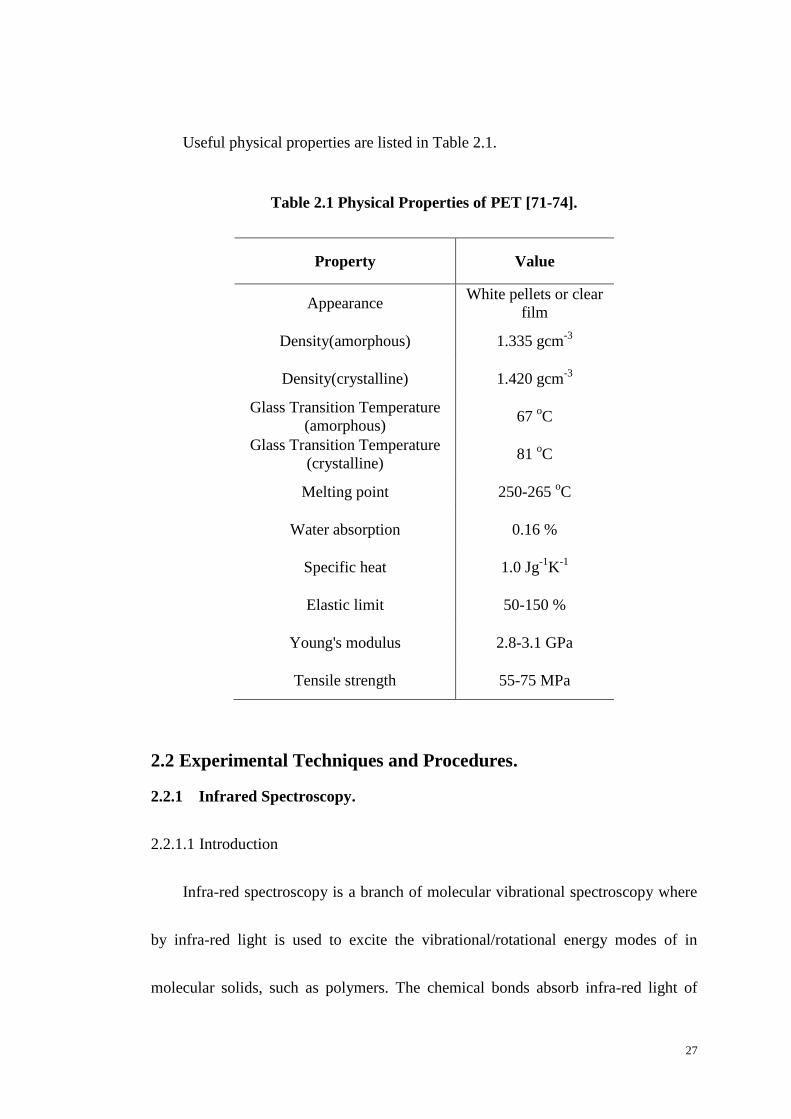
Useful physical properties are listed in Table 2.1.
Table 2.1 Physical Properties of PET [71-74].
Property Value
Appearance White pellets or clear
film
Density(amorphous) 1.335 gcm-3
Density(crystalline) 1.420 gcm-3
Glass Transition Temperature
(amorphous) 67
oC
Glass Transition Temperature
(crystalline) 81
oC
Melting point 250-265 oC
Water absorption 0.16 %
Specific heat 1.0 Jg-1
K-1
Elastic limit 50-150 %
Young's modulus 2.8-3.1 GPa
Tensile strength 55-75 MPa
2.2 Experimental Techniques and Procedures.
2.2.1 Infrared Spectroscopy.
2.2.1.1 Introduction
Infra-red spectroscopy is a branch of molecular vibrational spectroscopy where
by infra-red light is used to excite the vibrational/rotational energy modes of in
molecular solids, such as polymers. The chemical bonds absorb infra-red light of
28
characteristic wavelengths associated with the energy differences between the levels
involved in the excitation and to different extents depending on the relative ease of
the transition [75-81].
Each covalent bond in a molecule has different vibrational, rotational, torsional
and bending modes with characteristic quantum energy levels and fixed energy
differences, E between adjacent levels. If the energy difference corresponds exactly
with the energy of a photon, the light of that wavelength, , is strongly absorbed.
For the vibrational/rotational energy levels this occurs in the infrared region of the
electro-magnetic spectrum and in line with Planck Law [75, 82], the differences in
energy correlate to the wavelength of the absorbed light, i.e.
E = hv = hc/ (2.1)
where ν is the frequency, h Planck constant, c the velocity of light and the
wavelength. Each covalent bond has characteristic energy levels and precise
differences between the energy levels such that covalent bond absorbs infrared light,
at characteristic wavelengths.
The IR spectrum of a material is a plot of the fraction of the incident light
absorbed i.e. the transmittance, T = (I/I0), where I and Io are the intensities of the
transmitted and incident light as a function of reciprocal wavelength, or wavenumber.
29
The spectrum is unique to the molecule and can be used to determine its structure,
and also by comparing it with spectra of known materials confirm the presence and
absence of these materials.
The spectrum is also quantitative as the amount of light absorbed depends on
the amount of material present, according to the Beer-Lambert Law [75-79], i.e.
I = I0 exp(-εcl) (2.2)
where ε is the molar extinction coefficient of the absorption band, c the concentration
and l the sample thickness.
There are two different types of spectrometers used to measure the IR spectra of
materials,
a) a dispersive double beam spectrometer
b) a Fourier Transform spectrometer.
In the first the IR beam is split into two; one beam passes through the sample
and the other does not before both impinge on the light detector. A comparison is
made between the light intensities of the two beams as a function of wavenumber.
The FTIR spectrometer is a single beam instrument in which an IR laser is used as
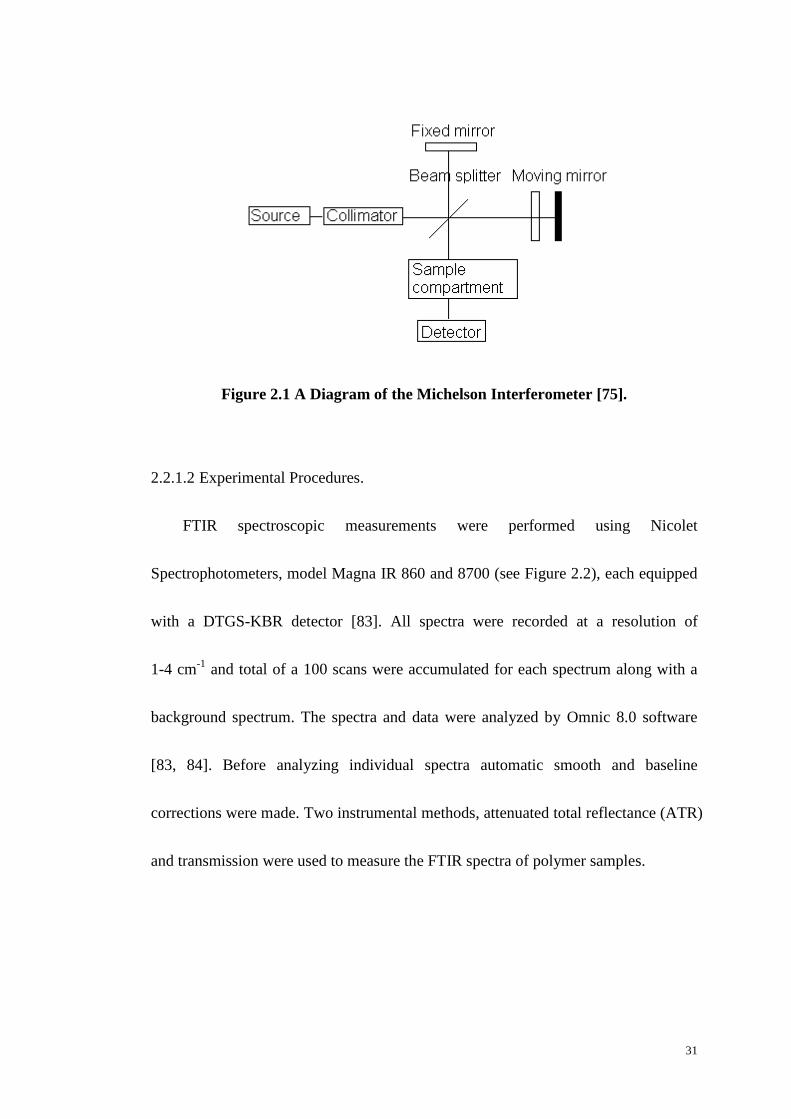
the radiation source. A schematic diagram of the optics is shown in Figure 2.1. The
radiation is split by a beam splitter which is a half-silvered mirror and which splits
30
the beam equally between a fixed and a moving mirror. The mirrors in turn reflect
the beams back to the beam splitter where they recombine constructively and
destructively producing an interferogram. When the sample is placed in the beam it
absorbs some of the radiation at fixed frequencies reducing the intensities in the
interferogram. A Fourier transform on the interferogram is then carried out to
produce the IR spectrum of the sample. The time taken to measure an IR Spectrum
depends on the scanning time of the moving mirror but it is faster than the dispersive
instrument. FTIR spectroscopy is a convenient method for measuring the infrared
spectrum of polymers. It is rapid and there are a number of analytical procedures
available for sample preparation which makes it convenient to use. The FTIR
spectrometer first repeatedly collects, usually 100-400, interferograms in digital form
and this is repeated with the sample removed [75]. Subtraction of the two and Fourier
transforming the interferograms produces the IR spectrum of the sample. The Fourier
transformed interferogram of the sample contains a unique characteristic spectrum of
the sample and subtraction of the baseline removes absorption bands characteristic of
atmospheric water vapour and carbon dioxide.
31
Figure 2.1 A Diagram of the Michelson Interferometer [75].
2.2.1.2 Experimental Procedures.
FTIR spectroscopic measurements were performed using Nicolet
Spectrophotometers, model Magna IR 860 and 8700 (see Figure 2.2), each equipped
with a DTGS-KBR detector [83]. All spectra were recorded at a resolution of
1-4 cm-1
and total of a 100 scans were accumulated for each spectrum along with a
background spectrum. The spectra and data were analyzed by Omnic 8.0 software
[83, 84]. Before analyzing individual spectra automatic smooth and baseline
corrections were made. Two instrumental methods, attenuated total reflectance (ATR)
and transmission were used to measure the FTIR spectra of polymer samples.
32
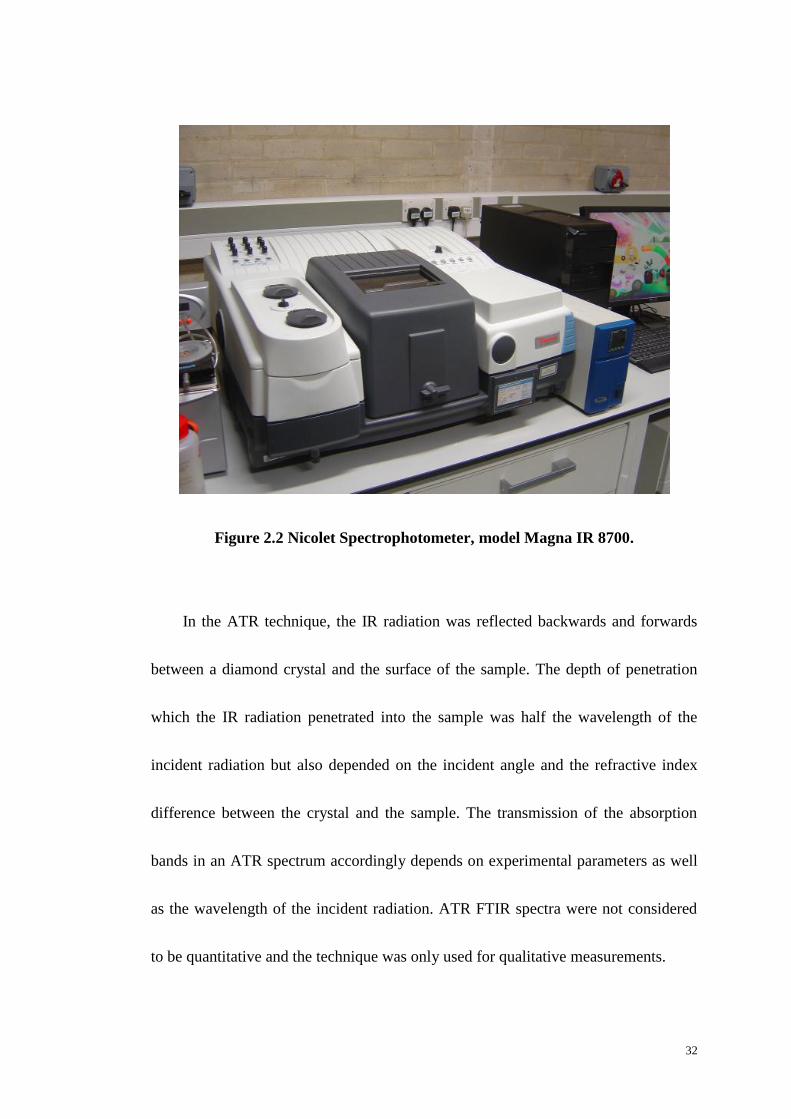
Figure 2.2 Nicolet Spectrophotometer, model Magna IR 8700.
In the ATR technique, the IR radiation was reflected backwards and forwards
between a diamond crystal and the surface of the sample. The depth of penetration
which the IR radiation penetrated into the sample was half the wavelength of the
incident radiation but also depended on the incident angle and the refractive index
difference between the crystal and the sample. The transmission of the absorption
bands in an ATR spectrum accordingly depends on experimental parameters as well
as the wavelength of the incident radiation. ATR FTIR spectra were not considered
to be quantitative and the technique was only used for qualitative measurements.
33
In the transmission technique, the IR radiation passed directly through the
sample contained within a potassium bromide (KBr) disc, or as a thin film. Since the
transmission of the sample was dependent on the molar extinction coefficient and
sample thickness, there was a severe restriction in examining thick polymer samples
greater than 10 μm for the main functional groups and 100 μm for secondary
functional groups.
KBr powder was pre-dried in an air oven for 12 hours to remove moisture. 300
mg of KBr powder was weigh and compressed into a disc of 16 mm diameter and
used as a reference sample. Two further discs of 150 mg KBr discs were made and
used to sandwich PET thin films. A slightly smaller area of PET thin film was cut
then sandwiched between two KBr plates. The thickness of the PET thin film was
adjusted to maintain absorbances value below 1.0 for the absorption band being
analyzed. Thicknesses between 1.5 – 6 μm were chosen for most experiments.
The PET film sandwiched between KBr discs was heated to 265 o
C for 2
minutes within the Linkam THM600 hot-stage cell to melt the PET film. This firmly
attached the film to the surface of the KBr discs, removed any orientation or
shrinkage, and enabled reproducible spectra of the film to be measured on cooling, or
with time at various preset temperatures during isothermal crystallization rate studies.
Prior to these rate studies the time scale was fixed and spectra measured at fixed
34
intervals over the range. The baseline spectrum was also measured and stored for
subtracting from the sample interferograms. The spectrum could then be measured
on cooling and mounting in the sample chamber of the spectrometer or in the cell of
the hot-sage as a function of temperature and time.
TA-FTIR spectra were collected when the sample was heated from room
temperature to above the melting point 275 oC at 4
oC min
-1 heating rate and then
cooled step-wise in 10 oC intervals using 20
oC min
-1 cooling rate between steps.
In isothermal crystallization experiments, PET film sample was heated to 270
oC at 50
oC min
-1 to melt and maintained at this temperature for 2 minutes. It was
then immediately quenched to the isothermal crystallization temperature from 228 to
240 oC at 60
oC min
-1. Once the sample had reached the isothermal crystallization
temperature, a series of spectra were collected at constant time intervals. By this
means IR transmission spectra could readily be measured for 3 minutes to unlimited
time at the isothermal temperature over the crystallization range studied.
Changes in the IR spectra of PET on melting were also followed by heating the
film sandwiched at preset rates of heating to 270 oC by collecting the spectra at
constant time intervals.
In seeded crystallization experiments, PET samples were prepared as described
above, a background spectrum of KBr discs was also measured, the time scale of the
35
experiment set, usually to 1200 minutes, and stored in the Omnic software. The
sample was heated to 270 oC at 50
oC min
-1 and held for 2 minutes to melt the PET.
This was followed by quench-cooling to 234 oC at 60
oC min
-1 and a series of spectra
collected to follow the development of crystallization over 50 minutes. Once the
primary crystallization had been completed, the temperature increased at 50 oC min
-1
to 244 ~ 250 oC. This temperature was in the range in which melting was observed to
occur and after a set time periods the sample was cooled to the isothermal
crystallization temperature. By this means crystallization from seeds produced were
studied isothermally.
The quality control of FTIR results and samples thickness have been selected
1720 cm-1
and 1410 cm-1
as the references for main peaks and secondary peaks
respectively. The standard value of absorbance of 1720 cm-1
and 1410 cm-1
were set
as 1.3±10% at room temperature and 1.0±10% in the melt.
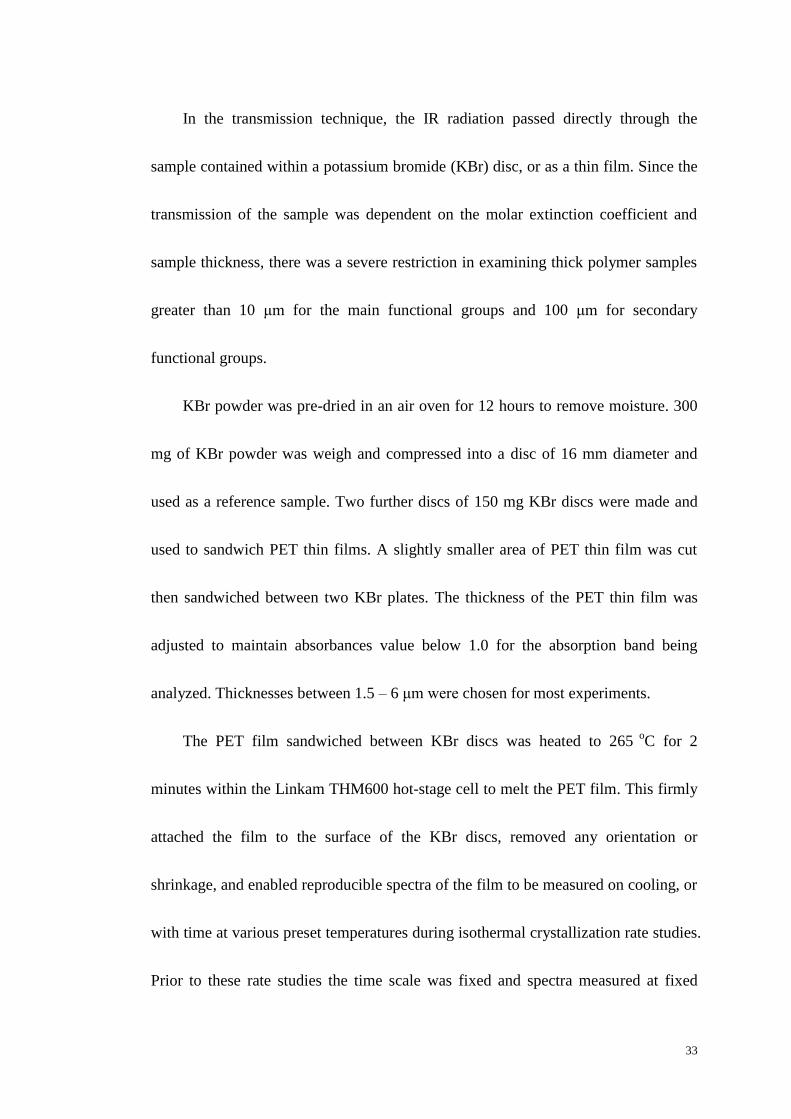
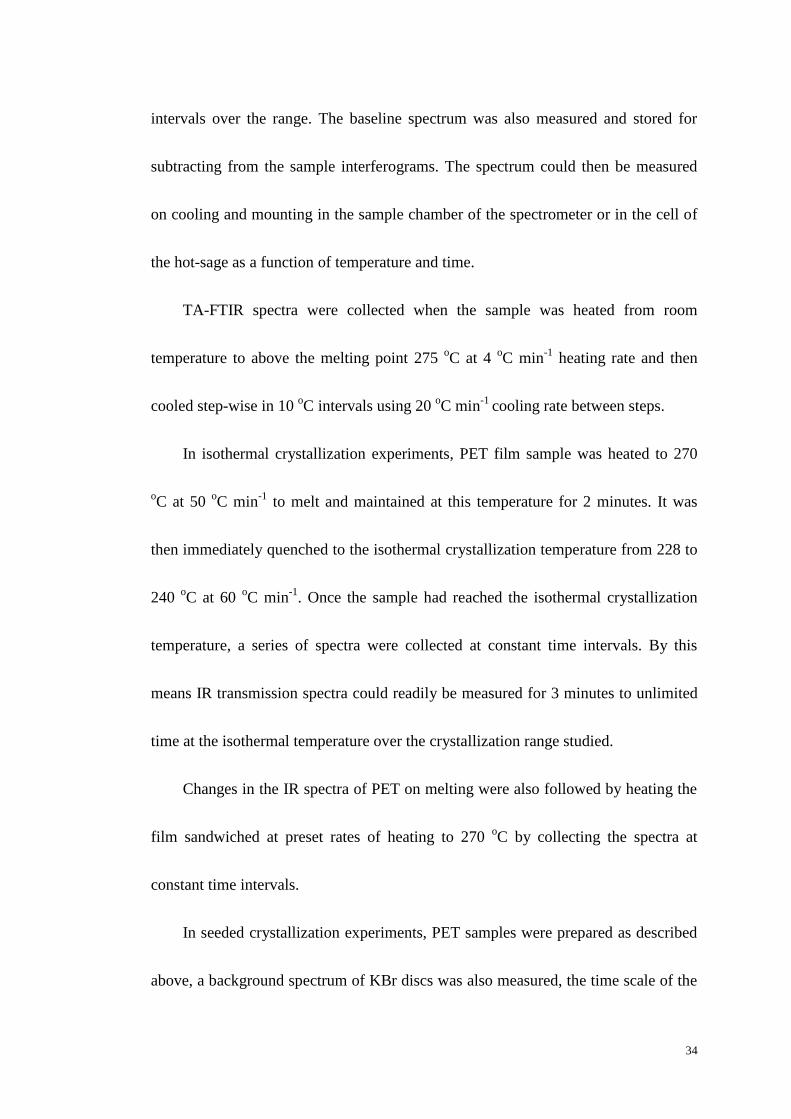
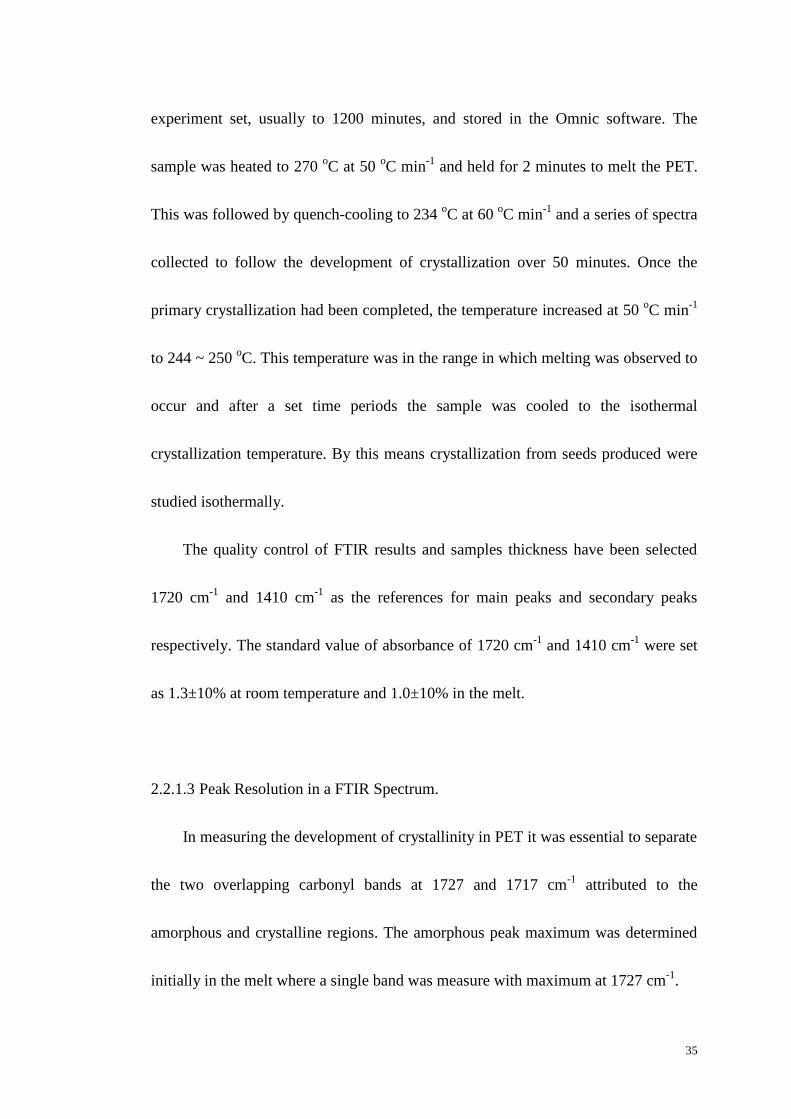
2.2.1.3 Peak Resolution in a FTIR Spectrum.
In measuring the development of crystallinity in PET it was essential to separate
the two overlapping carbonyl bands at 1727 and 1717 cm-1
attributed to the
amorphous and crystalline regions. The amorphous peak maximum was determined
initially in the melt where a single band was measure with maximum at 1727 cm-1
.

36
The spectral region from 1650 to 1800 cm-1
was selected for peaks resolving and
the Omnic baseline function set at the extremes of the range. Using the programmes
“Find Peak” (Figure 2.3A) and “Fit Peaks” (Figure 2.3B), the original absorption
band was resolved automatically into several smaller peaks by the software. A series
of ideal peaks was then selected in the programme “Edit Peaks” with fixed peak
maxima. This reduced the number of small peaks, set and locked in the wavenumbers
of peak maxima as well as verified the two main peaks, the amorphous band at 1727
cm-1
and the crystalline at 1717 cm-1
, see Figure 2.3C. Rerunning the “Fit Peaks”
gave a better fit to the absorption band and resolution of the two peaks, see
Figure 2.3D. The peaks were further edited by adjusting the value of half wave width
using a Lorentzian shape for the two absorption curves. Repeating the steps of the
“Fit Peaks” and “Edit Peaks” programmes gave the best fit to the absorption band and
the best resolution of the two main and other secondary peaks or noise peaks.
Normally, the result with a degree of fitting over 97 % and noise peaks area less than
5 % of total peak area is acceptable.

37
Figure 2.3A Use “Find Peaks” Function of Omnic.
Figure 2.3B First Time to Run Omnic “Fix Peaks” Function.
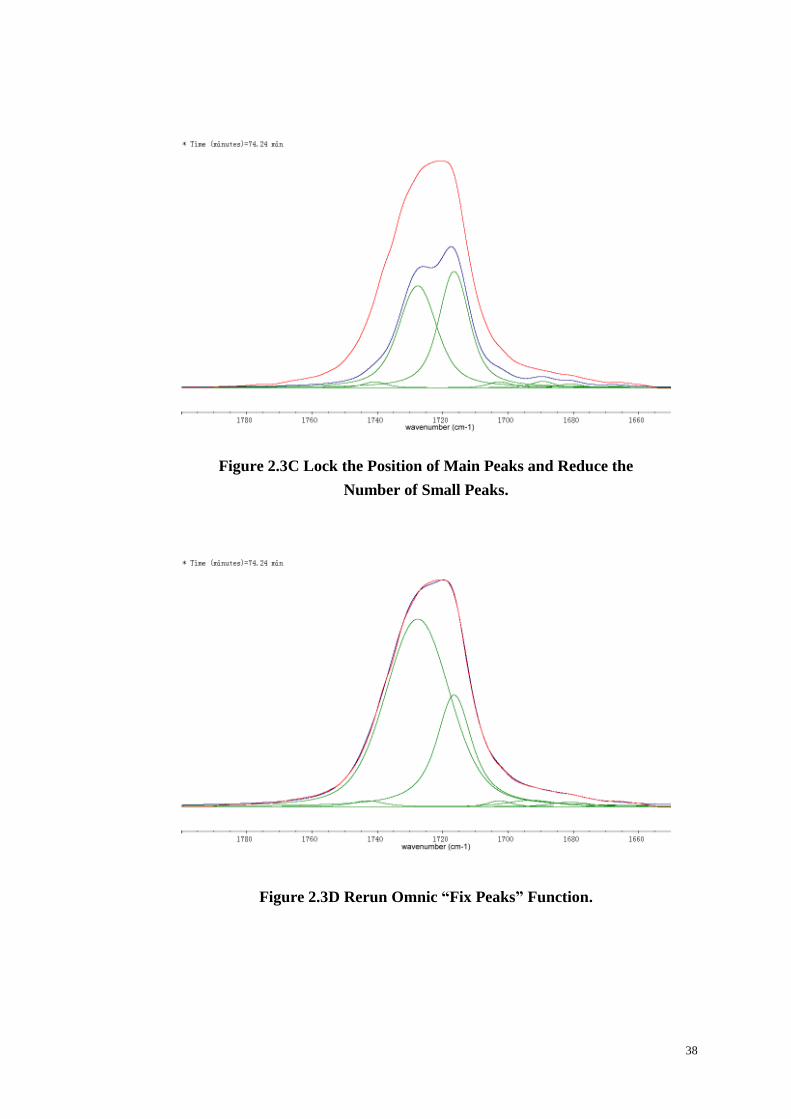
38
Figure 2.3C Lock the Position of Main Peaks and Reduce the
Number of Small Peaks.
Figure 2.3D Rerun Omnic “Fix Peaks” Function.

39
Figure 2.3E Adjust the Half Wave Width and Lorentzian Shape of
Peaks then Repeat “Fix Peaks” Function.
Figure 2.4 Spectrum of Isothermal Crystallization on FT-IR at 234 oC at 75
Minute Showing How the Overlapped Peaks is Divided.
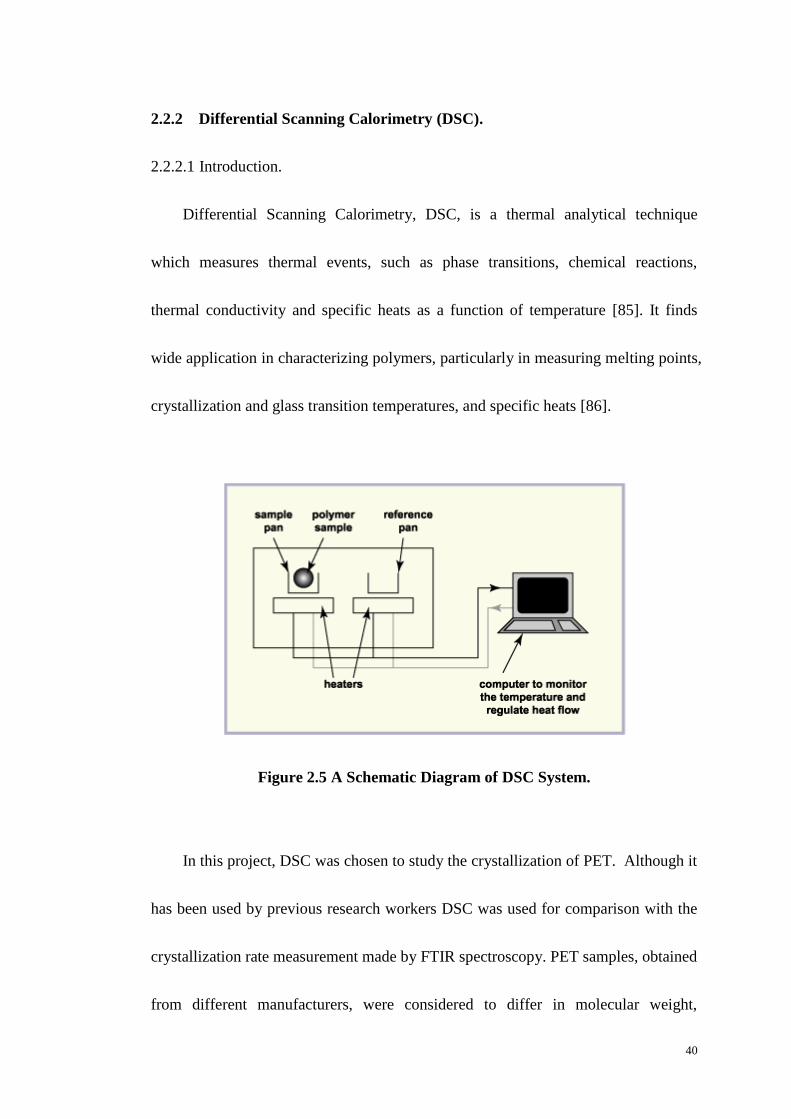
40
2.2.2 Differential Scanning Calorimetry (DSC).
2.2.2.1 Introduction.
Differential Scanning Calorimetry, DSC, is a thermal analytical technique
which measures thermal events, such as phase transitions, chemical reactions,
thermal conductivity and specific heats as a function of temperature [85]. It finds
wide application in characterizing polymers, particularly in measuring melting points,
crystallization and glass transition temperatures, and specific heats [86].
Figure 2.5 A Schematic Diagram of DSC System.
In this project, DSC was chosen to study the crystallization of PET. Although it
has been used by previous research workers DSC was used for comparison with the
crystallization rate measurement made by FTIR spectroscopy. PET samples, obtained
from different manufacturers, were considered to differ in molecular weight,
41
branching and extent of copolymerization and it was essential to measure their
crystallization rate-temperature dependence prior to a detailed study of changes to
the IR spectra on crystallization.
DSC is designed to measure the difference in the rate of heat flow required to
heat or cool a sample and reference at a defined rate of heating. It therefore measures
changes in heat flow, dH/dt of materials as a function of temperature. The heat flow
at temperature T is described as below,
𝑑𝐻
𝑑𝑡 𝑇
= (𝑑𝐻/𝑑𝑇)𝑇
(𝑑𝑇/𝑑𝑡 )𝑇= 𝐶𝑝 ,𝑇 𝑅 (2.3)
where Cp and R are the specific heat and the rate of heating respectively.
DSC measures the specific heat of a material as a function of temperature and by
integration can be used to measured enthalpy and entropy of phase transitions and
chemical reactions. The basic role of this technique is to maintain the sample and
reference at the same temperature while at the same time changing the temperature at
a controlled rate. When a sample undergoes a phase transition, endothermic or
exothermic, more or less heat is required to alter the temperature of the sample
relative to that of the reference and the heat flow is adjusted accordingly [86]. The
heat flow difference is recorded by the DSC as a function of temperature and
displayed against temperature or time.

42
DSC contains two separate thermal sensors; one for the sample and the second
the reference. During a DSC program, heating, cooling or at constant temperature the
differences in heat flow between the two sensors are monitored. The instrument
maintains sample and reference at exactly the same temperature and records the
difference in heat flow rate as a function of time or temperature. Integration of the
heat flow data over time enables the enthalpy of the transition to be directly measured,
after a correction is made for baseline differences between the sample and reference.
In this way the crystallization kinetics of PET over a range in temperature have been
studied [86].
2.2.2.2 Experimental Procedures.
A Perkin-Elmer differential scanning calorimeter, DSC-7 with a thermal
analyzer TAC 7/DZ [87], interfaced to a computer was used to follow the variation
of the rate of heat evolution with time during the crystallization or melting of PET.
The temperature scale of the DSC was calibrated from the melting point of high
purity (99.999%) metals: tin (231.93 oC) and indium (156.60
oC). The power
response of the calorimeter was calibrated from the enthalpy of fusion of indium,
taken to be 28.47Jg-1
.
43
Samples were weighed accurately using a Perkin-Elmer microbalance to 10 µg.
About 15.0 mg was used encapsulated in an aluminum pan and an empty aluminum
pan was used as reference.
In measuring the crystallization rate behaviour of PET as a function of
temperature the sample initially was heated to 275 oC at 10
oC min
-1 heating rate and
kept for 2 minutes at 275 oC. It was subsequently cooled to 30
oC at 10
oC min
-1. The
temperature of the onset of crystallization was noted and used to determine the
temperature range in which the sample crystallize at rates which could conveniently
be measured in the DSC.
Isothermal crystallization studies were carried out by heating a sample at 10 oC
min-1
to 275 oC. The sample was held at this temperature for 2 minutes to ensure
complete melting and then quenched to the isothermal crystallization temperature at
160 oC min
-1. It was subsequently held at that temperature until crystallization was
observed to be complete by the return of the thermal response to the calorimeter
baseline. The resulting exothermic trace was analyzed in terms of the Avrami
equation to determine half-lives, rate constants and the rate parameter, n, in the
temperature range 224 to 240 oC as described later. In this way the temperature
dependent rate parameters were determined and analyzed in terms on nucleation
control of the transition.

44
Once the isothermal crystallization process was completed, the sample was
heated to 280 oC at 10
oC min
-1 to determine the melting behaviour of the crystallized
sample.
Samples for seeded crystallization experiments were prepared in the same way.
The DSC samples, heated up to 275 oC and held for 2 minutes to completely melt,
were quenched to 234 oC and held for 50 minutes so that they could be crystallized to
the end of the primary crystallization stage, i.e. pre-crystallization. These were then
heated at 50 oC min
-1 to 244~258
oC for partial melting and subsequent seeded
crystallization. The time-scale of seeded stage varied from 1 to 1000 minutes. Once
the seeded crystallization process was finished, the sample was heated to 280oC at
10oC min
-1 to determine the melting behaviour.
Figure 2.6 The Perkin-Elmer DSC-7 and TAC 7/DZ.
45
2.2.3 Hot-stage Microscopy.
2.2.3.1 Optical Microscopy.
Optical microscopy provides a magnified view of the sample under transmitted
or reflected light. The magnified view could be detected by human eye, imaged on a
photographic plate or captured and displayed on a digital camera.
A digital microscope containing a charge-coupled device (CCD) camera to focus
the object was used to study the morphology of crystalline PET. The CCD camera
captured a digital image as a function of temperature and time, which could be
displayed dynamically on a computer screen for measurement of the image size.
2.2.3.2 Hot-stage Microscopy.
The hot-stage of the microscope included a specimen chamber mounted on the
microscope stage, a thermal control unit, cooling unit and computer thermal control
software [88, 89]. Hot-stage could be set up on high quality transmitted, reflected and
UV-fluorescence microscopes and the Laser-Raman microprobe to investigate the
changes and properties of materials [90-94]. The heating and cooling units and
specimen chamber provided a broad temperature range from -196 o
C to 500 o
C. The
computer software supports computer-controlled x-y stage and heating/cooling rates
could be set to 0.1 oC to 100
oC min
-1.
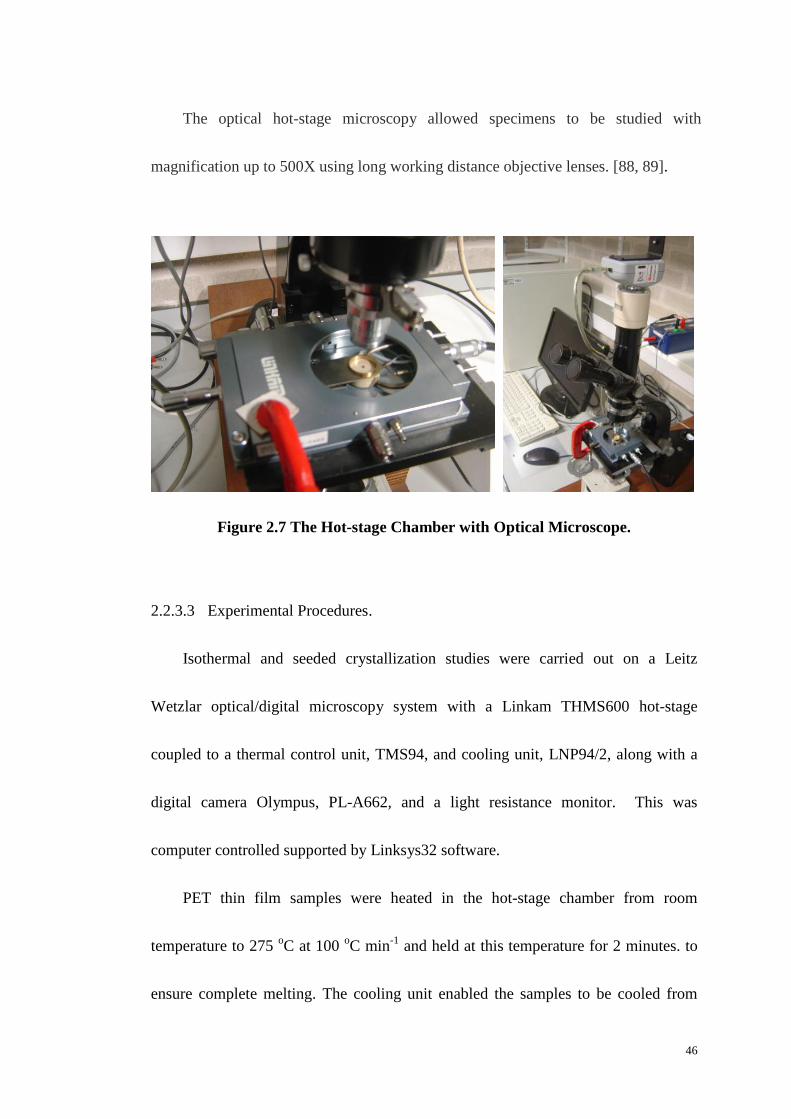
46
The optical hot-stage microscopy allowed specimens to be studied with
magnification up to 500X using long working distance objective lenses. [88, 89].
Figure 2.7 The Hot-stage Chamber with Optical Microscope.
2.2.3.3 Experimental Procedures.
Isothermal and seeded crystallization studies were carried out on a Leitz
Wetzlar optical/digital microscopy system with a Linkam THMS600 hot-stage
coupled to a thermal control unit, TMS94, and cooling unit, LNP94/2, along with a
digital camera Olympus, PL-A662, and a light resistance monitor. This was
computer controlled supported by Linksys32 software.
PET thin film samples were heated in the hot-stage chamber from room
temperature to 275 oC at 100
oC min
-1 and held at this temperature for 2 minutes. to
ensure complete melting. The cooling unit enabled the samples to be cooled from
47
250 oC to 230
oC at 80
oC min
-1 for isothermal crystallization at that temperature.
During crystallization the birefringence of the specimen was measured with a photo-
resist meter and the signal recorded by the light current sensor. Alternatively a series
of images could be recorded on the digital camera as a function of time. This
enabled the spherulitic growth of PET to be measured during the crystallization.
Samples for seeded crystallization experiments were prepared in the same way.
The thin film was heated to 275 oC and held for 2 minutes to melt the sample
completely. This was followed by quenching to 234 oC and holding the sample for
50 minutes to enable pre-crystallization to occur. The sample was the heated at 50 oC
min-1
to 244~250 oC where partial melting and seeded crystallization was followed
up to 1200 minutes. Images of the sample were taken at various to follow the
development of partial melting and seeded crystallization.
48
Chapter Three
Thermal Analysis of PET by DSC and FTIR
Spectroscopy
3.1 Introduction.
Thermal analysis FTIR spectroscopy, TA-FTIR, has been widely used to study
polymer degradation and changes in to chain conformation with temperature. In
studying polymer degradation it enables changes in chemical composition and chain
structure to be followed as a function of temperature and time. The kinetics of
reactions are followed by the change in the concentration of functional groups [95-
101] and significant changes in chemical composition determined from the
appearance and disappearance of absorption bands. In this way the relative
importance of competing reactions can be established as well as the build up and
disappearance of transient species.
49
The chain conformation of PET is closely associated with the ratio of cis and
trans rotational isomers present in the sample. In the un-oriented amorphous polymer
below the glass transition this ratio is invariant with temperature due to restricted
chain mobility. Above the glass transition the ratio is in thermal equilibrium due to
the onset of rotational modes in the chain. Accordingly the temperature dependence
of the cis/trans ratio has been used to measure the glass transition temperature, Tg
and follow the development of physical ageing with time at temperatures below Tg.
Recently [102] the kinetics of isothermal crystallization of poly (ethylene
terephthalate) by TA-FTIR have been measured by separating the crystalline and
amorphous components of the carbonyl absorption bands as a function of time over a
range of temperatures. This enabled the weight fraction crystallinity to be measured
well into the secondary crystallization process over a greater time scale and wider
temperature range than was possible by differential scanning calorimetry, DSC. The
later technique by measuring the rate of crystallization rather than the fractional
crystallinity was limited by the sensitivity of the calorimeter to measuring heat flow.
As a result it was not possible to measure the kinetics of secondary crystallization
with sufficient accuracy for kinetic analysis [103-106].
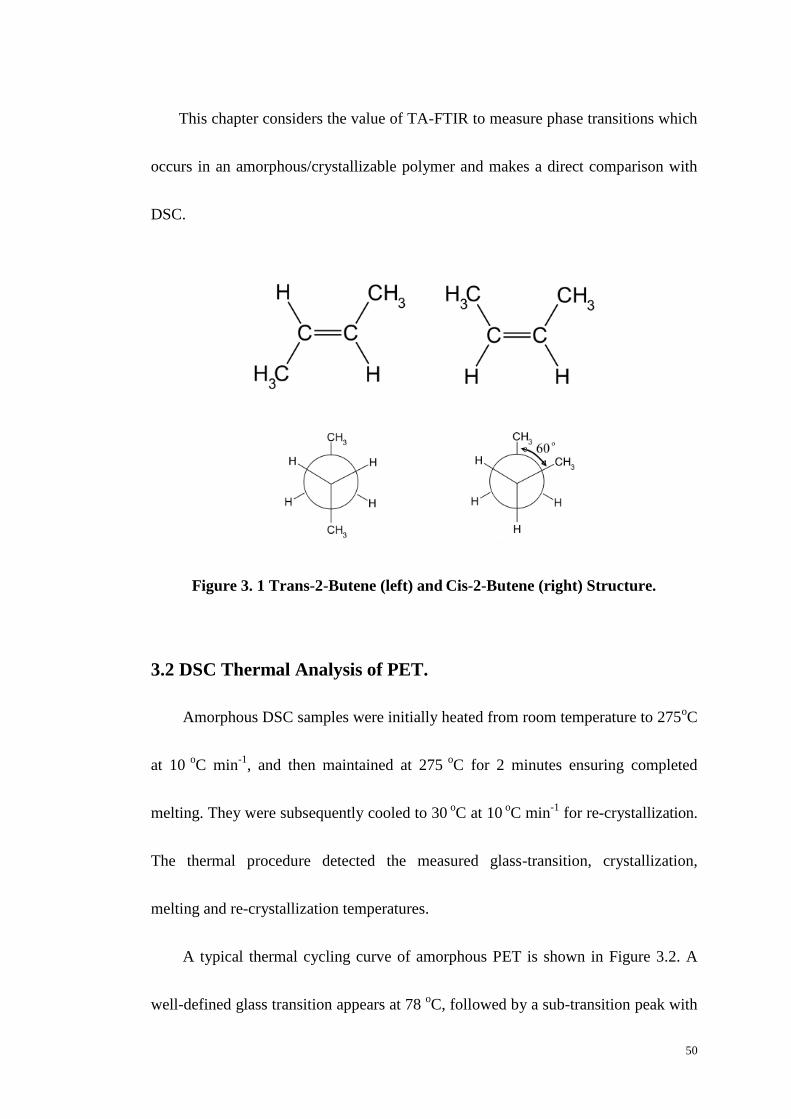
50
This chapter considers the value of TA-FTIR to measure phase transitions which
occurs in an amorphous/crystallizable polymer and makes a direct comparison with
DSC.
Figure 3. 1 Trans-2-Butene (left) and Cis-2-Butene (right) Structure.
3.2 DSC Thermal Analysis of PET.
Amorphous DSC samples were initially heated from room temperature to 275oC
at 10 o
C min-1
, and then maintained at 275 o
C for 2 minutes ensuring completed
melting. They were subsequently cooled to 30 oC at 10
oC min
-1 for re-crystallization.
The thermal procedure detected the measured glass-transition, crystallization,
melting and re-crystallization temperatures.
A typical thermal cycling curve of amorphous PET is shown in Figure 3.2. A
well-defined glass transition appears at 78 oC, followed by a sub-transition peak with

51
rapid quenching from the melt which is the cold crystallization procedure. The onset,
Tc1, and peak temperature of cold crystallization are 115 and 130 o
C respectively.
Melting happens in the range 225-260 oC with peak melting temperature at 255
oC.
On cooling to room temperature, crystallization of the sample occurs at about
230 oC in the high temperature region. The reset smooth curve shows no obvious
glass transition which is consistent with the sample being partially crystalline.
Figure 3.2 The DSC Analysis of PET.
(Red line indicates heating, blue cooling at 10 K min-1
)
-20
-15
-10
-5
0
5
10
15
0 50 100 150 200 250 300
DSC Response of PET
Hea
t F
low
/m
W m
g-1
Temperature / oC
Tc2
TmT
c1T
g
endothermic
exothermic
baseline
52
The heat flow-temperature curves in Figure 3.2 were integrated above the
instrument baseline generating corresponding change in enthalpy curves [107]
associated with the various transitions. These are shown in Figure 3.3 for the heating
and cooling curves. The glass transition is seen as a change in slope of the enthalpy
of the liquid line at about 75 oC. There is a linear increase in heat capacity with
temperature until the sample starts crystallizing at 115 oC. This is accompanied by
the evolution of heat corresponding to the enthalpy of crystallization at Tc1. The
enthalpy of the partially crystalline sample also increases linearly until the onset of
melting at 230 oC and melting continued up to 260
oC, at which the enthalpy attains
the value of the liquid phase. Thereafter the enthalpy increases linearly with a slope
which is the heat capacity of the liquid.

53
Figure 3.3 The Relative Enthalpy Change on Heating and Cooling PET.
320 K was used as the Reference Temperature.
(Red line indicates heating, blue cooling at 10 K min-1
)
On cooling from above the melting point to 30 o
C, the enthalpy of the liquid
decreases linearly with temperature and this extrapolates linearly to the liquid line
above the glass transition temperature, as shown by the dotted line in Figure 3.3.
Since there is no difference between the extrapolated entropy of the liquid and the
original sample at Tg, the original sample is amorphous [106]. On further cooling the
sample starts to crystallize at about 230oC with the evolution of the enthalpy of
crystallization at Tc2, and this is complete at 200 oC. The enthalpy then decreases
54
linearly with a slope corresponding to the specific heat of the partially crystalline
material. There was no evidence, such as a slope change, for a glass transition on
cooling in the semi-crystalline sample.
3.3 Typical FTIR Spectrum of PET.
Figure 3.4 shows a typical FTIR spectrum of amorphous PET. The main
absorption bands in the spectrum have been assigned [108-111] as follows, 3100-
2800 cm-1
to aromatic and aliphatic –C-H bond stretching, 1780-1650 cm-1
to the
ester carbonyl bond stretching, 1470-1350 cm-1
to bending and wagging vibrational
modes of the ethylene glycol segment, 1235 cm-1
to the ester group stretching,
1090cm-1
to the methylene group and aromatic bands in-plane/out-plane bending at
1016 and 725 cm-1
. Many of the medium and weaker bands have been attributed to
chain conformation and are sensitive to whether the sample is amorphous, oriented,
or crystalline [111-114], which will be discussed in detail in later chapter.
Differences are due to conformation of the ethylene glycol group (cis/trans isomers)
and also phenylene carbonyl bonds (cis-trans isomers).
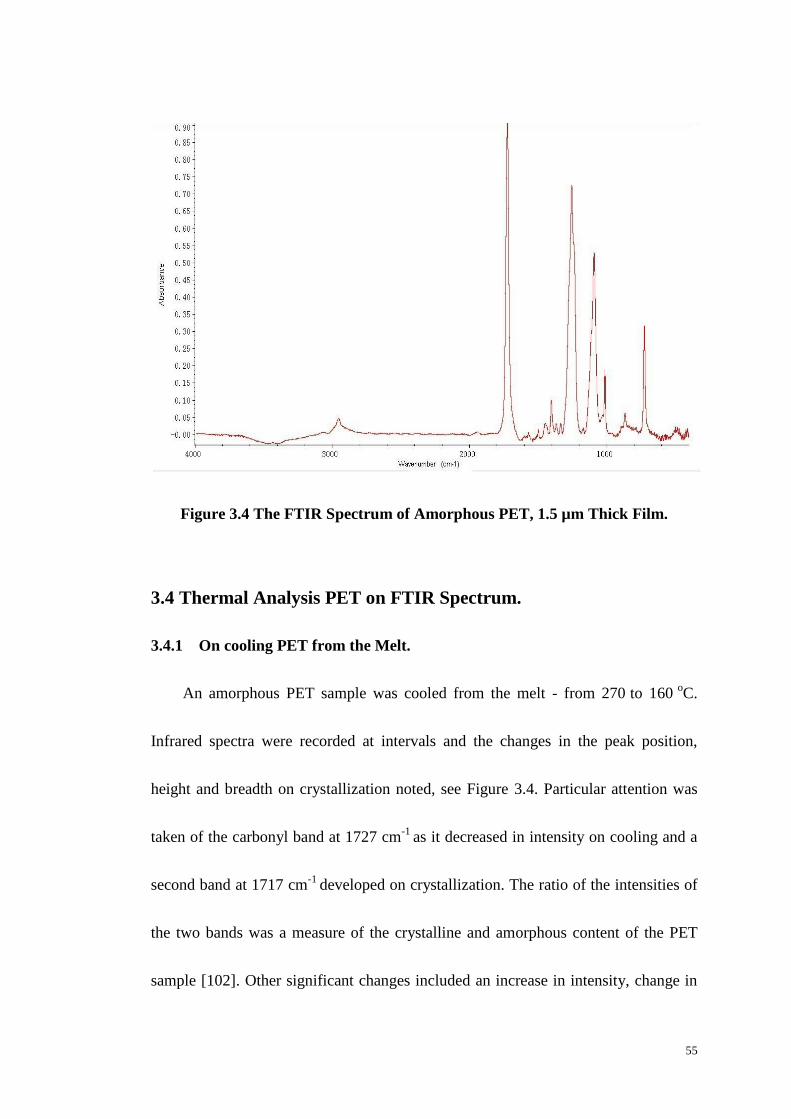
55
Figure 3.4 The FTIR Spectrum of Amorphous PET, 1.5 µm Thick Film.
3.4 Thermal Analysis PET on FTIR Spectrum.
3.4.1 On cooling PET from the Melt.
An amorphous PET sample was cooled from the melt - from 270 to 160
oC.
Infrared spectra were recorded at intervals and the changes in the peak position,
height and breadth on crystallization noted, see Figure 3.4. Particular attention was
taken of the carbonyl band at 1727 cm-1
as it decreased in intensity on cooling and a
second band at 1717 cm-1
developed on crystallization. The ratio of the intensities of
the two bands was a measure of the crystalline and amorphous content of the PET
sample [102]. Other significant changes included an increase in intensity, change in
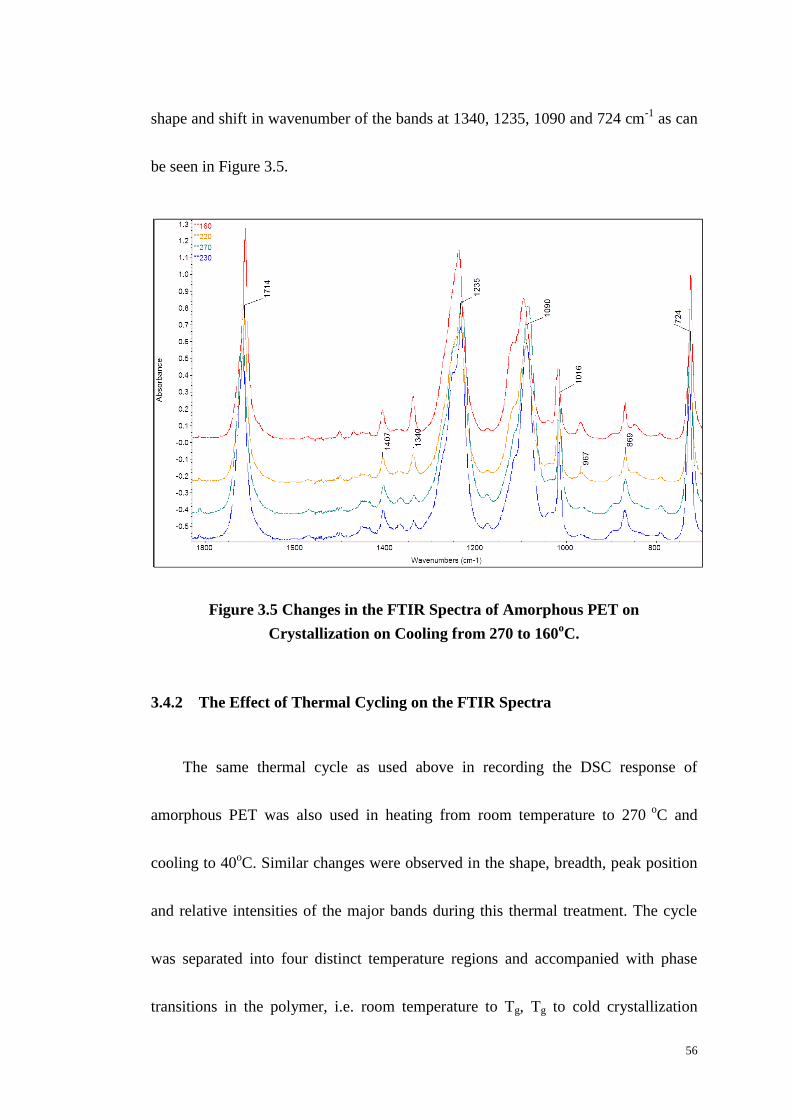
56
shape and shift in wavenumber of the bands at 1340, 1235, 1090 and 724 cm-1
as can
be seen in Figure 3.5.
Figure 3.5 Changes in the FTIR Spectra of Amorphous PET on
Crystallization on Cooling from 270 to 160oC.
3.4.2 The Effect of Thermal Cycling on the FTIR Spectra
The same thermal cycle as used above in recording the DSC response of
amorphous PET was also used in heating from room temperature to 270 o
C and
cooling to 40oC. Similar changes were observed in the shape, breadth, peak position
and relative intensities of the major bands during this thermal treatment. The cycle
was separated into four distinct temperature regions and accompanied with phase
transitions in the polymer, i.e. room temperature to Tg, Tg to cold crystallization
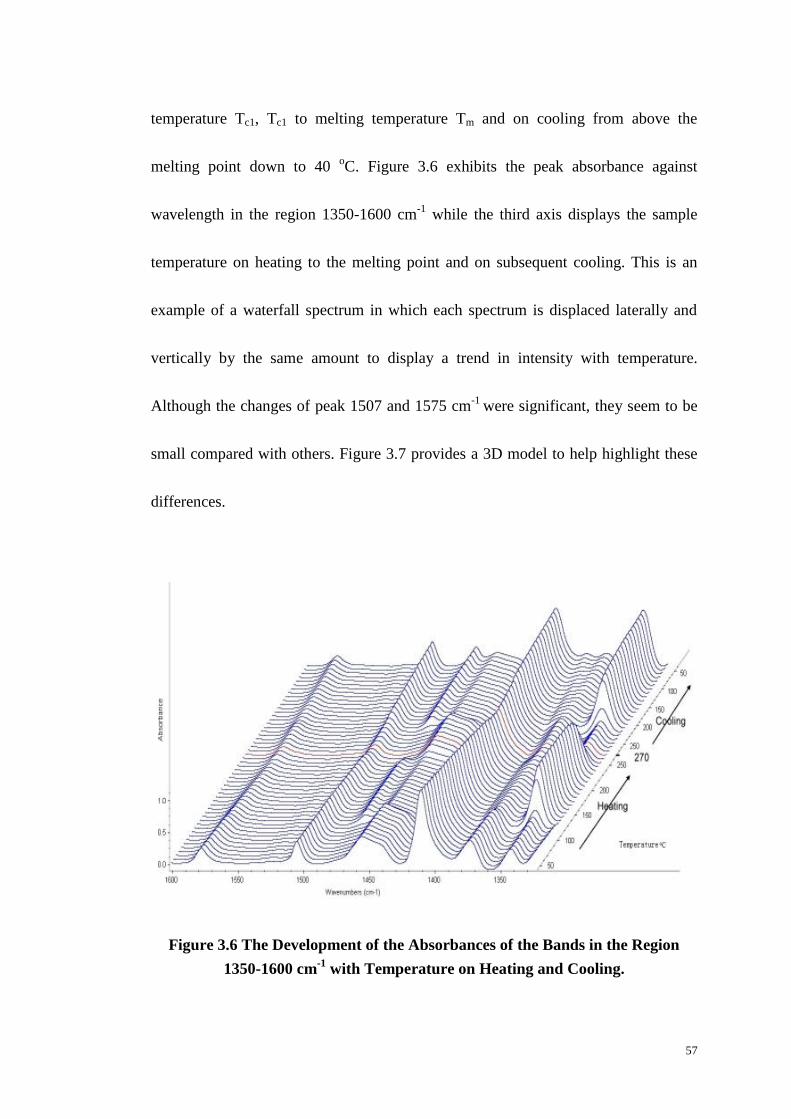
57
temperature Tc1, Tc1 to melting temperature Tm and on cooling from above the
melting point down to 40 oC. Figure 3.6 exhibits the peak absorbance against
wavelength in the region 1350-1600 cm-1
while the third axis displays the sample
temperature on heating to the melting point and on subsequent cooling. This is an
example of a waterfall spectrum in which each spectrum is displaced laterally and
vertically by the same amount to display a trend in intensity with temperature.
Although the changes of peak 1507 and 1575 cm-1
were significant, they seem to be
small compared with others. Figure 3.7 provides a 3D model to help highlight these
differences.
Figure 3.6 The Development of the Absorbances of the Bands in the Region
1350-1600 cm-1
with Temperature on Heating and Cooling.

58
Two different and opposite trends were observed in the way the absorbance of
the peaks changed on crystallization and melting on heating and cooling. For
example, the bands at 1472 and 1342 cm-1
increased in intensity at 110-120 oC and
decreased at 240oC on heating and increased again on cooling at 230
oC. This
increase is associated with the polymer crystallizing and the decrease with melting.
The reverse change was observed by the peaks at 1458-1440 and 1370 cm-1
i.e. an
increase in absorbance on melting and a decrease on crystallizing.
Figure 3.7 A 3D Representation of the Region 1480-1600 cm-1
with
Temperature on Heating and Cooling.
The pair of bands at 1472 and 1458-40 cm-1
have been assigned to the bending
modes of the trans and cis conformational isomers of the ethylene segments
respectively and the pair at 1342 and 1370 cm-1
to the wagging mode of this segment.
59
Since in the crystalline phase the chain conformation must be trans on crystallization
the trans isomer must increase at the expense of the cis and the reverse occurs on
melting. These increase and decrease of the peak intensities at each phase transition
have been designated as Type I behaviour, since they are the most commonly
encountered.
The band at 1410 cm-1
, however, was observed to show a different type of
behaviour in that the absorbance decreased smoothly with temperature in heating and
there was no abrupt change at phase transitions. This band has been assigned to the
stretching mode of –C-H bond in the aromatic ring. For convenience this has been
designated Type II behaviour and is discussed in section 3.4.4.
3.4.3 Type I Behaviour.
The effect of crystallization, melting and re-crystallization during thermal
cycling on the conformation of the molecular chain was studied by considering the
behaviour of the bending mode of the glycol methylene groups at 1470 and
1450 cm-1
. These two bands have been attributed to the trans and cis conformation
isomers [102]. The change in absorbances of the bands in the four temperature
regions can be seen in Figures 3.8 and 3.9. For comparison the Tg, Tc1, Tc2, and Tm
determined by DSC are marked on the figures. On heating the absorbances of the two
60
bands decreased with increasing temperature but the decrease was less marked with
the trans than the cis isomer. The Beer-Lambert law defines the absorbance of an IR
band as, A= ε[c]l. It was not possible to separate the temperature dependence of the
concentration and extinction coefficient in this experimment. However, both must
contribute since the absorbance of the two bands decrease with increasing
temperature while the concentration of the one of the species must increase and the
other decrease depending on which predominates at low temperature, so that ε must
have some temperature dependence.
In the region of the glass transition temperature, as measured by DSC at 78 oC,
the cis isomer only shows a step change in the absorbance with temperature and this
was attributed to the glass transition. Below the glass transition temperature, PET is a
rigid glass that and the chains cannot rotate, and the cis/trans ratio is constant,
independent of temperature. The chain conformation is not in thermal equilibrium
and does not change with temperature [101, 102]. Above the glass transition, the
amorphous polymer becomes a viscous liquid and its molecular chains have some
mobility due to the onset of bond rotation. The cis/trans ratio which define the chain
conformation is then in thermal equilibrium. The trans isomer does not show any
significant change in the glass transition region due to its very low absorption and
minor variations are difficult to separate from random fluctuations.

61
Figure 3.8 The Change in Absorbance of the Trans Isomer at 1470 cm-1
with
Temperature Showing the Glass Transition Temperature, Tg, Cold
Crystallization Temperature, Tc1, and Melting Point, Tm on Heating and the
Crystallization Temperature, Tc2, on Cooling.
(Red line indicates heating, blue cooling)
On heating low temperature crystallization occurs at Tc1 and it is accompanied
by a marked increase in absorption of the trans isomer, Figure 3.8, and a
corresponding decrease in the cis, Figure 3.9. This is due to the onset of
crystallization. In the crystal the chain must adopt the fully extended all trans
conformation and the cis form cannot be accommodated within the crystal but is
restricted to the amorphous regions. The overall trans and cis content increases and
decreases respectively proportional to the crystallinity.
0
0.05
0.1
0.15
0.2
0.25
0.3
0.35
0 50 100 150 200 250 300
Ab
so
rba
nce
Temperature / oC
Tc1
Tm
Tc2
The Change in Absorbance with Temperature
trans isomer
1470 cm-1
Tg
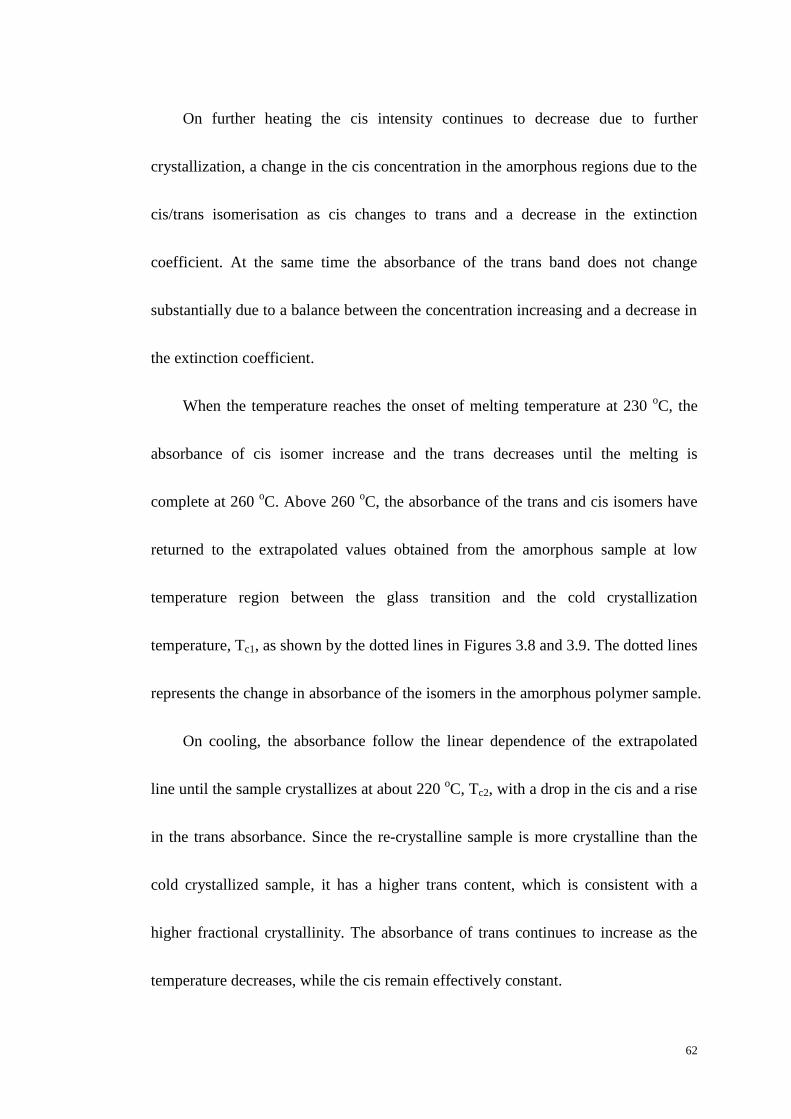
62
On further heating the cis intensity continues to decrease due to further
crystallization, a change in the cis concentration in the amorphous regions due to the
cis/trans isomerisation as cis changes to trans and a decrease in the extinction
coefficient. At the same time the absorbance of the trans band does not change
substantially due to a balance between the concentration increasing and a decrease in
the extinction coefficient.
When the temperature reaches the onset of melting temperature at 230 oC, the
absorbance of cis isomer increase and the trans decreases until the melting is
complete at 260 oC. Above 260
oC, the absorbance of the trans and cis isomers have
returned to the extrapolated values obtained from the amorphous sample at low
temperature region between the glass transition and the cold crystallization
temperature, Tc1, as shown by the dotted lines in Figures 3.8 and 3.9. The dotted lines
represents the change in absorbance of the isomers in the amorphous polymer sample.
On cooling, the absorbance follow the linear dependence of the extrapolated
line until the sample crystallizes at about 220 oC, Tc2, with a drop in the cis and a rise
in the trans absorbance. Since the re-crystalline sample is more crystalline than the
cold crystallized sample, it has a higher trans content, which is consistent with a
higher fractional crystallinity. The absorbance of trans continues to increase as the
temperature decreases, while the cis remain effectively constant.
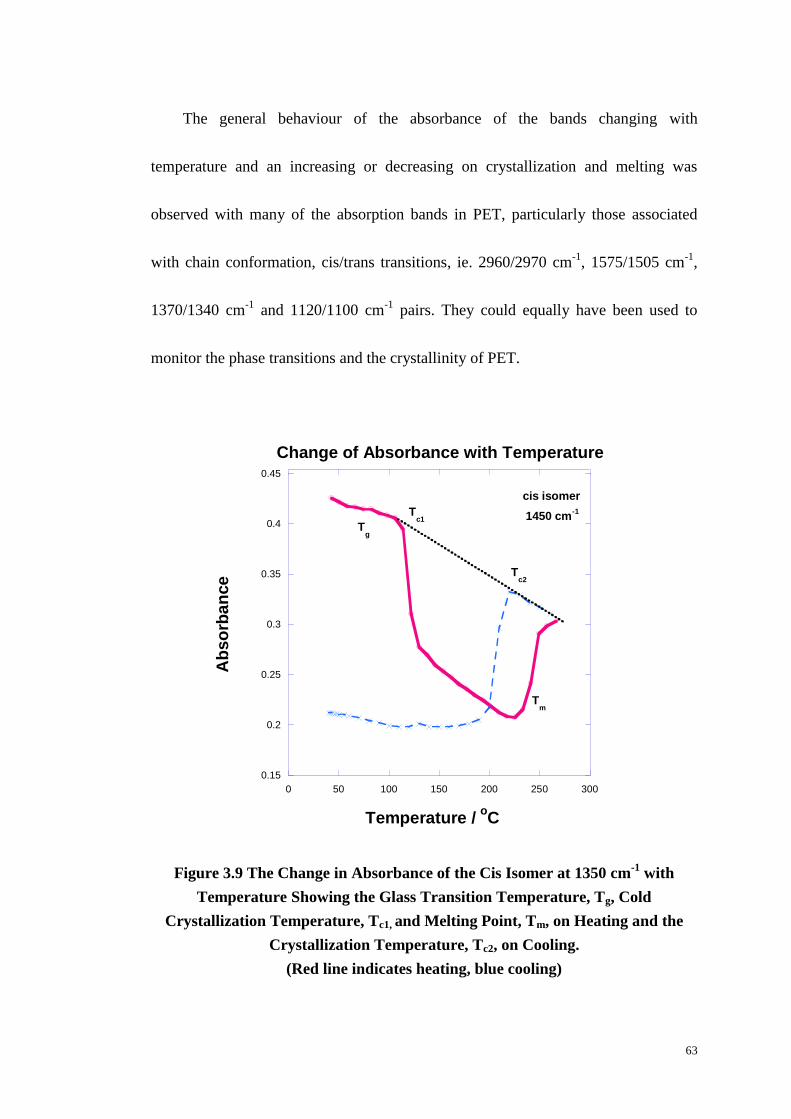
63
The general behaviour of the absorbance of the bands changing with
temperature and an increasing or decreasing on crystallization and melting was
observed with many of the absorption bands in PET, particularly those associated
with chain conformation, cis/trans transitions, ie. 2960/2970 cm-1
, 1575/1505 cm-1
,
1370/1340 cm-1
and 1120/1100 cm-1
pairs. They could equally have been used to
monitor the phase transitions and the crystallinity of PET.
Figure 3.9 The Change in Absorbance of the Cis Isomer at 1350 cm-1
with
Temperature Showing the Glass Transition Temperature, Tg, Cold
Crystallization Temperature, Tc1, and Melting Point, Tm, on Heating and the
Crystallization Temperature, Tc2, on Cooling.
(Red line indicates heating, blue cooling)
0.15
0.2
0.25
0.3
0.35
0.4
0.45
0 50 100 150 200 250 300
Change of Absorbance with Temperature
Ab
so
rba
nce
Temperature / oC
cis isomer
1450 cm-1
Tg
Tc1
Tc2
Tm

64
3.4.4 Type II Behaviour.
The absorption band at 1410 cm-1
has been assigned to –C-H bond of aromatic
ring stretching. It has played an important role in the characterization of the structure
of PET by IR spectroscopy since it has generally been used as an internal reference
against which all others can be ratioed [114]. It is also considered as being
effectively constant independent of crystallinity, orientation and in particular
temperature while all other bands change. The absorbance and peak maximum is
considered invariant with fractional crystallinity and degree of orientation and a
useful guide for changes in sample dimensions. It is thus important to establish effect
of temperature and thermal treatment on the shape, absorbance and position of the
band.
The temperature dependence of the absorbance of the 1410 cm-1
band was very
different from that observed from the Type I behaviour, see Figure 3.10. In the
heating run, a smooth drop with temperature was observed with a change in slope on
crystallization or melting instead of discontinuous jump during crystallization or
melting. On cooling the absorbance increased linearly with decreasing temperature
until the sample crystallized. The absorbance increased on further cooling but at a
much lower rate than before re-crystallization also with much lower value than on
initial heating.
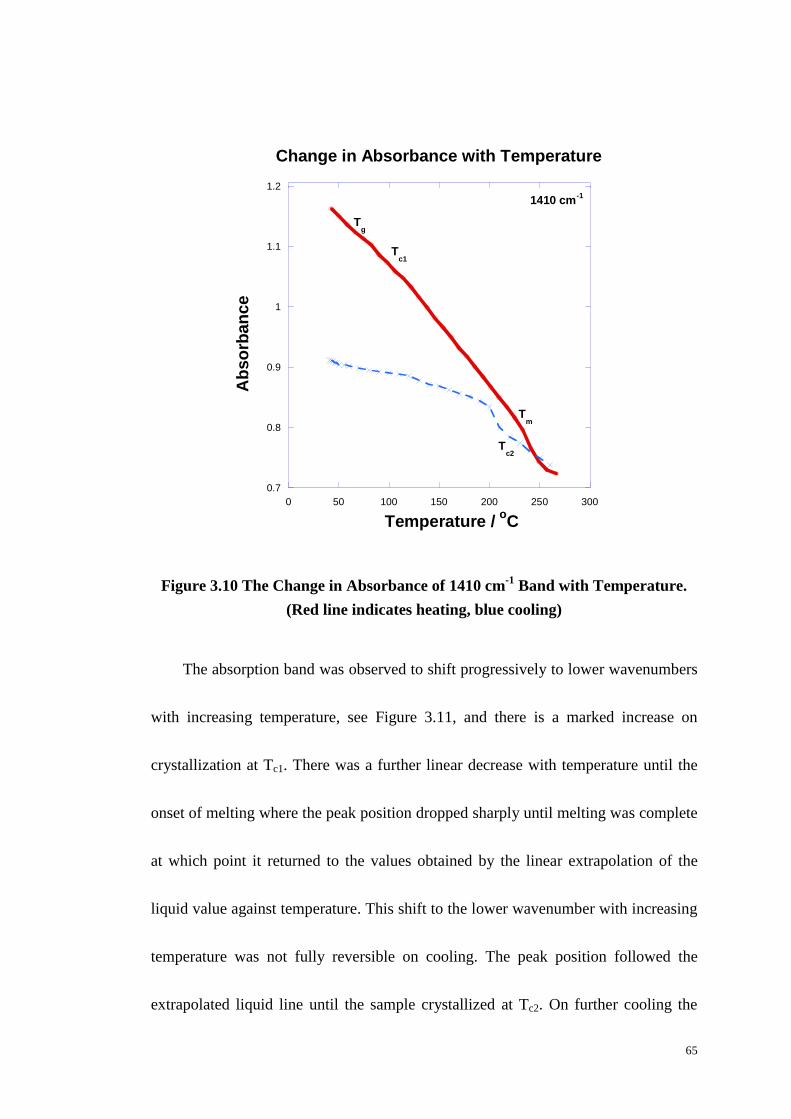
65
Figure 3.10 The Change in Absorbance of 1410 cm-1
Band with Temperature.
(Red line indicates heating, blue cooling)
The absorption band was observed to shift progressively to lower wavenumbers
with increasing temperature, see Figure 3.11, and there is a marked increase on
crystallization at Tc1. There was a further linear decrease with temperature until the
onset of melting where the peak position dropped sharply until melting was complete
at which point it returned to the values obtained by the linear extrapolation of the
liquid value against temperature. This shift to the lower wavenumber with increasing
temperature was not fully reversible on cooling. The peak position followed the
extrapolated liquid line until the sample crystallized at Tc2. On further cooling the
0.7
0.8
0.9
1
1.1
1.2
0 50 100 150 200 250 300
Ab
so
rban
ce
Temperature / oC
Tm
Tg
Tc1
Tc2
1410 cm-1
Change in Absorbance with Temperature
66
peak position continued to increase linearly in wavenumber but at higher values than
observed in the cold crystallization sample.
Figure 3.11 The Change in Peak Position of the 1410 cm-1
Band with Temperature.
(Red line indicates heating, blue cooling)
The shift in peak position on crystallization is less than 1 cm-1
and the
crystalline band which develops would almost completely overlap the initial
amorphous band. Changes in intensity due to the disappearance of the amorphous
band would be minimised by the inverse dependence of the crystalline absorbance
1406
1407
1408
1409
1410
1411
0 50 100 150 200 250 300
Change in Peak Position with Temperature
Peak P
osit
ion
Waven
um
be
r /
cm
-1
Temperature / oC
Tc1
Tm
Tc2
1410 cm-1
67
and would cancel one another if the extinction coefficients of the two band were
identical.
3.4.5 Special Mode of Type II Behaviour.
The effect of overlapping the two peaks was simulated by summing the
intensities of two well separated peaks due to ring stretching modes at 1505 cm-1
in
the crystalline regions and 1575 cm-1
in the amorphous, both of which belong to
Type I behaviour and similar to 1470/1450 cm-1
pair. The absorbances of the bands
increased and decreased to similar extents on crystallizing and melting, see Figure
3.12, such that on adding the two absorbances at each temperature resulted in little or
no net change during crystallization or melting, see Figure 3.13, but decreased with
increasing temperature followed a linear temperature dependent. To compare directly
with the absorption band at 1410 cm-1
, these absorbances were added over the full
temperature range on heating and cooling. The resulting trend was very similar to
that observed with the 1410 cm-1
band. In other words, two related but individual
Type I behaviour bands can be combined into a special mode of Type II behaviour.

68
Figure 3.12 The Change in Absorbance of with Temperature and on
Crystallization and Manelting at 1575 and 1505 cm-1
.
(Red lines indicates heating, blue cooling)
To summarize, Type II behaviour arises when the amorphous and crystalline
bands substantially overlap and it is not possible to follow the individual absorbances,
but only an average of the two is measured. There is then little or no change
associated with crystallization or melting. Nevertheless, the peak position changes on
crystallization or melting between the two limits set by the crystalline and
amorphous bands.
0.1
0.15
0.2
0.25
0.3
0.35
0.4
0 50 100 150 200 250 300
Change in Absorbance with Temperature
Ab
so
rba
nce
Temperature / oC
1575 cm-1
1505 cm-1

69
Figure 3.13 Simulation of Type II Behaviour Generated from Summing a
Pair of Type I Bands at 1575 and 1505 cm-1
.
3.5 Discussion.
3.5.1 Phase Transition Temperature of Individual Functional Group
Close examination of TA-FTIR response of the individual functional groups
with temperature show that they exhibit slightly different transition temperatures.
Groups which show Type I behaviour indicate that cold-crystallization occurs at 110-
120 oC with a change in absorbance. Those of Type II behaviour were less clear and
appeared to crystallize at a lower temperature i.e. at 100 oC, but this may reflect the
0.25
0.3
0.35
0.4
0.45
0.5
0.55
0.6
0 50 100 150 200 250 300
A1
575 +
A1
505
Temperature / oC
The Sum of the Absorbances of 1575 and 1505 cm-1
Tg
Tc1
Tc2
Tm

70
poorer sensitivity of the change in peak position to detect small changes rather than
any change in chain conformation. On heating further to melting, some functional
groups exhibit changes at a lower temperture (225 oC) than others. The aliphatic CH2
stretching band at 2950 cm-1
, the carbonyl stretching at 1727/1717 cm-1
, the glycol
methylene bending at 1470/1450 cm-1
, the glycol wagging at 1370/1340 cm-1
and the
ester bond stretching at 1120/1100 cm-1
show the onset of melting to be at 225 o
C.
Other functional groups seemed to be less sensitive to the onset of melting,
1575/1525 cm-1
aromatic ring stretching, 1410 cm-1
aromatic ring stretching and
1020/730 cm-1
benzene ring in-plane and out-plane bending. These show the onset of
melting to be at the higher temperature of 233 oC. However, in ever case the last
trace of crystallinity was observed to be 230 oC.
On cooling PET started to re-crystallize at 225 o
C and the bands at 1727/1717,
1120/1100, 1020/730 cm-1
respond immediately with a change in absorption while
others at 2950, 1575/1505, 1470/1450, 1410 and 1340 cm-1
occur later at 215 oC. The
phase transitions and the behaviour of the absorption bands on crystallization and
melting are summarised in Table 1.
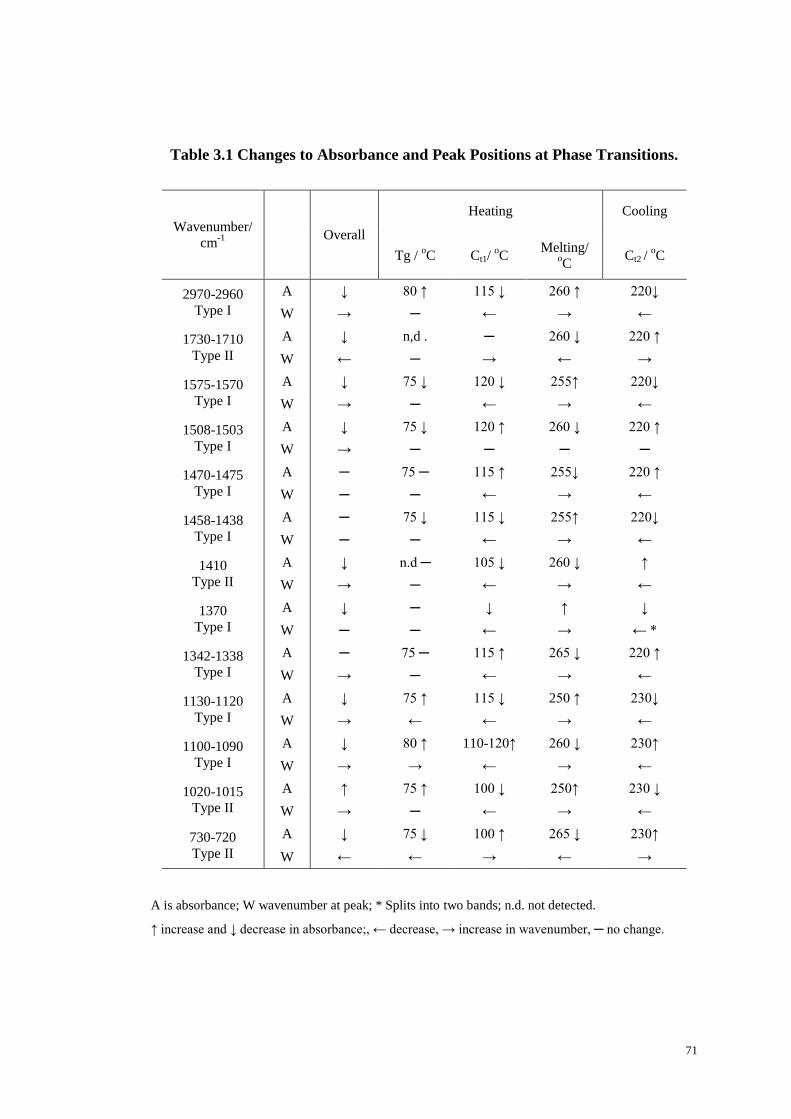
71
Table 3.1 Changes to Absorbance and Peak Positions at Phase Transitions.
Wavenumber/
cm-1
Overall
Heating Cooling
Tg / oC Ct1/
oC
Melting/ oC
Ct2 / oC
2970-2960 Type I
A ↓ 80 ↑ 115 ↓ 260 ↑ 220↓
W → ─ ← → ←
1730-1710 Type II
A ↓ n,d . ─ 260 ↓ 220 ↑
W ← ─ → ← →
1575-1570 Type I
A ↓ 75 ↓ 120 ↓ 255↑ 220↓
W → ─ ← → ←
1508-1503 Type I
A ↓ 75 ↓ 120 ↑ 260 ↓ 220 ↑
W → ─ ─ ─ ─
1470-1475 Type I
A ─ 75 ─ 115 ↑ 255↓ 220 ↑
W ─ ─ ← → ←
1458-1438 Type I
A ─ 75 ↓ 115 ↓ 255↑ 220↓
W ─ ─ ← → ←
1410 Type II
A ↓ n.d ─ 105 ↓ 260 ↓ ↑
W → ─ ← → ←
1370 Type I
A ↓ ─ ↓ ↑ ↓
W ─ ─ ← → ← *
1342-1338 Type I
A ─ 75 ─ 115 ↑ 265 ↓ 220 ↑
W → ─ ← → ←
1130-1120 Type I
A ↓ 75 ↑ 115 ↓ 250 ↑ 230↓
W → ← ← → ←
1100-1090 Type I
A ↓ 80 ↑ 110-120↑ 260 ↓ 230↑
W → → ← → ←
1020-1015 Type II
A ↑ 75 ↑ 100 ↓ 250↑ 230 ↓
W → ─ ← → ←
730-720 Type II
A ↓ 75 ↓ 100 ↑ 265 ↓ 230↑
W ← ← → ← →
A is absorbance; W wavenumber at peak; * Splits into two bands; n.d. not detected.
↑ increase and ↓ decrease in absorbance;, ← decrease, → increase in wavenumber, ─ no change.
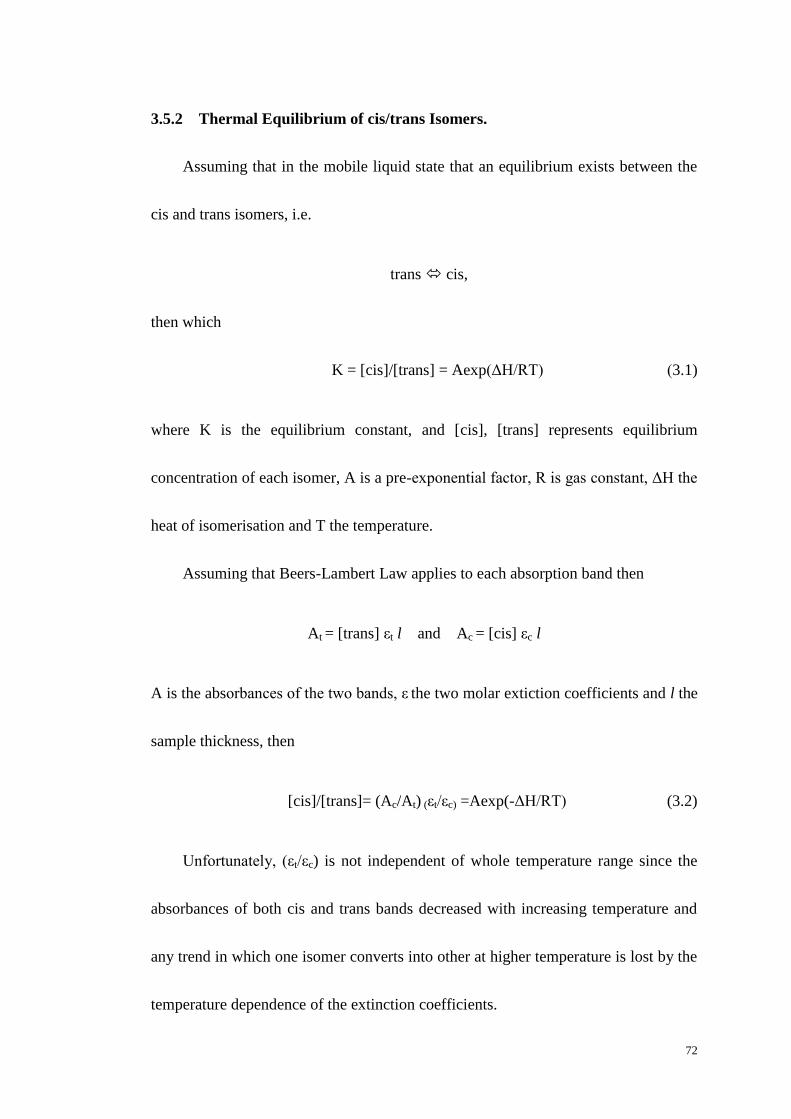
72
3.5.2 Thermal Equilibrium of cis/trans Isomers.
Assuming that in the mobile liquid state that an equilibrium exists between the
cis and trans isomers, i.e.
trans cis,
then which
K = [cis]/[trans] = Aexp(ΔH/RT) (3.1)
where K is the equilibrium constant, and [cis], [trans] represents equilibrium
concentration of each isomer, A is a pre-exponential factor, R is gas constant, ΔH the
heat of isomerisation and T the temperature.
Assuming that Beers-Lambert Law applies to each absorption band then
At = [trans] εt l and Ac = [cis] εc l
A is the absorbances of the two bands, ε the two molar extiction coefficients and l the
sample thickness, then
[cis]/[trans]= (Ac/At) (εt/εc) =Aexp(-ΔH/RT) (3.2)
Unfortunately, (εt/εc) is not independent of whole temperature range since the
absorbances of both cis and trans bands decreased with increasing temperature and
any trend in which one isomer converts into other at higher temperature is lost by the
temperature dependence of the extinction coefficients.
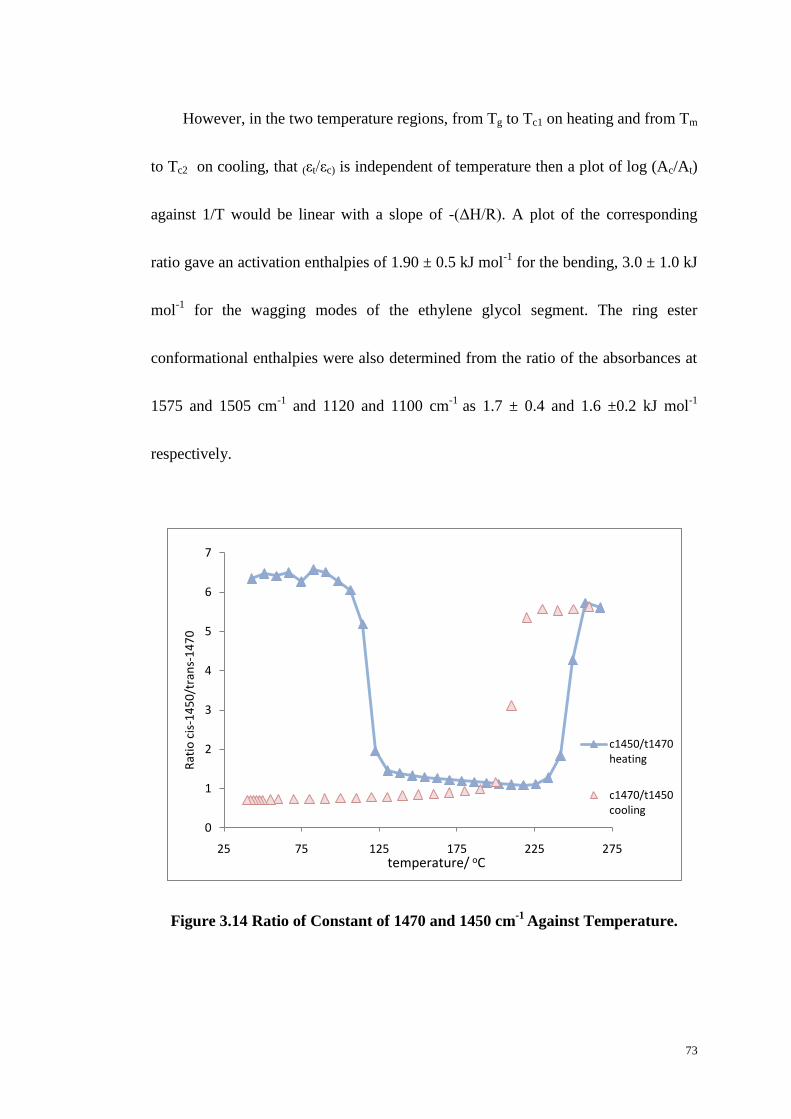
73
However, in the two temperature regions, from Tg to Tc1 on heating and from Tm
to Tc2 on cooling, that (εt/εc) is independent of temperature then a plot of log (Ac/At)
against 1/T would be linear with a slope of -(ΔH/R). A plot of the corresponding
ratio gave an activation enthalpies of 1.90 ± 0.5 kJ mol-1
for the bending, 3.0 ± 1.0 kJ
mol-1
for the wagging modes of the ethylene glycol segment. The ring ester
conformational enthalpies were also determined from the ratio of the absorbances at
1575 and 1505 cm-1
and 1120 and 1100 cm-1
as 1.7 ± 0.4 and 1.6 ±0.2 kJ mol-1
respectively.
Figure 3.14 Ratio of Constant of 1470 and 1450 cm-1
Against Temperature.
0
1
2
3
4
5
6
7
25 75 125 175 225 275
Rat
io c
is-1
45
0/t
ran
s-1
47
0
temperature/ oC
c1450/t1470 heating
c1470/t1450 cooling

74
3.5.3 Fractional Crystallinity Calculated from TA-FTIR Data
For a two phase partially crystalline polymer, the weight fraction crystallinity,
Xc, and the amorphous fraction, Xa, are related since
Xc + Xa = 1.0 (3.3)
At constant temperature and a partially crystalline sample the absorbance of the
cis or trans bands will both follow the fractional crystallinity and will decrease and
increase respectively. Accordingly,
Aa = (1-Xc) ε l (3.4)
At Xc = 1.0 , Ac = 0 and Xc = 0.0, Aa = Aa,T , where Aa,T is the value of the
absorbance at temperature T on the extrapolated amorphous line.
The fractional crystallinity of the sample is then
Xc = (A a,T - Aa) / A a,T (3.5)
The decrease in the absorbance of the cis isomer in Figure 3.8 on crystallization
is consistent with equations [3.4] and [3.5]. From the data presented in Figure 3.5B at
150 oC, the absorbance on the extrapolated amorphous line is 0.37, on heating is 0.25
and on cooling is 0.20. Substituting these values into Eq.[3.5], the fractional
crystallinity of the cold crystallized sample is 0.33, whilst that of the high
temperature crystallized material is 0.42 at 150oC. These fractional crystallinity

75
values are consistent with previous measurements on PET crystallized under similar
conditions [103-105].
3.6 Conclusions.
TA-FTIR has certain advantages over conventional thermal analytical
techniques in measuring the phase characteristics of polymer materials as has been
shown for PET. These lie in being able to measure the crystalline and amorphous
fractions directly from the absorbance of separate bands without the need to calibrate
with samples of known crystallinity. Absolute values of the crystallinity are
measured directly and are not limited by the sensitivity of the detectors since
measurements can be made over greater time periods to produce a detectable change.
This is not the case with conventional TA instruments which measure the rate of heat
evolution and is limited by the sensitivity of the detectors. It has been reported that
DSC is not capable of measuring isothermal crystallization of PET with half-lives
greater than several hours or indeed of measuring the very much slower secondary
crystallization process in PET [102-105]. Instead all measurements are restricted to
the primary crystallization process. TA-FTIR by measuring the fractional
crystallinity, rather than the rate of change with time, is not restricted in this way and
both primary and secondary processes can be measured to a similar degree of
accuracy [102].
76
Unlike DSC, which measures an overall transition temperature, TA-FTIR
assigns transition temperature to the onset of rotation or mobility of a particular chain
segment and can, in theory, detect the onset of pre-melting and molecular mobility.
The IR spectrum of PET is unduly complicated for its somewhat simple repeat
unit and this is undoubtedly due to the chain conformations which it can adopt.
Stretching, bending, wagging and deformation modes have been assigned to cis and
trans isomers of the ethylene glycol segments, which above the glass transition are in
thermal equilibrium and their absorbances changes with temperature, on crystallizing
and melting. Similarly the ester unit can adopted cis and trans placement relative to
the benzene ring and together with the stretching, in-plane and out-plane bending of
the aromatic –C-H groups a large number of bands are present and aromatic
substitute effects in the terephthalate group. In addition some of the bands change
their peak position according to whether they are associated with amorphous or
crystalline regions of the polymer, in particular the carbonyl stretching band occurs
at 1727 in the amorphous and 1717 cm-1
in the crystalline phase. The wavenumber
difference is sufficient to show the decrease in absorbance at the higher wavenumber
and the increase at lower, see Figure 3.4, and to deconvolute the overall band into its
components part thus enabling the amorphous and crystalline bands to be separately
analyzed in a kinetic study of the crystallization in Chapter 5.
77
Type I and II behaviour are observed in the variation of the absorbance with
temperature associated with the onset of rotational modes in the molecular chain and
the establishment of a dynamic equilibrium between the conformational isomers.
This enables the glass transition of the polymer to be determined from a change in
slope of the absorbance with temperature. Since the trans conformation alone can be
accommodated in the crystalline phase the absorbance of the trans isomer increases
on crystallization and decreases on melting; the overall change being dependent on
the fractional crystallinity. In this way the crystallinity of the polymer can be
determined along with the stability of the various phases established.
78
Chapter Four
FTIR Spectroscopic Analysis and Two-
dimensional Infrared Correlation Spectroscopy
of PET on Isothermal Crystallization
4.1 Introduction.
The IR spectra of PET were found to undergo substantial changes in the
position, intensity and breadth of the absorption bands on thermal cycling. However,
these changes were accompanied with temperature dependent effects which meant
that they increased or decreased with temperature without any phase transitions being
involved. They were undoubtedly associated with the thermal equilibrium of the
cis/trans isomerization but could also involve changes to the extinction coefficients.
To remove the temperature dependence and leave only phase transition effects such
79
as crystallization and melting, isothermal treatment was chosen at a temperature
between the onset of hot crystallization and melting.
The increase and decrease in absorbance, shifting in peak position and change in
shape was then due entirely to the transition and not change in temperature.
Excluding a few main absorption peaks whose changes can be observed clearly, the
behaviour of the weaker peaks were not so obvious. Overlapping of these peaks also
produced some difficulty in recognizing and quantifying changes especially where
they exhibited different behaviour. Two-dimensional infrared spectroscopy was used
to assist in recognizing the trend in behaviour with extent of transformation since it
was a novel analytical technique for analyzing a series of FTIR spectra series with
time.
4.2 Background Research on FTIR Spectrum of PET
The main absorption bands in the IR spectrum of PET see Figure 3.3 have been
assigned as follows; the bands, at 3100 and 2800 cm-1
have been attributed to
aromatic and aliphatic –C-H bond stretching, 1720cm-1
to the ester carbonyl bond
C=O stretching, 1470-1350 cm-1
to bending and wagging vibrational modes of the
ethylene glycol segment, 1235 cm-1
to the ester group stretching, 1090 cm-1
to the

80
methylene group and aromatic bands in-plane/out-plane bending at 1016 and
725 cm-1
.
Many of the remaining bands depend on the manufacturing procedure and
molecular conformation state of PET sample, i.e. whether has been extruded and
quenched, heat treated and subsequently drawn, in other word, whether the sample is
amorphous or crystalline, or oriented by stretching. Differences are due to
conformation of the ethylene glycol group and also phenylene carbonyl bonds
(cis/trans isomers).
Many of these absorption bands split as a result of the differences between the
force fields in the amorphous and crystalline regions and also between cis and trans
isomers. In the crystal, the trans isomer only is present but in the amorphous regions
both cis and trans isomers are present in dynamic equilibrium. This in turn is
temperature as well as degree of orientation dependent [113].
Since crystallization can also occur on stretching, depending on temperature, the
precise assignments of the absorption bands in the IR spectrum in terms of
crystallinity and changes in chain conformation have been disputed. Ward et al. [113]
have assigned bands at 1470, 1340, 975 and 845 cm-1
to the vibrations of the trans
isomer of the ethylene glycol segment trans isomer and at 1450, 1370, 1040 and 898
cm-1
to the cis. Liang and Krimm [108] have attributed differences to changes in

81
symmetry and resonance effects of the substituted benzene ring on the basis of model
and deuterated compounds. Miyake [111] observed that the bands at 973, 895 and
845 cm-1
increase on drawing while those at 1453. 1370, 1337 and 1042 cm-1
decreased but Cobbs [109] and Burton used the bands at 1340 and 972 cm-1
to follow
the crystallization of PET on heating, while Miller and Willis [110] used the
808 cm-1
band to follow the decrease in amorphous content. Schmidt [112] observed
changes to the 795, 848, 875, 896, 973, 988, 1018, 1022, 1042, 1172 cm-1
bands and
attributed the cis isomer to 896 and 1042cm-1
and the trans to 848 and 973 cm-1
bands on heating and stretching.
In a study of physical ageing of amorphous PET, Aref-Azar and Hay [101] used
the bands at 896 and 973 cm-1
to measure the temperature dependent equilibrium of
the rotation of the ethylene glycol segment, assigning these bands to cis and trans
conformations respectively while others [95] have used the 1340 cm -1
band for trans
and 1370 cm-1
for the cis conformation. The band at 1340 cm -1
was also attributed to
crystalline and that at 1370 cm-1
to amorphous regions.
Miyake [111] also observed that the bands at 1453, 1370, 1042, and 895 cm-1
decreased linearly with draw ratio while those at 1410, 1018, 874 were constant
while 1337, 973 and 845 cm-1
increased. On heating, peaks at 1453 moves to 1456,
1119 moves to 1126, 1099 to 1101, 873 to 874 and 841 to 848 cm-1
. 1475cm-1
82
appeared on heating while 1453 decreased in intensity. Many of these peaks were
assigned by analogy to model compounds and by examination of changes observed
on melting and re-crystallization.
Orientation has a marked effect on the IR spectrum of PET and in particular on
intensities and shift in the position of the bands [100, 101, 103, 105, 106, 111]. Trans
isomers increase with draw ratio at the expense of the cis and have been used to
measure degree of orientation. In these studies the band at 973 cm-1
is assigned to
CH2 trans; 896 cm-1
to cis; 1337 cm-1
to the CH2 cis wagging mode and 1340 cm-1
to
trans mode; 1020 cm-1
to in-plane bending of C-H group and 730 cm-1
to out-of-
plane bending of the benzene ring. Bands at 749 and 1410 cm-1
are also associated
with benzene ring vibrations.
In conclusion, crystal field effects produce sharper and more intense bands at
1475, 1387, 988 and 874 cm-1
, while bands at 1453, 1370, 1042, 973, 895 and 841
cm-1
are due to changes in chain conformation and to the presence of rotational
isomers, cis to trans; 909 and 860 cm-1
to trans and 898 and 870 cm-1
to cis; 848cm-1
to the trans -CH2- rocking and the 895 cm-1
to cis. Rotational isomer bands appear as
two peaks one increasing and the other decreasing on crystallization or melting, 1453
and 1456 cm-1
; 1337 and 1370 cm-1
due to -CH2- wagging. 1042 cm-1
is the anti-
83
symmetrical C-O stretch of cis form. The trans is symmetrical and does not appear in
IR spectra of PET [100].
4.3 Two-dimensional Infrared Spectroscopy.
4.3.1 General Two-dimensional Correlation Spectroscopic
Two-dimensional infrared spectroscopy is a novel analytical technique in
vibrational spectroscopy which can be used to interpret spectral changes
accompanying a change in structure or composition. As such it is useful in analyzing
the development of crystallinity within a polymer in which amorphous regions are
transformed into crystalline regions involving changes in molecular conformation.
Noda [115] proposed to call the procedure two-dimensional infrared (2D IR)
spectroscopy by analogy to the 2D correlation techniques used extensively with time-
resolved spectral signals in NMR spectroscopy. Later Noda modified the method to
analyzing non-oscillating spectra and generalized it to two-dimensional correlation
spectroscopy [116-123].
The mathematical procedure to yield 2D correlation spectra can be used to
handle arbitrary forms of variable dependent complex spectral signals. Nowadays,
2D correlation methods are widely used in IR, Raman, X-ray, fluorescence and many
other spectroscopies for characterizing functional group, conformation change and
84
complex material structure etc [124-145]. In recent year it has even developed and
derived a new concept of sample-sample correlation [146-148].
4.3.2 Principles of Two-dimensional Infrared Spectroscopy
The mathematical procedure involved in obtaining 2D correlation spectra from
time or temperature dependent complex spectra has been outlined by Noda and
Ozaki in some detail [115-118, 122, 149-151].
If ),( tvy defines the perturbation-induced variations in intensities of spectra
observed at fixed intervals (time, temperature or some other external variable), t
between tmin and tmax then the dynamic spectrum of the system, ),(~ tvy is defined as
)(),(),(~ vytvytvy for tmin ≦t≦tmax (4.1)
where )(vy is the initial or reference spectrum of the system.
The intensity of the 2D correlation spectrum X (ν1, ν2) is then represented as
),(~),(~),( 2121 tvytvyvv
(4.2)
where X (ν1, ν2) is a quantitative measure of comparative similarities or
dissimilarities in the intensities. ),(~ tvy is measured at two separate variables; ν is the
wavenumber and time or temperature, t, at fixed intervals.
85
The symbol < > is the cross-correlation function and is designed to compare the
two dependences of the spectra at t.
Simplifying Noda treatment, X (ν1, ν2) is a complex number function, such that
X (ν1, ν2) = Φ (ν1, ν2) + iΨ(ν1, ν2) (4.3)
It includes both real and imaginary components, which are recognized as
synchronous and asynchronous 2D correlation intensities. The synchronous 2D
correlation intensity Φ(ν1, ν2) illustrate the overall similarity or coincidental trends
of the two separate intensity variations, i.e. it is an in-phase character of the system.
The asynchronous 2D correlation intensity Ψ(ν1, ν2) is considered to be a
measure of dissimilarity or, more strictly speaking, out-of-phase character of the
spectral intensity variations [116].
The construction of 2D correlation spectra based on sinusoidally varying signals,
especially IR dichroism. A sinusoidally varying dynamic spectrum with a fixed
frequency Ω has the general form
tvAtvAtvy cos)(sin)(),(~ (4.4)
where A’(v) and A’’(v) are the amplitudes of two orthogonal component in-phase and
quadrature of the sinusoidal function.
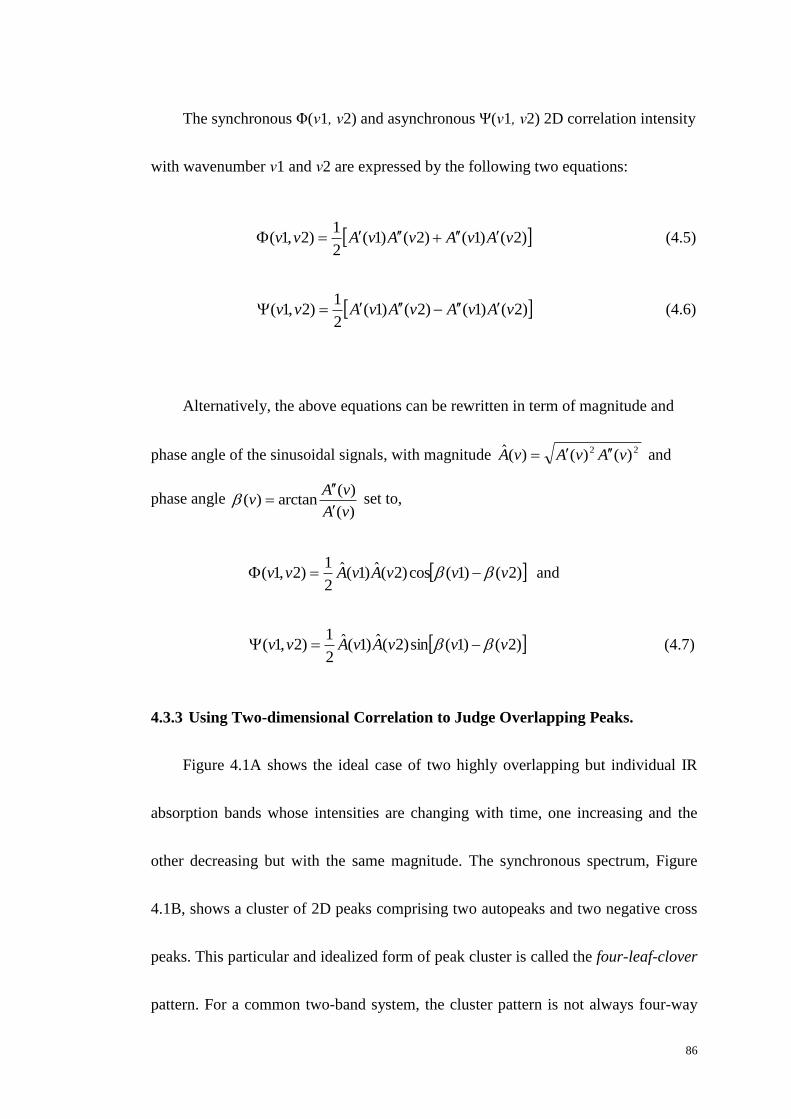
86
The synchronous Φ(ν1, ν2) and asynchronous Ψ(ν1, ν2) 2D correlation intensity
with wavenumber ν1 and ν2 are expressed by the following two equations:
)2()1()2()1(2
1)2,1( vAvAvAvAvv
(4.5)
)2()1()2()1(2
1)2,1( vAvAvAvAvv
(4.6)
Alternatively, the above equations can be rewritten in term of magnitude and
phase angle of the sinusoidal signals, with magnitude 22 )()()(ˆ vAvAvA and
phase angle )(
)(arctan)(
vA
vAv
set to,
)2()1(cos)2(ˆ)1(ˆ2
1)2,1( vvvAvAvv and
)2()1(sin)2(ˆ)1(ˆ2
1)2,1( vvvAvAvv
(4.7)
4.3.3 Using Two-dimensional Correlation to Judge Overlapping Peaks.
Figure 4.1A shows the ideal case of two highly overlapping but individual IR
absorption bands whose intensities are changing with time, one increasing and the
other decreasing but with the same magnitude. The synchronous spectrum, Figure
4.1B, shows a cluster of 2D peaks comprising two autopeaks and two negative cross
peaks. This particular and idealized form of peak cluster is called the four-leaf-clover
pattern. For a common two-band system, the cluster pattern is not always four-way
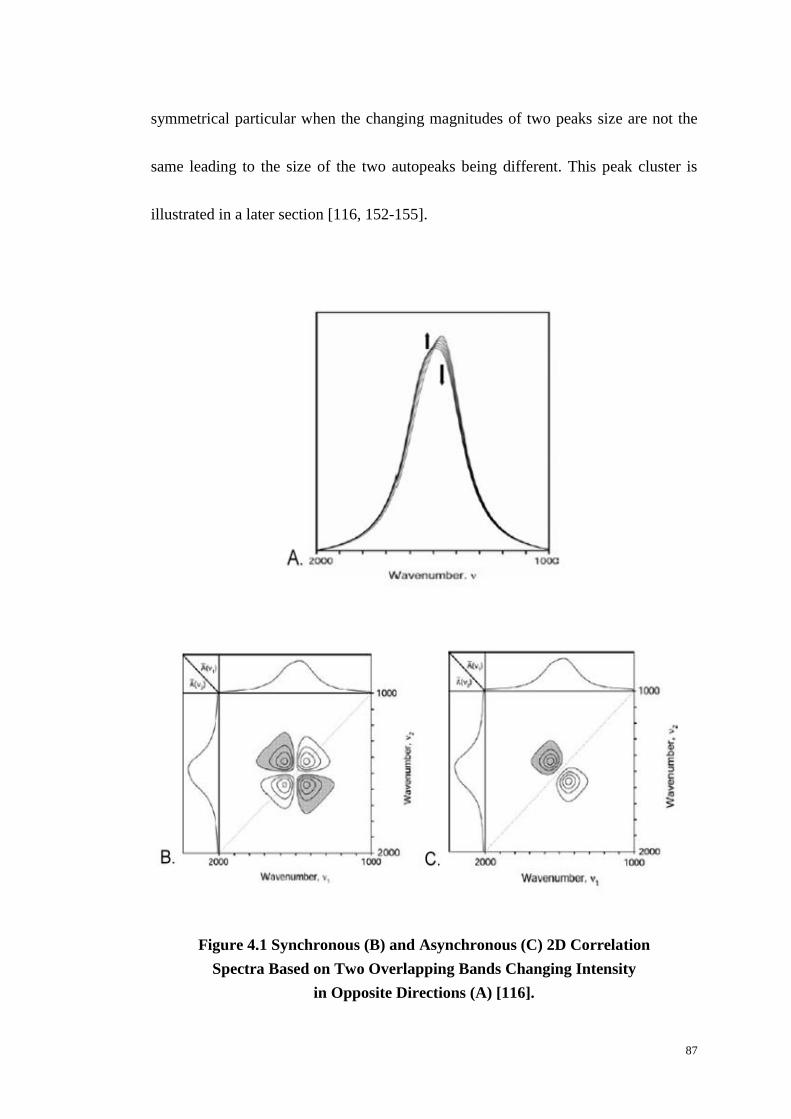
87
symmetrical particular when the changing magnitudes of two peaks size are not the
same leading to the size of the two autopeaks being different. This peak cluster is
illustrated in a later section [116, 152-155].
Figure 4.1 Synchronous (B) and Asynchronous (C) 2D Correlation
Spectra Based on Two Overlapping Bands Changing Intensity
in Opposite Directions (A) [116].
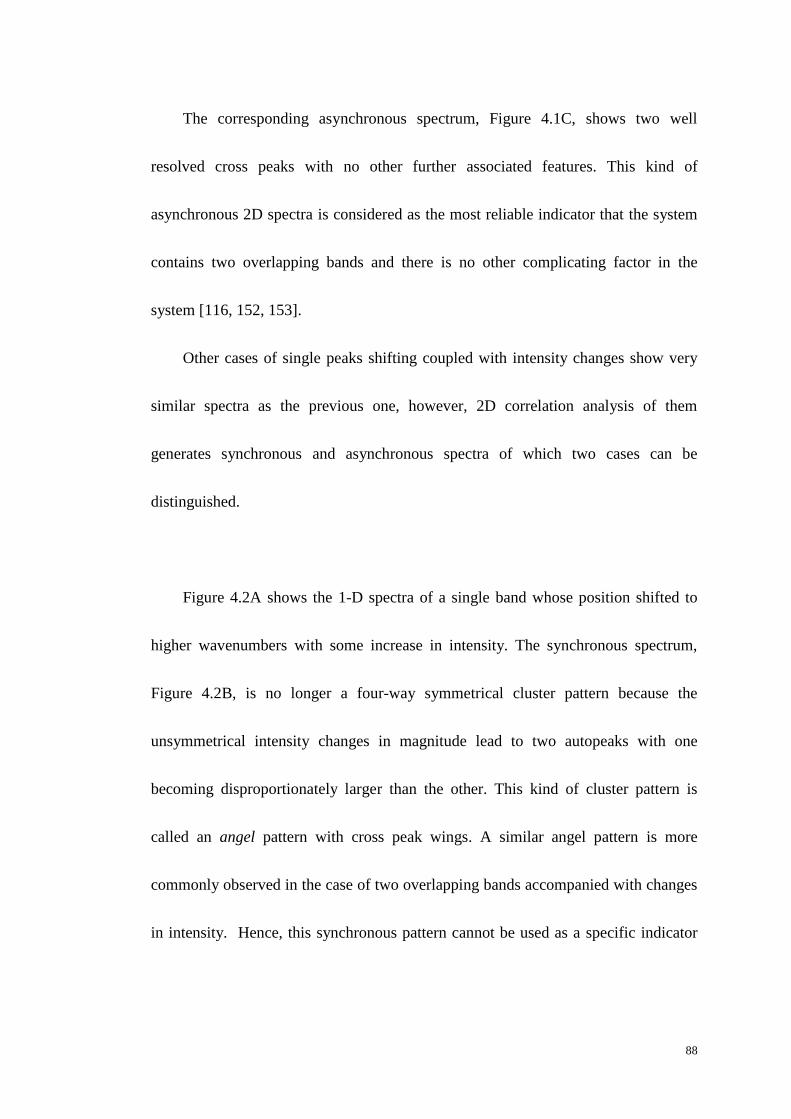
88
The corresponding asynchronous spectrum, Figure 4.1C, shows two well
resolved cross peaks with no other further associated features. This kind of
asynchronous 2D spectra is considered as the most reliable indicator that the system
contains two overlapping bands and there is no other complicating factor in the
system [116, 152, 153].
Other cases of single peaks shifting coupled with intensity changes show very
similar spectra as the previous one, however, 2D correlation analysis of them
generates synchronous and asynchronous spectra of which two cases can be
distinguished.
Figure 4.2A shows the 1-D spectra of a single band whose position shifted to
higher wavenumbers with some increase in intensity. The synchronous spectrum,
Figure 4.2B, is no longer a four-way symmetrical cluster pattern because the
unsymmetrical intensity changes in magnitude lead to two autopeaks with one
becoming disproportionately larger than the other. This kind of cluster pattern is
called an angel pattern with cross peak wings. A similar angel pattern is more
commonly observed in the case of two overlapping bands accompanied with changes
in intensity. Hence, this synchronous pattern cannot be used as a specific indicator
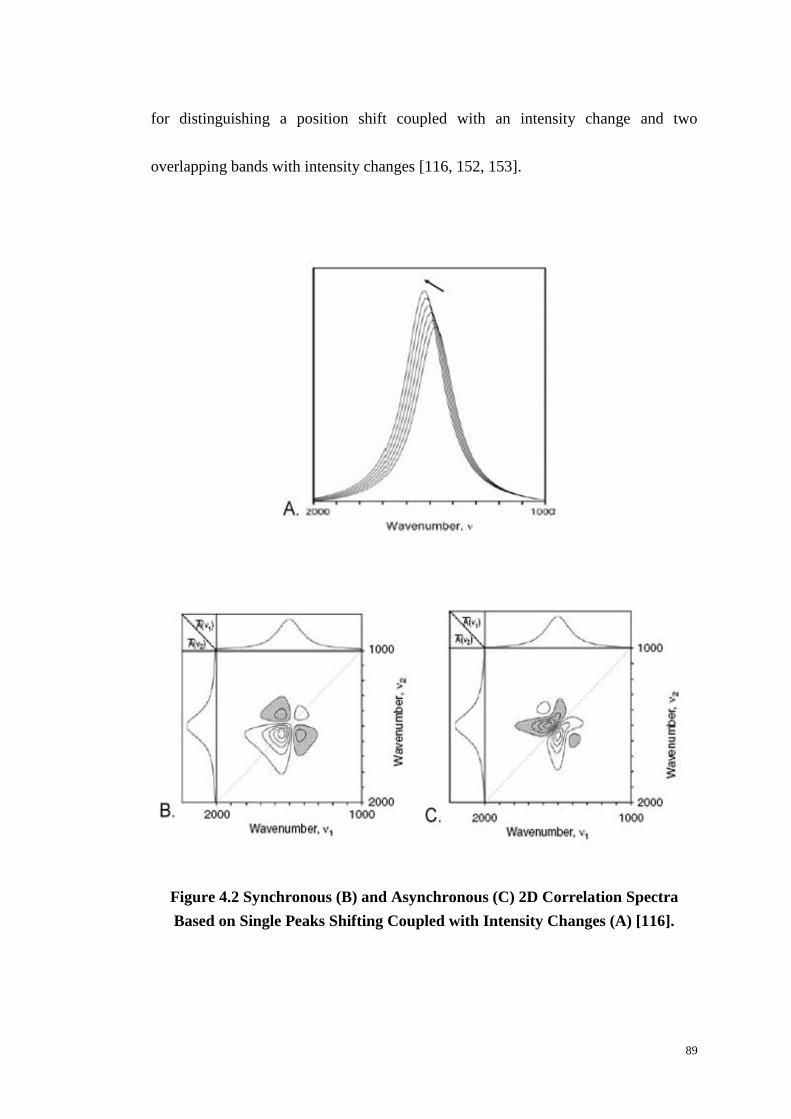
89
for distinguishing a position shift coupled with an intensity change and two
overlapping bands with intensity changes [116, 152, 153].
Figure 4.2 Synchronous (B) and Asynchronous (C) 2D Correlation Spectra
Based on Single Peaks Shifting Coupled with Intensity Changes (A) [116].
90
The asynchronous spectrum, Figure 4.2C is represented by a distorted butterfly
pattern when the intensity variation is accompanied with a shift in band position. A
standard butterfly pattern is normally observed in the asynchronous map of the 1D
spectra series with band position shift only. The pair of main asynchronous cross
peaks is distributed closer to the stronger synchronous autopeak side and covers the
whole range where both positive and negative synchronous autopeaks and cross
peaks located [116, 152, 153].
This case is easily confused with the more common case of two overlapping
bands with some noise in the spectra which produces secondary cross peaks in the
asynchronous map. However, the feature observed above in the main asynchronous
cross peaks are a clear indication of this. The asynchronous cross peaks are generated
from more complex procedures with less clear internal broad band variations, rather
than simple intensity changes of two overlapped bands. Another potential cause is
that of a weak secondary pair of cross peaks in the asynchronous spectrum. This pair
of cross peaks is located far from the diagonal but inside the range of the main
asynchronous cross peaks. In some cases, these weak cross peaks are not obvious and
overlooked due to their small magnitude compared with the strong main cross peaks.
By adjusting the contour level of the 2D spectrum plots the existence of such weak
cross peaks can become more evident [116, 152, 153].
91
4.4 Isothermal Crystallization on FTIR Spectrum and Two-
dimensional Infrared Spectroscopy Correlation of PET.
4.4.1 Isothermal Crystallization on FTIR.
Figure 4.3 shows the selected time-dependent FTIR spectra of PET on rapid
cooling from 275oC, above the melting point, to the temperature of onset
crystallization as observed to occur by DSC at 234oC [104, 105]. It can be seen that
substantial changes in the position, intensity and breadth of the absorption bands
occur. These differences result from temperature and conformational effects but the
isothermal changes are due to the development of crystallinity only. Significant
changes take place to the carbonyl band at 1727 cm-1
as it decreases in intensity and a
second band at 1717 cm-1
develops with isothermal crystallization consistent with the
disappearance of the amorphous component and an increase in the crystalline
component. A sharper peak develops at 1340 cm-1
, which is due to the wagging
vibrations of the –CH2–, associated with the isothermal transformation. Other
changes included an increase in intensity, change in shape and shift in wavenumber
of the bands at 2960, 1470/1450, 1260, 1100/1090 and 725 cm-1
as can be seen in
Figure 4.3. The changes with time are displayed to highlight them.
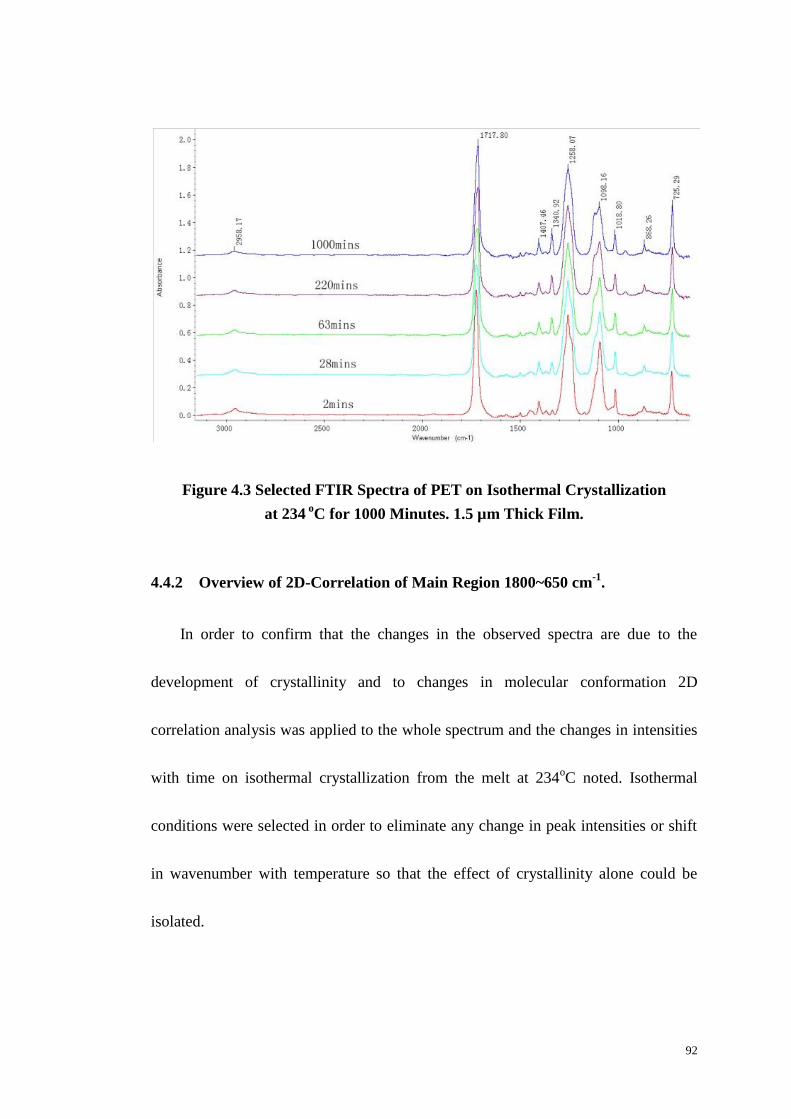
92
Figure 4.3 Selected FTIR Spectra of PET on Isothermal Crystallization
at 234 o
C for 1000 Minutes. 1.5 µm Thick Film.
4.4.2 Overview of 2D-Correlation of Main Region 1800~650 cm-1
.
In order to confirm that the changes in the observed spectra are due to the
development of crystallinity and to changes in molecular conformation 2D
correlation analysis was applied to the whole spectrum and the changes in intensities
with time on isothermal crystallization from the melt at 234oC noted. Isothermal
conditions were selected in order to eliminate any change in peak intensities or shift
in wavenumber with temperature so that the effect of crystallinity alone could be
isolated.
93
Generalized 2D IR correlation spectra based on the IR spectra of the partially
crystalline, v2, and totally amorphous PET samples, v1, in the reduced range 1800-
650cm-1
where most of the changes were observed, are shown in Figures 4.4A and B.
Seven diagonal peaks, i.e. autopeaks, are present in the regions, 1780-1680 cm-1
,
1400 cm-1
, 1350-1200 cm-1
, 1100 cm-1
, 780-730 cm-1
, and the change in intensities
are clearly associated with the development of crystallinity with time. Many more
positive cross or off-diagonal peaks are present; these represent simultaneous
changes in the peak intensities at different wavenumbers and as they are increasing in
intensities they are due to the development of crystallinity. Negative cross peaks are
also present, as light patches, and these are attributed to the reduction in amorphous
content in the polymer since their intensities decrease with increasing crystallinity.
The asynchronous 2D correlation spectrum shows sequential changes in the
intensities measured at different wavelengths and only develops cross peaks if the
absorption bands are out of phase with one other. As expected the asynchronous
correlation spectrum in Figure 4.4B shows no autopeaks and only off-diagonal cross
peaks of low intensities, suggesting that the changes in peak intensities are closely
related to one another, and that the increase in the development of crystalline peaks
closely follow the loss in amorphous peaks. Because of the large differences in
intensities observed between the bands and the complex nature of the changes
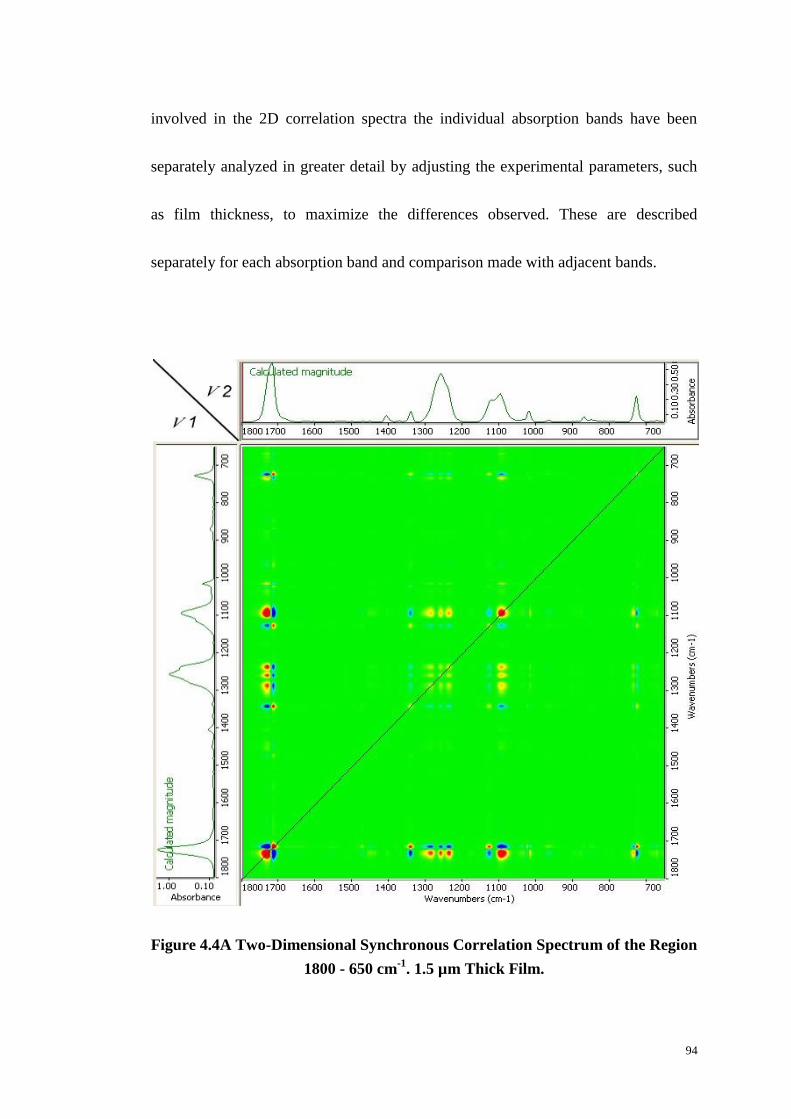
94
involved in the 2D correlation spectra the individual absorption bands have been
separately analyzed in greater detail by adjusting the experimental parameters, such
as film thickness, to maximize the differences observed. These are described
separately for each absorption band and comparison made with adjacent bands.
Figure 4.4A Two-Dimensional Synchronous Correlation Spectrum of the Region
1800 - 650 cm-1
. 1.5 µm Thick Film.
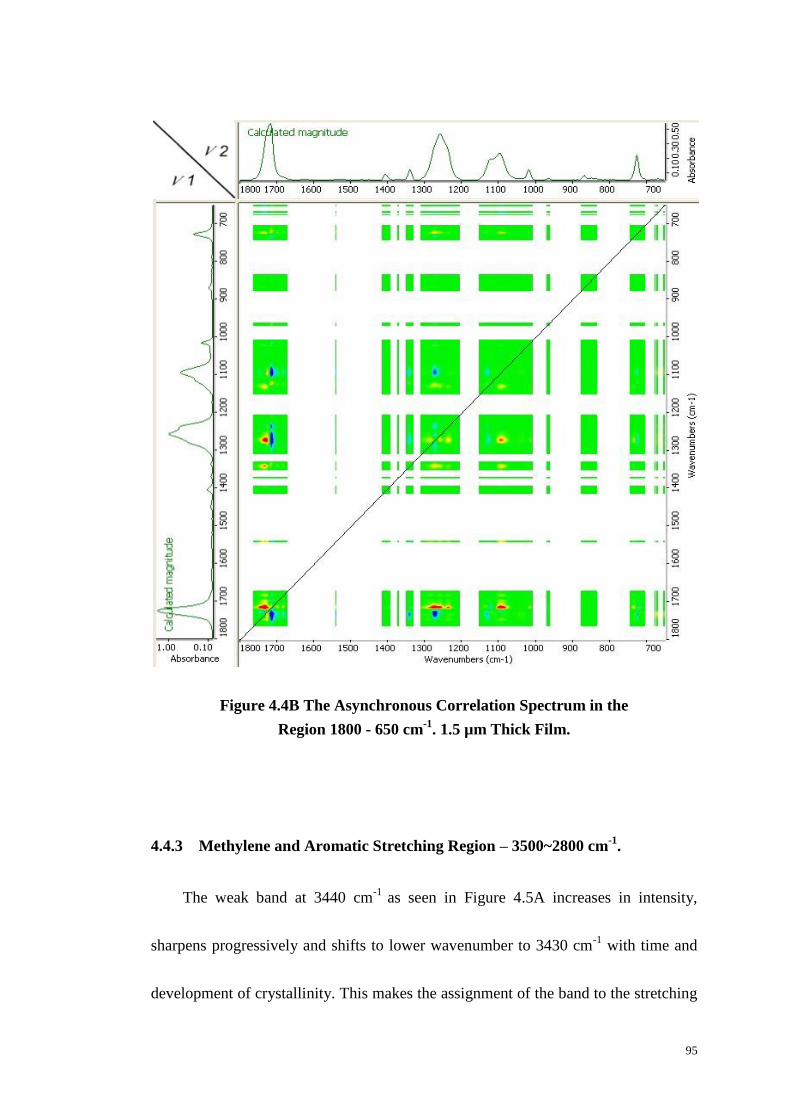
95
Figure 4.4B The Asynchronous Correlation Spectrum in the
Region 1800 - 650 cm-1
. 1.5 µm Thick Film.
4.4.3 Methylene and Aromatic Stretching Region – 3500~2800 cm-1
.
The weak band at 3440 cm-1
as seen in Figure 4.5A increases in intensity,
sharpens progressively and shifts to lower wavenumber to 3430 cm-1
with time and
development of crystallinity. This makes the assignment of the band to the stretching
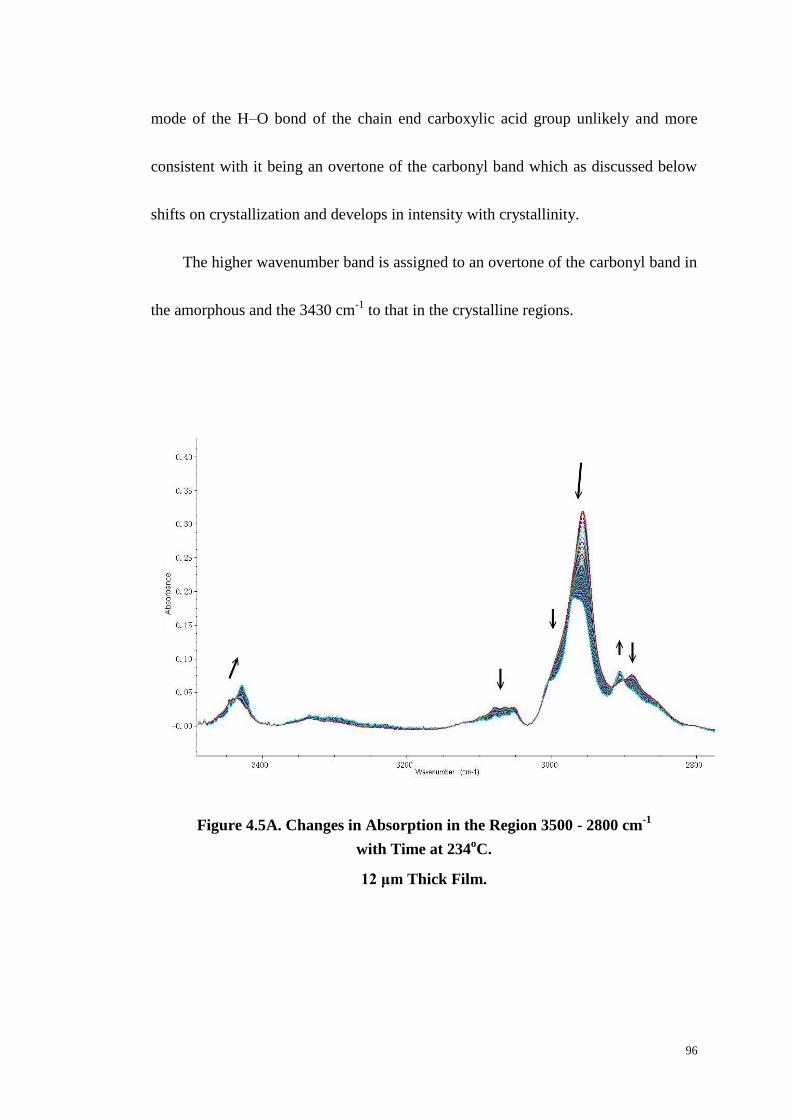
96
mode of the H–O bond of the chain end carboxylic acid group unlikely and more
consistent with it being an overtone of the carbonyl band which as discussed below
shifts on crystallization and develops in intensity with crystallinity.
The higher wavenumber band is assigned to an overtone of the carbonyl band in
the amorphous and the 3430 cm-1
to that in the crystalline regions.
Figure 4.5A. Changes in Absorption in the Region 3500 - 2800 cm-1
with Time at 234oC.
12 μm Thick Film.
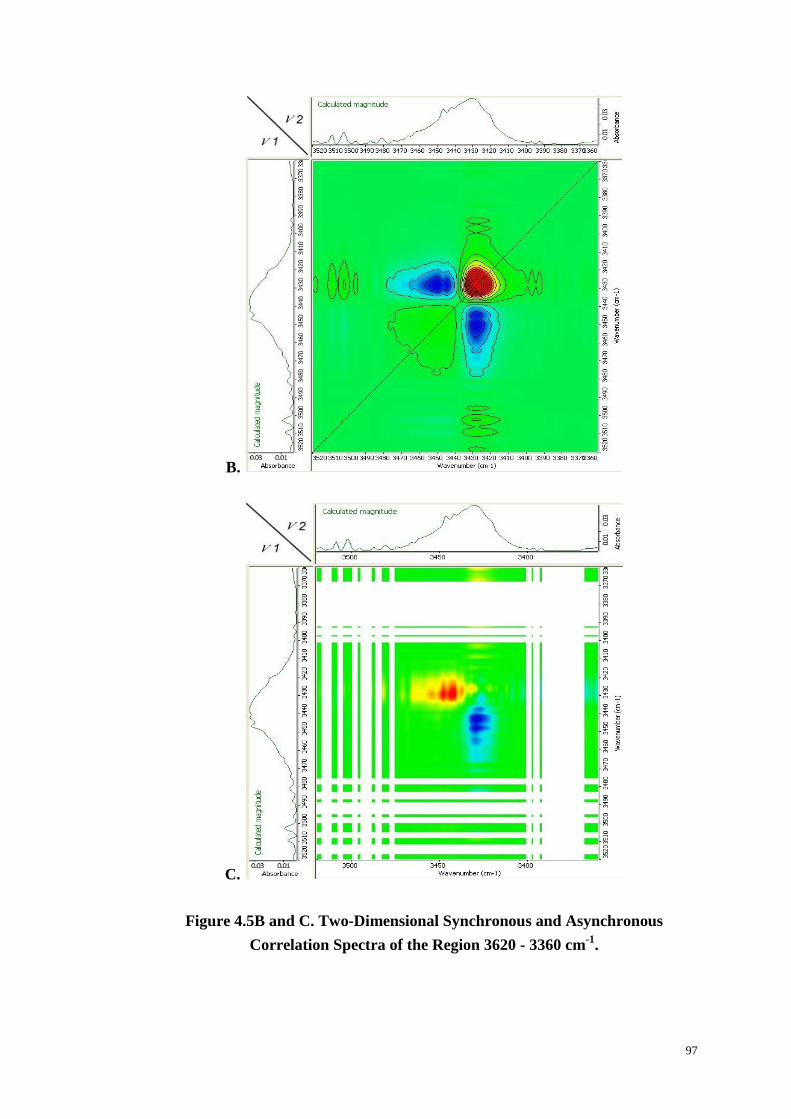
97
B.
C.
Figure 4.5B and C. Two-Dimensional Synchronous and Asynchronous
Correlation Spectra of the Region 3620 - 3360 cm-1
.

98
D.
E.
D and E. Two-Dimensional Synchronous and Asynchronous Correlation
Spectra of the Methylene Absorption Band in Region 3100 - 2800 cm-1
.
Figure 4.5
99
The 2D synchronous correlation spectrum, see Figure 4.5B, is characteristic of
two overlapping bands whose intensities are changing in the opposite direction, the
lower wavenumber one increasing while the higher one is decreasing but to a lesser
extent. There are accordingly two autopeaks, the lower wavenumber one of which
dominates the intensity contours, and two cross peaks both of which are negative.
This produces a somewhat distorted clover leaf pattern.
The asynchronous correlation spectrum is somewhat diffuse because of the low
intensities of the bands; see Figure 4.5C, but there is clearly two cross peaks, one of
which is positive and the other negative, consistent with the changes in peak intensity
associated with the transformation being linked together one increasing and the other
decreasing.
The four bands between 3100 and 3050 cm-1
are attributed to the stretching
modes of the four aromatic C–H bonds of the terephthalate ring. The bands do not
change position with time but there is a decrease in intensity as crystallinity develops.
This decrease is more than can be accounted for in terms of experimental error and is
attributed to differences in the extinction coefficients of the C–H bonds in the
amorphous and crystalline regions.
The doublet at 2960 and 2910 cm-1
is attributed to the stretching mode of the
aliphatic -CH2- groups in the ethylene glycol segment and present in the amorphous
100
regions. Accordingly, it is assigned to the cis isomer and its intensity drops with time
as a result of the phase transformation. It is accompanied with the progressive
development of a smaller band at 2890 cm-1
, the trans isomer or crystalline band. A
second trans peak develops at 3000 cm-1
as a shoulder on the cis 2960 cm-1
peak.
The contour map of the 2D synchronous correlation spectrum, see Figure 4.5D,
is dominated by the intense methylene absorption band at 2960 cm-1
such that there
appears to be only one autopeak, at 2960 cm-1
and four cross peaks, two positive
(2960, 2880 and 2960, 2980 cm-1
) and two negative (2960, 2910 and 2960,
3010 cm-1
) indicating that the change in intensities of the peaks are linked together
and occurring as a result of the transformation. The positive cross peak at 2960,
3070 cm-1
indicates that the aromatic C–H bands are changing in intensity in the
same way as the cis isomer of the methylene group, and is due to crystallization.
(Figure 4.5D.)
The asynchronous correlation spectrum shows two cross peaks, one positive and
the other negative, indicating that the intensities of the two peaks are changing in
different direction but the changes are linked, see Figure 4.5E.
101
4.4.4 The Carbonyl Stretching Region – 1800~1650 cm-1
.
The changes to the carbonyl absorption band at 234oC with time are shown in
Figure 4.6A. There is an obvious decrease in intensity of the initial amorphous band
at 1727 cm-1
followed by a simultaneous increase at 1717 cm-1
. An isobestic point
appeared in the absorbance at 1720 cm-1
consistent with a simultaneous change from
amorphous to crystalline.
The corresponding correlation spectra of the carbonyl absorption band in 3 and
2- dimensions, shown in Figure 4.6B and C, are derived from a series of spectra at
234 oC collected over time characteristic of the amorphous and crystallizing sample.
They comprise two positive autopeaks and two negative cross peaks. The
3-dimensional synchronous correlation map, see Figure 4.6B shows a large peak at
high wavenumber which progressively decreases in intensity and a second which
develops simultaneously at a lower wavenumber. The two are clearly coupled. The
2-dimensional map in Figure 4.6C has the characteristic angel pattern of a single
absorption band which shifts from higher to lower wavenumber and with different
intensities. The lower symmetry of the angel pattern arises from the difference in
breadth of the two bands – the amorphous is broad and the crystalline comparatively
sharp - and the maximum intensity of the two autopeaks can be used to define the
wavenumber of the initial and final peak, at 1727 and 1717 cm-1
respectively.
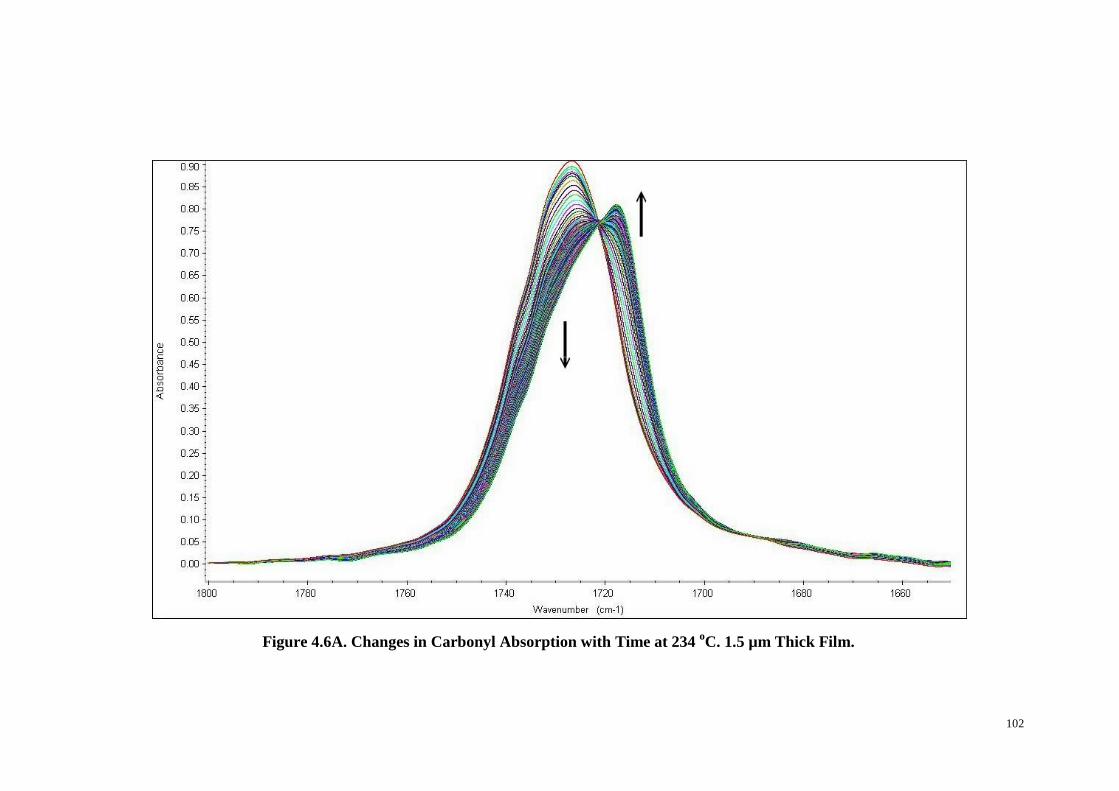
102
Figure 4.6A. Changes in Carbonyl Absorption with Time at 234 oC. 1.5 µm Thick Film.
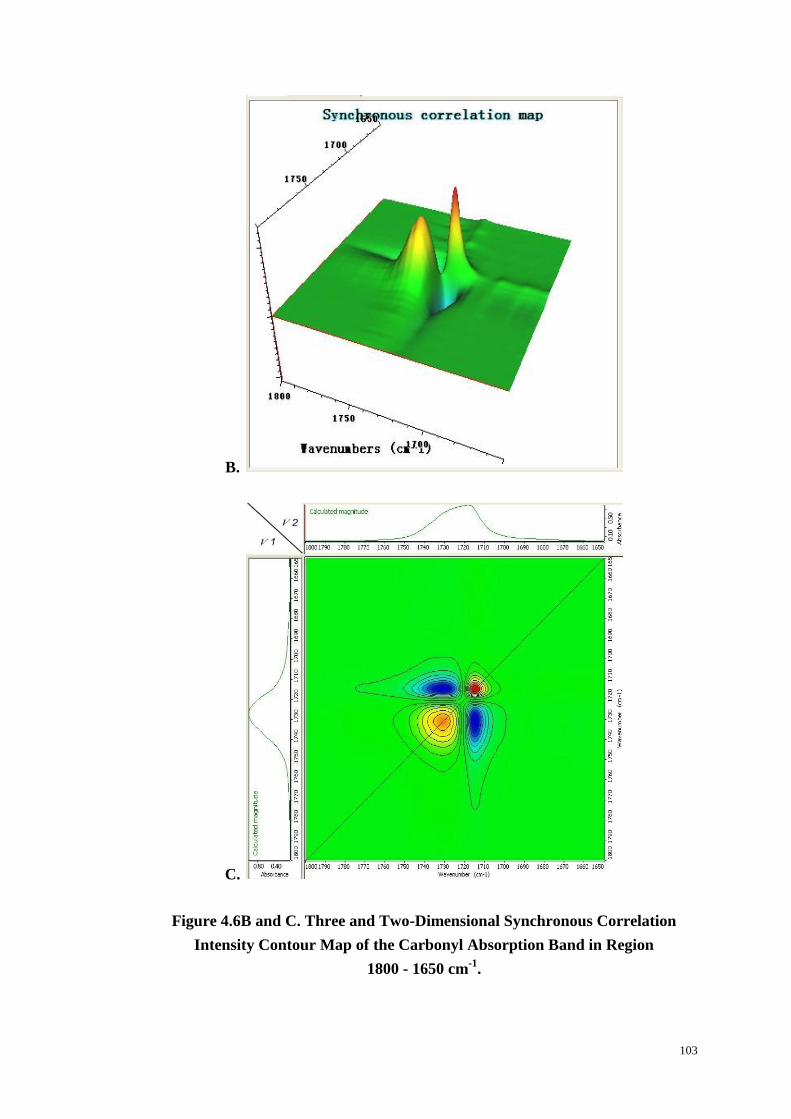
103
B.
C.
Figure 4.6B and C. Three and Two-Dimensional Synchronous Correlation
Intensity Contour Map of the Carbonyl Absorption Band in Region
1800 - 1650 cm-1
.
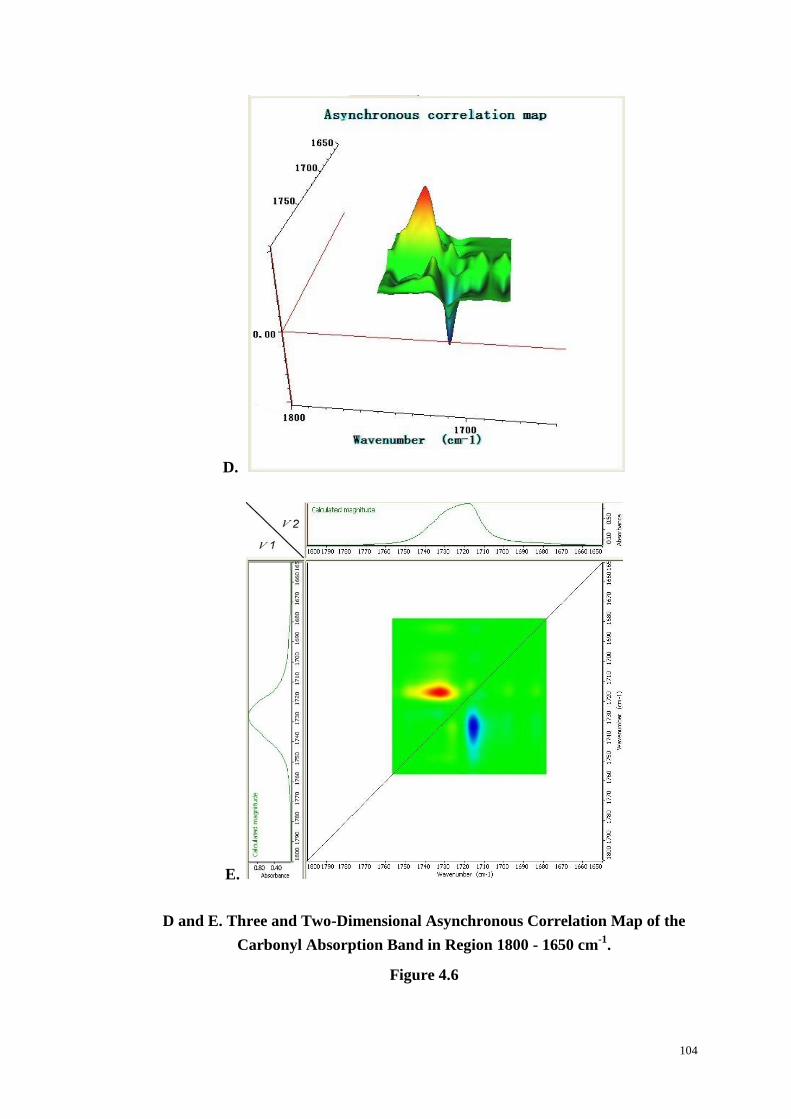
104
D.
E.
D and E. Three and Two-Dimensional Asynchronous Correlation Map of the
Carbonyl Absorption Band in Region 1800 - 1650 cm-1
.
Figure 4.6
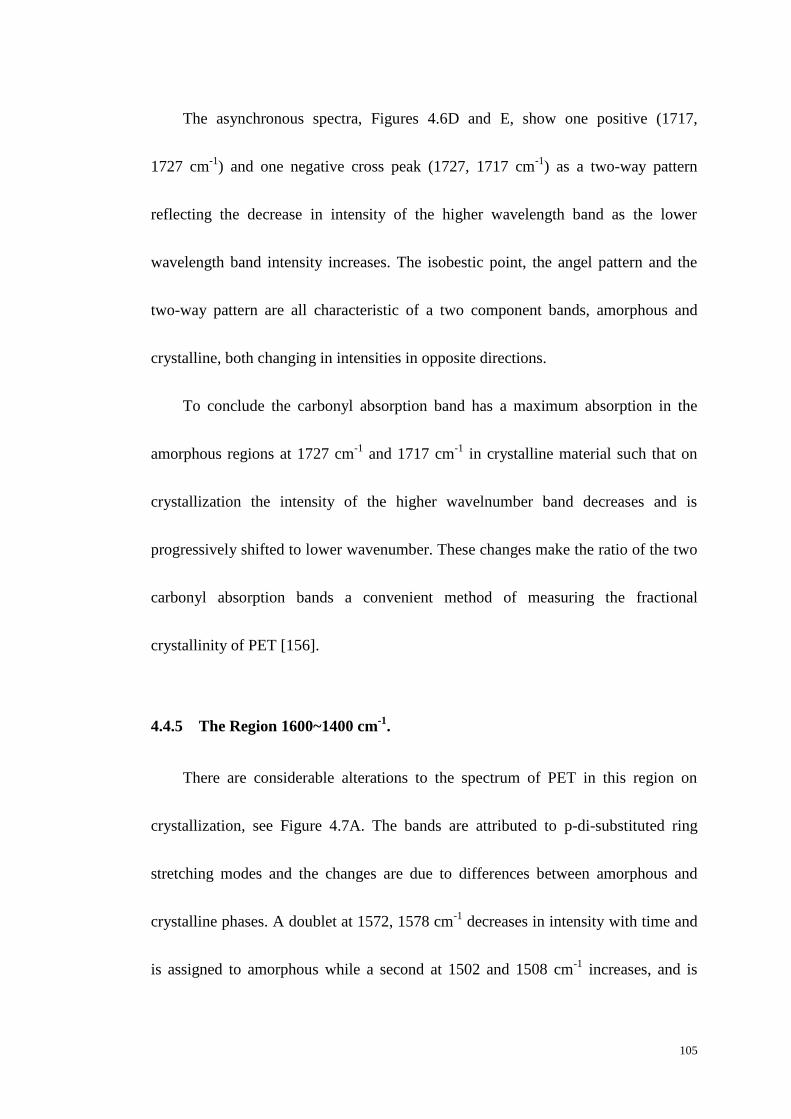
105
The asynchronous spectra, Figures 4.6D and E, show one positive (1717,
1727 cm-1
) and one negative cross peak (1727, 1717 cm-1
) as a two-way pattern
reflecting the decrease in intensity of the higher wavelength band as the lower
wavelength band intensity increases. The isobestic point, the angel pattern and the
two-way pattern are all characteristic of a two component bands, amorphous and
crystalline, both changing in intensities in opposite directions.
To conclude the carbonyl absorption band has a maximum absorption in the
amorphous regions at 1727 cm-1
and 1717 cm-1
in crystalline material such that on
crystallization the intensity of the higher wavelnumber band decreases and is
progressively shifted to lower wavenumber. These changes make the ratio of the two
carbonyl absorption bands a convenient method of measuring the fractional
crystallinity of PET [156].
4.4.5 The Region 1600~1400 cm-1
.
There are considerable alterations to the spectrum of PET in this region on
crystallization, see Figure 4.7A. The bands are attributed to p-di-substituted ring
stretching modes and the changes are due to differences between amorphous and
crystalline phases. A doublet at 1572, 1578 cm-1
decreases in intensity with time and
is assigned to amorphous while a second at 1502 and 1508 cm-1
increases, and is
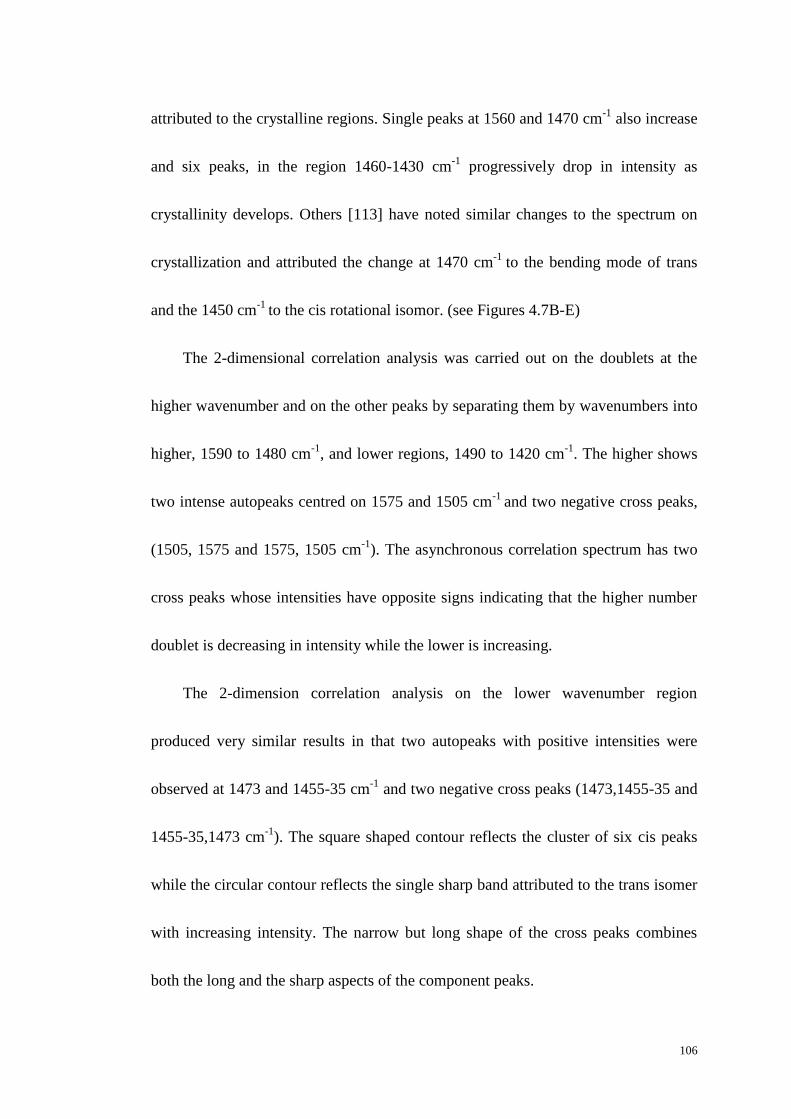
106
attributed to the crystalline regions. Single peaks at 1560 and 1470 cm-1
also increase
and six peaks, in the region 1460-1430 cm-1
progressively drop in intensity as
crystallinity develops. Others [113] have noted similar changes to the spectrum on
crystallization and attributed the change at 1470 cm-1
to the bending mode of trans
and the 1450 cm-1
to the cis rotational isomor. (see Figures 4.7B-E)
The 2-dimensional correlation analysis was carried out on the doublets at the
higher wavenumber and on the other peaks by separating them by wavenumbers into
higher, 1590 to 1480 cm-1
, and lower regions, 1490 to 1420 cm-1
. The higher shows
two intense autopeaks centred on 1575 and 1505 cm-1
and two negative cross peaks,
(1505, 1575 and 1575, 1505 cm-1
). The asynchronous correlation spectrum has two
cross peaks whose intensities have opposite signs indicating that the higher number
doublet is decreasing in intensity while the lower is increasing.
The 2-dimension correlation analysis on the lower wavenumber region
produced very similar results in that two autopeaks with positive intensities were
observed at 1473 and 1455-35 cm-1
and two negative cross peaks (1473,1455-35 and
1455-35,1473 cm-1
). The square shaped contour reflects the cluster of six cis peaks
while the circular contour reflects the single sharp band attributed to the trans isomer
with increasing intensity. The narrow but long shape of the cross peaks combines
both the long and the sharp aspects of the component peaks.
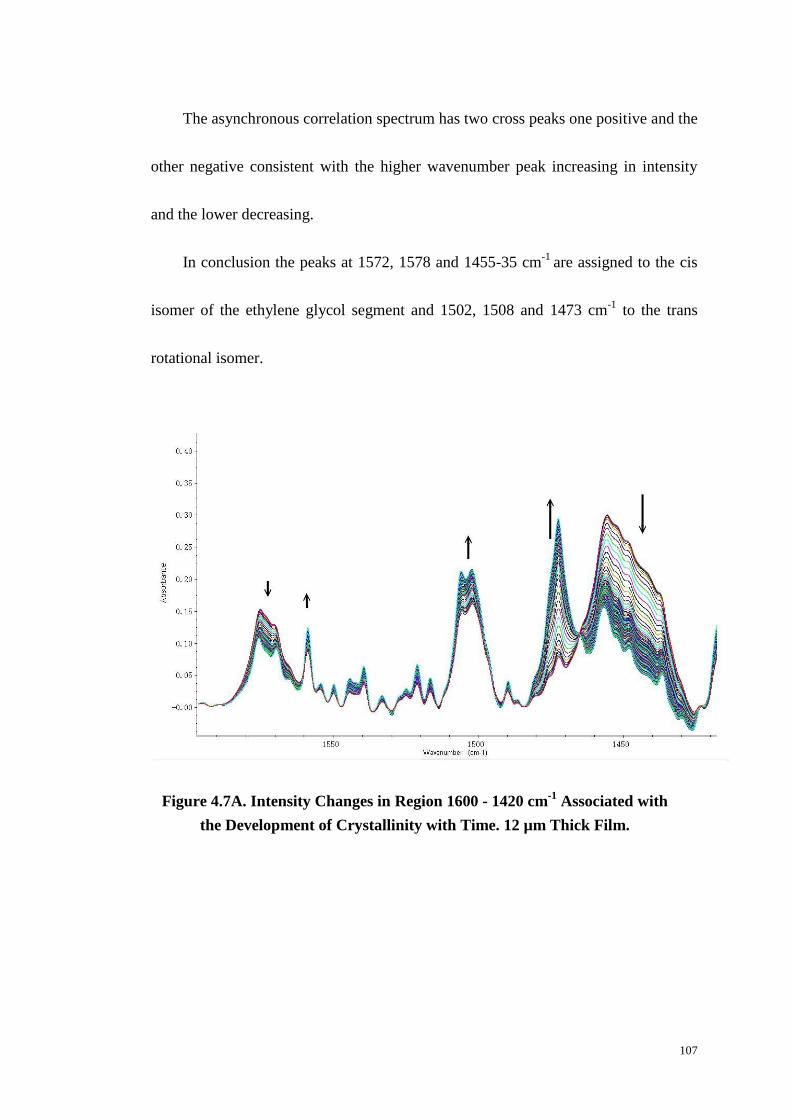
107
The asynchronous correlation spectrum has two cross peaks one positive and the
other negative consistent with the higher wavenumber peak increasing in intensity
and the lower decreasing.
In conclusion the peaks at 1572, 1578 and 1455-35 cm-1
are assigned to the cis
isomer of the ethylene glycol segment and 1502, 1508 and 1473 cm-1
to the trans
rotational isomer.
Figure 4.7A. Intensity Changes in Region 1600 - 1420 cm-1
Associated with
the Development of Crystallinity with Time. 12 µm Thick Film.

108
B.
C.
Figure 4.7B and C. Two-Dimensional Synchronous and Asynchronous
Correlation Spectra in the Region 1590 - 1480 cm-1
.
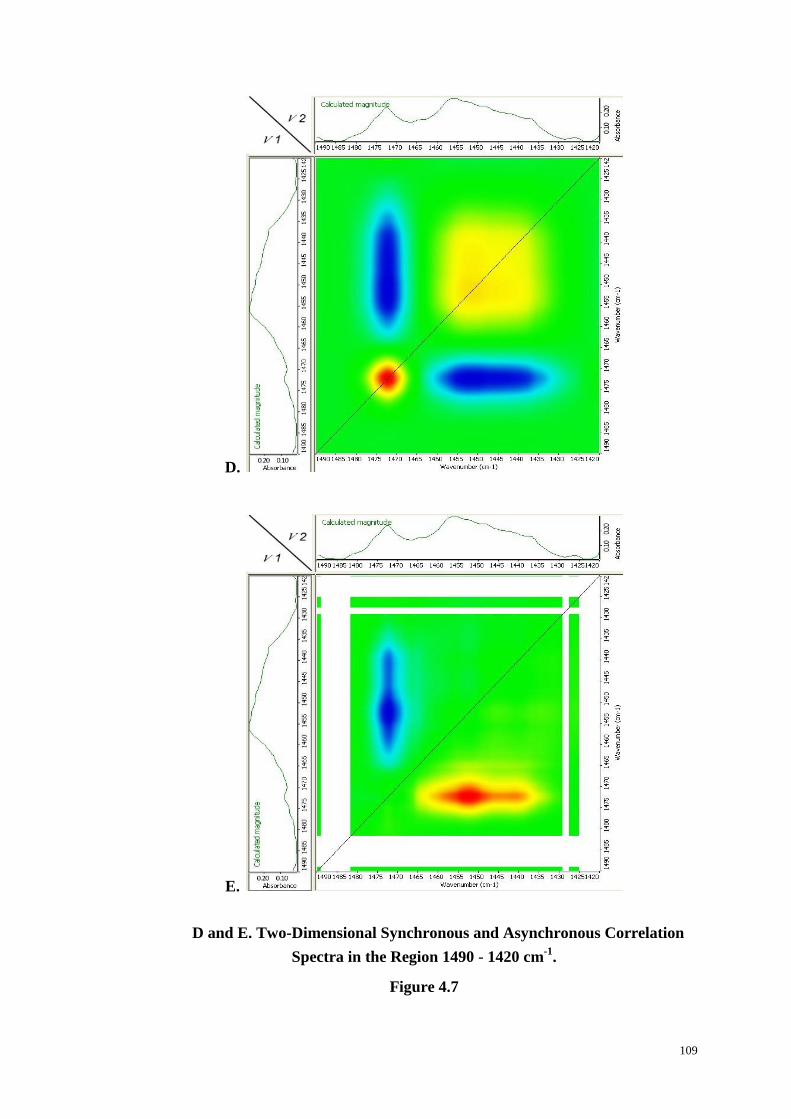
109
D.
E.
D and E. Two-Dimensional Synchronous and Asynchronous Correlation
Spectra in the Region 1490 - 1420 cm-1
.
Figure 4.7
110
4.4.6 The Region 1420~1320 cm-1
.
Liang and Krimm [108] have reported that the weak band at 1343 cm-1
is
sensitive to the degree of crystallinity and is not shifted by deuteration of the
polymer. Accordingly they attributed the band to the influence of resonance on the
terephthalate group, O-(O=C-C6H4-C=O)-O and to the in-plane alignment of the
carbonyl groups with the benzene ring in the crystal. However, Ward et al. [157]
attributed the 1340 cm -1
to the wagging vibrations of the –CH2- of the trans isomer
of the glycol group and the 1370 cm-1
to the cis. In line with this later assignment,
Figure 4.8A shows the progressive increase in intensity of this band with time and
crystallinity. Ward et al. also concluded that the intensity of the band at 1410 cm-1
did not change either on stretching or crystallization and used it as an internal
standard to standardise the intensities of trans and cis bands. The 3-8% decrease in
intensity of this peak is at variance with this as it is outside experimental error but
more in line with differences in the extinction coefficient between the amorphous
and crystalline regions but with no shift in peak position.
As well as an increase in intensity of the absorption band at 1340 cm-1
there is a
shift to higher wavenumbers from 1338 to 1342 cm-1
on crystallization. The
crystalline trans isomer is attributed to 1342 cm-1
and the amorphous trans isomer to
1338 cm-1
. The cis isomer, only present in the amorphous regions, is considered to
111
absorb at 1370 cm-1
. In the initial amorphous sample both cis and trans peaks have
similar intensities but with time the 1370 cm-1
peak decreases slightly while the
1342 cm-1
increases substantially. Three other bands at 1355, 1380 and 1407 cm-1
decrease with time but with much smaller changes in intensity. There are five distinct
isobestic points indicating that the changes to the peaks are linked and associated
with the phase transformation.
There is one autopeak in the synchronous 2D correlation spectrum consistent
with the very much larger increase in intensity of the 1342 cm-1
, see Figure 4.7B, and
several negative cross peaks indicating these changes are concerted. The cross peaks
are negative indicating that their intensities are decreasing along with the 1342 cm-1
.
The asynchronous correlation spectrum, see Figure 4.7C, shows one negative
and five positive off-diagonal cross peaks indicating that the shift in peak position
and change in intensities are synchronous and associated with the loss of amorphous
content and increased crystallinity. Five peaks are decreasing in intensity and one
increasing.
The 1338 and 1370 cm-1
peaks are attributed to the cis isomer of the ethylene
glycol segment in the amorphous regions and the 1342 to the trans isomer in the
crystalline. The 1408 cm-1
absorption band is not constant but decreases with
crystallinity, and changes with temperature.
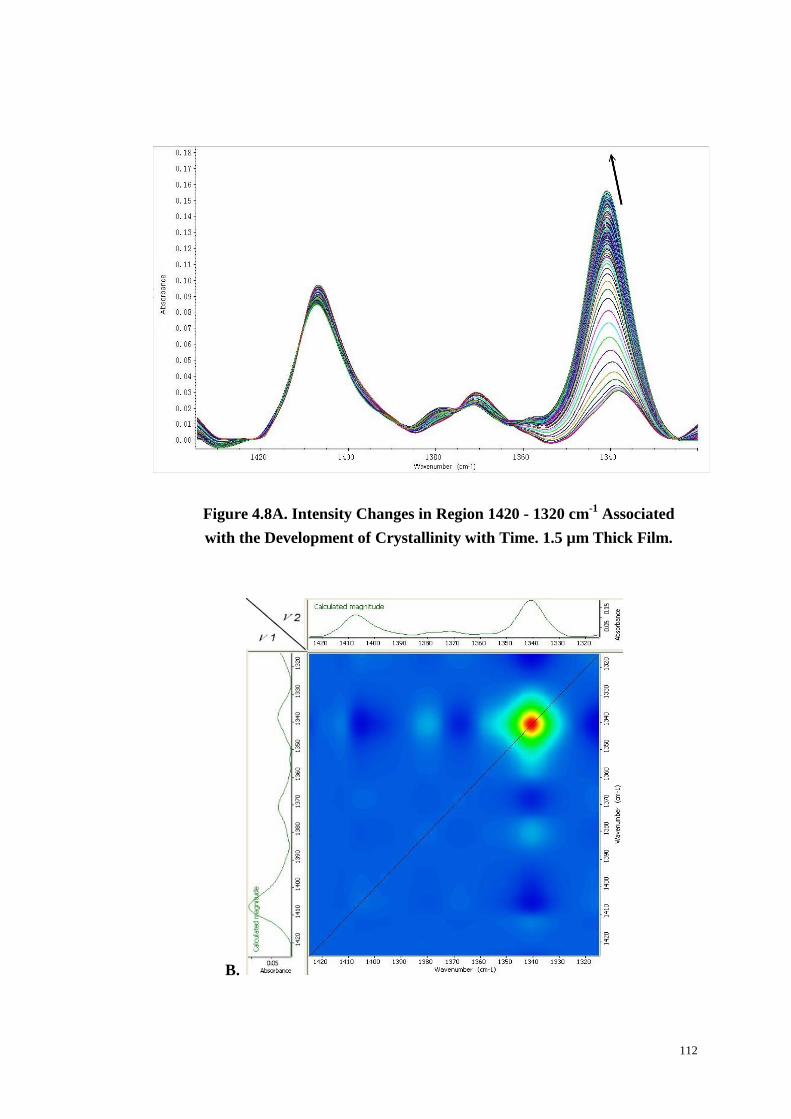
112
Figure 4.8A. Intensity Changes in Region 1420 - 1320 cm-1
Associated
with the Development of Crystallinity with Time. 1.5 µm Thick Film.
B.

113
C.
B and C. Two-Dimensional Synchronous and Asynchronous Correlation
Spectra in the Region 1420 - 1320 cm-1
.
Figure 4.8
4.4.7 The Region 1320~1200 cm-1
.
The band at 1255 cm-1
has been attributed to the stretching vibration of the ester
group, -C-O-C=O and the changes in intensity and peak shape with time are shown
in Figure 4.9A. The initial absorption bands have four maxima at 1235, 1255, 1285
and 1307 cm-1
associated with amorphous material and these decrease in intensity
with time into a featureless broad band with a maximum at 1255 cm-1
. The initial
bands are assigned to the amorphous and the final to crystalline regions.
The synchronous 2D correlation spectrum, see Figures 4.9B, exhibits three
positive autopeaks at 1237, 1260 and 1285 cm-1
and six cross peaks which are all
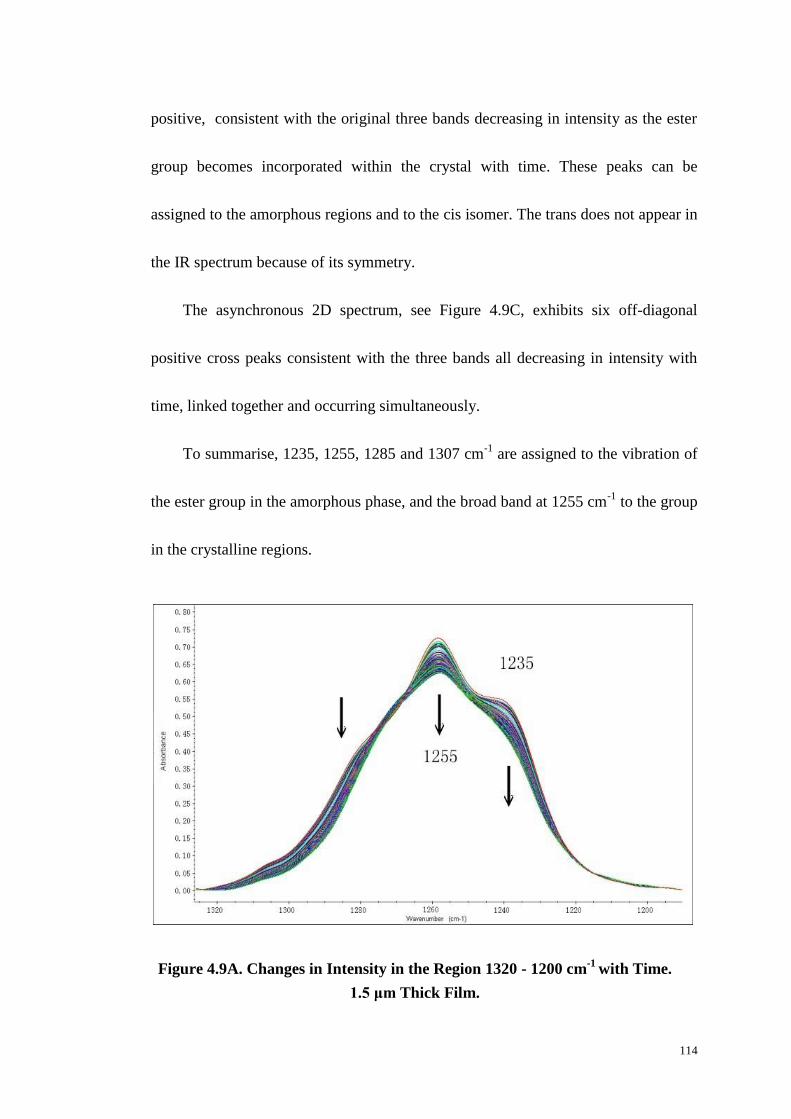
114
positive, consistent with the original three bands decreasing in intensity as the ester
group becomes incorporated within the crystal with time. These peaks can be
assigned to the amorphous regions and to the cis isomer. The trans does not appear in
the IR spectrum because of its symmetry.
The asynchronous 2D spectrum, see Figure 4.9C, exhibits six off-diagonal
positive cross peaks consistent with the three bands all decreasing in intensity with
time, linked together and occurring simultaneously.
To summarise, 1235, 1255, 1285 and 1307 cm-1
are assigned to the vibration of
the ester group in the amorphous phase, and the broad band at 1255 cm-1
to the group
in the crystalline regions.
Figure 4.9A. Changes in Intensity in the Region 1320 - 1200 cm-1
with Time.
1.5 μm Thick Film.

115
B.
C.
B and C. Two-Dimensional Synchronous and Asynchronous Correlation
Spectra in the Region 1320 - 1220 cm-1
with Time.
Figure 4.9
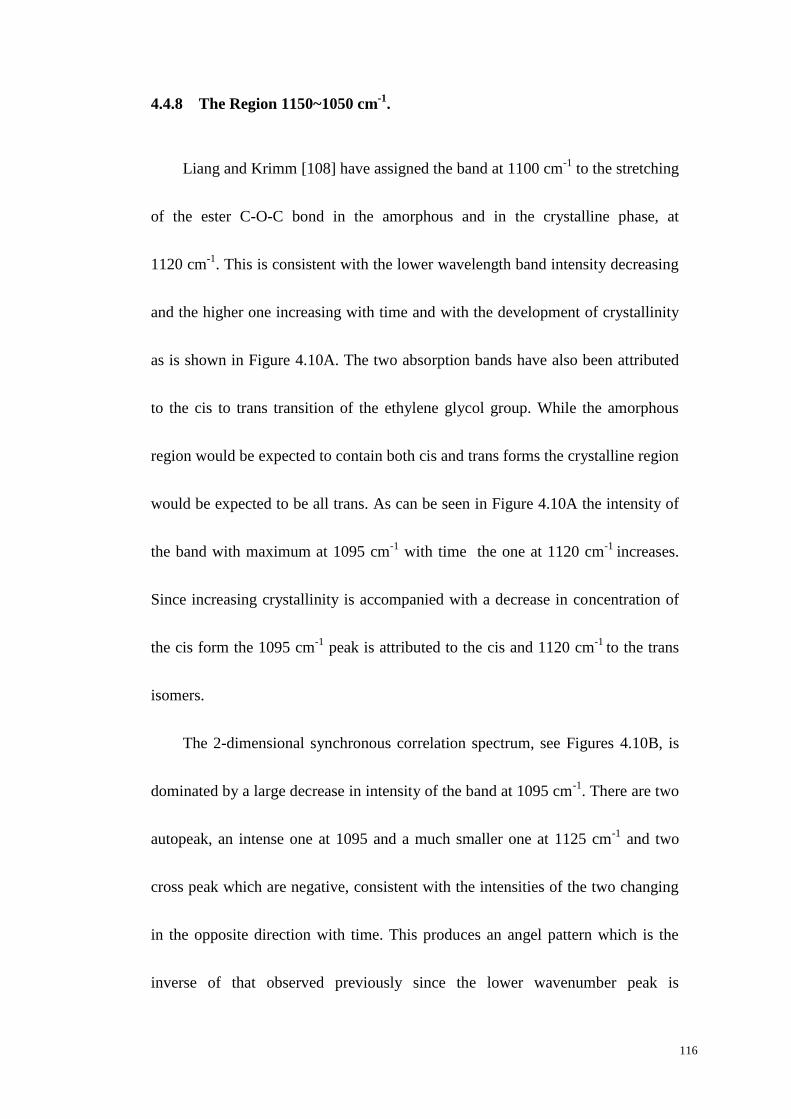
116
4.4.8 The Region 1150~1050 cm-1
.
Liang and Krimm [108] have assigned the band at 1100 cm-1
to the stretching
of the ester C-O-C bond in the amorphous and in the crystalline phase, at
1120 cm-1
. This is consistent with the lower wavelength band intensity decreasing
and the higher one increasing with time and with the development of crystallinity
as is shown in Figure 4.10A. The two absorption bands have also been attributed
to the cis to trans transition of the ethylene glycol group. While the amorphous
region would be expected to contain both cis and trans forms the crystalline region
would be expected to be all trans. As can be seen in Figure 4.10A the intensity of
the band with maximum at 1095 cm-1
with time the one at 1120 cm-1
increases.
Since increasing crystallinity is accompanied with a decrease in concentration of
the cis form the 1095 cm-1
peak is attributed to the cis and 1120 cm-1
to the trans
isomers.
The 2-dimensional synchronous correlation spectrum, see Figures 4.10B, is
dominated by a large decrease in intensity of the band at 1095 cm-1
. There are two
autopeak, an intense one at 1095 and a much smaller one at 1125 cm-1
and two
cross peak which are negative, consistent with the intensities of the two changing
in the opposite direction with time. This produces an angel pattern which is the
inverse of that observed previously since the lower wavenumber peak is
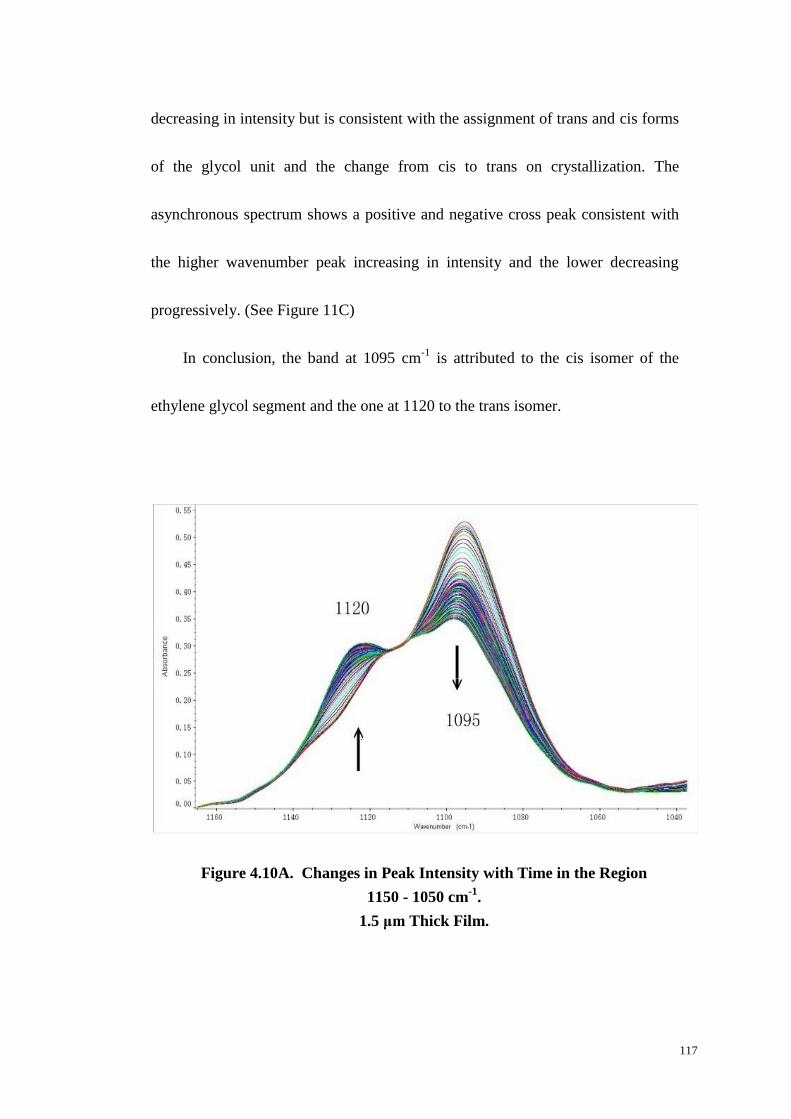
117
decreasing in intensity but is consistent with the assignment of trans and cis forms
of the glycol unit and the change from cis to trans on crystallization. The
asynchronous spectrum shows a positive and negative cross peak consistent with
the higher wavenumber peak increasing in intensity and the lower decreasing
progressively. (See Figure 11C)
In conclusion, the band at 1095 cm-1
is attributed to the cis isomer of the
ethylene glycol segment and the one at 1120 to the trans isomer.
Figure 4.10A. Changes in Peak Intensity with Time in the Region
1150 - 1050 cm-1
.
1.5 μm Thick Film.
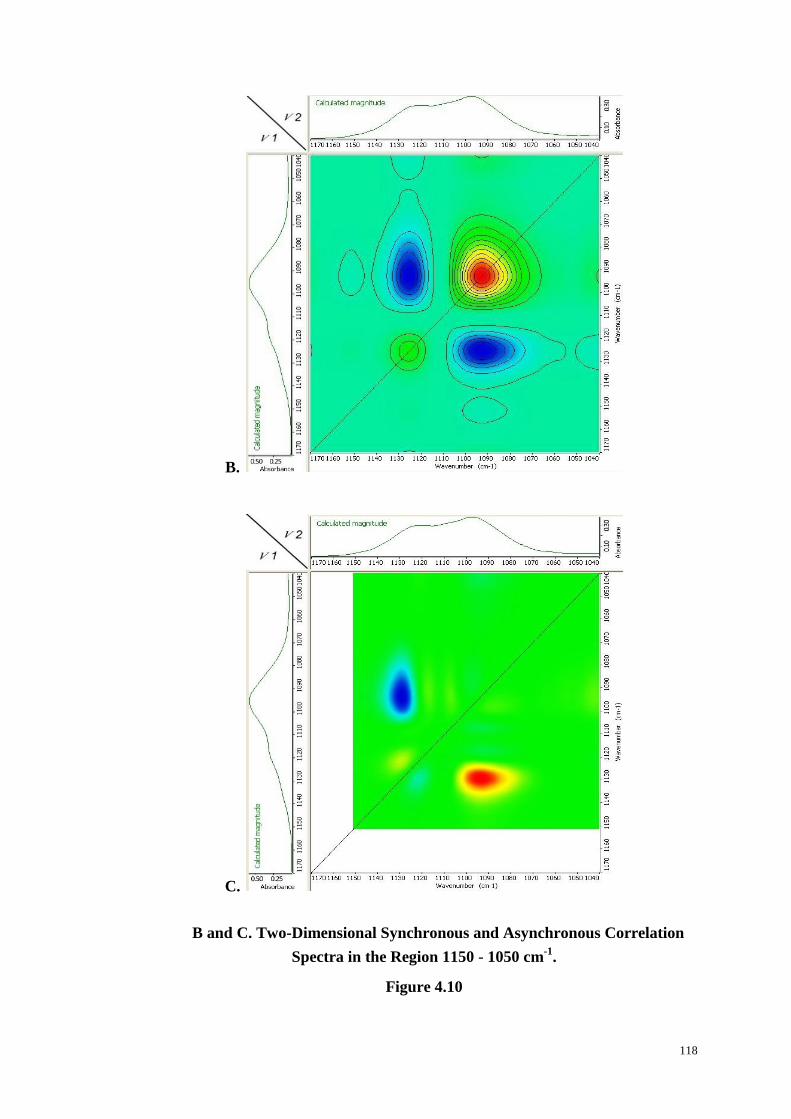
118
B.
C.
B and C. Two-Dimensional Synchronous and Asynchronous Correlation
Spectra in the Region 1150 - 1050 cm-1
.
Figure 4.10

119
4.4.9 1050~990 cm-1
Region.
The absorption band with maximum intensity at 1015 cm-1
is attributed to the
in-plane bending of the C-H bonds of a 1,4- di-substituted aromatic ring [114].
On isothermal crystallization, the initial sharp band progressively broadens and
shifts to higher wavenumbers, at 1020 cm-1
, see Figures 4.11A. There are
isobestic points at 1020 and 1027 cm-1
consistent with the changes being
concerted.
There are minor decreases in intensity with time in the region 1035 cm-1
which have been assigned to the deformation of the cis isomer of ethylene glycol
unit. The decrease in intensity is in agreement with it being transformed to the
trans isomer.
The 2D synchronous correlation map, Figures 4.11B, shows two positive
autopeaks at 1015 and 1022 cm-1
, accompanied with a pair of negative off-
diagonal cross peaks (1022, 1015 cm-1
) producing the characteristic but reversed
angel pattern consistent with the amorphous band disappearing and being replaced
with a lower intensity crystalline band at a higher wavelength.
In the asynchronous correlation map, see Figure 4.11C, off-diagonal cross
peak pairs are present at 1020, 1015 cm -1
, producing a butterfly pattern. They are
negative and positive consistent with their intensities moving in the opposite
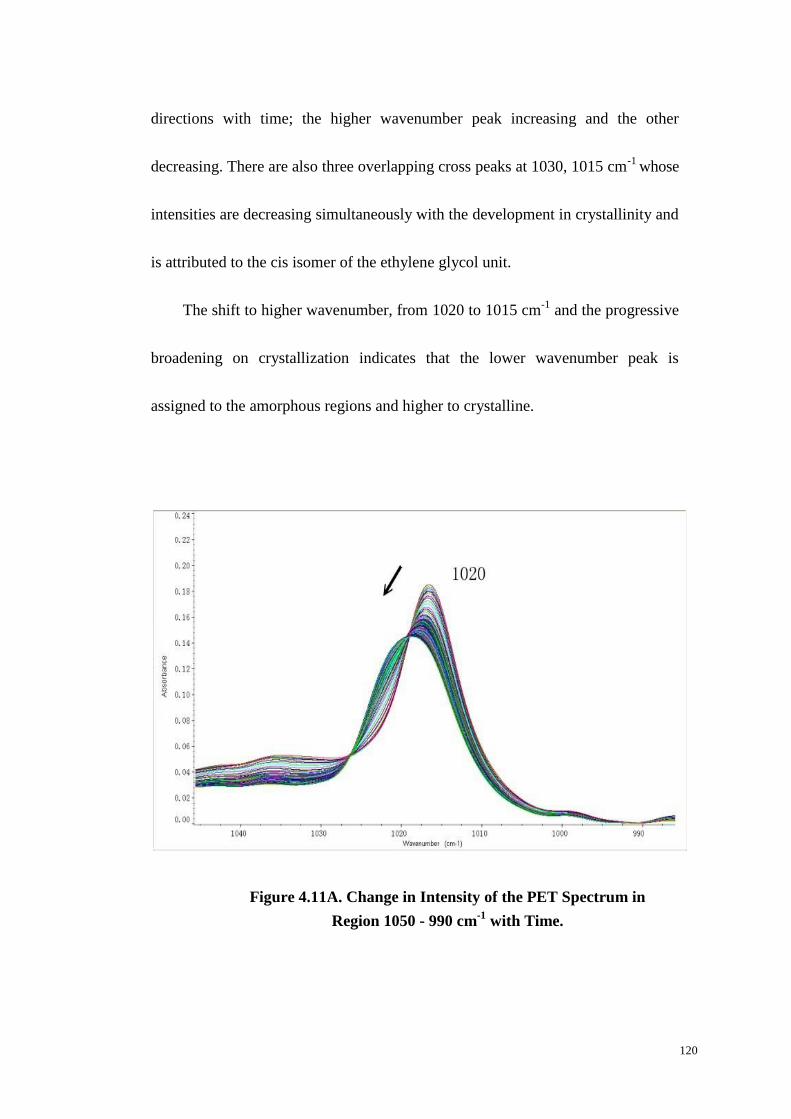
120
directions with time; the higher wavenumber peak increasing and the other
decreasing. There are also three overlapping cross peaks at 1030, 1015 cm-1
whose
intensities are decreasing simultaneously with the development in crystallinity and
is attributed to the cis isomer of the ethylene glycol unit.
The shift to higher wavenumber, from 1020 to 1015 cm-1
and the progressive
broadening on crystallization indicates that the lower wavenumber peak is
assigned to the amorphous regions and higher to crystalline.
Figure 4.11A. Change in Intensity of the PET Spectrum in
Region 1050 - 990 cm-1
with Time.
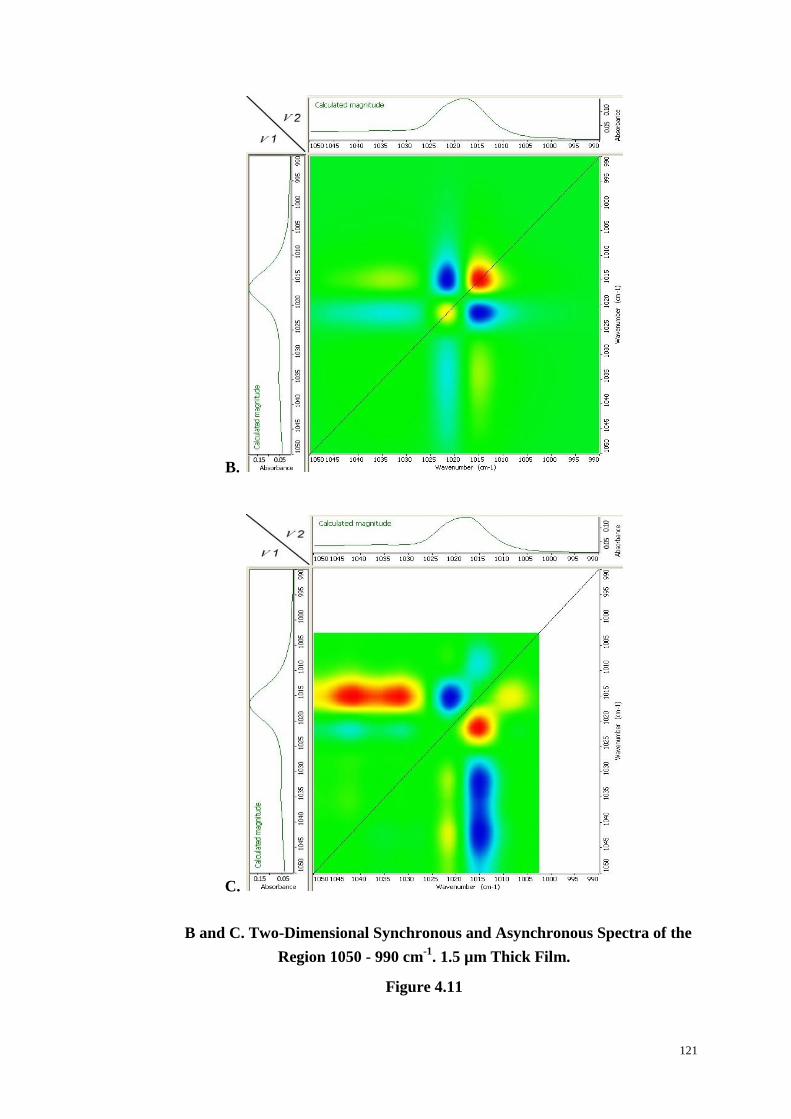
121
B.
C.
B and C. Two-Dimensional Synchronous and Asynchronous Spectra of the
Region 1050 - 990 cm-1
. 1.5 µm Thick Film.
Figure 4.11
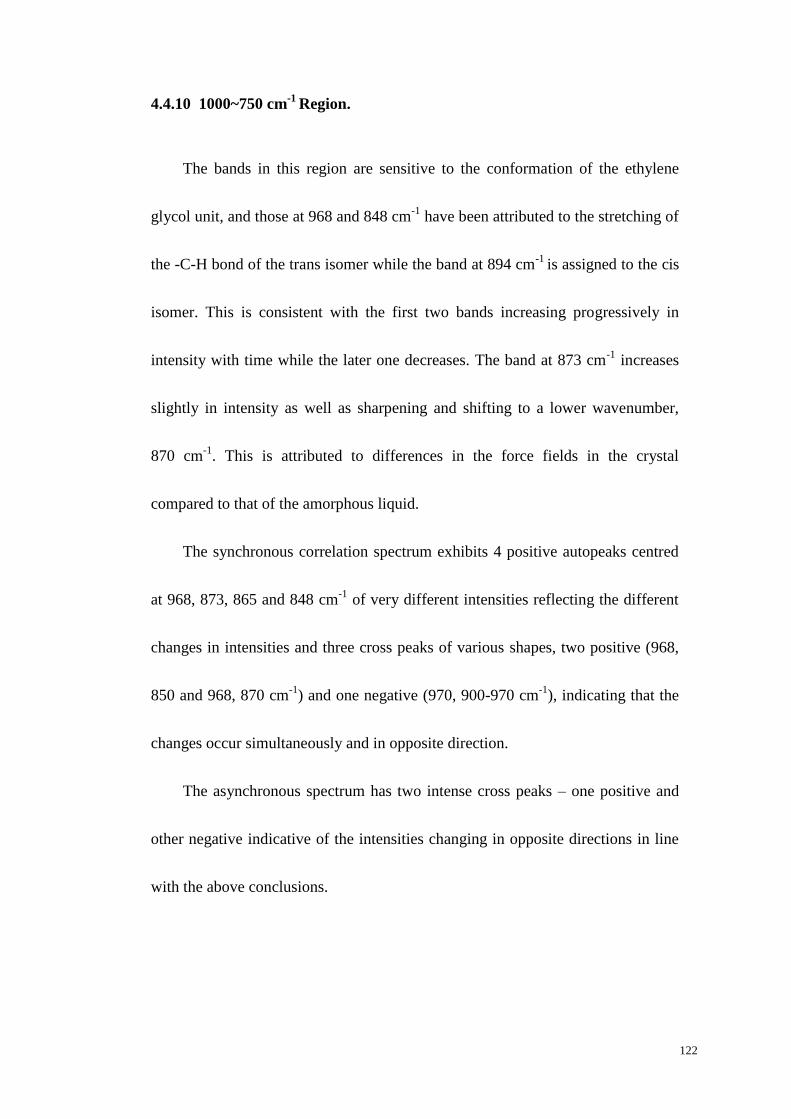
122
4.4.10 1000~750 cm-1
Region.
The bands in this region are sensitive to the conformation of the ethylene
glycol unit, and those at 968 and 848 cm-1
have been attributed to the stretching of
the -C-H bond of the trans isomer while the band at 894 cm-1
is assigned to the cis
isomer. This is consistent with the first two bands increasing progressively in
intensity with time while the later one decreases. The band at 873 cm-1
increases
slightly in intensity as well as sharpening and shifting to a lower wavenumber,
870 cm-1
. This is attributed to differences in the force fields in the crystal
compared to that of the amorphous liquid.
The synchronous correlation spectrum exhibits 4 positive autopeaks centred
at 968, 873, 865 and 848 cm-1
of very different intensities reflecting the different
changes in intensities and three cross peaks of various shapes, two positive (968,
850 and 968, 870 cm-1
) and one negative (970, 900-970 cm-1
), indicating that the
changes occur simultaneously and in opposite direction.
The asynchronous spectrum has two intense cross peaks – one positive and
other negative indicative of the intensities changing in opposite directions in line
with the above conclusions.

123
Figure 4.12A. Change in Intensity in Region 1000 - 750 cm-1
with Time.
12 µm Thick Film.
B.
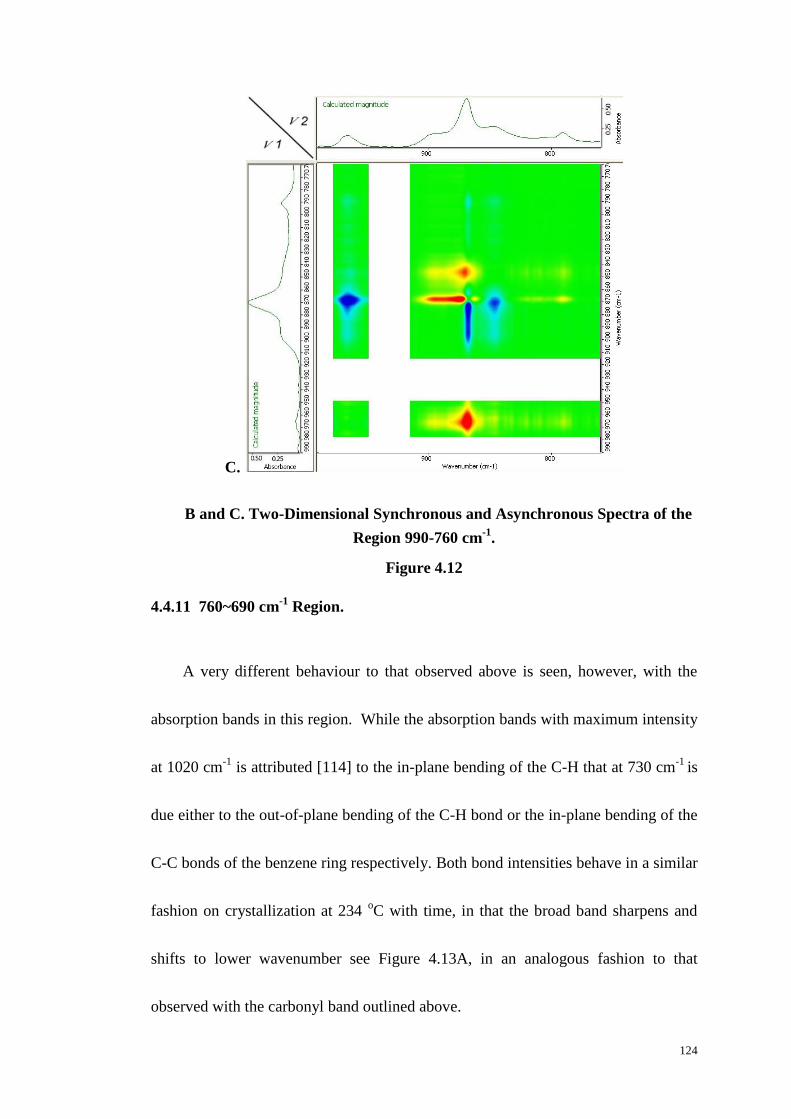
124
C.
B and C. Two-Dimensional Synchronous and Asynchronous Spectra of the
Region 990-760 cm-1
.
Figure 4.12
4.4.11 760~690 cm-1
Region.
A very different behaviour to that observed above is seen, however, with the
absorption bands in this region. While the absorption bands with maximum intensity
at 1020 cm-1
is attributed [114] to the in-plane bending of the C-H that at 730 cm-1
is
due either to the out-of-plane bending of the C-H bond or the in-plane bending of the
C-C bonds of the benzene ring respectively. Both bond intensities behave in a similar
fashion on crystallization at 234 oC with time, in that the broad band sharpens and
shifts to lower wavenumber see Figure 4.13A, in an analogous fashion to that
observed with the carbonyl band outlined above.
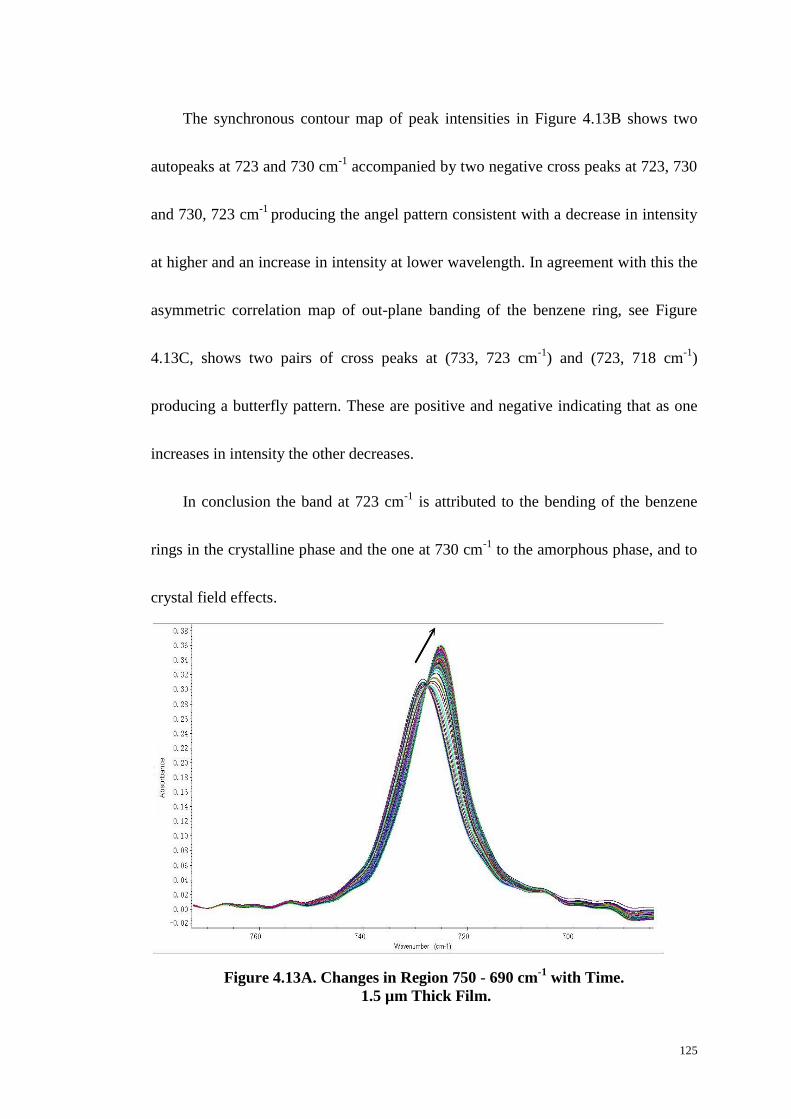
125
The synchronous contour map of peak intensities in Figure 4.13B shows two
autopeaks at 723 and 730 cm-1
accompanied by two negative cross peaks at 723, 730
and 730, 723 cm-1
producing the angel pattern consistent with a decrease in intensity
at higher and an increase in intensity at lower wavelength. In agreement with this the
asymmetric correlation map of out-plane banding of the benzene ring, see Figure
4.13C, shows two pairs of cross peaks at (733, 723 cm-1
) and (723, 718 cm-1
)
producing a butterfly pattern. These are positive and negative indicating that as one
increases in intensity the other decreases.
In conclusion the band at 723 cm-1
is attributed to the bending of the benzene
rings in the crystalline phase and the one at 730 cm-1
to the amorphous phase, and to
crystal field effects.
Figure 4.13A. Changes in Region 750 - 690 cm-1
with Time.
1.5 µm Thick Film.
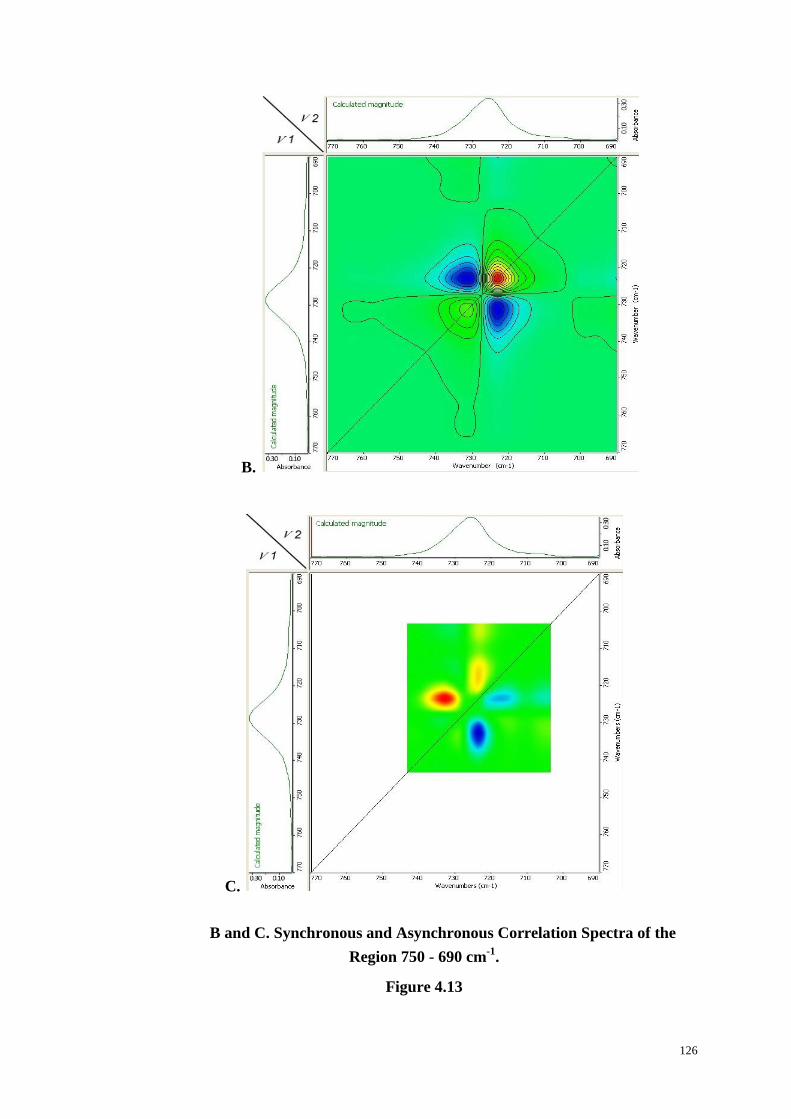
126
B.
C.
B and C. Synchronous and Asynchronous Correlation Spectra of the
Region 750 - 690 cm-1
.
Figure 4.13

127
4.5 Conclusions.
The FTIR spectrum of PET is unduly complicated particularly as it is sensitive
to the degree of crystallinity and chain orientation; this is due to presence of
rotational isomers of the ester and glycol units and to difference in the force fields
between the crystalline unit cell and the amorphous liquid. The first results in
changes to pairs of absorption bands attributed to the cis and trans isomers while the
second results in a shift in peak position, a sharpening of the band and a change in
intensity. The many changes which occur on crystallization are listed in Table 4.1
along with their assignment to crystalline or amorphous bands based on whether the
intensity increases (+ve) or decreases (-ve) during the transformation.
In the amorphous phase there is a temperature dependent equilibrium of cis and
trans isomers but since the chain structure in the unit cell is all trans crystallization is
always accompanied by a decrease in concentration of the cis isomer and a
simultaneous increase in the trans. This makes 2-dimensional time depended
correlation spectroscopy particularly useful in characterizing these absorption bands.
The broad amorphous absorption band at 3460 cm-1
and the crystalline one at
3450 cm-1
are attributed, see Table 4.1, to an overtone of the amorphous carbonyl
band at 1717 cm-1
since it mimics its behaviour on crystallization almost exactly in
shifting to lower wavenumber, becoming sharper and progressively increasing in
128
intensity with time. As a result the synchronous intensity maps are identical showing
the characteristic angel pattern, the asymmetry of the pattern arising from the relative
difference in extinction coefficient. An alternative assignment to the stretching
vibration of an H-O- of a chain end carbonyl group was ruled out as it would not
increase in intensity with time on crystallization.
The four very weak intensity bands centred on 3570 cm-1
are attributed to the
ring C-H bonds stretching vibration. They do not change their position but their
intensity is substantially reduced on crystallization. The aliphatic C-H bands at 2960
and 2880 cm-1,
however, in the amorphous phase change substantially on
crystallization. The intensity of the 2960 cm-1
decreases and two distinction
shoulders at 3000 and 2970 cm-1
develop while the band at 2880 is replaced with one
at 2900 cm-1
.
The intense carbonyl ester carbonyl band undergoes considerable changes on
crystallization in that the broad amorphous band at 1727 cm-1
sharpens decreases in
intensity and shifts to 1717 cm-1
, see Table 4.1. The intensity then increases
progressively with time at this lower wavenumber. The amorphous and crystalline
band can be separated into the two components and the decrease in amorphous
fraction closely follows the increase in fractional crystallinity [156] because of this
we attribute the difference in wavenumber of the two bands to environmental

129
differences between crystalline solid and amorphous liquid rather than the trans and
cis positions of the carbonyl groups in the crystal unit cell and the mobile liquid. This
makes the changes in the carbonyl band a ready method of determining the fractional
crystallinity of a PET sample.
The synchronous and asynchronous correlation spectra of the carbonyl band is
characteristic of two bands with different wavenumbers and intensities associated
with the initial and final stages of the transformation and is represented by the angel
pattern and two cross peaks.
The cis/trans rotational isomerizations of the ethylene glycol and the benzene
di-carboxylic ester group exhibit the characteristic angel pattern and this has been
useful in assigning the absorption bands of the isomers; bands at 1570, 1430-60,
1370, 1035, 894 cm-1
have been assigned to the cis isomer of the ethylene glycol unit
while the corresponding trans isomer has been assigned to bands at 1555, 1500-10,
1470, 1340, 962 and 847 cm-1
. The cis form of the ester group absorbs at 1255, 1235,
1285 and 1095 cm-1
and the trans at 1120 cm-1
. The shift in wavenumber, the change
in shape of the band and intensity mean that they have characteristic features in their
synchronous and asynchronous spectra and this greatly assists in peak assignment.
Other changes to the spectrum are associated with crystal field effects which
either shift the characteristic absorption band to different wavenumbers on
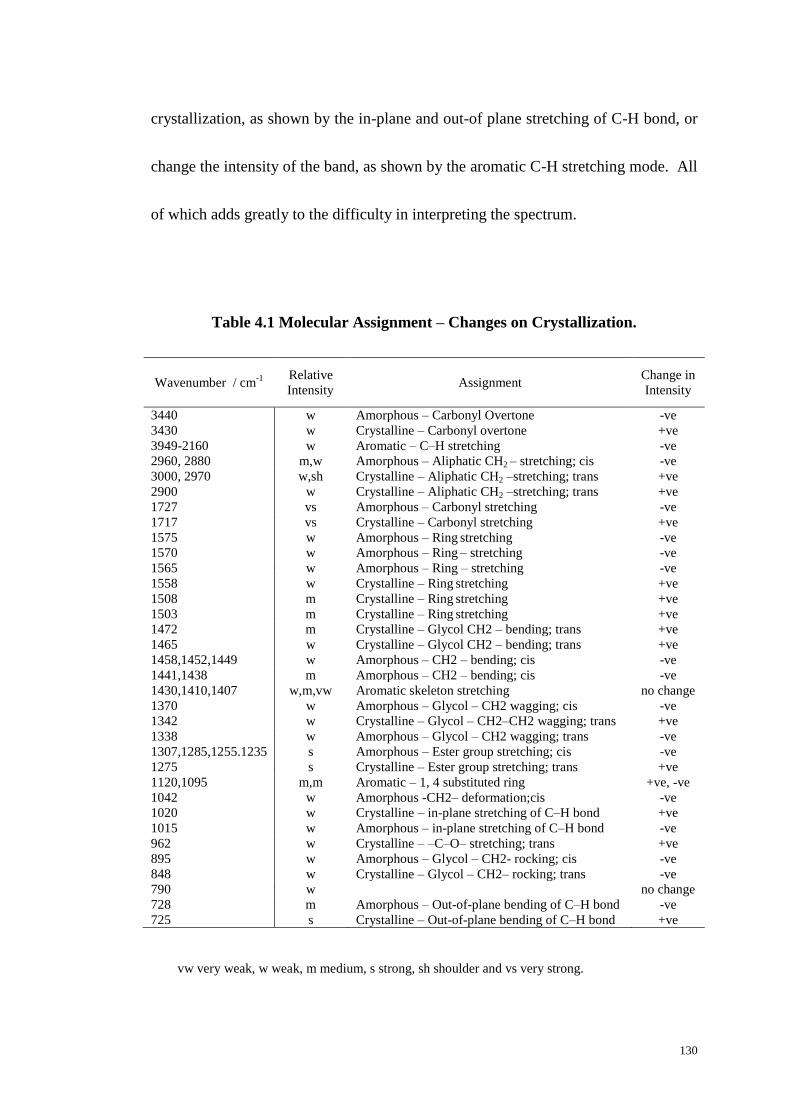
130
crystallization, as shown by the in-plane and out-of plane stretching of C-H bond, or
change the intensity of the band, as shown by the aromatic C-H stretching mode. All
of which adds greatly to the difficulty in interpreting the spectrum.
Table 4.1 Molecular Assignment – Changes on Crystallization.
Wavenumber / cm-1
Relative
Intensity Assignment
Change in
Intensity
3440 w Amorphous – Carbonyl Overtone -ve
3430 w Crystalline – Carbonyl overtone +ve
3949-2160 w Aromatic – C–H stretching -ve
2960, 2880 m,w Amorphous – Aliphatic CH2 – stretching; cis -ve
3000, 2970 w,sh Crystalline – Aliphatic CH2 –stretching; trans +ve
2900 w Crystalline – Aliphatic CH2 –stretching; trans +ve
1727 vs Amorphous – Carbonyl stretching -ve
1717 vs Crystalline – Carbonyl stretching +ve
1575 w Amorphous – Ring stretching -ve
1570 w Amorphous – Ring – stretching -ve
1565 w Amorphous – Ring – stretching -ve
1558 w Crystalline – Ring stretching +ve
1508 m Crystalline – Ring stretching +ve
1503 m Crystalline – Ring stretching +ve
1472 m Crystalline – Glycol CH2 – bending; trans +ve
1465 w Crystalline – Glycol CH2 – bending; trans +ve
1458,1452,1449 w Amorphous – CH2 – bending; cis -ve
1441,1438 m Amorphous – CH2 – bending; cis -ve
1430,1410,1407 w,m,vw Aromatic skeleton stretching no change
1370 w Amorphous – Glycol – CH2 wagging; cis -ve
1342 w Crystalline – Glycol – CH2–CH2 wagging; trans +ve
1338 w Amorphous – Glycol – CH2 wagging; trans -ve
1307,1285,1255.1235 s Amorphous – Ester group stretching; cis -ve
1275 s Crystalline – Ester group stretching; trans +ve
1120,1095 m,m Aromatic – 1, 4 substituted ring +ve, -ve
1042 w Amorphous -CH2– deformation;cis -ve
1020 w Crystalline – in-plane stretching of C–H bond +ve
1015 w Amorphous – in-plane stretching of C–H bond -ve
962 w Crystalline – –C–O– stretching; trans +ve
895 w Amorphous – Glycol – CH2- rocking; cis -ve
848 w Crystalline – Glycol – CH2– rocking; trans -ve
790 w no change
728 m Amorphous – Out-of-plane bending of C–H bond -ve
725 s Crystalline – Out-of-plane bending of C–H bond +ve
vw very weak, w weak, m medium, s strong, sh shoulder and vs very strong.

131
Chapter Five
The Kinetics of Crystallization of
Poly (ethylene terephthalate) as Measured
by FTIR Spectroscopy
5.1 Introduction.
PET has played a unique part in the development of crystallization kinetics as it
was one of the first polymers to be studied by dilatometry and the isothermal
crystallization time dependence interpreted in terms of the Avrami equation [50].
Since then and because of its commercial importance, its crystallization behaviour
has been widely studied by a range of experimental techniques. DSC in particular has
been most successful in studying the effect of molecular structure and
copolymerization in controlling the rate of primary crystallization but it is deficient
in not being sufficiently sensitive to measure to any appreciable extent the
development of secondary crystallization with time [103, 105].
132
Secondary crystallization is important in establishing the final degree of
crystallinity and the distribution of lamellar thicknesses achieved during any thermal
treatment or drawing process. This has a pronounced effect on the ultimate material
properties achieved. In Chapter 4 the application of FTIR spectroscopy to measure
the development of crystallinity and the effect on the IR spectra was reviewed, and
procedures outlined for separating amorphous and crystalline absorption bands [102].
It was observed by means of two-dimensional correlation spectroscopy that the
carbonyl band at 1720 cm-1
split into two on crystallization; a band at 1717 cm-1
was
attributed to the crystalline region and that at 1727 cm -1
to the amorphous region and
that intensities were inversely related, such that as one increased the other decreased
during crystallization and melting. Unlike DSC, FTIR spectroscopy measured the
degree of crystallinity directly and the overall conversion could be studied over
extended time periods well into the secondary crystallization process.
5.2 Results and Discussion.
5.2.1 Changes in FTIR Spectrum of PET on Crystallization.
Many changes are apparent in the FTIR spectrum of PET in the position of the
absorption bands and the increase and decrease of their intensities in the FTIR
spectrum of PET with time on crystallizarion, and these have been widely discussed
133
in terms of chain segment conformational changes (cis/trans isomers) and field
effects between crystalline and amorphous regions. While many of these changes
follow the progress of the crystallization, a previous study has shown that those
associated with the aromatic ester carbonyl stretching band at 1720 cm-1
has the
potential to be the most accurate in following the development of crystallinity in
PET [102].
The change in intensity and shift in the position of the carbonyl absorption band
on crystallization at 236 oC with time is shown in Figure 5.1. There is a decrease in
intensity of the initial amorphous band at 1727cm-1
followed by a simultaneous
increase in the intensity at 1717 cm-1
and an isobestic point at 1720 cm-1
consistent
with the change in the two intensities occurring synchronously. The changes
occurred as crystallization was observed to develop by DSC over the same time scale.
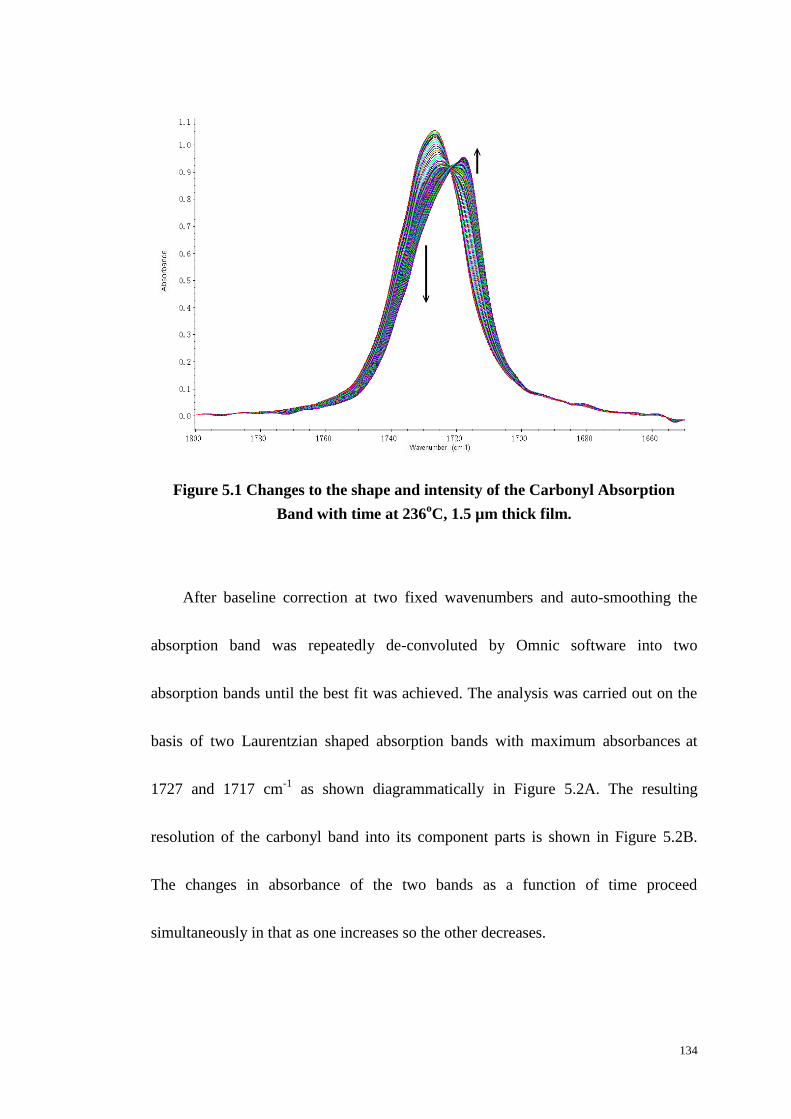
134
Figure 5.1 Changes to the shape and intensity of the Carbonyl Absorption
Band with time at 236oC, 1.5 µm thick film.
After baseline correction at two fixed wavenumbers and auto-smoothing the
absorption band was repeatedly de-convoluted by Omnic software into two
absorption bands until the best fit was achieved. The analysis was carried out on the
basis of two Laurentzian shaped absorption bands with maximum absorbances at
1727 and 1717 cm-1
as shown diagrammatically in Figure 5.2A. The resulting
resolution of the carbonyl band into its component parts is shown in Figure 5.2B.
The changes in absorbance of the two bands as a function of time proceed
simultaneously in that as one increases so the other decreases.

135
A.
B.
Figure 5.2 Deconvolution of the Carbonyl Absorption Band into
Crystalline and Amorphous Absorption Bands.
A. At Time t and B. Peak Changes with Time at 236oC.
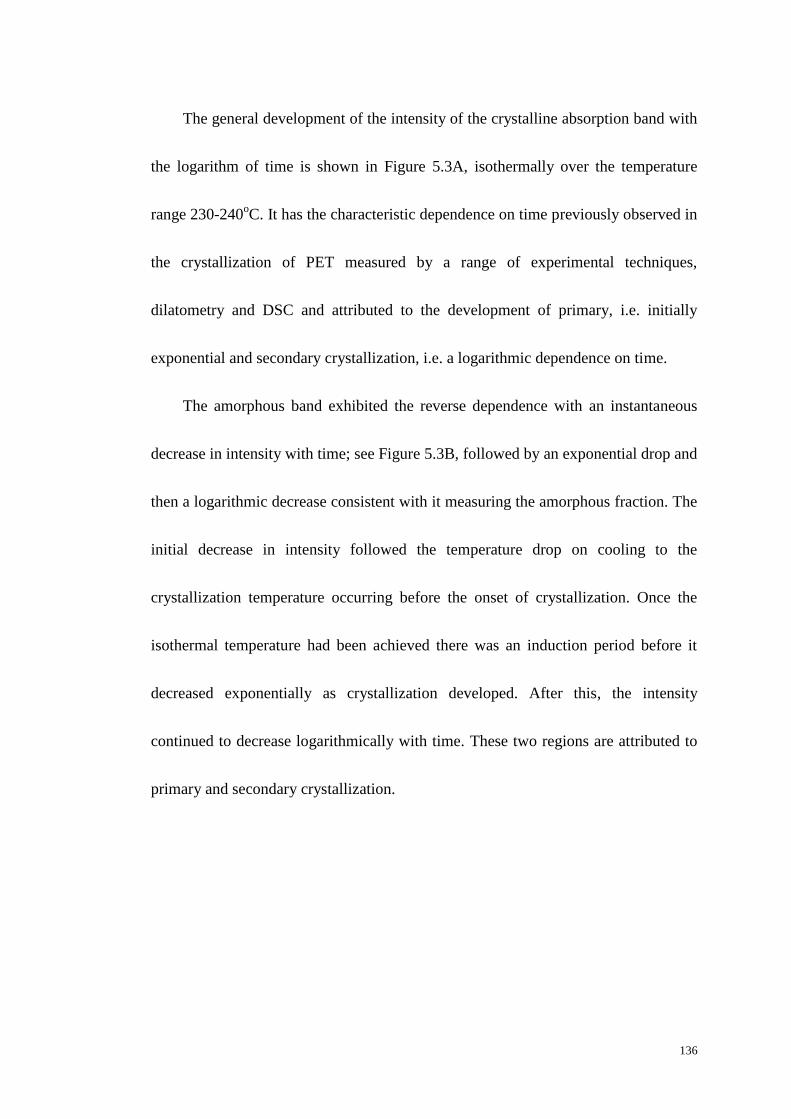
136
The general development of the intensity of the crystalline absorption band with
the logarithm of time is shown in Figure 5.3A, isothermally over the temperature
range 230-240oC. It has the characteristic dependence on time previously observed in
the crystallization of PET measured by a range of experimental techniques,
dilatometry and DSC and attributed to the development of primary, i.e. initially
exponential and secondary crystallization, i.e. a logarithmic dependence on time.
The amorphous band exhibited the reverse dependence with an instantaneous
decrease in intensity with time; see Figure 5.3B, followed by an exponential drop and
then a logarithmic decrease consistent with it measuring the amorphous fraction. The
initial decrease in intensity followed the temperature drop on cooling to the
crystallization temperature occurring before the onset of crystallization. Once the
isothermal temperature had been achieved there was an induction period before it
decreased exponentially as crystallization developed. After this, the intensity
continued to decrease logarithmically with time. These two regions are attributed to
primary and secondary crystallization.
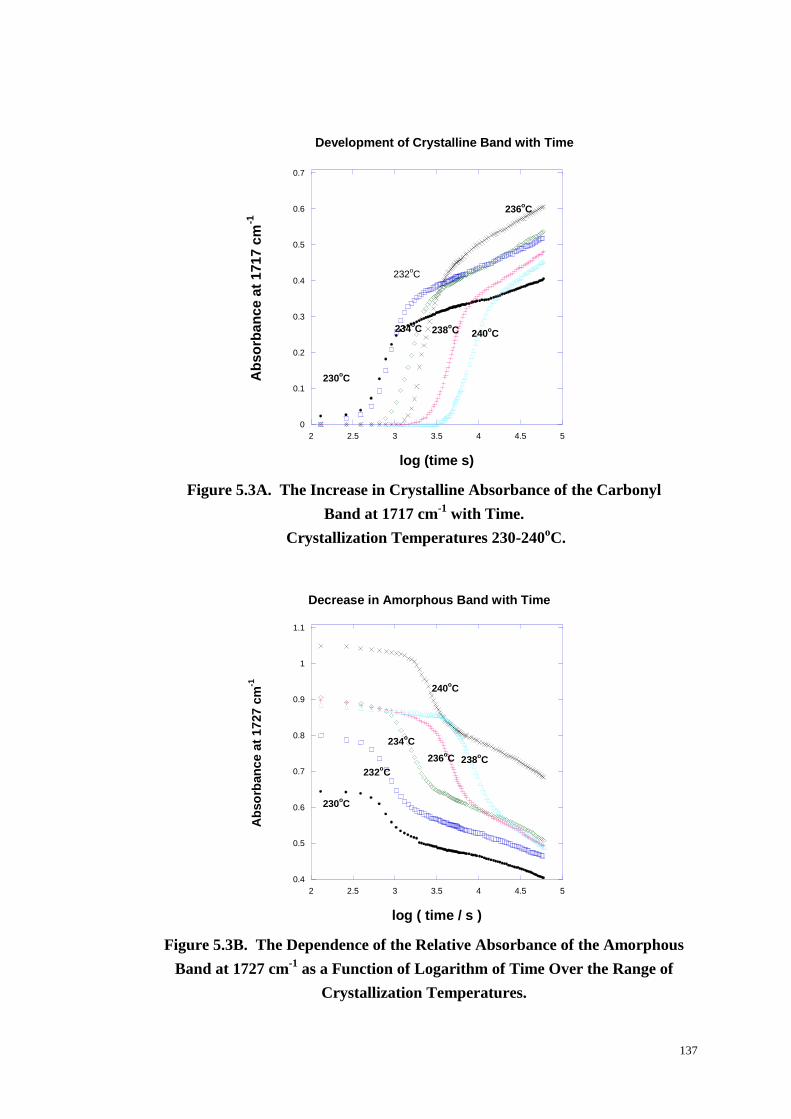
137
0
0.1
0.2
0.3
0.4
0.5
0.6
0.7
2 2.5 3 3.5 4 4.5 5
Ab
so
rba
nc
e a
t 1
71
7 c
m-1
log (time s)
Development of Crystalline Band with Time
232oC
230oC
240oC238
oC234
oC
236oC
Figure 5.3A. The Increase in Crystalline Absorbance of the Carbonyl
Band at 1717 cm-1
with Time.
Crystallization Temperatures 230-240oC.
0.4
0.5
0.6
0.7
0.8
0.9
1
1.1
2 2.5 3 3.5 4 4.5 5
Ab
so
rban
ce a
t 17
27
cm
-1
log ( time / s )
Decrease in Amorphous Band with Time
230oC
240oC
232oC
234oC
238oC236
oC
Figure 5.3B. The Dependence of the Relative Absorbance of the Amorphous
Band at 1727 cm-1
as a Function of Logarithm of Time Over the Range of
Crystallization Temperatures.
138
5.2.2 The Self-Consistency of the Measurements.
For the two phase model of a partially crystalline polymer, the amorphous
weight fraction, Xa t, is related to crystalline weight fraction, Xc,t , at time t,
Xa,t + Xc,t = 1.0 ( 5.1)
Defining Xa,t = Aa,t/Aa,o where Aa,t and Aa,o are the absorbances of the amorphous
band at time, t, and initially before any crystallinity has developed
Xc,t = (1 – Aa,t/Aa,o) ( 5.2)
For Beer-Lambert law to be obeyed by the crystalline band, the absorbance of the
crystalline band, Ac,t, at time t, Ac,t, = εclXc,t
where εc is extinction coefficient of the crystalline band and l sample thickness. Ac,t
is then linearly related to absorbance of the amorphous band, but increasing as the
other decreases since,
Ac,t, = εc l (1 – Aa,t/Aa,o) ( 5.3)
The linear dependence of the absorbance at 1717 cm-1
, A1717,t , on
(1-A1727,t /A1727,0) is shown in Figure 5.4 for each isothermal crystallization and was
taken as evidence that the above interpretation of the spectral changes is correcte.
139
The measured slope is a value of εcl for the crystalline band but since it varied
with temperature as well as sample thickness, l, the development of fractional
crystallinity with time was determined for each temperature from the ratio of Ac.t /εcl,
The development of the fractional crystallinity with time was calculated for each
crystallization temperature, see Figure 5.5, and used to analyze the kinetics of the
phase transition.
0
0.1
0.2
0.3
0.4
0.5
0.6
0 0.1 0.2 0.3 0.4 0.5
230 232 234
236 238 240
Ab
so
rba
nce a
t 17
17 c
m-1
Fractional Crystallinity, Xt
1 - A1727,t
/ A1727,0
Figure 5.4 The Correlation between Absorbance of the Crystalline Band at
1717 cm-1
and the Fractional Crystallinity as Defined by the Absorbance of the
Amorphous Band at 1727 cm-1
.
In conclusion the carbonyl absorption band of PET changes on crystallization
from a broad band with maximum intensity at 1727 cm-1
associated with the
amorphous region to a narrower band at 1717 cm-1
due to the crystalline regions. The
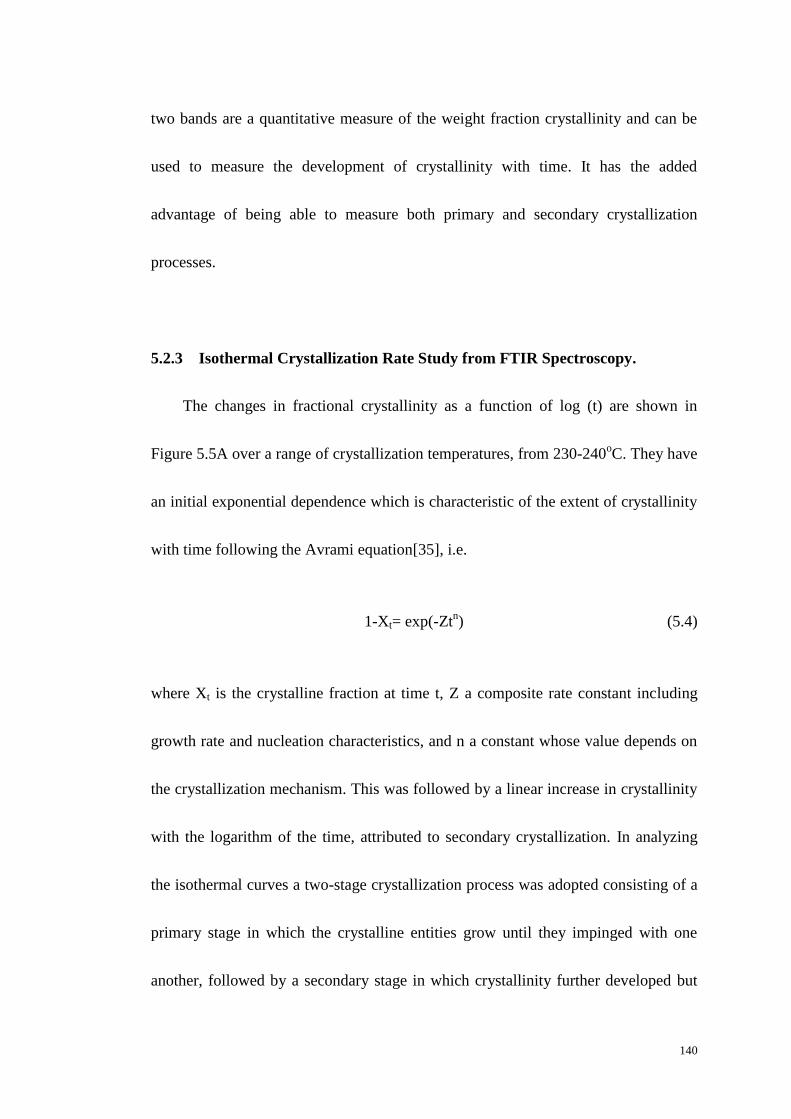
140
two bands are a quantitative measure of the weight fraction crystallinity and can be
used to measure the development of crystallinity with time. It has the added
advantage of being able to measure both primary and secondary crystallization
processes.
5.2.3 Isothermal Crystallization Rate Study from FTIR Spectroscopy.
The changes in fractional crystallinity as a function of log (t) are shown in
Figure 5.5A over a range of crystallization temperatures, from 230-240oC. They have
an initial exponential dependence which is characteristic of the extent of crystallinity
with time following the Avrami equation[35], i.e.
1-Xt= exp(-Ztn) (5.4)
where Xt is the crystalline fraction at time t, Z a composite rate constant including
growth rate and nucleation characteristics, and n a constant whose value depends on
the crystallization mechanism. This was followed by a linear increase in crystallinity
with the logarithm of the time, attributed to secondary crystallization. In analyzing
the isothermal curves a two-stage crystallization process was adopted consisting of a
primary stage in which the crystalline entities grow until they impinged with one
another, followed by a secondary stage in which crystallinity further developed but
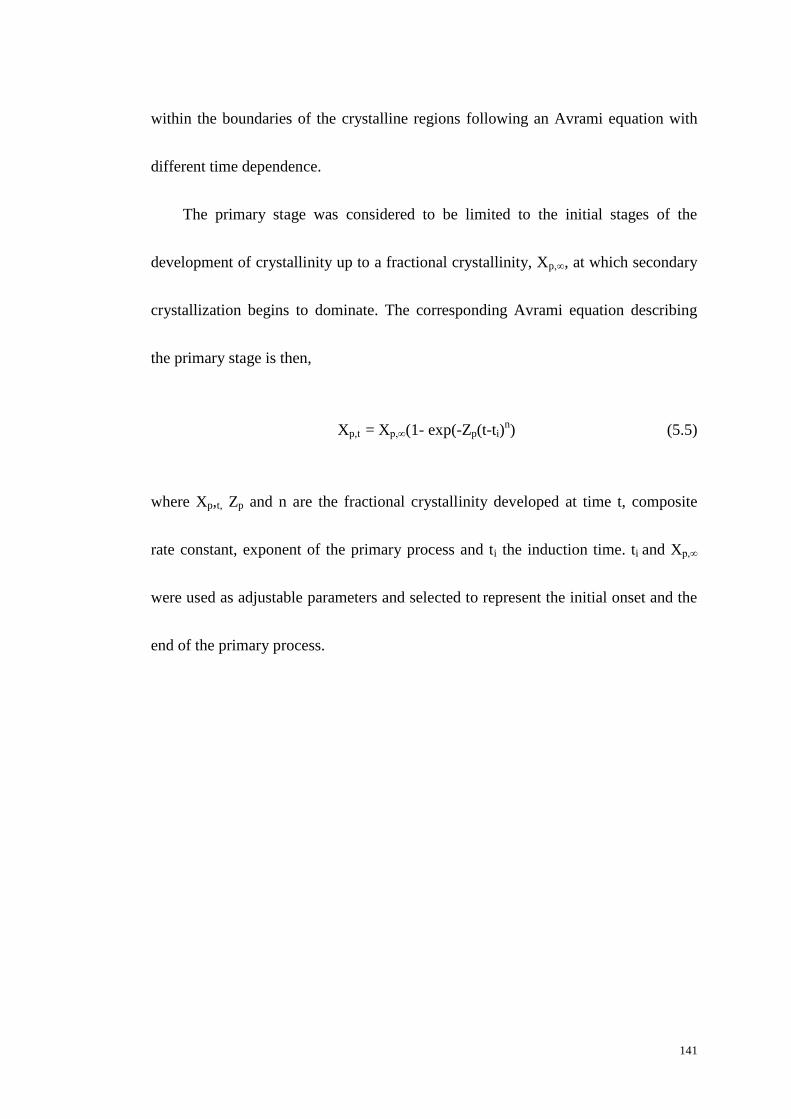
141
within the boundaries of the crystalline regions following an Avrami equation with
different time dependence.
The primary stage was considered to be limited to the initial stages of the
development of crystallinity up to a fractional crystallinity, Xp,∞, at which secondary
crystallization begins to dominate. The corresponding Avrami equation describing
the primary stage is then,
Xp,t = Xp,∞(1- exp(-Zp(t-ti)n) (5.5)
where Xp,t, Zp and n are the fractional crystallinity developed at time t, composite
rate constant, exponent of the primary process and ti the induction time. ti and Xp,∞
were used as adjustable parameters and selected to represent the initial onset and the
end of the primary process.
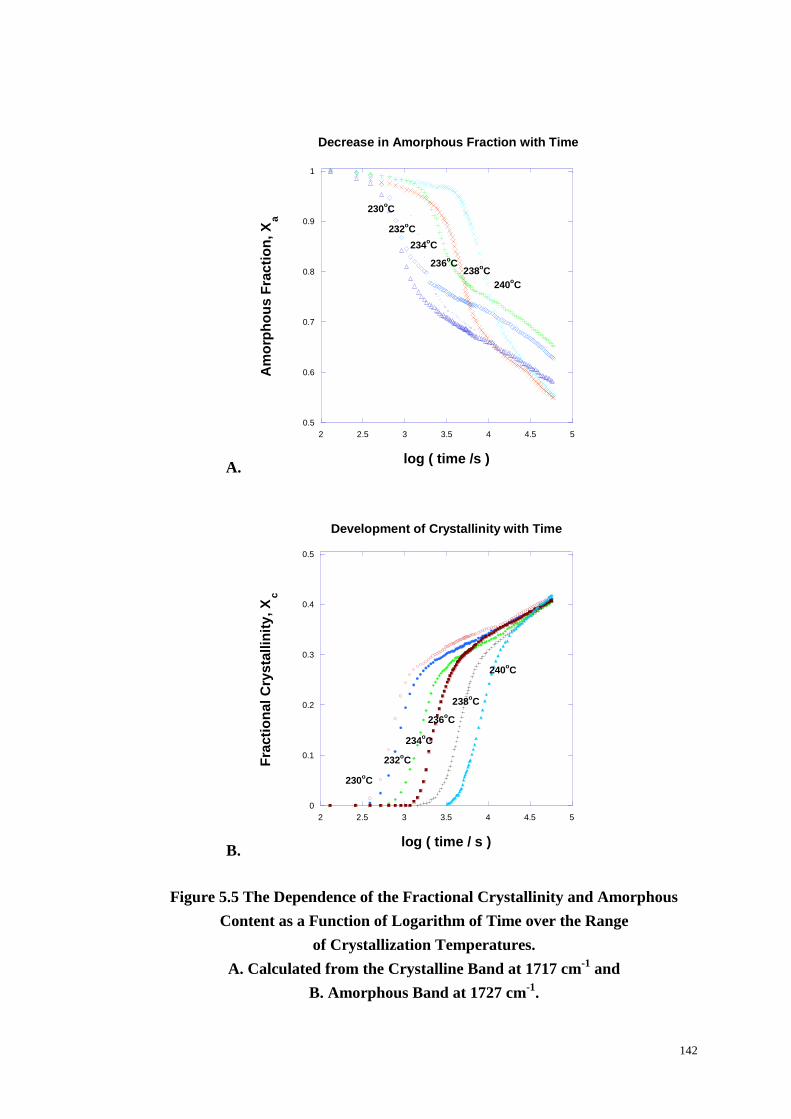
142
A.
0.5
0.6
0.7
0.8
0.9
1
2 2.5 3 3.5 4 4.5 5
Am
orp
ho
us
Fra
cti
on
, X
a
log ( time /s )
Decrease in Amorphous Fraction with Time
232oC
230oC
234oC
240oC
238oC
236oC
B.
0
0.1
0.2
0.3
0.4
0.5
2 2.5 3 3.5 4 4.5 5
Fra
cti
on
al C
rysta
llin
ity
, X
c
log ( time / s )
230oC
232oC
234oC
236oC
238oC
240oC
Development of Crystallinity with Time
Figure 5.5 The Dependence of the Fractional Crystallinity and Amorphous
Content as a Function of Logarithm of Time over the Range
of Crystallization Temperatures.
A. Calculated from the Crystalline Band at 1717 cm-1
and
B. Amorphous Band at 1727 cm-1
.

143
A.
-3
-2.5
-2
-1.5
-1
-0.5
0
0.5
1
2 2.5 3 3.5 4 4.5 5
The Effect of Induction Time
log
(-ln
(1-X
t))
log( t- ti/s)
ti=5000 s
0
2750 s
240oC X
p,inf=0.35
B.
-1.5
-1
-0.5
0
0.5
1
2 2.2 2.4 2.6 2.8 3 3.2 3.4
The Effect of Xp.inf
0.370.340.33
0.360.355
Lo
g(-
ln(1
-Xp
,t/X
p,in
f))
log (time /s)
Figure 5.6
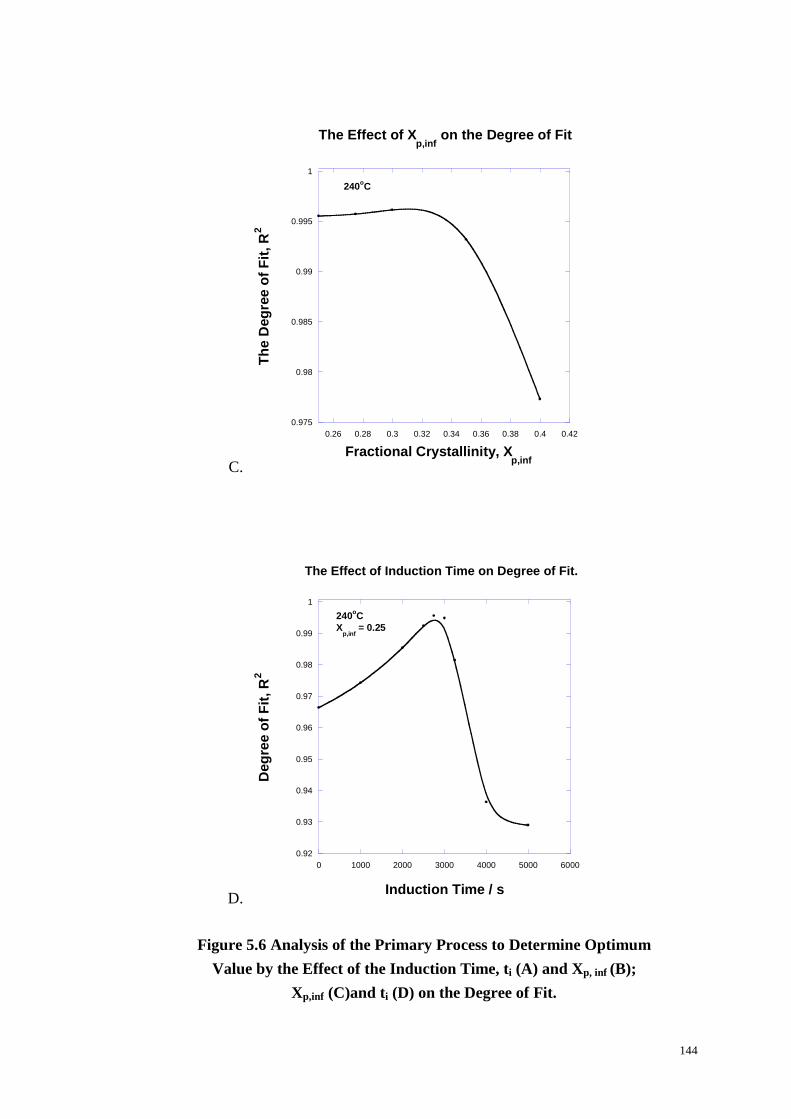
144
C.
0.975
0.98
0.985
0.99
0.995
1
0.26 0.28 0.3 0.32 0.34 0.36 0.38 0.4 0.42
Th
e D
eg
ree o
f F
it, R
2
Fractional Crystallinity, Xp,inf
The Effect of Xp,inf
on the Degree of Fit
240oC
D.
0.92
0.93
0.94
0.95
0.96
0.97
0.98
0.99
1
0 1000 2000 3000 4000 5000 6000
Deg
ree o
f F
it, R
2
Induction Time / s
240oC
Xp,inf
= 0.25
The Effect of Induction Time on Degree of Fit.
Figure 5.6 Analysis of the Primary Process to Determine Optimum
Value by the Effect of the Induction Time, ti (A) and Xp, inf (B);
Xp,inf (C)and ti (D) on the Degree of Fit.
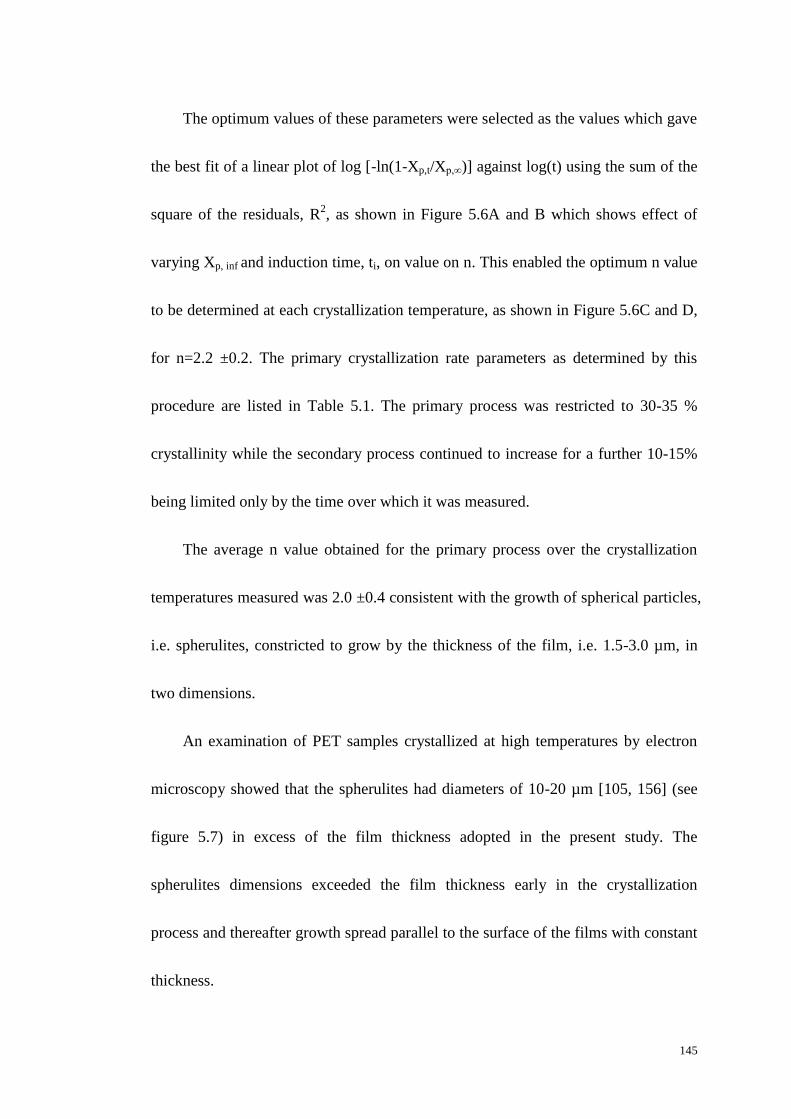
145
The optimum values of these parameters were selected as the values which gave
the best fit of a linear plot of log [-ln(1-Xp,t/Xp,∞)] against log(t) using the sum of the
square of the residuals, R2, as shown in Figure 5.6A and B which shows effect of
varying Xp, inf and induction time, ti, on value on n. This enabled the optimum n value
to be determined at each crystallization temperature, as shown in Figure 5.6C and D,
for n=2.2 ±0.2. The primary crystallization rate parameters as determined by this
procedure are listed in Table 5.1. The primary process was restricted to 30-35 %
crystallinity while the secondary process continued to increase for a further 10-15%
being limited only by the time over which it was measured.
The average n value obtained for the primary process over the crystallization
temperatures measured was 2.0 ±0.4 consistent with the growth of spherical particles,
i.e. spherulites, constricted to grow by the thickness of the film, i.e. 1.5-3.0 µm, in
two dimensions.
An examination of PET samples crystallized at high temperatures by electron
microscopy showed that the spherulites had diameters of 10-20 µm [105, 156] (see
figure 5.7) in excess of the film thickness adopted in the present study. The
spherulites dimensions exceeded the film thickness early in the crystallization
process and thereafter growth spread parallel to the surface of the films with constant
thickness.
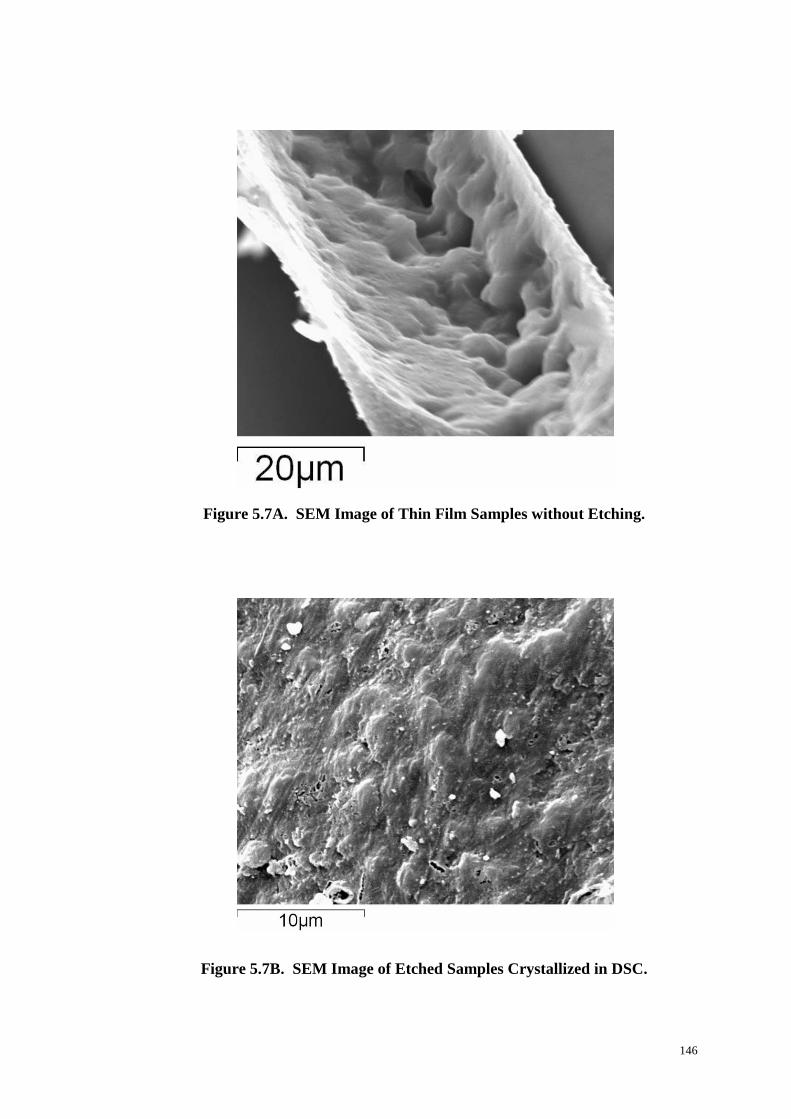
146
Figure 5.7A. SEM Image of Thin Film Samples without Etching.
Figure 5.7B. SEM Image of Etched Samples Crystallized in DSC.
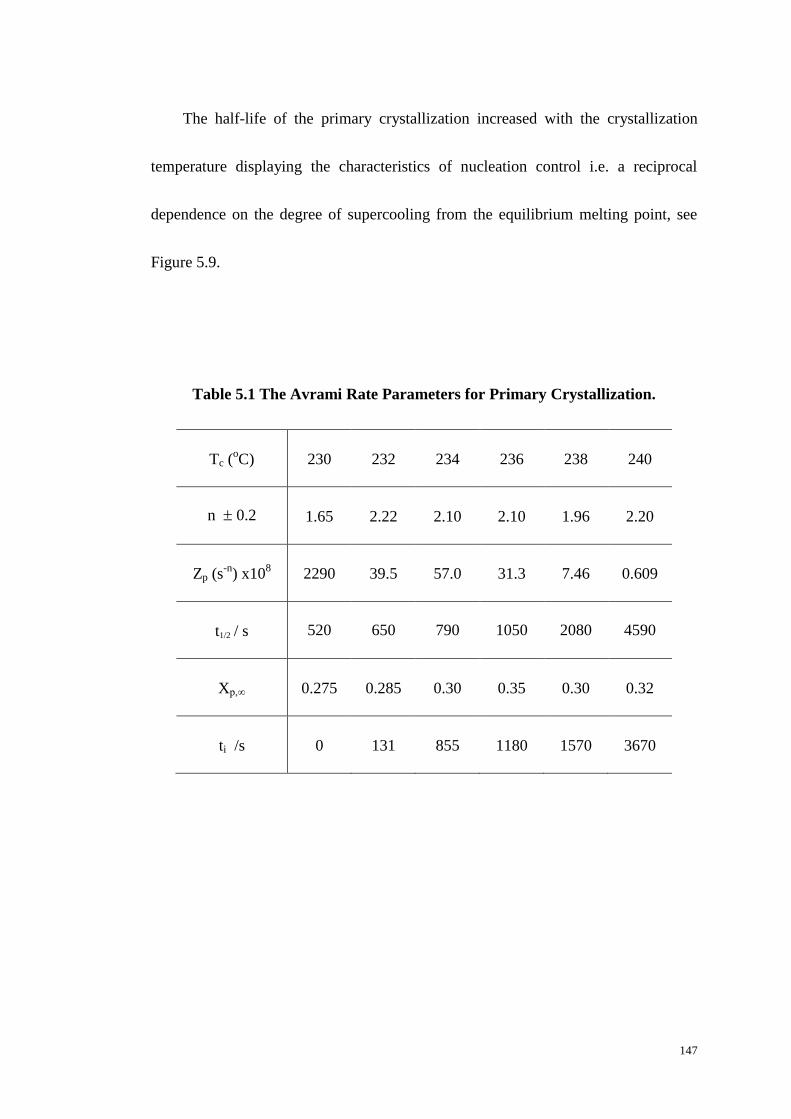
147
The half-life of the primary crystallization increased with the crystallization
temperature displaying the characteristics of nucleation control i.e. a reciprocal
dependence on the degree of supercooling from the equilibrium melting point, see
Figure 5.9.
Table 5.1 The Avrami Rate Parameters for Primary Crystallization.
Tc (oC) 230 232 234 236 238 240
n 0.2 1.65 2.22 2.10 2.10 1.96 2.20
Zp (s-n
) x108
2290 39.5 57.0 31.3 7.46 0.609
t1/2 / s 520 650 790 1050 2080 4590
Xp,∞ 0.275 0.285 0.30 0.35 0.30 0.32
ti /s 0 131 855 1180 1570 3670
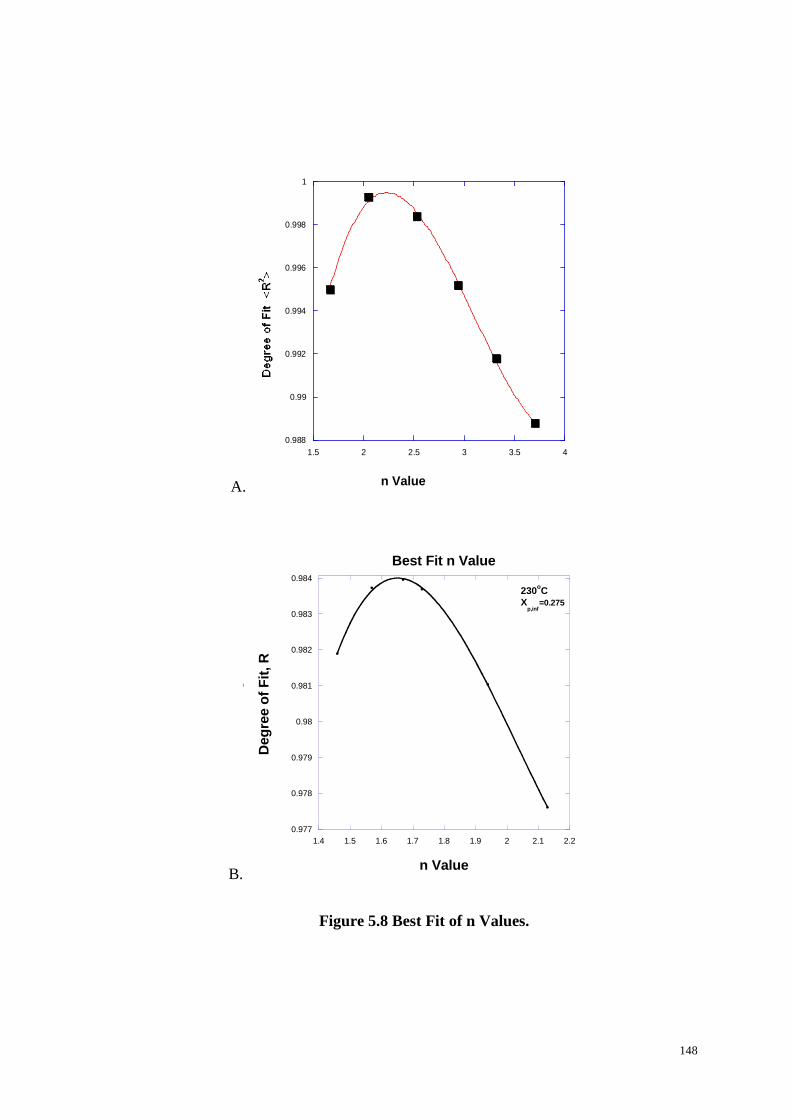
148
A.
B.
0.977
0.978
0.979
0.98
0.981
0.982
0.983
0.984
1.4 1.5 1.6 1.7 1.8 1.9 2 2.1 2.2
Best Fit n Value
Deg
ree o
f F
it, R
n Value
Deg
ree o
f F
it, R
230oC
Xp,inf
=0.275
Figure 5.8 Best Fit of n Values.
0.988
0.99
0.992
0.994
0.996
0.998
1
1.5 2 2.5 3 3.5 4
n Value
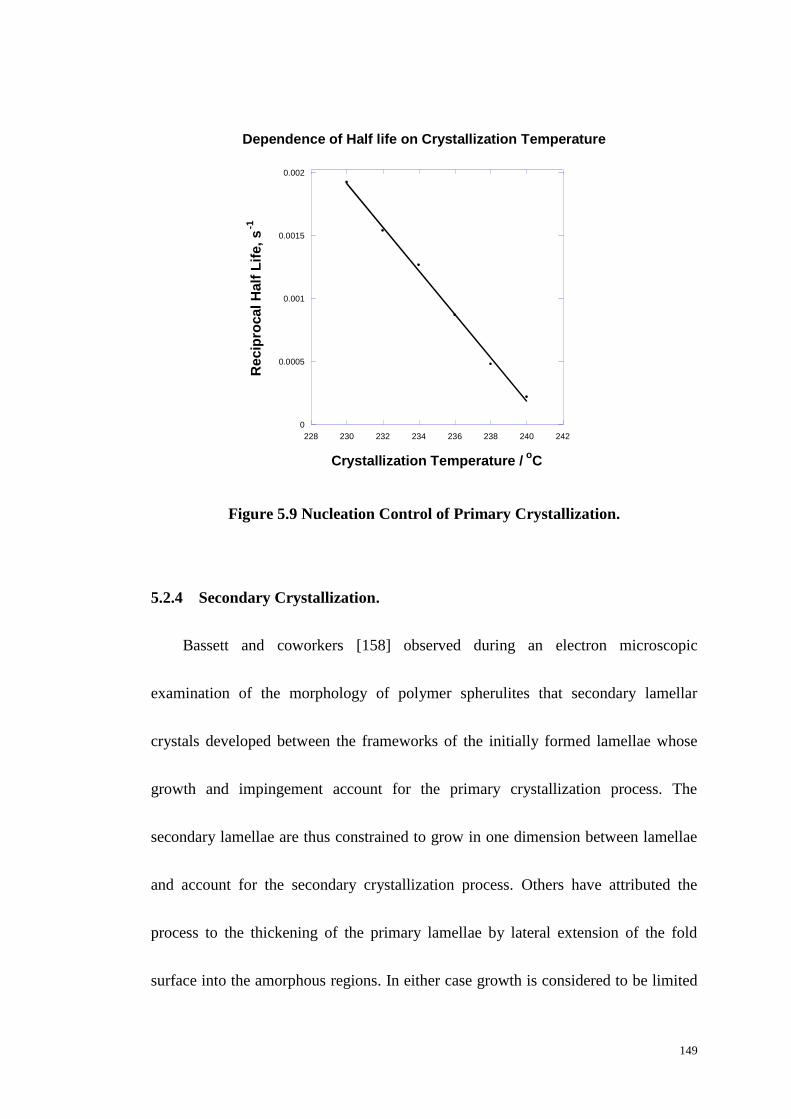
149
0
0.0005
0.001
0.0015
0.002
228 230 232 234 236 238 240 242
Dependence of Half life on Crystallization Temperature
Recip
rocal H
alf
Lif
e,
s-1
Crystallization Temperature / oC
Figure 5.9 Nucleation Control of Primary Crystallization.
5.2.4 Secondary Crystallization.
Bassett and coworkers [158] observed during an electron microscopic
examination of the morphology of polymer spherulites that secondary lamellar
crystals developed between the frameworks of the initially formed lamellae whose
growth and impingement account for the primary crystallization process. The
secondary lamellae are thus constrained to grow in one dimension between lamellae
and account for the secondary crystallization process. Others have attributed the
process to the thickening of the primary lamellae by lateral extension of the fold
surface into the amorphous regions. In either case growth is considered to be limited

150
to one dimension between pre-existing lamellae and should corresponds to an
Avrami model for which the n value is 1.0.
The fractional crystallinity, Xt, is accordingly the sum of two Avrami equations
for primary and secondary crystallization, modified to incorporate their relative
importance, Xp.∞, and Xs,∞, i.e.
Xt = Xp,t = Xp,∞ 1 − exp −Z t − ti np + Xs,∞ 1 − exp −Z t − tp,∞
ns
(5.6)
where Xp,∞ and Xs.∞ are the fractional crystallinity at the end of primary and
secondary process respectively.
An additional assumption was made that the secondary process started at the
end of the primary process with an induction time of tp,∞. Zp and Zs are the
corresponding composite rate constants and np and ns the Avrami exponents. The
secondary crystallization process was analyzed only when Xt > Xp,, and accordingly
Xt = Xp,∞ + Xs,∞ 1 − exp −Z t − tp,∞ ns (5.7)
and the kinetic parameters of the secondary crystallization, i.e. the Avrami constant,
ns, rate constant, Zs, and the half-life, t1/2, obtained from a plot of
log(-ln(1-((Xt-Xp,∞)/Xs,∞))) against log(t-tp,∞), see Figure 10A. The best fit value of ns
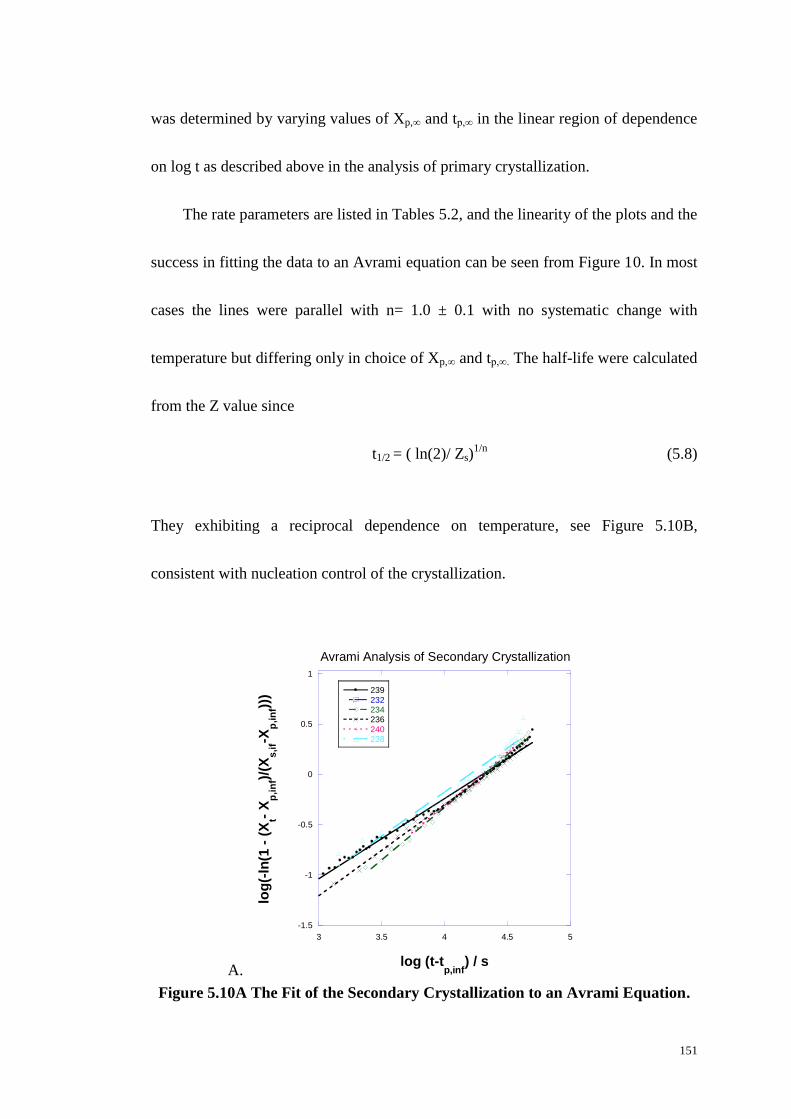
151
was determined by varying values of Xp,∞ and tp,∞ in the linear region of dependence
on log t as described above in the analysis of primary crystallization.
The rate parameters are listed in Tables 5.2, and the linearity of the plots and the
success in fitting the data to an Avrami equation can be seen from Figure 10. In most
cases the lines were parallel with n= 1.0 ± 0.1 with no systematic change with
temperature but differing only in choice of Xp,∞ and tp,∞. The half-life were calculated
from the Z value since
t1/2 = ( ln(2)/ Zs)1/n
(5.8)
They exhibiting a reciprocal dependence on temperature, see Figure 5.10B,
consistent with nucleation control of the crystallization.
A.
-1.5
-1
-0.5
0
0.5
1
3 3.5 4 4.5 5
Avrami Analysis of Secondary Crystallization
239
232234236
240238
log
(-ln
(1 -
(X
t- X
p,in
f)/(X
s,if-X
p,in
f)))
log (t-tp,inf
) / s
Figure 5.10A The Fit of the Secondary Crystallization to an Avrami Equation.
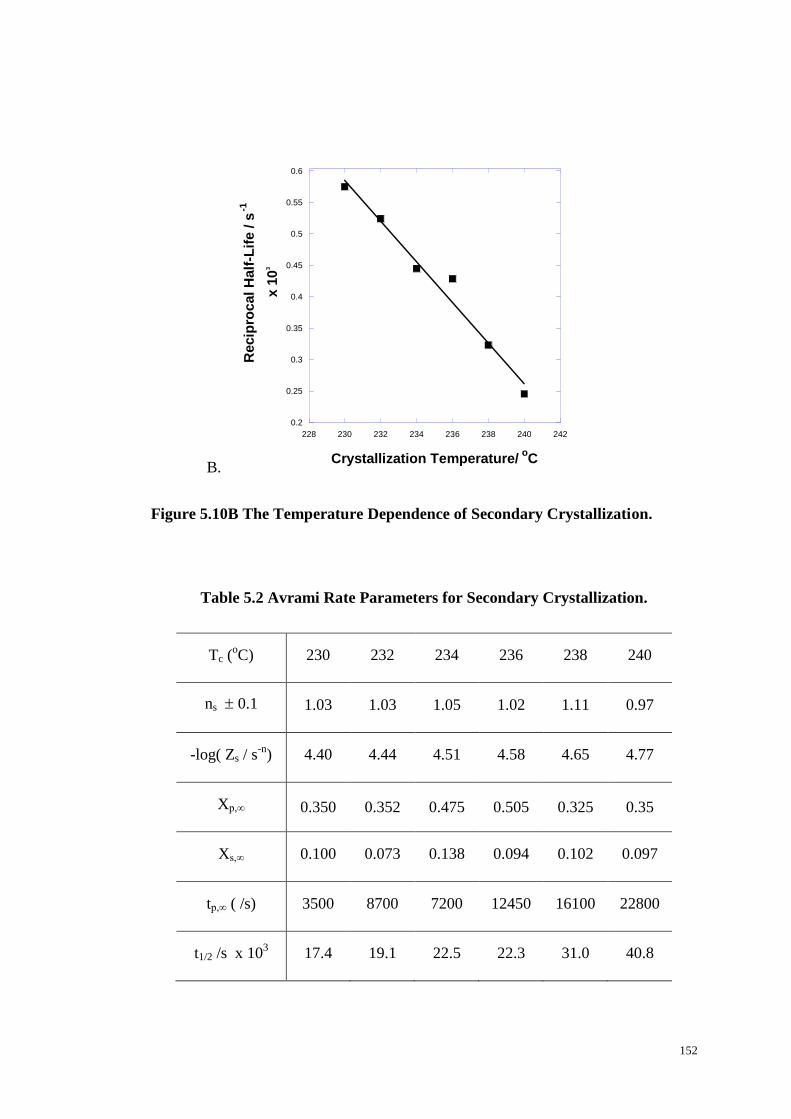
152
B.
0.2
0.25
0.3
0.35
0.4
0.45
0.5
0.55
0.6
228 230 232 234 236 238 240 242
Crystallization Temperature/ oC
Recip
rocal H
alf
-Lif
e / s
-1
x
10
3
Figure 5.10B The Temperature Dependence of Secondary Crystallization.
Table 5.2 Avrami Rate Parameters for Secondary Crystallization.
Tc (oC) 230 232 234 236 238 240
ns 0.1 1.03 1.03 1.05 1.02 1.11 0.97
-log( Zs / s-n
)
4.40 4.44 4.51 4.58 4.65 4.77
Xp,∞ 0.350 0.352 0.475 0.505 0.325 0.35
Xs,∞ 0.100 0.073 0.138 0.094 0.102 0.097
tp,∞ ( /s) 3500 8700 7200 12450 16100 22800
t1/2 /s x 103 17.4 19.1 22.5 22.3 31.0 40.8
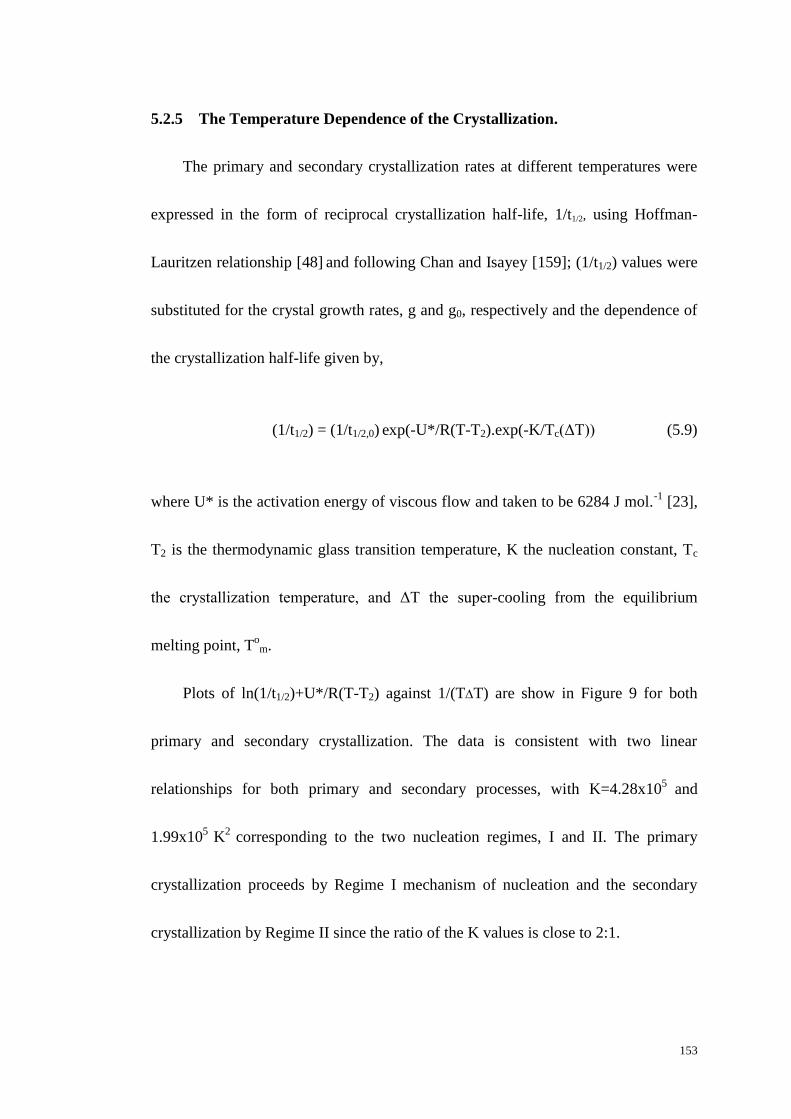
153
5.2.5 The Temperature Dependence of the Crystallization.
The primary and secondary crystallization rates at different temperatures were
expressed in the form of reciprocal crystallization half-life, 1/t1/2, using Hoffman-
Lauritzen relationship [48] and following Chan and Isayey [159]; (1/t1/2) values were
substituted for the crystal growth rates, g and g0, respectively and the dependence of
the crystallization half-life given by,
(1/t1/2) = (1/t1/2,0) exp(-U*/R(T-T2).exp(-K/Tc(ΔT)) (5.9)
where U* is the activation energy of viscous flow and taken to be 6284 J mol.-1
[23],
T2 is the thermodynamic glass transition temperature, K the nucleation constant, Tc
the crystallization temperature, and ΔT the super-cooling from the equilibrium
melting point, Tom.
Plots of ln(1/t1/2)+U*/R(T-T2) against 1/(TT) are show in Figure 9 for both
primary and secondary crystallization. The data is consistent with two linear
relationships for both primary and secondary processes, with K=4.28x10⁵
and
1.99x10⁵
K2
corresponding to the two nucleation regimes, I and II. The primary
crystallization proceeds by Regime I mechanism of nucleation and the secondary
crystallization by Regime II since the ratio of the K values is close to 2:1.
154
Regime I is considered to occur at high crystallization temperatures and low
degree of super-cooling. Surface secondary nucleation is rate determining since
coverage of the surface occurs and there is a delay before the next layer is nucleated.
For this model, the growing surface is smooth, and
K1= 4 be TomΔHv (5.10)
Regime II is normally observed at a higher degree of super-cooling and
secondary nucleation is considered to be more rapid such that it occurs before the
surface layer is covered. For this model the growing surface has several secondary
nuclei and is rough, and
K11=2 beTomΔHv (5.11)
where b is the monomolecular layer thickness, taken to be the perpendicular
separation of plane [24]. This is 5.53 Å [48], and is the side surface free energy of
the polymer crystal, e the fold surface free energy and ΔHv the enthalpy of fusion
per unit volume. was estimated from [24, 48, 160]
= 0.11ΔHv (ab) ½ (5.12)
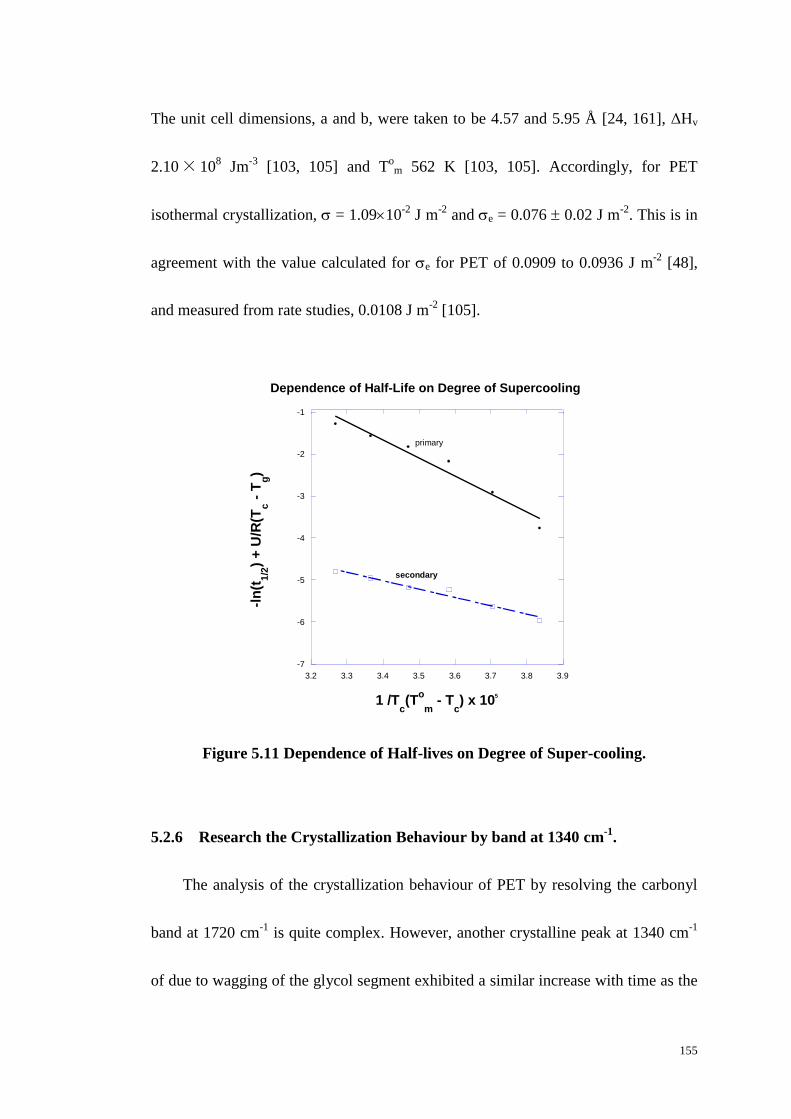
155
The unit cell dimensions, a and b, were taken to be 4.57 and 5.95 Å [24, 161], ΔHv
2.10× 10⁸ Jm
-3 [103, 105] and T
om 562 K [103, 105]. Accordingly, for PET
isothermal crystallization, = 1.0910-2
J m-2
and e = 0.076 0.02 J m-2
. This is in
agreement with the value calculated for e for PET of 0.0909 to 0.0936 J m-2
[48],
and measured from rate studies, 0.0108 J m-2
[105].
-7
-6
-5
-4
-3
-2
-1
3.2 3.3 3.4 3.5 3.6 3.7 3.8 3.9
-ln
(t1
/2)
+ U
/R(T
c -
Tg)
1 /Tc(T
o
m - T
c) x 10
5
primary
secondary
Dependence of Half-Life on Degree of Supercooling
Figure 5.11 Dependence of Half-lives on Degree of Super-cooling.
5.2.6 Research the Crystallization Behaviour by band at 1340 cm-1
.
The analysis of the crystallization behaviour of PET by resolving the carbonyl
band at 1720 cm-1
is quite complex. However, another crystalline peak at 1340 cm-1
of due to wagging of the glycol segment exhibited a similar increase with time as the
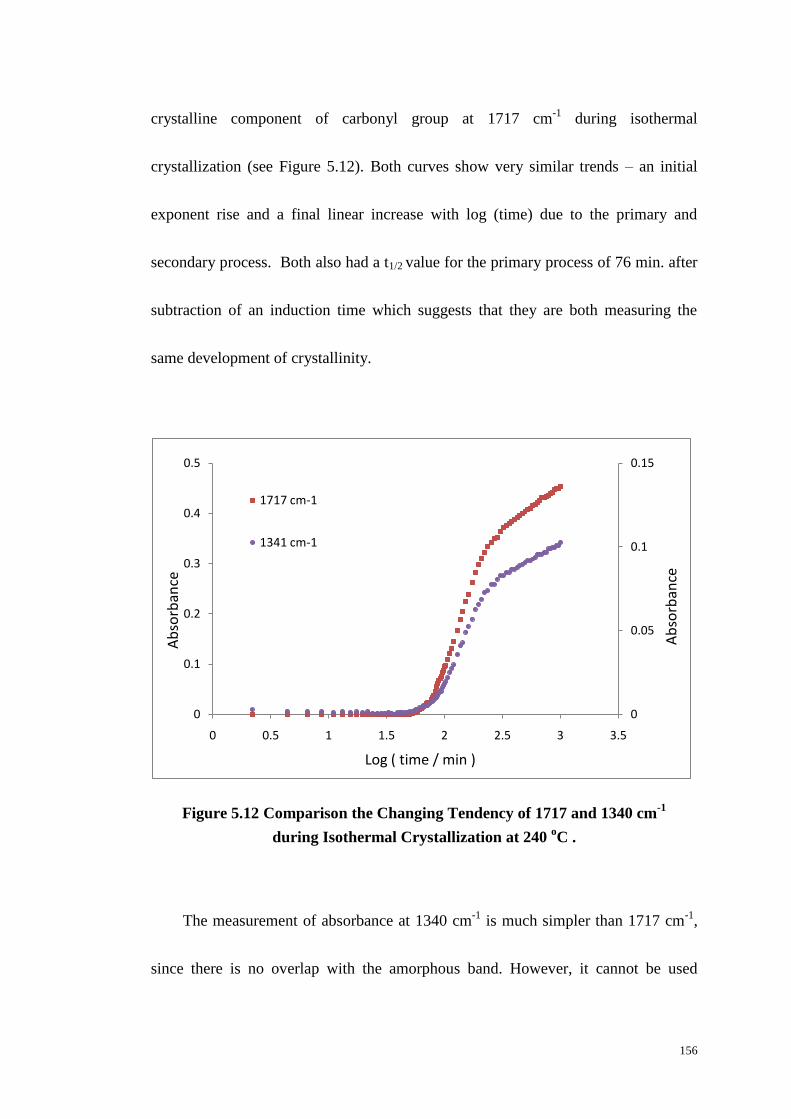
156
crystalline component of carbonyl group at 1717 cm-1
during isothermal
crystallization (see Figure 5.12). Both curves show very similar trends – an initial
exponent rise and a final linear increase with log (time) due to the primary and
secondary process. Both also had a t1/2 value for the primary process of 76 min. after
subtraction of an induction time which suggests that they are both measuring the
same development of crystallinity.
Figure 5.12 Comparison the Changing Tendency of 1717 and 1340 cm-1
during Isothermal Crystallization at 240 oC .
The measurement of absorbance at 1340 cm-1
is much simpler than 1717 cm-1
,
since there is no overlap with the amorphous band. However, it cannot be used
0
0.05
0.1
0.15
0
0.1
0.2
0.3
0.4
0.5
0 0.5 1 1.5 2 2.5 3 3.5
Ab
sorb
ance
Ab
sorb
ance
Log ( time / min )
1717 cm-1
1341 cm-1
157
directly to calculate the crystallinity of PET as it relates to the crystalline phase only
and there is no crystallinity calibrated reference. The carbonyl absorption band is
very intense such that thin films, 1.5-3 µm thick, are required for absorbance values
close to 1.0. The much weaker absorbance of the 1340 cm-1
band would enable film
thicknesses of up 15-30 µm to be used in the FTIR measurements. This could have
obvious advantages in measuring effect of film dimensions on the crystallization
kinetics, as well as improved accuracy of the measurements.
It would also require a different method of calibrating the fractional crystallinity
by similar observations on an amorphous band.
5.3 Conclusions.
The isothermal crystallization of PET has been measured in the temperature
range 230-240 oC by FTIR spectroscopy from the change in absorption of the
carbonyl ester group in the region of 1710-1730 cm-1
. Absorption bands were
attributed both to the amorphous at 1727 and crystalline content at 1717 cm-1
and
using the power of the Omnic software it was possible to resolve the two overlapping
bands and determine their relative contribution. Since both amorphous and
crystalline content were separately determined the fractional crystallinity could be
measured as a function of time. However, the intensity of both bands at constant
158
crystallinity decreased with temperature and calibration of the fractional crystallinity
was required to be calibrated at each temperature.
Since the fractional crystallinity rather than the rate of crystallization was
directly measured by the FTIR spectrometer the procedure was not limited by the
sensitivity of the measurements and the crystallization kinetics could be studied to
higher temperature, and so to lower rates for extended periods. Accordingly
secondary crystallization could be measured in greater detail than has been the case
with DSC.
The overall crystallization included two different time dependent steps,
attributed to primary and secondary crystallization. These appeared to occur
consecutively, such that it was possible to analyze them with two separated Avrami
equations - separated at a critical value of the degree of crystallinity, Xp,, where the
primary process stopped and the secondary started. Separate Avrami exponents, n,
were assigned to each; n was 2.0 for the primary process and 1.0 for the secondary
consistent with the crystallization mechanism. For the primary crystallization this
was growth of discs confined to two dimensions by the thickness of the films, 1.5 to
3 µm. To confirm this point the crystallization of PET sheet samples 1-2 mm thick
was measured by DSC over a similar temperature range, 224-234oC, limited by the
sensitivity of the calorimeter. Although the measured half-lives were reasonably
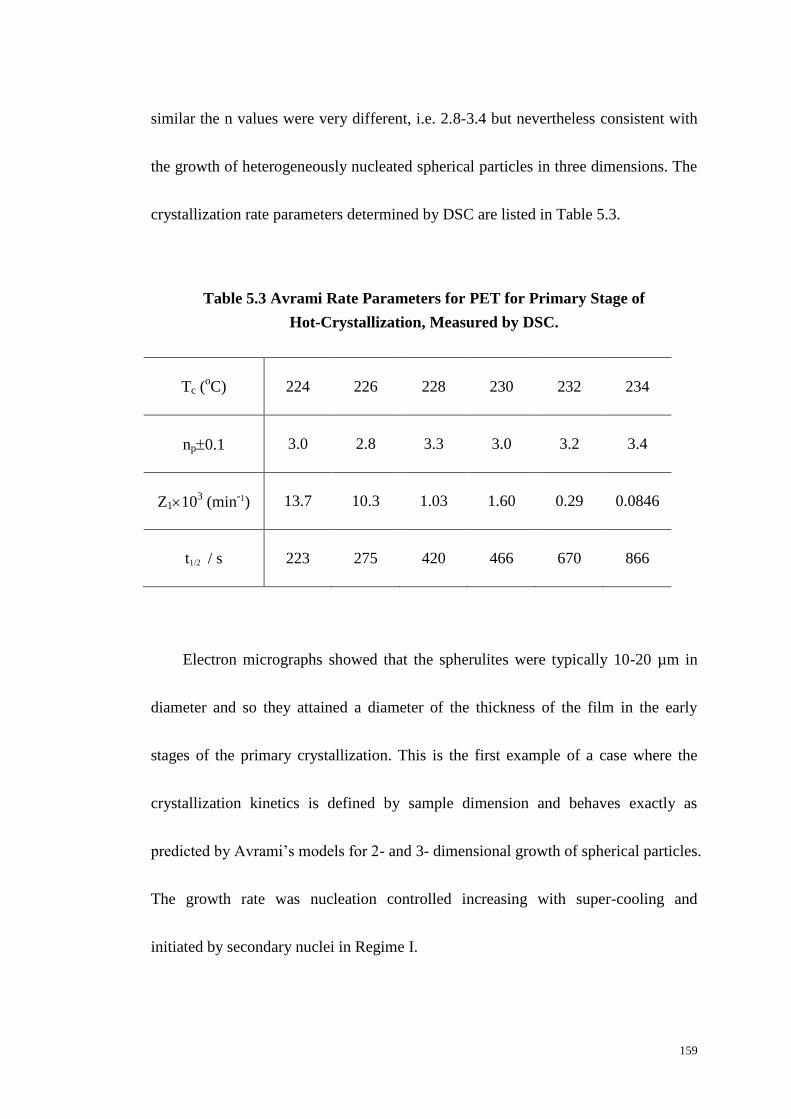
159
similar the n values were very different, i.e. 2.8-3.4 but nevertheless consistent with
the growth of heterogeneously nucleated spherical particles in three dimensions. The
crystallization rate parameters determined by DSC are listed in Table 5.3.
Table 5.3 Avrami Rate Parameters for PET for Primary Stage of
Hot-Crystallization, Measured by DSC.
Tc (oC) 224 226 228 230 232 234
np0.1 3.0 2.8 3.3 3.0 3.2 3.4
Z1103 (min
-1) 13.7 10.3 1.03 1.60 0.29 0.0846
t1/2 / s 223 275 420 466 670 866
Electron micrographs showed that the spherulites were typically 10-20 µm in
diameter and so they attained a diameter of the thickness of the film in the early
stages of the primary crystallization. This is the first example of a case where the
crystallization kinetics is defined by sample dimension and behaves exactly as
predicted by Avrami’s models for 2- and 3- dimensional growth of spherical particles.
The growth rate was nucleation controlled increasing with super-cooling and
initiated by secondary nuclei in Regime I.
160
For the secondary crystallization, the n value was 1.0 and this was consistent
with the growth of lamellae between the original lamellae laid down in the formation
of the spherulites. Growth was thus confined to the amorphous regions between the
parallel lamellae. Unlike primary secondary crystallization, however, was initiated
by nuclei in Regime II which may reflect the increased difficulty in accumulating
material on the lamellae from the melt constrained between lamellae.
161
Chapter Six
Melting Behaviour and Seeded Crystallization
of PET
6.1 Introduction
The melting behaviour of a polymer is an important physical parameter as it
defines the maximum working temperature of a crystalline polymer. Heating close to
the observed melting region invariably results in structural alterations to the polymer
and a change in physical and mechanical properties. In addition, measurement of the
equilibrium melting point of a polymer is important in defining the temperature
dependence of the kinetics of crystallization and underpins the theoretical
interpretation of all thermodynamic theories of phase transitions.
The melting point of a polymer is not unique since it depends on the
crystallization temperature and the thermal history of the sample. Many studies have
been made of the melting behaviour of PET but it has been concluded that melting is
162
complex depending on the experimental conditions chosen [103-106]. One, two and
three separate endotherms have been observed and attributed to different lamellae
thickness distributions produced on cooling to room temperature, on annealing on
heating to the melting point, during primary and secondary crystallization. However,
for PET, most of the studies are based on the melting of the lamellae produced
during the primary process at various crystallization temperatures [103, 105]. The
different heating rate adopted during the melting affects the measured melting
temperature since annealing occurred on heating and there is a thermal lag [162].
Secondary crystallization is also important in establishing the final degree of
crystallinity and the distribution of lamellae thicknesses achieved during thermal
treatment [163]. The thermal history of secondary crystallization is an important
factor in determining the shape of the final melting endotherm and the melting point
[106, 164].
6.2 Banks and Sharples’ model of Seeded Crystallization
Banks and Sharples proposed a procedure of seeded crystallization in order to
increase the rate of crystallization of polyethylene [28, 33, 165]. They used the
concept of partial melting to produce a large number of crystal seeds on which
primary crystallization would develop. This was achieved first by crystallizing
163
polyethylene at 127.5 oC, and then partially melting at a temperature 0.9
oC lower
than the previously observed melting point of 136.8 oC. After partial melting the
sample was cooled to 127.5 oC and subsequently re-crystallized. They found that the
half-life of primary isothermal crystallization had been reduced from 100 to 17.5
minutes. Crystallization had developed on seeds of crystalline material which
survived the partial melting, and acted as nuclei. In the other word, the number of the
primary nuclei had increased and this reduced the half-life of isothermal
crystallization and increases the crystallization rate. The nucleation process of seeded
crystallization is that of heterogeneous nucleation.
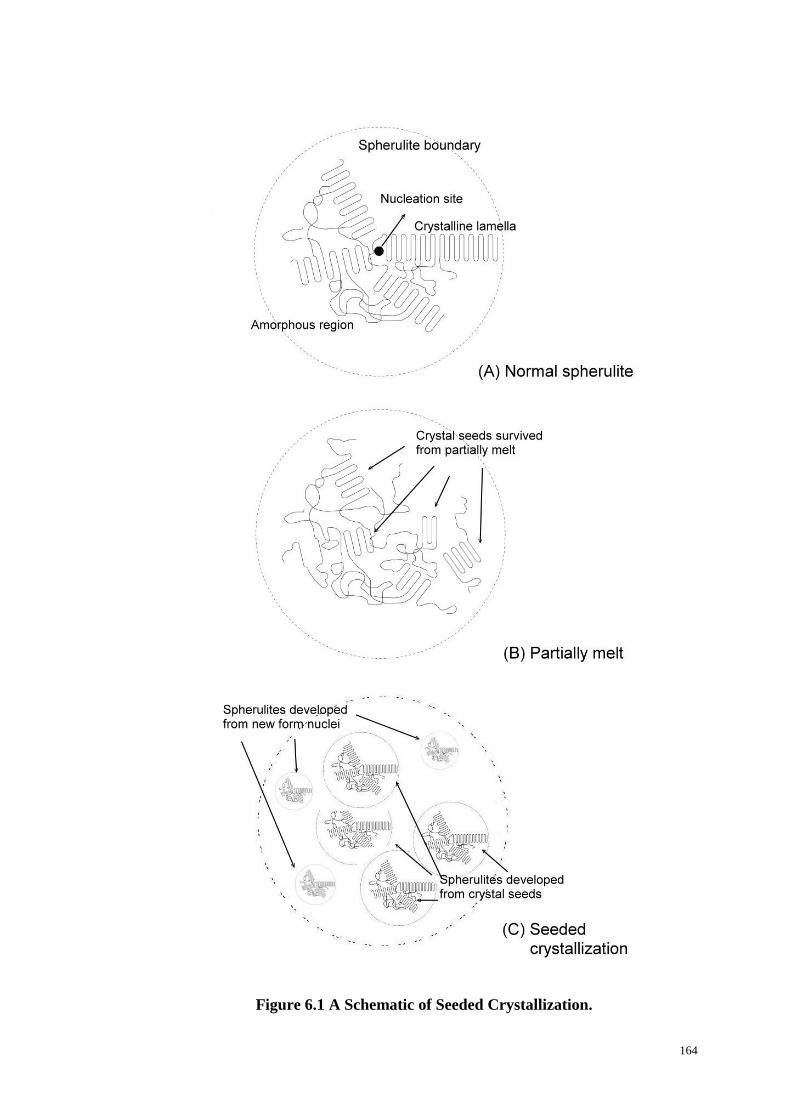
164
Figure 6.1 A Schematic of Seeded Crystallization.
165
Figure 6.2 show time lapse micrographs of the seeding procedure adopted by
Banks and Sharples showing the change in appearance of the PE spherulites during
partial melting, subsequent seeded crystallization and further crystallization. The PE
spherulites initially grown from the melt at 118.4 oC for 8 minutes (Figure 6.2A)
were partially melted at 127.6 oC, which is 0.9
oC
lower than the final melting
temperature at which the spherulites disappeared. On cooling to 118.4 oC again a
micro-crystalline texture developed rapidly within the regions initially occupied by
the spherulites. The amorphous regions external to the spherulite boundary continued
to crystallize retaining a memory of the structure of the original spherulites, see
Figure 6.2C.
This technique of seeding was applied to the study of the crystallization of PET
but since its spherulites were not resolvable by optical microscopy the process was
studied by FTIR spectroscopy and DSC and on samples which had completed their
primary crystallization so that the secondary process could be separately studied at
higher temperatures.
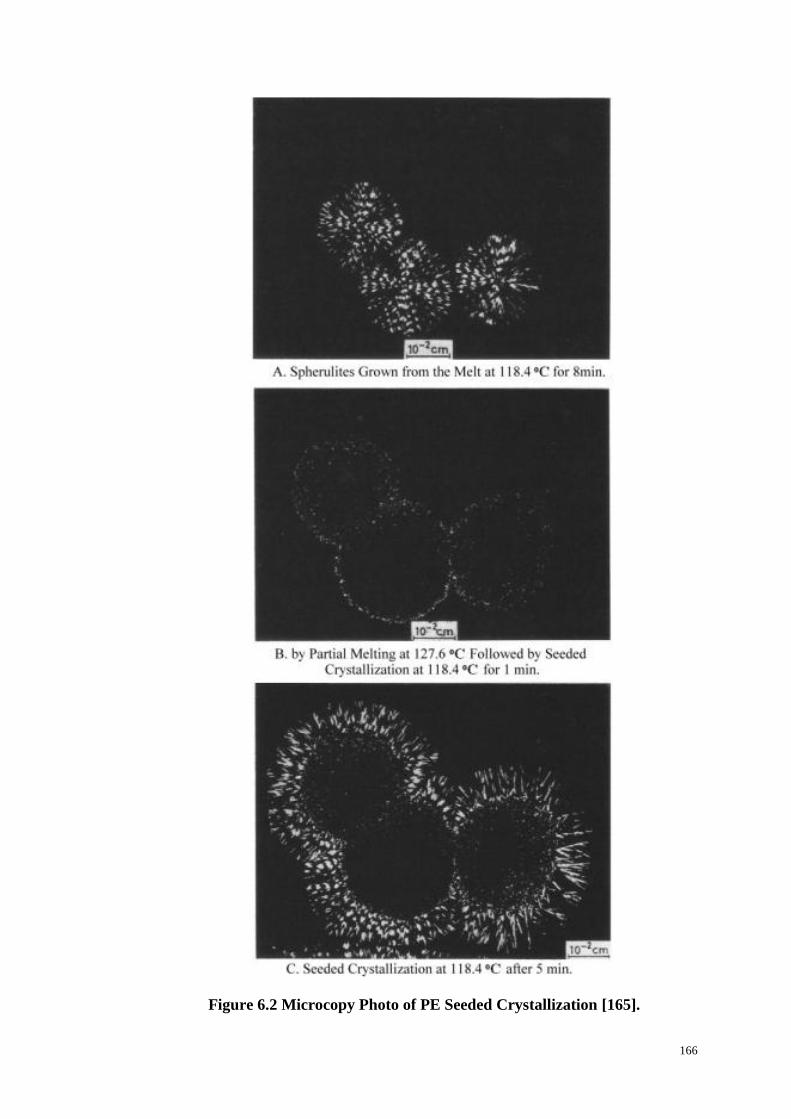
166
Figure 6.2 Microcopy Photo of PE Seeded Crystallization [165].
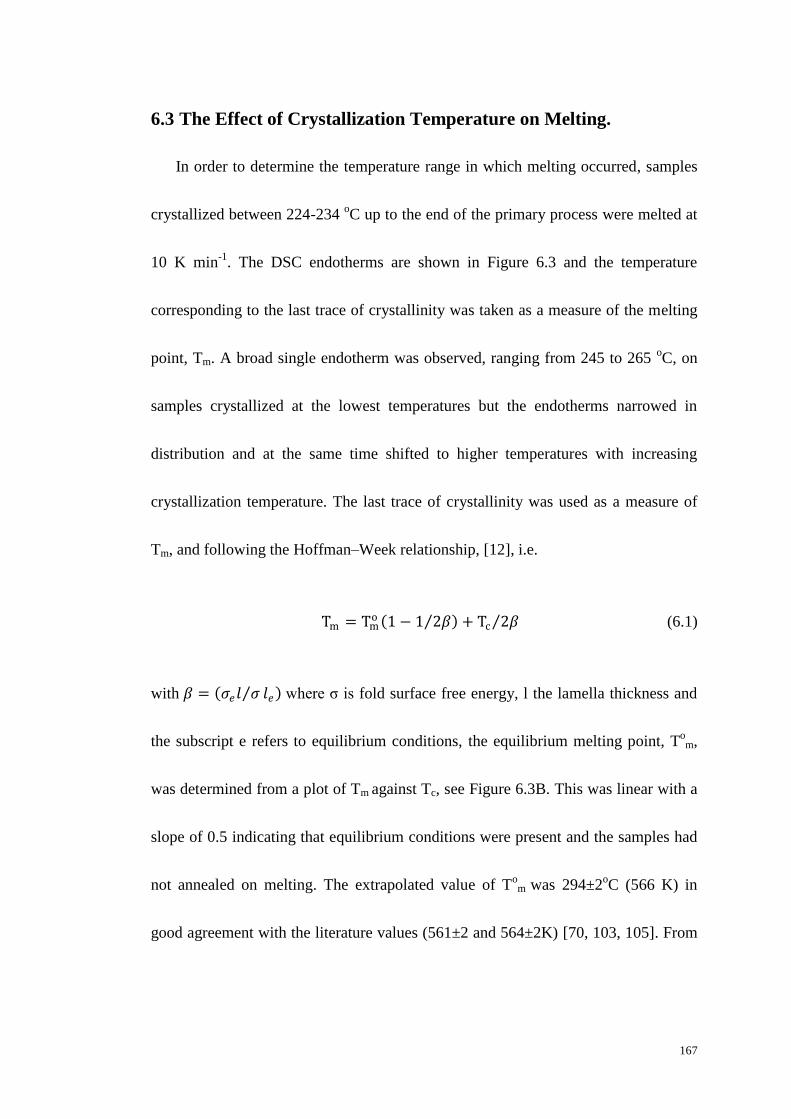
167
6.3 The Effect of Crystallization Temperature on Melting.
In order to determine the temperature range in which melting occurred, samples
crystallized between 224-234 oC up to the end of the primary process were melted at
10 K min-1
. The DSC endotherms are shown in Figure 6.3 and the temperature
corresponding to the last trace of crystallinity was taken as a measure of the melting
point, Tm. A broad single endotherm was observed, ranging from 245 to 265 oC, on
samples crystallized at the lowest temperatures but the endotherms narrowed in
distribution and at the same time shifted to higher temperatures with increasing
crystallization temperature. The last trace of crystallinity was used as a measure of
Tm, and following the Hoffman–Week relationship, [12], i.e.
Tm = Tmo 1 − 1 2𝛽 + Tc 2𝛽 (6.1)
with 𝛽 = 𝜎𝑒𝑙 𝜎 𝑙𝑒 where σ is fold surface free energy, l the lamella thickness and
the subscript e refers to equilibrium conditions, the equilibrium melting point, Tom,
was determined from a plot of Tm against Tc, see Figure 6.3B. This was linear with a
slope of 0.5 indicating that equilibrium conditions were present and the samples had
not annealed on melting. The extrapolated value of Tom was 294±2
oC (566 K) in
good agreement with the literature values (561±2 and 564±2K) [70, 103, 105]. From
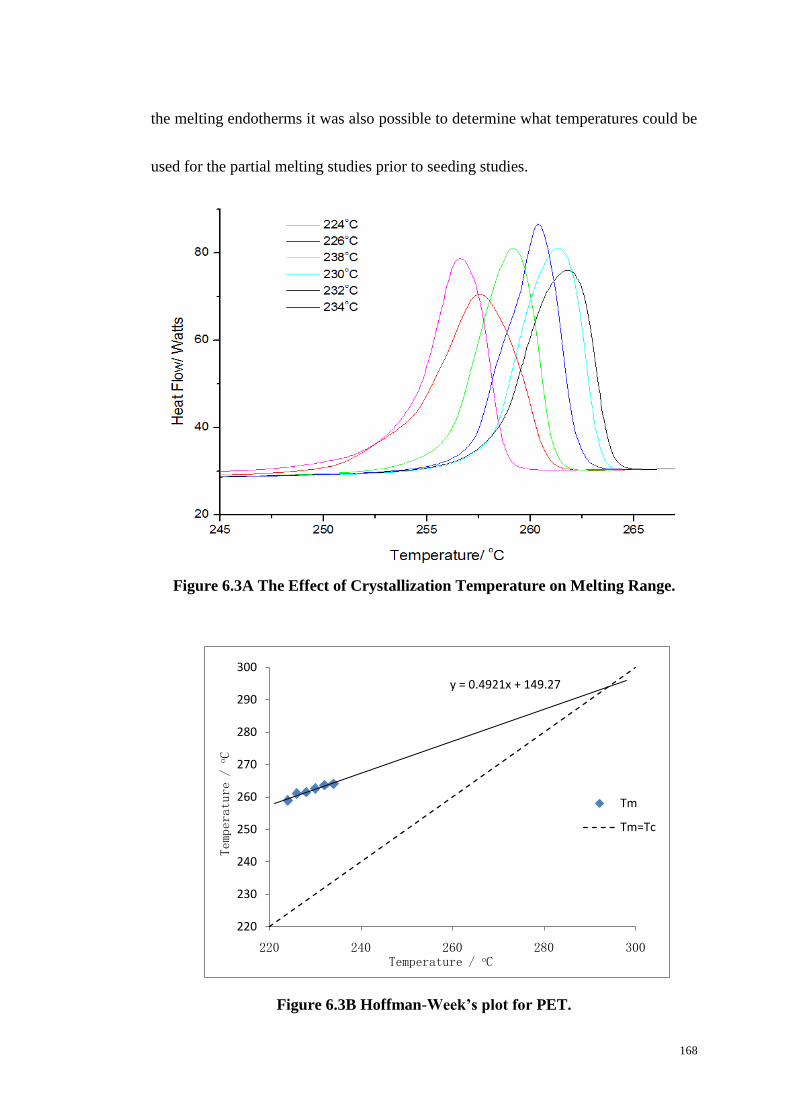
168
the melting endotherms it was also possible to determine what temperatures could be
used for the partial melting studies prior to seeding studies.
Figure 6.3A The Effect of Crystallization Temperature on Melting Range.
Figure 6.3B Hoffman-Week’s plot for PET.
y = 0.4921x + 149.27
220
230
240
250
260
270
280
290
300
220 240 260 280 300
Temperature / oC
Temperature / oC
Tm
Tm=Tc

169
6.4 The Effect of Crystallization Time on Melting Behaviour.
Only two isothermal crystallization series, at 228 and 234 oC, were selected to
study the melting behaviour of PET and in particular determine the effect of the
secondary crystallization on the melting behaviour. The melting endotherms for the
isothermally crystallized samples as a function of time are shown in Figures 6.4 and
6.5 in the time domain where secondary crystallization dominated, i.e. above 50
minutes. The endotherms were initially broad, melting over 20o but narrowed and
progressively moved to a higher temperature with time as secondary crystallization
developed.
Figure 6.4 The Effect of Time on the Melting of PET crystallized at 228 oC.
170
As was shown in Chapter 5, the half-life for primary crystallization at 228 and
234 o
C are 12 and 25 minutes. respectively, therefore the extending time scale of 50
to 1000 minutes fell within the secondary crystallization region and the change in
melting behaviour is associated with a progressive thickening of the lamella as
initially laid down.
Figure 6.5 The Effect of Time on the Melting of PET crystallized at 234oC
With time the melting point increased from 254 to 262 oC at 228
oC and 257 to
265 o
C at 234 o
C respectively. The melting temperature defined as the last trace of
crystallinity is a measure of the most stable and so thickest lamellae present in the
sample. This linear increase in the melting point with time, see Figure 6.6, was
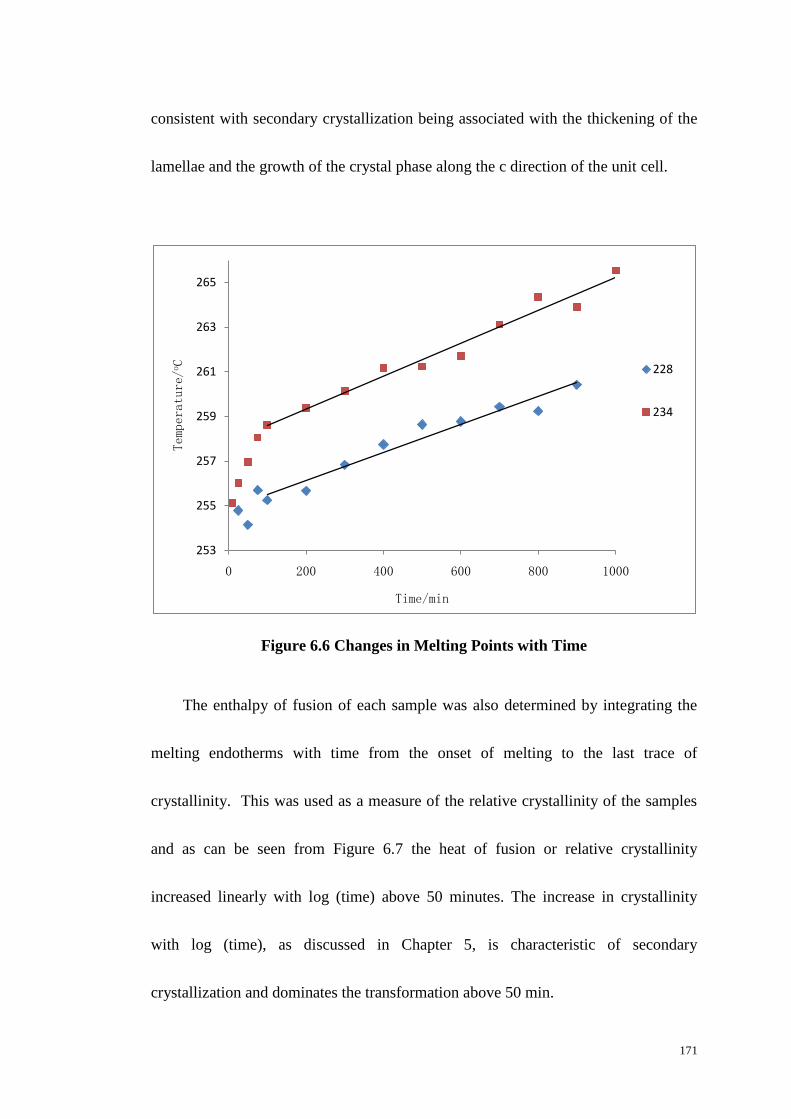
171
consistent with secondary crystallization being associated with the thickening of the
lamellae and the growth of the crystal phase along the c direction of the unit cell.
Figure 6.6 Changes in Melting Points with Time
The enthalpy of fusion of each sample was also determined by integrating the
melting endotherms with time from the onset of melting to the last trace of
crystallinity. This was used as a measure of the relative crystallinity of the samples
and as can be seen from Figure 6.7 the heat of fusion or relative crystallinity
increased linearly with log (time) above 50 minutes. The increase in crystallinity
with log (time), as discussed in Chapter 5, is characteristic of secondary
crystallization and dominates the transformation above 50 min.
253
255
257
259
261
263
265
0 200 400 600 800 1000
Temperature/
o C
Time/min
228
234
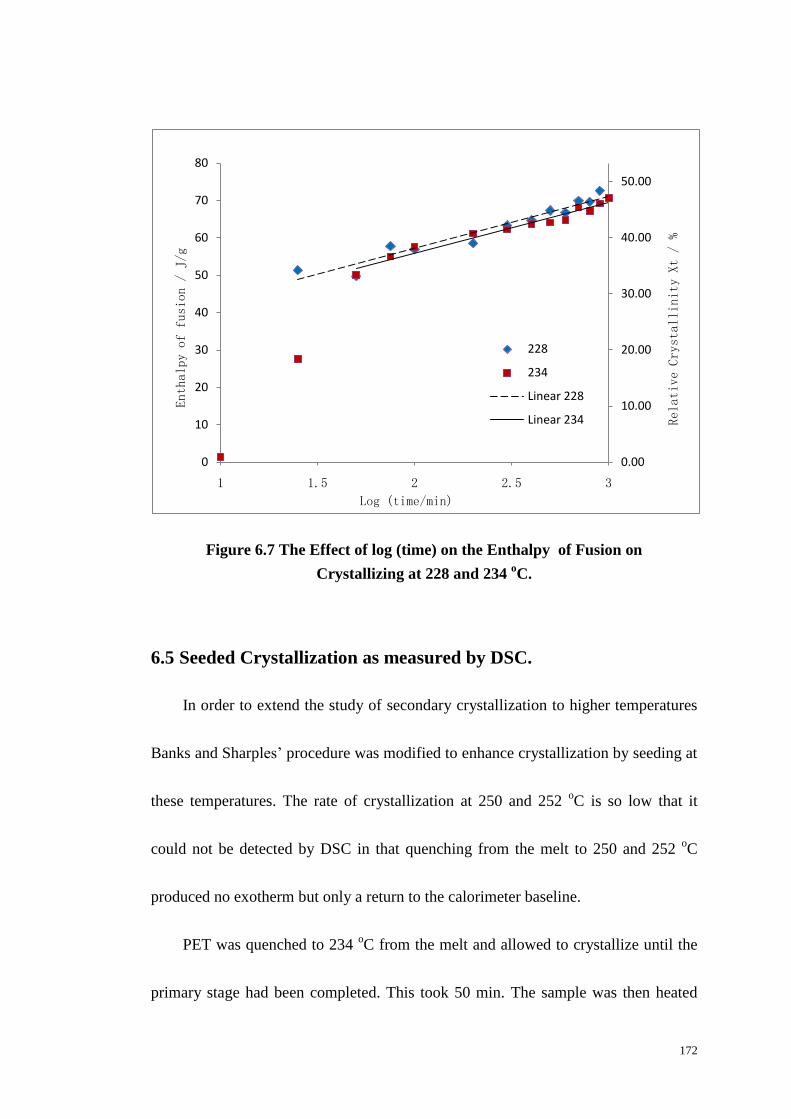
172
Figure 6.7 The Effect of log (time) on the Enthalpy of Fusion on
Crystallizing at 228 and 234 oC.
6.5 Seeded Crystallization as measured by DSC.
In order to extend the study of secondary crystallization to higher temperatures
Banks and Sharples’ procedure was modified to enhance crystallization by seeding at
these temperatures. The rate of crystallization at 250 and 252 oC is so low that it
could not be detected by DSC in that quenching from the melt to 250 and 252 oC
produced no exotherm but only a return to the calorimeter baseline.
PET was quenched to 234 oC from the melt and allowed to crystallize until the
primary stage had been completed. This took 50 min. The sample was then heated
0.00
10.00
20.00
30.00
40.00
50.00
0
10
20
30
40
50
60
70
80
1 1.5 2 2.5 3
Relative Crystallinity Xt / %
Enthalpy of fusion / J/g
Log (time/min)
228
234
Linear 228
Linear 234
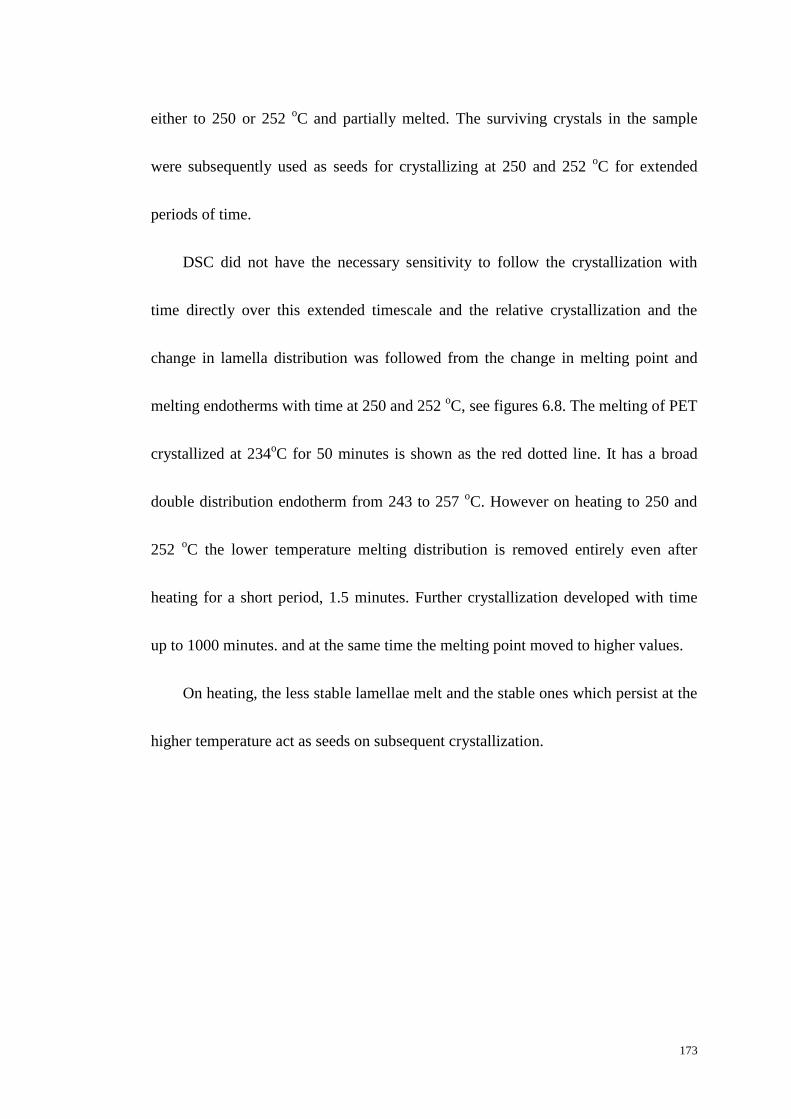
173
either to 250 or 252 oC and partially melted. The surviving crystals in the sample
were subsequently used as seeds for crystallizing at 250 and 252 oC for extended
periods of time.
DSC did not have the necessary sensitivity to follow the crystallization with
time directly over this extended timescale and the relative crystallization and the
change in lamella distribution was followed from the change in melting point and
melting endotherms with time at 250 and 252 oC, see figures 6.8. The melting of PET
crystallized at 234oC for 50 minutes is shown as the red dotted line. It has a broad
double distribution endotherm from 243 to 257 oC. However on heating to 250 and
252 oC the lower temperature melting distribution is removed entirely even after
heating for a short period, 1.5 minutes. Further crystallization developed with time
up to 1000 minutes. and at the same time the melting point moved to higher values.
On heating, the less stable lamellae melt and the stable ones which persist at the
higher temperature act as seeds on subsequent crystallization.
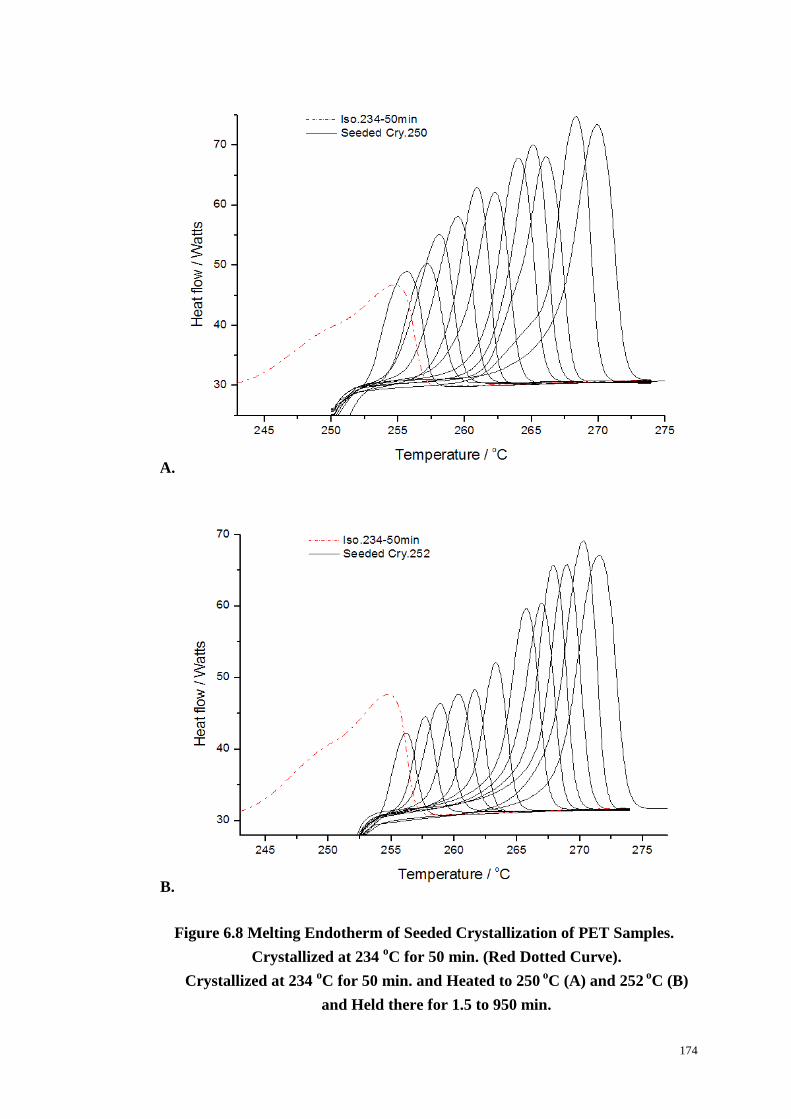
174
A.
B.
Figure 6.8 Melting Endotherm of Seeded Crystallization of PET Samples.
Crystallized at 234 oC for 50 min. (Red Dotted Curve).
Crystallized at 234 oC for 50 min. and Heated to 250
oC (A) and 252
oC (B)
and Held there for 1.5 to 950 min.
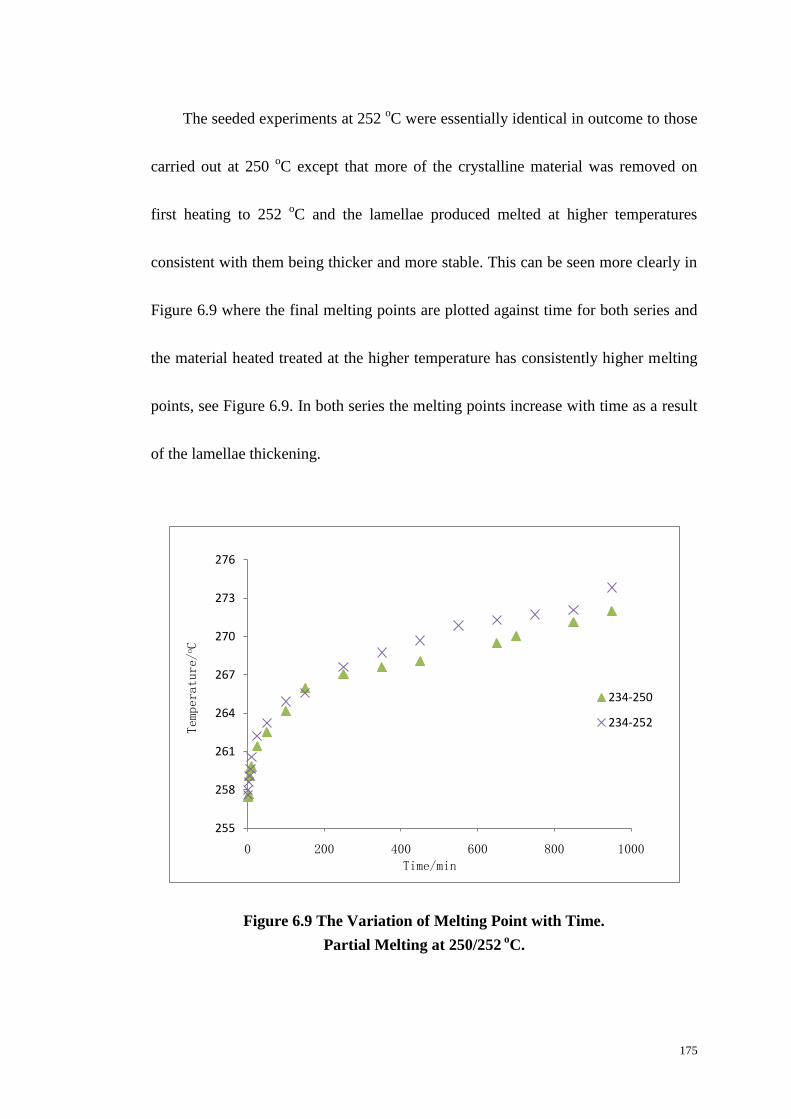
175
The seeded experiments at 252 oC were essentially identical in outcome to those
carried out at 250 oC except that more of the crystalline material was removed on
first heating to 252 oC and the lamellae produced melted at higher temperatures
consistent with them being thicker and more stable. This can be seen more clearly in
Figure 6.9 where the final melting points are plotted against time for both series and
the material heated treated at the higher temperature has consistently higher melting
points, see Figure 6.9. In both series the melting points increase with time as a result
of the lamellae thickening.
Figure 6.9 The Variation of Melting Point with Time.
Partial Melting at 250/252 o
C.
255
258
261
264
267
270
273
276
0 200 400 600 800 1000
Temperature/
oC
Time/min
234-250
234-252

176
The enthalpy of fusion of the various PET samples were measured by
integrating the melting endotherms against time, as described above and the value
used as a measure of relative crystallinity. The increase in enthalpy of fusion, and
hence in crystallinity, with log (time) can be seen in Figure 6.10 for both series of
seeded crystallizations; this increase was linear after an initial period of 10-30 min.,
consistent with the seeded crystallization developing by a secondary process.
Figure 6.10 The Increase in Enthalpy of Fusion with log (time) on
Heating to 250/252 o
C.
0.00
10.00
20.00
30.00
40.00
0
10
20
30
40
50
60
70
0 0.5 1 1.5 2 2.5 3
Relative Crystallinity Xt /
%
Enthaply of f
usion / J
/g
Log(time/min)
234-250
234-252
Linear 250
Linear 252
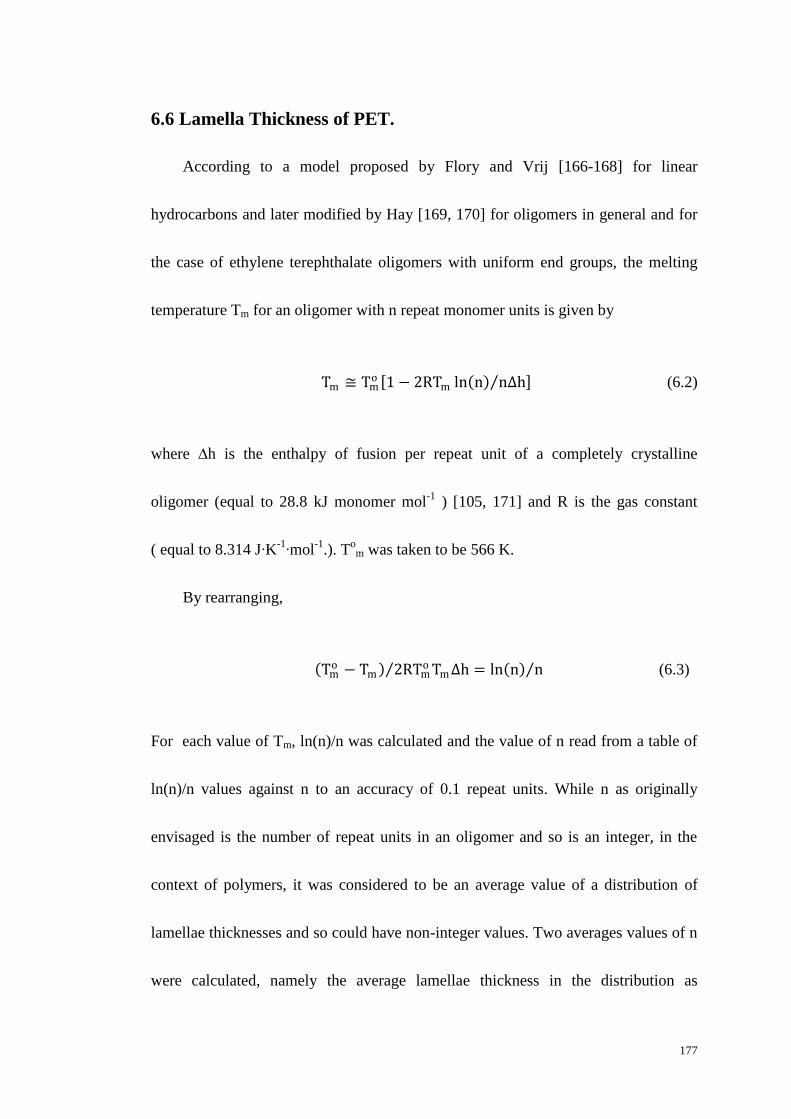
177
6.6 Lamella Thickness of PET.
According to a model proposed by Flory and Vrij [166-168] for linear
hydrocarbons and later modified by Hay [169, 170] for oligomers in general and for
the case of ethylene terephthalate oligomers with uniform end groups, the melting
temperature Tm for an oligomer with n repeat monomer units is given by
Tm ≅ Tmo 1 − 2RTm ln n n∆h (6.2)
where ∆h is the enthalpy of fusion per repeat unit of a completely crystalline
oligomer (equal to 28.8 kJ monomer mol-1
) [105, 171] and R is the gas constant
( equal to 8.314 J∙K-1
∙mol-1
.). Tom was taken to be 566 K.
By rearranging,
Tmo − Tm 2RTm
o Tm∆h = ln n n (6.3)
For each value of Tm, ln(n)/n was calculated and the value of n read from a table of
ln(n)/n values against n to an accuracy of 0.1 repeat units. While n as originally
envisaged is the number of repeat units in an oligomer and so is an integer, in the
context of polymers, it was considered to be an average value of a distribution of
lamellae thicknesses and so could have non-integer values. Two averages values of n
were calculated, namely the average lamellae thickness in the distribution as
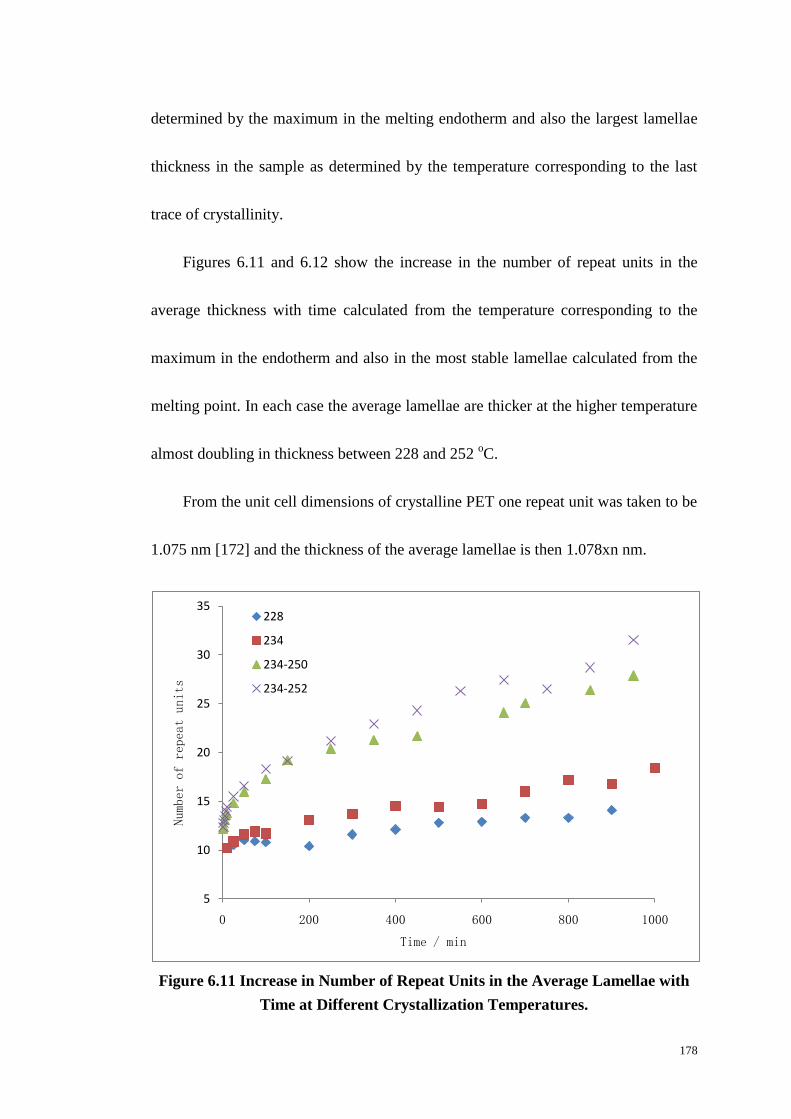
178
determined by the maximum in the melting endotherm and also the largest lamellae
thickness in the sample as determined by the temperature corresponding to the last
trace of crystallinity.
Figures 6.11 and 6.12 show the increase in the number of repeat units in the
average thickness with time calculated from the temperature corresponding to the
maximum in the endotherm and also in the most stable lamellae calculated from the
melting point. In each case the average lamellae are thicker at the higher temperature
almost doubling in thickness between 228 and 252 oC.
From the unit cell dimensions of crystalline PET one repeat unit was taken to be
1.075 nm [172] and the thickness of the average lamellae is then 1.078xn nm.
Figure 6.11 Increase in Number of Repeat Units in the Average Lamellae with
Time at Different Crystallization Temperatures.
5
10
15
20
25
30
35
0 200 400 600 800 1000
Number of repeat units
Time / min
228
234
234-250
234-252
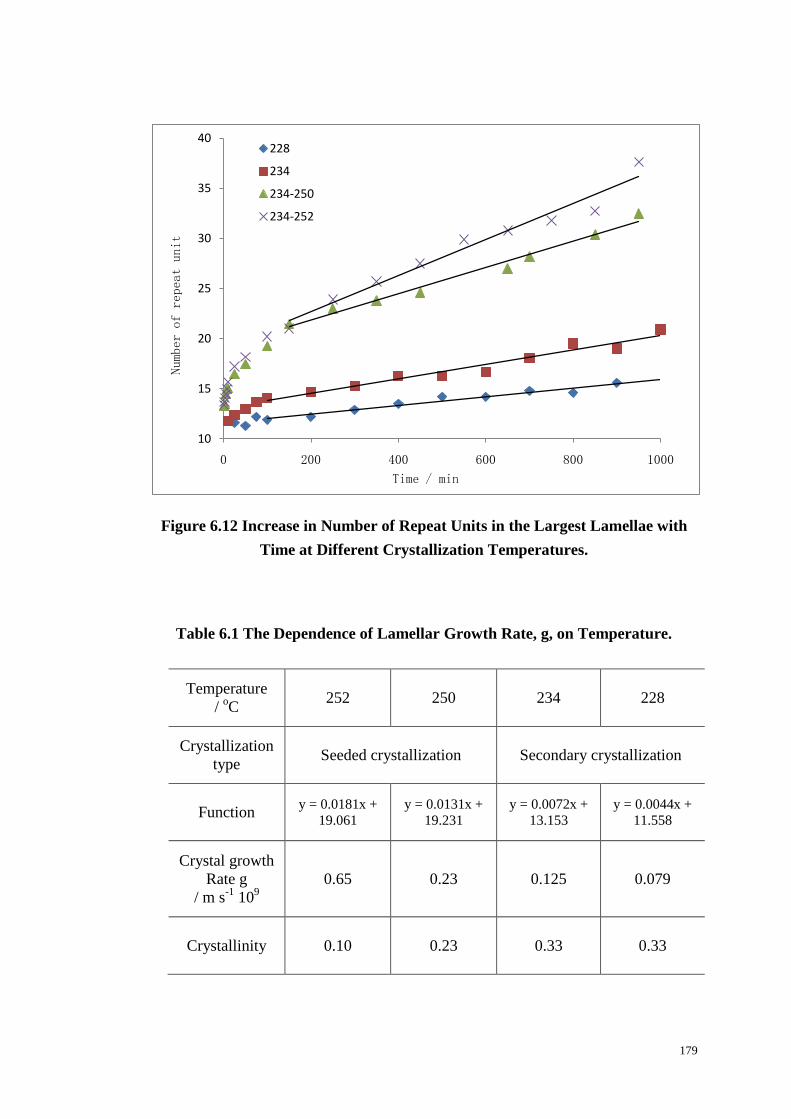
179
Figure 6.12 Increase in Number of Repeat Units in the Largest Lamellae with
Time at Different Crystallization Temperatures.
Table 6.1 The Dependence of Lamellar Growth Rate, g, on Temperature.
Temperature
/ oC
252 250 234 228
Crystallization
type Seeded crystallization Secondary crystallization
Function y = 0.0181x +
19.061
y = 0.0131x +
19.231
y = 0.0072x +
13.153
y = 0.0044x +
11.558
Crystal growth
Rate g
/ m s-1
109
0.65 0.23 0.125 0.079
Crystallinity 0.10 0.23 0.33 0.33
10
15
20
25
30
35
40
0 200 400 600 800 1000
Number of repeat unit
Time / min
228
234
234-250
234-252
180
The lamellar thickening growth rates, g, were determined from the slopes of
linear portions of the curves shown in Figure 6.12. The values obtained are listed in
Table 6.1 and show an increase with increasing temperature and in the case of the
seeded crystallization with decreasing seed content. This behaviour was unexpected
but appears to imply that increasing crystalline content in the melt constrained the
melt and slowed the growth rate proportionately.
6.7 Seeded Crystallization as studied by FTIR Spectroscopy.
FTIR spectroscopy has an advantage over DSC in being able to measure the
changes in the crystallinity of PET from the absorbance of the crystalline or
amorphous carbonyl bands at 1717 and 1727 cm-1
respectively. Accordingly the
seeded crystallizations discussed above from the point of view of the melting
behaviour as measured by DSC were also examined by FTIR spectroscopy.
Two series of seeded crystallization experiment were carried out following the
procedure adopted above; firstly a sample was crystallized isothermally up to the end
of the primary crystallization at 234 oC; this was followed by partial melting and re-
crystallization at 244 and 250 oC measuring the change in crystallinity by FTIR
spectroscopy. The carbonyl band, in the region 1710-30 cm-1
was resolved into its
two components, amorphous and crystalline, and the absorbance followed with time,
181
see Figure 6.13 and 6.14. The initial change in absorbance at 1727 and 1717 cm-1
during the isothermal crystallization at 234 oC, has the inverse and S shape
dependence respectively characteristic of the changes in amorphous and crystalline
content of the primary process as observed previously and discussed in Chapter 5.
On heating to 244 oC there is a small amount of melting as observed by a drop in
crystalline absorbance followed by a linear increase with log (time). The small
decrease in crystallinity on heating is consistent with the melting endotherms for the
sample crystallized at 234 oC in Figures 6.5 and 6.8 which shows that little or no
melting occurs at 244 oC. On further heating the crystallinity continued to increase
linearly with log (time), consistent with a secondary crystallization process
developing on the seeds produced at the lower temperature. These FTIR
spectroscopic results are consistent with those observed by DSC in that the
crystallinity increases linearly with log (time) at 244 oC and has the characteristics of
a secondary isothermal process at 244 oC produced after the primary process took
place at 234 oC.
In order to have a better comparison with the DSC seeded experiments the
procedure was repeated but the crystallization temperature was raised from 244 to
250 oC. This enabled more material to melt before crystallization developed further
on the residual seeds. The change in the absorption of the crystalline and amorphous
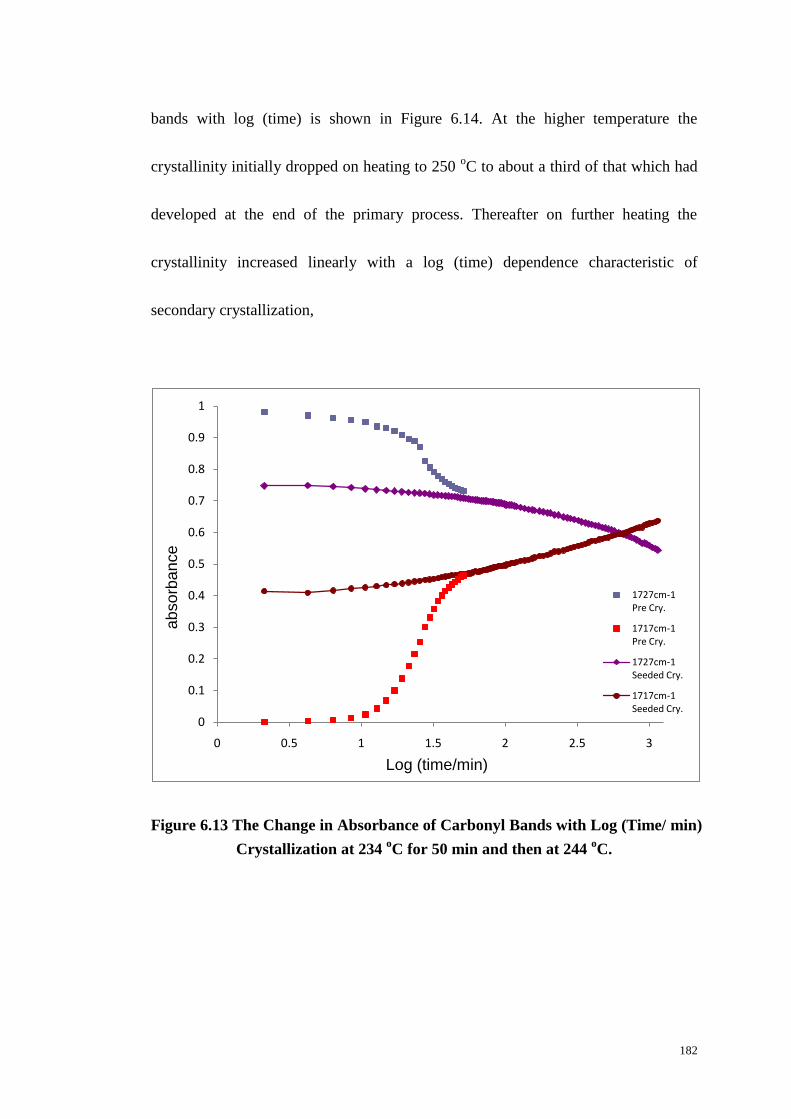
182
bands with log (time) is shown in Figure 6.14. At the higher temperature the
crystallinity initially dropped on heating to 250 oC to about a third of that which had
developed at the end of the primary process. Thereafter on further heating the
crystallinity increased linearly with a log (time) dependence characteristic of
secondary crystallization,
Figure 6.13 The Change in Absorbance of Carbonyl Bands with Log (Time/ min)
Crystallization at 234 oC for 50 min and then at 244
oC.
0
0.1
0.2
0.3
0.4
0.5
0.6
0.7
0.8
0.9
1
0 0.5 1 1.5 2 2.5 3
ab
so
rba
nce
Log (time/min)
1727cm-1 Pre Cry.
1717cm-1 Pre Cry.
1727cm-1 Seeded Cry.
1717cm-1 Seeded Cry.

183
Figure 6.14 The Change in Absorbance of Carbonyl Bands with Log (Time/ min)
Crystallized at 234oC for 50 min and then at 250
oC.
6.8 Discussion.
The development of crystallization on seeding with time as measured by the
increase in carbonyl absorption band at 1717 cm-1
, see Figures 6.13 and 6.14, and
was analyzed by a modified Avrami equation, i.e.
Xt = Xp,f + Xs,f(1- exp -Z(t-t p,f)n) (6.4)
where Xt is the crystallinity developed at time t, Xp,f the residual crystallinity left
after partial melting and Xs,f the final crystallinity achieved by the seeded
0
0.1
0.2
0.3
0.4
0.5
0.6
0.7
0.8
0.9
1
0 0.5 1 1.5 2 2.5 3
ab
so
rba
nce
Log (time/min)
1727cm-1 Pre Cry.
1717cm-1 Pre Cry.
1727cm-1 Seeded Cry.
1717cm-1 Seeded Cry.
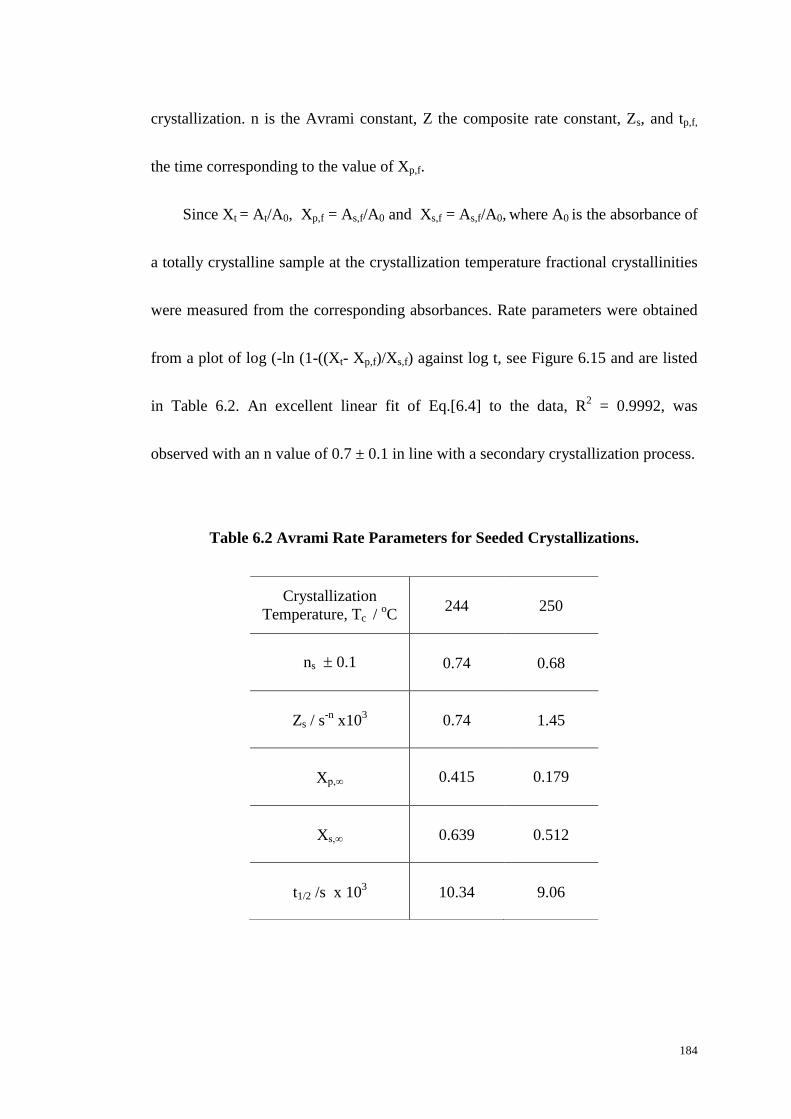
184
crystallization. n is the Avrami constant, Z the composite rate constant, Zs, and tp,f,
the time corresponding to the value of Xp,f.
Since Xt = At/A0, Xp,f = As,f/A0 and Xs,f = As,f/A0, where A0 is the absorbance of
a totally crystalline sample at the crystallization temperature fractional crystallinities
were measured from the corresponding absorbances. Rate parameters were obtained
from a plot of log (-ln (1-((Xt- Xp,f)/Xs,f) against log t, see Figure 6.15 and are listed
in Table 6.2. An excellent linear fit of Eq.[6.4] to the data, R2 = 0.9992, was
observed with an n value of 0.7 ± 0.1 in line with a secondary crystallization process.
Table 6.2 Avrami Rate Parameters for Seeded Crystallizations.
Crystallization
Temperature, Tc / oC
244 250
ns 0.1 0.74 0.68
Zs / s-n
x103 0.74 1.45
Xp,∞ 0.415 0.179
Xs,∞ 0.639 0.512
t1/2 /s x 103 10.34 9.06
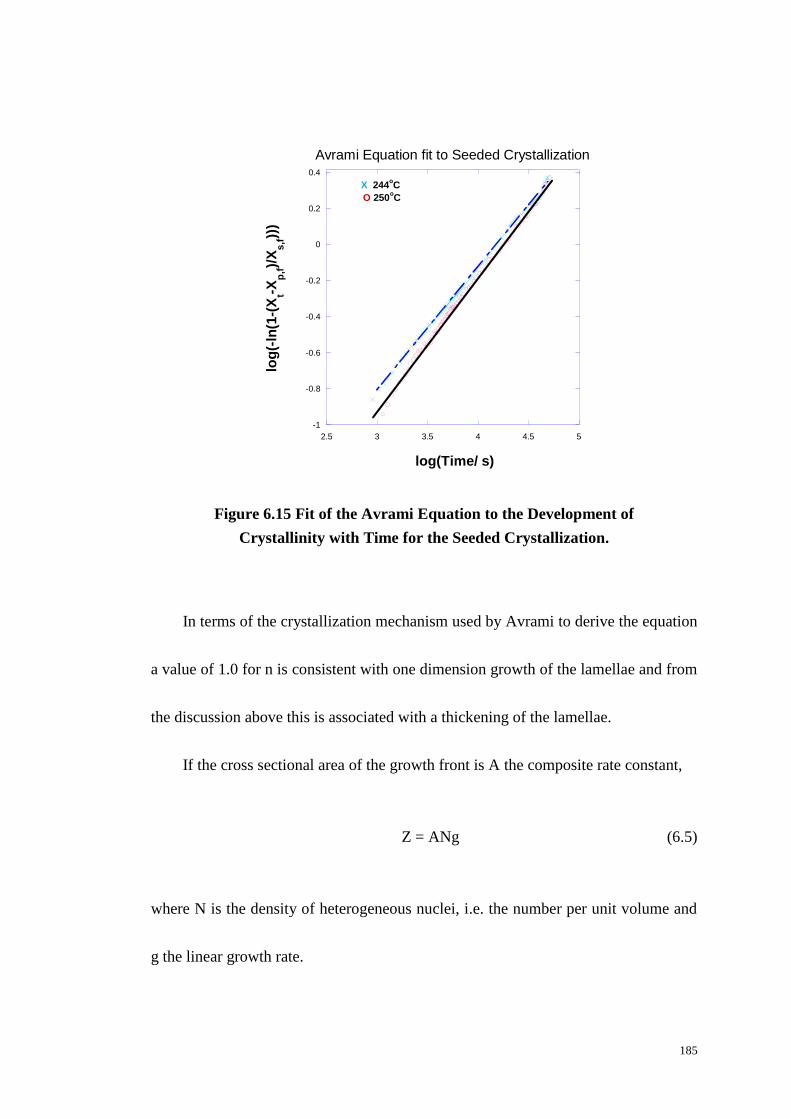
185
-1
-0.8
-0.6
-0.4
-0.2
0
0.2
0.4
2.5 3 3.5 4 4.5 5
Avrami Equation fit to Seeded Crystallization
log
(-ln
(1-(
Xt-X
p,f)/
Xs
,f))
)
log(Time/ s)
X 244oC
O 250oC
Figure 6.15 Fit of the Avrami Equation to the Development of
Crystallinity with Time for the Seeded Crystallization.
In terms of the crystallization mechanism used by Avrami to derive the equation
a value of 1.0 for n is consistent with one dimension growth of the lamellae and from
the discussion above this is associated with a thickening of the lamellae.
If the cross sectional area of the growth front is A the composite rate constant,
Z = ANg (6.5)
where N is the density of heterogeneous nuclei, i.e. the number per unit volume and
g the linear growth rate.
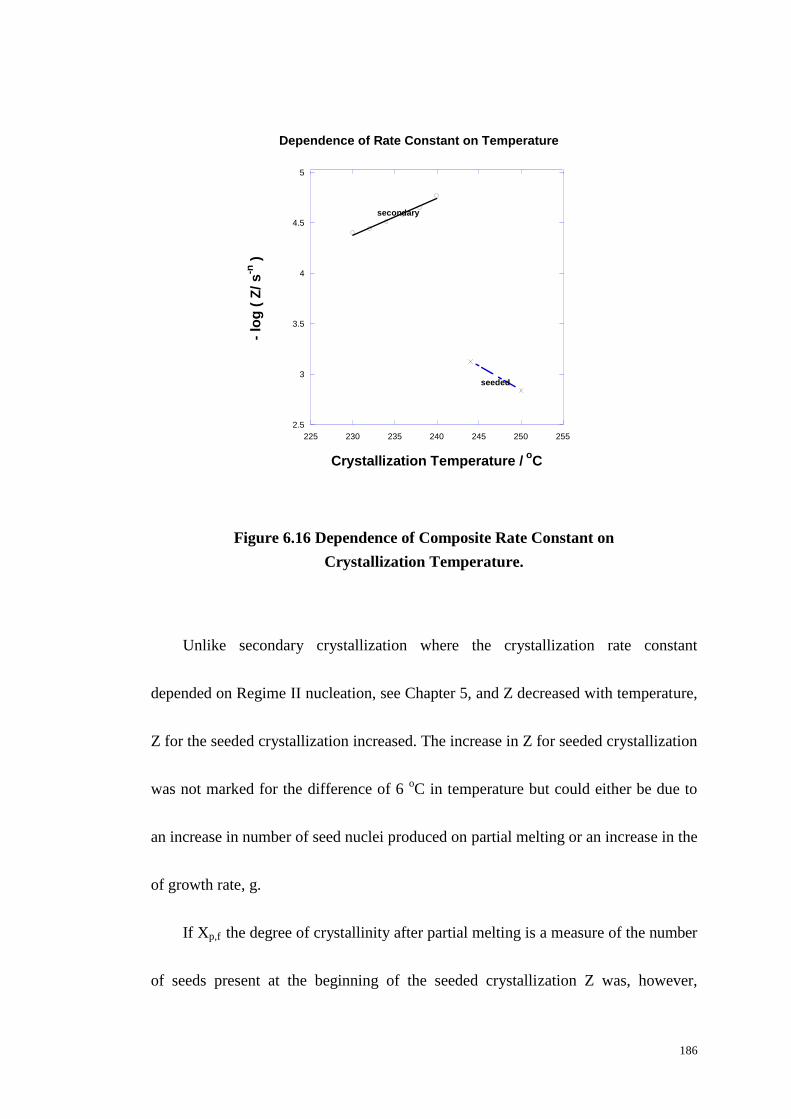
186
2.5
3
3.5
4
4.5
5
225 230 235 240 245 250 255
- lo
g (
Z/
s-n
)
Crystallization Temperature / oC
Dependence of Rate Constant on Temperature
secondary
seeded
Figure 6.16 Dependence of Composite Rate Constant on
Crystallization Temperature.
Unlike secondary crystallization where the crystallization rate constant
depended on Regime II nucleation, see Chapter 5, and Z decreased with temperature,
Z for the seeded crystallization increased. The increase in Z for seeded crystallization
was not marked for the difference of 6 oC in temperature but could either be due to
an increase in number of seed nuclei produced on partial melting or an increase in the
of growth rate, g.
If Xp,f the degree of crystallinity after partial melting is a measure of the number
of seeds present at the beginning of the seeded crystallization Z was, however,
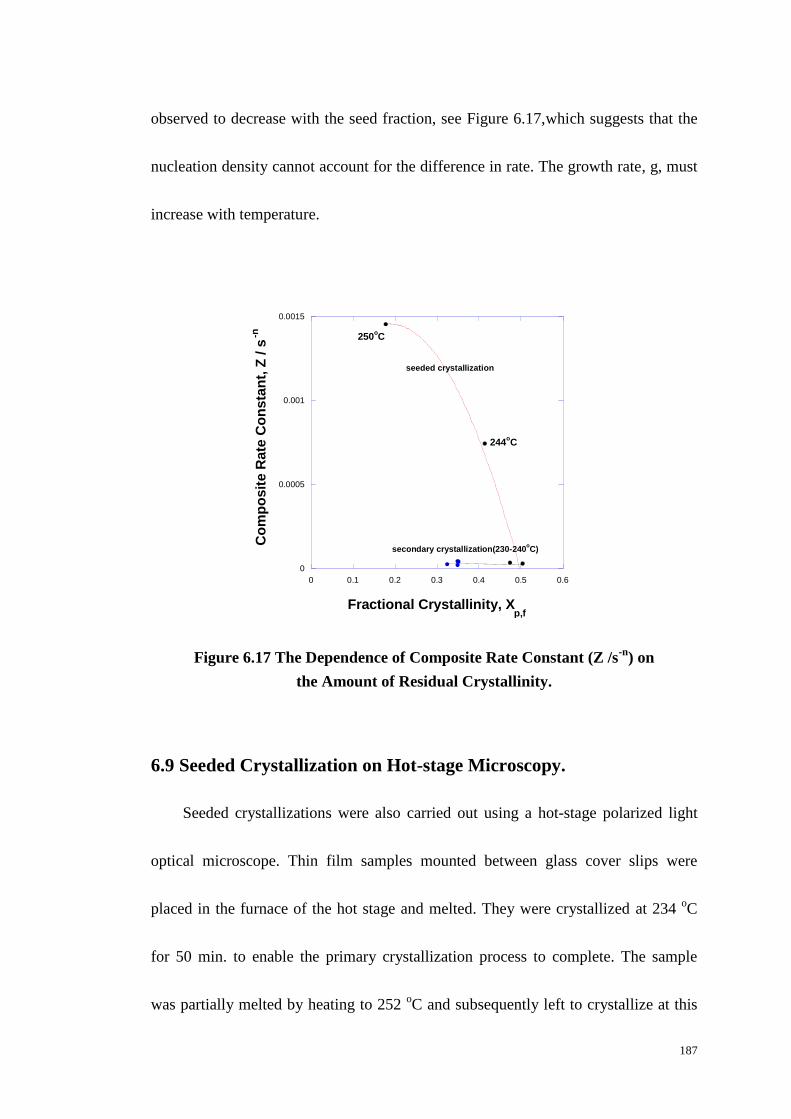
187
observed to decrease with the seed fraction, see Figure 6.17,which suggests that the
nucleation density cannot account for the difference in rate. The growth rate, g, must
increase with temperature.
0
0.0005
0.001
0.0015
0 0.1 0.2 0.3 0.4 0.5 0.6
Fractional Crystallinity, Xp,f
Co
mp
osit
e R
ate
Co
nsta
nt,
Z / s
-n
seeded crystallization
secondary crystallization(230-240oC)
250oC
244oC
Figure 6.17 The Dependence of Composite Rate Constant (Z /s-n
) on
the Amount of Residual Crystallinity.
6.9 Seeded Crystallization on Hot-stage Microscopy.
Seeded crystallizations were also carried out using a hot-stage polarized light
optical microscope. Thin film samples mounted between glass cover slips were
placed in the furnace of the hot stage and melted. They were crystallized at 234 oC
for 50 min. to enable the primary crystallization process to complete. The sample
was partially melted by heating to 252 oC and subsequently left to crystallize at this
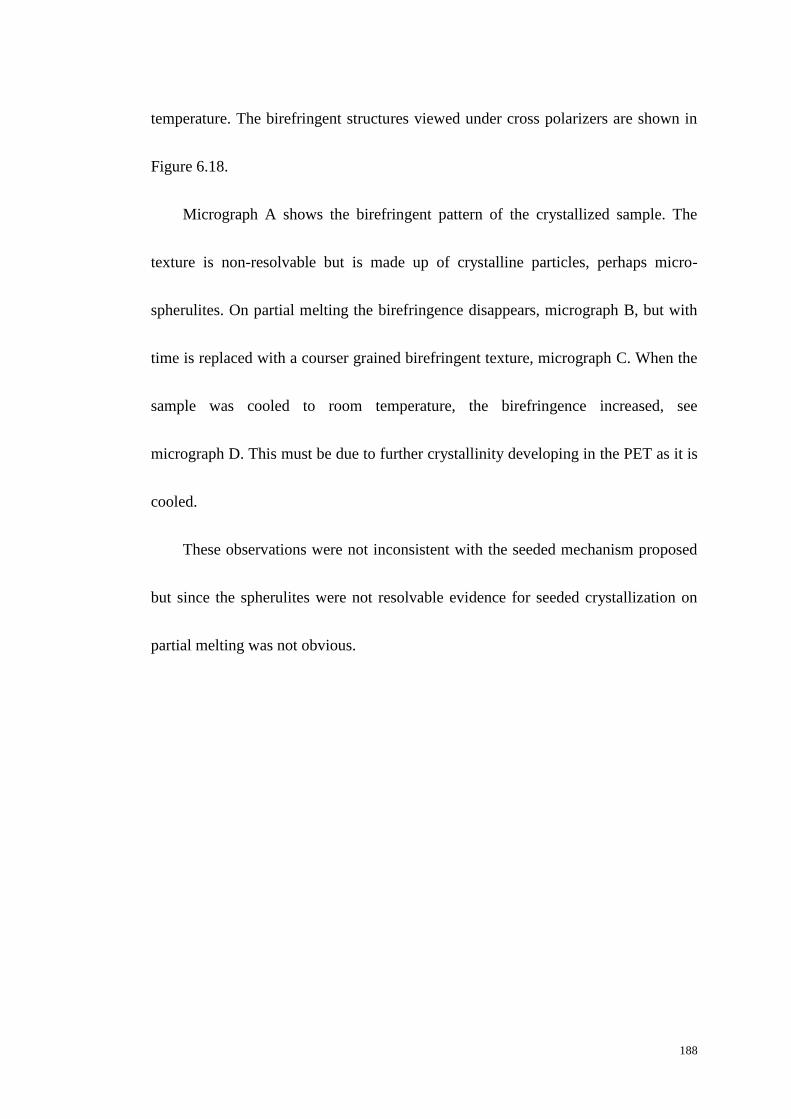
188
temperature. The birefringent structures viewed under cross polarizers are shown in
Figure 6.18.
Micrograph A shows the birefringent pattern of the crystallized sample. The
texture is non-resolvable but is made up of crystalline particles, perhaps micro-
spherulites. On partial melting the birefringence disappears, micrograph B, but with
time is replaced with a courser grained birefringent texture, micrograph C. When the
sample was cooled to room temperature, the birefringence increased, see
micrograph D. This must be due to further crystallinity developing in the PET as it is
cooled.
These observations were not inconsistent with the seeded mechanism proposed
but since the spherulites were not resolvable evidence for seeded crystallization on
partial melting was not obvious.

189
Figure 6.18A. Crystallization at 234oC for 50 min
Figure 6.18B. Partial Melting at 252 o
C
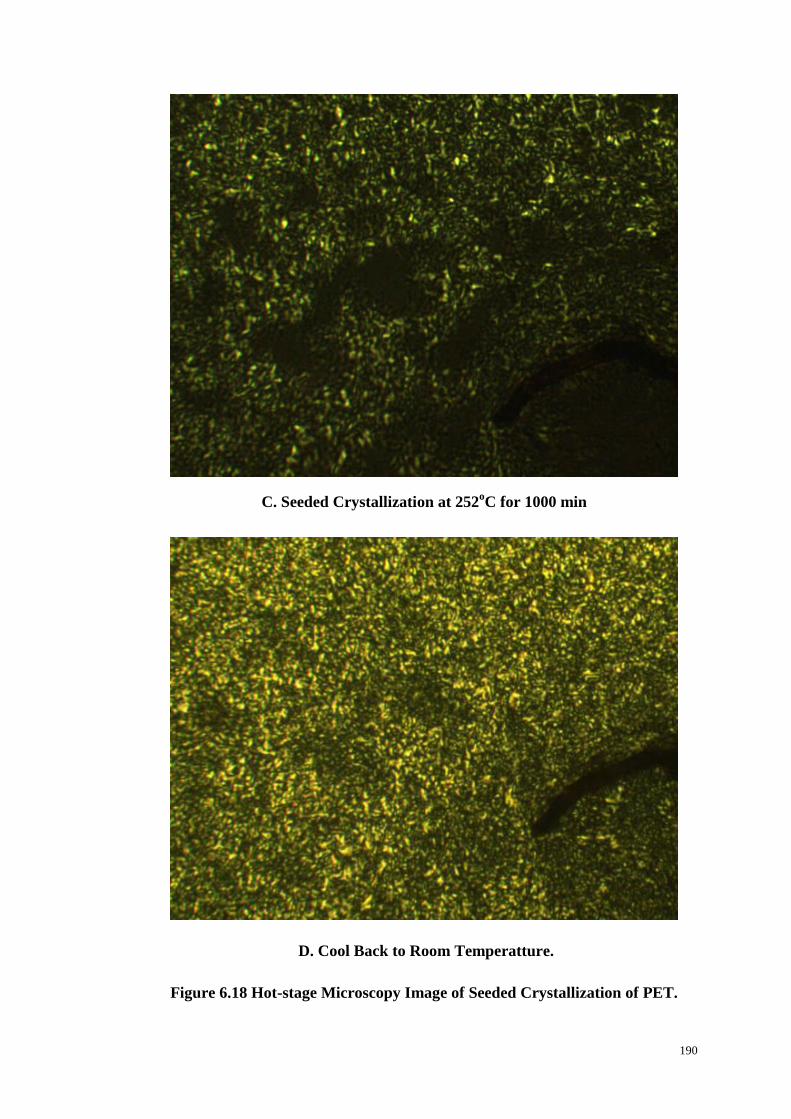
190
C. Seeded Crystallization at 252oC for 1000 min
D. Cool Back to Room Temperatture.
Figure 6.18 Hot-stage Microscopy Image of Seeded Crystallization of PET.
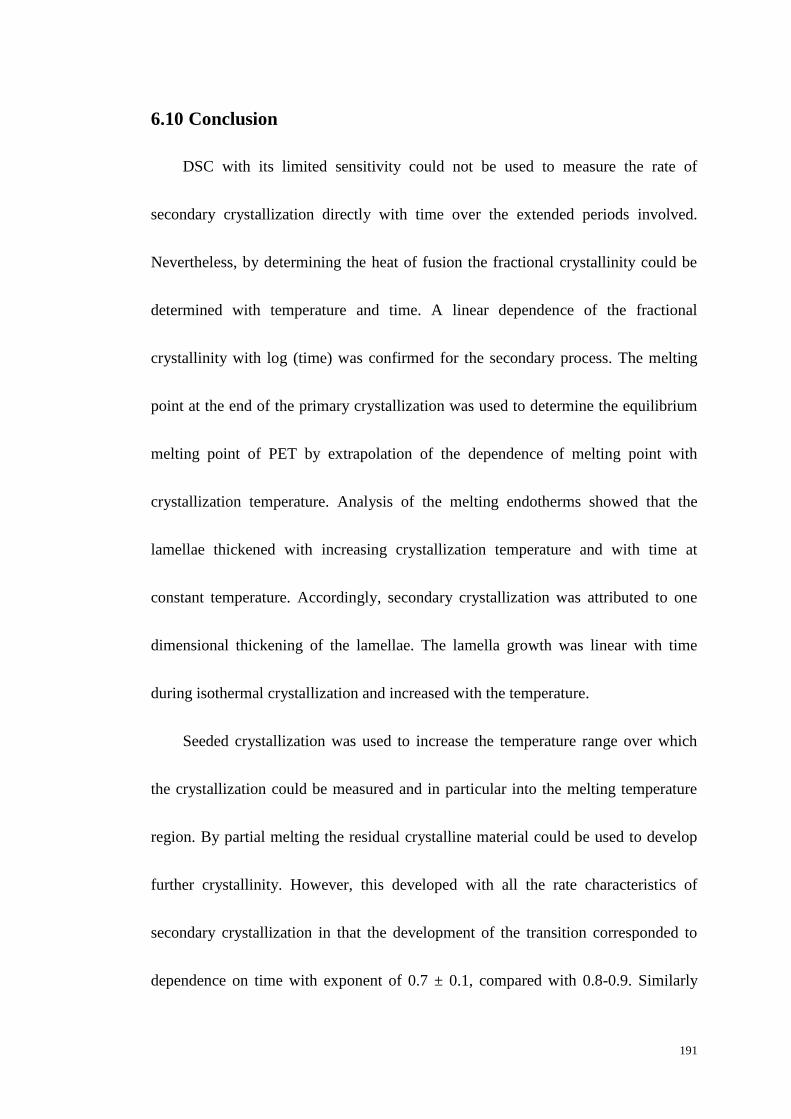
191
6.10 Conclusion
DSC with its limited sensitivity could not be used to measure the rate of
secondary crystallization directly with time over the extended periods involved.
Nevertheless, by determining the heat of fusion the fractional crystallinity could be
determined with temperature and time. A linear dependence of the fractional
crystallinity with log (time) was confirmed for the secondary process. The melting
point at the end of the primary crystallization was used to determine the equilibrium
melting point of PET by extrapolation of the dependence of melting point with
crystallization temperature. Analysis of the melting endotherms showed that the
lamellae thickened with increasing crystallization temperature and with time at
constant temperature. Accordingly, secondary crystallization was attributed to one
dimensional thickening of the lamellae. The lamella growth was linear with time
during isothermal crystallization and increased with the temperature.
Seeded crystallization was used to increase the temperature range over which
the crystallization could be measured and in particular into the melting temperature
region. By partial melting the residual crystalline material could be used to develop
further crystallinity. However, this developed with all the rate characteristics of
secondary crystallization in that the development of the transition corresponded to
dependence on time with exponent of 0.7 ± 0.1, compared with 0.8-0.9. Similarly
192
during seeded crystallization the lamellae thickness increased with temperature and
time.
The composite rate constant for seeded crystallization was, however,
complicated as it was controlled by the cross sectional area of growth face, the
nucleation density and the linear growth rate. Partial melting conditions, melting
temperature and time, controlled the initial seed crystallinity and this in turn
determined the nucleation area and density. At higher partial melting and
temperature, the total area and seed density was small but the composite rate constant
and linear growth rate was large. This cannot be explained in terms of nucleation
theory which predicts a decrease in rate with increasing crystallization temperature
but implies a greater mobility in the melt constrained by the adjacent seed crystals.
Such that the lower the seed density the greater the melt mobility and the crystalline
growth rate. This assumption has not been considered further in this study.
193
Chapter Seven
Conclusion and Future Work
7.1 Conclusion.
The study of the thermal properties using TA-FTIR in conjunction with DSC
has been most informative and useful in dealing with many interesting crystallization
problems in PET. Many of these have been successfully solved, not least of which is
the characterization of the IR bands in the spectrum of PET, measuring the fractional
crystallinity during crystallization and the kinetics of primary, secondary and seeded
crystallization. The novel technique of 2D correlation spectroscopy has been
investigated, along with the change in absorbance and peak position as a function of
temperature on heating and cooling; both together have been invaluable in explaining
the complex IR spectrum of PET in terms of chain conformation and cis/trans
isomerization. There is little doubt, however, that such analyses would not have been
available but for recent developments in software and data handling associated with
FTIR spectroscopy.
194
TA-FTIR has been used to characterize phase transitions by a change in the
absorbance or peak position with temperature in heating and cooling cycles. It has
the advantage of assigning the phase transition temperature to an individual chain
segment rather than other TA techniques, which averages over all them all.
Two different types of behaviours were observed; type I in which the
absorbance changed stepwise at the transition temperature and type II in which there
was no change in absorbance but a shift in peak position. The temperature
dependence of the absorbance was associated with the change in concentration of
rotational modes in the molecular chain and the establishment of a dynamic
equilibrium between the conformational cis/trans isomers. The onset of chain
mobility and the establishment of this equilibrium enabled the glass transition of the
polymer to be determined from the change in slope of the absorbance with
temperature. As the trans isomers alone is incorporated in the crystalline regions and
the cis and trans isomers exist together in the amorphous phase, changes in
absorbance follow the fractional crystallinity. The fractional crystallinity of the
polymer can accordingly be determined at any temperature from the ratio of the
trans/cis bands.
Type II behaviour is associated with no stepwise change in absorbance on
crystallizing or melting but is associate with a change in peak position between the
195
cis and the trans conformational isomers. It occurs when the absorption bands from
the two isomers substantially overlap and have very similar extinction coefficients.
Accordingly there is little or no change in absorbance on crystallizing or melting but
a change in peak position. In this way it was established that the band at 1410 cm-1
was not invariant with temperature or crystallinity and should not be used as an
internal standard as it has been in the past. It would be interesting to see if TA-FTIR
would be as successful in interpreting the phase transitions in other crystallizable
polyesters as it has been in PET.
Many bands in the IR spectrum of PET split into pairs on crystallizing or
melting either due to the different environment the molecular groups experience in
the crystal from that in amorphous regions or they are associated with the cis or trans
conformation of chain segments. In particular the carbonyl stretching band has an
amorphous band at 1727 cm-1
in the melt and a crystalline band at 1717 cm-1
. These
two bands have sufficient wavenumber separation for the Omnic software to
deconvolute the two components and determine the fractional crystallinity from the
absorption ratio. 2-D auto-correlation spectroscopy was successfully applied to these
two bands since it showed that the 1727 cm-1
band disappeared with time and was
progressively replaced by a sharper band at the lower wavenumber. The synchronous
and asymmetric correlation spectra had the characteristic “angel” pattern and two
196
cross peaks associated with the transformation from one IR band to another at
different wavenumbers and intensities. The bands could be assigned unambiguously
to amorphous and crystalline regions and used to determine the fractional
crystallinity with time. There is some evidence that bands at 1727 and 1717 cm-1
arose from environmental differences between crystalline solid and amorphous liquid
rather than the transition from cis to trans isomers of the carbonyl groups. However,
the bands were suitable for a kinetic study of the crystallization of PET.
All the absorption bands in the spectra of amorphous and partially crystalline
PET were similarly analyzed by 2D-IR correlation spectroscopy and assigned to
crystalline or amorphous molecular grouping in the polymer chains and to cis and
trans conformers of various chain segments. Accordingly the complex spectra of
PET with almost 50 absorption bands have been assigned. Many of the absorption
bands behaved as pairs and increased or decreased in intensity on crystallizing or
melting. These behaved in a similar fashion to the carbonyl band and exhibited
“angel” and “butterfly” patterns in their synchronous and asynchronous correlation
spectra respectively. The technique was useful in characterizing those bands which
have multiple components that shift and change intensity during conformation
change as this helped to assign them to rotational isomers and crystalline and
197
amorphous bands. Few of the bands, if any, did not change in this manner
particularly the one previously assigned as an internal standard.
The isothermal crystallization kinetics of PET was measured in the temperature
range from 230 to 240 oC by FTIR spectroscopy from the intensities of the
crystalline and amorphous bands of the carbonyl ester group. The two overlapping
absorption bands were readily deconvoluted by the Omnic software into separated
components and the fractional crystallinity determined as a function of time. Since
the procedure measured the fractional crystallinity directly and not the rate of
crystallinity the analysis was not limited by the sensitivity of the measurements and
the temperature range for crystallization kinetics study could have been expanded to
higher temperature, slower crystallization rates and longer periods thus the secondary
crystallization process could be measured to a reasonable degree of accuracy, unlike
in the DSC studies where its limited sensitivity restricted the rates of crystallization
which could be measured.
It was possible to analyze the kinetics of both primary and secondary
crystallization by assuming that they obeyed Avrami equations, with different n
values and that the two occurred one after the other; a value could be assigned to Xp,
at which the primary process terminated and the secondary started.
198
The Avrami exponents n were determined as 2.0 for primary and 1.0 for
secondary process. This was attributed to the crystallization of predetermined
spherical particles, i.e. spherulites limited by the PET film thickness to 1.5 to 3 µm
and so constrained to grow in two dimensions for most of their crystallization. SEM
measured the diameter of PET spherulites as 10-20 µm. and the diameter of the
spherulites attained the thickness of the film in the early stages of the primary
crystallization.
DSC kinetic measurement were made on much thicker specimens, 1-2 mm, and
the measured n values of 2.6-3.4 were consistent with three dimension growth of
spherulites. This is a case where the crystallization kinetics is defined by sample
dimension; thin film is dominated by 2-dimensional growth and thicker specimens by
three. But nevertheless the crystallization behaves exactly as prediction by the
Avrami’s models for 2- and 3- dimensional growth of predetermined spherical
particles.
A value of 1.0 was obtained for the n value of secondary crystallization and this
was interpreted as one dimensional thickening of the lamellae within the internal
structure of the spherulites.
The growth rate of the primary process was nucleation controlled increasing
with super-cooling and initiated by secondary nuclei in Regime I while that of the
199
secondary was nucleated in Regime II. The FTIR spectroscopic analysis of the
kinetics was consistent with the proposed crystallization mechanism.
While the kinetics of crystallization could only be directly measured over the
primary process by DSC due to limiting sensitivity, the increase in crystallinity could
be extended into the secondary process by measurement of the enthalpy of fusion,
and from this the fractional crystallinity. These measurements were very time
consuming and limited by the number of individual measurements which could
sensibly be made. Nevertheless the development of crystallinity after the initial
primary process followed a linear dependence with log (time) as observed previously
for the secondary process.
Melting was also observed to drift to higher temperatures and to narrow with
increasing crystallization temperature at constant crystallinity and with increasing
crystallization time at constant temperature. This was interpreted firstly as due to an
increase in lamellae thickness due to nucleation control of the critical size nuclei and
from which the equilibrium melting point of PET was determined and secondly to an
increase in lamellae thickness as a result of secondary crystallization such that
increasing time periods increased the crystallinity and melting range. Accordingly
secondary crystallization was attributed to linear growth of the ab surface of the PET
200
unit cell along the c direction into the melt between adjacent lamellae within the
spherulites.
The melting endotherms were interpreted assuming that the melting point were
determined by the thickness of the lamellae and the relative amount present in the
crystalline sample was proportional to the height of the endotherm above the baseline
at that temperature and accordingly the increase in average thickness and the thickest
lamellae were determined as a function of temperature. A linear increase in thickness
with time was observed which was taken to be a measure of the growth rate of the
lamellae in the chain direction, g. This was observed to increase with increasing
temperature. Although the increase was not large it did not agree with nucleation
control of growth and suggested that the linear growth of the lamellae was inhibited
by increasing crystallinity and increasing constraint imposed by the crystalline
lamellae on adjacent regions of the melt.
Self-seeding was used to extend the temperature range over which
crystallization rates could be measured and Banks and Sharples’ procedure of
partially melting the sample and using the residual un-melted material as seeds was
adopted. However, these seeds were allowed to re-crystallize at the partial melting
temperature rather than cooled to previous crystallization temperature. After an
initially settling down period the seeded crystallization followed the same time
201
dependence of secondary crystallization but the rate constant was much greater and
increased with increasing temperature which implied that the kinetics of seeded
crystallization much more complicated than expected. It would appear to be
controlled by the growth surface area, the number of seeds and the linear growth rate.
The effects of these on the kinetics of seeded crystallizations require to be separately
studied.
A higher partial melting crystallization temperature leads to lower residual
crystallinity and results in a smaller number of seeds and growth area. The first will
increase the crystallization rate by increasing the chain mobility and reducing
constraints on the melt while the second effect will reduce the crystallization rate. A
lower partial melting temperature has the opposite effect since it leads to a higher
initial crystallinity, greater surface area and a larger number of seeds. This first
reduces the rate of crystallization by increasingly constraining the melt and the
second increases the rate proportional to the number of seeds. Experiments have to
be designed to eliminate some of these variables before their effect on seeding can be
evaluated.
Seeded crystallization provides for the possibility of crystallizing polymers at
higher temperatures, even located in the normal melting temperature region, to
202
produce greater lamellae thicknesses and higher melting temperature and to consider
the effect of this morphology on their mechanical and physical properties.
7.2 Future Work.
Application of Two-dimensional Infrared Spectroscopy
Polarized IR and dichroic IR experiments are recommended to be carried out on
PET at high yield rate to determine the effect of draw ratio on the IR spectrum.
Orientation should increase the amount of trans isomers present in the sample and at
high temperatures above Tg encourage the development of crystallinity. This should
be followed up by 2D-FTIR analysis to separate the effects of crystallization and
orientation of PET on its spectrum and over a wide range of temperature, to establish
regimes when they occur together and separately
Once the degree of orientation and fractional crystallinity can be separately
kinetic rate studies can be made to determine under what conditions crystallization
accompanies orientation and the effect of orientation on the crystallization kinetics.
203
Seeded Crystallization
Self-seeding appears to be a useful technique to extend the temperature range
over which crystallization kinetics can be studied. However, it is more complicated
than expected as it is controlled by three additional factors which do not occur in
conventional rate studies, namely crystal growth area, number of seeds and the linear
growth rate. Their effect on the crystallization rate should be separately studied by
controlling the fraction of material melted and the isothermal temperature. By setting
the amount of partial melting constant, the temperature dependence of the rate
constant can be measured and the effect of super-cooling checked for nucleation
control. By varying the amount of partial melting and keeping the crystallization
temperature constant the retardation of the growth by increasing crystallinity can be
better established.
Since the increased time period for secondary and seeded isothermal
crystallization can generate crystalline material with thicker lamellae PET with this
morphology may have improved mechanical and physical properties. Tensile
specimens with this structure should be prepared for mechanical properties test and
compared with conventional samples.
204
SEM Micro structure of Seeded Crystallization
High resolution SEM is recommended to study the different micro-structures of
PET produced by seeded crystallization, isothermal crystallization and on slow
cooling to room temperature. It would be interesting to see what differences in
morphology are present and determine the size of the crystalline particles present.
This would establish the difference in nucleation density between seeded and
conventionally crystallized material.
Chemical Technology in Industry
Self-seeding may have advantages over added seeding agents in the temperature
range in which they are active, the morphologies produced and should not lead to
deleterious effects in thermal and oxidative stability.
Application of the technique in industry may help achieve production of
material with higher crystallinity, thicker lamellae and improved mechanical and
physical properties. It may also provide a way to reduce the use of nucleating agents,
improve the purity of the polymer and be more environmental friendly.
205
Reference
1. Gumther, B. and H.G. Zachmann, Influence of Molar Mass and Catalysts on
the Kinetics of Crystallization and on the Orientation of Poly(Ethylene-
Terephthalate). Polymer, 1983. 24(8): p. 1008-1014.
2. Köpnick H., M. Schmidt, W. Brügging, J. Rüter and W. Kaminsky,
Polyesters. Ullmann's Encyclopedia of Industrial Chemistry, 2005. A21: p.
233–238.
3. Hovenkam.Sg, Kinetic Aspects of Catalyzed Reactions in Formation of
Poly(Ethylene Terephthalate). Journal of Polymer Science Part a-1-Polymer
Chemistry, 1971. 9(12): p. 3617-&.
4. Keller, A., G.R. Lester, and L.B. Morgan, Crystallization Phenomena in
Polymers. I. Preliminary Investigation of the Crystallization Characteristics
of Polyethylene Terephthalate Philosophical Transactions of the Royal
Society A, 1954. A247: p. 1-12.
5. http://www.goodfellow.com. 1st Otc. 2012
6. Martin, L., Handbook of Bottle Production and Preforms: Chapter 2-PET
Preforms, ed. O. Brandau. 2012, Norwich, USA: William Andrew Publishing.
7. PET-Recycling Forum;"Current Technological Trends in Polyester
Recycling"; 9th International Polyester Recycling Forum Washington. 2006,
Sao Paulo.
8. Wunderlich, B., Macromolecular Physics; Volume 2, Crystal Nucleation,
Growth. 1976, London: Anealing Academic Press.
9. Wunderlich, B., Macromolecular Physics; Volume 2. 1976, New York:
Academic Press.
10. Muthukumar, M., Nucleation in Polymer Crystallization. Advances in
Chemical Physics, Vol 128, 2004. 128: p. 1-63.
11. Young R.J and Lovell P.A, Introduction to Polymers. 2nd ed. 1991, London:
Chapman & Hall.
12. Hoffman, J.D. and J.J. Weeks, Melting Process and Equilibrium Melting
Temperature of Polychlorotrifluoroethylene. Journal of Research of the
National Bureau of Standards Section a-Physics and Chemistry, 1962.
66(Jan-F): p. 13-&.
13. Turnbull, D. and J.C. Fisher, Rate of Nucleation in Condensed Systems.
Journal of Chemical Physics, 1949. 17(1): p. 71-73.
206
14. Gibbs J.W., The Scientific Papers of J. Williard Gibbs 1962, New York:
Dover.
15. Lauritze.J.I and J.D. Hoffman, Extension of Theory of Growth of Chain-
Folded Polymer Crystals to Large Undercoolings. Journal of Applied Physics,
1973. 44(10): p. 4340-4352.
16. Jenkins, M.J., Crystallisation in miscible blends of PEEK and PEI. Polymer,
2001. 42(5): p. 1981-1986.
17. Cebe, P. and S.D. Hong, Crystallization Behavior of Poly(Etheretherketone).
Polymer, 1986. 27(8): p. 1183-1192.
18. Al Lafi, A.G., J.N. Hay, and D.J. Parker, The effect of proton irradiation on
the melting and isothermal crystallization of poly (ether-ether-ketone).
Journal of Polymer Science Part B-Polymer Physics, 2008. 46(11): p. 1094-
1103.
19. Guttman, C.M., J.D. Hoffman, and E.A. Dimarzio, Monte-Carlo Calculation
of Sans for Various Models of Semi-Crystalline Polyethylene. Faraday
Discussions, 1979. 68: p. 297-309.
20. Hoffman, J.D., C.M. Guttman, and E.A. Dimarzio, On the Problem of
Crystallization of Polymers from the Melt with Chain Folding. Faraday
Discussions, 1979. 68: p. 177-197.
21. Hoffman, J.D., Regime-Iii Crystallization in Melt-Crystallized Polymers - the
Variable Cluster Model of Chain Folding. Polymer, 1983. 24(1): p. 3-26.
22. Hoffman, J.D., Role of Reptation in the Rate of Crystallization of
Polyethylene Fractions from the Melt. Polymer, 1982. 23(5): p. 656-670.
23. Lauritzen, J.I. and J.D. Hoffman, Theory of Formation of Polymer Crystals
with Folded Chains in Dilute Solution. Journal of Research of the National
Bureau of Standards Section a-Physics and Chemistry, 1960. 64(1): p. 73-102.
24. Hoffman, J.D., et al., Growth-Rate of Spherulites and Axialites from Melt in
Polyethylene Fractions - Regime-1 and Regime-2 Crystallization. Journal of
Research of the National Bureau of Standards Section a-Physics and
Chemistry, 1975. 79(6): p. 671-699.
25. Avrami, M., Kinetics of Phase Change II Transformation-Time Relations for
Random Distribution of Nuclei Journal of Chemical Physics, 1940. 8(212-
224).
26. Avrami, M., Kinetics of Phase Change and Microstructure Kinetics of Phase
Change III Journal of Chemical Physics. Journal of Chemical Physics
1940:8:212-224 1941. 9: p. 177-184.
207
27. Velisaris, C.N. and J.C. Seferis, Crystallization Kinetics of
Polyetheretherketone (Peek) Matrices. Polymer Engineering and Science,
1986. 26(22): p. 1574-1581.
28. Banks, W., M. Gordon, R. J. Roe and A. Sharples, The Crystallization of
Polyethylene .1. Polymer, 1963. 4(1): p. 61-74.
29. Hay, J.N. and M. Sabir, Crystallization Kinetics of High Polymers .
Polyethylene Oxide .2. Polymer, 1969. 10(3): p. 203-&.
30. Hay, J.N. and P.J. Mills, The Use of Differential Scanning Calorimetry to
Study Polymer Crystallization Kinetics. Polymer, 1982. 23(9): p. 1380-1384.
31. Hillier, I.H., Modified Avrami Equation for Bulk Crystallization Kinetics of
Spherulitic Polymers. Journal of Polymer Science Part a-General Papers,
1965. 3(9pa): p. 3067-&.
32. Price, F.P., A Phenomenological Theory of Spherulitic Crystallization -
Primary and Secondary Crystallization Processes. Journal of Polymer
Science Part a-General Papers, 1965. 3(9pa): p. 3079-&.
33. Banks, W., A. Sharples, and J.N. Hay, The effect of simultaneously occurring
processes on the course of polymer crystallization. Journal of Polymer
Science Part a-1-Polymer Chemistry, 1964. 2(9): p. 4059–4067.
34. Verhoyen, O., F. Dupret, and R. Legras, Isothermal and non-isothermal
crystallization kinetics of polyethylene terephthalate: Mathematical modeling
and experimental measurement. Polymer Engineering and Science, 1998.
38(9): p. 1594-1610.
35. Hay, J.N., Application of modified Avrami equations to polymer
crystallization kinetics. British Polymer Journal, 1973. 3: p. 74-82.
36. Evans, U.R., The Laws of Expanding Circles and Spheres in Relation to the
Lateral Growth of Surface Films and the Grain-Size of Metals. Transactions
of the Faraday Society, 1945. 41(7): p. 365-374.
37. Qin, J.L., S.Q. Guo, and Z.T. Li, Melting behavior and isothermal
crystallization kinetics of PP/mLLDPE blends. Journal of Polymer Research,
2008. 15(5): p. 413-420.
38. Charles, E. and J. Carraher, Seymour/Carraher's polymer chemistry. 2003:
CRC Press.
39. McCrum, N.B., C.P.Buckley, and C.B.Bucknall, Principles of Polymer
Engineering. 1988: Oxford University Press.
40. Mandelkern, L., Characterization of Materials in Research: Ceramics and
Polymers. 1975, New York: Syracuse University Press, Syracuse.
208
41. Raimo, M., "Kinematic" analysis of growth and coalescence of spherulites
for predictions on spherulitic morphology and on the crystallization
mechanism. Progress in Polymer Science, 2007. 32(6): p. 597-622.
42. Granasy, L., T. Pusztai, G. Tegze, J. A. Warren and J. F. Douglas, Growth
and form of spherulites. Physical Review E, 2005. 72(1).
43. Hartshorne, N.H. and A. Stuart, Crystals and the Polarising Microscope. 4th
ed. 1970, London: Edward Arnold Ltd.
44. Sawyer, L.C., D.T. Grubb, and G.F. Meyers, Polymer microscopy. 2008:
Springer.
45. Bassett, D.C., Principle of Polymer morghology. 1981, New York:
Cambridge university press.
46. R.W.Cahn, P. Haasen, and E.J. Kramer., Materials science and technology
series : a comprehensive treatment. Processing of polymers, ed. H. E.H. Vol.
18. 1997, Weinheim, Chichester: Wiley-VCH.
47. Hay, J.N., "Crystallization from the Melt" in "Flow-Indusced Crystallization
in Polymer Systems". 1979, London: Gordon and Breach Sci. Publishers Ltd.
48. Hoffman J.D, Davis GT, and L. JI., Treatise on solid state chemistry.
Crystalline and non-crystalline solids, ed. H. NB. Vol. 3. 1976, New York:
Plenum.
49. Lim, J.S., I. Noda, and S.S. Im, Effects of metal ion-carbonyl interaction on
miscibility and crystallization kinetic of poly(3-hydroxybutyrate-co-3-
hydroxyhexanoate)/lightly ionized PBS. European Polymer Journal, 2008.
44(5): p. 1428-1440.
50. Hartley, F.D., F.W. Lord, and L.B. Morgan, Crystallization Phenomena in
Polymers. III. Effect of Melt Conditions and the Temperature of
Crystallization on the Course of the Crystallization in Polyethylene
Terephthalate. Philosophical Transactions of the Royal Society A, 1954.
A247: p. 23-34.
51. Van Antwerpen, F. and D.W.V. Krevelen, Influence of crystallization
temperature, molecular weight, and additives on the crystallization kinetics of
poly(ethylene terephthalate). Journal of Polymer Science: Polymer Physics
Edition, 1972. 10(12): p. 2423-2435.
52. Jabarin, S.A., Crystallization kinetics of polyethylene terephthalate. II.
Dynamic crystallization of PET. Journal of Applied Polymer Science, 1987.
34(1): p. 97-102.
53. Mitsuishi, Y. and M. Ikeda, Studies on crystallization of poly(ethylene
terephthalate) by differential thermal analysis. Special consideration of the
209
two exothermic peaks in the thermogram of crystallization. Journal of
Polymer Science Part A-2: Polymer Physics, 1966. 4(2): p. 283-288.
54. Bell, J.P. and T. Murayama, Relations between dynamic mechanical
properties and melting behavior of nylon 66 and poly(ethylene terephthalate).
Journal of Polymer Science Part A-2: Polymer Physics, 1969. 7(6): p. 1059-
1073.
55. McGraw, G.E., Study of molecular orientation in poly(ethylene terephthalate)
fibers by fluorescence polarization. Journal of Polymer Science Part A-2:
Polymer Physics, 1970. 8(8): p. 1323-1336.
56. Miller, G.W., Thermal analyses of polymers. XIII. Crystalline character of
the 70°c transition of poly(ethylene terephthalate). Journal of Polymer
Science: Polymer Physics Edition, 1975. 13(9): p. 1831-1844.
57. Nealy, D.L., T. G. Davis, and C.J. Kibler, Thermal history and melting
behavior of poly(ethylene terephthalate). Journal of Polymer Science Part A-
2: Polymer Physics, 1970. 8(12): p. 2141-2151.
58. Ozawa, T., Kinetics of non-isothermal crystallization. Polymer, 1971. 12(3):
p. 150-158.
59. Misra, A. and R.S. Stein, Light scattering studies of the early stages of the
crystallization of poly(ethylene terephthalate). Journal of Polymer Science
Part B: Polymer Letters, 1972. 10(6): p. 473-477.
60. Stein, R.S. and A. Misra, Kinetics of growth of developing spherulites.
Journal of Polymer Science: Polymer Physics Edition, 1973. 11(1): p. 109-
116.
61. Reinsch, V.E. and Ludwig Rebenfeld, Crystallization processes in
poly(ethylene terephthalate) as modified by polymer additives and fiber
reinforcement. Journal of Applied Polymer Science, 1994. 52(5): p. 649-662.
62. Jackson, J.B. and G.W. Longman, The crystallization of poly(ethylene
terephthalate) and related copolymers. Polymer, 1969. 10: p. 873-884.
63. Lu, X. and J.N. Hay, The effect of physical aging on the rates of cold
crystallization of poly(ethylene terephthalate). Polymer, 2000. 41(20): p.
7427-7436.
64. Abdesselam, M., J.P. Stoquert, S. Chami, M. Djebara and A.C. Chami, M.
Siad, Method to measure composition modifications in polyethylene
terephthalate during ion beam irradiation. Nuclear Instruments and Methods
in Physics Research Section B: Beam Interactions with Materials and Atoms,
2009. 267(1): p. 108-112.
65. Yoshii, T., Hirohisa Yoshida, and Tadashi Kawai, Effect of structural
relaxation of glassy PET on crystallization process observed by the
210
simultaneous DSC–XRD and DSC–FTIR. Thermochimica Acta, 2005. 431(1-
2): p. 177-181.
66. Zhu, P. and D. Ma, Study on the double cold crystallization peaks of
poly(ethylene terephthalate) (PET): 2. Samples isothermally crystallized at
high temperature. European Polymer Journal, 1999. 35(4): p. 739-742
67. Zhang, Z., M. Ren, J. Zhao, S. Wu and H. Sun, Kinetics of non-isothermal
cold crystallization of uniaxially oriented poly(ethylene terephthalate).
Polymer, 2003. 44(8): p. 2547-2551.
68. Li, G., S.L. Yang, J.M. Jiang and C. X. Wu, Crystallization characteristics of
weakly branched poly(ethylene terephthalate). Polymer, 2005. 46(24): p.
11142-11148.
69. Avramov, I. and N. Avramova, Kinetics of relaxation and crystallization of
poly(ethylene terephthalate). Journal of Non-Crystalline Solids, 1999. 260(1-
2): p. 15-20.
70. Dangseeyun, N., P. Srimoaon, P. Supaphol and M. Nithitanakul, Isothermal
melt-crystallization and melting behavior for three linear aromatic polyesters.
Thermochimica Acta, 2004. 409(1): p. 63-77
71. Brandrup, J., E.H.Immergut, Polymer Handbook. Third ed. 1989: John Wiley
& Sons.
72. Mark, J.E., Polymer Data Handbook. Second ed. 2009: Oxford University
Press.
73. Speight, J.G. and N.A. Lange, Lange's handbook of chemistry 16 ed, ed.
McGraw-Hill. 2005.
74. Dominghaus, H., Plastics for Engineers: Materials, Properties, Applications.
3rd ed. 1993, Munich Vienna New York Barcelona: Hanser Publishers.
75. Smith, B.C., Fundamentals of Fourier Transform Infrared spectroscopy.
1996, Boca Raton: CRC press.
76. Fawcett , H., A., Polymer Spectroscopy. 1996: John Wiley & Sons.
77. Stuart, B., Infrared Spectroscopy: Fundamentals and Applications. 2004:
John Wiley & Sons.
78. Mackenzie, M.W., Advances in applied Fourier transform infrafred
spectroscopy 1988 Chichester: Wiley
79. Ingle, J.D.J. and S.R. Crouch, Spectrochemical Analysis. 1988, New Jersey:
Prentice Hall.
80. Bernhard, S., Infrared and Raman spectroscopy: methods and applications.
1994, Cambridge: Weinheim, VCH.
81. Scheuing, D., Fourier transform infrared spectroscopy in colloid and
interface science. 1990, Washington, DC: American Chemical Society.
211
82. Planck, M., The Theory of Heat Radiation. 2nd ed, ed. M. Masius. 1914: P.
Blakiston's Son & Co.
83. http://www.thermo.com.20th
Feb 2012
84. Jiang, E.Y., Advanced FT-IR Spectroscopy, Principles, Experiments and
Applications Based on Research-Grade Nicolet ™ FT-IR Spectrometers.
2008: Part of Thermo Fisher Scientific.
85. Oneill, M.J., Analysis of Temperature-Controlled Scanning Calorimeter.
Analytical Chemistry, 1964. 36(7): p. 1238-&.
86. Wunderlich, B., Thermal Analysis. 1990, New York: Academic Press.
87. http://www.perkinelmer.co.uk.20th
Feb 2012
88. http://www.sintef.no/.5th
May 2012
89. http://www.linkam.co.uk/.8th
May 2012
90. Stieger, N., M. Aucamp, S.W. Zhang and M.M. de Villiers, Hot-stage Optical
Microscopy as an Analytical Tool to Understand Solid-state Changes in
Pharmaceutical Materials. American Pharmaceutical Review, 2012.
91. Vitez, I.M., A.W. Newman, M. Davidovich and C. Kiesnowski, The
evolution of hot-stage microscopy to aid solid-state characterizations of
pharmaceutical solids. Thermochimica Acta, 1998. 324(1-2): p. 187-196.
92. Schonherr, H., R.M. Waymouth, and C.W. Frank, Nucleation and
crystallization of low-crystallinity polypropylene followed in situ by hot stage
atomic force microscopy. Abstracts of Papers of the American Chemical
Society, 2003. 226: p. U521-U521.
93. Krumme, A., Measuring crystallization kinetics of high density polyethylene
by improved hot-stage polarized light microscopy. Polymer Testing, 2004.
23(1): p. 29-34.
94. Wang, X., W.M. Hou, J.J. Zhou, L. Li, Y. Li and C.M. Chan, Melting
behavior of lamellae of isotactic polypropylene studied using hot-stage
atomic force microscopy. Colloid and Polymer Science, 2007. 285(4): p. 449-
455.
95. Atkinson, J.R., F. Biddlestone, and J.N. Hay, An investigation of glass
formation and physical ageing in poly(ethylene terephthalate) by FT-IR
spectroscopy. Polymer, 2000. 41(18): p. 6965-6968.
96. Levchik, S.V., L. Costa, and G. Camino, Effect of Ammonium Polyphosphate
on Combustion and Thermal-Degradation of Aliphatic Polyamides.
Makromolekulare Chemie-Macromolecular Symposia, 1993. 74: p. 95-99.
97. Holland, B.J. and J.N. Hay, Thermal degradation of nylon polymers. Polymer
International, 2000. 49(9): p. 943-948.
212
98. Holland, B.J. and J.N. Hay, The kinetics and mechanisms of the thermal
degradation of poly(methyl methacrylate) studied by thermal analysis-
Fourier transform infrared spectroscopy. Polymer, 2001. 42(11): p. 4825-
4835.
99. Holland, B.J. and J.N. Hay, The thermal degradation of PET and analogous
polyesters measured by thermal analysis-fourier transform infrared
spectroscopy. Polymer, 2002. 43(6): p. 1835-1847.
100. Holland, B.J. and J.N. Hay, The thermal degradation of poly(vinyl alcohol).
Polymer, 2001. 42(16): p. 6775-6783.
101. Arefazar, A. and J.N. Hay, Physical Aging in Glassy-Polymers - an Ir
Spectroscopic Investigation of Poly(Ethylene-Terephthalate). Polymer, 1982.
23(8): p. 1129-1132.
102. Chen, Z.Y., J.N. Hay, and M.J. Jenkins, FTIR spectroscopic analysis of
poly(ethylene terephthalate) on crystallization. European Polymer Journal,
2012. 48(9): p. 1586-1610.
103. Kong, Y. and J.N. Hay, Multiple melting behaviour of poly(ethylene
terephthalate). Polymer, 2003. 44(3): p. 623-633.
104. Lu, X.F. and J.N. Hay, Crystallization orientation and relaxation in
uniaxially drawn poly(ethylene terephthalate). Polymer, 2001. 42(19): p.
8055-8067.
105. Lu, X.F. and J.N. Hay, Isothermal crystallization kinetics and melting
behaviour of poly(ethylene terephthalate). Polymer, 2001. 42(23): p. 9423-
9431.
106. Kong, Y. and J.N. Hay, The measurement of the crystallinity of polymers by
DSC. Polymer, 2002. 43(14): p. 3873-3878.
107. Geur, U., S. Lau, B.B. Wunderlich and B. Wunderlich, Heat Capacity and
Other Thermodynamic Properties of Linear Macromolecules. VIII. Polyesters
and Polyamides. Journal of Physical and Chemical Reference Data, 1983.
12(1): p. 65-89.
108. Liang, C.Y. and S. Krimm, Infrared Spectra of High Polymers .9.
Polyethylene Terephthalate. Journal of Molecular Spectroscopy, 1959. 3(5): p.
554-574.
109. Cobbs, W.H. and R.L. Burton, Crystallization of Polyethylene Terephthalate.
Journal of Polymer Science, 1953. 10(3): p. 275-290.
110. Miller, R.G.J. and H.A. Willis, An Independent Measurement of the
Amorphous Content of Polymers. Journal of Polymer Science, 1956. 19(93):
p. 485-494.
213
111. Miyake, A., The Infrared Spectrum of Polyethylene Terephthalate .1. The
Effect of Crystallization. Journal of Polymer Science, 1959. 38(134): p. 479-
495.
112. Schmidt, P.G., Polyethylene Terephthalate Structural Studies. Journal of
Polymer Science Part a-General Papers, 1963. 1(4): p. 1271-&.
113. Grime, D. and I.M. Ward, The Assignment of Infra-Red Absorptions and
Rotational Isomerism in Polyethylene Terephthalate and Related Compounds.
Transactions of the Faraday Society, 1958. 54(7): p. 959-971.
114. Ward, I.M. and M.A. Wilding, Ir and Raman-Spectra of Poly(M-Methylene
Terephthalate) Polymers. Polymer, 1977. 18(4): p. 327-335.
115. Noda, I., Two-Dimensional Infrared-Spectroscopy. Journal of the American
Chemical Society, 1989. 111(21): p. 8116-8118.
116. Noda I and Ozaki Y, Two-dimensional correlation spectroscopy -
applications in vibrational and optical spectroscopy. 2004, Chichester: John
Wiley and Sons.
117. Noda, I., Kernel analysis for two-dimensional (2D) correlation spectroscopy.
Journal of Molecular Structure, 2006. 799(1-3): p. 34-40.
118. Noda, I., Cyclical asynchronicity in two-dimensional (2D) correlation
spectroscopy. Journal of Molecular Structure, 2006. 799(1-3): p. 41-47.
119. Marcott, C., A.E. Dowrey, and I. Noda, Dynamic 2-Dimensional Ir
Spectroscopy. Analytical Chemistry, 1994. 66(21): p. A1065-A1075.
120. Wu, Y.Q., I. Noda, F. Meersman and Y. Ozaki, Orthogonal signal corrected
two-dimensional (OSC 2D) correlation infrared spectroscopy. Journal of
Molecular Structure, 2006. 799(1-3): p. 121-127.
121. Shinzawa, H., S. Morita, I. Noda and Y. Ozaki, Effect of the window size in
moving-window two-dimensional correlation analysis. Journal of Molecular
Structure, 2006. 799(1-3): p. 28-33.
122. Noda, I., Progress in two-dimensional (2D) correlation spectroscopy. Journal
of Molecular Structure, 2006. 799(1-3): p. 2-15.
123. Noda, I., Scaling techniques to enhance two-dimensional correlation spectra.
Journal of Molecular Structure, 2008. 883: p. 216-227.
124. Zhong, Z.M., G.F. Wang, and M.L. Geng, Probing strong adsorption of
individual solute molecules at solid/liquid interfaces with model-based
statistical two-dimensional correlation analysis. Journal of Molecular
Structure, 2006. 799(1-3): p. 204-210.
125. Esmonde-White, F.L.W. and D.H. Burns, Visualization of N-way data using
two-dimensional correlation analysis. Vibrational Spectroscopy, 2004. 36(2):
p. 287-292.
214
126. Gregoriou, V.G., S.E. Rodman, B.R. Nair and P.T. Hammond, Two-
dimensional correlation infared analysis (2D-IR) based on dynamic infrared
spectroscopy used as a probe of the viscoelastic behavior of side chain liquid
crystalline polyurethanes. Journal of Physical Chemistry B, 2002. 106(43): p.
11108-11113.
127. Palmer, R.A., P.Y. Chen, and M.H. Gilson, Step-scan two-dimensional
Fourier transform infrared (S-2 2D FT-IR) spectroscopy applied to the
dynamic mechanical analysis of block copolymers. Abstracts of Papers of the
American Chemical Society, 1996. 212: p. 26-Pmse.
128. Chen, P.C. and C.C. Joyner, Coherent 2D Resonance Raman Spectroscopy as
a tool for studying molecular structure. Journal of Molecular Structure, 2006.
799(1-3): p. 23-27.
129. Mello, C., A.E.M. Crotti, R. Vessecchi and W.R. Cunha, 2D Raman
spectroscopy as an alternative technique for distinguishing oleanoic acid and
ursolic acid. Journal of Molecular Structure, 2006. 799(1-3): p. 141-145.
130. Jung, Y.M. and I.S. Yang, Analysis of Raman modes of YNi2B2C by two-
dimensional correlation spectroscopy. Journal of Molecular Structure, 2006.
799(1-3): p. 173-176.
131. Noda, I., Y.L. Liu, and Y. Ozaki, Two-dimensional correlation spectroscopy
study of temperature-dependent spectral variations of N-methylacetamide in
the pure liquid state .1. Two-dimensional infrared analysis. Journal of
Physical Chemistry, 1996. 100(21): p. 8665-8673.
132. Noda, I., Y.L. Liu, and Y. Ozaki, Two-dimensional correlation spectroscopy
study of temperature-dependent spectral variations of N-methylacetamide in
the pure liquid state .2. Two-dimensional Raman and infrared-Raman
heterospectral analysis. Journal of Physical Chemistry, 1996. 100(21): p.
8674-8680.
133. Noda, I., Y.L. Liu , Y. Ozaki , M.A. Czarnecki, Two-Dimensional Fourier-
Transform near-Infrared Correlation Spectroscopy Studies of Temperature-
Dependent Spectral Variations of Oleyl Alcohol. Journal of Physical
Chemistry, 1995. 99(10): p. 3068-3073.
134. Padermshoke, A., H. Sato, Y. Katsumoto, S. Ekgasit, I. Noda and Y. Ozaki,
Crystallization behavior of poly(3-hydroxybutyrate-co-3-hydroxyhexanoate)
studied by 2D IR correlation spectroscopy. Polymer, 2004. 45(21): p. 7159-
7165.
135. Padermshoke, A., Y. Katsumoto, H. Sato, S. Ekgasit, I. Noda and Y. Ozaki,
Surface melting and crystallization behavior of polyhydroxyalkanoates
215
studied by attenuated total reflection infrared spectroscopy. Polymer, 2004.
45(19): p. 6547-6554.
136. Wu, Y.Q., F. Meersman, and Y. Ozaki, A novel application of hybrid two-
dimensional correlation infrared spectroscopy: Exploration of the
reversibility of the pressure- and temperature-induced phase separation of
poly(N-isopropylacrylamide) and poly(N-isopropylmethacrylamide) in
aqueous solution. Macromolecules, 2006. 39(3): p. 1182-1188.
137. Pastrana-Rios, B., Simulation of FT-IR spectra and 2D-COS analysis for the
thermal perturbation of apo-centrin. Journal of Molecular Structure, 2006.
799(1-3): p. 163-167.
138. Thomas, A.C. and H.H. Richardson, 2D-IR correlation analysis of thin film
water adsorbed on alpha-Al2O3(0001). Journal of Molecular Structure, 2006.
799(1-3): p. 158-162.
139. Wang, L.X., Y.Q. Wu, and F. Meersman, Two-dimensional correlation
infrared spectroscopic study on the conformational changes occurring in the
thermally induced pretransition of ribonuclease A. Journal of Molecular
Structure, 2006. 799(1-3): p. 85-90.
140. Wang, L.X., Y.Q. Wu, and F. Meersman, Clarification of the thermally-
induced pretransition of ribonuclease A in solution by principal component
analysis and two-dimensional correlation infrared spectroscopy. Vibrational
Spectroscopy, 2006. 42(2): p. 201-205.
141. Nakashima, K., H. Fukuma, Y. Ozaki and I. Noda, Two-dimensional
correlation fluorescence spectroscopy V: Polarization perturbation as a new
technique to induce intensity changes in fluorescence spectra. Journal of
Molecular Structure, 2006. 799(1-3): p. 52-55.
142. Ashton, L., C.M.B. Boguslawa, and E.W. Blanch, Application of two-
dimensional correlation analysis to Raman optical activity. Journal of
Molecular Structure, 2006. 799(1-3): p. 61-71.
143. Dluhy, R., S. Shanmukh, and S.I. Morita, The application of two-dimensional
correlation spectroscopy to surface and interfacial analysis. Surface and
Interface Analysis, 2006. 38(11): p. 1481-1496.
144. Ji, H., H, Hwang, S.B. Kim, I. Noda and Y.M. Jung, Characterization of
spin-coated films of biodegradable poly(3-hydroxybutyrate-co-3-
hydroxyhexanoate) copolymers by two-dimensional correlation spectroscopy.
Journal of Molecular Structure, 2008. 883: p. 167-172.
145. Zhang, J.M., H. Sato, H. Tsuji, I. Noda and Y. Ozaki, Differences in the CH3
center dot center dot center dot O=C interactions among poly(L-lactide),
poly(L-lactide)/poly(D-lactide) stereocomplex, and poly(3-hydroxybutyrate)
216
studied by infrared spectroscopy. Journal of Molecular Structure, 2005. 735:
p. 249-257.
146. Sasic, S., J.H. Jiang, and Y. Ozaki, Potentials of variable-variable and
sample-sample, generalized and statistical, two-dimensional correlation
spectroscopies in investigations of chemical reactions. Chemometrics and
Intelligent Laboratory Systems, 2003. 65(1): p. 1-15.
147. Sasic, S., A. Muszynski, and Y. Ozaki, A new possibility of the generalized
two-dimensional correlation spectroscopy. 1. Sample-sample correlation
spectroscopy. Journal of Physical Chemistry A, 2000. 104(27): p. 6380-6387.
148. Sasic, S., A. Muszynski, and Y. Ozaki, A new possibility of the generalized
two-dimensional correlation spectroscopy. 2. Sample-sample and
wavenumber-wavenumber correlations of temperature-dependent near-
infrared spectra of oleic acid in the pure liquid state. Journal of Physical
Chemistry A, 2000. 104(27): p. 6388-6394.
149. Noda, I., 2-Dimensional Infrared (2d Ir) Spectroscopy - Theory and
Applications. Applied Spectroscopy, 1990. 44(4): p. 550-561.
150. Jiang, E.Y. and R.A. Palmer, Comparison of phase rotation, phase spectrum,
and two dimensional correlation methods in step-scan Fourier transform
infrared photoacoustic spectral depth profiling. Analytical Chemistry, 1997.
69(10): p. 1931-1935.
151. Jiang, E.Y. and A. Grenov, Extension of two-dimensional global phase
difference correlation analysis to step-scan FT-IR photoacoustic spectral
depth profiling of layered systems. Journal of Molecular Structure, 2006.
799(1-3): p. 188-195.
152. Morita, S., H. Shinzawa, I. Noda and Y. Ozaki, Effect of band position shift
on moving-window two-dimensional correlation spectroscopy. Journal of
Molecular Structure, 2006. 799(1-3): p. 16-22.
153. Morita, S., H. Shinzawa, R. Tsenkova, I. Noda and Y. Ozaki, Computational
simulations and a practical application of moving-window two-dimensional
correlation spectroscopy. Journal of Molecular Structure, 2006. 799(1-3): p.
111-120.
154. Czarnik-Matusewicz, B., et al., Potential pitfalls concerning visualization of
the 2D results. Journal of Molecular Structure, 2006. 799(1-3): p. 253-258.
155. Wang, Y.W., W.Y. Gao, I. Noda and Z.W. Yu, A modified mean
normalization method to reduce the effect of peak overlap in two-dimensional
correlation spectroscopy. Journal of Molecular Structure, 2006. 799(1-3): p.
128-133.

217
156. Chen, Z.Y., J.N. Hay, and M.J. Jenkins, The kinetics of Crystallization of
Poly(ethylene terephthalate) measured by FTIR Spectroscopy. European
Polymer Journal, 2012 submitted for publication.
157. Padibjo, S.R. and I.M. Ward, A Structural Study of the Tensile Drawing
Behavior of Poly(Ethylene-Terephthalate). Polymer, 1983. 24(9): p. 1103-
1112.
158. Bassett, D.C., R.H. Olley, and I.A.M.A. Raheil, On crystallization
phenomena in PEEK. Polymer, 1988. 29(10): p. 1745–1754.
159. Chan, T.W. and A.I. Isayev, Quiescent polymer crystallization: Modelling
and measurements. Polymer Engineering & Science, 1994. 34(6): p. 461-471.
160. Miller, R.L. and R.F. Boyer, Chain folding and cross-sectional area per
chain. Journal of Polymer Science: Polymer Physics Edition, 1978. 16(2): p.
371-374.
161. Miller, R.L. and R.F. Boyer, Regularities in x-ray scattering patterns from
amorphous polymers. Journal of Polymer Science: Polymer Physics Edition,
1984. 22(12): p. 2043-2050.
162. Brown, M.E., Introduction to Thermal Analysis - Techniques and
Applications. 2nd ed. 2001, Netherlands: Kluwer Academic Publishers.
163. Kolb, R., C. Wutz, N. Stribeck, G. von Krosigk and C. Riekel, Investigation
of secondary crystallization of polymers by means of microbeam X-ray
scattering. Polymer, 2001. 42(12): p. 5257-5266.
164. Yagpharov, M., Thermal-Analysis of Secondary Crystallization in Polymers.
Journal of Thermal Analysis, 1985. 31(5): p. 1073-1082.
165. Banks, W., M. Gordon, and A. Sharples, The Crystallization of Polyethylene
after Partial Melting. Polymer, 1963. 4(3): p. 289-302.
166. Flory, P.J. and A. Vrij, Melting Points of Linear-Chain Homologs - Normal
Paraffin Hydrocarbons. Journal of the American Chemical Society, 1963.
85(22): p. 3548-&.
167. Flory, P.J., R.A. Orwoll, and A. Vrij, Statistical Thermodynamics of Chain
Molecule Liquids .2. Liquid Mixtures of Normal Paraffin Hydrocarbons.
Journal of the American Chemical Society, 1964. 86(17): p. 3515-&.
168. Flory, P.J., R.A. Orwoll, and A. Vrij, Statistical Thermodynamics of Chain
Molecule Liquids .I. Equation of State for Normal Paraffin Hydrocarbons.
Journal of the American Chemical Society, 1964. 86(17): p. 3507-&.
169. Hay, J.N. and M. Wiles, Surface Free-Energy of Extended Chain Crystals of
Polyethylene. Makromolekulare Chemie-Macromolecular Chemistry and
Physics, 1977. 178(2): p. 623-630.
218
170. Mills, P.J. and J.N. Hay, The Lamella Size Distribution in Nonisothermally
Crystallized Low-Density Polyethylene. Polymer, 1984. 25(9): p. 1277-1280.
171. Mehta, A., U. Gaur, and B. Wunderlich, Equilibrium Melting Parameters of
Poly(Ethylene-Terephthalate). Journal of Polymer Science Part B-Polymer
Physics, 1978. 16(2): p. 289-296.
172. Daubeny, R.D. and C.W. Bunn, The Crystal Structure of Polyethylene
Terephthalate. Proceedings of the Royal Society of London Series a-
Mathematical and Physical Sciences, 1954. 226(1167): p. 531-542.
219
Appendix
Supported Publications:
1. Chen, Z.Y., J.N. Hay, and M.J. Jenkins, FTIR spectroscopic analysis of
poly(ethylene terephthalate) on crystallization. European Polymer Journal, 2012.
48(9): p. 1586-1610.
Received 22th Apr. 2012. Received in revised form 1st Jun. 2012. Accepted 11th Jun. 2012.
2. Chen, Z.Y., J.N. Hay, and M.J. Jenkins, The thermal analysis of poly(ethylene
terephthalate) by FTIR spectroscpy. Thermochimica Acta, 2013. 552: p. 123–
130
Received 11th Jul. 2012. Received in revised form 2nd Oct. 2012. Accepted 1st Nov. 2012.
3. Chen, Z.Y., J.N. Hay, and M.J. Jenkins, The kinetics of crystallization of
poly(ethylene terephthalate) measured by FTIR Spectroscopy. European
Polymer Journal, In Press, Corrected Proof, Available online 28 March 2013
Received 28th Jun. 2012. Received in revised form 11th Mar. 2013. Accepted 17th Mar. 2013.
FTIR spectroscopic analysis of poly(ethylene terephthalate)on crystallization
Ziyu Chen, J.N. Hay ⇑, M.J. JenkinsThe School of Metallurgy and Materials, College of Physical Science and Engineering, The University of Birmingham, Edgbaston, Birmingham B15 2TT, UK
a r t i c l e i n f o
Article history:Received 22 April 2012Received in revised form 1 June 2012Accepted 11 June 2012Available online 29 June 2012
Keywords:Poly(ethylene terephthalate)Two-dimensional FTIR correlationspectroscopySynchronous and asynchronous mappingCrystallization
a b s t r a c t
The vibrational spectrum of partially crystalline poly(ethylene terephthalate), PET, appearsto be unduly complex in that the absorption bands are split into amorphous and crystallinemodes and are sensitive to chain configuration and orientation. Assignment of the bandshas accordingly proved to be difficult and lead to differences in interpretation. Two-dimen-sional infrared spectroscopy is a recent novel analytical technique in vibrational spectros-copy which can be used to interpret differences in the spectra with time or temperatureaccompanying changes in structure and morphology and has been used to analyze thedevelopment of crystallinity within a polymer in which amorphous regions are trans-formed into crystalline regions and involving changes in molecular configuration.
Two-dimensional IR correlation spectroscopy has been successfully applied to theseproblems in the attempt to measure the fractional extent of crystallinity in PET as a func-tion of time and crystallization temperature as well as changes to molecular configuration.
� 2012 Elsevier Ltd. All rights reserved.
1. Introduction
Poly(ethylene terephthalate), PET, is an important com-mercial polymer and widely used in fibre production andin the manufacture of pressurized bottles. Since the devel-opment of physical and mechanical properties is closelyassociated with the degree of crystallinity and orientationthe development of crystallinity and/or fibre morphologysubstantially improves dimensional stability and gas per-meability. In the commercialization of the polymer it hasbeen important to develop rapid analytical procedures todetermine the degree of crystallinity and fibre orientationduring processing in order to maintain material properties.Various IR spectroscopic techniques have been extensivelyused to determine crystallinity and orientation in PET [1–12] but many limitations have been cited which have re-stricted their application, not least of which have beenthe assignment of the molecular characteristic of the
absorption bands which are observed in the vibrationalspectrum of PET and their assignment to crystalline andamorphous regions.
This paper attempts to use recent developments, suchas two dimensional correlation spectroscopy [13–15] to re-solve many of the issues of band assignments as well asusing the increased accuracy and speed of data acquisitionof rapid scan FT IR spectroscopy to measure isothermalcrystallization and melting behaviour of PET.
2. Experimental
Commercial PET films, 1–15 lm thick, were obtainedfrom Goodfellow Ltd., UK. These were dried in a vacuumoven at 100 �C for 12 h prior to use and stress relieved bymelting between KBr plates. Amorphous samples wereproduced by quenching into ice/water from above themelting point and subsequently dried in a vacuum ovenbelow the glass transition temperature.
FTIR spectra were measured on Nicolet spectrophotom-eters, models 1860 and 8700 with a DTGS-KBR detector, onthin film samples mounted between KBr plates in an
0014-3057/$ - see front matter � 2012 Elsevier Ltd. All rights reserved.http://dx.doi.org/10.1016/j.eurpolymj.2012.06.006
⇑ Corresponding author. Tel.: +44 121 414 4544; fax: +44 121 4145232.
E-mail address: [email protected] (J.N. Hay).
European Polymer Journal 48 (2012) 1586–1610
Contents lists available at SciVerse ScienceDirect
European Polymer Journal
journal homepage: www.elsevier .com/locate /europol j
Thermochimica Acta 552 (2013) 123– 130
Contents lists available at SciVerse ScienceDirect
Thermochimica Acta
jo ur n al homepage: www.elsev ier .com/ locate / tca
The thermal analysis of poly(ethylene terephthalate) by FTIR spectroscopy
Ziyu Chen, J.N. Hay ∗, M.J. JenkinsThe School of Metallurgy and Materials, The College of Physical Sciences and Engineering, The University of Birmingham, Edgbaston, Birmingham B15 2TT, UK
a r t i c l e i n f o
Article history:Received 11 July 2012Received in revised form 2 October 2012Accepted 1 November 2012Available online 28 November 2012
Keywords:Poly(ethylene terephthalate)DSCFTIR spectroscopyTrans/cis isomersCrystallizationMelting
a b s t r a c t
Thermal analysis-FTIR spectroscopy, TA-FTIR, has been used to characterize the phase transitions in thinfilms of poly(ethylene terephthalate) and it has been shown to have distinct advantages over other TAtechniques in particular it was not so limited in sensitivity. Since the technique measured property, suchas amorphous content or fractional crystallinity directly rather than the rate of change of the propertieswith time or temperature, it was not so restricted in the time scale over which measurements were made.It also had the advantage of measuring the change in concentration of different functional groups withtemperature and determining the temperature range over which chain mobility set in and defining thetype of molecular groups involved in the configurational changes.
The change in absorbance and shift in peak position with temperature are discussed in terms of theseparation of crystalline and amorphous bands as well as defining the cis/trans ratio as a function oftemperature.
Depending on the change in absorbance or peak position with temperature of the IR bands, they havebeen characterized as type I or type II behaviour. Measurements on both have been used to characterizethe glass transition, crystallization and melting behaviour of PET.
© 2012 Elsevier B.V. All rights reserved.
1. Introduction
Thermal analysis-FTIR spectroscopy, TA-FTIR, has been used tostudy the chemical reactivity and physical properties of polymersat a molecular level. Polymer degradation, in particular, has beenwidely studied since it enables changes in the polymer structureto be followed as a function of temperature and time, the kinet-ics of reactions have been followed by the change in intensity offunctional groups [1–7] and any significant change in chemicalcomposition determined from the appearance and disappearanceof absorption bands. In this way the relative importance of com-peting reactions have been established as well as the build-up anddisappearance of transient species involved in the decompositionreactions.
Recently [8], the kinetics of isothermal crystallization ofpoly(ethylene terephthalate) has been measured by TA-FTIR byseparating the crystalline and amorphous components of the car-bonyl absorption bands as a function of time over a range oftemperatures. This enabled the weight fraction crystallinity to bemeasured well into the secondary crystallization process over agreater time scale and wider temperature range than was possi-ble by differential scanning calorimetry, DSC. The later techniqueby measuring the rate of crystallization rather than the fractional
∗ Corresponding author. Tel.: +44 121 414 4544; fax: +44 121 414 5232.E-mail address: [email protected] (J.N. Hay).
crystallinity was limited by the sensitivity of the calorimeter tomeasure heat flow and could not measure the secondary processdirectly [9–12].
This paper considers the value of TA-FTIR to measure phase andmolecular transitions which occurs in an amorphous/crystallizablepolymer, PET, and makes a direct comparison with DSC.
2. Experimental
Commercial PET films, with thickness between 1.5 and 13 �m,were obtained from Goodfellow Ltd, UK. They were stress relievedby melting between KBr plates or in aluminum pans, and thenquenched into ice/water to produce amorphous samples as deter-mined by DSC [11]. They were dried in a vacuum oven below theglass transition temperature, Tg, prior to use.
A Perkin-Elmer differential scanning calorimeter, DSC-7, inter-faced to a computer was used as described elsewhere [9–12] tofollow the variation of the rate of heat evolution with time. The tem-perature scale of the DSC was calibrated from the melting point ofhigh purity metals: tin (230.06 ◦C); indium (154.58 ◦C). The powerresponse of the calorimeter was calibrated from the enthalpy offusion of indium, taken to be 28.47 J g−1. Disc shaped samples ofPET, cut from a moulded sheet, were weighted and enclosed inaluminum pans. An empty aluminum pan was used as reference.Samples were initially heated from room temperature to 275 ◦C at aheating rate of 10 ◦C min−1 and kept for 2 min at 275 ◦C. They weresubsequently cooled to 30 ◦C at 10 ◦C min−1. The thermal procedure
0040-6031/$ – see front matter © 2012 Elsevier B.V. All rights reserved.http://dx.doi.org/10.1016/j.tca.2012.11.002

The kinetics of crystallization of poly(ethylene terephthalate)measured by FTIR spectroscopy
Ziyu Chen, J.N. Hay ⇑, M.J. Jenkins The School of Metallurgy and Materials, College of Physical Sciences and Engineering, The University of Birmingham, Edgbaston, Birmingham B15 2TT, UK
a r t i c l e i n f o
Article history: Received 28 June 2012 Received in revised form 11 March 2013 Accepted 17 March 2013 Available online xxxx
Keywords:Poly(ethylene terephthalate)FTIR spectroscopy Isothermal crystallization Primary and secondary crystallization
a b s t r a c t
The kinetics of crystallization of poly(ethylene terephthalate ), PET, have been measure d by FTIR spectroscopy using the absorbances of the crystalline and amorphous phase carbonyl bands at 1717 and 1727 cm �1 to determine the fractional crystallinity as a function of time and isothermally over the temperature range 230–240 �C. Both primary and secondary crystallization could be measured with similar accuracy limited only by the length of time over which the measurements were made.
The primary and secondary crystallization time dependences were fitted to Avrami equa- tions with n values of 2.0 and 1.0, respectively. The initial primary process was interpreted as due to two-dimensional spherulites restricted early in the crystallization by the thick- ness of the film sample, 1.5–3.0 lm. Secondary crystallization was considered to be due to one dimensional thickening of lamellae produced in the initi al production of the spheru- lites.
FTIR spectroscopy was considered to have some advantages in measuring the develop- ment of crys tallinity over other techniques, such as DSC and DTA, which measure the rate of crystallization and are limited by the sensitivity of the calorimeter to measure the rate of heat evolutio n.
� 2013 Elsevier Ltd. All rights reserved.
1. Introductio n
Poly(ethylene terephthalate), PET, has played a unique part in the developmen t of crystallization kinetics as it was one of the first polymers to be studied by dilatometry [1] and the isothermal crystallization- time dependence interpreted in terms of the Avrami equation [2]. Because it is a commerciall y important engineeri ng polymer, as amolding material, as fibers and in the manufactur e of pres- surized bottles, whose material properties are markedly dependent on microstructure, morphology and degree of orientation, its crystallization behavior has been widely studied by a range of other experime ntal techniques, including calorimetry , X-ray diffraction, light scattering and vibrational spectroscopy [1,3–20]. Different ial scan-
ning calorimetry (DSC) in particular has been most suc- cessful in studying the effect of molecular structure and copolymeriz ation in controlling the rate of primary crystal- lization but it is deficient in not being sufficiently sensitive to measure to any appreciable extent the developmen t of secondary crystallization with time [21,22].
Secondary crystallization is important in establishing the final degree of crystallinity and the distribut ion of lamellar thicknesses achieved during any thermal treat- ment or drawing process. This has a pronounced effect on the ultimate material properties achieved. We have re- cently reviewed the application of FTIR spectroscopy to measure the developmen t of crystallinity and the effect on the IR spectra, outlining procedures for separating amorphous and crystalline absorption bands [23]. It was observed by means of two-dimensional correlation spec- troscopy that the carbonyl band at 1720 cm �1 split into two, at 1717 and 1727 cm �1, attributed to crystalline and amorphous content and that the absorbance of each are in-
0014-3057/$ - see front matter � 2013 Elsevier Ltd. All rights reserved. http://dx.doi.org/10.1016/j.eurpolymj.2013.03.020
⇑ Corresponding author. Tel.: +44 121 414 4544; fax: +44 121 414 5232.
E-mail address: [email protected] (J.N. Hay).
European Polymer Journal xxx (2013) xxx–xxx
Contents lists availabl e at SciVerse ScienceDi rect
Europea n Po lymer Journ al
journal homepage: www.elsevier .com/locate /europol j
Please cite this article in press as: Chen Z et al. The kinetics of crystallizati on of poly (ethylene terephthal ate) measured by FTIR spec tros- copy. Eur Polym J (2013), http://dx. doi.org/1 0.1016/j.eu rpolymj.20 13.03.020