Embed Size (px)
Citation preview

The Current and Future Role of Social Security in Retirement Planning
Retirement Industry ConferenceApril 5, 2019
Steve Goss, Chief Actuary, Social Security Administration
2
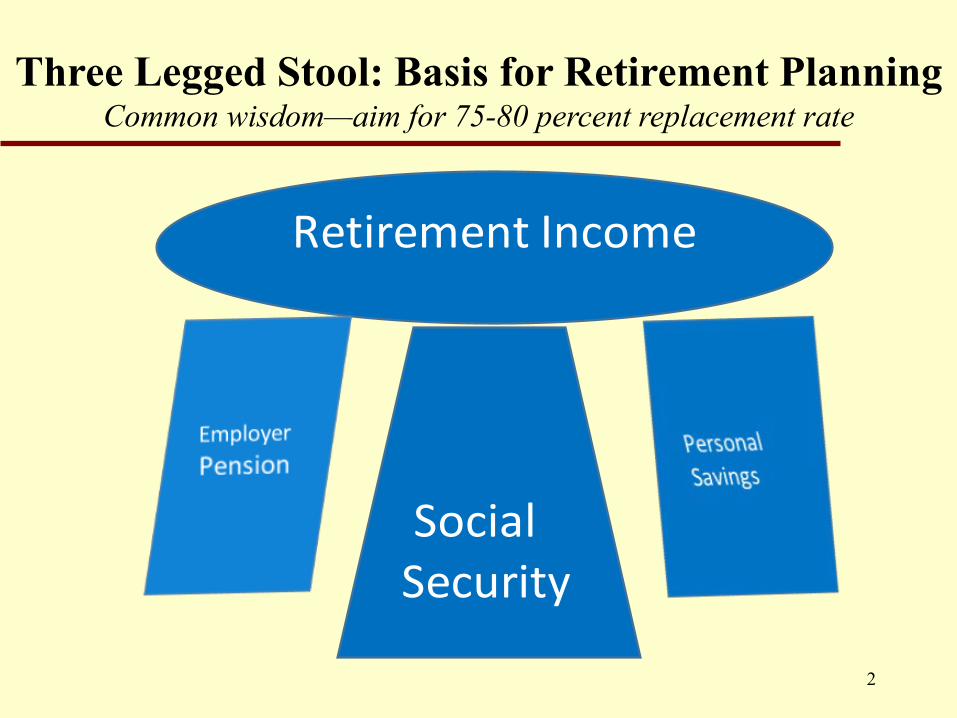
Three Legged Stool: Basis for Retirement PlanningCommon wisdom—aim for 75-80 percent replacement rate
Retirement Income
Social Security
3
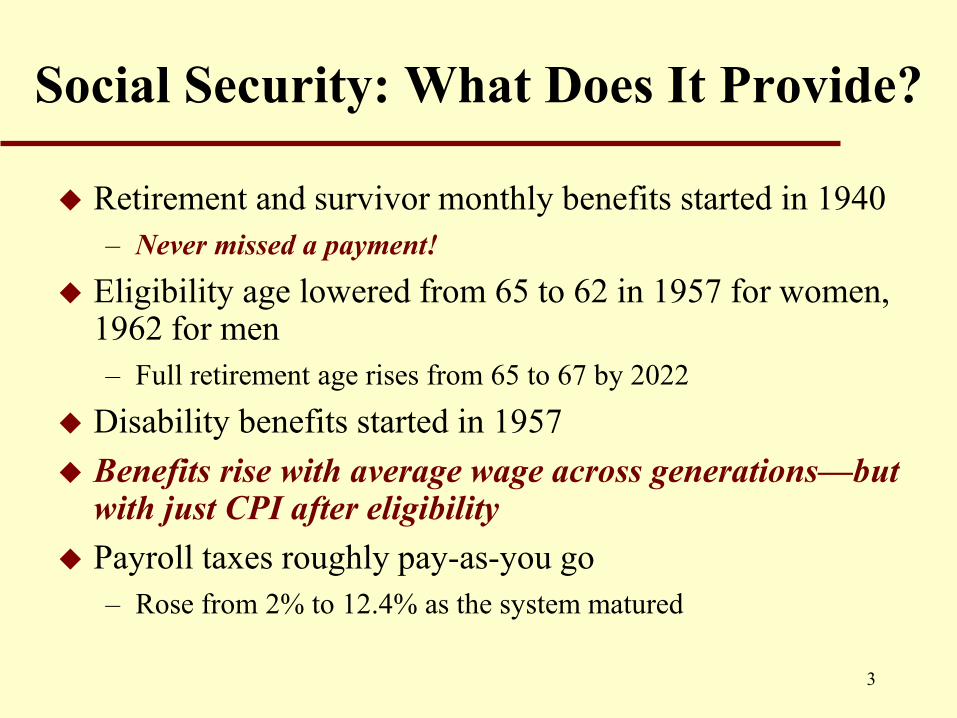
Social Security: What Does It Provide?
Retirement and survivor monthly benefits started in 1940– Never missed a payment!
Eligibility age lowered from 65 to 62 in 1957 for women, 1962 for men– Full retirement age rises from 65 to 67 by 2022
Disability benefits started in 1957 Benefits rise with average wage across generations—but
with just CPI after eligibility Payroll taxes roughly pay-as-you go
– Rose from 2% to 12.4% as the system matured

4
Social Security: Who Pays, Who Benefits
95 percent of workers contribute—177 million in 2019 64 million beneficiaries in 2019:
– 45 million retirees, plus another 3 million of their spouses and children– Plus 6 million survivors– Plus over 10 million disabled workers and their dependents
What share of retirement income does Social Security provide?– For about 1/3 of beneficiaries, Social Security is essentially their only
income– For about 2/3 of beneficiaries, Social Security provides at least half of
their income Note decline in employer-sponsored defined benefit
pension plans

Defined Benefit Plans Replaced by DC PlansAnd lump sum options increasing for DB plans
5
0%
10%
20%
30%
40%
50%
60%
1979
1980
1981
1982
1983
1984
1985
1986
1987
1988
1989
1990
1991
1992
1993
1994
1995
1996
1997
1998
1999
2000
2001
2002
2003
2004
2005
2006
2007
2008
2009
2010
2011
2012
2013
2014
Private-Sector Workers Participating in Employment-Based Retirement Plans, by Plan Type, 1979-2014
Defined Benefit Total Defined Contribution Total
Both Either
Source: U.S. Department of Labor Form 5500 Summaries 1979-1998, Pension Benefit Guaranty Corporation,Current Population Survey 1999-2013, EBRI estimates 1999-2014.

6
Start Social Security Scheduled Benefit at Age 65: Replace 25% to Over 50% of Career Earnings
0
10
20
30
40
50
60
70
1940 1960 1980 2000 2020 2040 2060 2080
Scheduled Monthly Benefit Levels as Percent of Career-Average Earnings by Year of Retirement at age 65
Low Earner ($23,353 for 2018; 25th percentile)
Medium Earner ($51,894 for 2018; 56th percentile)
High Earner ($83,031 for 2018; 82nd percentile)
Max Earner ($128,400 for 2018; 100th percentile)

7
Start Social Security Scheduled Benefit at Age 62:Replace 20% to Over 40% of Career Earnings
0
10
20
30
40
50
60
70
1960 1980 2000 2020 2040 2060 2080
Scheduled Monthly Benefit Levels as Percent of Career-Average Earnings by Year of Retirement at age 62
Low Earner ($23,353 in 2018; 25th percentile)
Medium Earner ($51,894 in 2018; 56th percentile)
High Earner ($83,031 in 2018; 82nd percentile)
Max Earner ($128,400 in 2018; 100th percentile)

8
Social Security Financing
Basically “pay-as-you-go” Current workers provide for current beneficiaries Trust Funds provide a “contingency reserve” because they
cannot borrow Total spending to date cannot exceed income to date
Current Social Security reserves (excess income) =$2.9 trillion Available to augment tax income as needed
Reserves projected to deplete in 2034 under current law Expect Congress to act—as it always has

9
Social Security Cost Is Now Above Scheduled Income:With no change in the law, trust fund reserves would deplete in 2034 and
continuing revenue would cover 79%, and eventually 74%, of cost
0%
5%
10%
15%
20%
25%
2005 2015 2025 2035 2045 2055 2065 2075 2085 2095
Calendar year
Cost: Scheduled and payable benefits
Non-interest Income
Payable benefits as percentof scheduled benefits:2017-33: 100%2034: 79%2092: 74%
Cost: Scheduled but not fully payable benefits
Expenditures: Payable benefits = income after trust fund depletion in 2034

Rising Social Security Cost Is Due to the Changing Age Distribution
mainly due to drop in birth rates
10
0.00
0.05
0.10
0.15
0.20
0.25
0.30
0.35
0.40
0.45
0.50
1940 1950 1960 1970 1980 1990 2000 2010 2020 2030 2040 2050 2060 2070 2080 2090 2100
Aged Dependency Ratio 2018 TRPopulation 65+/(20-64)
Actual and TR Intermediate
TFR remains at 3.0 after 1964
TFR remains at 3.3 after 1964

11
What Will Congress Do?Cost rises from 4.2% of GDP in 1990-2008 to 6% by 2035. Will Americans prefer to keep
scheduled benefits and pay more? Or keep payroll tax at 12.4% and lower benefits?
0%
2%
4%
6%
8%
10%
1990 2000 2010 2020 2030 2040 2050 2060 2070 2080 2090
Calendar year
Non-interest Income
Historical Estimated
Cost
12
So How Does Social Security Fit Into Retirement Planning?
Provides monthly CPI-indexed income that covers 25% to 75% of target retirement income, depending on career earnings level– Future amount might be somewhat lower depending on how
Congress addresses the future shortfall, reflecting the will of the American people
– But few things are more certain than that Social Security benefits will be there for you in the future
Individuals should learn what they can expect by signing up for a “my Social Security” account at https://www.ssa.gov/myaccount/ and looking at their prospective benefits

13
Opportunities to be Considered/Conveyed
The age you start receiving benefits is crucial:– Starting benefits as early as 62 will lower your monthly
benefit level to 70% of what you can get by waiting to 67– Delaying the start of benefits until 70 adds 24% to what
you would get starting at 67, or 77% to what you get starting at 62
– The decision is personal, depending on health, ability to keep working, and other sources of income
14
Opportunities to be Considered/Conveyed
The availability of additional “CPI-indexed life annuity” income by delaying claiming is unique – Some who retire early can even consider living off of other
resources up to age 67 or 70, in order to increase monthly benefit thereafter
– The increase may convey to a surviving spouse Or, if preferred, individuals can start benefits early
and purchase a deferred income annuity for later, particularly if their other retirement income is not indexed like Social Security

15
Opportunities No Longer Available
“Withdrawal of claim”– It used to be possible to pay back prior benefits and
“restart” them at higher amount if still very healthy at (say) age 70
– Now repayment is limited to 1 year “File and Suspend”
– It used to be possible to file for your worker benefit at (say) age 67, then suspend it, and receive a spouse benefit or have your spouse receive a spouse benefit on your account
These “claiming strategies” have both been eliminated

16
Other Considerations for Financial Planners
How to better emphasize the importance of lifetime income?– Planning to have enough income for your life expectancy
will fail for half of us– Without a life annuity, should assets be drawn down to last
until age 120?– How to better convey the value of a life annuity that may
appear small compared to an equivalent lump sum value?– How to convey the need for increasing income after
retirement, not just from Social Security?

17
Other Considerations for Financial Planners
How to deal with fewer private DB plans, and with lump sum options for those remaining? – Are good private annuities available that are fairly priced?– Will indexed life annuities become more available? If so,
will anti-selection render them unaffordable or unattractive?
– Have we simply been too successful in emphasizing the accruing balances in DC accounts, without regard to what they mean for lifetime income? Should a “translation” into monthly lifetime income be required?

Finally, What Have People Been Doing About Claiming Social Security Benefits?
Consider the effect of eliminating the retirement earnings test over NRA in 2000
0
10
20
30
40
50
60
70
80
90
100
1975 1980 1985 1990 1995 2000 2005 2010 2015
Male Retired Worker Beneficiaries In Current Payment Status as Percent of Insured Population
(excluding those receiving only some other OASDI benefit)
62.5 63.5 64.5 65.5 66.5 67.5 68.5 69.5 70.5
Recession
Eliminate Earnings Test Over NRA
0
10
20
30
40
50
60
70
80
90
100
1975 1980 1985 1990 1995 2000 2005 2010 2015
Female Retired Worker Beneficiaries In Current Payment Status as Percent of Insured Population
(excluding those receiving only some other OASDI benefit)
62.5 63.5 64.5 65.5 66.5 67.5 68.5 69.5 70.5
Recession
Eliminate Earnings
18

Employment Over Age 65… is rising, and was even resistant to the last recession. How much of this is from changing the NRA and earnings test? Is the best retirement approach “a job” (Paul Samuelson)?
0
0.1
0.2
0.3
0.4
0.5
0.6
0.7
0.8
0.9
1
1980 1982 1984 1986 1988 1990 1992 1994 1996 1998 2000 2002 2004 2006 2008 2010 2012 2014 2016
Male Ratio of Civilian Employment to Non-institutionalized Population
EPM2554 EPM5559 EPM6064 EPM6569 EPM70O
70 and over
65-69
60-64
55-59
25-54
19
0
0.1
0.2
0.3
0.4
0.5
0.6
0.7
0.8
0.9
1
1980 1982 1984 1986 1988 1990 1992 1994 1996 1998 2000 2002 2004 2006 2008 2010 2012 2014 2016
Female Ratio of Civilian Employment to Non-institutionalized Popultion
EPF2554 EPF5559 EPF6064 EPF6569 EPF70O
70 and over
65-69
60-64
55-59
25-54