Embed Size (px)
Citation preview

Age and Ageing 1998; 27: 605-613 © 1998, British Geriatrics Society
The description of activities of dailyliving in five centres in England andWalesTHE MEDICAL RESEARCH COUNCIL COGNITIVE FUNCTION AND AGEING STUDY (MRC CFAS)
Writing committee: Magnus A. McGee, Anthony L. Johnson, David W. K. Kay1 and MRC CFAS Analysis subcommittee2
MRC Biostatistics Unit, Institute of Public Health, University Forvie Site, Robinson Way, Cambridge CB2 2SR, UK
'Newcastle Project for Health in Later Life, Research Unit, I - 4 Claremont Terrace, Newcastle-upon-Tyne NE2 4AE, UK
2See Appendix
Address correspondence to M. A McGee. Fax; (+44) 1223 330388
AbstractObjectives: the Medical Research Council Cognitive Function and Ageing Study is a longitudinal study of healthand well-being of the ageing UK population. We present the screening interview which assesses how this groupcopes with activities of daily living (ADL), and characteristic ranges for the total score of these activities by age andsex.Design: random sampling was from Family Health Service Authority lists in three urban and two rural areas,including institutions. Participants (w = 13009) in their 65th year and over were interviewed between 1991 and1994. The sample was stratified to provide equal numbers in the 65-74 and 75 years and over age groups. Eachparticipant was asked about socio-demographic variables, cognitive function, physical health, medication and ADL(based on the nine items from the self-reported Townsend's disability scale).Results: the scale shows good reliability and validity in this study. There is a high frequency of disability amongstthe oldest old, and relationships between ability and age and between ability and sex and other sociodemographicvariables: the risk of having difficulty increases with living away from home, with poorer eyesight and speech, withlower social class and with lack of further education. Projections of the number (and percentage) of severelydisabled over-65-year-olds in the UK in 2011 and 2051 are 1.4 million (2.2%) and 2.3 million (39%) respectively.
Keywords: activities of daily living age factors, ageing epidemiology, longitudinal studies, mutticentre study, physiology, reproduability
of results
Introduction
In England and Wales in 1901 <6% of the populationwere over 65 years. By 1991 16% of the populationwere older than 65, and more than half of this groupwere older than 75. Information about the health statusof the elderly population in England and Wales is scantand related mainly to non-institutionalized individuals[1, 2]. However, the proportions of elderly peopleliving at home or in institutions vary with time and theage structure of the population.
The Medical Research Council Cognitive Functionand Ageing Study (MRC CFAS) was set up to investigatekey areas relevant to the health and well-being of an
ageing population. Here, we address the need for anepidemiological perspective of physical disability [3]assessing how participants cope with daily activitiesand providing age-sex-specific estimates of physicalability in the elderly population. This was considered inoutline in previous studies [4, 5] but associations withimportant demographic and social features were nottaken into account in any detail.
'Physical ability' refers to the ability to carry outvarious activities which are dependent on bothphysical and mental function. Physical ability is anabstract attribute and therefore cannot be measureddirectly. One method of assessment is a self-reportedscale consisting of several activities of daily living
605
Dow
nloaded from https://academ
ic.oup.com/ageing/article/27/5/605/36432 by guest on 02 February 2022

M. A. McGee et al.
(ADL), preferably one which is reliable and valid [6].However it is not sufficient to stop there. The reliabilityand validity of the scale must be established within thecontext of the study to which it is applied since thedesign and administration may affect what the scale ismeasuring.
We anticipated associations between physical abilityand both age and sex, as well as other potentialdemographic characteristics such as social class. Animportant confounder of the ability-sex and ability -age associations is strength. Several authors havereported the absolute strength of women to bearound 60% that of men [7]. The difference is reducedor disappears when adjusted for height, body weight,lean body weight or muscle area.
Methods
Design
The MRC CFAS is a population-based study of the65 years and over age group in Cambridgeshire,Newcastle, Nottingham, Oxford, Gwynedd and liver-pool. At the first four study centres, individuals weretaken from computerized Family Health Service Author-ity lists, including those institutionalized within theprevious 2 years. Participants were randomly selectedfrom those eligible and resident in the centre's geogra-phical area. Selection was undertaken to provide at least2500 interviews for each area, half in the over-75 agegroup. Individuals from Gwynedd were identifiedmanually and sampled using the same sampling frameas the other four centres. Liverpool used a slightlydifferent design [8] and is not included in the analysis.The sample and audit trail is fully described elsewhere[9].
InterviewThe screening interview, administered by a trained layinterviewer using a lap-top computer, containedquestions on orientation, socio-demography, socialcontacts, general health, memory, sleeping problems,ADL [10-14], smoking, drinking, cognition and med-ication. The interviewer also rated the participant'smemory and behaviour. The route through the ques-tions was determined by the response to each questionand as a result inapplicable questions were skipped.This was especially important in the orientation section,where a lack of response or inaccurate responseswould result in fewer questions being asked. This'priority mode' included questions on orientation,memory and a short version of the cognitive sectioncovering the Mini-Mental State Examination [15].Interviewers could also use the priority mode whereparticipants were frail or were becoming agitated.
The Townsend disability scale is a short index of
activities that assesses physical ability in social termsand can be administered by a lay person [12]. Withtime, minor changes were made to produce the scale[13, 14] used in this study. The scale consists of ninequestions or 'items' (Table 1). Subjects report dieirlevel of difficulty. The valid responses — 'yes, with nodifficulty', 'yes, with some difficulty' and 'no, needshelp'—score 0, 1 and 2 respectively.
The scale gives equal weighting to each item andignores daily and seasonal effects. Items are wordedwithout reference to a time period. Interviewers wereinstructed to record what the participant told them.
Sex and Age (years)
k
Sex and Age (years)
Sex and Age (years)
Figure I. Percentages of participants reporting nodifficulty D, some difficulty O, or inability 0 in atying a knot, b preparing a hot-meal, c washing orbathing, and by age and sex.
606
Dow
nloaded from https://academ
ic.oup.com/ageing/article/27/5/605/36432 by guest on 02 February 2022
The MRC Cognitive Function and Ageing Study
Seasonal effects should cancel each other becauseinterviews at each centre were spread over either a 1 or2 year period. Full details of interviewer training andquality control are described elsewhere [9].
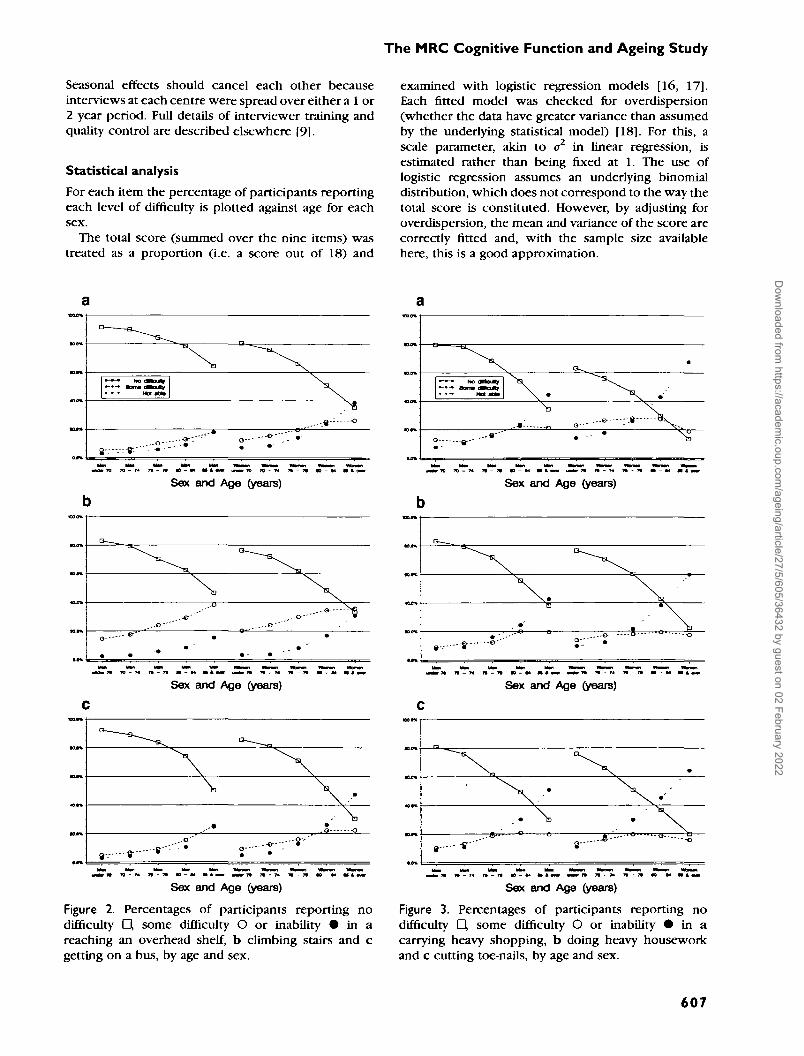
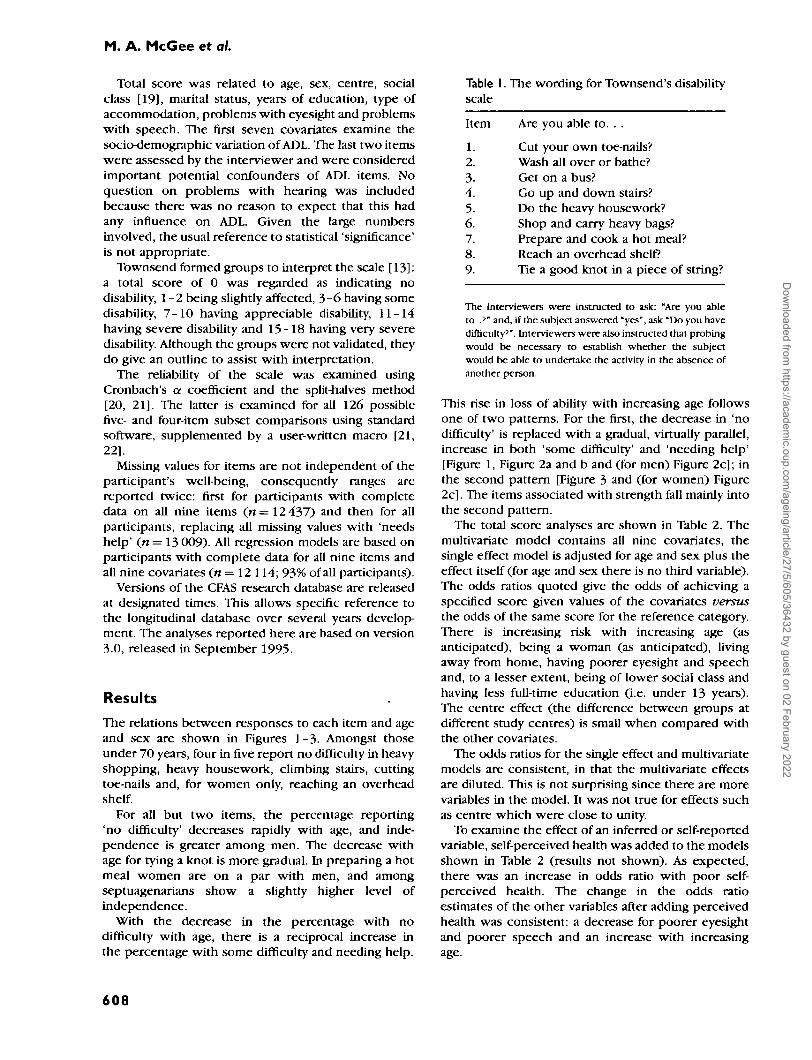
Statistical analysisFor each item the percentage of participants reportingeach level of difficulty is plotted against age for eachsex.
The total score (summed over the nine items) wastreated as a proportion (i.e. a score out of 18) and
examined with logistic regression models [16, 17].Each fitted model was checked for overdispersion(whether the data have greater variance than assumedby the underlying statistical model) [18]. For this, ascale parameter, akin to a2 in linear regression, isestimated rather than being fixed at 1. The use oflogistic regression assumes an underlying binomialdistribution, which does not correspond to the way thetotal score is constituted. However, by adjusting foroverdispersion, the mean and variance of the score arecorrectly fitted and, with the sample size availablehere, this is a good approximation.
.>»
D —
O
XNo (Stouty
Not a t *
-9"'"'r
\ .
V -„ o--•
Sex and Age (years) Sex and Age (years)
. . - © " "
e - --•"
"X
ry O"
•
\
f
Sex and Age (years) Sex and Age (years)
\
,Q -Q
• • - 8 -8 - ' 8—
X-• x..--8-"" *̂ --o
Sex and Age (years)
Figure 2. Percentages of participants reporting nodifficulty D, some difficulty O or inability • in areaching an overhead shelf, b climbing stairs and cgetting on a bus, by age and sex.
Sex and Age (years)
Figure 3. Percentages of participants reporting nodifficulty D, some difficulty O or inability I in acarrying heavy shopping, b doing heavy houseworkand c cutting toe-nails, by age and sex.
607
Dow
nloaded from https://academ
ic.oup.com/ageing/article/27/5/605/36432 by guest on 02 February 2022
M. A. McGee et al.
Total score was related to age, sex, centre, socialclass [19], marital status, years of education, type ofaccommodation, problems with eyesight and problemswith speech. The first seven covariates examine thesocio-demographic variation of ADL. The last two itemswere assessed by the interviewer and were consideredimportant potential confounders of ADL items. Noquestion on problems with hearing was includedbecause there was no reason to expect that this hadany influence on ADL. Given the large numbersinvolved, the usual reference to statistical 'significance'is not appropriate.
Townsend formed groups to interpret the scale [13]:a total score of 0 was regarded as indicating nodisability, 1-2 being slightly affected, 3-6 having somedisability, 7-10 having appreciable disability, 11-14having severe disability and 15-18 having very severedisability. Although the groups were not validated, theydo give an outline to assist with interpretation.
The reliability of the scale was examined usingCronbach's a coefficient and the split-halves method[20, 21]. The latter is examined for all 126 possiblefive- and four-item subset comparisons using standardsoftware, supplemented by a user-written macro [21,22].
Missing values for items are not independent of theparticipant's well-being, consequently ranges arereported twice: first for participants with completedata on all nine items (n— 12 437) and then for allparticipants, replacing all missing values with 'needshelp' (n = 13 009). All regression models are based onparticipants with complete data for all nine items andall nine covariates (n = 12 114; 93% of all participants).
Versions of the CFAS research database are releasedat designated times. This allows specific reference tothe longitudinal database over several years develop-ment. The analyses reported here are based on version3.0, released in September 1995.
Results
The relations between responses to each item and ageand sex are shown in Figures 1-3. Amongst thoseunder 70 years, four in five report no difficulty in heavyshopping, heavy housework, climbing stairs, cuttingtoe-nails and, for women only, reaching an overheadshelf.
For all but two items, the percentage reporting'no difficulty' decreases rapidly with age, and inde-pendence is greater among men. The decrease withage for tying a knot is more gradual. In preparing a hotmeal women are on a par with men, and amongseptuagenarians show a slightly higher level ofindependence.
With the decrease in the percentage with nodifficulty with age, there is a reciprocal increase inthe percentage with some difficulty and needing help.
Table I. The wording for Townsend's disabilityscale
Item Are you able to. . .
1. Cut your own toe-nails?2. Wash all over or bathe?3. Get on a bus?4. Go up and down stairs?5. Do the heavy housework?6. Shop and carry heavy bags?7. Prepare and cook a hot meal?8. Reach an overhead shelf?9- Tie a good knot in a piece of string?
The interviewers were instructed to ask: "Are you ableto .'" and, if the subject answered "yes", ask "Do you havedifficulty'". Interviewers were also instructed that probingwould be necessary to establish whether the subjectwould be able to undertake the activity in the absence ofanother person.
This rise in loss of ability with increasing age followsone of two patterns. For the first, the decrease in 'nodifficulty' is replaced with a gradual, virtually parallel,increase in both 'some difficulty' and 'needing help'[Figure 1, Figure 2a and b and (for men) Figure 2c]; inthe second pattern [Figure 3 and (for women) Figure2c]. The items associated with strength fall mainly intothe second pattern.
The total score analyses are shown in Table 2. Themultivariate model contains all nine covariates, thesingle effect model is adjusted for age and sex plus theeffect itself (for age and sex there is no third variable).The odds ratios quoted give the odds of achieving aspecified score given values of the covariates versusthe odds of the same score for the reference category.There is increasing risk with increasing age (asanticipated), being a woman (as anticipated), livingaway from home, having poorer eyesight and speechand, to a lesser extent, being of lower social class andhaving less full-time education (i.e. under 13 years).The centre effect (the difference between groups atdifferent study centres) is small when compared withthe other covariates.
The odds ratios for the single effect and multivariatemodels are consistent, in that the multivariate effectsare diluted. This is not surprising since there are morevariables in the model. It was not true for effects suchas centre which were close to unity.
To examine the effect of an inferred or self-reportedvariable, self-perceived health was added to the modelsshown in Table 2 (results not shown). As expected,there was an increase in odds ratio with poor self-perceived health. The change in the odds ratioestimates of the other variables after adding perceivedhealth was consistent: a decrease for poorer eyesightand poorer speech and an increase with increasingage.
608
Dow
nloaded from https://academ
ic.oup.com/ageing/article/27/5/605/36432 by guest on 02 February 2022

The MRC Cognitive Function and Ageing Study
Table 2. Number, back transformed mean, odds ratio (OR) and 95% confidence interval (CI) from multivariatelogistic regression for the total score (n = 12 114)
Effect
Age (years)<7070-7475-7980-84>85
SexMaleFemale
CentreCambridgeGwyneddNewcastleNottinghamOxford
Marital statusSingleWith partnerWidowedDivorced/separated
Social classI and IIIII (non-manual)IE (manual)IVandVArmed forces
Full time education (years)<9 years910-122=13
Type of accommodationHouse, flat or granny flatWarden-controlled flatHome or hospital
Deterioration of eyesightNoneSomeMarked/blind
Deterioration of speechNoneSomeMarked/dumb
n
31023040276720171188
49287186
24662414234923432542
94462094522
439
3663138744782415
171
860675332801221
10970862282
11049681384
11905164
45
Mean score
0.871.191.983.466.38
1.232.39
1.711.761.912.131.84
2.171.322.751.72
1.491.941.892.421.90
2.801.961.681.34
1.66366
10.42
1.644.757.51
1.825.706.32
Single
OR
11.322.123.697.26
0.601
1.001.091.061.301
1.0911.151 3 1
0.730.9211.240.91
1.0810.830.63
1
1.515.62
11.942.95
14.025.72
effect
95% CI
(1.2, 1.4)(1.9, 2.3)(3.4, 4.0)(6.6, 8.0)
(0.6, 0.6)
(0.9, 1.1)(1.0, 1.2)(1.0, 1.2)(1.2, 1.4)
(1.0, 1.2)
(1.1, 1-2)(1.1, 1-5)
(0.7, 0.8)(0.8, 1.0)
(1.2, 1.3)(0.7, 1.1)
(1.0, 1.2)
(0.8, 0.9)(0.6, 0.7)
(1.4, 1.7)(4.8, 6.6)
(1.8, 2.1)(2.6, 3.3)
(3-3, 4.8)(4.0, 8.2)
Multivariate
OR
11.241933 0 05.02
0.611
0.971.191.091.261
0.9511.041.12
0.810.9511.170.86
1.0310.920.76
11.444.92
11.722.66
13.104.18
95% CI
(1.1, 1.4)(1.8, 2.1)(2.7, 3.3)(4.5, 5.6)
(0.6, 0.6)
(0.9, 1.1)(1.1, 1.3)(1.0, 1.2)(1.2, 1.4)
(0.9, 1.1)
(1.0, 1.1)(1.0, 1.3)
(0.8, 0.9)(0.9, 1.0)
(1.1, 1.3)(0.7, 1.1)
(0.9, 1.1)
(0.9, 1.0)(0.7, 0.8)
(1.3, 1.6)(4.2, 5.7)
(1.6, 1.9)(2.4, 3.0)
(2.6, 3.7)(2.9, 6.0)
The total score was transformed using, y = log (score +1). The back transformed mean for y is reported. Single effect estimates arc for modelswith parameter plus age and sex. The intercept parameter for the multivariate model is —2.07. The scale parameter for the multivariate was 2.32and between 2.40 and 2.46 for single effects
609
Dow
nloaded from https://academ
ic.oup.com/ageing/article/27/5/605/36432 by guest on 02 February 2022

M. A. McGee et al.
Table 3. Percentage of participants with grouped total score by age and sex for all data (« = 13 009) and for completedata (n = 12 457)'
Age (years)
Men<7070-7475-7980-842=85
Women<7070-7475-7980-84^85
n
1444 (1426)1386(1361)1159(1125)778 (746)393 (344)
1743 (1728)1763 (1741)1748 (1687)1477(1360)1118(919)
Townsend's disability grouping
None or slight
81.3 (82.3)77.8 (79.2)64.4 (66.3)48.1 (50.0)24.9 (28.4)
72.6 (73.2)63.4 (64.2)47.6(49.1)28.0 (30.2)10.6(12.7)
Some
11.7(11.5)11.9(11.9)18.9 (19.0)26.1 (26.9)20.4 (22.3)
15.5(15.5)21.0(21.1)26.7 (27.3)25.5 (27.5)17.7(21.2)
Appreciable
3.3 (3.2)4.8 (4.6)6.4 (6.5)
11.7(11.6)20.6 (22.9)
6.6 (6.4)9.4 (9.4)
12.3 (12.2)17.7 (18.9)20.5 (23.3)
Severe
3.7 (2.9)5.5 (4.1)
10.4 (8.0)14.1 (11.3)34.1 (26.1)
5.3 (4.6)6.2 (5.1)
13.4(11.2)28.8(23.1)51.3 (42.6)
"In parentheses.
Characteristic ranges for the total score are summar-ized in Table 3 using Townsend's classification. Bothdatasets are reported since non-respondents areintrinsically different, usually with poorer cognitivehealth and older. Complete data were available for 98%of participants with accommodation in a house, flat orgranny flat (n = 11 225) compared with 97% living in awarden-controlled flat (n = 892) and 68% in a home orhospital (n = 320). The complete data give a lowerestimate for each item in the range 2.6-3.4% (resultsnot shown).
Cronbach's a for the complete data (n = 12 437) was0.91. The lowest a after one item in turn was removedwas 0.89- The correlation between the remaining eightitems and the recalculated total score ranged from 0.62to 0.80; for the ninth item, tying a knot, was 0.47.The median split-half reliability was 0.91, range 0.88-0.93.
Discussion
Results and inference
Our analysis shows the high frequency of disabilityamongst the oldest old and, as expected, the relation-ships between ability and age and ability and sex. Lessthan 5% of men and women in the under-70 agegroup were severely disabled compared with over one-quarter of men and over 40% of women in the over-85group.
One proposal for greater disability amongst femalesrelates to their longer survival from the onset ofdisability which means that while the incidence ofdisability is similar, the prevalence is higher in women[23]. In a cohort aged 70-79 years, baseline physicalperformance (prevalence) was better in men but after3 years follow-up there was no difference in the
incidence of disability between the sexes [24]. Asecond argument accepts the increased disability withage [24], but adds that the longer that disease isavoided the shorter the time spent, on average, in adependent state before death, particularly in women[25, 26].
The loss of ability with age appears to be associatedwith age-related changes in muscle strength and raisesthe hypothesis of a direct link between strength andability to perform physical activities. Male disability is61% that of females. We confirmed the decrease inmuscle strength with age, which most likely resultedfrom decreased muscle mass and in turn has aproportional effect on muscle strength and aerobicpower [26]. The reductions in strength and musclemass with age are gradual, but changes in the older oldare marked [27, 28]—a finding which helps explainthe patterns seen in Figures 1-3. That muscle strengthand total ADL score are related is supported by severalstudies which consider the relationship betweenphysiological measures and ADL from different per-spectives [29-32].
The results in Table 3 are based on a populationsample and can be used to infer the degree of disability.The results should not be applied to populations thatlive only at home, which would provide a seriousoverestimate of disability. Similarly, the resourcesrequired to provide for disability could be under-estimated since subjects with impaired ADL mayrequire higher use of health services before death [33]-
The CFAS screening interview had 200 questions,from which nine covariates were used in the multi-variate analysis (Table 2). The selection was based onmeasurable covariates which allow the results to beapplied beyond this study. The consistency of thecovariate effects, while expected, is reassuring. Thereasons for the centre effect are unclear but, along withmarital status, the effects are minimal when the
610
Dow
nloaded from https://academ
ic.oup.com/ageing/article/27/5/605/36432 by guest on 02 February 2022

The MRC Cognitive Function and Ageing Study
magnitude of the odds ratios and mean total scoreswithin each variable are compared. For example,centre shows an increase of only 30% in odds ratioand 0.43 in mean score, compared with around 70%and 1 for sex and >700% and over >5 for age.
The results in Table 3 are reported for participantswith complete data for each scale item (« = 12 437)and, by recoding missing items as 'not able to do', forall participants (n = 13 009). Amongst the 572 subjectswith missing data, 382 (67%) had missing data for allitems and 97 (17%) had missing data for one item. Inthe former group, 342 (90%) have an Mini-Mental StateExamination score [15] of <18 (indicating severecognitive impairment) compared with 18 (19%) ofthe latter group. Missing data suggest that theparticipant is likely to be physically infirm or cogni-tively impaired. The recoding assumption is reasonablefor physically infirm subjects and, whilst a cognitivelyimpaired participant's inability to answer the questiongives no information about ability, it seems reasonableto assume that their communication impairment wouldindicate a need for extra care.
Each pair of point estimates provides a crude lowerand upper estimate for each category of the total score.Estimates for the complete data are greater than thetrue value because the participants omitted are lessable, while the all participant set provides estimateslower than the true value because the missing dataassumption is too harsh. The difference between thetwo estimates will increase with age since the amountof missing data increases with age.
The total score analysis is adjusted for overdisper-sion. Ignoring overdispersion would lead to standarderrors being under-estimated and hence exaggeratedsignificance and smaller confidence intervals [34]: inTable 2 the 95% confidence interval for the multivariateodds ratio for those aged 85 and over is shrunk from(4.5, 5.6) to (4.8, 53) when overdispersion is ignored.
Methodological considerations
Participants who died between being identified inthe eligible sample and their interview do not biasresults since the 'date' for taking the cross-section ofthe population is effectively the participant's ownscreening date.
The percentage of refusers in MRC CFAS for the5-year age bands from <70 years to S90 years are 24.4,18.4, 198, 17.4, 17.6 and 14.9 respectively. A reviewshowed non-response to be associated with poorcurrent health status but no consistent link withchronic illness or disability, suggesting that non-response could also depend on experience of medicalcare. Others have shown lower response levels tohealth care studies amongst healthier subjects [35].
Townsend's classification of severe disability wasused to investigate the effect of refusers. Thepercentage of refusers in that class required to
change the prevalence by 5% was calculated for eachage group. For the age groups under 70 years throughto 80-84 years, 25, 33, 37 and 52% of refusers wouldhave to be severely disabled to increase the prevalenceby 5%. It would be impossible to achieve thecorresponding decrease, even if none of the refuserswas severely disabled. For the 85 years and over agegroup, if between 18% and 78% of refusers wereseverely disabled then the prevalence would remainwithin the 5% band. The percentage of refusersrequired to change the prevalence by 5% increaseswith age, and the range of plausible values is wideenough to suggest that the bias would not beconsiderable.
The (intra) reliability and validity of the scale must beestablished within the context of the study since thedesign and administration may affect what the scale ismeasuring. The inter-rater reliability was addressed intraining, as discussed elsewhere [9] •
Reliability is assessed by the split-halves method andCronbach's a coefficient—the expected correlationbetween the test scale and the unknown true scale. Allthe split-half reliability coefficients have high values(>0.80 [20, 36]) and with an a of >90% there is littledoubt about the reliability of Townsend's disabilityscale for this study.
Validation is the relationship between the scale andwhat it is supposed to measure, in this case betweenTownsend's disability scale and physical ability [20,36]. There are three types of validity to be considered:content, construct and criterion. Construct validity hasmore relevance in abstract areas, like psychology andsociology, where the variable of interest cannot bedirectly observed and •will not be considered further.
Content validity asks if the scale covers all aspects ofthe attribute measured. Townsend observed thatactivities relating to disability could be classed intofive attributes [13]: maintaining personal existence;providing the means to fulfil the first; activitiesnecessary to immediate family and household relation-ships; activities necessary to external social relation-ships and activities necessary to the instrumental rolesperformed as a member of society. Each attribute isprogressively harder to measure and the scale coversthe first two, effectively ADL and instrumentalactivities of daily living, giving a scale which has awide range of abilities [6] that can be readily measured.The factor analysis of Townsend's disability scale ison-going.
Criterion validity considers whether the attribute ofinterest is measured accurately. It was examined byKelly-Hayes et al. [37] when a self-reported scale wascompared with an objectively measured scale using thesame items. They reported higher disability in self-rating scale with more disparities with increasing ageand poorer cognitive function. If the findings hold forthe current study then some individuals disability willbe over-estimated. The Kelly-Hayes findings "do not
61 I
Dow
nloaded from https://academ
ic.oup.com/ageing/article/27/5/605/36432 by guest on 02 February 2022
M. A. McGee et al.
represent those who are more likely to be moredisabled at home or in an institution". The questionremains whether the relationship holds for peoplewith either cognitive impairment or greater disabilityor both. Here self-reported measures may reflect pastability rather than current ability and could beaccounted for by either cognitive decline or, forsubjects living at home, self-perceived concern thatthe questionnaire is an assessment of their ability to liveat home [38, 39].
We have established the validity of Townsend'sdisability scale as an indication of physical ability, butwith the warning that there may be some over-estimation of disability for a small proportion ofindividuals.
To infer the level of disability from the scale inthis study, a balance has to be reached between whatthe participant actually does—ability plus socialcomponent—and what the participant can do—abilityas observed. If questions were phrased "do you?" thenthe answers are conditional on the participant'ssurroundings, consequently the phrase "are you ableto?" is used.
Using the wording "are you?" rather than "can you?"should not be confused with the capacity versusperformance issue [33]- For "are you?" questions theparticipants are not asked about a particular capacity,for example "are you able to walk a mile?". If they hadbeen then the participant's need or opportunity to dothe item would have been an issue.
Implications and concluding remarks
The study confirms and estimates the ability-age andability-sex associations amongst those 65 years old andover. Applying the findings in Table 3 to populationestimates and projections [40] results in lowerestimates of the numbers (and percentage) of severelydisabled over-65-year-olds in the UK in 1992, 2011,2031 and 2051 respectively of 1.0 million (1.7%), 1.2million (2.0%), 1.7 million (2.7%) and 2.1 million (3.5%)compared with upper estimates of 1.2 million (2.1%),1.5 million (2.5%), 2.1 million (3.3%) and 2.5 million(4.3%).
AcknowledgementsThe MRC CFAS is funded by the Medical ResearchCouncil and the Department of Health. We acknowl-edge the help of B. Ackerley, J. Brooks, V. Gilgeous, L.Hughes, V. Jackson, J. Pollock, A. Scott, all the liaisonofficers and interviewers, members of the steeringcommittee, MRC personnel, and other study members.We thank the Family Health Service Authorities, thegeneral practitioners, their staff and the participants fortheir help and co-operation. M.A.M. also thanks T.McGee for all his assistance.
Key points• In a large, geographically dispersed, stratified,
random sample (n= 13009), the self-reportedTownsend's disability scale shows good reliabilityand validity.
• The frequency of disability increases with age andwith certain socio-demographic characteristics.
• Projections of the number (and percentage) ofseverely disabled over-65-year-olds in the UK in2011 and 2051 are 1.4 million (2.2%) and 2.3million (3-9%) respectively.
References
1. Hunt A. The Elderly at Home. London: HMSO, 1978.
2. Clarke M. Problems of the elderly: an epidemiologicalperspective. J R Coll Phys Lond 1984; 18: 128-31.
3- Report of the Royal College of Physicians. PhysicalDisability in 1986 and Beyond. J R Coll Physicians Lond1986; 20: 160-94.
4. OPCS. The General Household Survey 1986. London:HMSO, 1989.
5. Martin J, Meltzer H, Elliot D. OPCS Survey of Disability inGreat Britain. London: HMSO, 1988.
6. Applegate WB, Blass JP, Williams TF. Instruments for thefunctional assessment of older patients. N Engl J Med 1990;322: 1207-14.
7. Fontera WR, Hughes VA, Lutz KJ, Evans WJ. A cross-sectional study of muscle strength and mass in 45- to 78-yr-oldmen and women. J Appl Physiol 1991; 71: 644-50.
8. Saunders PA, Copeland JRM, Dewey ME, Larkin BA, ScottA. Alpha: the Liverpool MRC study of the incidence ofdementia and cognitive decline. Neuroepidemiology 1992;11 (suppl. 1): 44-7.
9. The Medical Research Council Cognitive Function andAgeing Study. Cognitive function and dementia in six areas ofEngland and Wales: the distribution of MMSE and prevalenceof GMS organicity level in the MRC-CFAS study. Psychol Med1998;28: 319-55.
10. Townsend P. The Last Refuge. London: Roudedge andKegan Paul, 1962.
11. Shanas E, Townsend P, Wedderburn D, Friis H, Milhoj P,Stehouwer J. Old people in three industrial societies. London:Roudedge and Kegan Paul, 1968.
12. Sainsbury S. Measuring Disability. London: Bell, 1973.
13. Townsend P. Poverty in the United Kingdom. Harmonds-worth: Pelican, 1979.
14. Bond J, Carstairs V. Services for the Elderly. Edinburgh:Scottish Health Service Studies, no.42, 1982.
15. Folstein MF, Folstein S, McHugh PR. Mini Mental StateExam: a practical method for grading the cognitive state ofpatients for clinicians. J Psychiatr Res 1975; 12: 189-98.
612
Dow
nloaded from https://academ
ic.oup.com/ageing/article/27/5/605/36432 by guest on 02 February 2022

The MRC Cognitive Function and Ageing Study
16. Breslow NE, Day NE. Statistical Methods in CancerResearch. Volume 1: The analysis of case-control studies.Lyon, France: International Agency for Research on Cancer,1980.
17. SAS Institute Inc. SAS Technical Report P-243: SAS/STATSoftware: The GENMOD Procedure. Cary, NC: SAS 1993.
18. Marriot FHC. A Dictionary of Statistical Terms, fifthedition. Hariow: Longman, 1990.
19. Bias P, Halstead K, Prandy K. Computer AssistedStandard Occupational Coding. London: HMSO, 1994
20. Carmines EG, Zeller RA. Reliability and validity assess-ment. In: Lewis-Beck MS ed. Basic Measurement, InternationalHandbooks on Quantitative Applications in the SocialSciences, Volume 4. London: Sage, 1994: 1-47.
21. SAS Institute Inc. SAS Procedures Guide. Cary, NC: SAS,1991.
22. SAS Institute Inc. SAS Guide to Macro Processing. Cary,NC: SAS, 1990.
23. Manton KG. A longitudinal study of functional changeand mortality in the United States. J Gerontol 1988; 43: 153-61.
24. Seeman TE, Charpentier PA, Berkman LF et al Predictingchanges in physical perfromance in a high-functioning elderlycohort: McArthur studies of successful ageing. J Gerontol1994;49:M97-108.
25. Katz S, Branch LG, Branson NH et aL Active lifeExpectancy. N Engl J Med 1983; 309: 1218-23-
26. Grimley Evans J. Can we live to be a healthy hundred?MRC News 1994; Aug: 18-21.
27. Grimby G. Physical activity and effects of muscle trainingin the elderly. Ann Clin Res 1988; 20: 62-6.
28. Grimby G. Physical activity and muscle training in theelderly. Acta Med Scand Suppl 1986; 711: 233-7.
29- Bergstrom G, Aniansson A, Bjelle A, Grimby G, Lundgren-Iindquist B, Svanborg A. Functional consequences of jointimpairment at age 79. Scand J Rehabil Med 1985; 17: 183-90.
30. Ensrud KE, Nevitt MC, Yunis C et aL Correlates ofimpaired function in older women. J Am Geriatr Soc 1994; 42:481-9.
31. Posner JD, McCully KK, Landsberg LA et al. Physicaldeterminants of independence in mature women. Arch PhysMed Rehabil 1995; 76: 373-80.
32. Vogt MT, Cauley JA, Kuller LH, Nevitt MC. Functionalstatus and mobility among elderly women with lowerextremity arterial disease: the Study of Osteoporotic Frac-tures. J Am Geriatr Soc 1994; 42: 923-9.
33- Branch LG, Meyers AR. Assessing physical function in theelderly. Clin Geriatr Med 1987; 3: 29-51.
34. Diggle PJ, Liang KY, Zeger SL. Appendix A. In: Analysis ofLongitudinal data. New York: Oxford University Press, 1995.
35. Armstrong BK, White E, Saracci R. Principles ofExposure Measurement in Epidemiology. New York: OxfordMedical Publications, 1992.
36. Bowling A. Measuring Health: A review of quality of lifemeasuremant scales. Milton Keynes: Open University Press,1991.
37. Kelly-Hayes M, Jette AM, Wolf PA, D'Agostino RB, OdellPM. Functional limitations and disability among elders in theFramington study. Am J Public Health 1992; 82: 841-5.
38. Goldstein MZ. Evaluation of the elderly patient. In:Bienenfeld D ed. Verwoerdt's Clinical Geropsychiatry, 3rdedition. Baltimore, MD: Williams and Wilkins, 1990: 47-57.
39- Kemp BJ, Mitchell J. Functional assessment in geriatricmental health. In: Birren JE, Sloane RB, Cohen GD, eds.Handbook of Mental Health and Aging, 2nd editon. SanDiego, CA: Academic Press, 1992: 672-94.
40. OPCS. National Population Projections, 1992 based.Series PP2, no. 19. London: HMSO, 1995.
Received 5 July 1997; accepted 18 September 1997
Appendix: study personnelStudy management groupT. Arie, J. Bond, C. Brayne, J. R. M. Copeland, N. E. Day,M. Devakumar, M. E. Dewey, M. Esiri, O. Goddard, B.Gregson, J. Grimley Evans, F. A. Huppert, M. Jepson, A. LJohnson, D. W. K. Kay, C. McCracken, I. McKeith, K. Morgan,J. Morris, C. Parker, E. S. Paykel, N. Walker
National coordinatorsC. McCracken, G. P. Slegg
Centre coordinators and principal investigatorsC. Brayne, F. A. Huppert, J. Nickson, E. S. Paykel (Cambridge),J. R. M. Copeland, M Devakumar, M. E. Dewey, S.Jones-Evans(Gwynedd), J. R. M. Copeland, M. E. Dewey, P. McKibbin,P. Saunders (Liverpool), A. Fairbairn, S. Hrisos, J. IUing,D. W. K. Kay, I. McKeith (Newcastle), T. Arie, J. Levings,K. Morgan, C. Parker (Nottingham), J. Grimley Evans, O.Goddard (Oxford)
MRC Biostatistics UnitC.Gill, A. L.Johnson, D. Mathewson, M. A. McGee.J. Nickson,N. Walker
Analysis subcommitteeC. Brayne, J. R. M. Copeland, N. E. Day, M. E. Dewey, C. Gill,B. Gregson, F. A. Huppert,J. IUing, A. L.Johnson, D. W K. Kay,D. Mathewson, C. McCracken, M. A. McGee, K. Morgan,J. Nickson, C. Parker, E. S. Paykel, N. Walker
Instrument subcommitteeJ. Bond, C. Brayne, J. R. M. Copeland, M. E. Dewey, C. Gill,B. Gregson, J. Grimley-Evans, F. A. Huppert, A. L. Johnson,D. W. K. Kay, C. McCracken, I. McKeith, K. Morgan, N. Walker
613
Dow
nloaded from https://academ
ic.oup.com/ageing/article/27/5/605/36432 by guest on 02 February 2022
Milap Day Centre, Southhall. © Brenda Prince/Format.
Dow
nloaded from https://academ
ic.oup.com/ageing/article/27/5/605/36432 by guest on 02 February 2022


![[Slideshare] tafaqqahu-(2015)-#2 -daily-application-(five-principles)-(31-january-2015)](https://img.pdfslide.net/doc/110x75/55a5dd9e1a28ab79558b45b2/slideshare-tafaqqahu-2015-2-daily-application-five-principles-31-january-2015.jpg)