Embed Size (px)
Citation preview

THE DETERMINANTS OF AUDIENCE
GRATIFICATION TOWARDS DIGITAL BILLBOARDS
BY
KOH YI LUAN
LOK CHUAN MING
SYED HASIF BIN SYED HEZER
A researchproject submitted in partial fulfillment of the
requirement for the degree of
BACHELOR OF INTERNATIONAL BUSINESS (HONS)
UNIVERSITI TUNKU ABDUL RAHMAN
FACULTY OF ACCOUNTANCY AND MANAGEMENT
DEPARTMENT OF INTERNATIONAL BUSINESS
NOVEMBER 2014

Determinants of Audience Gratification Towards Digital Billboards
II
Copyright @ 2014
ALL RIGHTS RESERVED. No part of this paper may be reproduced, stored in a
retrieval system, or transmitted in any form or by any means, graphic, electronic,
mechanical, photocopying, recording, scanning or otherwise, without the prior
consent of the authors.

Determinants of Audience Gratification Towards Digital Billboards
III
DECLARATION
We hereby declare that:
(1) This undergraduate research project is the end result of our own work and that due
acknowledgement has been given in the references to ALL sources of information be
they printed, electronic, or personal.
(2) No portion of this research project has been submitted in support of any
application for any other degree or qualification of this or any other university, or
other institutes of learning.
(3) Equal contribution has been made by each group member in completing the
research project.
(4) The word count of this research report is 14,341.
Name of student: Student ID: Signature:
1. Koh Yi Luan 11UKB01348
2. Lok Chuan Ming 11UKB07426
3. Syed Hasif 09UKB04430
Date: 27th
November 2014

Determinants of Audience Gratification Towards Digital Billboards
IV
ACKNOWLEDGEMENTS
“An investment in knowledge always pays the best interest.”
- Benjamin Franklin
We would like to dedicate this quote to University Tunku Abdul Rahman (UTAR) for
providing us the opportunity to undertake UKMZ3016 Research Project as we have
gained new knowledge and intellectual skills in studying the topic of interest. We are
also grateful for the accessible abundance of resources facilitated by the university.
Besides, this research is beneficial not only to our interest but also allows us to
contribute the knowledge to society and future researchers.
We wish to thank our dearest supervisor, Dr. Sia Bee Chuan for her patience and
guidance in achieving our objectives during the course of this research project.
Moreover, she has given us the freedom and time to explore the topic. Without her
trust and confidence in our group, it would be difficult to make this project possible.
Moving on, we would like to express our gratitude to our friends and family for
sharing ideas and giving us valuable suggestions especially during the beginning of
the project. We also deeply appreciate their support and motivation throughout the
project.
Lastly, we sincerely appreciate the cooperation of anonymous respondents that
attended our survey and we are thankful for them to spend precious time to answer
each and every one of our questions.
Determinants of Audience Gratification Towards Digital Billboards
V
TABLE OF CONTENTS
Page
Copyright Page...........................................................................................ii
Declaration.................................................................................................iii
Acknowledgement.....................................................................................iv
Table of Contents......................................................................................v
List of Tables............................................................................................x
List of Figures.......................................................................................... xi
List of Appendices...................................................................................xii
Preface.....................................................................................................xiii
Abstract....................................................................................................xiv
CHAPTER 1 RESEARCH OVERVIEW
1.0 Introduction........................................................................ 1
1.1 Research Background.................................................. 1
1.2 Problem Statement........................................................ 3
1.3 Research Objectives...................................................... 4
1.3.1 General Objectives............................................. 4
1.3.2 Specific Objectives............................................. 4
1.4 Research Questions........................................................ 5
1.5 Hypotheses of the Study................................................. 5
1.6 Significance of the Study................................................ 6
1.7 Chapter Layout................................................................ 7
1.8 Conclusion...................................................................... 8
Determinants of Audience Gratification Towards Digital Billboards
VI
CHAPTER 2 LITERATURE REVIEW
2.0 Introduction..................................................................... 9
2.1 Review of Literature....................................................... 9
2.1.1 Technology Acceptance Model......................... 9
2.1.1.1 Digitalization…................................... 10
2.1.1.2 Informativeness................................... 12
2.1.1.3 Irritation............................................... 13
2.1.1.4 Credibility............................................ 15
2.1.2 Uses and Gratification Theory................................ 16
2.2 Review of Relevant Theoretical Models......................... 18
2.3 Proposed Theoretical/Conceptual Framework................ 19
2.4 Hypotheses Development................................................ 20
2.4.1 Relationship between Digitalization and
Audience Gratification.......................................... 20
2.4.2 Relationship between Informativeness and
Audience Gratification.......................................... 21
2.4.3 Relationship between Irritationand
Audience Gratification.......................................... 23
2.4.4 Relationship between Credibility and
Audience Gratification.......................................... 24
2.5 Conclusion......................................................................... 25
CHAPTER 3 METHODOLOGY
3.0 Introduction……………………………………………......... 26
3.1Research Design…………………………………………..….. 26
3.2 Data Collection Methods………………………………......... 27
Determinants of Audience Gratification Towards Digital Billboards
VII
3.2.1Primary Data Collection…………………………... 27
3.2.2 Secondary Data Collection…………………….... 28
3.3 Sampling Design…………………………………………... 28
3.3.1 Target Population………………………………….. 28
3.3.2 Sampling Frame and Sampling Location……..…… 29
3.3.3 Sampling Elements………………………..……...... 29
3.3.4 Sampling Techniques………………………………. 30
3.3.5 Sampling Size………………………………………. 30
3.4 Research Instrument…………………………………………. 30
3.4.1 Questionnaire Design………………………………. 30
3.4.2 Pilot Test………………………………………….... 31
3.5 Constructs Measurement…………………………………….. 32
3.5.1 Nominal Scale…………………………………..…. 32
3.5.2 Interval Scale………………………………..……... 32
3.5.3 Ordinal Scale…………………………………..…... 33
3.6 Data Processing………………………………………..……. 33
3.6.1 Data Checking………………………………..……. 34
3.6.2 Data Editing………………………………..………. 34
3.6.3 Data Coding…………………………………..……. 34
3.6.4 Data Transcribing………………………….………. 35
3.6.5 Data Cleaning……………………………………… 35
3.7 Data Analysis………………………………………...….….. 35
3.7.1 Descriptive Analysis………………………………. 36
3.7.2 Scale Measurement…………………………...…… 36
3.7.2.1 Reliability Test………………………….…... 37
3.7.3 Inferential Analysis…………………………...…… 37
3.7.3.1 Pearson Correlation Coefficient Test……….. 38
3.7.3.2 Multiple Regressions Analysis………..……. 38
3.8 Conclusion……………………………………………..…… 39
Determinants of Audience Gratification Towards Digital Billboards
VIII
CHAPTER 4 DATA ANALYSIS
4.0 Introduction………………………………………………… 40
4.1 Descriptive Analysis…………………………………….…. 40
4.1.1 Respondent Demographic Profile…………….…….. 40
4.1.2 Central Tendencies Measurement of Constructs......... 49
4.2 Scale Measurement………………………………………… 52
4.2.1 Reliability Analysis………………………………. 52
4.3 Inferential Analysis………………………………………... 53
4.3.2 Pearson Correlation Analysis……………………... 54
4.3.3 Multiple Regression Analysis……………………... 55
4.3.3 Test of Significant………………………………… 57
4.4 Conclusion………………………………………...………. 59
CHAPTER 5 DISCUSSION, CONCLUSION AND IMPLICATION
5.0 Introduction………………………………………….……….. 60
5.1 Summary of Statistical Analyses…………………………….. 60
5.1.1 Descriptive Analyses………………………………… 60
5.1.2 Scale Measurement…………………………………... 61
5.1.2.1 Reliability Analysis…………………………… 61
5.1.3 Inferential Analysis…………………………………… 61
5.1.3.1 Pearson Correlation Analysis…………………. 61
5.1.3.2 Multiple Regression Analysis…………………. 62
5.2 Discussion of Major Findings……………………………….. 63
Determinants of Audience Gratification Towards Digital Billboards
IX
5.2.1 Digitalization………………………………………... 64
5.2.2 Informativeness………………………………………. 65
5.2.3 Irritation………………………………………………. 66
5.2.4 Credibility…………………………………………….. 67
5.3 Implications of Study…………………………………………. 69
5.3.1 Managerial Implication………………………..……… 69
5.3.1.1 Digitalization……………………………..……. 69
5.3.1.2 Informativeness…………………………..……. 70
5.3.1.3 Irritation……………………………………..…. 71
5.3.1.4 Credibility………………………………..…….. 72
5.4 Limitations of Study……………………………………..……. 72
5.5 Recommendations for Future Research………………..……… 74
5.6 Conclusion……………………………………………….……. 75
Determinants of Audience Gratification Towards Digital Billboards
X
LIST OF TABLES
Page
Table 3.1 Rules of Thumb about Correlation Coefficient…………….. 38
Table 4.1 Gender………………………………………………………. 41
Table 4.2 Age............................................................................................ 42
Table 4.3 Race........................................................................................... 43
Table 4.4 Education Level……………………………..……………… 44
Table 4.5 Employment Status……………………………….………… 45
Table 4.6 My thoughts while viewing the ad were………….…..……… 46
Table 4.7 Advertising on outdoor digital billboard…………….....……. 47
Table 4.8 Advertising on outdoor digital billboards…………….……… 48
Table 4.9 The advertisements I saw were…………………………...…. 49
Table 4.10 Central Tendencies Measurement of Constructs.................... 49
Table 4.11 Reliability Statistics for Pilot Test (n=50)……………..…… 52
Table 4.12 Reliability Statistics (n=254)………………………………. 53
Table 4.13 Correlation…………………………………………………. 54
Table 4.14 Model Summary…………………………………………… 55
Table 4.15 ANOVA……………………………………………………. 56
Table 4.16 Coefficients.............................................................................. 56
Table 5.1 Summary of Research question, Hypothesis and Result……. 63
Determinants of Audience Gratification Towards Digital Billboards
XI
LIST OF FIGURES
Page
Figure 2.1 Theoretical Model of Assessing
Audiences’ Satisfaction of Advertising
Digital-Billboard: A U&G Theoretical Perspective…………………… 18
Figure 2.2Proposed Conceptual Frameworks for
Determinants of Digital Billboards that Influences Audience’s Attitude.... 19, 68
Figure 4.1 Gender……………………………………………………… 40
Figure 4.2 Age………………………………………………………… 41
Figure 4.3 Race………………………………………………………… 42
Figure 4.4 Education Level……………………………………………. 43
Figure 4.5 Employment Status………………………………………… 44
Figure 4.6 My thoughts while viewing the ad were……………………. 45
Figure 4.7 Advertising on outdoor digital billboard……………………. 46
Figure 4.8Advertising on outdoor digital billboard…………………….. 47
Figure 4.9 The advertisements I saw were…………….………………… 48

Determinants of Audience Gratification Towards Digital Billboards
XII
LIST OF APPENDICES
APPENDIX A –Survey Questionnaires
APPENDIX B – SPSS Output
Determinants of Audience Gratification Towards Digital Billboards
XIII
PREFACE
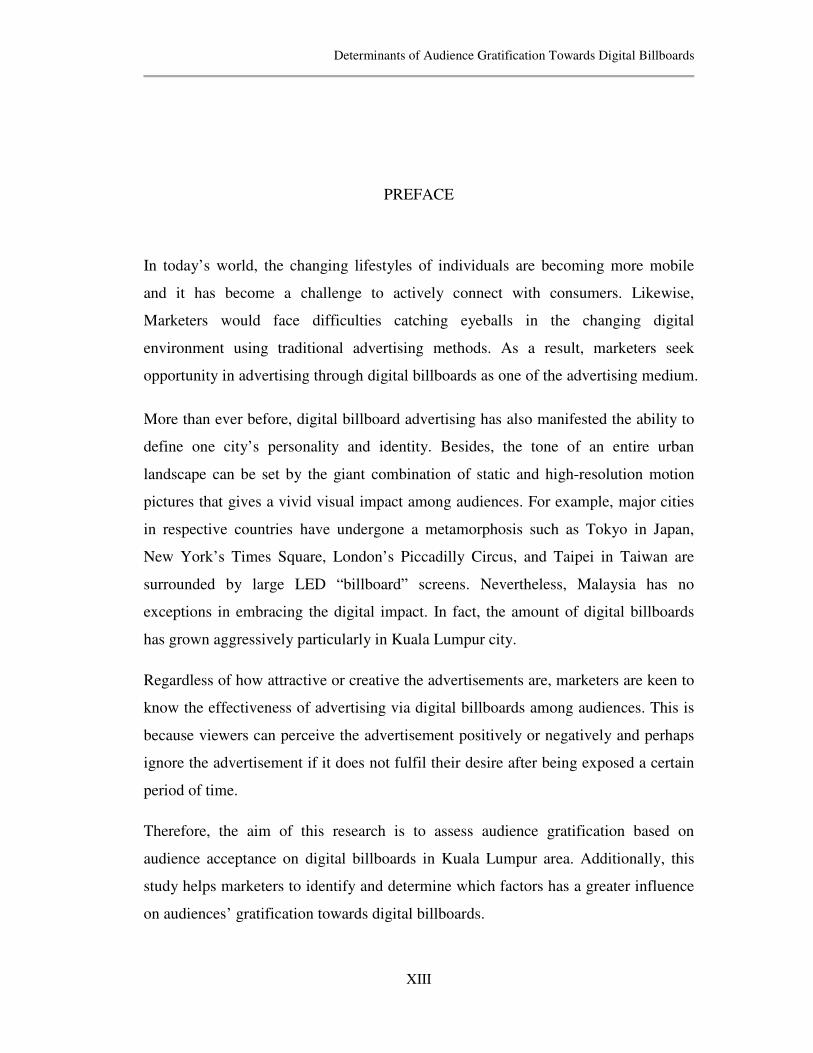
In today’s world, the changing lifestyles of individuals are becoming more mobile
and it has become a challenge to actively connect with consumers. Likewise,
Marketers would face difficulties catching eyeballs in the changing digital
environment using traditional advertising methods. As a result, marketers seek
opportunity in advertising through digital billboards as one of the advertising medium.
More than ever before, digital billboard advertising has also manifested the ability to
define one city’s personality and identity. Besides, the tone of an entire urban
landscape can be set by the giant combination of static and high-resolution motion
pictures that gives a vivid visual impact among audiences. For example, major cities
in respective countries have undergone a metamorphosis such as Tokyo in Japan,
New York’s Times Square, London’s Piccadilly Circus, and Taipei in Taiwan are
surrounded by large LED “billboard” screens. Nevertheless, Malaysia has no
exceptions in embracing the digital impact. In fact, the amount of digital billboards
has grown aggressively particularly in Kuala Lumpur city.
Regardless of how attractive or creative the advertisements are, marketers are keen to
know the effectiveness of advertising via digital billboards among audiences. This is
because viewers can perceive the advertisement positively or negatively and perhaps
ignore the advertisement if it does not fulfil their desire after being exposed a certain
period of time.
Therefore, the aim of this research is to assess audience gratification based on
audience acceptance on digital billboards in Kuala Lumpur area. Additionally, this
study helps marketers to identify and determine which factors has a greater influence
on audiences’ gratification towards digital billboards.
Determinants of Audience Gratification Towards Digital Billboards
XIV
ABSTRACT
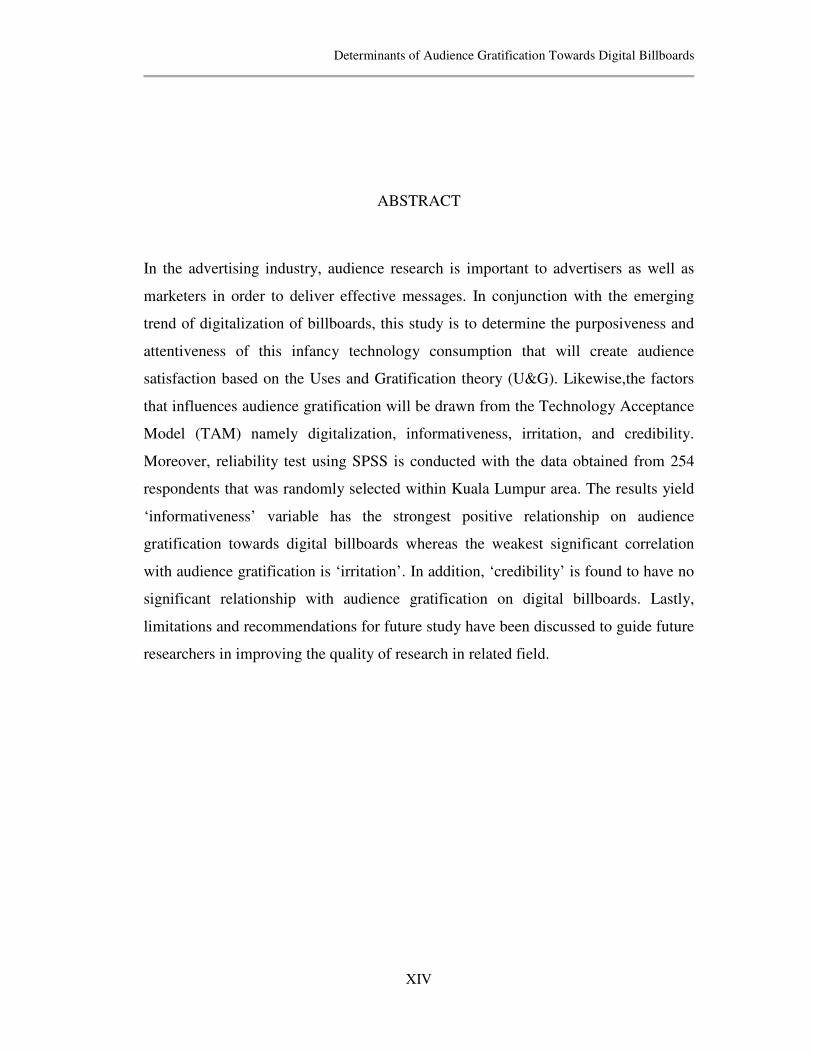
In the advertising industry, audience research is important to advertisers as well as
marketers in order to deliver effective messages. In conjunction with the emerging
trend of digitalization of billboards, this study is to determine the purposiveness and
attentiveness of this infancy technology consumption that will create audience
satisfaction based on the Uses and Gratification theory (U&G). Likewise,the factors
that influences audience gratification will be drawn from the Technology Acceptance
Model (TAM) namely digitalization, informativeness, irritation, and credibility.
Moreover, reliability test using SPSS is conducted with the data obtained from 254
respondents that was randomly selected within Kuala Lumpur area. The results yield
‘informativeness’ variable has the strongest positive relationship on audience
gratification towards digital billboards whereas the weakest significant correlation
with audience gratification is ‘irritation’. In addition, ‘credibility’ is found to have no
significant relationship with audience gratification on digital billboards. Lastly,
limitations and recommendations for future study have been discussed to guide future
researchers in improving the quality of research in related field.
Determinants of Audience Gratification Towards Digital Billboards
Page 1 of 76
CHAPTER 1: RESEARCH OVERVIEW
1.0 Introduction
This research aims to identify the elements of audience gratification of digital
billboards in Kuala Lumpur. The main areas emphases are on research background,
problem statements, research questionsand research objectives, significance of the
study, chapter layout and summary of the overall project.
1.1 Research background
According to Outdoor Advertising Association of America (OAAA), 2014 revealed
that the Out of home (OOH) advertising is the second-fastest growing marketing
medium next to Internet in the advertising industry. OOH advertising is also known
as outdoor advertising with numerous standard advertising formats that are exposed
to audiences outside from home. OOH comprises of four major categories, namely
billboards, transit, street furniture, and alternative whereby billboards account the
largest percentage of industry revenue among the categories in the United
States.Billboards include bulletins, digital billboards, posters, junior posters,
walls/spectaculars.
Billboards are one of the long-lasting medium segments and haveevolved to digital
billboards (Adetunji & Yazam, 2012) for it is flexible and fluid among advertisers.In
addition, digital billboards are considerably more economical and interactive than
Determinants of Audience Gratification Towards Digital Billboards
Page 2 of 76
traditional print billboards (Adetunji & Yazam, 2012 as cited in Michael, 2011). It is
reported in recent studies that billboards are gradually replaced by digital displays
andthe number of digital billboards implementation is increasing especially in major
cities like Hong Kong, New York, and Kuala Lumpur.
In the United States, individuals with the age of 18 or older reportedly spend more
than 70 percent of their waking hours outdoor which advertisers will face challenge in
gaining viewer’s attention if by relying mainly or heavily on conventional printed
billboards to deliver message (Outdoor Advertising Association of America, Inc.
(oaaa), 2014). Similarly, printed advertisements on billboards cannot be changed as
often as digital billboards hence; frequent viewing of the same advertisements by
audience will cause intention to avoid or ignore the advertisement.Thus, the influence
of technology has not only dramatically increase the efficiency of tracking the
advertisements projected on digital billboards by marketers but also improved the
displays on digital billboards in terms of increase in amount of information, motions
and quality in attracting audience’s attention (Lopez-Pumarjo & Bassell, 2009).
In the academic and practical industries of mass media and communications, audience
research is important to advertisers (Winmer & Dominick, 2011) in determining the
audiences’ satisfaction of the advertising medium as well as the degree of reception
of the message received by audience (Adetunji & Yazam, 2012).This is because
audience can choose to ignore or receive any messages they desire (Saudat & Ridwan,
2012) and process messages negatively or positively by the message developer
(Thompson, 1993) regardless of how persuasive or influential the media messages are.
Various studies adopted Technology Acceptance Model to investigate audience’s
attitude and willingness of accepting digital billboards (Lee & Lan, n.d.) and to
understand how media and its messages are able to satisfy different audiences based
on the uses and gratification theory (Adetunji & Yazam, 2012 as cited in Whitaker,
Ramsey & Smith, 2004).Therefore, with the developing trend of advertising on digital
billboards, it is necessary to determine audiences’ gratificationstowards digital
billboards with the influential variablesdrawn from the Technology Acceptance
Model.
Determinants of Audience Gratification Towards Digital Billboards
Page 3 of 76
1.2 Problem Statement
Digital billboards have the ability to captivate large audiences and generate high
recall rates due to repeated displays among audiences (Frost & Sullivan, 2010). For
example, PowerScreen Malaysia, Malaysia’s LED Digital Out-of-Home Network in
Market Centres throughout Malaysia, revealed that each advertisement has 1,300
exposures per day in 12 selected locations with a minimum 39,000 exposures per
month. Based on Q2’11 Nielsen Media index July 2010- June 2011 (NMR),
advertisements can reach out to 4.45 million viewers monthly. Thus, marketers can
maximize their opportunities in this changing advertising medium – digital billboard.
On the contrary, Lee &Lan (2010) cited that advertising through digital signage has a
low acceptance rate among viewers in Taiwanbecause the transformational impact of
digital signage is still in its infancy (as cited in Lee & Chang, 2009). In 2014, up to
4,400 billboards have been replaced by digital (LED) displays which is only 1 percent
of the total number of billboards in the United States (Outdoor Advertising
Association of America, Inc. (oaaa), 2014).In the study of Asian Digital Media
Landscape, The Nielsen Company (2012) reported that as low as 1.1 percent of
advertising expenditure goes towards outdoor advertising in Malaysia as compared to
40.3 percent of advertising expenditure on local newspapers based on Nielsen
Southeast Asia Advertising Index 2011. Likewise, the number of digital billboards is
increasing but at a very slow rate.
Other than that, the study on uses and gratification theory and Technology
Acceptance Model on digital billboards is rather limited in examining individuals
concerns towards the development of this new technology. The statement is further
supported in a research by Adetunji & Yazam (2012).
In short, marketers foresee the advantages of advertising through digital billboards;
however, there is a possibility of slow growth of digital billboards in terms of
numbers as well as advertising expenditure is influenced by audience’s acceptance of
Determinants of Audience Gratification Towards Digital Billboards
Page 4 of 76
the new technology. Therefore, this research is to determine which variable has
significant impact on audience gratification on digital billboards which include
digitalization, informativeness, irritation, and credibility.
1.3 Research Objective
The research objective can be divided into two sections which are general objective
and specific objectives.
1.3.1 General Objective
The purpose of this research is to understand the overall determinants of digital
advertising that influences audience’s attitude. This study aims to assess the
relationship between the four identified variables (digitalization, informativeness,
irritation and credibility) towards audience gratification on digital billboards
advertising. The specific objectives of the research are developed as follow:
1.3.2 Specific Objectives
1. To examine the relationship between digitalization and audience
gratification on digital billboards advertising.
Determinants of Audience Gratification Towards Digital Billboards
Page 5 of 76
2. To examine the relationship between informativeness and audience
gratification on digital billboards advertising.
3. To examine the relationship between irritation and audience
gratification on digital billboards advertising.
4. To examine the relationship between credibility and audience
gratification on digital billboards advertising.
1.4 Research Questions
The study conducted will attempt to answer the following questions:
1. Does digitalization influences audiences’ gratification towards digital
billboards?
2. To what extent the informativeness of digital billboards influence the
audiences’ gratification?
3. Are audiences experiencing or addressing irritation issues fromdigital
billboards?
4. Do audiences perceive credibility in advertisements displayed on digital
billboards?
1.5 Hypotheses of the Study
H1: There is a significant relationship between digitalization and audience
gratification on digital billboards.
Determinants of Audience Gratification Towards Digital Billboards
Page 6 of 76
H2: There is a significant relationship between informativeness and audience
gratification on digital billboards.
H3: There is a negative relationship between irritation and audience gratification on
digital billboards.
H4: There is a significant relationship between credibility and audience gratification
on digital billboards.
1.6 Significance of the Study
This research is to emphasize the factors that influence audiences’ gratification
towards digital billboards in Kuala Lumpur. The following relational elements are
digitalization, informativeness, irritation, and credibility. By conducting this research,
researchers could identify and evaluate the key factors of accepting digital billboards
that affect audiences’ gratification. Hence, this study would contribute to future
researchers and academicians as a foundation to conduct the study in similar field.
The importance of advertising is to create awareness, to sell products, services, and
delivering ideas to target audience (Edegoh et al., 2013). Therefore, the significance
of this study would help marketers to ensure advertising messages are displayed and
delivered effectively in the market with the identification of audience’s perception on
the emerging digital billboard advertising medium. In addition, the results and
implications of this research would be useful not only to marketers but also relevant
organizations that have the interest to deliver message via digital billboards. By
providing a clearer insight of audience gratification on digital billboards, users would
also find this research to be suitable in the process of decision-making and improving
advertising strategy as the appropriate advertising channel may help toincrease
competitive advantages as well as to create awareness to the right target audience
Determinants of Audience Gratification Towards Digital Billboards
Page 7 of 76
effectively. Therefore,marketers would benefit from this study in making the most
strategic advertising decision.
1.7 Chapter Layout
Chapter 1: Introduction
This chapter is to provide the general view of the research project. This chapter
includes background of the research, problem statement, research objectives, research
questions, hypotheses and significance of the research study.
Chapter 2: Literature Review
This chapter is focusing on reviewing the literature from articles and journals that are
published by other researchers. This literature review is to provide clearer view on the
variables that are relevantto this research. It describes the determinants of audiences’
gratification in digital billboards. The independent variables for this research can be
found through literature review which includes digitalization, informativeness,
irritation and credibility. Besides, the dependent variable for this research is
audiences’ gratification. Conceptual framework is set up and hypotheses development
is further discussed in this chapter.
Chapter 3: Research Method
The overview of research methodology is further discussed in detail in this chapter.
Methodology portrays how the research study has been taken in terms of research
Determinants of Audience Gratification Towards Digital Billboards
Page 8 of 76
design, data collection methods, sampling design, research instrument, constructs
measurement, data processing and data analysis.
Chapter 4: Data Analysis
This chapter reviews the analysis of the results that are gathered through
questionnaires. Descriptive analysis, scale measurement and inferential analysis are
carried out with Statistical Package of the Social Science (SPSS) program.
Chapter 5: Discussion and Conclusion
This chapter sums up all previous chapters and provides suggestions on future
research. The details that are discussed in this chapter are the summary of statistical
analyses, discussions of major findings, implication for managerial, limitations of the
research and the recommendations for future research.
1.8 Conclusion
All in all, the chapter review provides an overall idea of the research project. This
includes the setting of the research, problem statement, the objectives of the research,
research questions, hypotheses and the significance of the research project. The
layout for each chapter is also briefly mentioned in this chapter. The following
chapter will be discussing the literature review of the variables of the research project.
Determinants of Audience Gratification Towards Digital Billboards
Page 9 of 76
CHAPTER 2: LITERATURE REVIEW
2.0 Introduction
This chapter explains the literature review of the determinants of audiences’
gratification in digital billboards which are digitalization, informativeness, irritation,
and credibility based on the Technology Acceptance Model. Each of the variables
will be explained further in this chapter. The purpose of literature review is to identify
the rationale of the research and to provide a complete understanding about the
research project (Mertens, 2010).
2.1 Review of Literature
2.1.1 Technology Acceptance Model
Past studies have studied and investigated the elements of Technology Acceptance
Model (TAM) and have proposed frameworks of the model (Abdul, Thongapani &
Auh, 2014 as cited in Ajzen, 1991; Davis, Bagozzi & Warshaw, 1989). TAM is used
to predict the technology acceptance among potential users and decision makers and
have been empirically supported with considerable theoretical studies by researchers
(Ajzen, 1991; Wu & Lu, 2013). The TAM was defined by Davis (1989) with the uses
of Theory of Reasoned Action (TRA) as a basis to specify the causal link between
Determinants of Audience Gratification Towards Digital Billboards
Page 10 of 76
two key beliefs about innovative technology, perceived usefulness (PU) and
perceived ease of use (PEOU) (FĂDOR, 2014 as cited in Davis, 1989). User’s
acceptance of a new technology depends on the PU which is the primary function
whereby a user believes that using a particular system increases work performance
(Abdul, Thongapani & Auh, 2014; FĂDOR, 2014 as cited in Davis, 1989).
Additionally, PU leads to PEOU as secondary function in which the user perceives
the difficulty or ease of using the particular system. Apart from that, the PU and
PEOU are based, in part, on normative and extrinsic motives (Peng, 2012).
According to Du (2012), frameworks that are proposed from TAM model are usually
emphasized on technology adoption within the organization (Davis, 1989) and have
been used in many general contexts relating to user’s usage and acceptance of
technology (Davis et al., 1989; Venkatesh, 2000). Likewise, TAM is adopted in a
study by Lee &Lan (2010) to investigate the impact of technology acceptance of
digital signage. In this research, influential variablesof audience gratification on
digital billboards aredigitalization, informativeness, irritation, and credibilityare
drawn from the TAM based on past studies.
2.1.1.1 Digitalization of Digital Billboard Advertisement
Rückriem et al. (2011) defined digitalization as a conversion of analog data such as
text, voice, pictures into digital format like videos. The digital information can be
processed, stored, and transmitted through digital tools, circuits, and networks
(Rückriem, Ang-Stein & Erdmann, 2011). Digitalization of billboards acts as a
cutting-edge technology with innovative features that enable banks to market
themselves more effectively and dynamically (Lind, 2008). In this study, it is
applicable to various companies apart from banks. Lind described the digitalization of
billboards advertising to be flexible and fluid in terms of high reach and frequency of
Determinants of Audience Gratification Towards Digital Billboards
Page 11 of 76
audiences, able to provide 24-hour consumer engagement, portrays powerful creative
messages and interactivity, routine scheduling and guaranteed message delivery,
regularly updates creative advertisements according to seasons, price or promotions,
and immediate updates via dynamic content feeds (Lind, 2008; Outdoor Advertising
Association of America, Inc. (oaaa), 2011).
The terms Digitalization and Entertainment are interchangeably used as digitalization
is an extension of entertainment and exciting media among media users according to
Adetunji & Yazam (2012) and Luo (2002) (as cited in Eighmey and McCord, 1998;
Eighmey, 1997). Adetunji & Yazam (2012) also stated that the operationalization of
digitalization from the theoretical stand of entertainment (as cited in Stem
&Zaichokwsky, 1991; Yoo, 2011; and Smock et al., 2011) is applied to befit the
digital billboard’s media genre.
Moving on, digitalization provides more functional vivid indoor and outdoor
advertisements like audio and motion displays to deliver products or services
information to audiences with high-quality resolutions (Tullamn, 2004). Since the
digitalization of billboard advertising, timely digital contents are remotely controlled
through the centralized system via the Internet platform (Raymond, 2005).
Digitalization of billboard advertising has the ability to provide diversity and
variability features to audiences with the convenience of resetting or changing the
contents of the advertisements according to the market conditions (Wilson, 2004;
Lind, 2008).
Wilson (2004) explained that the attractiveness of digital billboard advertisements is a
basis of digitalization and acts as a dynamic multimedia presentation which is able to
attract audiences’ attention and trigger the desire to make purchase immediately. An
article written by Copley (2012) stated that digital billboards are able to project
unlimited amount of images in a short period of time. Moreover, images and videos
shown on digital billboards draw audiences’ attentions to the visuals being displayed
and determined that the advent of technology affects the efficacy of communicative
billboards to reach worldwide whereas, other forms of media are often ignored by
audiences.
Determinants of Audience Gratification Towards Digital Billboards
Page 12 of 76
Over the years, digital billboards have become increasingly acceptable as display
technology in the marketplace (as cited in Home Theater News, 2007). Lind (2008)
stated that “digital billboards are the future of outdoor advertising.”
2.1.1.2 Informativeness in Digital Billboard Advertisement
Qimei (1999) has acknowledged that the factor of informativeness is best defined by:
informative, intelligent, knowledgeable, resourceful, useful, and helpful based on past
studies of print advertisements and TV commercials. According to Luo, 2002 (as
cited in Bauer & Greyser, 1968) suggested that advertisements are considered to have
the ability to provide audience with information and adequate motivations to accept
the ad itself. Ducoffe (1996) adds on that informativeness is the advertising’s ability
to inform and create awareness among consumers of product alternatives in order for
consumers to achieve optimum satisfaction during product or service
purchase.Outdoor billboards serve as a platform of communication and dissemination
of information, to provoke thoughts and ideas, to raise awareness as well as to display
graphical expression effectively (Chien, 2011).
Adetunji & Yazam (2012) explained the transformation stages of billboards
advertising from paper poster to plastic prints, to the wide digitalized screen
projection and the amount of billboard advertisements did not decline functionally
due to the mass communication among audience. Based on Adetunji & Yazam’s
study (as cited in Outdoor Advertising Association of America, Inc. (oaaa), 2011), the
advent of technology enables wide display of advertisements digitally on the latest
digitalized and electronic version of billboards with the means of communication.
Likewise, digital billboards are capable of delivering dynamic messages to large
amount of audiences, providing timely information, news and others that varies on the
location of the digital billboard. Thus, Informativeness is conceptualized to measure
Determinants of Audience Gratification Towards Digital Billboards
Page 13 of 76
the degree of information and the timeliness and promptness of information that the
digital billboards display to the audiences (Adetunji & Yazam, 2012).
Generally, there are two kinds of advertisements presented in many advertisement
literatures determined by audiences’ perspective on advertisements and
advertisements exposure, which are brand building and directional advertising
(Fernandez, 2000). Brand building advertises products or services and is usually
delivered via traditional media such as Newspaper, Radio, TV and others. On the
other hand, directional advertising is by assisting potential consumers to realize
information that is needed. This happens especially when audience is attracted to the
advertisement (Adetunji & Yazam, 2012 (as cited in Fernandez & Rosen, 2000;
Lohse & Rosen, 2001). However, differentiating the types of advertisement has been
a vague debate among researchers in such that brand building is stringently subject to
traditional media whereas, directional advertisement is only for media that is mainly
developed to deliver advertising messages. For example, movie list, yellow pages,
directories and billboards (Wang, 2002). In the case of digital billboards, it is known
as a directional advertising that includes functions of brand building and directional
advertising in conveying messages to audiences (Adetunji & Yazam, 2012).
2.1.1.3 Irritation of Digital Billboard Advertisement
One of the six dimensions of individual reactions towards advertising is irritation
(Wells, Leavitt & McConville, 1971). Aaker and Bruzzone (1985) defines that an
irritating commercial consist of provoking elements, inflict discomfort and temporary
impatience to the audiences. In addition, advertisements that shows product with
unrealistic and false information as well as advertisements that portray physical
discomfort are likely to cause irritation towards the advertisements by viewers.
Determinants of Audience Gratification Towards Digital Billboards
Page 14 of 76
Ducoffe (1996) stated that advertisements that may offend, annoy and insult the
audiences are likely to be classified as irritation to audiences. Besides, majority of the
advertisements do not necessarily relate to the audiences’ needs and this could cause
a sense of negative perception towards advertisements among the audiences.
Moreover, advertisements that are being forced upon the audiences could cause
confusiondistraction, obstruction and discomfort in order to grab attention can be
classified as intrusion which is the main input for irritation (Ducoffe, 1996; Li,
Edwards & Lee, 2002; Zhang, 2000). Stewart and Pavlou (2002) also concluded that
the audiences can be confused, irritated and overwhelmed by excessive
advertisements.
Li, Edwards and Lee (2002) stated that the advertisements could irritate the audiences
when the ads target wrong audiences, have manipulative messages or repetition of
advertisement in a certain period of timeframe. In addition, the advertisement itself
also can be a form of irritation as advertisement is classified as a form of noise in
communication that could cause irritation to environment (Speck and Elliott, 1997).
Similarly, it is also proven that irritation of an advertisement can decrease the overall
effectiveness of the advertisement (Aaker and Bruzzone, 1985).
Besides, irritation of advertisement can also be determined by the degree of the
advertisement design and appearance which appear to be messy and irritating that
causes discomfortto the audiences (Luo, 2002). However, Chien (2011) explained
that any type of advertisement that is transmitted through outdoor billboard can be
considered as annoyance towards natural scenic views which can cause irritation to
the audiences. Besides, Alwitt and Prabhaker (1992) stated that some advertisements
are beneficial to certain audiences and yet irritating and not worthwhile to others.
Determinants of Audience Gratification Towards Digital Billboards
Page 15 of 76
2.1.1.4 Credibility of Digital Billboard Advertisement
Advertising credibility can be defined as ‘the extent to which the consumer perceives
claims made about the brand in the advertisement to be truthful and believable’
(Mackenzie & Lutz, 1989). Mackenzie & Lutz (1989) further explained about
advertising credibility subsystem which includes perceived advertisement claim
discrepancy, advertiser trustworthiness and advertisement credibility are used to
determine the credibility of an advertisement.
Conversely, Varey (2002) defined advertiser credibility as the level of audience
perceives a company to have credible source of information in which the company’s
reputation could affect its advertiser trustworthiness (Jarvenpa and Tractinsky, 1999).
Likewise, credibility in an advertisement is affected by different elements, such as
company’s credibility and bearer of the message (Goldsmith, Lafferty and Newell,
2000).
Besides, celebrities also play an important role in enhancing the credibility of an
advertisement as mentioned by Goldsmith et al. (2000) and the audiences perceived
that celebrities as reliable sources of information about the product or company they
endorse. Celebrities credibility is determined by source-credibility model which the
effectiveness of advertisement is depend on the perceived level of expertise and
trustworthiness related to the endorser (Erdogan. 1999).
Pavlou and Stewart (2000) define advertising credibility as ‘predictability and
fulfillment of implicit and explicit requirements of an agreement’. Ducoffe (1996)
believed that attitude towards advertisement is related to the audiences’ attitude
towards the advertisement characteristics and audiences’ perceived value of the
advertisement. Bauer & Greyser (1968) concluded that advertisement which is placed
on newspaper is perceived to be more credible, reliable and informative compare to
television. Haghirian et al. (2005) stated that an advertisement that has higher
credibility will likely to have higher value which could bring higher impact to the
audiences.Apart from that, advertisement credibility is determined by the

Determinants of Audience Gratification Towards Digital Billboards
Page 16 of 76
advertisement content that portrays important timely information (Balasubramanian et
al., 2002).
2.1.2 Audiences’ gratification based on Uses and Gratification theory
Uses and Gratification theory (U&G) was originally developed by Herta Herzog in
1944 to determine the purposiveness and attentiveness in media consumption
(Adetunji & Yazam, 2012). U&G theory have been widely used in the marketing
literature with the means of accessing individual behavior related to the technology
adoption and usage (Peng, 2012). Sundar & Limperos (2013) explained that
gratifications are conceptualized as “need satisfactions,” which exist when particular
media source is able to provide needs for the individual that match with his/her
expectations rather than on specific features of the media (as cited in Katz, Blumler &
Gurevitch, 1974; Haridakis, 2002).
The assumption of U&G theory is that audiences are goal-directed in terms of
individual behavior, and are known as active media users. Similarly, the audiences
are conscious of the needs and choose the favorable media for attention to satisfy
their communication wants (Katz, Blumler & Gurevitch, 1974; Adetunji & Yazam,
2012).
Adetunji & Yazam (2012) reported that U&G acts as a functionalist theory which can
be applied to articulate audience satisfaction and gratification report towards mass
media (as cited in Eighmey & McCord, 1998; Katz, Blumler & Gurevitch 1974).
Peng (2012) added that factors related to an individual’s choice of the new media can
be explained directly from the U&G model (as cited in Stafford et al., 2004).
Likewise, factors range from utilitarian (functional) to non-utilarian such as
enjoyment, entertainment, and social status. In addition, studies related to media
Determinants of Audience Gratification Towards Digital Billboards
Page 17 of 76
technology that uses U&G theoretical perspective often apply and test dimensions
namely entertainment, informativeness, and irritations (Adetunji & Yazam, 2012 as
cited in Luo 2002).
Quantitative research using the U&G theory traditionally has to fulfill what, where,
and how audience adapt, consume and use mass media. These can be determined by
demographics, usage patterns, rating scales of needs, motivation and satisfaction level
(McQuail, 2001).
Based on a research done by Adtunji & Yazam (2012), relevant components chosen
in the research are digitalization, informativeness, irritation, and location that
influence the gratification of audiences towards digital billboard with the adoption of
U&G theory. Therefore, this study proposes four components namely digitalization,
informativeness, irritation, and credibility to assess the causal effect and relationship
of consumers’ gratification towards digital billboards.
Determinants of Audience Gratification Towards Digital Billboards
Page 18 of 76
2.2 Review of Relevant Theoretical Models
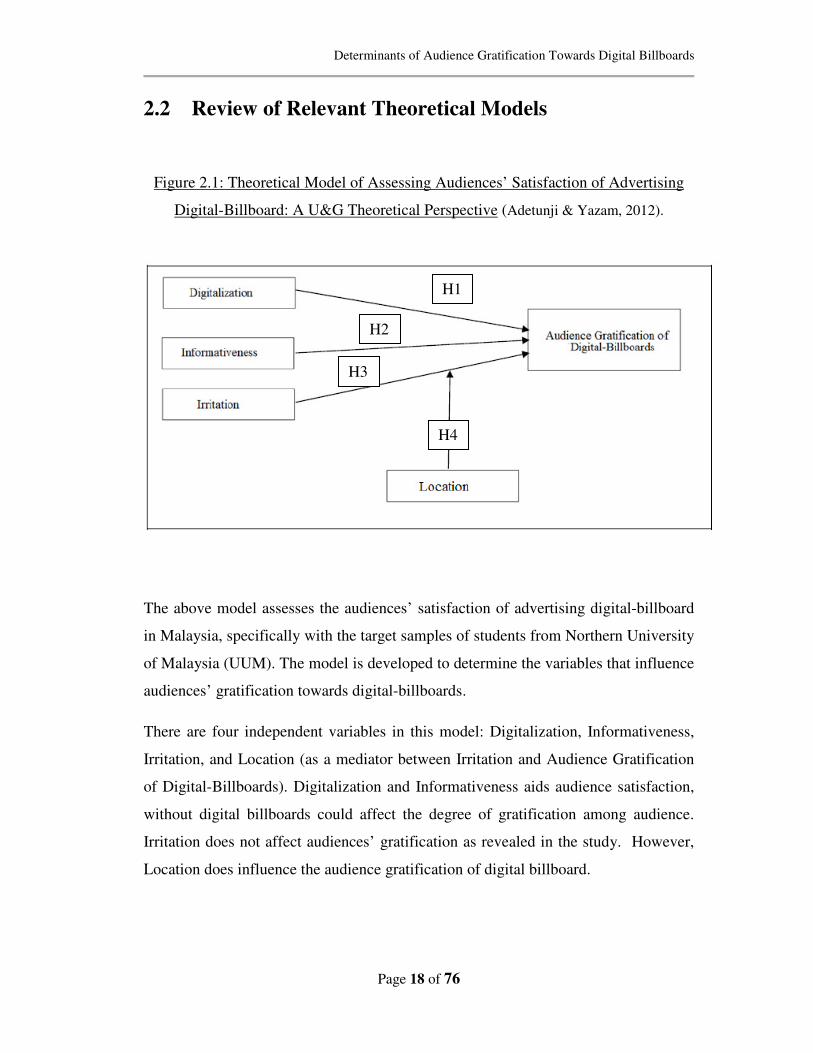
Figure 2.1: Theoretical Model of Assessing Audiences’ Satisfaction of Advertising
Digital-Billboard: A U&G Theoretical Perspective (Adetunji & Yazam, 2012).
The above model assesses the audiences’ satisfaction of advertising digital-billboard
in Malaysia, specifically with the target samples of students from Northern University
of Malaysia (UUM). The model is developed to determine the variables that influence
audiences’ gratification towards digital-billboards.
There are four independent variables in this model: Digitalization, Informativeness,
Irritation, and Location (as a mediator between Irritation and Audience Gratification
of Digital-Billboards). Digitalization and Informativeness aids audience satisfaction,
without digital billboards could affect the degree of gratification among audience.
Irritation does not affect audiences’ gratification as revealed in the study. However,
Location does influence the audience gratification of digital billboard.
H1
H4
H3
H2
Determinants of Audience Gratification Towards Digital Billboards
Page 19 of 76
2.3 Proposed Theoretical/ Conceptual Framework
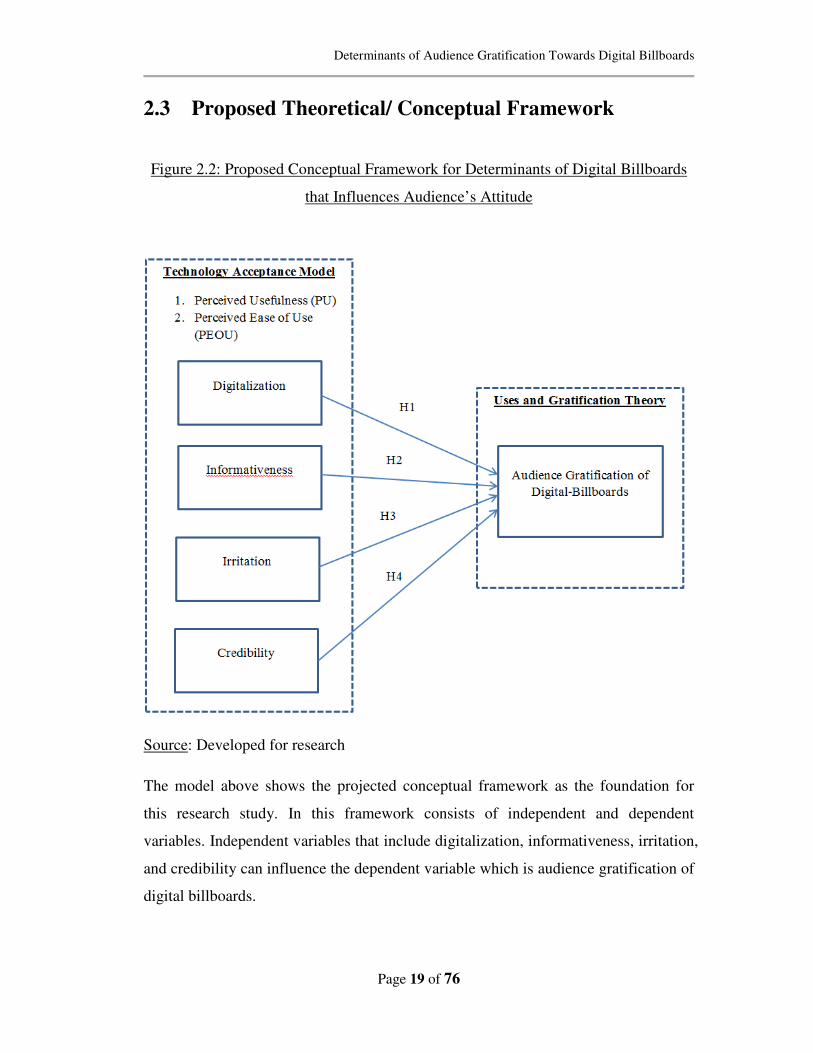
Figure 2.2: Proposed Conceptual Framework for Determinants of Digital Billboards
that Influences Audience’s Attitude
Source: Developed for research
The model above shows the projected conceptual framework as the foundation for
this research study. In this framework consists of independent and dependent
variables. Independent variables that include digitalization, informativeness, irritation,
and credibility can influence the dependent variable which is audience gratification of
digital billboards.
Determinants of Audience Gratification Towards Digital Billboards
Page 20 of 76
2.4 Hypothesis Development
2.4.1 Relationship between digitalization and audience gratification
on outdoor digital advertising.
The term Digitalization and Entertainment are used interchangeably. User and
gratification theorists (U&G theory) revealed that the value of digitalization
entertainment lies in its ability to satisfy users’ needs for escapism, hedonistic
pleasure, aesthetic enjoyment, and/ or emotional relief (Adetunji & Yazam, 2012 as
cited in McQuail, 2001). Similarly, the U&G theory is adopted in studies to access
the variables influencing audiences’ attitude (Qimei & Wells, 1999; MacMillan, 2000;
Luo, 2002). However, Michael (2011) argued that past studies found that the types of
billboard advertising does not relate to audiences’ attitude as audiences are being
exposed to outdoor digital billboard advertisements spontaneously. In other words,
audiences do not have the choice to avoid the advertisements displayed by digital
billboards.
Besides, research based in United States regarding the assessment of digital billboards
is attractive to branding of products, return on investment, and audience exposure
(Adetunji & Yazam, 2012 as cited in Gerba, 2004). Due to the effectiveness of
outdoor digital billboards in the United States, there are laws on road safety that
prohibit the implementation of digital billboards in some areas. Likewise, the
animation features draws driver’s attention and that leads to unsafe driving on the
road.
In Malaysian context, it is reported that Malaysians are satisfied of richer and higher
interactive features provided by digital billboards particularly in crowded cities such
as Kuala Lumpur and Penang. Furthermore, Malaysians found digital billboards
advertisements to be interesting (53%), attractive (63%), and unique (58%) based on
Determinants of Audience Gratification Towards Digital Billboards
Page 21 of 76
a research presented by Malaysian Communication and Multimedia Commission
(SKMM) (2009).
A study revealed that the more entertaining or digitalized media are, the more the
audiences are attracted to as compared to media that is less digitalized. Therefore,
audiences’ gratification on media channels is influenced by the entertainment
provided by the media (Stem & Zaichowsky, 1991).
The hypothesis is forwarded as:
H1: There is a significant relationship between digitalization and audience
gratification on outdoor digital advertising.
2.4.2 Relationship between informativeness and audience
gratification on outdoor digital advertising.
Advertisements are less noticed or processed by the audience due to the competitive
distraction of advertisements and advertisements medium that targets potential
audiences frequently (Borgart, 1985). Similarly, Interrupted attention, lack of time,
and lack of creativity are constraints that lead advertisements to be less valued and
less informative that is ineffective (Adetunji & Yazam, 2012). The constraints stated
are however insufficient to undermine the informativeness of advertisements and ads
media informativeness (Wang, 2002). Furthermore, Ducoffe (1996) mentioned that
the advertisement messages are forced on audiences irrelevantly which audiences
shop for products or services after being exposed to product details from the
advertisement.
The basis of advertisement consumer’ response involves familiarity, empathy or
satisfaction, entertainment, brand reinforcement, irritation, and informativeness
Determinants of Audience Gratification Towards Digital Billboards
Page 22 of 76
according to research by Plummer (1971). Past studies has shown that informative
advertising is favorable to consumers (Abernethy & Franke 1996; Ducoffe, 1995) and
that information is processed more extensively (Kendzierski, 1980; Kenna & Baillet,
1980) than non-relevant information.
A survey conductedby Bauer & Greyer (1968) found that majority consumers
reported that information provided by the advertisement is the main reason in
approving the advertisement. Nonetheless, Advertisement messages delivered via
television is considered less informative as compared to advertisements from
newspaper argued Bauer & Greyer (1968) and Larkin (1978). This is because
newspaper is viewed as more reliable, credible, and informative stated in a study.
Based on significant findings of a research by Outdoor Advertising Association of
America, Inc. (oaaa) in 2009, found that audiences gain a lot of knowledge from
billboard advertisement with the ability to recall a wide range of actionable
information collected from shops and restaurants they later visited, radio and TV
programs that interest them, events that they desire to attend, or something funny that
they shared with friends later during the day.
Thus, there is significance in relationship between advertisement values, audience
attitude to advertising and informativeness of the advertisements empirically found
and supported in a study by Ducoffe (1995). Correspondingly, informativeness
identifies the value of ads and acts as an insight of audience attitude.
Thus, the following is hypothesized:
H2: There is a significant relationship between informativeness and audience
gratification on outdoor digital advertising.

Determinants of Audience Gratification Towards Digital Billboards
Page 23 of 76
2.4.3 Relationship between irritation and audience gratification on
outdoor digital advertising.
Jessica, Tim, Simon, and Itan (2011) have concluded that digital billboards can cause
major distraction towards drivers on road that leads to more driving errorsas a result
of reduced concentration and slower responsiveness which can cause higher road
accidents. As mentioned by Ducoffe (1996), distraction can happen when the drivers
perceived the ads as confusing, annoying and insulting which irritate the audiences.
Chien (2011) mentioned that outdoor advertising is a form of pollution to natural
scenic views and advertisement itself is a form of noise as stated by Speck and Elliott
(1997) which can cause irritation among the audiences.
As issue raised by Li et al (2002), ads that target wrong audiences, have unscrupulous
message and high number of repetition in short time could irritate the audiences and
ads that are forced on audiences can be considered as intrusion. In addition, audience
is forced to see unwanted ads that may have high repetition when they are driving on
the road with many digital billboards that have been set up on the roadsides and
flyover. Consequently, audiences will have negative feeling and feeling unsatisfied
towards the advertisements (Rettie, Robinson & Jenner,2001; Zhang, 2000; Alwitt &
Prabhaker, 1994).
From audiences’ viewpoint, advertisement that have unnecessary graphic and noises
can deem to be irritating and the audiences perceive the advertisement negatively
(Ducoffe, 1996). Luo (2002) stated that audiences avoid advertisements that bring
discomfort and unpleasantness. Otherwise, when the audiences see digital billboards
involuntarily that are not up to their liking and acceptability, they will get irritated
and hence reject the advertisements that are shown in the digital billboards.
However, advertising irritation may not necessarily bring negative outcomes toward
advertisements. Based on Demirdjian and Brungs (1984) research on perceive
irritation on advertising, found out that advertisements that are irritating are able to
Determinants of Audience Gratification Towards Digital Billboards
Page 24 of 76
create brand awareness and influence higher advertisement recall among audiences as
compare to non-irritate advertisements. This suggests that the advertising on digital
billboards do not necessarily bring a degree of irritation that is capable of affecting
the audiences’ perception towards the ads negatively.
Therefore, the following is hypothesized:
H3: There is a negative significant relationship between irritation and audience
gratification on outdoor digital advertising.
2.4.4 Relationship between credibility and audience gratification on
outdoor digital advertising.
Watt (2014) stated that outdoor advertising have its credibility as there are many
companies employed outdoor advertising have spent a total of 5.6 billion dollar in
year 2006 according to Outdoor Advertising Association of America. In other words,
the advertisements that can be seen by audiences are as credible as other medium
such as newspaper and television. The drivers are able to get the intended messages
that are being portrayed by the advertisers.
Besides, study shows that the drivers in the United States perceive the advertisements
on outdoor advertising have high level of advertiser trustworthiness and advertising
credibility with credible sources of information (Varey, 2002) and timely information
(Balasubramanian et al., 2002) displayed. Moreover, audiences are positively
influenced by the credibility of advertisements (Hagirian et al., 2005). Hence,
audiences have positive feelings towards advertisements displayed on outdoor digital
billboards.
Determinants of Audience Gratification Towards Digital Billboards
Page 25 of 76
Furthermore, outdoor advertising that uses picture of celebrities can also increase the
advertisements’ credibility. As stated by Goldsmith et al. (2000), the celebrities can
boost up the confidence of the audiences towards the advertisement and the audiences
perceived the celebrities as reliable sources of information. By using celebrities’
pictures on outdoor advertising, the advertisements will have higher credibility
towards the audiences.
On the contrary, there are critics mentioned that advertising nowadays do not have the
necessary credibility such as the reliability, meaningfulness and usefulness of the
advertisements and most of the advertisers do not convey the accurate information to
the audiences (Bachman, 2013). This indicates that advertising on digital billboards
may not have the credibility that audiences seek for.
Hence, the following is hypothesized:
H4: There is a significant relationship between credibility and audience gratification
on outdoor digital advertising.
2.5 Conclusion
In this chapter, we discuss the independent variables (digitalization, informativeness,
irritation, and credibility), and dependent variable (audiences’ gratification).
Moreover, we also identified and developed four hypotheses in this chapter. The
following chapter will discuss the methodology that we will use in our research.
Determinants of Audience Gratification Towards Digital Billboards
Page 26 of 76
Chapter 3: Methodology
3.0 Introduction
In this chapter, it will explain the methods used in the research project which is
collecting data and information for analyzing and evaluation of the hypothesis and
research questions. The methods will be explain are research design, data collection,
sampling design, constructs management, research instrument which includes the
pilot test, followed by data processing and data analysis. The objective of this chapter
is to present a clear understanding towards the evaluation of the results with
appropriate procedures applied.
3.1 Research Design
Research is an enquiry, finding and brings out something which was formerly
unidentified, unclear or required in testing the credibility of current information,
according to Finn, et al. (2000). A study of a process requires an appropriate
technique of information selection, analysis and research. Quantitative research was
conducted in this study to identify which variables will influence audience attitude
towards the usage of outdoor digital advertising.
Descriptive research design was also use in this study. According to Devin
Kowalczyk, is a study designed to depict the participants in an accurate way. Simpler
way, it is about describing the people to take part in the studies. There are 3 ways a
researcher can conduct descriptive research project which is observational, a method
Determinants of Audience Gratification Towards Digital Billboards
Page 27 of 76
of viewing and recording participants, case study, an in-depth study of an individual
or group of individuals and lastly survey, brief interview or discussion with an
individual about a specific topic.
Cross-sectional research is a research method frequently used in developmental
psychology. It is also utilized in others areas such as social science and education.
Studies utilizes different groups of people who differ in variable of interest, but share
other same or similar characteristics such as educational background, socioeconomic
status and ethnicity (Kendra Cherry, 2013)
3.2 Data Collection Methods
Data collection is a systematic process of gathering data and information from a
targeted variety of sources which then researcher analyzes the data to form statements
which answers research problems. In this particular research, data was collected
through distributing survey questionnaires in the Kuala Lumpur outdoor digital
advertising audiences. Data collected are used to answer the hypotheses and research
problems. There are two types of data collection method, primary and secondary data.
3.2.1 Primary data collection
According to Kynda R. Curtis, primary data are collected precisely to address the
problem through questions form which is conducted by the particular researcher.
Primary data can be collected through surveys, focus groups or in-depth interviews
such as taste test. Primary data collection also gives the advantage of receiving
Determinants of Audience Gratification Towards Digital Billboards
Page 28 of 76
responses directly on the spot. This method is also easy for coding, investigation and
clarification.
In collecting primary data for the research, questionnaire was used. Questionnaire is
also a tool which known as an inexpensive way to collect data. Primary data is then
gathered and assembled primarily with the research purpose of how outdoor digital
advertising influences the audience attitude in the Kuala Lumpur area. Questionnaire
is also easy to understand, thus it can avoid difficulty of targeted respondents to
understand as well. This is because the targeted audiences are the public pedestrians
in Malaysia walking around the cities where digital billboards are around them.
3.2.2 Secondary Data Collection
Is data that have been collected and recorded by someone else or specifically known
as researchers and readily from other source (Tran Thi Ut, 2013). Secondary data also
gives relevant information to support particular linked research. It is also less
expensive, cheaper and less time consuming. Secondary data can be found through
journals, libraries and also relevant articles.
3.3 Sampling Design
3.3.1 Target Population
A target population must be prudently defined so that appropriate sources which the
data collected can be recognized to provide accurate answer for the research
Determinants of Audience Gratification Towards Digital Billboards
Page 29 of 76
(Zikmund el al, 2013). The target population in this research project is the public
pedestrians walking around cities in Kuala Lumpur, where most of the digital
billboards are placed in the pedestrian’s path way and also lamp poles by the dividers.
3.3.2 Sampling Frame and Sampling Location
Location where most outdoor digital billboard placed Kuala Lumpur is the walkway
from Pavilion Mall to Lot 10 to Plaza Low Yat to Bukit Bintang and lastly to Times
Square. Also at Kuala Lumpur Conventon Centre (KLCC) or known as Kuala
Lumpur Twin Tower to Avenue K which is located opposite KLCC. These places are
all walking distance to each other where many digital billboards are placed along the
walkway, dividers and also lamp poles. Thus, Kuala Lumpur will be the most suitable
region to collect data related to outdoor digital billboard. Surveys are delivered
through hard copy face to face with the pedestrians.
3.3.3 Sampling Elements
Sampling elements respondents in this research project must be pedestrians walking
along the target walkway. This is because the pedestrians there are encounter the most
digital billboard as the targeted area are areas where most digital billboard are placed.
Thus, pedestrians there are the most suitable respondents to complete this research
project.
Determinants of Audience Gratification Towards Digital Billboards
Page 30 of 76
3.3.4 Sampling Techniques
Sampling techniques used in this research project is non-probability sampling
techniques. Non-probability samples are chosen without following mathematical
guidelines (Dr. Brad Warren, 2011). It is used because we couldn’t obtain whole
sampling frame in the study. The type of non-probability techniques used is
convenience sampling. This technique gives researchers a more convenient way of
measuring the data and also it’s easier to conduct due to time constraints.
3.3.5 Sampling Size
The sample size in this research project is set to be 260 respondents. Thus, 260 copies
of questionnaires are delivered to pedestrians in the targeted Kuala Lumpur areas and
some are conducted online towards respondents that are set to be qualified. Therefore,
Statistical Package for Society Science (SPSS) version 20.0 will be use to analyze the
data of the respondents.
3.4 Research Instrument
Based on the literature review done in Chapter 2, self-administered questionnaire are
formed to collect primary data from the audience. Questionnaire is then delivered and
conducted face to face with respondents and the questionnaire will be collected back
on the spot to boost respondent’s involvement.
3.4.1 Questionnaire Design
Questionnaire is written in asingle language which is English. English is a more
universal, appropriate and easy language to communicate with the whole respondents.
Determinants of Audience Gratification Towards Digital Billboards
Page 31 of 76
The cover page of the questionnaire briefly introduces the purpose of the research to
give respondents a rough thought of scope to answer the questionnaire. 260 of
questionnaires were delivered to the respective Kuala Lumpur pedestrians. The
questionnaire is separated into 3 sections. Which is Section A, B and C.
Section A is about the respondents view and perception in rating towards hypothesis
tested. There are five variables which are digitalization, informative, irritation,
credibility and satisfaction. All the variables are measured using likert-scale of
measurement.
Section B is about the general knowledge of the people perception towards digital
billboards.
Section C is about the respondent’s basic demographic characteristics. This allows the
researchers to capture general information about the respondents and also help to
understand the respondents more specifically.
3.4.2 Pilot Test
Before conducting the survey questionnaires to the 260 audiences, a pilot test was
conducted to ensure the rational of the questionnaire. According to (Van Teijlingen
and Hundley, 2011), pilot test is conducted to filter the rationale of the questionnaire
to avoid errors in the questionnaire and also to ensure all the questions are
understandable by the respondents. A pilot test also helps researcher identifies
potential problems such as questionnaire too complicated or ambiguous towards the
respondents.
Determinants of Audience Gratification Towards Digital Billboards
Page 32 of 76
3.5 Constructs Measurement
The scale of measurement is a crucial tool which influences the statistical procedures
that are used in analyzing the data. There are four types of measuring scales which are
nominal, ordinal, interval and also ratio. In the particular research project, only
nominal, interval and ordinal scales are adopted in designing the questionnaire.
3.5.1 Nominal Scale
Nominal scale is at the other end of the structure. They do not even need the task of
mathematical values, but only of exclusive identifiers (numerals, characters, colors).
They are invariant under any modification that maintains the connection between
people and their identifiers. Thus it is allowable to execute almost any function on the
provided that researchers do not combine or mix up details. When the details
principles are numeric, these features consist of any features that map one-to-one
from the exclusive set of figures into a new set. When the details principles are not
number, permissible features consist of putting in order the details values. Besides,
only the most fragile type of details can endure such irrelevant changes (Paul F.
Velleman & Wilkinson, 1993).
3.5.2 Interval Scale
Interval scale is a set of range that consists of nominal and ordinal qualities, besides
that, it catches details about variations in amounts, or range of an idea from one issues
to the next (Zikmund et al., 2010). Interval scale uses variety for calculate the factors,
Determinants of Audience Gratification Towards Digital Billboards
Page 33 of 76
so the range between the figures are always equivalent (Hair et al., 2007). Period
scale not only shows purchase, but it helps to evaluate the range between any two
points on the range. It allows scientists to estimate indicates and the standard
diversions of the reactions on the factors. The researchers implied the interval range
where it is used by various scientists to gauge concepts such as views, behavior, and
emotions (Hair et al., 2007). Correlative with interval range, scientists usually
evaluate and calculate the outcomes depending on Likert scale. In common, there are
5 groups of responses comprised with this range from (5) = strongly agree, (4) =
agree, (3) = neutral, (2) = disagree and (1) = strongly disagree.
3.5.3 Ordinal Scale
Ordinal scale measurement is measured through ranking-order (Stevens, 1946).
Ordinal scale is used when categorize the information based on a specific order or
rank. Example usage of ordinal scale is the monthly expenses on foods, which is
divided as below RM50, RM50 to RM100, RM100 to RM150, RM150 and above.
3.6 Data Processing
Data processing refers to information and data collected for a research which is being
process through checking, editing, coding, transcribing and cleaning. The purpose of
data processing is to filter out irrelevant information to improve quality of the data
and precise the results.
Determinants of Audience Gratification Towards Digital Billboards
Page 34 of 76
3.6.1 Data Checking
Data checking is a very crucial procedure to detect errors in the data. Pilot test was
carried out to ensure the questionnaire is understandable and relevant. Also, once
questionnaire is collected back from the respondents, researchers must check the data
to ensure the data collected is clear and understandable for the researcher to analyze
and process the data.
3.6.2 Data Editing
Data editing is a process of investigating the data collected in questionnaires to detect
errors and increase precision of data (MBA Knowledge Base). According to Mildred
B. Parten (1959), data must be accurate, consistent with secured facts, uniformly
entered and accepted for tabulation. This is to warrant the data collected are
consistent. Researchers then correct the data collected if there is data error occurred
such as incomplete and ambiguous answers collected from the respondents. Example,
two answers was given in a single question, researcher then choose one of the answer
only.
3.6.3 Data Coding
The next procedure of data processing is data coding which refers data converted into
numbers so it can easily key into computer software for analysis purpose (Lewis,
Bryman & Liao, 2004). Researchers converted the data collected into number. In
Determinants of Audience Gratification Towards Digital Billboards
Page 35 of 76
current research, the answer from strongly disagree to strongly agree is indicated by
number one to number five.
3.6.4 Data Transcribing
Malhotra and Peterson (2006) stated that data transcribing refers as key in the coded
data into computers. The coded data collected from questionnaire was transcribed into
SPSS software version 20.0 by researchers.
3.6.5 Data Cleaning
Data cleaning is the last procedure of data processing which refers as cleaning data
for consistencies. Inconsistencies data may come from extreme values and faulty
logic (Malhotra & Peterson, 2006). Researchers correct some inconsistencies data that
came from extreme values and faulty logic.
3.7 Data Analysis
In this study, simple and advance data analysis will be used to interpret the data. For
simple analysis, it will calculate frequency distribution, the mean, percentage
Determinants of Audience Gratification Towards Digital Billboards
Page 36 of 76
distribution, and so forth. For advance analysis, it will be Multiple Regression
Analysis and Pearson Correlation Coefficient. Besides, in current research Statistical
Package for the Social Sciences (SPSS) version 20.0 software will assist the
researches to analyze quantitative data effectively.
3.7.1 Descriptive Analysis
Descriptive statistics is used to help researchers to study the data by describe and
summarize the basic data that have been collected from the respondent (McLellan et
al., 2003). Besides, descriptive statistic is very useful for researchers to gain a general
picture of the respondent demographic data. Moreover, descriptive statistic is most
suitable method to use when the objective is to describe and discuss data more
generally and conveniently. In this way, descriptive statistic helps the researchers to
simplify numerous data in a sensible way. In current research, data that are suitable
for descriptive statistic are age, income, and so forth.
3.7.2 Scale Measurement
This tool is to measure the reliability of the data to gain an appropriate result for the
research project. The test is known as reliability test. According to Oxford Dictionary,
reliability refers to the consistently stable and good in quality and performance results.
Determinants of Audience Gratification Towards Digital Billboards
Page 37 of 76
3.7.2.1 Reliability Test
Reliability analysis is used to examining the consistency and stability of variable
(Sekaran & Bougie, 2010). Moreover, it is useful when independent variables are
used to predict the outcome. Consistency indicates how well the variables are being
measured within a group of data. In current research, Cronbach’s alpha index is used
to evaluate the reliability in term of internal consistency measurement. The reliability
result of the test will be interpreted in Cronbach’s Alpha value. Subsequently, alpha
coefficient values will be compared with the rules of thumb. Whereas, the rule of
thumb for Cronbach’s Alpha, “α ≥ 0.9 –Excellent”, “0.7 ≤ α < 0.9 – Good”, “0.6 ≤ α
< 0.7 – Acceptable”, “0.5 ≤ α < 0.6 – Poor”, and “α < 0.5 – Unacceptable”. A cut off
points above than 0.6 shows the result is reliable. Cronbach’s Alpha can be
considered as an adequate index for consistency and reliability of the independent and
dependent variables (Zikmund, 2003).
3.7.3 Inferential Analysis
Inferential analysis is used to study the probability of differences between the
observed data and actual data that might happen by chance in this study (Malhotra,
2006). Besides, inferential analysis is used to make inference about the characteristics
of a population based on sample data. In current study, Multiple Regression Analysis
and Pearson's Correlation Coefficient are used.
Determinants of Audience Gratification Towards Digital Billboards
Page 38 of 76
3.7.3.1 Pearson Correlation Coefficient Test
Pearson Correlation Coefficient is a technique used to evaluate the strength of the
linear relationship between the variables. Besides, it shows the direction strength of
significant and association between the relationship among all variables. Pearson‘s
correlation value could range between 1.00 and 0.00. Value 1.00 means perfect
correlation while value 0.00 means no correlation (Frederick & Larry, 2009). For
example, confidence level of 95 percentages is assigned. If p-value is less than 0.05,
H1 will be accepted. Vice versa, Ho is rejected when P value <0.05.
Table 3.1: Rules of Thumb about Correlation Coefficient
Coefficient Range Strength of Association
± 0.00 to ±0.20 Slight, almost negligible
± 0.21 to ±0.40 Small but definite relationship
± 0.41 to ± 0.70 Moderate
± 0.71 to ± 0.90 High
± 0.91 to ± 1.00 Very Strong
Source: Hair, J., Money, A., Samouel, P., & Page, M. (2007).
3.7.3.2 Multiple Regression Analysis
Multiple regression analysis is used to find out how outdoor digital advertising
influences audience attitude’s among Kuala Lumpur pedestrians. Furthermore,
multiple regression analysis also uses to measures the degree of influence of the
Determinants of Audience Gratification Towards Digital Billboards
Page 39 of 76
independent variables on a dependent variable and forecast a single dependent
variable (Zikmund, 2003). The result of multiple regression analysis will determine
whether the impact between the variables is positive or negative to the independent
variables. From the impact, researches will justify based on the result obtain from the
multiple regression analysis.
3.8 Conclusion
This chapter is all about the methodologies which are going to be use in the research
project. Questionnaire are distributed and conducted is reflected as primary data and
journals, books and internet is known as secondary data. The SPSS software is then
used to analyze the collected data to test the variables reliability and others results
which discussed earlier. Therefore, the next chapter contains the results of the
research project for us to have a better understanding towards the data analysis.
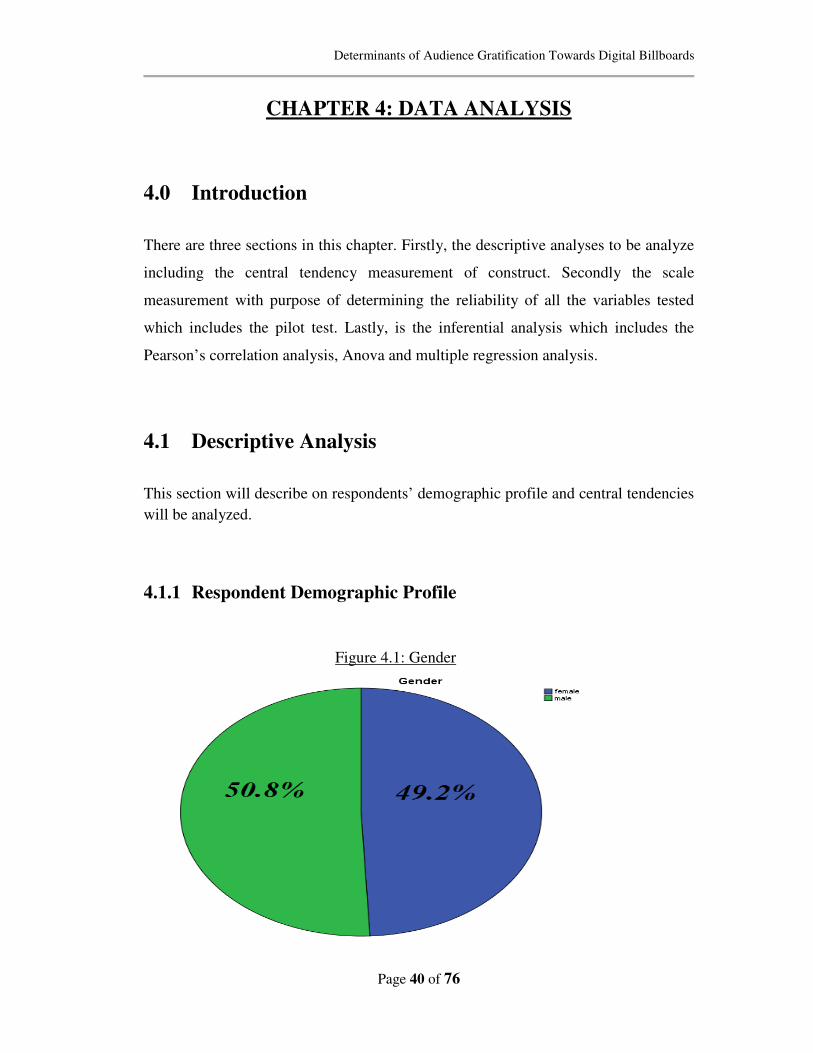
Determinants of Audience Gratification Towards Digital Billboards
Page 40 of 76
CHAPTER 4: DATA ANALYSIS
4.0 Introduction
There are three sections in this chapter. Firstly, the descriptive analyses to be analyze
including the central tendency measurement of construct. Secondly the scale
measurement with purpose of determining the reliability of all the variables tested
which includes the pilot test. Lastly, is the inferential analysis which includes the
Pearson’s correlation analysis, Anova and multiple regression analysis.
4.1 Descriptive Analysis
This section will describe on respondents’ demographic profile and central tendencies
will be analyzed.
4.1.1 Respondent Demographic Profile
Figure 4.1: Gender

Determinants of Audience Gratification Towards Digital Billboards
Page 41 of 76
Table 4.1: Gender
Frequency Percent Valid Percent Cumulative
Percent
Valid
Male 129 50.8 50.8 100.0
Female 125 49.2 49.2 49.2
Total 254 100.0 100.0
Above Table 4.1, it shows the gender of respondents. Out of 254 respondents, 50.8%
of the respondents are male while 49.2% of the respondents are female.
Figure 4.2: Age
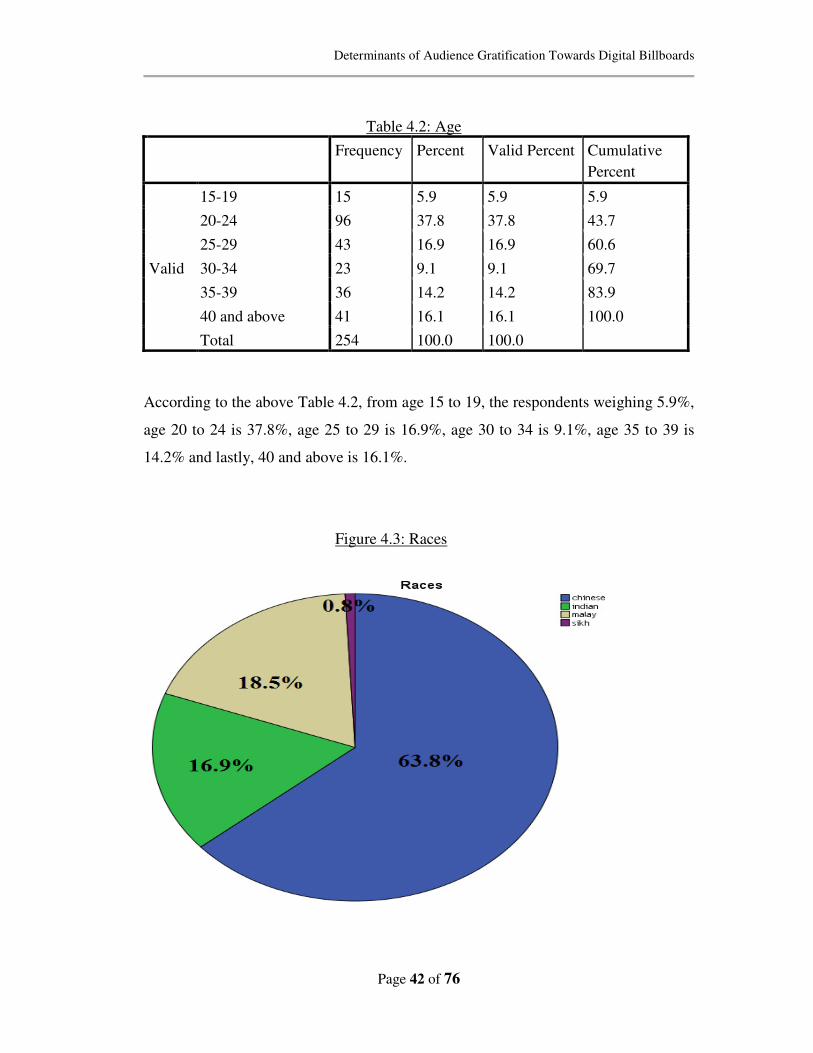
Determinants of Audience Gratification Towards Digital Billboards
Page 42 of 76
According to the above Table 4.2, from age 15 to 19, the respondents weighing 5.9%,
age 20 to 24 is 37.8%, age 25 to 29 is 16.9%, age 30 to 34 is 9.1%, age 35 to 39 is
14.2% and lastly, 40 and above is 16.1%.
Figure 4.3: Races
Table 4.2: Age
Frequency Percent Valid Percent Cumulative
Percent
Valid
15-19 15 5.9 5.9 5.9
20-24 96 37.8 37.8 43.7
25-29 43 16.9 16.9 60.6
30-34 23 9.1 9.1 69.7
35-39 36 14.2 14.2 83.9
40 and above 41 16.1 16.1 100.0
Total 254 100.0 100.0
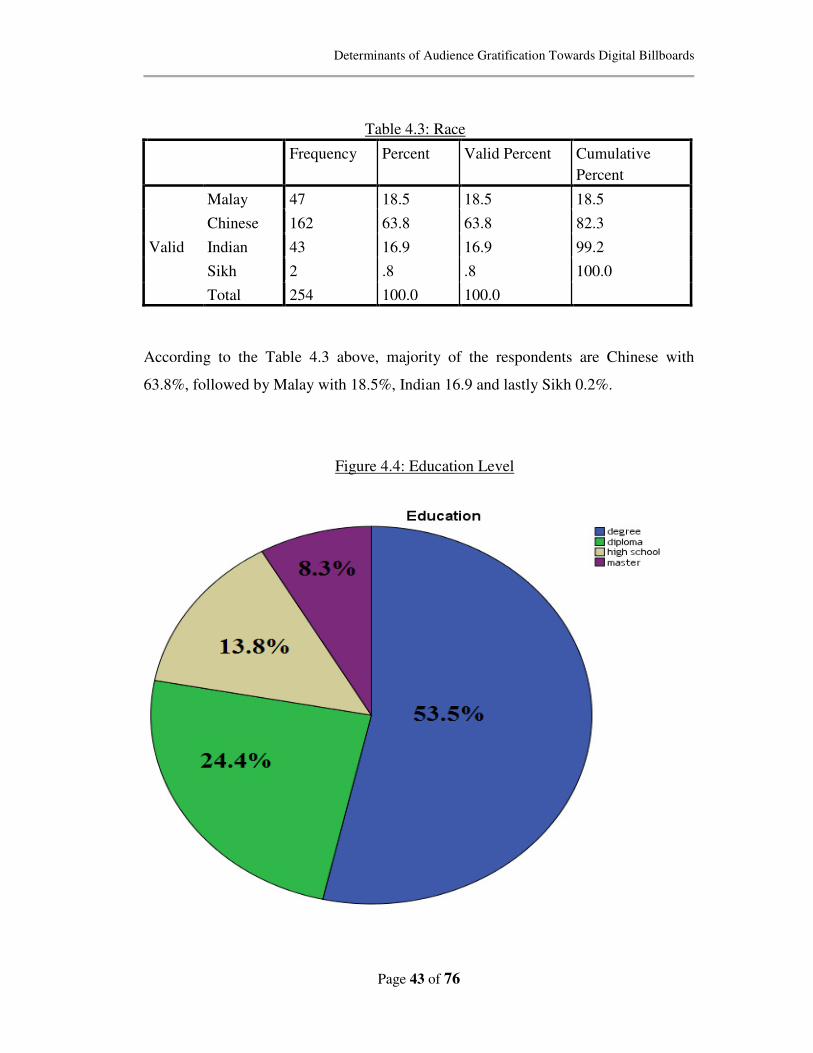
Determinants of Audience Gratification Towards Digital Billboards
Page 43 of 76
Table 4.3: Race
Frequency Percent Valid Percent Cumulative
Percent
Valid
Malay 47 18.5 18.5 18.5
Chinese 162 63.8 63.8 82.3
Indian 43 16.9 16.9 99.2
Sikh 2 .8 .8 100.0
Total 254 100.0 100.0
According to the Table 4.3 above, majority of the respondents are Chinese with
63.8%, followed by Malay with 18.5%, Indian 16.9 and lastly Sikh 0.2%.
Figure 4.4: Education Level
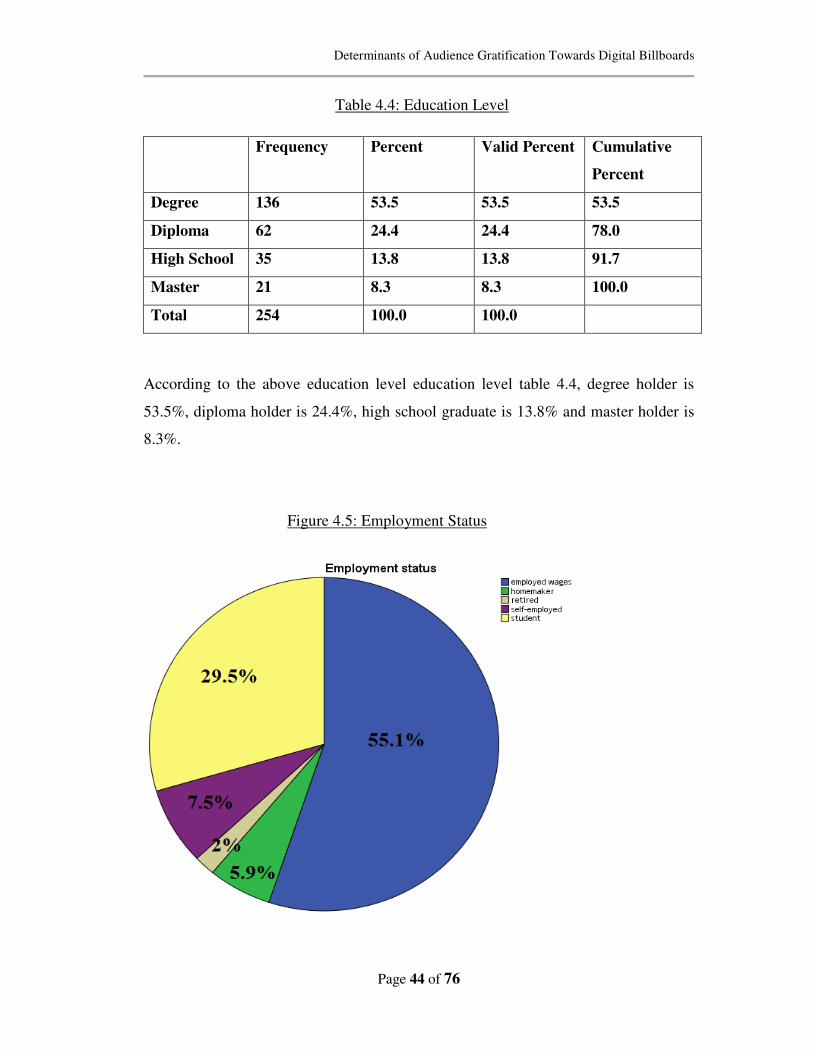
Determinants of Audience Gratification Towards Digital Billboards
Page 44 of 76
Table 4.4: Education Level
Frequency Percent Valid Percent Cumulative
Percent
Degree 136 53.5 53.5 53.5
Diploma 62 24.4 24.4 78.0
High School 35 13.8 13.8 91.7
Master 21 8.3 8.3 100.0
Total 254 100.0 100.0
According to the above education level education level table 4.4, degree holder is
53.5%, diploma holder is 24.4%, high school graduate is 13.8% and master holder is
8.3%.
Figure 4.5: Employment Status
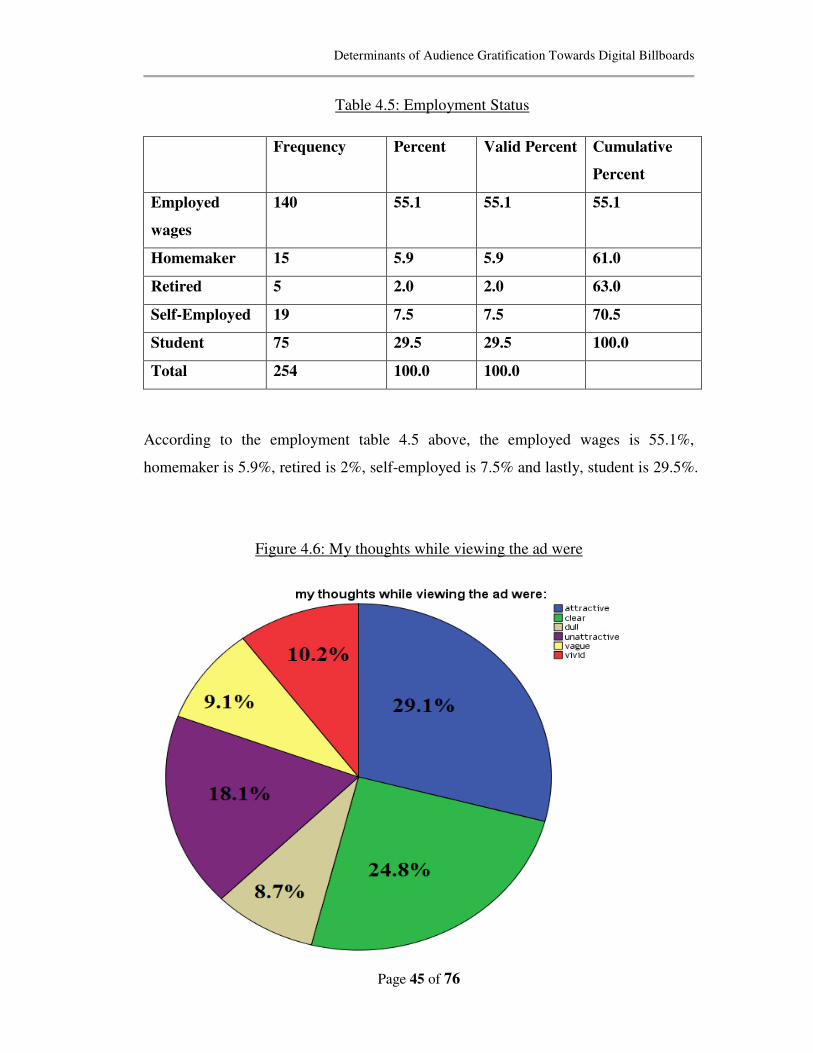
Determinants of Audience Gratification Towards Digital Billboards
Page 45 of 76
Table 4.5: Employment Status
Frequency Percent Valid Percent Cumulative
Percent
Employed
wages
140 55.1 55.1 55.1
Homemaker 15 5.9 5.9 61.0
Retired 5 2.0 2.0 63.0
Self-Employed 19 7.5 7.5 70.5
Student 75 29.5 29.5 100.0
Total 254 100.0 100.0
According to the employment table 4.5 above, the employed wages is 55.1%,
homemaker is 5.9%, retired is 2%, self-employed is 7.5% and lastly, student is 29.5%.
Figure 4.6: My thoughts while viewing the ad were
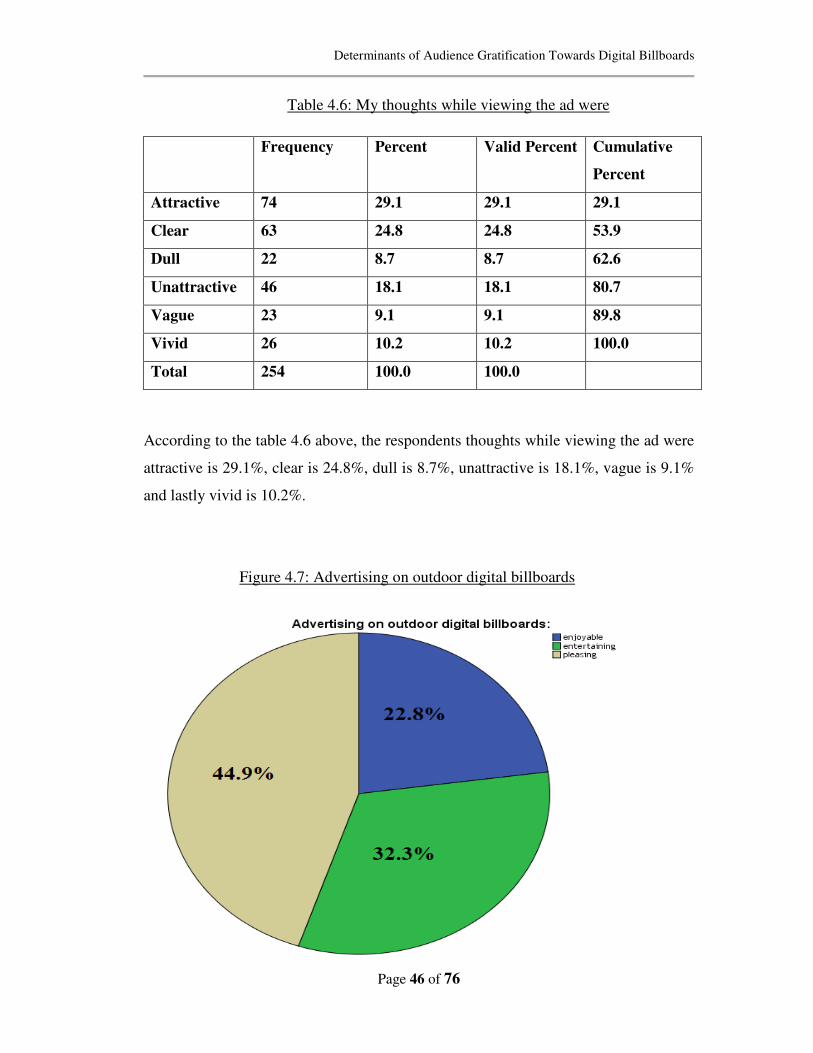
Determinants of Audience Gratification Towards Digital Billboards
Page 46 of 76
Table 4.6: My thoughts while viewing the ad were
Frequency Percent Valid Percent Cumulative
Percent
Attractive 74 29.1 29.1 29.1
Clear 63 24.8 24.8 53.9
Dull 22 8.7 8.7 62.6
Unattractive 46 18.1 18.1 80.7
Vague 23 9.1 9.1 89.8
Vivid 26 10.2 10.2 100.0
Total 254 100.0 100.0
According to the table 4.6 above, the respondents thoughts while viewing the ad were
attractive is 29.1%, clear is 24.8%, dull is 8.7%, unattractive is 18.1%, vague is 9.1%
and lastly vivid is 10.2%.
Figure 4.7: Advertising on outdoor digital billboards
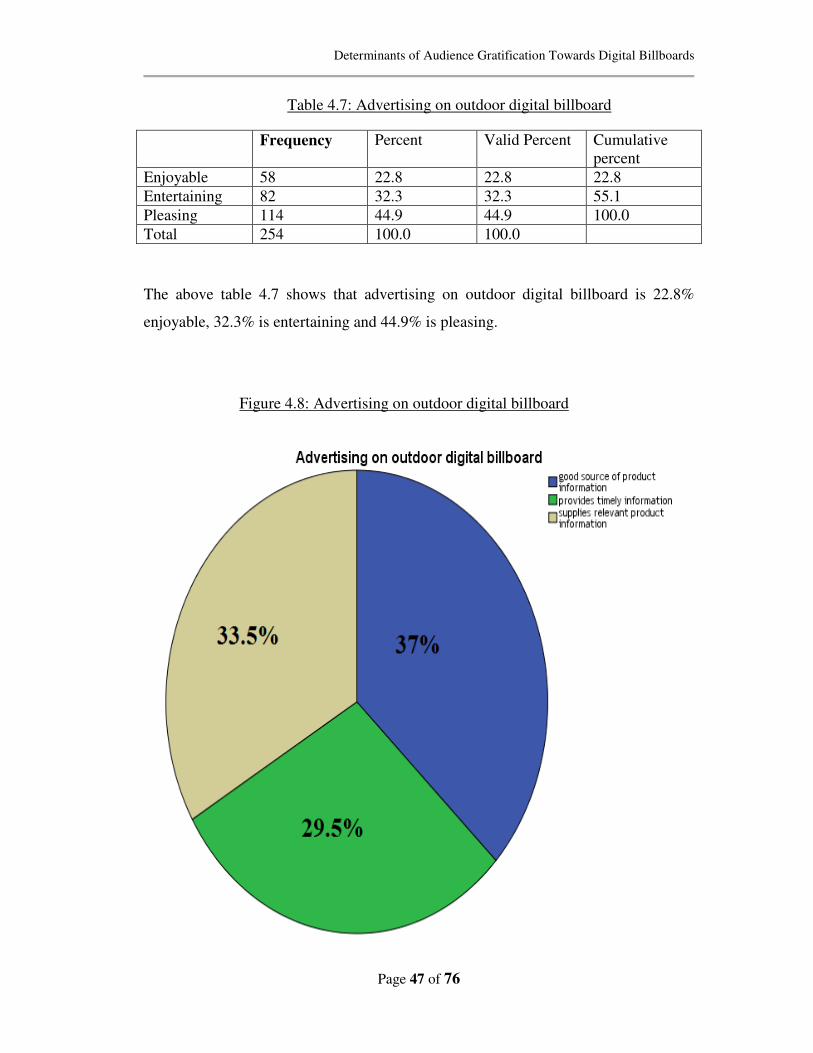
Determinants of Audience Gratification Towards Digital Billboards
Page 47 of 76
Table 4.7: Advertising on outdoor digital billboard
Frequency Percent Valid Percent Cumulative
percent
Enjoyable 58 22.8 22.8 22.8
Entertaining 82 32.3 32.3 55.1
Pleasing 114 44.9 44.9 100.0
Total 254 100.0 100.0
The above table 4.7 shows that advertising on outdoor digital billboard is 22.8%
enjoyable, 32.3% is entertaining and 44.9% is pleasing.
Figure 4.8: Advertising on outdoor digital billboard
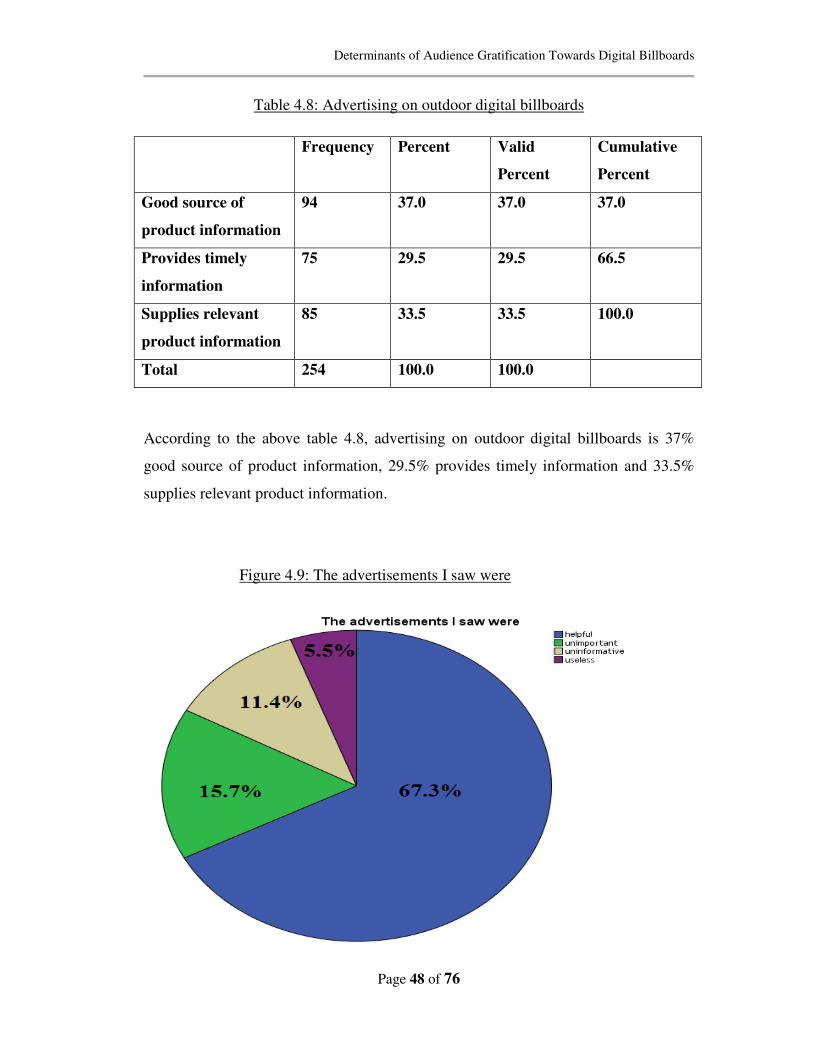
Determinants of Audience Gratification Towards Digital Billboards
Page 48 of 76
Table 4.8: Advertising on outdoor digital billboards
Frequency Percent Valid
Percent
Cumulative
Percent
Good source of
product information
94 37.0 37.0 37.0
Provides timely
information
75 29.5 29.5 66.5
Supplies relevant
product information
85 33.5 33.5 100.0
Total 254 100.0 100.0
According to the above table 4.8, advertising on outdoor digital billboards is 37%
good source of product information, 29.5% provides timely information and 33.5%
supplies relevant product information.
Figure 4.9: The advertisements I saw were

Determinants of Audience Gratification Towards Digital Billboards
Page 49 of 76
Table 4.9: The advertisements I saw were
Frequency Percent Valid
Percent
Cumulative
Percent
Helpful 171 67.3 67.3 67.3
Unimportant 40 15.7 15.7 83.1
Uninformative 29 11.4 11.4 94.5
Useless 14 5.5 5.5 100.0
Total 254 100.0 100.0
Based on the table 4.9 above, the advertisements respondents saw were 67.3% helpful,
15.7% unimportant, 11.4% uninformative and lastly 5.5% useless.
4.1.2 Central Tendencies Measurement of Constructs
Table 4.10: Central Tendencies Measurement of Constructs
Variables Items Mean Standard
deviation
Digitalization D1=I feel that outdoor digital billboard advertisements
are enjoyable.
D2=I feel that outdoor digital billboard advertisements
are entertaining.
D3=I like the graphics on the outdoor digital billboard
advertisements.
D4=I usually do not pay attention to advertisements.
3.52
3.72
3.47
3.35
.993
.856
1.109
1.082
Informative I1=Outdoor digital billboard advertisements provide
the useful information I need.
I2=I feel that outdoor digital billboard is a good
source for timely information.
I3=I feel that outdoor digital billboard improves my
3.49
3.63
3.74
.993
.968
.968
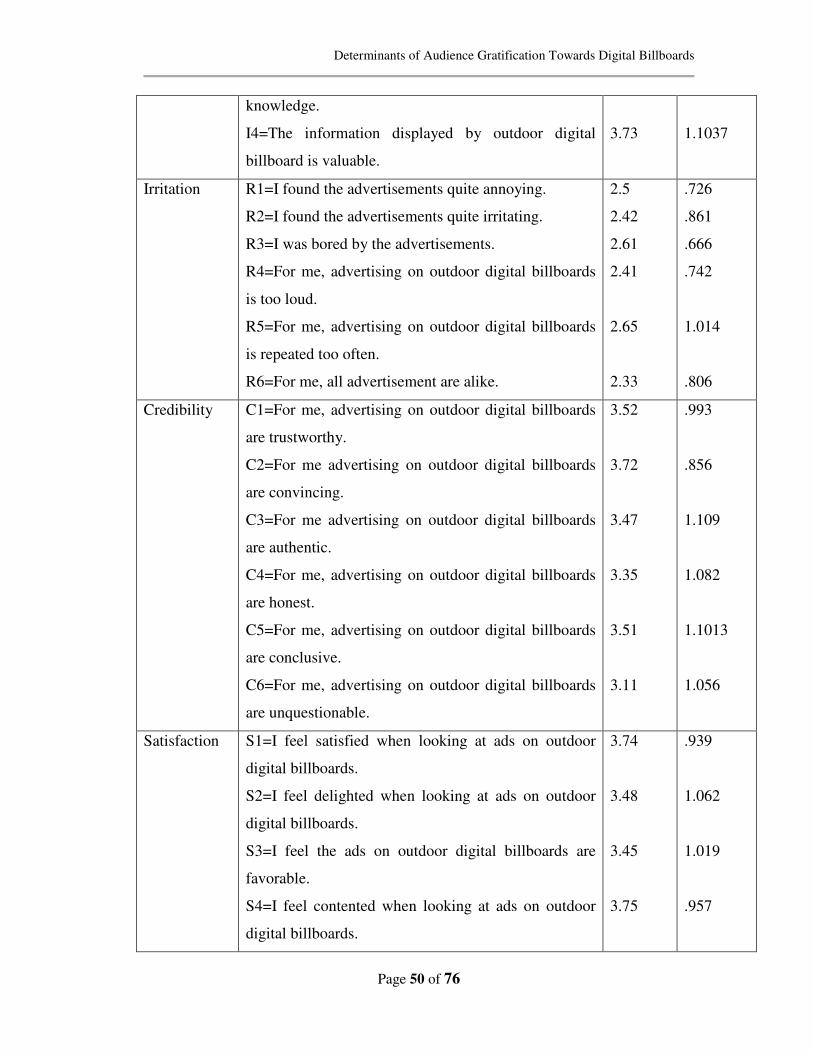
Determinants of Audience Gratification Towards Digital Billboards
Page 50 of 76
knowledge.
I4=The information displayed by outdoor digital
billboard is valuable.
3.73
1.1037
Irritation R1=I found the advertisements quite annoying.
R2=I found the advertisements quite irritating.
R3=I was bored by the advertisements.
R4=For me, advertising on outdoor digital billboards
is too loud.
R5=For me, advertising on outdoor digital billboards
is repeated too often.
R6=For me, all advertisement are alike.
2.5
2.42
2.61
2.41
2.65
2.33
.726
.861
.666
.742
1.014
.806
Credibility C1=For me, advertising on outdoor digital billboards
are trustworthy.
C2=For me advertising on outdoor digital billboards
are convincing.
C3=For me advertising on outdoor digital billboards
are authentic.
C4=For me, advertising on outdoor digital billboards
are honest.
C5=For me, advertising on outdoor digital billboards
are conclusive.
C6=For me, advertising on outdoor digital billboards
are unquestionable.
3.52
3.72
3.47
3.35
3.51
3.11
.993
.856
1.109
1.082
1.1013
1.056
Satisfaction S1=I feel satisfied when looking at ads on outdoor
digital billboards.
S2=I feel delighted when looking at ads on outdoor
digital billboards.
S3=I feel the ads on outdoor digital billboards are
favorable.
S4=I feel contented when looking at ads on outdoor
digital billboards.
3.74
3.48
3.45
3.75
.939
1.062
1.019
.957

Determinants of Audience Gratification Towards Digital Billboards
Page 51 of 76
S5=I like to see ads on outdoor digital billboards very
much.
3.56 1.662
D1 to D4 Questions for Digitalization
I1 to I4 Questions for Informative
R1 to R6 Questions for Irritation
C1 to C6 Questions for Credibility
S1 to S5 Questions for Satisfaction
(D2=I feel that outdoor digital billboard advertisements are entertaining) has the
highest mean value 3.72 at with standard deviation of 0.856 while (D4=I usually do
not pay attention to advertisements) shows the lowest mean value at 3.35 with
standard deviation of 1.082.
(I3=I feel that outdoor digital billboard improves my knowledge) has the highest
mean value 3.74 at with standard deviation of 0.968 while (I1=Outdoor digital
billboard advertisements provide the useful information I need) shows the lowest
mean value at 3.49 with standard deviation of 0.993.
(R5=For me, advertising on outdoor digital billboards is repeated too often) has the
highest mean value 2.65 at with standard deviation of 1.014 while (R6=For me, all
advertisement are alike) shows the lowest mean value at 2.33 with standard deviation
of 0.806.
(C2=For me advertising on outdoor digital billboards are convincing) has the highest
mean value 3.72 at with standard deviation of 0.856 while (C6=For me, advertising
on outdoor digital billboards are unquestionable) shows the lowest mean value at 3.11
with standard deviation of 1.506.
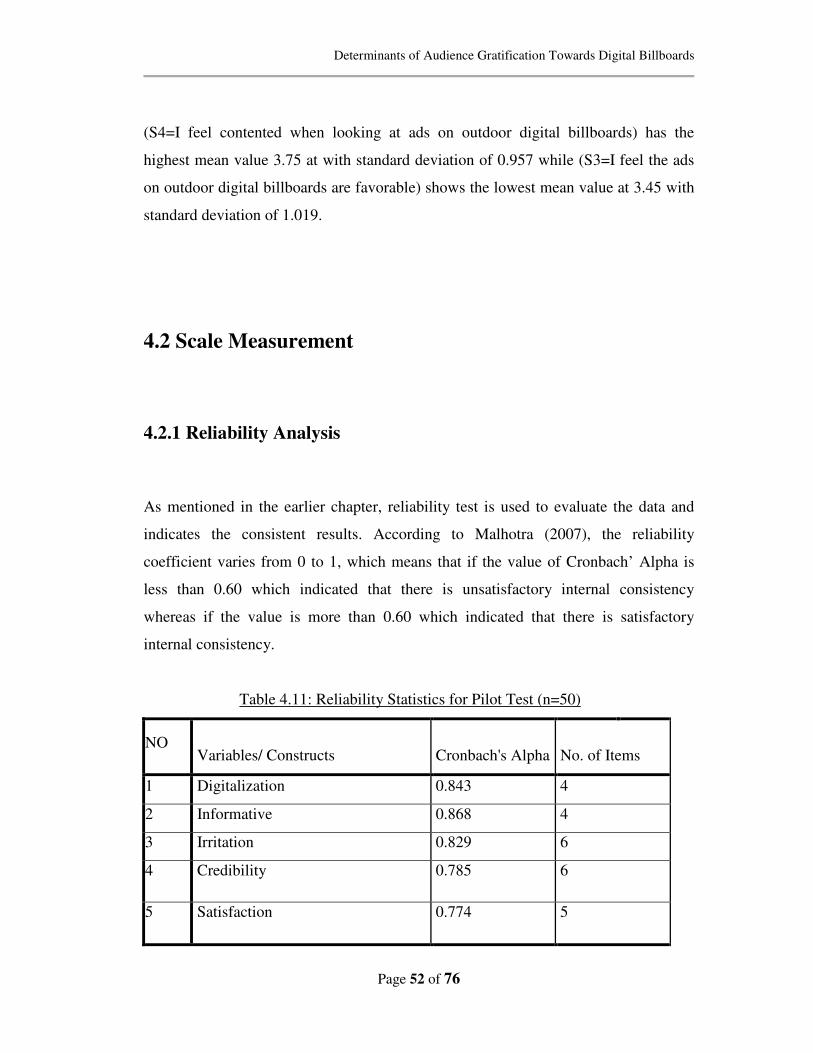
Determinants of Audience Gratification Towards Digital Billboards
Page 52 of 76
(S4=I feel contented when looking at ads on outdoor digital billboards) has the
highest mean value 3.75 at with standard deviation of 0.957 while (S3=I feel the ads
on outdoor digital billboards are favorable) shows the lowest mean value at 3.45 with
standard deviation of 1.019.
4.2 Scale Measurement
4.2.1 Reliability Analysis
As mentioned in the earlier chapter, reliability test is used to evaluate the data and
indicates the consistent results. According to Malhotra (2007), the reliability
coefficient varies from 0 to 1, which means that if the value of Cronbach’ Alpha is
less than 0.60 which indicated that there is unsatisfactory internal consistency
whereas if the value is more than 0.60 which indicated that there is satisfactory
internal consistency.
Table 4.11: Reliability Statistics for Pilot Test (n=50)
NO Variables/ Constructs Cronbach's Alpha No. of Items
1 Digitalization 0.843 4
2 Informative 0.868 4
3 Irritation 0.829 6
4 Credibility 0.785 6
5 Satisfaction 0.774 5
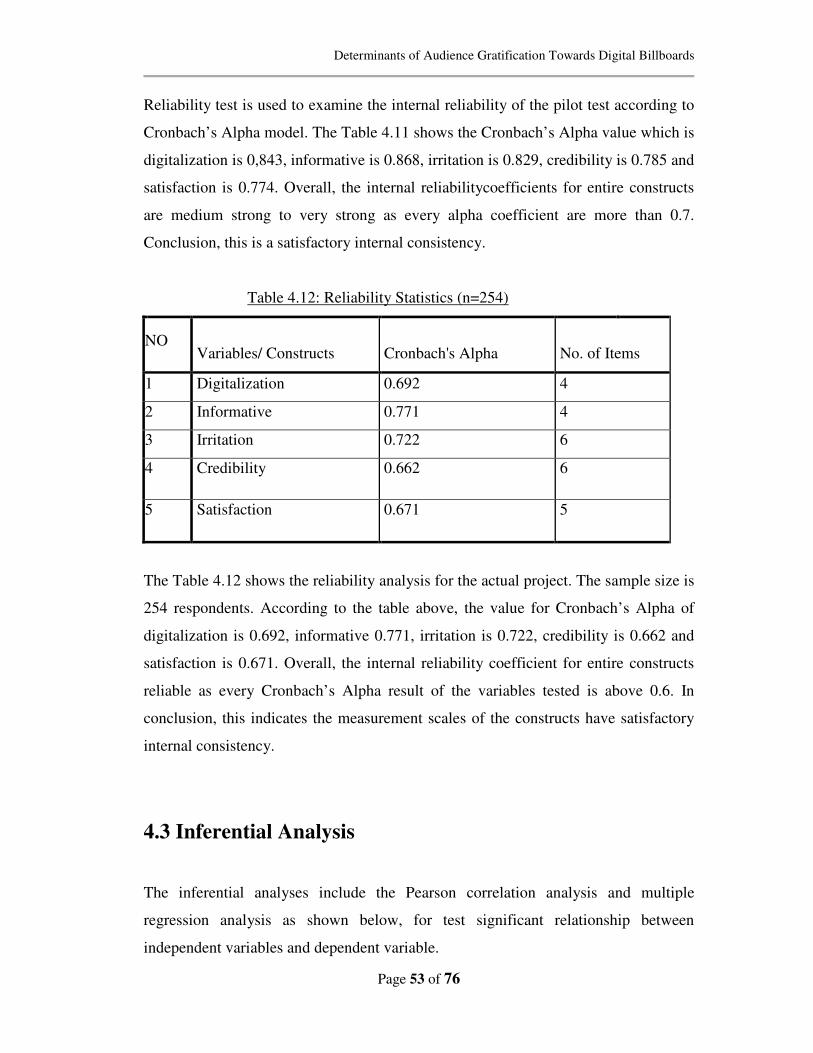
Determinants of Audience Gratification Towards Digital Billboards
Page 53 of 76
Reliability test is used to examine the internal reliability of the pilot test according to
Cronbach’s Alpha model. The Table 4.11 shows the Cronbach’s Alpha value which is
digitalization is 0,843, informative is 0.868, irritation is 0.829, credibility is 0.785 and
satisfaction is 0.774. Overall, the internal reliabilitycoefficients for entire constructs
are medium strong to very strong as every alpha coefficient are more than 0.7.
Conclusion, this is a satisfactory internal consistency.
Table 4.12: Reliability Statistics (n=254)
NO Variables/ Constructs Cronbach's Alpha No. of Items
1 Digitalization 0.692 4
2 Informative 0.771 4
3 Irritation 0.722 6
4 Credibility 0.662 6
5 Satisfaction 0.671 5
The Table 4.12 shows the reliability analysis for the actual project. The sample size is
254 respondents. According to the table above, the value for Cronbach’s Alpha of
digitalization is 0.692, informative 0.771, irritation is 0.722, credibility is 0.662 and
satisfaction is 0.671. Overall, the internal reliability coefficient for entire constructs
reliable as every Cronbach’s Alpha result of the variables tested is above 0.6. In
conclusion, this indicates the measurement scales of the constructs have satisfactory
internal consistency.
4.3 Inferential Analysis
The inferential analyses include the Pearson correlation analysis and multiple
regression analysis as shown below, for test significant relationship between
independent variables and dependent variable.
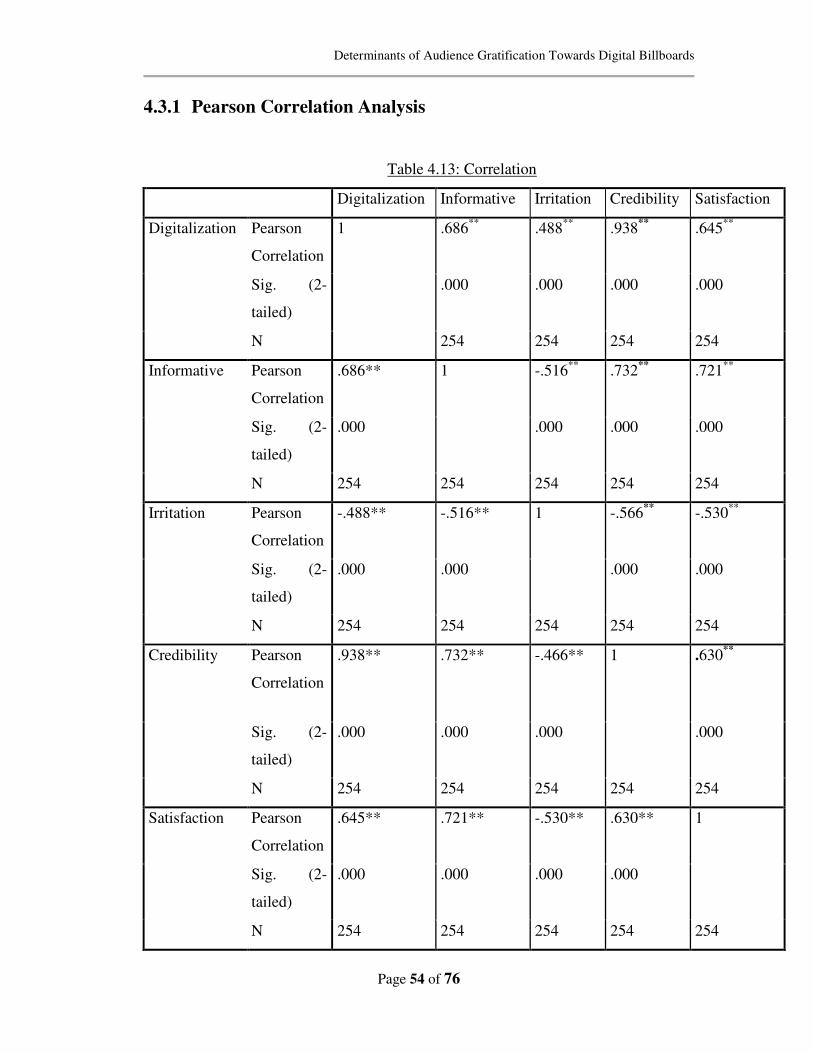
Determinants of Audience Gratification Towards Digital Billboards
Page 54 of 76
4.3.1 Pearson Correlation Analysis
Table 4.13: Correlation
Digitalization Informative Irritation Credibility Satisfaction
Digitalization Pearson
Correlation
1 .686**
.488**
.938**
.645**
Sig. (2-
tailed)
.000 .000 .000 .000
N 254 254 254 254
Informative Pearson
Correlation
.686** 1 -.516**
.732**
.721**
Sig. (2-
tailed)
.000
.000 .000 .000
N 254 254 254 254 254
Irritation Pearson
Correlation
-.488** -.516** 1 -.566**
-.530**
Sig. (2-
tailed)
.000 .000
.000 .000
N 254 254 254 254 254
Credibility Pearson
Correlation
.938** .732** -.466** 1 .630**
Sig. (2-
tailed)
.000 .000 .000
.000
N 254 254 254 254 254
Satisfaction Pearson
Correlation
.645** .721** -.530** .630** 1
Sig. (2-
tailed)
.000 .000 .000 .000
N 254 254 254 254 254
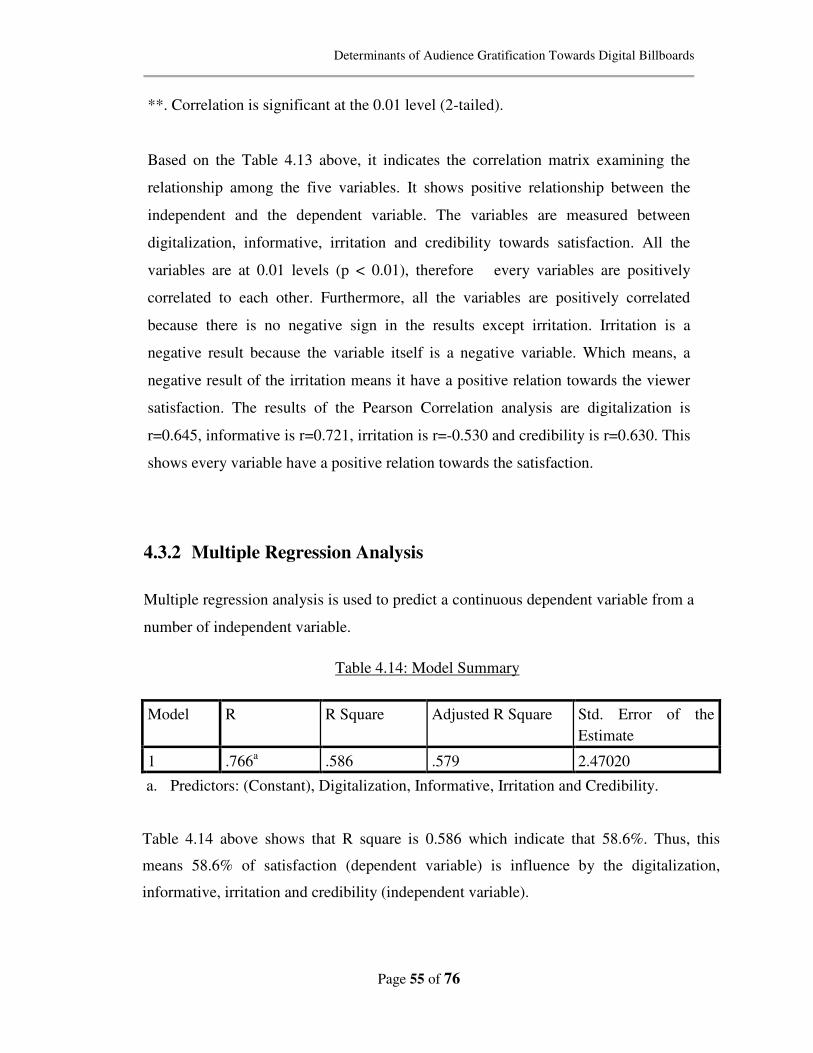
Determinants of Audience Gratification Towards Digital Billboards
Page 55 of 76
**. Correlation is significant at the 0.01 level (2-tailed).
Based on the Table 4.13 above, it indicates the correlation matrix examining the
relationship among the five variables. It shows positive relationship between the
independent and the dependent variable. The variables are measured between
digitalization, informative, irritation and credibility towards satisfaction. All the
variables are at 0.01 levels (p < 0.01), therefore every variables are positively
correlated to each other. Furthermore, all the variables are positively correlated
because there is no negative sign in the results except irritation. Irritation is a
negative result because the variable itself is a negative variable. Which means, a
negative result of the irritation means it have a positive relation towards the viewer
satisfaction. The results of the Pearson Correlation analysis are digitalization is
r=0.645, informative is r=0.721, irritation is r=-0.530 and credibility is r=0.630. This
shows every variable have a positive relation towards the satisfaction.
4.3.2 Multiple Regression Analysis
Multiple regression analysis is used to predict a continuous dependent variable from a
number of independent variable.
Table 4.14: Model Summary
Model R R Square Adjusted R Square Std. Error of the
Estimate
1 .766a .586 .579 2.47020
a. Predictors: (Constant), Digitalization, Informative, Irritation and Credibility.
Table 4.14 above shows that R square is 0.586 which indicate that 58.6%. Thus, this
means 58.6% of satisfaction (dependent variable) is influence by the digitalization,
informative, irritation and credibility (independent variable).
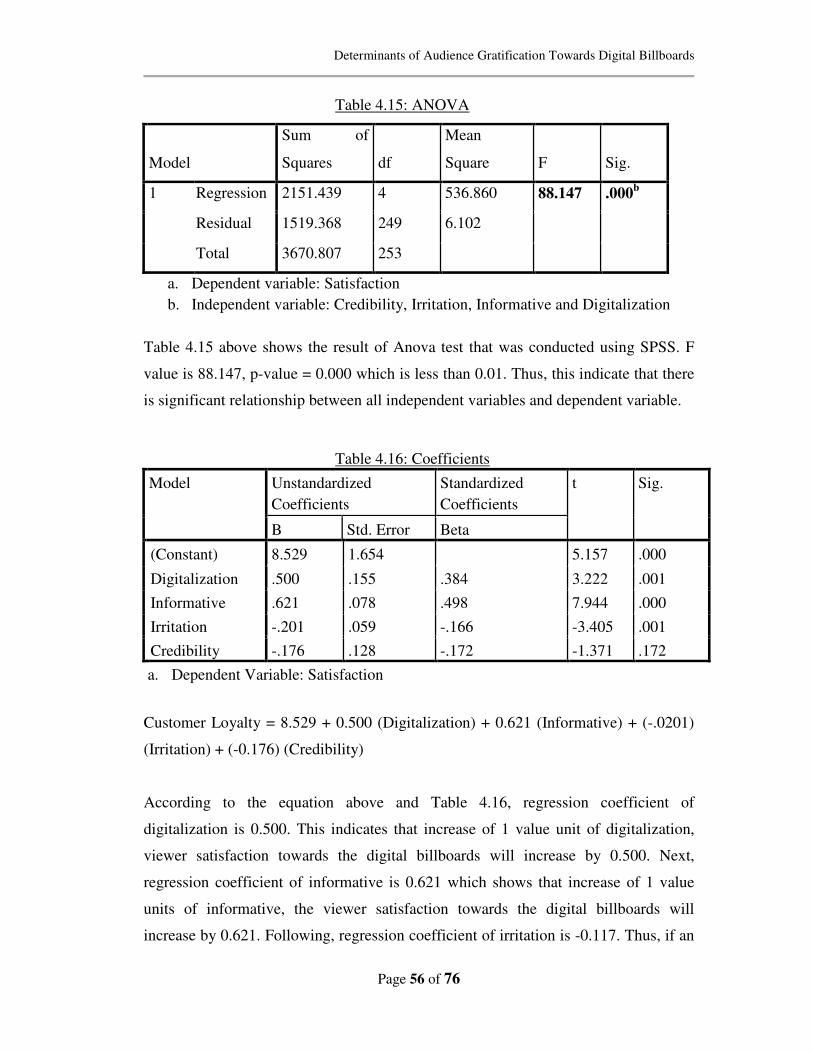
Determinants of Audience Gratification Towards Digital Billboards
Page 56 of 76
Table 4.15: ANOVA
Model
Sum of
Squares df
Mean
Square F Sig.
1 Regression 2151.439 4 536.860 88.147 .000b
Residual 1519.368 249 6.102
Total 3670.807 253
a. Dependent variable: Satisfaction
b. Independent variable: Credibility, Irritation, Informative and Digitalization
Table 4.15 above shows the result of Anova test that was conducted using SPSS. F
value is 88.147, p-value = 0.000 which is less than 0.01. Thus, this indicate that there
is significant relationship between all independent variables and dependent variable.
Customer Loyalty = 8.529 + 0.500 (Digitalization) + 0.621 (Informative) + (-.0201)
(Irritation) + (-0.176) (Credibility)
According to the equation above and Table 4.16, regression coefficient of
digitalization is 0.500. This indicates that increase of 1 value unit of digitalization,
viewer satisfaction towards the digital billboards will increase by 0.500. Next,
regression coefficient of informative is 0.621 which shows that increase of 1 value
units of informative, the viewer satisfaction towards the digital billboards will
increase by 0.621. Following, regression coefficient of irritation is -0.117. Thus, if an
Table 4.16: Coefficients
Model Unstandardized
Coefficients
Standardized
Coefficients
t Sig.
B Std. Error Beta
(Constant) 8.529 1.654 5.157 .000
Digitalization .500 .155 .384 3.222 .001
Informative .621 .078 .498 7.944 .000
Irritation -.201 .059 -.166 -3.405 .001
Credibility -.176 .128 -.172 -1.371 .172
a. Dependent Variable: Satisfaction
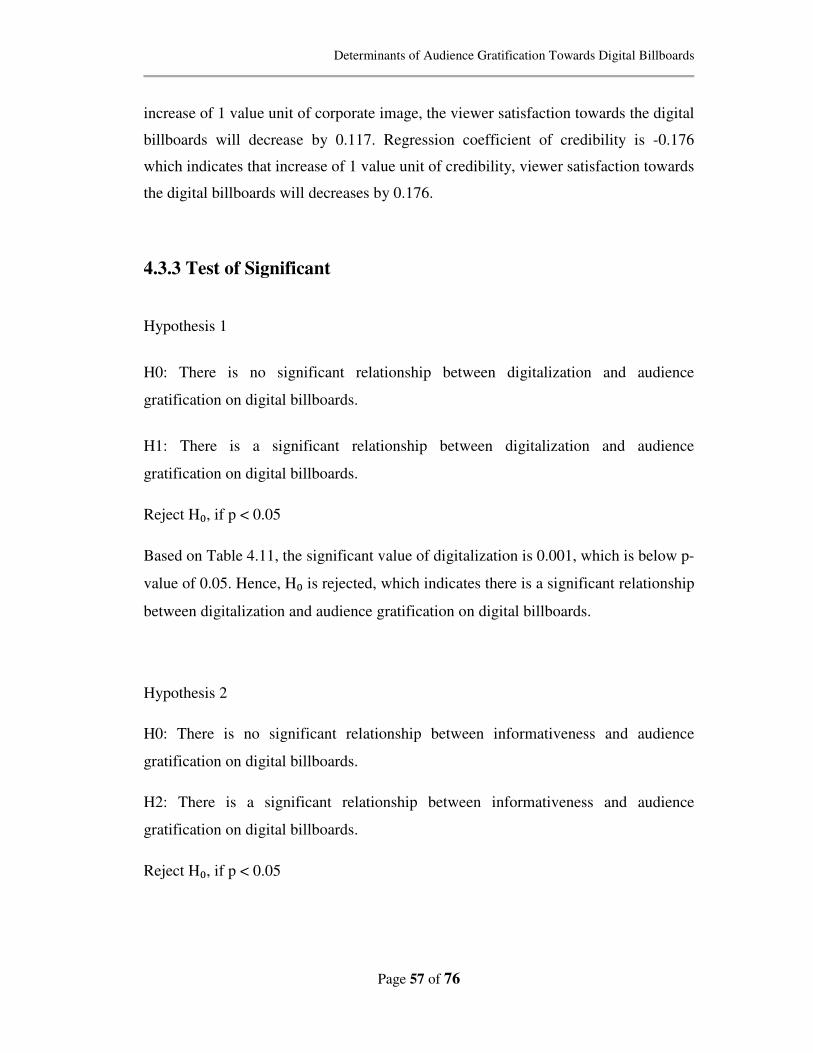
Determinants of Audience Gratification Towards Digital Billboards
Page 57 of 76
increase of 1 value unit of corporate image, the viewer satisfaction towards the digital
billboards will decrease by 0.117. Regression coefficient of credibility is -0.176
which indicates that increase of 1 value unit of credibility, viewer satisfaction towards
the digital billboards will decreases by 0.176.
4.3.3 Test of Significant
Hypothesis 1
H0: There is no significant relationship between digitalization and audience
gratification on digital billboards.
H1: There is a significant relationship between digitalization and audience
gratification on digital billboards.
Reject H₀, if p < 0.05
Based on Table 4.11, the significant value of digitalization is 0.001, which is below p-
value of 0.05. Hence, H₀ is rejected, which indicates there is a significant relationship
between digitalization and audience gratification on digital billboards.
Hypothesis 2
H0: There is no significant relationship between informativeness and audience
gratification on digital billboards.
H2: There is a significant relationship between informativeness and audience
gratification on digital billboards.
Reject H₀, if p < 0.05
Determinants of Audience Gratification Towards Digital Billboards
Page 58 of 76
Based on Table 4.11, the significant value of informative is 0.000, which is below p-
value of 0.05. Hence, H₀ is rejected, which indicates there is a significant relationship
between informative and audience gratification on digital billboards.
Hypothesis 3
H0: There is no negative significant relationship between irritation and audience
gratification on digital billboards.
H3: There is a negative significant relationship between irritation and audience
gratification on digital billboards.
Reject H₀, if p < 0.05
Based on Table 4.11, the significant value of irritation is 0.001, which is below p-
value of 0.05. Hence, H₀ is rejected, which indicates there is a negative significant
relationship between irritation and audience gratification on digital billboards.
Hypothesis 4
H0: There is no significant relationship between credibility and audience gratification
on digital billboards.
H4: There is a significant relationship between credibility and audience gratification
on digital billboards.
Reject H₀, if p < 0.05
Based on Table 4.11, the significant value of credibility is 0.172, which is above p-
value of 0.05. Hence, H4 is rejected, which indicates there is no significant
relationship between credibility and audience gratification on digital billboards.
Determinants of Audience Gratification Towards Digital Billboards
Page 59 of 76
4.4 Conclusion
In this chapter, the results from descriptive analysis, scale measurement and
inferential analysis that was produced out by SPSS were utilized to assess and
investigate the respondents' demographic profile, dependability of five variables and
test whether the free and go between variables has huge effect on subordinate variable
or not. The following part will further talk about the major discoveries in our
exploration and concluding our research.
Determinants of Audience Gratification Towards Digital Billboards
Page 60 of 76
CHAPTER 5: DISCUSSION, CONCLUSION AND
IMPLICATION
5.0 Introduction
This chapter discusses the findings of the previous chapter and interprets the
summary of statistical analyses. Furthermore, it discusses implications and limitations
of the study. It also includes recommendations for future research.
5.1 Summary of Statistical Analyses
5.1.1 Descriptive Analyses
Out of 254 respondents, the majority of the respondents are male which is 50.8% of
the total respondents while 49.2% of the respondents are female.Highest majority of
respondents are from age 20 to 24 which is 37.8%, next is from age 25 to 29 is 16.9%,
third isfrom age 40 and above is 16.1%, fourth is from age 35 to 39 is 14.2%,
fromage 30 to 34 is 9.1%, and lastly from age 15 to 19 is 5.9%. The majority of the
respondents are Chinese with 63.8%, followed by Malay with 18.5%, Indian 16.9 and
lastly Sikh 0.2%. Most of the respondents are degree holder which is 53.5%, diploma
holder is 24.4%, high school graduate is 13.8% and master holder is 8.3%. Majority
of them are employed wages which is 55.1%, followed by student is 29.5%, self-
employed is 7.5%, homemaker is 5.9% and lastly the retiree is 2%. The respondents
thoughts while viewing the ad were attractive is 29.1%, followed by clear is 24.8%,
unattractive is 18.1%, vivid is 10.2%, vague is 9.1% and lastly dull is 8.7%. The
respondents perceived that advertising on outdoor digital billboard pleasing is 44.9%,
followed by entertaining is 32.3% and enjoyable is 22.8%. The breakdown of the
Determinants of Audience Gratification Towards Digital Billboards
Page 61 of 76
respondents’perceived advertising on outdoor digital billboards is a good source of
product information is 37%, 33.5% agree with the advertising supplies relevant
product informationand 29.5% of them believed it provides timely information.
Lastly, most of the respondents believed the advertisements that they saw were 67.3%
helpful, followed by 15.7% unimportant, 11.4% uninformative and lastly 5.5%
useless.
5.1.2 Scale Measurement
5.1.2.1 Reliability Analysis
Reliability test is used to examine the internal reliability of the actual results. Based
on the table 4.12,informative(0.771) has the highest level of alpha coefficient value,
followed by irritation (0.722), digitalization (0.692), and credibility (0.662). For the
dependent variable, satisfaction is 0.671. As every Cronbach’s Alpha result of the
variables tested is above 0.6, the variables show high significant and reliability.
5.1.3 Inferential Analysis
5.1.3.1 Pearson Correlation Analysis
According to Table 4.13, the results show that all the variables are at 0.01 levels (p <
0.01) which indicate every variable are positively correlated to each other.
Informative as the independent variable has the strongest positive correlation to
satisfactionwhere r=0.721, followed by digitalization (r=0.645), credibility (r=0.630)
and lastly irritation (r=-0.530) which is negative correlated to satisfaction.
Determinants of Audience Gratification Towards Digital Billboards
Page 62 of 76
5.1.3.2 Multiple Regression Analysis
Multiple regressions analysis is done to test the relationship between independent
variables and the dependent variable. Based on Table 4.14, it shows that R square is
0.586 which indicate that 58.6% of satisfaction (dependent variable) is affected by the
digitalization, informative, irritation and credibility (independent variable).Besides,
Table 4.15 shows the result of Anova test where F value is 88.147 with p-value =
0.000 which is less than 0.01. This indicates that there is significant relationship
between all independent variables and dependent variable.
Based on Table 4.16, the regression coefficient of informative is 0.621 which indicate
informative has high positive correlation with satisfaction and followed by
digitalization at 0.500. Besides,the regression coefficient of credibility is -0.176
which shows that there is high negative relationship between credibility and
satisfaction. Lastly, the regression coefficient of irritation is -0.117 which indicates
that irritation is negatively correlated with satisfaction.
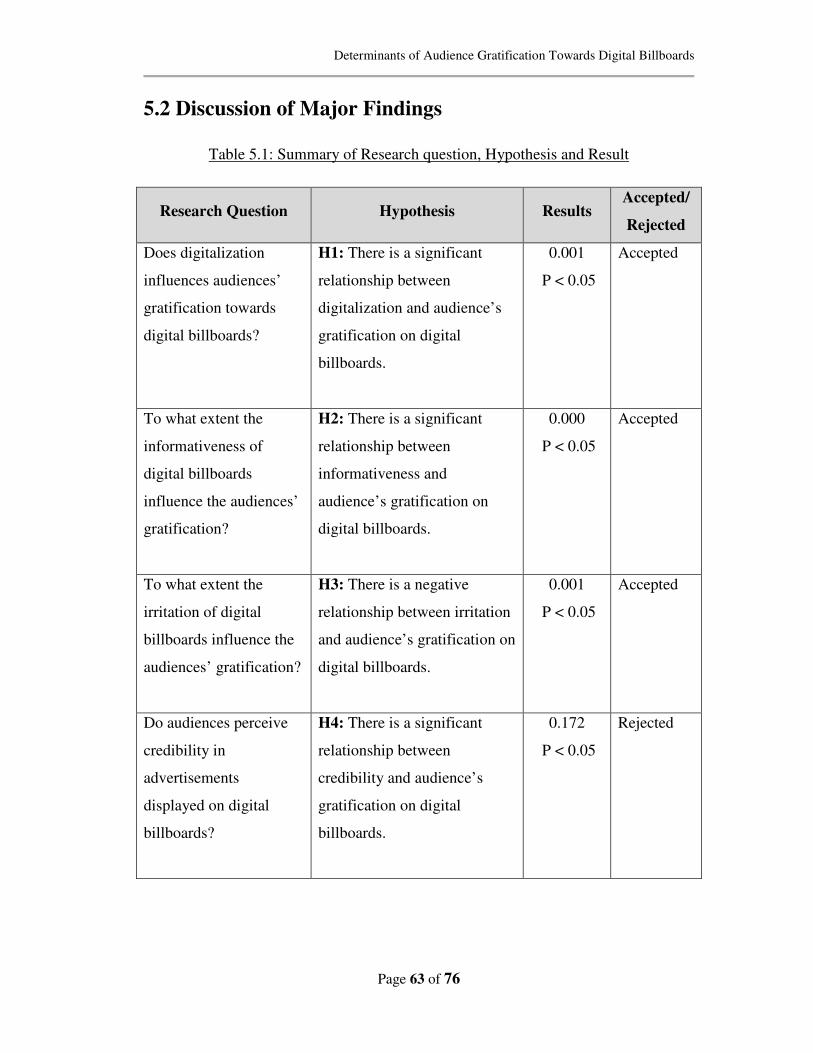
Determinants of Audience Gratification Towards Digital Billboards
Page 63 of 76
5.2 Discussion of Major Findings
Table 5.1: Summary of Research question, Hypothesis and Result
Research Question Hypothesis Results Accepted/
Rejected
Does digitalization
influences audiences’
gratification towards
digital billboards?
H1: There is a significant
relationship between
digitalization and audience’s
gratification on digital
billboards.
0.001
P < 0.05
Accepted
To what extent the
informativeness of
digital billboards
influence the audiences’
gratification?
H2: There is a significant
relationship between
informativeness and
audience’s gratification on
digital billboards.
0.000
P < 0.05
Accepted
To what extent the
irritation of digital
billboards influence the
audiences’ gratification?
H3: There is a negative
relationship between irritation
and audience’s gratification on
digital billboards.
0.001
P < 0.05
Accepted
Do audiences perceive
credibility in
advertisements
displayed on digital
billboards?
H4: There is a significant
relationship between
credibility and audience’s
gratification on digital
billboards.
0.172
P < 0.05
Rejected
Determinants of Audience Gratification Towards Digital Billboards
Page 64 of 76
5.2.1 Digitalization
H0: There is no significant relationship between digitalization and audience
gratification on digital billboards.
H1: There is a significant relationship between digitalization and audience
gratification on digital billboards.
Based on the result from Pearson Correlation Analysis, digitalization is significantly
correlated with audience gratification (r=0.645). Besides, the multiple regression
analysis results found that digitalization is influencing audience gratification towards
advertising through digital billboard positively (p=0.500). Hence, the hypothesis (H1)
is accepted as there is a significant relationship between digitalization and audience
gratification on digital billboards. Meanwhile, in the internal reliability test, the
Cronbach’s Alphavalue for digitalization is 0.692.
The finding is corroborative with the study done by Ducoffe (1995) that
entertainment is significantly related to advertisement value among consumers. This
finding is also further supported from various past studies by respectful researchers
that applied the uses and gratification theory to conceptualize the relationship or
effect of features as well as entertainment on audience gratification in which the
results are in line with this research (Adetunji & Yazam, 2012 as cited in Luo, 2002;
Livaditi, Qimei & Wells, 1999; and MacMillan, 2000). Similarly, audience is
attracted to the vividness, animated and interactive features of digital billboards that
eventually lead to feeling of satisfaction.
Thus, the research objective to assess the relationship between digitalization and
audience gratification is achieved. Besides, the research question of “Does
digitalization influences audiences’ gratification towards digital billboards?” is also
answered accordingly in this study.
Determinants of Audience Gratification Towards Digital Billboards
Page 65 of 76
5.2.2 Informativeness
H0: There is no significant relationship between informativeness and audience
gratification on digital billboards.
H2: There is a significant relationship between informativeness and audience
gratification on digital billboards.
From Pearson Correlation Analysis, informativeness is significantly correlated with
audience gratification (r=0.721). It shows that informativeness has the strongest
significant correlation with audience gratification. Next, the multiple regression
analysis shows that informativeness is influencing audience gratification towards
digital billboards positively (p=0.621). Therefore, the hypothesis (H2) is accepted as
there is significant relationship between informativeness and audience gratification on
digital billboards. At the same time, internal reliability test shows Cronbach’s Alpha
value for informativeness is 0.771 which is the highest score compared with other
variables.
The finding is consistent with the argument by Chien (2011) with proven findings
that information is essential to be displayed regardless in the form of traditional or
digital billboards. Moreover, this present study findings also confirm the findings of
Adetunji & Yazam (2012), Luo (2002), and Ducoffe (1995) in the context of digital
billboards. In addition, information seekers tend to pay more attention to the
advertisement displayed (Rettie, Robinson & Jenner, 2001 as cited in Li & Bukovac,
1999). Likewise, audience values the effectiveness of advertising through digital
billboard that provides information about products or services.
Therefore, the research objective to assess the relationship between informativeness
and audience gratification on digital billboard is achieved. On the other hand, the
research question of “To what extent the informativeness of digital billboards
influence the audiences’ gratification?” is also answered in this study.
Determinants of Audience Gratification Towards Digital Billboards
Page 66 of 76
5.2.3Irritation
H0: There is no significant relationship between irritation and audience gratification
on digital billboards.
H3: There is a negative significant relationship between irritation and audience
gratification on digital billboards.
By referring to the result from Pearson Correlation Analysis, irritation is negative
significantlycorrelated with audience gratification (r=-0.530).It shows that irritation
has the weakest significant correlation with audience gratification. By referring to the
multiple regression analysis results, it shows that irritation is affecting audience
gratification towards digital billboards negatively(p=-0.117), which means that
individuals do experience irritation from digital billboard advertising and have
negative feelings with little or no satisfaction towards the new technology.
Meanwhile, the internal reliability test, the Cronbach’s Alpha value for irritation is
0.722. Thus, the hypothesis (H3) is supported as there is a negative significant
relationship between irritation and audience gratification on digital billboards.
The findings in this current study are supported by Luo (2002) where he found out
that people reject ads that are irritating that are shown in the digital billboards.
Besides, this study also confirms the findings of Ducoffe (1996), Li et al. (2002), and
Rettie et al. (2001). Furthermore, digital billboard can be a form of environmental
pollution that can brings irritation to the audiences as stated by Chien (2011) and
Speck and Elliott (1997).
Hence, the research objective to assess the relationship between irritation and
audience gratification is satisfied. Besides, the research question of “Are audiences
experiencing or addressing irritation issues from digital billboards?” is answered in
this study.
Determinants of Audience Gratification Towards Digital Billboards
Page 67 of 76
5.2.4Credibility
H0: There is no significant relationship between credibility and audience
gratification on digital billboards.
H4: There is a significant relationship between credibility and audience gratification
on digital billboards.
Based on the Pearson Correlation analysis, credibility is significantly correlated with
audience gratification (r=0.630). Besides, the multiple regression analysis indicates
that credibility is not affecting audience gratification towards digital billboards (p=-
0.176). Therefore, the hypothesis (H4) is rejected as there is no significant
relationship between credibility and audience gratification on digital billboards.
Meanwhile, in the internal reliability test, the Cronbach’s Alpha value for credibility
is 0.662which is the lowest score compared with other variables.
Most ofthe past studies indicate that credibility of ads is positively correlated with the
attitude of audiences towards the ads. Bachman (2013) stated that advertisement
nowadays does not have enough credibility which may affect the audiences’
satisfaction negatively but the findings of this study do not reflect the past studies as
the findings show there no significant relationship between credibility and audiences’
gratification. This indicates that the audiences do not take credibility of ads into count
and the ads trustworthiness does not affect audiences’ gratification.
In this case, credibility is not a factor that influences audience gratification. Therefore,
the objective of research to assess the relationship between credibility and audience
gratification on digital billboards has been met. Besides, the research question of “Do
audiences perceive credibility in advertisements displayed on digital billboards?” is
also answered through this study.
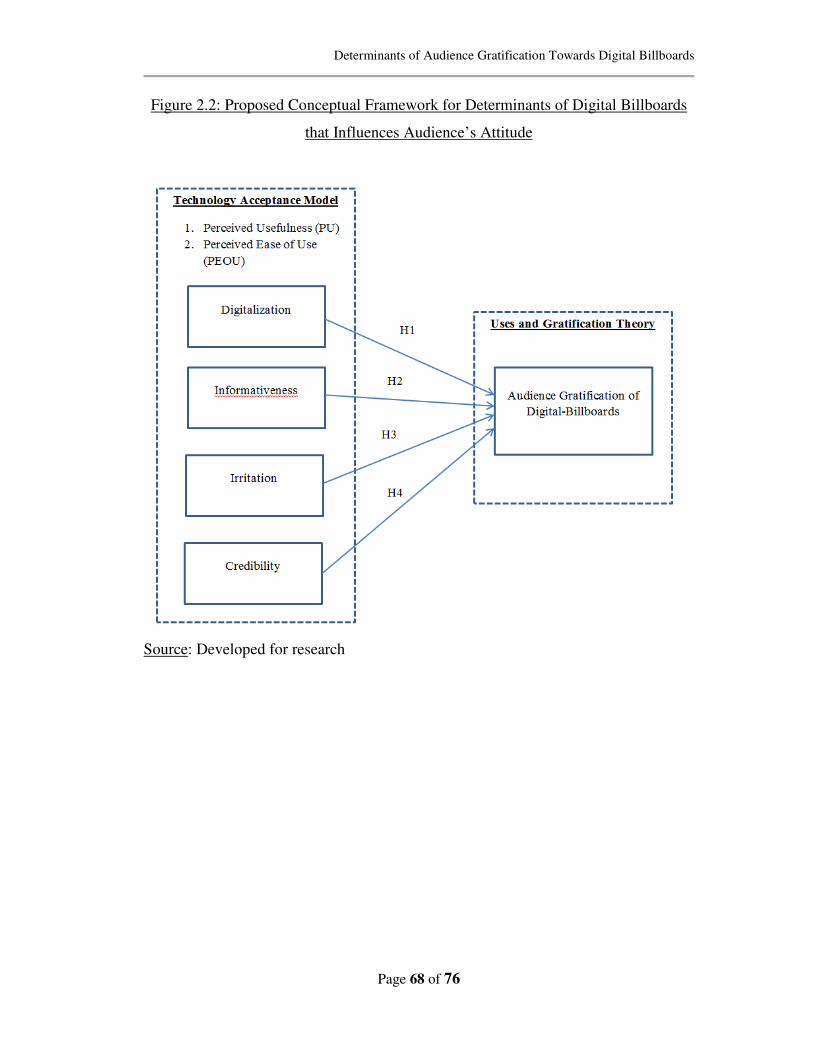
Determinants of Audience Gratification Towards Digital Billboards
Page 68 of 76
Figure 2.2: Proposed Conceptual Framework for Determinants of Digital Billboards
that Influences Audience’s Attitude
Source: Developed for research
Determinants of Audience Gratification Towards Digital Billboards
Page 69 of 76
5.3 Implications of the Study
Results retrieved from analysis are important and substantial to aid managers and
marketers in developing and planning of sales strategies and targets in the business, as
well as managing the business development to achieve goals and objectives.Based on
the proposed framework, marketers could determine the degree of influence of the
factors that affect the audience’s gratitude towards digital billboards and making sure
messages delivered via digital billboards are effective.
5.3.1 Managerial Implication
5.3.1.1 Digitalization
Based on the results, it is found that digitalization has positive impact on influencing
audience gratification on advertising via digital billboard.According to several out of
home advertising websites, the rates of advertising vary according to size, location,
schedules of displays (e.g. daily, weekly, monthly), and minimum message display
duration. The large display of digital billboards portrays larger images and characters
appear to be brighter and can be seen and read from a distant. In conjunction, it is
generally understood that bright lights and motion pictures can draw attention due to
its illumination that is brighter than the surroundings as well as the visual movements
presented (Jerry, 2009). Similarly, high cost may occur in order to capture mass
audience attention.
Determinants of Audience Gratification Towards Digital Billboards
Page 70 of 76
Besides that, color can attract audience to pay attention on the advertisement
(Fernandez & Rosen, 2000). Fernandez & Rosen, 2000 also cautioned that color can
enhance the product’s appealand substantiate verbal claims and markedly increase the
chances of consumer seeking the advertiser when used carefully or vice versa. Not
only the combination or selection of color is the key to attract audience attention,
entertainment is equally important.Ducoffe (1995) explained that to optimize the
value of advertisement, the message should be delivered creatively and able to
entertain audience. Nevertheless, the goal of advertising through digital billboard is to
create brand awareness and to increase sales which in return, the organization benefits
from higher return on investment.
5.3.1.2 Informativeness
Furthermore, among the independent variables tested for this research,
informativeness plays the most influencing role in the audience gratification on
digital billboard advertising. Although messages displayed on digital billboard is
essentialand able to satisfy audience expectations, however, the information presented
should not hold their attention for too long. For that reason, audience may miss out
the rest of the details from the advertisement after successive display or may even
cause unsafe driving as well as traffic congestion among drivers that slow down to
read the message. Therefore, one must keep in mind that message lengths must be
kept short and simple so that the advertisement is optimized for legibility and
readability among target audience (Jerry, 2009).
In Malaysia, there is lack of guidelines specifically on the amount of information to
be displayed on outdoor digital signage. Whereas, there are many research carried on
information presentation and road safety in both the United States and abroad has
developed consistent and clear guidelines for display characteristics including rapid,

Determinants of Audience Gratification Towards Digital Billboards
Page 71 of 76
unambiguous message interpretation as well as ease of reading among audience (Jerry,
2009). Hence, the amount of information should be carefully evaluated even though is
not restricted by the Advertising Standards Authority (1997) Malaysia.
5.3.1.3 Irritation
Besides that, the finding from the research revealed that irritation is another
contributing factor that has a negative impact on audience gratification towards
digital billboard advertising. To avoid or reduce any case of irritation in digital
billboard advertising, the advertisement must not causes any major distraction
towards the drivers (audiences) as to avoid any road accidents (Jessica, Tim, Simon,
and Itan, 2011). To further reduce the amount of irritation on the drivers, one must
avoid using excessive unnecessary graphic and noises of advertisement on digital
billboards. This is to ensure lesser distractions towards the drivers and at the same
time reduces irritation.
Besides, the positioning of the digital billboards should not be perceived as a form of
pollution towards natural views which can cause irritation to the audiences (Chien,
2011). Therefore, it is important to check the level of irritation of digital billboards as
to avoid discomfort and unpleasantness towards the audiences (Luo, 2002). The lower
the irritation of digital billboards, the higher the effectiveness of the advertisements.
Determinants of Audience Gratification Towards Digital Billboards
Page 72 of 76
5.3.1.4 Credibility
This study attains a distinct verdict that there is no relationship between credibility
and audience gratification. Nonetheless, one of the guidelines in Malaysian Code of
Advertising Practice whichestablished by the Advertising Standards Authority (1997)
states that all advertisements should be legal, honest, and truthful. Likewise, omission,
ambiguity or exaggerated claim as well as statements or visual presentation that
directly or by implication in an advertisement that are likely to mislead the consumer
about the presented product or service should not be disregarded (Advertising
Standards Authority, 1997). A booklet prepared by Malaysian Investment
Development Authority (MIDA) (2012) on developing projects in Malaysia added
that “outdoor advertising guidelines and approvals are under the auspices of the
respective state Government/ local authorities.” Hence, if the proposed advertisement
does not follow the laws and regulations imposed, the advertisement will be
disapproved and will cause loss of opportunity and profit by the organization or small
business.
5.4 Limitations of the Study
In this study, there are some limitations during the process of research. Firstly, there
is lack of study particularly on the uses and gratification theory and Technology
Acceptance Model on digital billboards. Likewise, rich information that can be
obtained from qualitative study is neglected due to complexity and short time frame
in conducting the research. Single quantitative method is used in this research
whereby respondents are restricted to give opinions that are beyond the options
provided in the survey questionnaire.
Determinants of Audience Gratification Towards Digital Billboards
Page 73 of 76
Limitations of time constraint and restriction of resources confine the respondents
within Kuala Lumpur area to participate in the questionnaire survey randomly. In
addition, potential respondents’ opinions from other states such as Penang, Johor, and
Malacca are not included in this study as the process of interview requires face to face
interaction among respondents with the presence of digital billboard. The process is
time consuming. Thus, this research is unable to generalize overall digital billboard
advertising landscape in Malaysia.
In conjunction with lack of time and resources limits the translation and verification
of questionnaire survey from English to Malay language by a qualified translator. It
has been a challenge to ensure respondents are able to fully understand the survey
questionnaire in English language as the level of understanding the language varies
among each individual respondent. Unavoidably, respondents may misinterpret or
misunderstood the some of the contents in the questionnaire and yet refuse to seek for
clarification in providing accurate answer. Consequently, it is possible that
respondents may answer the survey questionnaire depending on their feelings,
intuition, and making guesses to complete the survey. However, further explanations
were still given to respondents to ensure optimum accuracy of data collection. Hence,
this causes the survey questionnaire process to be slower.
Furthermore, the variables tested limits to four independent variables namely
digitalization, informativeness, irritation, and credibility. There are other variables
that may influence the audience’s gratification towards digital billboards such as
display environment, size of digital billboard, the ability to recall advertisements and
others that had been discussed by previous researchers or academicians are not
explored in this research.
Determinants of Audience Gratification Towards Digital Billboards
Page 74 of 76
5.5 Recommendations for Future Research
There are several recommendations to improve the quality of future research on
audience gratification towards digital billboards. Future researchers are suggested to
include qualitative research in the study as the method can provide an ambiguous,
complex, and elastic information that may not be obtained from quantitative research.
Next, the duration of research should be extended in order for future researchers to
have sufficient time to plan for resources in terms of travel and accommodation if
necessary to reach out to potential respondents from other areas in Malaysia. For
instance, Penang, Johor, and Malacca is recommended to be explored and conduct
interviews and surveys on audience gratification towards digital billboards as this
new technology are spotted emerging in these states. This would increase the sample
size and improves the overall results and findings from the research which can be
used to represent the digital media landscape of Malaysia.
Furthermore, future researchers should consider to include Malay language in the
survey questionnaire as Bumiputera are in fact, accounts the majority race in
Malaysia. Besides, there are other races that understand Malay language better than
English language. By including dual language in the survey questionnaire, this would
minimize the difficulties faced by some respondents and this would also reduce the
need for researcher to give additional explanations from the questionnaire survey.
Thus, the speed of data collection is not only increased but accurate response from
respondents will also be obtained.
Lastly, future researchers are encouraged to take other variables that affect audience’s
gratification of digital billboards into consideration. This would allow researcher to
have more comprehensive understanding on the needs and demands of today’s
consumer even though more time will be spent in the research review process.
Likewise, the study will provide a wider perspective and enhances the scope of
Determinants of Audience Gratification Towards Digital Billboards
Page 75 of 76
research in understanding the factors in TAM model that affects audiences’
gratification towards digital billboards.
5.6 Conclusion
This study was done to explore the determinants of audiences’ gratification towards
digital billboards by clarifying digitalization, informativeness, irritation, and
credibility. In conjunction, the objective of this research project has been fulfilled in
identifying four variables towards audience’s gratification on digital billboards.
After testing the Pearson Correlation Analysis, Multiple Regression Analysis, and
Internal Reliability Analysis Test, result obtained indicates that the following
variables: digitalization, and informativeness,have positive significant relationship
with the audiences’ gratification while irritation has negative significant relationship
with the audiences’ gratification. On the other hand, this study found that credibility
does not have an impact on audience gratification on digital billboards.
Moving on, the outcome of this research showed that informativenss is the most
important element that influences audiences’ gratification towards digital billboard
advertising and credibility is the least important factor. Besides, this chapter has
discussed the usefulness of the factors for marketers and managers to make the most
strategic decision in advertising via digital billboard. Furthermore, the barriers met
provided with valuable suggestions for future researchers are stated in this chapter.
All in all, digital billboard will continue to develop and grow in near future as this
device is not only economical and effective in delivering messages but it is also an
unavoidable realm from which to reach progressively elusive audiences. Likewise,
Determinants of Audience Gratification Towards Digital Billboards
Page 76 of 76
digital billboard acts as an ideal anchor of integrated marketing communication
among marketers and advertisers. Therefore, this study provides information for
future researchers, academicians and organizations that are interested to make further
investigations on the factors influencing audiences’ gratification on digital billboards.
Determinants of Audience Gratification Towards Digital Billboards
REFERENCES
Aaker, D. S. & Bruzzone D. E. (1985).Causes of irritation in advertising. Journal of
Marketing, 49 (2) ,47-57.
Adetunji, R. R., & Yazam, S. S. N. M. (2012). Assessing Audiences’ Satisfaction of
Advertising Digital-Billboard: A U&G Theoretical Perspective. Proceedings
of the 2nd
. International Conference on Arts, Social Sciences & Technology
Penang, Malaysia, 3rd
. – 5th
March 2012.
Advertising. (2012). Malaysia: Investment in the services sector (21ed.) [Booklet].
Malaysian Investment Development Authority: Author.
Bachman, K. (2013). Do Ad Messages Have a Credibility Problem? Retrieved
October 10, 2014, from http://www.adweek.com/news/advertising-
branding/do-ad-messages-have-credibility-problem-152818
Balasubramanian, S., Peterson, R.A. & Jarvenpaa, S.L. (2002).Exploring the
implications of M-commerce for markets and marketing.Journal of the
Academyof Marketing Science,30(4), pp. 348–361.
Bauer R. A., & Greyser S. A. (1968). Advertising in America consumer view. Boston,
MA: Harvard University.
Bogart, L. (1985). War of the words: Advertising in the Year 2010. Across the Board.
Chien, C. (2011). “Billboard Evolution,” The Four Peaks Review 1.1, 86-97.
Copley, J. (2012). THE YEAR AHEAD FOR... OUTDOOR. Campaign (UK), (2), 29.
Demirdjian, Z. S., & Brungs, S. A. (1984). Perceived Irritation in Advertising: Some
Preliminary Findings. Retrieved October 11, 2014, from
http://www.csulb.edu/~zdemirdj/Earlyp/Perceived%20Irritation%20in%20Ad
vertising.pdf
Determinants of Audience Gratification Towards Digital Billboards
Ducoffe, R. H. (1995). How Consumers Assess the Value of Advertising. Journal Of
Current Issues & Research In Advertising (CTC Press), 17(1), 1.
Ducoffe, R. H. (1996). ADVERTISING VALUE AND ADVERTISING THE WEB.
Journal Of Advertising Research, 36(5), 21-35.
Erdogan, B.Z. (1999) Celebrity endorsement: a literature review. Journal of
Marketing Management, 15(3), pp. 291–314.
FĂDOR, A. (2014). Innovation and technology acceptance model (TAM): A
theoretical approach. Romanian Journal Of Marketing, (2), 59-65.
Fernandez, K. V., & Rosen, D. L. (2000). The Effectiveness of Information and Color
in Yellow Pages Advertising. Journal Of Advertising, 29(2), 59-73.
Goldsmith, R. E., Lafferty, B. A., & Newell, S. J. (2000). The Impact of Corporate
Credibility and Celebrity Credibility on Consumer Reaction to
Advertisements andBrands, Journal of Advertising 29(3), 43 – 54
Jarvenpaa, S.L. & Tractinsky, N. (1999) Consumer trust in an internet store: across-
cultural validation.Journal of Computer Mediated Communications, 5(2).
Retrieved September 27, 2014 from
www.ascusc.org/jcmc/vol5/issue2/jarvenpaa.html/
Jerry, W. (2009). Display Technology for Outdoor Advertising Signs. Retrieved
October 3, 2014, from
http://rightofway.transportation.org/Documents/NCHRP%20Reports/207%28
256%29%20digital%20outdoor%20advertising_aashto.pdf
Jessica, E., Tim H., Simon H., Ion J. (2011, May). Effects of advertising billboards
during simulated driving. Applied Ergonomics, 42(4), 619-626.
Larkin, E. F. (1979).Consumer perceptions of the media and their advertising content.
Journal of Advertising, 8(2), 5-7.
Determinants of Audience Gratification Towards Digital Billboards
Lee, M. R., & Lan, Y. C. (2010). An Investigation of Viewer’s Perception and
Acceptance of Digital Signage. Retrieved September 13, 2014, from anzmac:
http://www.anzmac.org/conference_archive/2010/pdf/anzmac10Final00159.p
df
Li, H., Edwards, S. M. & Lee, J. (2002). Measuring the intrusiveness of
advertisements: Scale development and validation. Journal of advertising,
31(2), 37-47
Edegoh L. O. N., Nwanolue, I. M., & Ezeh. N. C (2013). Audience Assessment of the
Use of Models in Billboard Advertising: A Study of Consumers of Amstel Malt
in Onitsha, Nigeria, 6(1), 217-227.
Lind, D. J. (2008). BILLBOARDS GET A DIGITAL MAKEOVER. ABA Bank
Marketing, 40(4), 34-39.
Lopez-Pumarejo, T. A., & Bassell, M. (2009). The Renaissance of Outdoor
Advertising: From Harlem to Hong Kong. American Journal Of Business
(American Journal Of Business), 24(2), 33-39.
Lou, Y., Korneliussen, T. & Grønhaug, K. (2009) The effect of ad value, ad
placement and ad execution on the perceived intrusiveness of web
advertisements. International Journal of Advertising, 28(4), 623–638.
Luo, X. (2002). Uses and gratifications theory and E-consumer behaviors: A
structural equation modeling study. Journal of interactive advertising, 2(2),
[No Pagination], Retrieved September 29, 2014, from
http://www.jiad.org/article22.html.
MacMillan, S. J. (2000). Mass Media and the Concept of Interactivity: An
Exploratory Study of Online Forums and Reader E-Mail. Media, Culture &
Society, 22 (2), 205-221.
Malaysian Code of Advertising Practice (3rd
ed.). (2008, September). Retrieved
October 3, 2014, from http://www.unicef.org/malaysia/Code-of-Advertising-
Practice.pdf
Determinants of Audience Gratification Towards Digital Billboards
Malaysian Communications and Multimedia Commission (SKMM).(2009),
Advertising Development in Malaysia: Catching Eyeballs in Changing
Media.Cyberjaya,Selangor:from;
http://www.skmm.gov.my/skmmgovmy/files/attachments/Ad_Dev_Malaysia.
McQuail, D. (2001). With more handsight: Conceptual problems and some ways
forward for media use research [Electronic version]. Communications, 26(4),
337-350.
Michael, A. (2011, April). Out-of-Home run. Brandweek, 52(14), 1-7. Retrieved
September 27, 2014, from Academic source premier database.
Peng, D. (2012). Factors Influencing Consumers' Acceptance of Mobile Marketing:
An Empirical Study of the Chinese Youth Market. International Journal Of
China Marketing, 2(2), 24-37.
Outdoor Advertising Association of America, Inc.. (2014). Out of home advertising
today, America: from;
http://www.oaaa.org/Portals/0/Public%20PDFs/Outdoor%20Advertising%20
Today.pdf
Outdoor Advertising Association of America, Inc.. (2011). Digital billboards today,
America: from;
http://www.oaaa.org/Portals/0/Public%20PDFs/Outdoor%20Advertising%20
Today.pdf
Qimei, C., & Wells, W. D. (1999). Attitude toward the Site. Journal Of Advertising
Research, 39(5), 27-37.
Plummer J. T. (1971). A theoretical view of advertising communication. Journal of
communication, 21, 315-25.
Determinants of Audience Gratification Towards Digital Billboards
PowerScreen. (2014).Why Choose PowerScreen. Retrieved October 18, 2014, from
http://www.powerscreen.com.my/products/why-choose-powerscreen
Rückriem, G., Ang-Stein, C., & Erdmann, J. W. (2011). Understanding Media
Revolution: How Digitalization is to be Considered. Retrieved November 10,
2014, from
http://shiftingschool.files.wordpress.com/2011/04/understanding_mediarevolu
tion.pdf
Saudat, S. A, & Ridwan, A. R. (2012). The role of cultural elements on advertisement
reception: A case of Malaysians. International Journal on Social Science,
Economics & Art, 2(1), 7-12.
Speck, P. S., & Elliott, M. T. (1997).Predictors of Advertising Avoidance in Print and
Broadcast Media.Journal of Advertising, 26, 61-76.
Stewart, D. W., & Pavlou, P. A. (2002). From Consumer Response to Active
Consumer: Measuring the Effectiveness of Interactive Media, Journal of the
Academy of Marketing Science, 30(4), 376 – 396
Sundar, S., & Limperos, A. M. (2013). Uses and Grats 2.0: New Gratifications for
New Media. Journal Of Broadcasting & Electronic Media, 57(4), 504-525.
doi:10.1080/08838151.2013.845827
The Neilsen Co. (2012). The Asian media landscape is turning digital. Retrieved
October 18, 2014, from
http://www.nielsen.com/content/dam/corporate/au/en/reports/2012/changing-
asian-media-landscape-feb2012.pdf
Tullamn, M. (2004). Ready For Take Off: Getting Beyond The Pilot In Dynamic
Digital Sinage. Systems Contractor News New York, 62.
Varey, R.J. (2002) Marketing Communication: Principles and Practice. London:
Routledge
Determinants of Audience Gratification Towards Digital Billboards
Venkatesh, V., Mo Morris, M.G., Davis, G.B., & Davis, F.D.(2003). User acceptance
of information technology: Toward a unified view. MIS Quarterly, 27, 425-
478.
Watt.(2014). Billboard Advertising – Outdoor Advertisement Boost Business
Credibility. Retrieved October 9, 2014, from http://www.xzslf.com/billboard-
advertising-outdoor-advertisements-boost-business-credibility/
Wells, W.D., Leavitt, C., & McConville, M. (1971).A reaction profile for TV
commercials.
Alwitt, L.F., & Prabhaker, P.R. (1992).Functional and belief dimensions of attitudes
to television advertising: Implications for copytesting. Journal of
Advertising Research, 32(5), 30–42.
Winmmer, R. D.,& Dominick, J. R. (2011). Mass Media Research, an Introduction.
(9th Ed.). Canada: Wadsworth cengage learning.
Zhang, P. (2000) The Effect of Animation on Information Seeking Performance on
the World Wide Web: Securing Attention or Interfering with Primary Tasks,
Journal of Association for Information Systems(JAIS), 1(1), 2000.
Determinants of Audience Gratification Towards Digital Billboards
Appendix A: Questionnaire
BACHELOR OF INTERNATIONAL BUSINESS (HONS)
FINAL YEAR PROJECT
TITLE OF RESEARCH:
The Determinants of Audience Gratification towards Digital Billboards
Survey Questionnaire
Dear respondents,
We are undergraduate students of Bachelor of International Business (Hons), from
Universiti Tunku Abdul Rahman (UTAR). The purpose of this study is to find out
the audience satisfaction from advertising through digital billboards in Kuala Lumpur.
Your answers will be kept PRIVATE and CONFIDENTIAL and used solely for
academic study purposes.
Thank you for your cooperation.
Name ID No.
Koh Yi Luan 11UKB01348
Lok Chuan Ming 11UKB07426
Syed Hasif 09UKB04430
Instructions:
1. There are THREE partsin this questionnaire. Please answer ALL questions
in ALL sections.
2. Section A consists of questions on Construct Measurement. In Section B, it
consists of questions related to the General knowledge. In Section C, the
questions are pertaining to the respondents’ demographic profiles.
3. The contents of this questionnaire will be kept strictly confidential.
Completion of this form will take you approximately 10 to 15 minutes.
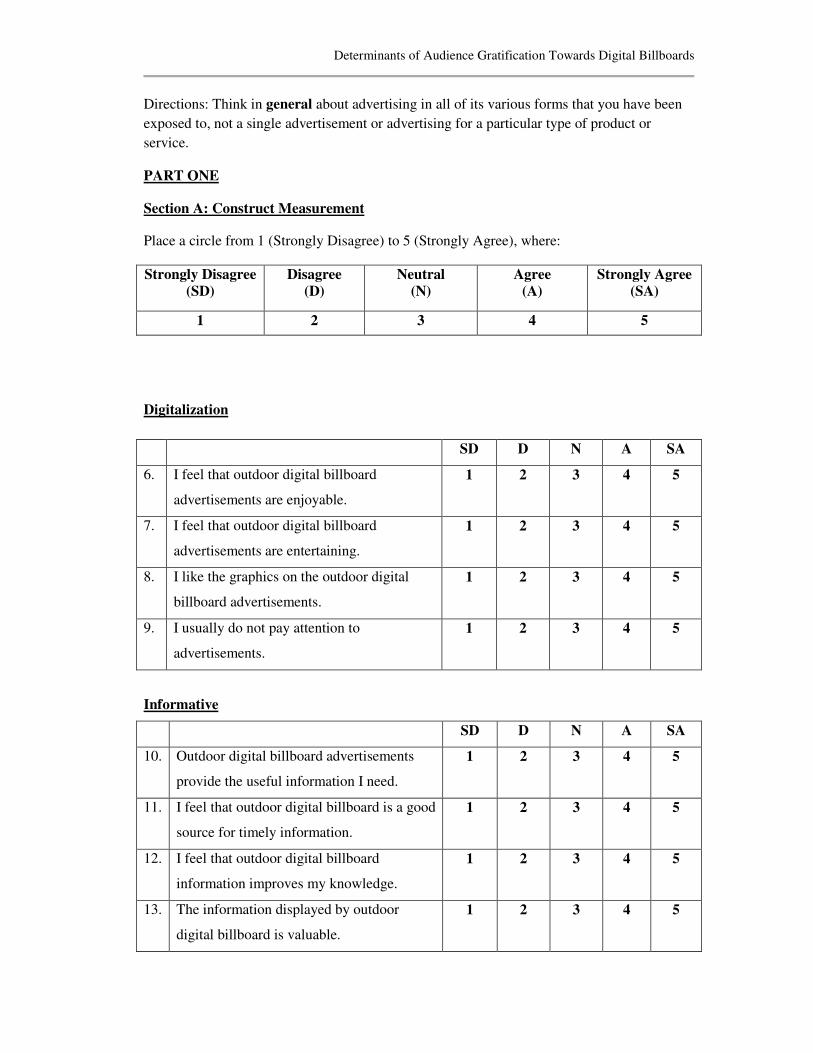
Determinants of Audience Gratification Towards Digital Billboards
Directions: Think in general about advertising in all of its various forms that you have been
exposed to, not a single advertisement or advertising for a particular type of product or
service.
PART ONE
Section A: Construct Measurement
Place a circle from 1 (Strongly Disagree) to 5 (Strongly Agree), where:
Strongly Disagree
(SD)
Disagree
(D)
Neutral
(N)
Agree
(A)
Strongly Agree
(SA)
1 2 3 4 5
Digitalization
SD D N A SA
6. I feel that outdoor digital billboard
advertisements are enjoyable.
1 2 3 4 5
7. I feel that outdoor digital billboard
advertisements are entertaining.
1 2 3 4 5
8. I like the graphics on the outdoor digital
billboard advertisements.
1 2 3 4 5
9. I usually do not pay attention to
advertisements.
1 2 3 4 5
Informative
SD D N A SA
10. Outdoor digital billboard advertisements
provide the useful information I need.
1 2 3 4 5
11. I feel that outdoor digital billboard is a good
source for timely information.
1 2 3 4 5
12. I feel that outdoor digital billboard
information improves my knowledge.
1 2 3 4 5
13. The information displayed by outdoor
digital billboard is valuable.
1 2 3 4 5
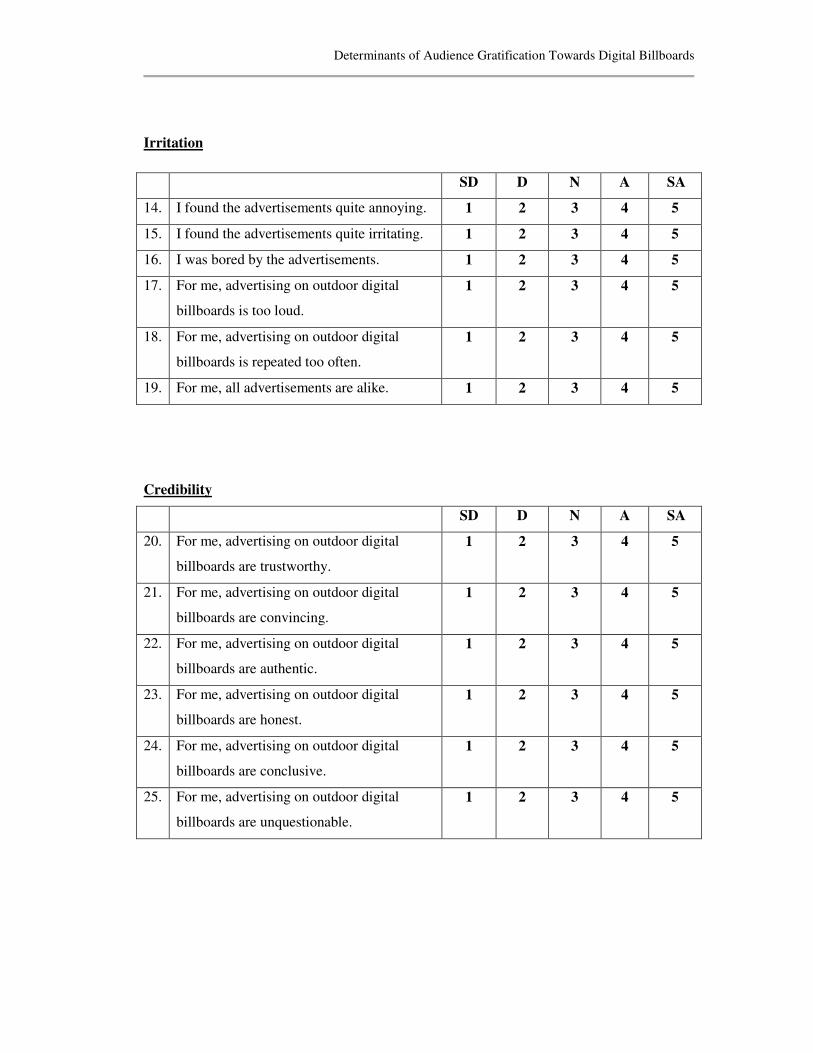
Determinants of Audience Gratification Towards Digital Billboards
Irritation
SD D N A SA
14. I found the advertisements quite annoying. 1 2 3 4 5
15. I found the advertisements quite irritating. 1 2 3 4 5
16. I was bored by the advertisements. 1 2 3 4 5
17. For me, advertising on outdoor digital
billboards is too loud.
1 2 3 4 5
18. For me, advertising on outdoor digital
billboards is repeated too often.
1 2 3 4 5
19. For me, all advertisements are alike. 1 2 3 4 5
Credibility
SD D N A SA
20. For me, advertising on outdoor digital
billboards are trustworthy.
1 2 3 4 5
21. For me, advertising on outdoor digital
billboards are convincing.
1 2 3 4 5
22. For me, advertising on outdoor digital
billboards are authentic.
1 2 3 4 5
23. For me, advertising on outdoor digital
billboards are honest.
1 2 3 4 5
24. For me, advertising on outdoor digital
billboards are conclusive.
1 2 3 4 5
25. For me, advertising on outdoor digital
billboards are unquestionable.
1 2 3 4 5
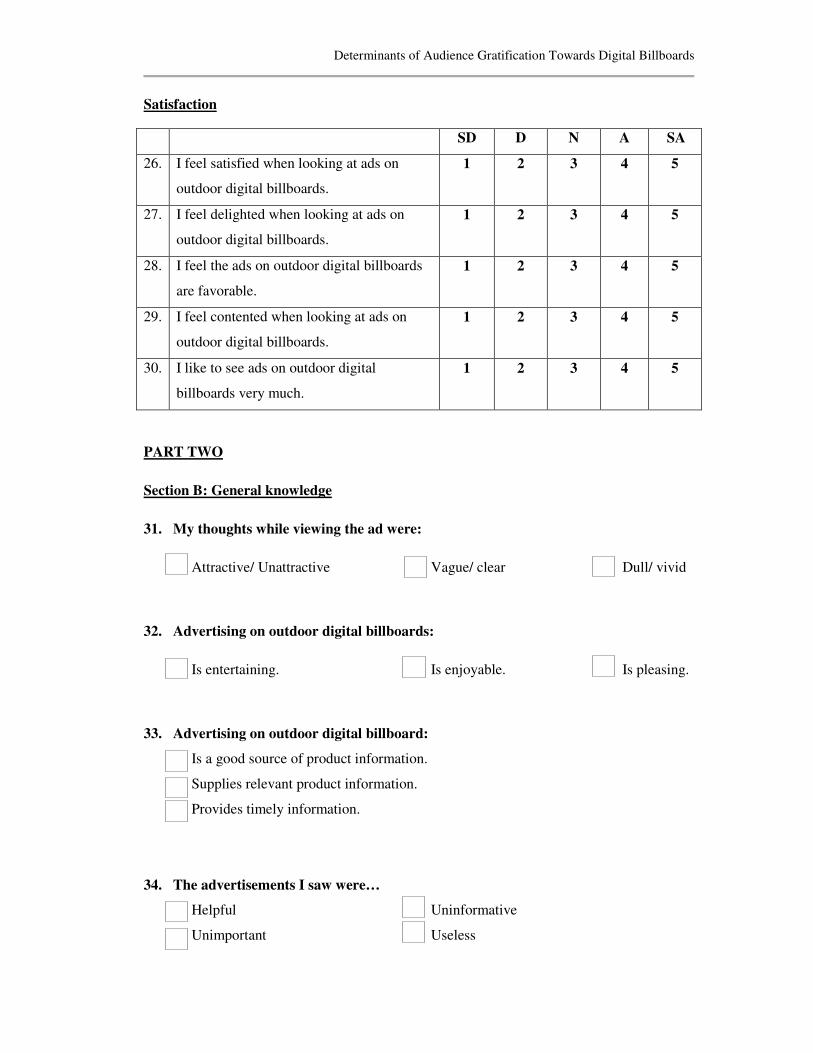
Determinants of Audience Gratification Towards Digital Billboards
Satisfaction
SD D N A SA
26. I feel satisfied when looking at ads on
outdoor digital billboards.
1 2 3 4 5
27. I feel delighted when looking at ads on
outdoor digital billboards.
1 2 3 4 5
28. I feel the ads on outdoor digital billboards
are favorable.
1 2 3 4 5
29. I feel contented when looking at ads on
outdoor digital billboards.
1 2 3 4 5
30. I like to see ads on outdoor digital
billboards very much.
1 2 3 4 5
PART TWO
Section B: General knowledge
31. My thoughts while viewing the ad were:
Attractive/ Unattractive Vague/ clear Dull/ vivid
32. Advertising on outdoor digital billboards:
Is entertaining. Is enjoyable. Is pleasing.
33. Advertising on outdoor digital billboard:
Is a good source of product information.
Supplies relevant product information.
Provides timely information.
34. The advertisements I saw were…
Helpful Uninformative
Unimportant Useless

Determinants of Audience Gratification Towards Digital Billboards
PART THREE
Section C: Demographic Information(Place a TICK for each question)
1. Gender
Male Female
2. Age
15-19 20-24 25-29 30-34 35-39
40 and above
3. Race
Malay Indian
Chinese Other (Please specify): _________________
4. Education
High School Degree
Diploma/ Certificate Master
5. Professional or Employment Status
Student Homemaker (Eg. Housewife)
Self-employed Retired
Employed for wages Other (Please specify):
__________________
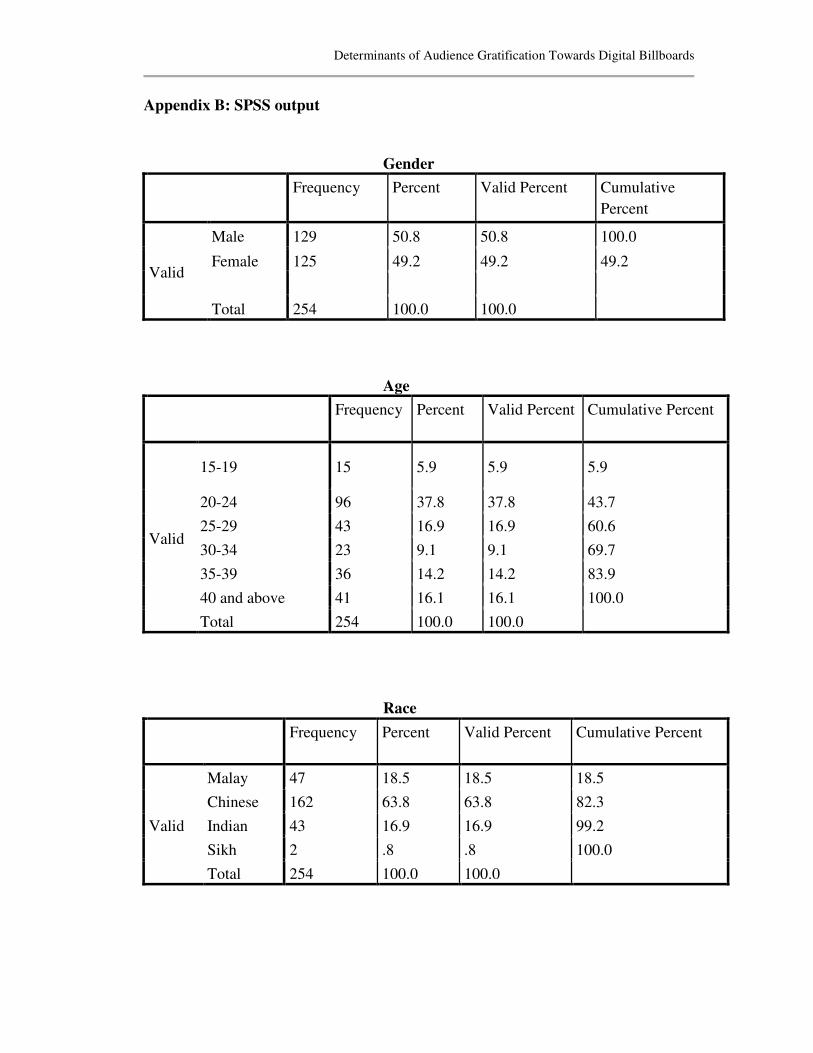
Determinants of Audience Gratification Towards Digital Billboards
Appendix B: SPSS output
Gender
Frequency Percent Valid Percent Cumulative
Percent
Valid
Male 129 50.8 50.8 100.0
Female 125 49.2 49.2 49.2
Total 254 100.0 100.0
Race
Frequency Percent Valid Percent Cumulative Percent
Valid
Malay 47 18.5 18.5 18.5
Chinese 162 63.8 63.8 82.3
Indian 43 16.9 16.9 99.2
Sikh 2 .8 .8 100.0
Total 254 100.0 100.0
Age
Frequency Percent Valid Percent Cumulative Percent
Valid
15-19 15 5.9 5.9 5.9
20-24 96 37.8 37.8 43.7
25-29 43 16.9 16.9 60.6
30-34 23 9.1 9.1 69.7
35-39 36 14.2 14.2 83.9
40 and above 41 16.1 16.1 100.0
Total 254 100.0 100.0
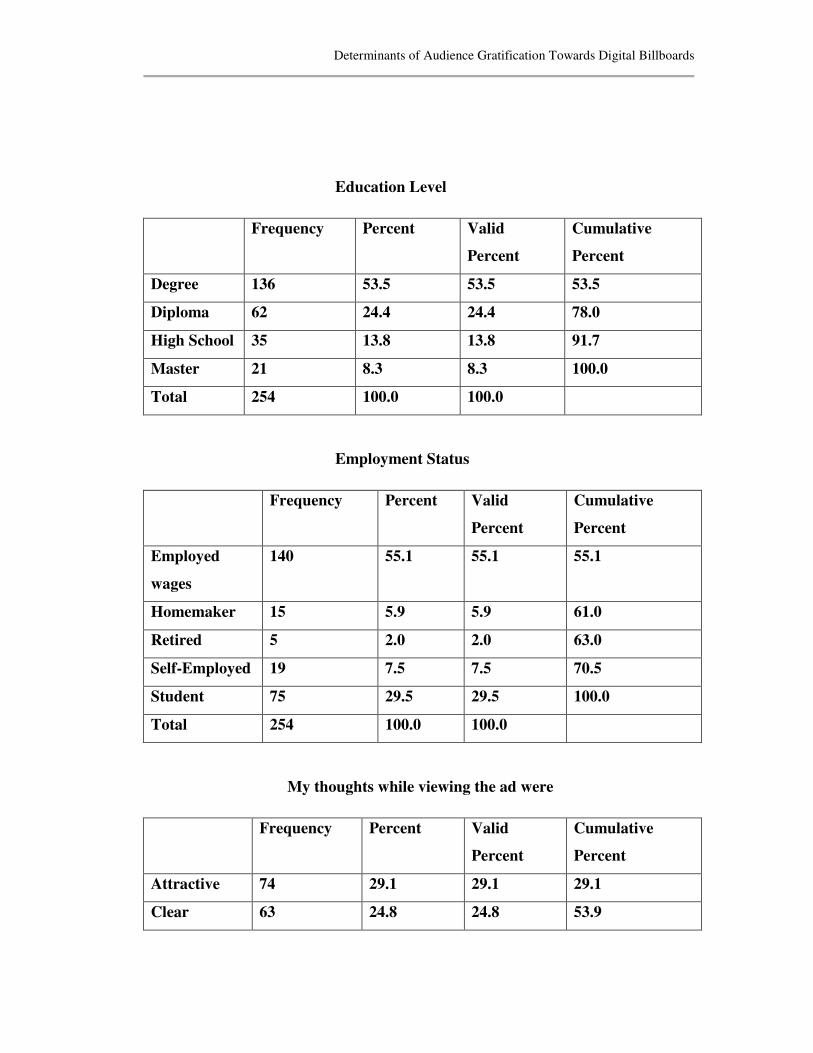
Determinants of Audience Gratification Towards Digital Billboards
Education Level
Frequency Percent Valid
Percent
Cumulative
Percent
Degree 136 53.5 53.5 53.5
Diploma 62 24.4 24.4 78.0
High School 35 13.8 13.8 91.7
Master 21 8.3 8.3 100.0
Total 254 100.0 100.0
Employment Status
Frequency Percent Valid
Percent
Cumulative
Percent
Employed
wages
140 55.1 55.1 55.1
Homemaker 15 5.9 5.9 61.0
Retired 5 2.0 2.0 63.0
Self-Employed 19 7.5 7.5 70.5
Student 75 29.5 29.5 100.0
Total 254 100.0 100.0
My thoughts while viewing the ad were
Frequency Percent Valid
Percent
Cumulative
Percent
Attractive 74 29.1 29.1 29.1
Clear 63 24.8 24.8 53.9
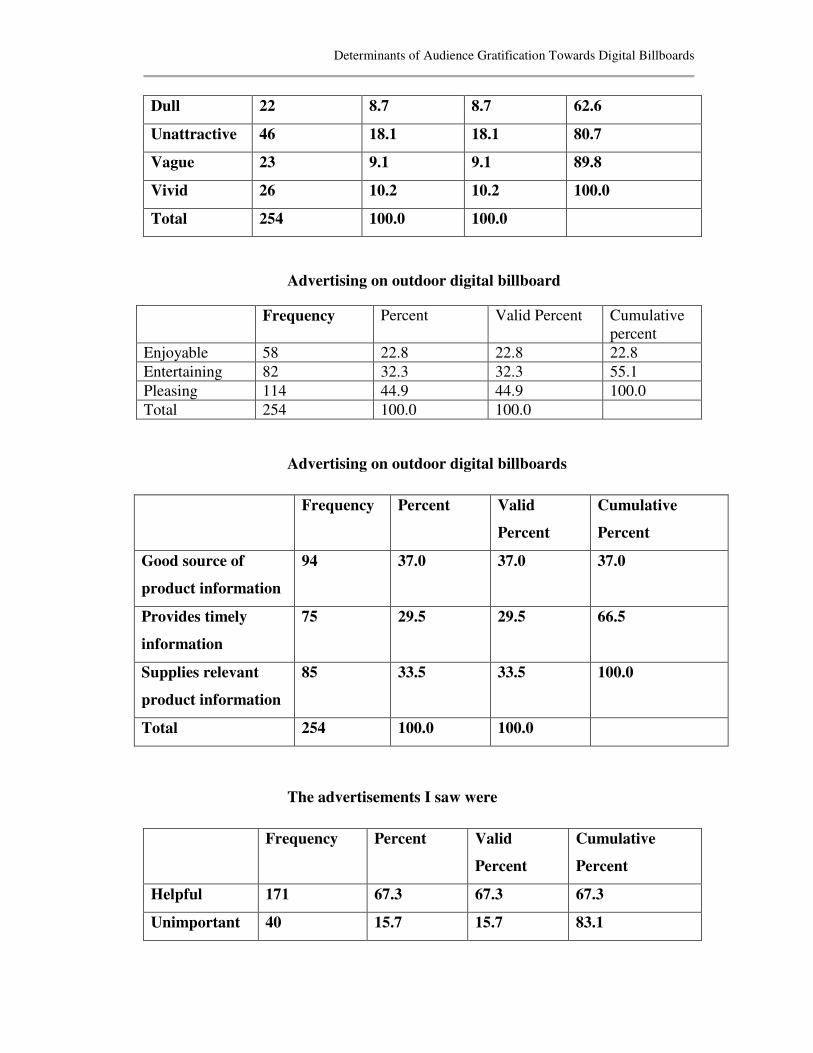
Determinants of Audience Gratification Towards Digital Billboards
Dull 22 8.7 8.7 62.6
Unattractive 46 18.1 18.1 80.7
Vague 23 9.1 9.1 89.8
Vivid 26 10.2 10.2 100.0
Total 254 100.0 100.0
Advertising on outdoor digital billboard
Frequency Percent Valid Percent Cumulative
percent
Enjoyable 58 22.8 22.8 22.8
Entertaining 82 32.3 32.3 55.1
Pleasing 114 44.9 44.9 100.0
Total 254 100.0 100.0
Advertising on outdoor digital billboards
Frequency Percent Valid
Percent
Cumulative
Percent
Good source of
product information
94 37.0 37.0 37.0
Provides timely
information
75 29.5 29.5 66.5
Supplies relevant
product information
85 33.5 33.5 100.0
Total 254 100.0 100.0
The advertisements I saw were
Frequency Percent Valid
Percent
Cumulative
Percent
Helpful 171 67.3 67.3 67.3
Unimportant 40 15.7 15.7 83.1
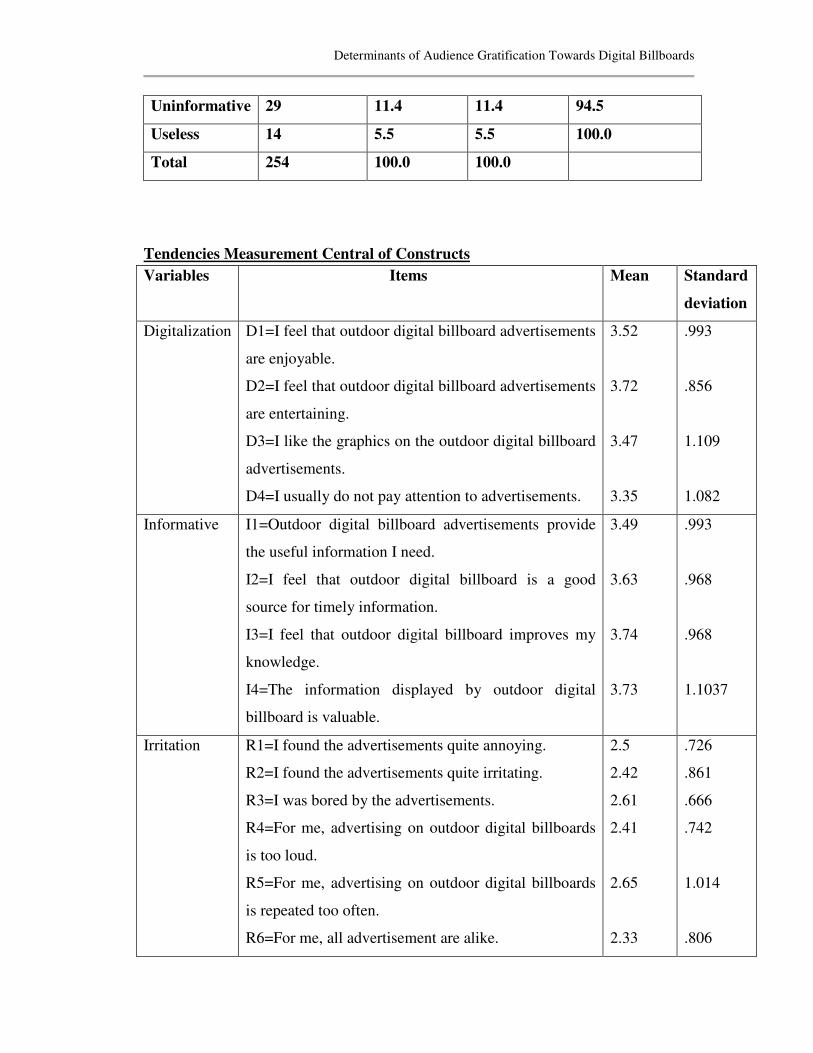
Determinants of Audience Gratification Towards Digital Billboards
Uninformative 29 11.4 11.4 94.5
Useless 14 5.5 5.5 100.0
Total 254 100.0 100.0
Tendencies Measurement Central of Constructs
Variables Items Mean Standard
deviation
Digitalization D1=I feel that outdoor digital billboard advertisements
are enjoyable.
D2=I feel that outdoor digital billboard advertisements
are entertaining.
D3=I like the graphics on the outdoor digital billboard
advertisements.
D4=I usually do not pay attention to advertisements.
3.52
3.72
3.47
3.35
.993
.856
1.109
1.082
Informative I1=Outdoor digital billboard advertisements provide
the useful information I need.
I2=I feel that outdoor digital billboard is a good
source for timely information.
I3=I feel that outdoor digital billboard improves my
knowledge.
I4=The information displayed by outdoor digital
billboard is valuable.
3.49
3.63
3.74
3.73
.993
.968
.968
1.1037
Irritation R1=I found the advertisements quite annoying.
R2=I found the advertisements quite irritating.
R3=I was bored by the advertisements.
R4=For me, advertising on outdoor digital billboards
is too loud.
R5=For me, advertising on outdoor digital billboards
is repeated too often.
R6=For me, all advertisement are alike.
2.5
2.42
2.61
2.41
2.65
2.33
.726
.861
.666
.742
1.014
.806
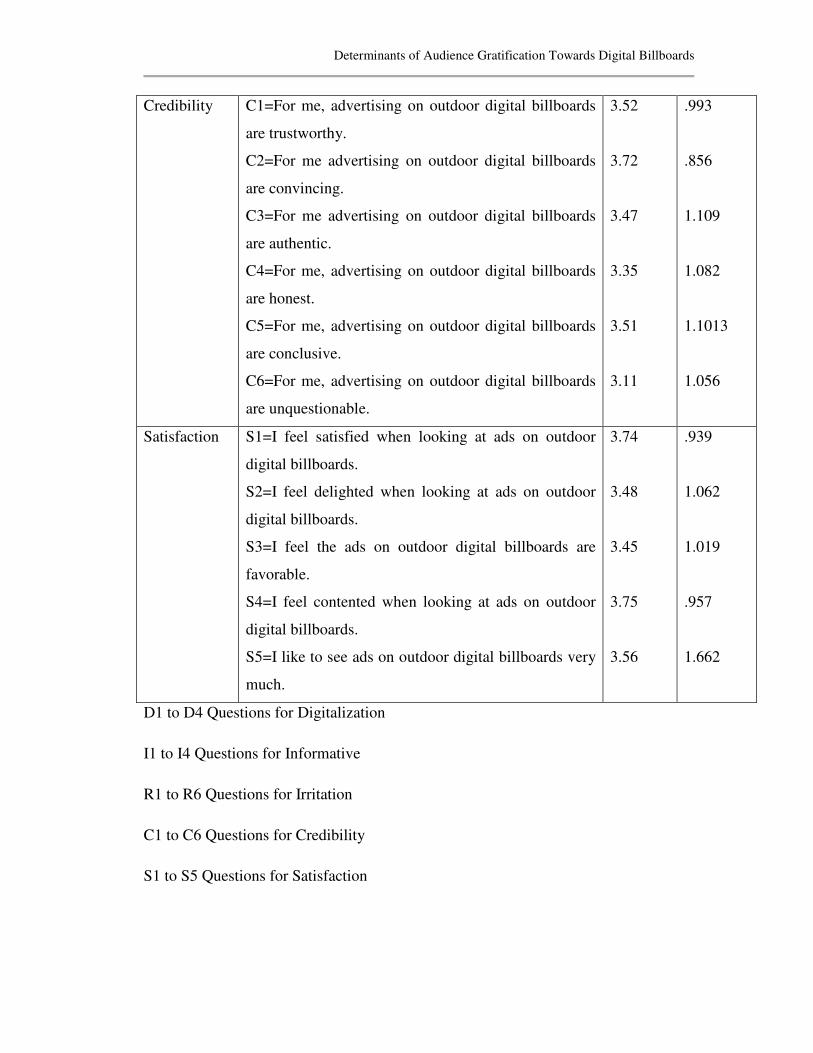
Determinants of Audience Gratification Towards Digital Billboards
Credibility C1=For me, advertising on outdoor digital billboards
are trustworthy.
C2=For me advertising on outdoor digital billboards
are convincing.
C3=For me advertising on outdoor digital billboards
are authentic.
C4=For me, advertising on outdoor digital billboards
are honest.
C5=For me, advertising on outdoor digital billboards
are conclusive.
C6=For me, advertising on outdoor digital billboards
are unquestionable.
3.52
3.72
3.47
3.35
3.51
3.11
.993
.856
1.109
1.082
1.1013
1.056
Satisfaction S1=I feel satisfied when looking at ads on outdoor
digital billboards.
S2=I feel delighted when looking at ads on outdoor
digital billboards.
S3=I feel the ads on outdoor digital billboards are
favorable.
S4=I feel contented when looking at ads on outdoor
digital billboards.
S5=I like to see ads on outdoor digital billboards very
much.
3.74
3.48
3.45
3.75
3.56
.939
1.062
1.019
.957
1.662
D1 to D4 Questions for Digitalization
I1 to I4 Questions for Informative
R1 to R6 Questions for Irritation
C1 to C6 Questions for Credibility
S1 to S5 Questions for Satisfaction
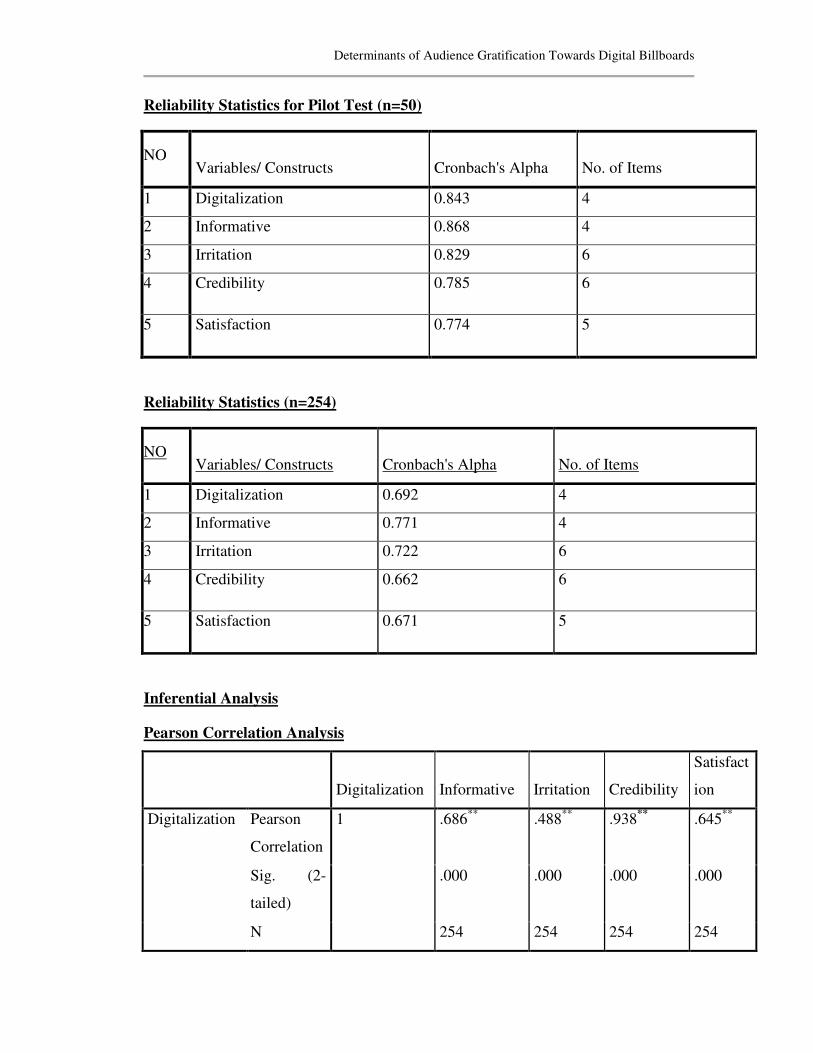
Determinants of Audience Gratification Towards Digital Billboards
Reliability Statistics for Pilot Test (n=50)
NO Variables/ Constructs Cronbach's Alpha No. of Items
1 Digitalization 0.843 4
2 Informative 0.868 4
3 Irritation 0.829 6
4 Credibility 0.785 6
5 Satisfaction 0.774 5
Reliability Statistics (n=254)
NO Variables/ Constructs Cronbach's Alpha No. of Items
1 Digitalization 0.692 4
2 Informative 0.771 4
3 Irritation 0.722 6
4 Credibility 0.662 6
5 Satisfaction 0.671 5
Inferential Analysis
Pearson Correlation Analysis
Digitalization Informative Irritation Credibility
Satisfact
ion
Digitalization Pearson
Correlation
1 .686**
.488**
.938**
.645**
Sig. (2-
tailed)
.000 .000 .000 .000
N 254 254 254 254
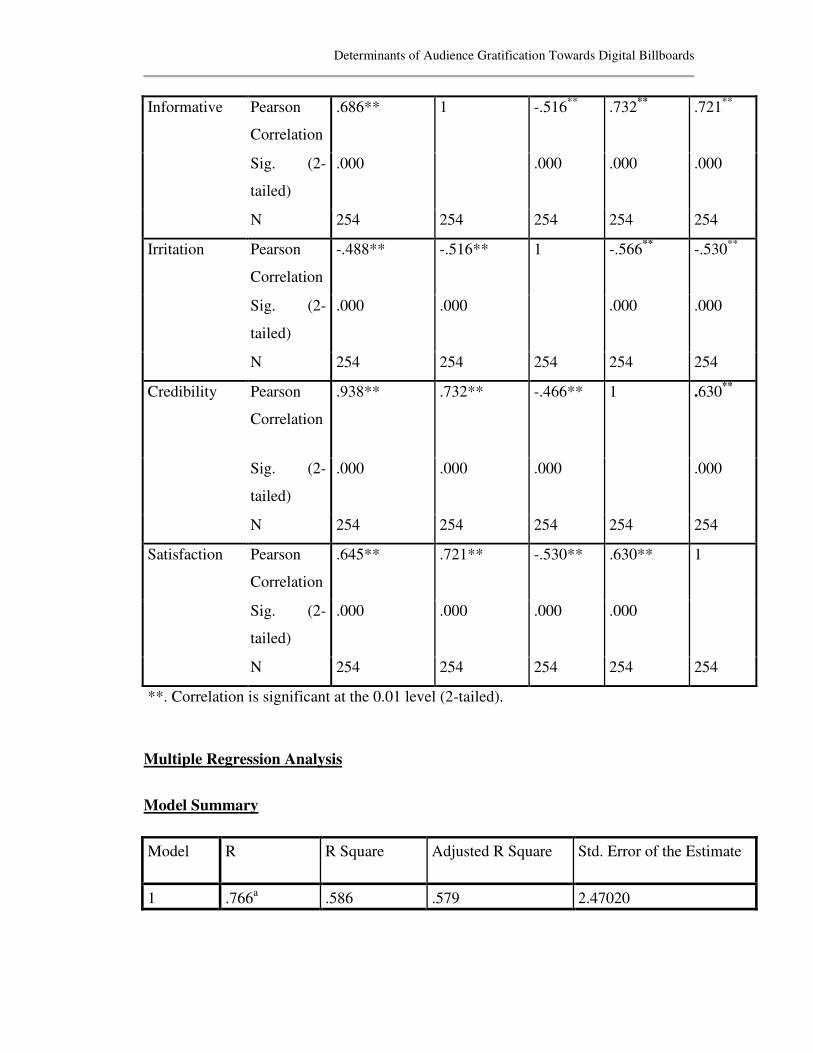
Determinants of Audience Gratification Towards Digital Billboards
Informative Pearson
Correlation
.686** 1 -.516**
.732**
.721**
Sig. (2-
tailed)
.000
.000 .000 .000
N 254 254 254 254 254
Irritation Pearson
Correlation
-.488** -.516** 1 -.566**
-.530**
Sig. (2-
tailed)
.000 .000
.000 .000
N 254 254 254 254 254
Credibility Pearson
Correlation
.938** .732** -.466** 1 .630**
Sig. (2-
tailed)
.000 .000 .000
.000
N 254 254 254 254 254
Satisfaction Pearson
Correlation
.645** .721** -.530** .630** 1
Sig. (2-
tailed)
.000 .000 .000 .000
N 254 254 254 254 254
**. Correlation is significant at the 0.01 level (2-tailed).
Multiple Regression Analysis
Model Summary
Model R R Square Adjusted R Square Std. Error of the Estimate
1 .766a .586 .579 2.47020

Determinants of Audience Gratification Towards Digital Billboards
b. Predictors: (Constant), Digitalization, Informative, Irritation and Credibility.
c. Dependent variable: Satisfaction
d. Independent variable: Credibility, Irritation, Informative and Digitalization
ANOVA
Model
Sum of
Squares df
Mean
Square F Sig.
1 Regression 2151.439 4 536.860 88.147 .000b
Residual 1519.368 249 6.102
Total 3670.807 253
Coefficients
Model Unstandardized
Coefficients
Standardized
Coefficients
t Sig.
B Std. Error Beta
(Constant) 8.529 1.654 5.157 .000
Digitalization .500 .155 .384 3.222 .001
Informative .621 .078 .498 7.944 .000
Irritation -.201 .059 -.166 -3.405 .001
Credibility -.176 .128 -.172 -1.371 .172
b. Dependent Variable: Satisfaction