Embed Size (px)
Citation preview

NBER WORKING PAPER SERIES
THE DETERMINANTS OF NATIONAL COMPETITIVENESS
Mercedes DelgadoChristian Ketels
Michael E. PorterScott Stern
Working Paper 18249http://www.nber.org/papers/w18249
NATIONAL BUREAU OF ECONOMIC RESEARCH1050 Massachusetts Avenue
Cambridge, MA 02138July 2012
The authors would like to acknowledge invaluable guidance from Antonio Ciccone, and essential dataanalysis by Rich Bryden. Albert Bravo-Biosca, Aart Kraay and Giuseppe Iarossi offered very helpfulsuggestions. We are also grateful to the World Economic Forum’s Global Competitiveness Networkteam, and the participants in the seminars at the World Bank, the Inter-American Development Bank,Orkestra, Temple University, BI Norwegian Business School, Tsinghua University, Drexel University,Lehigh University, and MOC faculty workshop for very helpful comments. The authors at varioustimes made compensated presentations at meetings that focused on issues of national competitiveness,using the data and results presented in the enclosed paper. This work was funded in part by the WorldEconomic Forum. The views expressed herein are those of the authors and do not necessarily reflectthe views of the National Bureau of Economic Research.
NBER working papers are circulated for discussion and comment purposes. They have not been peer-reviewed or been subject to the review by the NBER Board of Directors that accompanies officialNBER publications.
© 2012 by Mercedes Delgado, Christian Ketels, Michael E. Porter, and Scott Stern. All rights reserved.Short sections of text, not to exceed two paragraphs, may be quoted without explicit permission providedthat full credit, including © notice, is given to the source.

The Determinants of National CompetitivenessMercedes Delgado, Christian Ketels, Michael E. Porter, and Scott SternNBER Working Paper No. 18249July 2012JEL No. O12,O47,O5
ABSTRACT
We define foundational competitiveness as the expected level of output per working-age individualthat is supported by the overall quality of a country as a place to do business. The focus on outputper potential worker, a broader measure of national productivity than output per current worker, reflectsthe dual role of workforce participation and output per worker in determining a nation’s standard ofliving. Our framework highlights three broad and interrelated drivers of foundational competitiveness: social infrastructure and political institutions, monetary and fiscal policy, and the microeconomicenvironment. We estimate this framework using multiple data sets covering more than 130 countriesover the 2001-2008 period. We find a positive and separate influence of each driver on output perpotential worker. The microeconomic environment has a positive effect on output per potential workereven after controlling for historical legacies. Using our framework we define a new concept, globalinvestment attractiveness, which is the cost of factor inputs relative to a country’s competitiveness. This analysis reveals important insight into the economic trajectory of individual countries. Our frameworkalso offers a novel methodology for the estimation of a theoretically grounded and empirically validatedmeasure of national competitiveness.
Mercedes DelgadoTemple University and ISCFox School of BusinessAlter Hall 5421801 Liacouras WalkPhiladelphia, PA [email protected]
Christian KetelsInstitute for Strategy and CompetitivenessHarvard [email protected]
Michael E. PorterHarvard UniversityInstitute for Strategy and CompetitivenessLudcke HouseHarvard Business SchoolSoldiers Field RoadBoston, MA [email protected]
Scott SternMIT Sloan School of Management100 Main Street, E62-476Cambridge, MA 02142and [email protected]

2
1. Introduction
“The President's Council on Jobs and Competitiveness was created to […] ensure the
competitiveness of the United States and [advise the President] on ways to create jobs,
opportunity, and prosperity for the American people.” www.whitehouse.gov, accessed August
21, 2011.
Policy makers in the United States and in many other countries frequently invoke
competitiveness as a central objective of national economic policy, even though they often
disagree about the ways to achieve it. Many academic researchers, in contrast, have expressed
skepticism about the term itself (Krugman, 1994; De Grauwe, 2010), partially due to some
policies that are put forward to promote competitiveness (e.g., currency devaluation, ‘strategic’
industrial policy). A major problem is the different definitions of competitiveness that abound in
the literature (Boltho, 1995). While policymakers often link competitiveness to objectives such
as “jobs, opportunity, and prosperity” (President’s Council on Jobs and Competitiveness, 2011),
many definitions of competitiveness commonly used have at best an indirect connection to
overall national economic performance.
In practice, there is a dichotomy in how policy makers think about competitiveness: On
the one hand, competitiveness is associated with qualities that enable a high standard of living
(e.g., a country like Sweden is prosperous because of its high competitiveness). On the other
hand, competitiveness is associated with locational attributes that drive growth, (i.e., a country
like China is competitive because of its low quality-adjusted cost of labor). Being an attractive
location for investment affects prosperity indirectly and over the long run.
This paper first develops a novel definition of competitiveness that ties directly to
economic performance and encompasses the full range of factors that shape national prosperity,
and especially the influence of public policy and business practice.
We define foundational competitiveness as the expected level of output per working-age
individual given the overall quality of a country as a place to do business. This definition goes
beyond the expected level of productivity per employed worker, because prosperity is ultimately
rooted in the ability to both achieve high productivity as well as mobilize a high share of the
available workforce. By considering the expected output of all potential workers (i.e., all
working age inhabitants of a location), this definition captures both influences on prosperity.

3
Using our concept of foundational competitiveness, we can then define a related concept,
global investment attractiveness, which we define as the gap between a country’s foundational
competitiveness and its current factor costs. An attractive location is one which provides low
factor costs compared to potential productivity (Porter, 2006). International investment and trade
flows will be influenced by global investment attractiveness. Locations with higher attractiveness
should be able to grow more quickly than peer locations with similar competitiveness but higher
factor costs. Over time, this can support prosperity growth if enables foundational
competitiveness to improve as well.
We build and estimate a model to explain foundational competitiveness across countries.
Our framework (Figure 1) distinguishes between the role of macroeconomic and microeconomic
influences on competitiveness. Macroeconomic factors set general conditions that create
opportunities for higher productivity but do not directly link to company productivity and labor
mobilization. We incorporate two broad dimensions of macroeconomic competitiveness,
building on the economic development literature. First, social infrastructure and political
institutions (SIPI) is defined to include basic health and education, the quality of political
institutions, and the rule of law. Over the last decade, a number of influential studies have
identified such institutions and their long-term impact as a critical source of differences in
productivity (and, ultimately, prosperity) across nations (e.g., La Porta et al., 1998; Hall and
Jones, 1999; Acemoglu et al., 2001; Rodrik et al., 2004; Glaeser et al., 2004; Caselli, 2005). The
second broad dimension of macroeconomic competitiveness is monetary and fiscal policy
(MFP), which includes measures of fiscal sustainability and debt and inflation policies for
managing short and medium-term fluctuations of economic activity (see e.g., Fischer, 1993).
From a policy perspective, SIPI and MFP are generally set or heavily influenced by the national
government.
Microeconomic determinants of competitiveness are very different. Moving beyond the
broad institutional factors, microeconomic competitiveness is focused on specific attributes of
the national business environment (e.g., whether business regulation enhances or inhibits
investment and growth), the organization and structure of economic activity (e.g., the extent of
local rivalry and the extent of agglomeration spillovers from cluster development), and the use of
sophisticated business management practices (e.g., whether firms use incentive pay). Porter
(1990) was among the first to focus specifically on the role of the microeconomic factors in

4
shaping aggregate productivity and national prosperity. A significant body of empirical evidence
now emphasizes the role of microeconomic policies, structure and practices in national and
regional economic performance (among others, Dertouzos, et al, 1989; Saxenian, 1994; Porter,
1998, 2003; Bloom and van Reenen, 2007; Bloom et al., 2009; Freeman and Shaw, 2009;
Delgado, Porter, and Stern, 2010). Relative to the strong historical dependency of the aggregate
institutional factors emphasized in the macroeconomics literature, policymakers (and even
private sector leaders) have significant latitude to strengthen microeconomic competitiveness by
enhancing the national business environment, enabling cluster development, and improving the
sophistication of company operations and strategy.
Our empirical approach to test this framework utilizes a rich dataset including more than
120 indicators of macro- and microeconomic competitiveness available across 130 countries,
covering the 2001 to 2008 period. Data is drawn from a mix of public sources (e.g., the Doing
Business indicators of the World Bank) as well as the annual Executive Opinion Survey of the
World Economic Forum (WEF). Building on the literature on composite indicators (Kaufmann
et al. 1999, 2008; OECD, 2008; Høyland et al., 2009), the numerous individual indicators are
aggregated in a step-wise process, providing novel measures of different dimensions of
competitiveness, including MICRO, SIPI and MFP. To estimate foundational competitiveness,
we specify a comprehensive model of output per potential worker (measured by GDP (ppp-
adjusted) by population between 15-64 years old) as a function of MICRO, SIPI and MFP,
controlling for endowments (such as natural resources and location).
Unlike much literature, our focus is not on validating the importance of individual
indicators, but on the influence of unbiased estimates of the overall microeconomic and
macroeconomic environment on output per potential worker. Since our measures of the
microeconomic and macroeconomic environment are based on a large number of policy and
input indicators, our approach reduces the endogeneity concerns that would arise if we were
attempting to pin down the causal impact of a single policy or institution on competitiveness.
Additionally, to account for the potential ability of more prosperous countries to adapt more
advanced policies (such as better business practices and more effective environmental policies),

5
we control for country endowments, historical institutions, and we consider both cross-sectional
and fixed effects approaches to estimation.1
We find significant evidence for the positive and separate influence of SIPI, MFP, and
the microeconomic conditions on national competitiveness. Consistent with prior studies,
institutions (SIPI in our model) positively influence national output per potential worker.
However, we find that microeconomic conditions have a strong positive impact as well, even
after controlling for current institutional conditions. We then take into account historical factors
that might influence contemporary conditions, building on Acemoglu et al. (2001). We find that
the microeconomic conditions have a positive influence on competitiveness even after
controlling for historical institutional conditions and incorporating country fixed effects (which
offer a broader measure of a country’s unobserved legacy). Current institutions and
macroeconomic policies seem largely endogenous to historical legacies. Overall, the findings
strongly suggest that contemporaneous public and private choices, especially those that relate to
microeconomic competitiveness, are an important driver of country output per potential worker
and, ultimately, prosperity.
Finally, our framework allows us to assess both the foundational competitiveness of
individual countries and their global investment attractiveness. Using the estimated coefficients
of MICRO, SIPI and MFP, we compute an overall competitiveness score for each country and
year, which provides an estimate of each country’s competitiveness compared to peers and over
time. The relationship between the estimated competitiveness and (labor) costs provides a
measure of the current global attractiveness of countries as investment locations. This analysis
provides important insights into the economic trajectory of individual countries. Countries with
high global investment attractiveness (i.e., low factor costs relative to competitiveness), such as
China and Singapore, have grown rapidly. Conversely, countries with low global investment
attractiveness (high factor costs relative to competitiveness), like Greece, Italy, and Spain, have
found their prosperity to be unsustainable.
The paper is organized as follows. Section 2 develops our definition of foundational
competitiveness, relating it to the previous competitiveness literature and the wider literature on 1 We observe large variation in MICRO and SIPI among countries with similar levels of development, mitigating this concern.

6
cross-country differences on prosperity and growth. Sections 3 to 5 discuss our approach to
estimating a new model of competitiveness based on this definition: Section 3 explains the data,
Section 4 discusses the empirical framework, and Section 5 discusses the main findings. Section
6 presents findings on the foundational competitiveness and global investment attractiveness of
individual countries, and a final section concludes.
2. What is National Competitiveness?
The term competitiveness is used in a bewildering variety of ways, both in the policy
community and in academic research. Some equate competitiveness with the ability to achieve
certain overall outcomes, such as a high standard of living and economic growth. Other
definitions focus on the ability to achieve specific economic outcomes such as job creation,
exports, or FDI. Yet other definitions see competitiveness as defined by specific local
conditions such as low wages, stable unit labor costs, a balanced budget, or a ‘competitive’
exchange rate to support a current account surplus. These different views of competitiveness
have confused the public and scholarly dialogue, and have obscured the development of an
integrated framework to explain causes of cross-country differences in economic performance.
The evolution of the competitiveness debate has oscillated around three ideas: market
share, costs, and productivity. When the term competitiveness first gained prominence in the
1980s, the public debate in the United States was dominated by fears about the seemingly
unstoppable rise of the Japanese economy. Competitiveness was associated with lower labor
costs and policies that helped companies gain market share in the global market place (and to
“beat” foreign competitors). Here, competitiveness was a zero-sum game: a country could only
improve its competitiveness at the expense of another country.
The research on strategic trade/industrial policy published during the 1980s (Krugman,
1986; Spencer and Brandner, 2008; Lall, 2001) seemed to suggest that countries could increase
their welfare by achieving leading market positions in sectors characterized by, for example,
high economies of scale, through the use of targeted government support. Further research
questioned the welfare benefits of such profit-shifting policies (Porter, 1990; Krugman, 1994).
However, the underlying view that competitiveness is reflected in a country’s market share in
certain strategic industries lives on in the notion of “industrial competitiveness” (e.g., see

7
UNIDO, 2009).2 And it continues to influence policy action, for example in China’s efforts to
capture market position in solar energy and telecom products through heavy government support.
High market shares can indeed be a symptom of underlying advantages of a location, but
can also be achieved through targeted and distortive subsidies. Thus, high market shares in
specific sectors are neither the ultimate objective of economic policy nor the root cause of
overall economic performance. Instead of focusing on the performance of individual sectors,
more recent studies have examined country- and region-specific patterns of related industries and
trade composition as an important corollary of successful economic development (Hausmann
and Klinger, 2006; Delgado, Porter and Stern, 2010b; Lin, 2011).3
Another view of competitiveness focuses on measures related to a location’s costs. Work
on cost competitiveness has various interpretations. Low labor costs (compensation per hour,
per employee) are seen as a sign of competitiveness leading to lower unemployment, higher
exports and higher FDI. Other studies examine the relationship between (labor) costs and output.
Unit labor costs are often used to evaluate whether a country’s balance of payments is likely to
be sustainable (e.g., European Central Bank, 2008).
The naïve interpretation of competitiveness as low costs, especially low wages, is clearly
misguided if prosperity is the policy objective. Similarly, unit labor costs can be in line with
sustainable external balances at many different levels of prosperity and economic performance.
They provide a relevant diagnostic for the functioning of specific markets, but do not constitute a
root cause of competitiveness that underpins economic performance.
In response to these misconceptions about competitiveness, Porter (1990), together with
organizations like the Council on Competitiveness, refocused the debate towards the notion that
competitiveness is what underpins wealth creation and economic performance (Porter, 1990;
Aiginger, 2006). Using this perspective, competitiveness becomes tightly connected to
productivity. This is validated by a large literature that identified productivity as the central
driver of cross-country differences in prosperity (Hall and Jones, 1999; Lewis, 2004). Various
sets of factors have been proposed to explain cross-country differences in productivity (Hall and
Jones, 1999; Porter et al., 2008, Fagerberg et al., 2007). A range of indicators in the WEF’s
2 These studies define competitiveness as having strong market positions in strategic industries, as measured by a nation’s export intensity or the value added per capita in manufacturing or high-tech industries. 3 These studies suggest that the emergence of new economic activity in a location and the diversification of exports are linked to the presence of related economic activity in the location.

8
Global Competitiveness Report and the World Bank’s Doing Business ranking have been
developed to capture many of them. Policy documents such as the OECD’s Growth Agenda
(OECD, 2005) and the European Commission’s 2020 strategy (EC, 2010) are largely based on
this productivity-focused approach to competitiveness.
Defining Foundational Competitiveness
Building on these lessons, we propose a new definition of competitiveness that relates
directly to prosperity, is comprehensive in its coverage of the underlying drivers, and focuses on
factors that can be changed through policy. We define foundational competitiveness as the
expected level of output per working-age individual given the overall quality of a country as a
place to do business. Both the productivity of employed workers and the ability to employ a
large share of the available labor force influence overall prosperity. The large variation in labor
productivity of active employees across countries is widely known, and strongly related to the
variation in GDP per capita (See Figure 2). But there is also large variation in labor
mobilization.4 Focusing on working-age population (versus total population) allows us to
distinguish between competitiveness conditions and purely demographic factors. Our definition
of competitiveness thus broadens the notion of productivity used in prior work, and encompasses
the full range of productivity-enhancing factors amenable to policy action that shape prosperity.
The Determinants of Foundational Competitiveness
Having defined foundational competitiveness, the challenge is to identify a
comprehensive set of contemporaneous drivers of the expected output per potential worker, with
a focus on those amenable to change through policy actions. A significant number of research
streams have emerged in the literature, to explain cross-country differences in prosperity, with
numerous candidates identified. We offer an integrated framework that incorporates the full
range of factors. These can be grouped into two main areas: macroeconomic and microeconomic
(See Figure 1). Endowments influence prosperity but not the underlying productivity, and
cannot be changed through policy. Hence we introduce endowments in our framework as
controls.
4 Figure 2b offers some evidence that there is large variation in labor mobility even among countries with high labor productivity. This suggests that, while these two outcomes are positively related, productivity improvements not always translate into better labor mobilization.

9
Macroeconomic competitiveness
Macroeconomic competitiveness is driven by a range of institutions, policies, and public
good investments that set the context for an entire economy. Social infrastructure (a term
introduced by Hall and Jones (1999)) and political institutions define the broader context in
which productive economic activity takes place. A number of studies have found a significant
long-term relationship between the nature of institutions and prosperity (Acemoglu et al., 2001;
Hall and Jones, 1999). Particular aspects of institutional quality that have been carefully
examined include the rule of law (La Porta et al., 1998), the presence of property rights (De Soto,
2000), the quality of governance (Kaufmann et al., 2008), and the impact of corruption (Mauro,
1995; Shleifer and Vishny, 1991).5
Education, health care, and public safety are other aspects of the overall social
infrastructure necessary to enable productive economic activity (Sachs, 2005). If large parts of
the population have limited basic reading and writing skills, their ability to actively participate in
the economy is severely limited. If the presence of malaria or an HIV/AIDS epidemic means
that large segments of society must concentrate on sustaining their basic health, there is little
hope for them to become productive (Lorentzen et al., 2008; Weil, 2007). The presence of war,
civil unrest, and high levels of crime can also undermine the opportunities for productive
business activity. However, empirical support for a strong relationship between security and
productivity is limited (Stone, 2006).
The other aspect of macroeconomic competitiveness, monetary and fiscal policy, is the
focus of much public debate (Fischer, 1993). While it has a clear impact on short-term economic
activity, the literature finds only weak effects on long-term productivity differences. This is
largely because differences in the quality of monetary and fiscal policy are well explained by
differences in institutional quality (Acemoglu et al., 2003). Another measurement challenge is
the identification of clear benchmarks of ‘good’ monetary and fiscal policy. There is, for
example, a broad policy consensus on the need to achieve low inflation (Goodfriend, 2007), but
moderate levels of inflation do not seem to limit long-term productivity (Levine and Renelt,
1992; Temple, 2000; Barro, 2002). Similarly, “normal” levels of debt seem to be sustainable,
with only very high levels of debt (~90% of GDP) reducing growth (Reinhart and Rogoff, 2010).
5 The interpretation of some of these findings remains under debate because distinguishing the impact of institutions is often complex due to the high levels of correlation of institutions with endowments (such us geographic location) as well as other possible drivers of productivity (Dixit, 2007).

10
The same ambiguity exists for the overall level of government spending. Within normal
parameters, the overall size of government (and implicitly the level of taxes) is less important
than how taxation is structured and the way government spends money (Johansson et al., 2008).
Microeconomic competitiveness
Microeconomic factors are those that have a direct influence on company productivity and
labor force mobilization. The policy literature often makes a distinction between inputs (often from
government investments) and incentives (competition, openness) as drivers of higher productivity.
Porter’s work combined these and other dimensions of the national business environment (NBE)
into one integrated framework, adding the quality of local demand conditions and the presence of
the related and supporting industries (Porter, 1990; 2007). Because of their graphical
representation, these four areas have collectively become referred to as the Diamond.
Factor conditions (quality and quantity) have long been seen as affecting company creation
and productivity. Physical infrastructure clearly plays an important role in productivity, though
there remains debate about the size of its effect (Calderon and Serven, 2004; Garcia-Milà et al.,
1996; Gramlich, 1994; Aschauer, 1989). Efficient access to capital is important for companies to
make the long-term investments needed to raise productivity levels (Ang, 2008; Aghion et al. 2007;
Levine, 2005; King and Levine, 1993; Rajan and Zingales, 1998). The quantity and quality of
workforce training, higher education, managerial education, and research in an economy all have a
positive impact on prosperity (Barro, 2002; Krueger and Lindahl, 2001; Gennaioli et al. 2011) as
does the broader institutions and policies supporting innovation (Furman et al., 2002 Fagerberg,
1988; Escribano and Guasch, 2005). The quality of administrative practices, such as low costs of
starting a business, is another important input to business productivity and new business formation
(Branstetter et al., 2010; World Bank, 2010a; Ciccone and Papaiouannou, 2008; Conway et al.,
2005; Nicoletti and Scarpatta, 2003).
Company productivity is also strongly related to the set of incentives and rules that
govern local competition. High levels of competition on local markets are crucial for high
performance (Carlin et al., 2005; Lewis, 2004; Porter and Sakakibara, 2004). The vitality of
competition affects the entry of new firms, the exit of underperforming old firms, and the
performance patterns across existing firms (Bloom and van Reenen, 2007; Bloom et al., 2009;
Nickell, 1996; Syverson, 2004). The ownership structure of companies (private vs. state-owned;

11
conglomerate vs. single-business) is another important influence not only on company efficiency
but also on the health of rivalry (see review at Megginson and Netter, 2001). Labor market policies
are clearly important for the productivity of companies as well as for labor force mobilization,
but there remain significant disagreements about the role of specific policies (OECD, 1994;
Nickell and Layard, 1999; Busso, Gregory and Kline, 2010; World Bank, 2011).
Openness to international competition, via trade and investment, enables a nation to
improve local productivity, expand the most productive local industries, access more advanced
knowledge and technology from abroad, and expose local companies to higher levels of
competitive pressure. Evidence of the positive influence of trade on the transfer of knowledge
and firm innovation in a country has been established by several studies using firm-level data,
including MacGarvie (2006), Branstetter (2006), Bernard et al. (1999, 2007), among others. The
empirical literature on the impact of openness on long-term differences in country-level
productivity and growth, however, offers mixed results. A number of researchers have found a
positive relationship between openness and prosperity (Alcalá and Ciccone, 2004; Baldwin,
2003; Dollar and Kraay, 2003; Frankel and Romer, 1999; Sachs and Warner, 1995) or identified
the role of trade as a means to tap into other countries’ knowledge stock (Coe and Helpman,
1995). But other authors are more skeptical and attribute these findings to the specific data and
econometric approaches (Rodriguez and Rodrik, 2000).
Demand conditions have received far less consideration in the economic literature. The
business literature has for some time suggested that stringent local regulation that anticipates
future changes and opportunities in other markets can encourage companies to innovate and
build profitable international market positions. These new regulatory induced technological
opportunities can provide direct productivity benefits that companies may have otherwise
neglected (Esty and Porter 2005; Porter and van der Linde, 1995; Jaffe, 1995; Porter, 1990;
Linder, 1961).
Another dimension of the business environment that directly influences companies’
productivity is the presence of clusters of related and supporting industries. Clusters are geographic
agglomerations of companies, suppliers, service providers, and associated institutions in a particular
field, linked by externalities and complementarities of various types (Porter, 1990, 1998). The
presence of strong clusters enables companies to achieve higher productivity and raises regional

12
performance (Feldman and Audretsch, 1999; Glaeser and Kerr, 2009; Delgado, Porter and Stern,
2010a, 2010b).
Finally, the quality and sophistication of company operations and strategies (COS) of
enterprises operating in a country, including production practices, marketing, organizational
practices and extent of internalization differs significantly across locations (Porter, 1996; Bloom
and van Reenen, 2007). Thus differences in productivity across countries arise partly because of
the managerial sophistication of local firms. Though clearly the productivity of an economy is
the sum of the productivity of firms in the economy, such internal managerial influences have
received scant attention in the economic literature. Recent analyses reveal significant differences
in managerial sophistication even across countries with broadly similar institutional and business
environments (Porter et al., 2007; Bloom and van Reenen, 2007; Freeman and Shaw, 2009;
Delgado, 2010).
Endowments
Every nation has endowments, which are inherited and given. Prosperity is affected by
these endowments directly, for example by the sale of natural resources. For our empirical
analysis, then, we need to control for the effect of these endowments when estimating the role of
competitiveness for economic performance. The economic value of endowments will be
affected by policy choices countries make. A competitive nation is one which enhances the
value of endowments through a better environment for business. However, endowments such as
natural resources can have a direct positive effect on total output, they can also erode
competitiveness by corrupting political institutions and distorting economic policy choices
(Arezki and van der Ploeg, 2007; Gylfason et al., 1997; Papyrakis and Gerlagh, 2004; Sachs and
Warner, 2001).
Prior studies have suggested geographic location, natural resource deposits, and country
size are endowments that affect prosperity. A country’s geographic location can affect the ease
with which it can trade, for example, through access to a long coastline for shipping or proximity
to large markets (Gallup et al., 1998; Boulhol et al., 2008). Geography can also influence the
prevalence of diseases and colonization patterns, which affect historical and current institutional
conditions. Country size can attract FDI to access the local market and enable economies of
scale in areas like R&D to be exploited (Romer, 1990). Larger countries might more easily

13
attract investments, even if they are not more competitive. However, empirical studies find that
small countries enjoy greater openness than large countries or find no evidence of benefits of
market size after controlling for the role of institutions (Hall and Jones, 1999).
Defining Global Investment Attractiveness
We have explained so far foundational competitiveness, which focuses on the level of
prosperity that is sustainable at a point in time. Another aspect of competitiveness that plays a
significant role in the public debate is the ability of a location to attract investment. Investment
inflows influence economic dynamism and growth, even if they are not in any simple way
related to prosperity. We define global investment attractiveness to examine these dynamics.
Global attractiveness is a location’s foundational competitiveness relative to the cost of factor
inputs. This concept measures whether a country’s cost levels can be supported by its underlying
competitiveness (Porter, 2006). Countries with low factor costs relative to foundational
competitiveness (e.g., China) will be more attractive for investment and should experience more
rapid growth, while countries with high costs (e.g., Greece) relative to competitiveness may find
sustaining levels of prosperity challenging. As a measure of the gap between competitiveness
and factor costs, global investment attractiveness is a diagnostic for understanding the dynamics
of foreign direct investment, international trade patterns, and potentially pressures on exchange
rates. In open markets, the imbalances between costs and foundational competitiveness should
disappear over time, with wages adjusting up or down. But labor market structures in many
countries can allow such imbalance to persist over time, making differences in global
attractiveness an important empirical feature of international competitiveness.
3. Data
The literature reviewed in the previous section suggests a large number of factors that
affect competitiveness and are amenable to policy action. For an empirical estimation of
competitiveness, robust cross-country data on these factors is necessary. Over the last several
years, the scope of available country-level data has significantly improved, especially data on
different aspects of microeconomic competitiveness. We utilize the full range of data now
available to compute our measures of microeconomic and macroeconomic competitiveness

14
(SIPI, MFP and MICRO), using a rich dataset with more than 120 indicators across over 130
countries and covering the 2001 to 2010 period.6
In addition to traditional public sources of data, we employ survey data from the
Executive Opinion Survey (EOS) of the World Economic Forum. Starting in 1998, the EOS
Survey began to include a broad range of microeconomic indicators that allowed for the year-by-
year measurement not only of the macroeconomic environment but also the microeconomic
conditions shaping business practices in individual countries around the world (Porter, 1998b;
2003). We are able to exploit these data, and use ninety-two EOS indicators, covering most
categories of competitiveness, particularly microeconomic competitiveness where there are few
alternative data sources with comparable coverage. An important attribute of the EOS is that the
respondents are executives of companies, capturing the informed judgments of the actual
participants in the economies of the countries examined. Survey respondents evaluate each
question using 7-point Likert-scale ratings. The number of countries covered by the EOS varies
over time, with the country coverage improving from 76 in 2001 to up to 133 countries in 2008.
Countries have on average 80 respondents per year, with larger countries having a higher
number. The average rate of response across countries is around 40%. To compute
representative country-year averages for each indicator, individual responses are aggregated
using a sector-weighted average (see Browne et al., 2008).7
We also use 29 hard data (and survey) indicators from other internationally recognized
data sources to compute our main measures of microeconomic and macroeconomic conditions,
including the World Bank Governance Indicators (Kaufmann, Kraay, and Mastruzzi, 2008); the
World Bank Doing Business Indicators (World Bank, 2010); the World Bank World
Development Indicators; the World Health Organization database; the IMF World Economic
Outlook database; the World Telecommunication/ICT Indicators database (ITU); the USPTO
patent database; the UN Comtrade export dataset, the Center for International Development
database; and the UN Gender-related Development index (See Table A1 for the specific
indicators sourced from these databases). The use of hard data indicators helps reduce concerns 6 The data used for the estimation of the competitiveness model covers 130 countries for up to 8 years (2001-2008); and 2010 data is used to assess the current competitiveness of individual countries based on the estimated model. Each indicator included has a significant relationship to GDP per potential worker. 7 Sector-weighted country averages takes into account the contributions to a country’s GDP of each of the four main economic sectors: agriculture, manufacturing industry, non-manufacturing industry, and services. See Browne et al. (2008) for a detailed explanation of the weighting mechanism. Sector-weighted country averages are computed for all years but 2002 (respondents’ sector is missing that year).

15
about measurement error and the potential bias of Survey data. Finally, data on employed
population is sourced from the Conference Board Total Economy Database, and the labor cost
per hour in US$ (both pay and non-pay costs) from the Economist Intelligence Unit.
4. Empirical Framework
We define a step-wise process to aggregate the indicators into novel competitiveness
categories including MICRO, SIPI and MFP, building on the recent literature on composite
indices (Kaufmann et al. 1999; OECD, 2008; Høyland et al., 2009). We then specify a
comprehensive model of output per potential worker as a function of MICRO, SIPI and MFP.
Figure 3 shows an overview of the different microeconomic and macroeconomic
categories included, and Table A1 reports the individual indicators within each category.
Categories are organized hierarchically and sum to the final competitiveness score.
4.1 Variable Definitions
Our model explains national competitiveness, defined in terms of the expected level of
output per potential worker, based on the overall quality of the microeconomic and
macroeconomic environment. The best measure of output per potential worker that is widely
available across countries and over time is the (log of) GDP adjusted for purchasing power parity
(ppp) per working age individual (15-64 years old).8 The average output per potential worker is
approximately 22,000 international dollars (ppp) in our sample of 130 countries (see Table 1).
Output per potential worker encompasses both output per employed worker and
mobilization in a country of the working-age population. In the analysis we estimate how our
competitiveness model relates to each of these components. The labor mobilization ratio is
defined as the employed population to working-age population ratio. The average labor
mobilization ratio in our sample is 0.66. Output per worker (labor productivity) is measured as
GDP (ppp) per employed person, averaging 35,000 (based on 108 countries).
In our sensitivity analyses, we also examine output per capita ((log of) GDP (ppp) per
capita) as an alternative dependent variable. This is an overall measure of national prosperity.
Output per potential worker is linked to, but distinct from, prosperity. Prosperity is also
8 In the case of Ireland, we used GNP instead of GDP because of the size of dividend outflows to foreign investors.

16
influenced by demographic factors (variation in the population dependency ratio) that are not
part of competitiveness.
4.2 Measuring the Determinants of Competitiveness
Our empirical framework is based on a two-step aggregation of individual indicators into
composite measures covering MICRO, SIPI and MFP. First, to synthesize data from multiple
related indicators that measure the same conceptual category (e.g., SIPI), we compute a factor
score for each category using factor analysis (FA) – specifically principal component factor
analysis.9 As discussed below, the precise details of this aggregation are distinct for each of our
main explanatory variables (MICRO, SIPI and MP). Second, we regress these variables on
output per potential worker to determine our main empirical findings and to compute the overall
competitiveness scores for individual countries.
Microeconomic competitiveness. The two main categories of microeconomic
competitiveness (MICRO) are the sophistication of company operations and strategy (COS) and
the quality of the national business environment (NBE). NBE in turn is divided into four
components: factor conditions, context for strategy and rivalry, supporting and related industries
(that includes the state of cluster development), and demand conditions (See Figure 3, and Porter
(1990, 2007)).10
The MICRO variable deliberately includes a large number of indicators to facilitate
competitiveness assessment of individual countries. While the different microeconomic sub-
categories and indicators are correlated the strengths and weaknesses of individual countries’
9 Within a category there are numerous individual indicators that are highly correlated and related to the underlying phenomenon to be measured. The FA method provides a weighted average of the (standardized) indicators. This is a method often used to aggregate indicators when there are no strong priors on their relative weights (see e.g., Kaufman et al., 2008; OECD, 2008b). In most cases, the allocation of individual indicators to categories is clear. For a few indicators, allocation to categories requires a judgment based on the indicator’s primary effect, and its relatedness to other indicators within a category. For example, primary education is allocated to SIPI; and the quality of more advanced levels of education is allocated to the NBE (microeconomic competitiveness). We view primary education as a broad indicator of the ability of individuals to participate in society, and a foundation on which skill and further education impact productivity. Another case is trade barriers were indicators such as the average tariff rate on imports, are allocated to NBE. Trade barriers are a direct determinant of the competitive pressure from foreign companies. Taxation effectiveness is also allocated to NBE since is a direct incentive effect on firms, even though it also has a relation to fiscal policy. We have tested these choices statistically and found the rankings and scores are highly stable to re-categorization of specific indicators. 10 Some areas of COS and NBE are further differentiated into narrower subcategories to better align with a policy area. For example, under factor conditions, indicators are grouped by logistical infrastructure, communications infrastructure, administrative infrastructure, capital market infrastructure, and innovation infrastructure (See Figure 3 and Table A1).

17
vary widely, calling for country-specific policy priorities. We use a two-step FA procedure to
aggregate a mix of 86 hard data and Survey indicators of microeconomic competitiveness (See
Table A1 for a list of the indicators). First, a separate factor score is computed for COS and for
each component of the NBE.11 Second, these five components are aggregated using FA into an
overall score for MICRO.12 The resulting MICRO variable has a mean of zero and standard
deviation of one. This two-step approach avoids a bias towards those areas of microeconomic
competitiveness for which more indicators are available. We test that the MICRO variable (and
its sub-categories) is robust to the random exclusion of individual indicators, further validating
our analysis (see discussion in Section 6 and Table A4).
The MICRO variable uses a large number of survey-based indicators (71 EOS versus 15
hard data indicators). There may be respondents’ bias and measurement error, such as over-
estimating the quality of some indicators in countries with a positive economic outlook (see
Delgado, 2010). To test for this, we compute an alternative measure of the microeconomic
environment based solely on hard data indicators, using a synthetic measure based on the World
Bank’s Doing Business indicators, which is a weighted average of 35 (standardized) indicators
that capture different dimensions of the cost of doing business in a country (MICRODoing
Business).13 While this synthetic measure captures only some components of the NBE (mainly
input conditions and context for strategy and rivalry), it has a correlation coefficient of 0.8 with
our main variable, providing a good proxy for microeconomic influences.
11 See Table A2 for a summary of the FA analysis. We retain the primary factor for each aggregation (each explains more than 50% of the variance). We also test that the indicators are well grouped based on their low individual uniqueness and the Cronbach's alpha reliability coefficient of the indicators aggregated. The Cronbach's alpha is greater than 0.93 for each of the five factor scores, indicating that the indicators group very well. Finally, we also test that the scores of COS and each of the NBE components are robust to the random exclusion of individual indicators (this test is discussed in Section 6 and illustrated in Table A4). 12 We retain one factor that explains 93% of the variation (see Table A2). Each of the five components gets roughly the same weight. MICRO of country c in year t is then computed as follows: MICROct= 0.21*COSct+ 0.21*NBE-Factor Conditionsct + 0.21*NBE-Demandct + 0.20*NBE-Related Industriesct + 0.20*NBE-Contextct. 13 We use 35 indicators available from 2004-2010, and take an annual “average of averages.” We do not use FA because some indicators do not group well. Instead, for each of the 10 sub-categories of cost of doing business, we compute an average, and then take an average across sub-categories. All indicators are standardized and scaled so that higher values mean lower cost of doing business. The indicators used are: starting a business (procedures, time, cost, and capital); dealing with licenses (procedures, time, and cost); employing workers (difficulty of hiring, rigidity of hours, difficulty of firing, rigidity of employment, and firing costs); registering property (procedures, time, and cost); getting credit (legal rights, credit information, public registry coverage, and private bureau coverage); protecting investors (disclosure, director liability, shareholder suits, and investor protection); paying taxes (payments and hours); trading across borders (exports/imports procedures and time); enforcing contracts (procedures, time, and cost); and closing a business (recovery rate, time and cost).

18
Social infrastructure and political institutions. The SIPI variable is computed using a FA
weighted average of 32 indicators (of which 11 are hard data indicators) that capture three
dimensions: basic health and education, political institutions (both decision making and
efficiency of the executive), and the rule of law (safety, corruption and efficiency of the legal
process).14 We test that the SIPI variable (and its sub-categories) is robust to the random
exclusion of individual indicators (see discussion in Section 6 and Table A4).
Figure 4 plots SIPI against MICRO. While they are correlated, we observe large
variations across countries in MICRO even after conditioning on the institutional environment
(SIPI). For example, Germany, Canada, Australia, and Iceland have similar institutional
conditions, but differ greatly in the quality of microeconomic conditions with Germany leading
in MICRO as of 2010 (see Table 6).
Monetary and fiscal policy. This component captures fiscal and monetary policies that
help manage short-term fluctuations of economic activity. The MFP score of a country-year is a
prior 3-years moving average on three indicators: inflation, government net debt (% GDP), and
government surplus/deficit (% of GDP).15 Drawing on prior studies that find that “moderate”
levels of inflation and debt may have no effect on growth (see e.g., Temple, 2000; Barro, 2002;
Sala i Martin, et al. 2007; Reinhart and Rogoff, 2010), we define a “neutral” zone for these
indicators: inflation [0.5-3.0%], government debt [<60%], and government deficit [<-3%].
Indicators within the neutral zone receive the maximum score; otherwise we compute the
deviation from the neutral zone on a log scale.16 The MFP score is then computed using a
standardized average of the (standardized) indicators with an equal weighting of the monetary
and fiscal scores. 17
14 We retain the first factor that explains 64% of the variance. The Cronbach's alpha reliability coefficient for the SIPI aggregation is 0.98, confirming that the indicators group very well (See Table A2). 15 We use moving averages to capture persistent weak macro policy indicators (e.g., continued high inflation). For each indicator, say inflation, the moving average is computed as 0.5*inflationt-1+0.3*inflationt-2 + 0.2*inflationt-3. 16 The indicators get a score of zero in the neutral zone and minus ln(1+ deviation from neutral zone) otherwise. Our results are robust to changing the neutral zones and to using a simple (versus weighted) average of the indicators. 17 A weighted average with 0.5 weight for inflation and 0.25 for each fiscal indicator. The standardized average is computed excluding Zimbabwe since it is a large outlier. We do not use FA because we only have three indicators and they do not group well.

19
4.3 Estimating National Competitiveness
The microeconomic environment (MICRO), social infrastructure and political institutions
(SIPI), and monetary and fiscal policies (MFP) each reflect distinct influences on
competitiveness in terms of the nature of their effect on company productivity and the nature and
locus of the policy process. Hence, we estimate their separate effect on output per potential
worker. To do so, we specify a comprehensive regression that uses the (log of) country-year
output per potential worker as the dependent variable, with MICRO, SIPI, MFP as the main
explanatory variables, controlling for endowments and year dummies. We estimate the
following baseline model using panel data for 130 countries up to 8 years (2001-2008):
t
c,t 0 MICRO c,t 1 SIPI c,t 1 MFP c,t 1
END c,t 1 t c,t
Ln Output per potential worker MICRO SIPI MFP
ENDOWMENTS year
(1)
We estimate equation 1 using OLS and cluster the standard errors by country. We are
interested in the short-term effect of MICRO, SIPI and MFP on country output per potential
worker. 18 In the empirical analysis, we use various lag structures for these variables to examine
their medium-term impact as well.
To properly estimate the effect of these variables on output per potential worker we
control for endowments. Controlling for endowments allows us to distinguish between
“inherited” output and output “created” by the underlying competitiveness of the location.
Drawing on prior studies, we include three types of endowment indicators: natural resources,
geographical location and market size (See Table 1). The model controls for natural resources
wealth by using (log of) per capita unprocessed natural resource exports in the prior year (Ln
unprocessed exports pc).19 The percentage of land area within 100 km of ice-free
18 MICRO and SIPI variables are essentially lagged a year, and MFP is a moving average of the prior 3 years. For example, MICRO2008 is computed based mainly on EOS data that is collected during November 2007-April 2008 (and hard data indicators collected mainly by the end of 2007); and it is used to predict (year-end) 2008 Output per potential worker. 19 This variable is unprocessed exports per capita in US $. Export data is sourced from the UN Comtrade data. The main categories of unprocessed products include natural resource-derived categories such as fuels, metals, raw materials, agricultural products, among others but the unprocessed categorization adds a further refinement by distinguishing, for example, raw crude products (unprocessed) from petroleum oils (semi-processed).

20
coast/navigable rivers is used as a control for locational quality (Location).20 The size of a
country is controlled for by including (log of) population size in (Ln population).
The inclusion of endowments in the model also controls for unobserved historical factors
that could be correlated with the current quality of institutions and with output per potential
worker. To more directly control for historical legacies, we also include various indicators of the
quality of historical institutions, such as the mortality rates faced by European settlers in
colonized countries during the 17th-19th centuries, and the extent of democracy or extent of
constraint on Executive in 1900 (based on Acemoglu et al., 2001). Finally, we fully control for
unobserved country-level factors that could induce correlation between the dependent and
explanatory variables by including country fixed effects in one of the specifications.
A separate source of concern is the potential endogeneity of MICRO. There are two
issues at play. First, if we were evaluating the impact of an individual policy (or institution), we
would be centrally concerned about the potential for omitted variables (i.e., other factors that
might influence economic performance and the specific policy). Our approach overcomes this
bias by constructing a composite variable, MICRO, that is an unbiased estimate of the
microeconomic environment of a country.21 While additional individual indicators of the
microeconomic environment might reduce the “noise” associated with MICRO (i.e., might
enhance the precision of our variable), our findings are robust to the inclusion or exclusion of
individual policy indicators from MICRO.
Second, as countries achieve higher levels of prosperity, they could be able to afford to
invest in better microeconomic conditions. For example, more prosperous countries may invest
in better business schools or adopt more effective environmental policies. While we cannot
eliminate the potential for such bias entirely, our approach and data significantly mitigate such
concerns. First, our analysis directly controls for the underlying endowments, historical legacies,
and macroeconomic environment of each country. Second, we observe significant variation in
MICRO across countries with broadly similar levels of development (See Figure 4). Finally, our
analysis includes estimates that rely both on cross-sectional variation (where such concerns may
20 The literature also examines the impact of being close to the equator as a locational influence, and as a proxy for exposure to tropical diseases. We recognize this potential, but measure instead the policy responses (e.g., health system effectiveness) in SIPI. 21 While our main measure of MICRO is based on a mix of Survey and hard data, we also use an alternative variable MICRODoing Business that only includes hard data, and so it won’t be subject to potential Survey respondents’ bias towards the expected economic performance of the country.

21
be more salient) as well as fixed effects estimates. We believe that our estimates provide
instructive evidence about the role that the microeconomic environment plays in shaping
competitiveness across countries and over time.
5. Findings
Table 2 presents our main results on the relationship between output per potential worker
and individual categories of competitiveness, controlling for endowments. We first examine the
role of the macroeconomic environment (Social Infrastructure and Political Institutions (SIPI),
and Macroeconomic Policy (MFP)) in model (2-1). We find that macroeconomic
competitiveness, especially institutional factors (SIPI), has a positive impact on country output
per potential worker. This is consistent with prior work on the role of institutional factors in
explaining productivity (e.g., see La Porta et al., 1998; Hall and Jones, 1999; and Acemoglu et
al., 2001).
In (2-2) we examine the effect of microeconomic competitiveness. We find a positive and
robust relationship, even after controlling for endowments. This positive effect could be due to
the influence of the quality of institutions on the quality of microeconomic conditions. We
expect SIPI to influence, but not determine, MICRO since sound institutions create a context for
more sophisticated management practices. To examine whether the microeconomic environment
has a separate positive influence, model 2-3 estimates our baseline model. The coefficient of
MICRO declines with the inclusion of SIPI, but the effect remains significant.
While prior research on productivity and growth has tended to focus on the role of
macroeconomic competitiveness, our results strongly support a distinct and important role for
microeconomic competitiveness. All broad categories of competitiveness are statistically
significant and important, even after controlling for the others. The MICRO, SIPI and MFP
variables are standardized, and so we can easily compare the magnitude of their effects. The
coefficients of SIPI and MICRO are of similar magnitude (a standard deviation increase in these
variables is associated with an approximate 30% increase in output per potential worker), and
significantly larger than the effect of MFP.
Regarding the impact of endowments, across all the specifications, natural resources
wealth (Ln unprocessed exports pc) and direct access to maritime transportation (Location)
variables have a positive impact on output per potential worker. Consistent with other studies

22
(e.g., Hall and Jones, 1999), we do not find evidence of a separate positive effect of country size
(Ln Population).22
The main results are robust to a wide range of sensitivity tests. Model (2-4) shows that
our main findings are robust to the random exclusion of countries and years. We implement
bootstrap analysis using a random sample of countries and randomly dropping up to one year in
each simulation.23 For each simulation we estimate model (2-3). We then compute the median
bootstrapped coefficient of MICRO, SIPI, and MFP (and their standard errors) based on 1,500
simulations. Model (2-4) shows that the median bootstrapped coefficients are not significantly
different from those in model (2-3), reinforcing our findings.24
Our results are also robust to substituting our largely survey-based MICRO variable with
an alternative composite variable based on a more narrow set of hard data indicators. In model 2-
5 we test our synthetic microeconomic competitiveness variable, based solely on quantitative
World Bank cost of doing business indicators (MICRODoing Business), and the estimated
coefficients are basically the same. This result further validates our main MICRO variable, and
suggests that our findings are not driven by Survey respondents’ potential bias towards the
expected outlook of the country.
In model 2-6, we use output per capita as an alternative dependent variable measured by
(log of) GDP (ppp) per capita. Output per capita and output per potential worker are highly
correlated, but distinct since countries vary in their population dependency ratio (how many
young people and older people depend on people of working age, and so in the overall prosperity
that existing workers can support. Model 2-6 shows that our results are robust to using output
per capita, further emphasizing the link between our competitiveness variables and prosperity.
So far we have focused on the contemporaneous effect of microeconomic and
macroeconomic conditions on output per worker. In the empirical analysis, we also explore
various lag structures for SIPI and MICRO (not reported). The results are robust to using 3-year
22 The endowments explain around 60% of the variance in output per potential worker. In the sensitivity analysis we drop the smallest (less than a million people) and/or largest countries (more than a 100 million people), and find that the estimated coefficients of MICRO, SIPI, MFP and of the endowment variables change little. 23 Countries are sampled with replacement using a blocked re-sampling approach where each draw is a country across years. 24 The results in model (2-3) are also robust to a number of additional sensitivity tests such as including additional years of data (2009 and 2010); dropping outliers (smallest and largest countries), and considering alternative MP definitions (based on simple versus weighted average of the indicators). In all these specifications the coefficients of MICRO, SIPI and MP change little.

23
moving averages for SIPI and MICRO and are also robust to using two/three year lags.25 These
findings suggest that changes in microeconomic and institutional conditions have both a short
and medium-term impact on country competitiveness, though we expect the lag and magnitude
of the effect to vary for individual policy actions and countries.
Finally, in model 2-7, we include country fixed effects to fully control for country
heterogeneity (in terms of geography, endowments, historical institutions, etc.). While we need
to be cautious in interpreting these results due to the short panel of eight years, microeconomic
competitiveness continues to matter though its coefficient declines. In contrast, the coefficients
of SIPI and MFP become insignificant. Institutional conditions in a country may be more
persistent, and so, their impacts get confounded with the country fixed effects.
Historical legacy. Some important recent studies show the very long-term impact of
institutions on cross-country prosperity differences. Most notably, Acemoglu et al. (2001) finds
that the mortality rates faced by European settlers in colonized countries during the 17th-19th
centuries can explain more than 25% of the variation in the quality of current national
institutions. They find that the quality of current institutions (instrumented by European settler
mortality) positively impact country prosperity.
While our endowment variables (and the country fixed effects) should capture some
unobserved historical factors that correlate with current output per potential worker and
institutional conditions, we more directly examine the role of historical legacies in Table 3,
where we use a sub-sample of 59 ex-colony countries and include their (log of) European settler
mortality as a control for the historical origins of institutions.26 As expected, this variable is
negatively associated with the quality of current institutions (SIPI) and with output per potential
worker.
In model (3-1), we find that current institutional conditions (SIPI) continue to have a
positive influence on output per potential worker but the magnitude of the effect declines after
controlling for historical institutions (settler mortality rate variable). In model (3-2) we find a
positive effect of microeconomic competitiveness (MICRO) even after controlling for historical
25 The moving average of MICRO in year t is computed as 0.5*MICROt + 0.3*MICROt-2 + 0.2*MICROt-3; and similarly for SIPI. We do not modify MFP variable since, as mentioned earlier, this variable is based on 3-year moving average of individual indicators. 26 This sub-sample of countries have on average a lower GDP per capita, MICRO, SIPI, and MFP than our full sample (see Table 1). This sample excludes, among others, European colonizer countries.
24
institutions.27 We then test our comprehensive model (equation 1), excluding (in 3-3) and
including (in 3-4) the European settler mortality variable. While the coefficients of SIPI and
MFP become highly insignificant with the inclusion of settler mortality, the positive effect of
MICRO remains significant (and of similar magnitude). The positive influence of
microeconomic competitiveness on output per potential worker is also robust to using alternative
historical institution variables (such as the extent of democracy or the extent of constraint on
Executive in 1900, both sourced from Acemoglu et al., 2001), and using the alternative
microeconomic variable solely based on doing business indicators (MICRODoing Business). Overall
the microeconomic environment of a country is more dynamic than the institutional
environment, and seems to have a distinct effect on prosperity from these institutional “root
causes.”
The Drivers of Labor Productivity and Labor Mobilization. Our competitiveness
framework focuses on output per potential worker as a broader notion of productivity that
captures the productivity of the workers as well as the ability of a country to mobilize the
working-age population, both important to prosperity. Countries differ greatly in these two
components (see Figure 2), and we are interested in understanding how our competitiveness
dimensions relate to each of them.
In Table 4 we examine the relationship between the microeconomic and macroeconomic
competitiveness dimensions and both labor mobilization and labor productivity (measured by
output per worker), using a sub-sample of 108 countries for which these two dependent variables
are available. Interestingly, only MICRO is significantly related to labor mobilization (model 4-
1). In contrast, SIPI is significantly related to output per worker, and its effect is of similar
magnitude to that of MICRO (model 4-3).28 Our overall competitiveness score is positively
associated with both labor mobilization and, especially, with output per worker (models 4-2 and
4-4).29 While a complete analysis of the separate role that each of the drivers of foundational
competitiveness plays in labor mobilization versus labor productivity is beyond the scope of this
27 We also estimate models (2-1) and (2-3) for the sub-sample of ex-colonies and the estimated coefficients of SIPI and MICRO are of similar magnitude than for the full sample models. 28 While the effect of MICRO on output per worker is slightly noisy in the baseline model (4-3), this variable has a strong positive effect if we exclude SIPI. 29 The competitiveness score is computed as a weighted sum of MICRO, SIPI and MFP variables (based on the normalized weights from model 2-3; see equation 2 in Section 6). The findings reported in Table 4 are also robust to using an unweighted average of MICRO, SIPI, and MFP.

25
paper, we find it instructive that MICRO (which may be subject to significant influence by
medium-term policy decisions or changes in corporate practice) is particularly influential in
determining the overall labor force mobilization rate in a country.30
Comparing different competitiveness views. Our analysis so far has shown how the
novel measures of microeconomic and macroeconomic competitiveness proposed in this paper
explain the level of output per potential worker. We now compare this in Table 5 to alternative
measures of competitiveness proposed in the literature: (log of) labor costs per hour in $US (both
pay and non-pay costs) and current account balance (% GDP) as proxies for different versions of
cost competitiveness; and manufacturing exports per capita (in $US) and high-tech exports (% of
manufacturing exports) as indicators of specific sector competitiveness.
Cost competitiveness, understood as low labor costs, is sometimes seen as critical to
sustain global market positions that in turn are supposed to support high prosperity. Model (5-1)
shows that countries with better SIPI tend to have higher labor costs, and countries with higher
levels of prosperity also tend to have higher labor costs (not reported). Irrespective of the
direction of causality, these findings suggest that economic policies focusing on holding down
labor costs to enhance competitiveness are fundamentally misguided. While labor market
practices that drive up labor costs without enhancing productivity can be detrimental for
prosperity, the focus should not be on keeping labor costs high or low per se but on labor costs
relative to a country’s foundational competitiveness. We explore this further below in our
analysis of global attractiveness for investment (see Section 6).
Cost competitiveness, understood as favorable real exchange rates and low unit labor
costs driving a current account surplus, too, is argued to be important for sustainable prosperity.
Our analysis suggests that the focus on external balance is also misguided view of
competitiveness. The external balance of countries is neither related to the quality of MICRO
and SIPI, nor to prosperity levels. Model (5-2) shows that the current account balance is
positively influenced only by monetary and fiscal policies (MFP). Furthermore, this variable is
not significantly correlated with output per capita (after controlling for country endowments).
The current account is a useful diagnostic indicator of macroeconomic policy, but not sufficient
to capture the broader notion of competitiveness as a driver of sustainable levels of prosperity.
30 See Busso, Gregory and Kline (2010) and Criscuolo et al. (2012) and for evaluation of some labor mobilization policies in the US and in Europe.

26
Industrial competitiveness, understood as strong exports positions in specific sectors, is
also thought to be important for prosperity. We analyze industrial competitiveness as measured
by (log of) manufacturing exports per capita in model (5-3) and by high-tech exports (%
manufacturing exports) in model (5-4). In both specifications we find that export performance is
positively related to microeconomic competitiveness, as we would expect, with no significant
impact of SIPI. Export intensity in manufacturing and high-tech is also positively correlated to
the levels of output per capita of a country (not reported). Export performance in selected
industries is a reflection of microeconomic competitiveness, and an intermediate indication of
prosperity. But it is best understood as a symptom of strengths in specific competitiveness
dimensions rather than as comprehensive measure of foundational competitiveness. Direct focus
on exports independent of underlying competitiveness runs the risk of encouraging distortions
and subsidies that will reduce prosperity rather than enhance it.
6. Assessing Foundational Competitiveness and Global Investment Attractiveness for
Individual Countries
Our empirical framework provides a foundation for estimating the level of foundational
competitiveness for individual countries. We construct a competitiveness score for each country
within our sample by first normalizing the coefficients associated with each of the three
dimensions of competitiveness (MICRO, SIPI, and MFP) so that they sum to 1.0 (e.g.,
MICRO MICRO MICRO SIPI MFPˆ ˆ ˆ ˆˆ ( ) . Using the estimates from our baseline specification
(model 2-3), the estimated competitiveness score for county c in year t is: ct ct ct ctCompetitiveness Score 0.433*MICRO 0.452*SIPI 0.114*MFP (2)
Table 6 provides the resulting competitiveness scores and rankings for the top 30 nations in
2010, with Sweden, Switzerland, and Finland leading in foundational competitiveness.
Using the literature on composite indices (Kaufmann et al., 1999, 2004; OECD, 2008;
and Høyland et al., 2009), we test the robustness of these scores (and rankings) in several ways.
First, the predicted competitiveness scores tend to have small standard errors and narrow

27
confidence intervals (see Figure 5).31 The competitiveness scores (and its components) are also
robust to the random exclusion of individual indicators, and to the exclusion of countries, years
and control variables (See Tables A3 and A4).32
The competitiveness score thus provides a powerful summary indicator of each country’s
foundational medium-term competitiveness compared to peers. Significant changes in the scores
over time provide revealing information about the evolution of competitiveness of countries.
While country competitiveness tends to change slowly, some countries, like China, have
experienced meaningful improvements in competitiveness in recent years (especially in
subcategories of MICRO).
Our framework can also evaluate the sustainability of a country’s prosperity level, by
looking at the gap between actual output per potential worker and the estimated competitiveness
levels, and the dynamics of this gap overtime. For some countries, like Spain, and Greece, actual
output per potential worker in 2008 was significantly higher than predicted given their
underlying microeconomic and macroeconomic conditions and endowments (i.e., the country-
year residual from estimating equation 1 was large and positive). Prosperity levels unexplained
by competitiveness or endowments may not be sustainable.
Understanding Global Investment Attractiveness
Global investment attractiveness (GIA) weighs foundational competitiveness against the
cost of factor inputs, especially labor. This is revealing for understanding the flows of
investment, the sustainability of a country’s current prosperity, and the likely trajectory for
growth and future prosperity.
To assess global investment attractiveness of individual countries, Figure 6 plots (log)
labor costs per hour in US$ (pay and non-pay costs) versus country foundational competitiveness
31 We compute the standard errors of the predicted competitiveness scores (from estimating model 2-3) and build the 90% confidence interval for each country-year score. In 2010 the average width of the confidence intervals is only 0.281 (and the standard deviation is 0.173). 32 First, as explained in Section 4.2, we test the robustness of the estimated MICRO SIPI and MP categories to the random exclusion of individual indicators. We find that these measures and the overall competitiveness score are robust to excluding indicators (See Table A4). Second, we use the 1,500 bootstrapped coefficients from model (2-4) - based on the random changes in the set of countries and years - to compute the bootstrapped competitiveness scores of a country-year. We find that the gap between the base competitiveness score and the median bootstrapped score of a country-year is insignificant. The maximum absolute gap in the score is only 0.012. We also examine how the competitiveness score changes when randomly dropping up to all the endowment variables and the gap between the base and bootstrapped competitiveness scores is also insignificant (See Table A3).

28
scores in 2008.33 Countries like India, Malaysia, China and Singapore are attractive not because
of their low absolute level of wages, but because their wages are low relative to their
foundational competitiveness. Venezuela’s wages, for example, are not much higher than
Malaysia’s. But the lower level of foundational competitiveness makes Venezuela a much less
attractive location.
Interestingly, countries like Spain, Italy, and Greece, for which the current global crisis
has proven current prosperity levels to be unsustainable, registered low global investment
attractiveness before the crisis. For these countries, the level of actual output per potential
worker was significantly higher than the output predicted given their foundational
competitiveness and endowments. This mismatch can be the consequence of growth spurts due
to credit-fuelled consumption and investment in non-productive areas such as residential or
commercial real estate.34 An alternative explanation for the deviation in labor costs from
foundational competitiveness would be labor market regulations that keep wages above or below
market clearing levels.35
To better understand the link between GIA and country dynamics, in Figure 7 we plot
GIA in 2008 against the growth in output per potential worker during 2008-2010. Overall, the
2008-2010 was a period of negative growth, with a median value of -2.7% in our sample.
However, we see interesting differences in country dynamics related to GIA. This analysis,
which can only be suggestive given the short time period, reveals that current GIA is positively
and significantly correlated with subsequent growth.36 Countries with high GIA tend to
experience a strong positive growth, including China and India (with growth rates above 8% and
4%, respectively). In contrast, countries with low GIA tend to experience a high contraction in
output with growth rates below the median value, including Italy, Spain, Ireland, and Venezuela,
among others.
33 Based on the analysis in Figure 6, we measure GIA by comparing a country’s actual labor costs with the labor costs predicted by its competitiveness (i.e., the GIA score used is defined as the Expected (ln) Labor costs given competitiveness minus Actual (ln) Labor Costs) We implement this analysis for a sub sample of 60 countries for which the labor costs data is available. Further work is needed to develop a more robust measure of global attractiveness for a larger set of countries. 34 For a further discussion of the Spanish case see Delgado and Ketels (2011). 35 This would impact the deviation of actual from expected output less strongly than overheating demand. Artificially high wages dampen output through lower employment but could also strengthen demand. A modeling of these dynamics is beyond the scope of this paper. 36 This correlation remains significant and of similar magnitude after dropping some obvious outliers (China, Latvia, and Lithuania).

29
These initial findings suggest that GIA is important to explaining the economic trajectory
of individual countries. Further analysis is needed to fully understand the relationship between
foundational competitiveness and global investment attractiveness over longer time periods,
including the role of changing FDI, export activity, and wage growth. For example, a high level
of global investment attractiveness should spur a process by which wages grow rapidly over time
relative to growth in productivity. It is also possible that the relationship between foundational
competitiveness, global investment attractiveness, and prosperity over time is non-linear (e.g.,
for sufficiently low levels of competitiveness, even a low wage level may not be sufficient to
attract investment) or related to country-specific factors such as market size. We plan to
investigate these relationships in more detail in future work.37
7. Conclusion
Competitiveness has become a central feature of the economic policy debate, as it should
when it is understood as underpinning prosperity. But the competitiveness debate, both in policy
and academia, remains hobbled by confusion about what the term competitiveness actually
means. This paper offers a definition and framework for competitiveness that is directly linked
to cross-country differences in economic performance. To explain competitiveness, we offer a
comprehensive framework capturing the full range of influences, with a focus on fundamental
factors that can be changed through new policies and practices.
We define foundational competitiveness as the expected level of output per working-age
individual given the overall quality of a country as a place to do business. We define global
investment attractiveness as factor costs relative to foundational competitiveness, which captures
the economic attractiveness of a location which will drive growth and the rate of prosperity
improvement.
We develop and estimate a framework for measuring foundational competitiveness that
synthesizes a wide range of studies on different dimensions. It captures both macroeconomic
and microeconomic underpinnings of competitiveness in three areas: social infrastructure and
political institutions, monetary and fiscal policy, and microeconomic conditions. We establish a
37 Further analysis can also look at the time-series data to examine whether global attractiveness of individual countries is persistent or transitory. Our preliminary analysis, using the roughly decade-long data set we have available, indicates a significant level of persistence. Wages do adjust; see for example the recent wage growth in China. But quite often there seem to be structural factors that inhibit or at least slow this process.
30
positive and separate influence of each of these drivers in determining country-level differences
in output per potential worker. While confirming previous findings on the role of broad
institutional circumstances, we find that the microeconomic environment has a separate and
robust positive effect on competitiveness, even after controlling for current and historical
institutional conditions and national endowments. Our empirical analysis reveals limitations of
competitiveness thinking based on cost competitiveness, external balances, and export
performance in selected industries.
We offer a novel methodology for estimating a theoretically grounded and empirically
validated index of national competitiveness. Current competitiveness-related rankings (e.g.,
World Economic Forum, 2011; World Bank, 2010; Heritage Foundation, 2010) provide useful
data on particular policy areas. However, other indexes lack a clear conceptual framework and
suffer from inadequate aggregation procedures.
There are several opportunities to build in the analysis given here. First, our exploration
of global investment attractiveness promises insights into the economic trajectory of particular
countries that relates closely to the intuition of many practitioners about what competitiveness is.
The definition of global investment attractiveness offers a platform for further work.
Second, the relative impact of different dimensions of competitiveness on overall
prosperity is likely to change during the course of economic development. In particular, we
expect microeconomic conditions to be increasingly important as countries proceed to more
advanced stages of development (Rostow, 1960; Porter, 1990). Our short panel dataset makes it
challenging to reliably test for these dynamics, but future additions to the data should enable
further research in this direction.
Third, the national competitiveness profiles generated by our framework provide valuable
input to identifying country-specific priorities in upgrading overall competitiveness. We expect
improvements in individual weaknesses, which relate to ‘binding constraints’ (Hausmann,
Rodrik and Velasco, 2005), should have a disproportionate effect on expected output per
potential worker. This will occur if the impact of one dimension of competitiveness on
prosperity depends on the level of competitiveness achieved in other dimensions (Porter, 1990).
The empirical approach here stays within the tradition of the existing literature in leaving these
interaction effects outside of the analysis. However, the combination of competitiveness profiles
together with data on different aspects of economic performance (e.g., labor costs, rate of

31
business creation, TFP, and FDI) can create a powerful diagnostic tool to help identify country-
specific binding constraints for competitiveness improvement (e.g., Porter and Ketels, 2007;
Hausmann et al., 2005; Ketels, 2011).
Fourth, our analysis suggests that competitiveness is linked to both components of output
per potential worker: the output per employed person and the ability of a country to mobilize the
workforce. Further research could examine the separate role that each of the subcategories of
foundational competitiveness plays in each of these components. Particular dimensions of the
national business environment and business practices could be especially relevant for
understanding the drivers of labor mobilization, a question with great salience for the policy
debate in many countries.
Finally, the same competitiveness framework can be used to assess performance and at
different geographic levels. This is especially important for sub-national regions, because many
competitiveness factors, especially microeconomic, differ across regions within countries and
result in significant differences in economic performance at this level (Porter, 2003; Gennaioli et
al., 2011, Delgado et al., 2012). While data availability is challenging, there is an increasing
realization that the sub-national level is a highly salient level of geography.
8. References
Acemoglu, D., S. Johnson and J. Robinson. 2001. “The Colonial Origins of Comparative Development,” American Economic Review 91 (5), 1369-1401.
Acemoglu, D., S. Johnson, J. Robinson, and Y. Thaicharoen. 2003. “Institutional Causes, Macroeconomic Symptoms: Volatility, Crises and Growth,” Journal of Monetary Economics 50 (1), 49-123.
Aghion, P., P. Howitt, D. Mayer-Foulkes. 2007. “The Effect of Financial Development on Convergence: Theory and Evidence,” Quarterly Journal of Economics 120 (1), 173-222.
Aiginger, K. 2006. “Competitiveness: From a Dangerous Obsession to a Welfare Creating Ability with Positive Externalities,” Journal of Industry, Competition and Trade, 6 (2), 161-177
Alcalá, F. and A. Ciccone. 2004. “Trade and Productivity,” Quarterly Journal of Economics 119 (2), 613-646.
Ang, J. 2008. “A Survey on Recent Developments in the Literature on Finance and Growth,” Journal of Economic Surveys 22 (3), 536-576.
Arezki, R. and F. van der Ploeg. 2007. “Can the Natural Resource Curse Be Turned into a Blessing?” IMF Working Paper 07/55. Washington, DC: International Monetary Fund.
Aschauer, D. A. 1989. “Is Public Expenditure Productive?” Journal of Monetary Economics 23 (2), 117–200.

32
Baldwin, R. 2003. “Openness and Growth: What's the Empirical Relationship,” NBER Working Paper No. 9578.
Barro, R. J. 2002. “Inflation and Growth,” in: J. Rabin, G. Stevens (eds.), Handbook of Monetary Economics, Boca Raton: CRC Press.
Barro. J.R. 2002. “Education as a Determinant of Economic Growth,” in E. Lazear (ed.), Education in the Twenty-First Century, Stanford, CA: Hoover Institute.
Bartelsman, E.J., J.C. Haltiwanger, and S. Scarpetta. 2009. “Cross-Country Differences in Productivity: The Role of Allocation and Selection,” NBER Working Paper No. 15490.
Branstetter, L. 2006. “Is Foreign Direct Investment a Channel of Knowledge Spillovers? Evidence from Japan's FDI in the United States.” Journal of International Economics 68(2), 325-344.
Branstetter, L., F. Lima, J.T. Lowell, and A. Venancio. 2010. “Do Entry Regulations Deter Entrepreneurship and Job Creation? Evidence from Recent Reforms in Portugal,” NBER Working Paper No. 16473.
Bernard, A.B. and J. Bradford Jensen. 1999. “Exceptional Exporter Performance: Cause, Effect, or Both?” Journal of International Economics 47(1), 1-25.
Bernard, A., J. Jensen, S. Redding and P. Schott. 2007. “Firms in International Trade,” Journal of Economic Perspectives 21(3), 105-130.
Bloom, N. J. Van Reenen. 2007. “Measuring and Explaining Management Practices Across Firms and Countries,” Quarterly Journal of Economics 122 (4), 1351-1408.
Bloom, N. and Sadun, R. and Van Reenen, J. 2009. “The Organization of Firms across Countries,” CEP Discussion Papers, 937. Centre for Economic Performance, London School of Economics and Political Science, London, UK.
Boltho, A. 1995. “The Assessment: International Competitiveness,” Oxford Review of Economic Policy 12 (3), 1-16.
Boulhol, H., A. de Serres, and M. Molar. 2008. “The Contribution of Economic Geography to GDP per Capita,” Economics Department Working Paper No. 602, Paris: OECD.
Browne, C., R. Bryden, M. Delgado and T. Geiger. 2008. “Executive Opinion Survey: Capturing the Voice of the Business Community,” in World Economic Forum (ed.), 2008, The Global Competitiveness Report 2008-2009, Hampshire: Palgrave Macmillan.
Busso, M., J. Gregory and P. Kline. 2010. “Do Local Empowerment Programs Work? Evidence from the Federal Empowerment Zone Program,” NBER Working Paper No. 16096.
Calderon, C., L. Serven. 2004. “The Effects of Infrastructure Development on Growth and Income Distribution,” World Bank Policy Research Working Paper No. 3400. Washington, D.C.: World Bank.
Carlin, W., M. Schaffer and P. Seabright. 2005. “A Minimum of Rivalry: Evidence from Transition Economies on the Importance of Competition for Innovation and Growth,” William Davidson Institute Working Paper No. 670, Ann Arbor: University of Michigan Business School.
Caselli, F. “Accounting for Cross-Country Income Differences,” in Aghion, P., S. Durlauf (eds.). 2005. Handbook of Economic Growth. Amsterdam: Elsevier.
Ciccone, A. and E. Papaioannou. 2008. “Entry Regulation and Intersectoral Reallocation,” Working Paper.
Coe, D. and E. Helpman. 1995. “International R&D Spillovers,” European Economic Review 39, 859-887.

33
Conway, P., V. Janod, and G. Nicoletti. 2005. “Product Market Regulation in the OECD Countries,” Economics Department Working Paper No. 419, Paris: OECD.
Criscuolo C., R. Martin, H. Overman, and J.V. Reenen. 2012. “The Causal Effect of Industrial Policy,” NBER Working Paper 17842.
De Grauwe, P. 2010. Introduction, in P. De Grauwe (ed.), Dimensions of Competitiveness, CESifo Seminar Series, Cambridge: MIT Press, ix-xvi.
Delgado M., 2010, “Do Clusters Really Matter for Companies’ Competitive Strategies? Evidence at the Country Level,” Manuscript.
Delgado, M. and C. Ketels. 2011. “Assessing Country Competitiveness: Case of Spain,” in P. Cooke, J.L. Curbelo and M.D. Parrilli (eds.) Innovation, Global Change and Territorial Resilience, Edward Elgar, Cheltenham, forthcoming.
Delgado, M., M.E. Porter and S. Stern. 2012. “Defining Clusters of Related Industries,” Manuscript.
Delgado, M., M.E. Porter and S. Stern. 2010a. “Clusters, Convergence and Economic Performance,” U.S. Census Bureau Center for Economic Studies (CES) Working Paper 10-34.
Delgado M., M.E. Porter, and S. Stern. 2010b. “Clusters and Entrepreneurship,” Journal of Economic Geography 10 (4), 495-518.
De Soto, H. 2000. The Mystery of Capital, New York City, NY: Basic Books. Dertouzos, M.L., R.K. Lester, and R.M. Solow. 1989. Made in America: Regaining the
Productive Edge, MIT Press, Cambridge, Mass. Dixit, A. 2007. “Evaluating Recipes for Development Success,” The World Bank Research
Observer 22 (2), 131-158. Dollar, D. and A. Kraay. 2003. “Institutions, Trade, and Growth,” Journal of Monetary
Economics 50 (1), 133-162. Esty, Daniel C. and Michael E. Porter. 2005. “National Environmental Performance: An
Empirical Analysis of Policy Results and Determinants,” Environment and Development Economics 10 (4).
European Central Bank. 2008. “Globalization and the Competitiveness of the Euro Area,” Occasional Paper Series No. 97, Frankfurt: European Central Bank.
European Commission. 2010. Europe 2020: A European Strategy for Smart, Sustainable, and Inclusive Growth, COM (2010) 2020, Brussels: European Commission.
Fagerberg, J., M. Srholec and M. Knell. 2007. “The Competitiveness of Nations: Why Some Countries Prosper While Others Fall Behind,” World Development 35 (10), 1595-1620.
Fagerberg J. 1988. “International Competitiveness,” Economic Journal 98, 355-374. Feldman, M. and D. Audretsch. 1999. “Innovation in Cities: Science-Based Diversity,
Specialization and Localized Competition,” European Economic Review 43(2), 409-429. Fischer, S. 1993. “The Role of Macroeconomic Factors in Growth,” Journal of Monetary
Economics 32 (3), 485-512. Frankel, J. and D. Romer. 1999. “Does Trade Cause Growth,” The American Economic Review
89 (3), 379-399. Freeman, R.B. and K.L. Shaw (eds.). 2009. International Differences in the Business Practices
and Productivity of Firms, NBER Conference Reports, Chicago, The University of Chicago Press.
Furman, J., M. Porter, S. Stern. 2002. “The Determinants of National Innovative Capacity,” Research Policy 31 (6), 899-933.

34
Gallup, J.L., J.D. Sachs, and A.D. Mellinger. 1998. “Geography and Economic Development,” NBER Working Paper, No. 6849, Cambridge, MA: National Bureau of Economic Research.
Garcia-Milà, T., T. McGuire, R. Porter. 1996. “The Effect of Public Capital in State-Level Production Functions Reconsidered,” Review of Economics and Statistics 78 (1), 177- 180.
Glaeser, E.L., and W.R. Kerr, 2009, “Local Industrial Conditions and Entrepreneurship: How Much of the Spatial Distribution Can We Explain?” Journal of Economics and Management Strategy, 18(3), pp. 623-663.
Glaeser, E., R. La Porta, F. Lopez-de-Silanes, and A. Shleifer. 2004. “Do Institutions Cause Growth?,” Journal of Economic Growth 9(3), 271-303.
Gennaioli, N., R, La Porta, F. Lopez-de-Silanes, and A. Shleifer. 2011. “Human Capital and Regional Development,” NBER Working Paper 17158.
Goodfriend, M. 2007. “How the World Achieved Consensus on Monetary Policy,” Journal of Economic Perspectives 21(4), pp. 47-68.
Gramlich, E. M. 1994. “Infrastructure Investment: A Review Essay,” Journal of Economic Literature 32(3), 1176-96.
Gylfason, R., T. Herbertson, and G. Zoega. 1997. “A Mixed Blessing: Natural Resources and Economic Growth,” Discussion Paper No. 1668, London: Center for Economic Policy Research.
Hall, R. E. and C. I. Jones. 1999. “Why Do Some Countries Produce So Much More Output per Worker than Others?” Quarterly Journal of Economics 114 (1), 83-116.
Hausmann, R. and B. Klinger. 2006. “Structural Transformation and Patterns of Comparative Advantage in the Product Space,” Working Paper No. 128.Cambridge, MA: Harvard University Center for International Development.
Hausmann, R., D. Rodrik, and A. Velasco. 2005. “Growth Diagnostics,” Working Paper, Boston: Harvard University – Kennedy School of Government.
Heritage Foundation. 2010. 2010 Index of Economic Freedom. Washington, D.C.: The Heritage Foundation.
Høyland B., K. Moene, and F. Willumsen. 2009. “The Tyranny of International Index rankings,” Working Paper.
Jaffe, A. 1995. Environmental Regulation and the Competitiveness of U.S. Manufacturing: What Does the Evidence Tell Us?,” Journal of Economic Literature 33 (1), 132-163.
Johansson, Å., C. Heady, J. Arnold, B. Brys, and L. Vartia. 2008. “Tax and Economic Growth,” Economics Department Working Paper No. 620, Paris: OECD.
Kaufmann, D., A. Kraay, and P. Zoido-Lobaton.1999. “Aggregating Governance Indicators,” Policy Research Working Paper Series 2195, The World Bank.
Kaufmann, D., A. Kraay, and M. Mastruzzi. 2008. “Governance Matters VII: Governance Indicators for 1996–2007,” World Bank Policy Research Working Paper No. 4654, Washington, D.C.: World Bank.
Ketels, C. 2011. “Latvia Competitiveness Report: Diagnosing Country Competitiveness,” mimeo, Stockholm School of Economics: Riga.
King, R. and R. Levine. 1993. “Finance, Entrepreneurship, and Growth,” Journal of Monetary Economics 32 (3), 513-542.
Krueger, A., M. Lindahl. 2001. “Education for Growth: Why and For Whom?” Journal of Economic Literature 39 (4), 1101-1136.
35
Krugman, P. 1986. Strategic Trade Policy and the New International Economics. MIT Press. Krugman, P. 1994. “Competitiveness: A Dangerous Obsession,” Foreign Affairs 73(2), 28-44. Lall, S. 2001. Competitiveness, Technology and Skills. Cheltenham: Edgar Elgar. La Porta, R., F. Lopez-de-Silanes, A. Shlefer, and R. Vishny. 1998. “Law and Finance,” Journal
of Political Economy 106 (6), 1113-1155. Levine, R. 2005. “Law, Endowments, and Property Rights,” Journal of Economic Perspectives
19 (3), 61-88. Levine, R. “Finance and Growth: Theory and Evidence”, in: Aghion, P., S. Durlauf (eds.). 2005.
Handbook of Economic Growth. Amsterdam: Elsevier Levine, R. and D. Renelt. 1992. "A Sensitivity Analysis of Cross-country Growth Regressions,”
American Economic Review 82 (4), 942-963. Lewis, W. W. 2004. The Power of Productivity. Chicago, IL: The University of Chicago Press. Lin, J.Y., 2011. “New Structural Economics: A Framework for Rethinking Development,”
Policy Research Working Papers, no. 5197, Washington D.C., World Bank. Linder, S. B. 1961. An Essay on Trade and Transformation. Stockholm: Almqvist & Wicksell. Lorentzen, P., J. McMillan, and R. Wacziarg. 2008. “Death and Development,” Journal of
Economic Growth 13 (2), 81-124. MacGarvie, M. 2006. “Do firms learn from international trade?,” Review of Economics and
Statistics 88 (1), 46-60. Mauro, P. 1995. “Corruption and Growth,” Quarterly Journal of Economics 110 (3), 681-712. Megginson, W. and J. Netter. 2001. “From State to Market: A Survey of Empirical Studies on
Privatization,” Journal of Economic Literature 39 (2), 321-389. Nickell, S. 1996. “Competition and Corporate Performance,” Journal of Political Economy 104
(4), 724-746. Nickell, S. and R. Layard, 1999. “Labor Market Institutions and Economic Performance,” in: O.
Ashenfelter and D. Card (ed.), Handbook of Labor Economics, 3, 3029-3084. Elsevier. Nicoletti, G., S. Scarpatta. 2003. “Regulation, Productivity and Growth,” OECD Working Paper
No. 347, Paris: OECD. OECD. 1994. The OECD jobs study: facts, analysis, strategies. Paris: OECD. OECD. 2005. Economic Policy Reforms: Going for Growth 2005. Paris: OECD. OECD. 2008. Handbook on Constructing Composite Indicators. Paris: OECD. Papyrakis, E., and R. Gerlagh. 2004. “The Resource Curse Hypothesis and Its Transmission
Channels,” Journal of Comparative Economics 32 (March), 181-93. Porter, M. E. 2006. “The Microeconomic Foundations of Prosperity: Findings from the Business
Competitiveness Index,” with C. Ketels and M. Delgado, in World Economic Forum (ed.), Global Competitiveness Report 2006-2007, Geneva: World Economic Forum.
———. 2003. “The Economic Performance of Regions,” Regional Studies 37(6&7), 549-678. ———. 2003. “Building the Microeconomic Foundations of Prosperity: Findings from the
Microeconomic Competitiveness Index,” in The Global Competitiveness Report 2002-2003, P. Cornelius (ed.), New York: Oxford University Press.
———. 1998a. “Clusters and Competition: New Agendas for Companies, Governments, and Institutions.” In On Competition. Boston: Harvard Business School Press.
———. 1998b. “Measuring The Microeconomic Foundations of Economic Development,” in The Global Competitiveness Report 1998, Geneva, Switzerland: World Economic Forum, 1998.
———. 1996. “What Is Strategy?” Harvard Business Review 74 (6), 61-78.

36
———. 1990. The Competitive Advantage of Nations. New York: The Free Press. Porter, M.E., M. Delgado, C. Ketels, and S. Stern. 2008. “Moving to a New Global
Competitiveness Index,” in World Economic Forum (ed.), 2008, The Global Competitiveness Report 2008-2009.
Porter, M. E. and M. Sakakibara. 2004. “Competition in Japan,” Journal of Economic Perspectives, Winter Issue.
Porter, M. E. and C. Ketels. 2007. Competitiveness at the Crossroads: Choosing the Future Direction of the Russian Economy. Moscow: Center for Strategic Research.
Porter, M. E. and C. van der Linde. 1995. “Toward a New Conception of the Environment-Competitiveness Relationship,” Journal of Economic Perspectives 9(4), 97-118.
Rajan, R., L. Zingales. 1998. “Financial Dependence and Growth,” American Economic Review 88 (3), 559-586.
Reinhart C.M and K.S. Rogoff. 2010. “Growth in a Time of Debt,” American Economic Review Papers and Proceedings.
Rodríguez, F. and D. Rodrik. 2000. “Trade Policy and Economic Growth: A Skeptic's Guide to the Cross-National Evidence.” In B. Bernanke and K. Rogoff (eds.), NBER Macroeconomics Annual 2000. Cambridge, MA: National Bureau of Economic Research.
Rodrik, D., A. Subramanian, and F. Trebbi. 2004. “Institutions Rule: The Primacy of Institutions over Geography and Integration in Economic Development,” Journal of Economic Growth 9 (2), 131-165.
Romer, P. M. 1990. “Endogenous Technological Change,” Journal of Political Economy 98(5), S71-S102.
Rostow, W.W. 1960. The Stages of Economic Growth: A Non-Communist Manifesto. Cambridge: Cambridge University Press.
Sachs, J. 2005. The End of Poverty. New York City, NY: Penguin. Sachs, J. and A. Warner. 2001. “The Curse of Natural Resources,” European Economic Review 45, 827-838. Sachs, J. and A. Warner. 1995. “Economic Reform and the Process of Global Integration,”
Brookings Papers on Economic Activity 1(1), 1-118. Sala-i-Martin, X., G. Doppelhoffer, and R. Miller. 2004. “Determinants of Long-Term Growth:
A Bayesian Averaging of Classical Estimates (BACE) Approach,” American Economic Review 94 (4).
Sala-i-Martin, X., J. Blanke, M. Drzeniek Hanouz, T. Geiger, I. Mia and F. Paua. 2007. The Global Competitiveness Index: Measuring the Productive Potential of Nations, in: The Global Competitiveness Report 2007/08, Geneva: World Economic Forum.
Saxenian, A., 1994, Regional Advantage: Culture and Competition in Silicon Valley and Route 128. Cambridge, MA: Harvard University.
Shleifer, A., R. Vishny. 1991. “Corruption,” Quarterly Journal of Economics 109 (3), 599-617. Spencer, B. and J. Brandner. 2008. “Strategic Trade Policy,” in: The New Palgrave Dictionary of
Economics, ed. by S.N. Durlauf and L. E. Blume, Basingstoke, Hampshire: Palgrave Macmillan, 2008.
Stone, C. 2006. “Crime, Justice, and Growth in South Africa: Toward a Plausible Contribution from Criminal Justice to Economic Growth,” CID Working Paper No. 131, Cambridge, MA: Harvard University.
Syverson, C., 2004, “Market Structure and Productivity: A Concrete Example,” Journal of Political Economy 112 (6), 1181–1222.

37
Syverson, C. 2011. “What Determines Productivity?,” Journal of Economic Literature 49(2), 326-365.
Temple, J. 2000. “Inflation and Growth: Stories Short and Tall,” Journal of Economic Surveys 14 (4), 395-426
UNIDO - Industrial Development Report. 2009. Breaking In and Moving Up: New Industrial Challenges for the Bottom Billion and the Middle-Income Countries, ISBN: 978-92-1-106445-2.
Weil, D. 2007. “Accounting for the Effect of Health on Economic Growth,” Quarterly Journal of Economics 122 (3), 1265-1306.
World Bank. 2010. Doing Business in 2010. Washington, D.C.: The World Bank. World Bank. 2011. “Employing Workers Methodology.”
http://www.doingbusiness.org/methodology/employing-workers, accessed 8/30/11

38
Table 1: Variable Definition and Descriptive Statistics (2001-2008) Definition 130 countries
Mean (Std)
(Obs. 832)
59 countries
(ex-colony)
Mean (Std)
(Obs. 400) Output per capita GDP (PPP-adjusted) per capita 14867.190
(14185.330) 9320.001
(10763.44) Output per potential worker GDP (PPP-adjusted) per working-age
individual (15-64 years old) 21908.20
(20287.77) 14066.43
(15319.49) Output per worker* GDP (PPP-adjusted) per employed
individual 34829.76
(26525.45) 23892.60 (22655.1)
Labor mobilization ratio Employed population/Working-age population ratio
0.658 (0.120)
0.650 (0.120)
Microeconomic Competitiveness (MICRO)
PCA aggregation of MICRO indicators 0.019 (0.992)
-0.285 (0.925)
MICRODoing Business* Weighted average of the World Bank
doing business indicators 0.030
(0.978) -0.215 (1.038)
Social Infrastructure and Political Institutions (SIPI)
PCA aggregation of SIPI indicators 0.014 (0.985)
-0.356 (0.922)
Monetary and Fiscal Policy (MFP)
Weighted average of Fiscal and Monetary Policy Indicators
0.003 (0.987)
-0.236 (1.028)
Ln European Settler Mortality
(Ln) European settler mortality rate (17th-19th centuries; Acemoglu et al., 2001)
4.378 (1.192)
ENDOWMENTS Population Population in millions 53.343
(167.588) 61.905
(161.025) Location Percentage of Land area within 100 km
of ice-free coast/navigable river 56.240
(36.671) 50.115
(36.480) Unprocessed exports per capita
Per capita unprocessed goods exports (US $)
721.790 (2624.412)
327.454 (645.716)
Notes: Unbalanced panel of 130 countries and a sub-sample of 59 ex-colony countries. The variables are sourced from: IMF (GDP, Population), Conference Board Total Economy Database (Employed Population), the Center for International Development database (Location) and UN Comtrade dataset (Unprocessed exports pc). See Table A1 for the list of individual indicators used to compute the composite variables MICRO, SIPI and MP. *MICRODoing Business is only available 2004-2010. Output per worker is available for a sub-sample of 108 countries.

39
Table 2: Competitiveness and output per potential worker (Obs.= 832)
Ln Output per potential worker
Bootstrap Doing Business Obs.=575
Ln GDP per
capita (ppp)
Country FEs
2-1 2-2 2-3 2-4 2-5 2-6 2-7 MICRO .595
(.047)
.289
(.125)
.283
(.124)
.277
(.129)
.043
(.017)
MICRODOING BUSINESS .274
(.074)
SIPI .574
(.053)
.301
(.123)
.302
(.123)
.349
(.070)
.338
(.130)
.001 (.022)
MFP .086
(.045) .076
(.044)
.077
(.046)
.099
(.039)
.080
(.047)
.007 (.005)
Ln Population .022 (.030)
-.066
(.032)
-.021 (.034)
-.020 (.035)
.031 (.028)
-.011 (.036)
Location .006
(.001)
.005
(.001)
.006
(.001)
.006
(.001)
.007
(.001)
.007
(.001)
Ln Unprocessed exports per capita
.233
(.028)
.250
(.026)
.234
(.027)
.234
(.028) .236
(.025)
.249
(.029)
Year Fixed Effects Yes Yes Yes Yes Yes Yes Yes Country Fixed Effects No No No No No No Yes R-squared .824 .820 .830 .854 .826 .998 Notes: All specifications include intercept (not reported). Bold and bold-italic refer to coefficients significant at 5% and 10% levels. Standard errors clustered by country. Model 2-4 reports bootstrapped standard errors based on 1,500 simulations (using a random set of countries and randomly dropping a year in each simulation). Model 2-5 uses a composite measure based on the World Bank doing business indicators; this data is only available after 2003.Model 2-6 uses GDP per capita (ppp-adjusted) as the dependent variable. Table 3: Competitiveness, historical legacy factors, and output per potential worker
Ln Output per potential worker
Sub-sample of ex-colonies Obs.=400 3-1 3-2 3-3 3-4 MICRO .385
(.075)
.404
(.168)
.469
(.154)
SIPI .331
(.081)
.158 (.154)
-.120 (.144)
MFP .073 (.049)
.047 (.039)
Ln European Settler Mortality -.298
(.058)
-.296
(.047)
-.304
(.047)
Ln Population -.027 (.043)
-.094
(.038)
-.072 (.055)
-.112
(.043) Location .005
(.002)
.003
(.002)
.004
(.002)
.003
(.002)
Ln Unprocessed exports pc .246
(.034) .238
(.031) .260
(.039) .236
(.030) Year Fixed Effects Yes Yes Yes Yes R-squared .837 .859 .791 .862 Notes: Standard errors clustered by country. Bold and bold-italic numbers refer to coefficients significant at 1% and 5% levels. The sample is a set of 59 countries that were colonized (see Acemoglu et al., 2001).

40
Table 4: Competitiveness and the components of output per potential worker (Obs.=726) Ln Labor Mobilization Ratio Ln Output per Worker
4-1 4-2 4-3 4-4 MICRO .079
(.048)
.228 (.157)
SIPI .009 (.048)
.276
(.155)
MFP -.005
(.021) .071
(.061)
COMPETITIVENESS score .090
(.016)
.572
(.064)
Ln Population -.004 (.014)
.002 (.012)
-.014 (.044)
-.017 (.037)
Location -.001
(.000)
-.001 (.000)
.007
(.002)
.007
(.002)
Ln Unprocessed exports per capita
.000 (.011)
-.001 (.011)
.232
(.036)
.233
(.036)
Year Fixed Effects Yes Yes Yes Yes R-squared .176 .168 .760 .760
Note: All specifications include intercept (not reported). Bold and bold-italic refer to coefficients significant at 5% and 10% levels. Standard errors clustered by country. This analysis uses up to 108 countries for which employed population data is available. Labor mobilization ratio is defined as Ln(Employed Pop/Working-Age Pop) and Output per Worker as GDP-ppp/Employed Population. Models 2 and 4 include our overall competitiveness score (using the normalized weights from model 2-3; see equation 2 in Section 6).
Table 5: Other views about competitiveness
Ln Labour costs per hour - US$
Current Account Balance
(% GDP)
Ln Mfg Exports per capita ($US)
High-tech Exports
(% Mfg exports)
Obs.=464 Obs.=832 Obs.=819 Obs.=819 5-1 5-2 5-3 5-4
MICRO -.124 (.419)
1.380 (2.579)
1.063
(.340)
5.521
(3.130)
SIPI 1.135
(.429)
-1.528 (2.426)
.397 (.385)
.168 (3.240)
MFP .054 (.137)
1.195
(.667)
.220
(.112)
.781 (.783)
Ln Population -.016 (.074)
.746 (.622)
-.033 (.095)
.797 (.843)
Location .004 (.003)
-.008 (.023)
.015
(.003)
.055 (.041)
Ln Unprocessed exports per capita
.136 (.096)
2.263
(.586)
.197
(.092)
-.703 (.629)
Year Fixed Effects Yes Yes Yes Yes R-squared .719 .206 .713 .233 Notes: All specifications include intercept (not reported). Bold and bold-italic refer to coefficients significant at 5% and 10% levels. Standard errors clustered by country.

41
Table 6 Competitiveness rankings and scores in 2010 (Top 30 nations)
Country
Index Score
Index Rank
Micro Rank
COS Rank
NBE Rank
SIPI Rank
MFP Rank
Output per Potential Worker
Sweden 1.922 1 1 1 1 1 1 16 Switzerland 1.820 2 2 2 3 3 1 8 Finland 1.739 3 4 6 4 2 1 22 Netherlands 1.562 4 6 5 7 9 1 9 Denmark 1.541 5 9 7 14 6 1 17 Singapore 1.535 6 3 12 2 8 58 7 Norway 1.525 7 15 10 16 5 1 3 Germany 1.492 8 5 4 6 12 32 21 Luxembourg 1.485 9 16 17 15 7 1 1 Hong Kong SAR 1.437 10 8 20 5 15 1 12 Canada 1.397 11 10 19 8 10 39 15 Austria 1.376 12 17 11 17 13 27 13 Australia 1.365 13 21 24 20 11 1 11 New Zealand 1.365 14 23 25 23 4 1 30 United Kingdom 1.204 15 13 9 13 19 53 19 Belgium 1.144 16 18 15 18 18 66 18 Taiwan, China 1.143 17 12 14 9 29 1
Qatar 1.129 18 14 13 11 21 45 2 France 1.088 19 20 16 21 17 72 20 United States 1.050 20 11 8 12 31 38 5 Japan 1.040 21 7 3 10 20 114 23 Saudi Arabia 0.990 22 19 21 19 26 64 35 Cyprus 0.882 23 31 40 32 23 1 34 Ireland 0.862 24 26 22 27 22 61 10 Tunisia 0.850 25 27 29 26 24 47 76 Bahrain 0.840 26 28 43 25 32 19 24 Iceland 0.823 27 25 18 29 14 129 14 United Arab Emirates 0.794 28 24 26 24 34 63 25 Chile 0.767 29 30 35 30 28 33 51 Oman 0.751 30 29 39 28 25 69 31 Ranking based on 134 countries. Figure 1: Determinants of national foundational competitiveness

42
Figure 2a: Labor productivity, labor mobilization, and prosperity, 2008 (US=100)
Figure 2b: Frequency of labor mobilization ratios by labor productivity levels, 2008
Figure 3: Competitiveness framework structure: Six levels of measurement

43
Figure 4: Country differences in MICRO and SIPI, 2010
Figure 5: Country competitiveness scores and their confidence intervals in 2010
Notes: The confidence intervals (at 90% level) are based on the standard error (clustered by country) of the predicted competitiveness scores from estimating Model (2-3).

44
Figure 6: Country global investment attractiveness (Obs.=60)
Notes: Labor cost data is sourced from EIU (data available for a sub-sample of 60 countries).
Figure 7: Country global investment attractiveness and growth (Obs.=60)
Notes: Higher values of GIA means greater cost advantage relative to competitiveness. The GIA score is defined as the Expected (log) Labor costs given competitiveness minus Actual (log) Labor Costs (from the analysis in Figure 6). The median values of GIA and Growth in Output per Potential Worker are -0.164 and -0.027, respectively.

45
Appendix Table A1: Individual indicators by competitiveness category: Mean 2001-2008
MICROECONOMIC COMPETITIVENESS (MICRO)
Mean
Std
Dev
Mean
Std
Dev
Company operations and strategy (COS) Science and innovation infrastructure Strategy and operational effectiveness
Quality of scientific research institutions 4.04 .98
Firm-level technology absorption 4.78 .80 University/industry research collaboration 3.39 .99 Company spending on R&D 3.45 .98 Availability of scientists and engineers 4.53 .93 Nature of competitive advantage 3.66 1.11 Low brain drain 3.53 1.09 Value chain breadth 3.84 1.16 Utility patents per capita (log)d -13.59 2.71 Capacity for innovation 3.49 1.05 Quality of the educational system 3.68 1.07 Production process sophistication 3.90 1.16 Quality of math and science education 4.17 1.08 Extent of marketing 4.41 1.03 Quality of management schools 4.21 .98 Degree of customer orientation 4.61 .78 Tertiary school enrollmentc 35.18 24.6
Organizational practices
Demand conditions (NBE) Extent of staff training 3.93 .96 Gov procurement of advanced tech. products 3.69 .68 Willingness to delegate authority 3.86 .95 Gov success in ICT promotion 4.04 .83 Extent of incentive compensation 4.09 .86 Laws relating to ICT 3.84 1.05 Reliance on professional management 4.62 .92 Buyer sophistication 3.95 1.06
Internationalization of firms
Presence of demanding regulatory standards 4.29 1.09 Prevalence of foreign technology licensing 4.53 .85 Stringency of environmental regulations 4.03 1.18 Control of international distribution 4.04 .69 Supporting & related industries & clusters (NBE) Extent of regional sales 4.56 1.13 Availability of latest technologies 4.13 1.26 Breadth of international markets 3.86 1.27 Supplier quantity 4.76 .74
Factor (Input) conditions (NBE) Supplier quality 4.48 .94 Logistical infrastructure
Availability of process machinery 3.01 1.03
Quality of roads 3.86 1.44 Availability of specialized research & training 4.11 .96 Quality of railroad infrastructure 3.07 1.58 State of cluster development 3.47 .86 Quality of port infrastructure 3.97 1.38 Extent of collaboration in clusters 3.74 .85 Quality of air transport infrastructure quality 4.65 1.17 Extent of cluster policy 3.60 .75 Quality of electricity supply 4.66 1.53 Context for strategy and rivalry (NBE) Quality of transport network: business 4.69 1.05 Cooperation in labor-employer relations 4.53 .71
Communications infrastructure
Pay and productivity 4.05 .76 Quality of telephone/fax infrastructure 5.46 1.18 FDI role in technology transfer 4.79 .67 Internet access in schools 3.78 1.43 Impact of taxes on incentives to work/invest 3.46 .99
Mobile cell subscribers per 100 inhabitantsa 50.78 38.21 Low distortive effect of taxes/subsidies on competition 4.05 .76
Personal computers per 100 inhabitantsa 19.06 22.37 Intellectual property protection 3.84 1.26 Internet users (%)a 23.51 23.78 Restrictions of capital inflows/outflows 4.97 1.15 Fixed telephone lines per 100 inhabitantsa 24.96 20.46 Strength of auditing and accounting standards 4.77 .96
Administrative infrastructure
Absence of trade barriers 5.02 .94 (Low) Burden of custom procedures 3.99 1.01 Prevalence of foreign ownership 5.05 .74 (Low) Burden of government regulation 3.10 .74 Impact of rules on FDI 4.91 .72 Easiness of starting a new business 4.17 .94 Intensity of local competition 4.84 .74 (Low) # of procedures required to start a businessb
-9.44 3.62 Effectiveness of antitrust policy 4.02 1.01 (Low) Days required to start a business (in log)b -3.47 .87 Low market dominance by business groups 3.91 .98 Paying Taxes -(Low) Payments numbersb
-32.22 23.13 Efficacy of corporate boards 4.51 .70 Capital market infrastructure
Low market disruption from state enterprises 4.03 .77
Regulation of security exchanges 4.73 0.98 Investor protectionb 5.24 1.55 Financial market sophistication 4.13 1.30 Low rigidity of employmentb -29.7 16.5 Soundness of banks 5.38 .99 Regulatory qualitye .34 .89 Ease of access to loans 3.34 .97 Low tariff rate (applied rate, simple mean)c -8.33 6.59 Venture capital availability 3.27 .95
Financing through local equity market 4.58 1.21 Protection of minority shareholders’ interests 4.51 .85 Getting Credit Legal rights indexb 5.58 2.34
Domestic credit to private sectorc 61.26 51.67 Notes: Based on a panel of 134 countries over 2001-2008. Unless otherwise noted the source is the EOS. a Source: World
Telecommunication/ICT Indicators. b Source: World Bank Doing Business Indicators. c Source: WDI. d Source: USPTO. e
Source: World Bank Governance.

46
Table A1 Individual indicators by competitiveness category: Mean 2001-2008 (continued) MACROECONOMIC COMPETITIVENESS (SIPI and MP)
Mean
Std
Dev
Mean
Std
Dev
Social infrastructure and political institutions (SIPI)
Basic Health and Education
Rule of law Quality of primary education 3.82 1.33 Safety - Reliability of police services 4.27 1.24
Quality of healthcare services 3.88 1.46 Safety - Low business costs of
crime/violence 4.46 1.28 Accessibility of healthcare services 4.82 1.22 Safety - Low impact of organized crime 4.86 1.19 Health expenditure a 6.73 2.36 Judicial independence 4.04 1.41 Life Expectancy a 70.4 9.61 Efficiency of legal framework 3.95 1.24 Low prevalence of malaria b -.81 5.36 Property rights 4.69 1.13 Low incidence of tuberculosis a -3.9 1.43 Infrequency of diversion of public funds 3.80 1.34 Low infant mortality rate a -27.6 29.4 Infrequency of irregular payments by firms 4.61 1.15 Primary school enrollment a 90.7 10.4 Low business costs of corruption 4.41 1.17 Secondary school enrollment a 77.4 25.1 Ethical behavior of firms 4.35 .94 Gender-related development indexc .76 .16 Control of Corruptiond .23 1.04
Political institutions
Rule of Lawd .20 .98 Effectiveness of law-making bodies 3.48 1.05
Public trust of politicians 2.84 1.28 Monetary and fiscal policy (MFP)*
Government spending efficiency 3.41 .92 Gov Surplus/Deficit (% GDP)e -.36 .59 Lack of favoritism in decisions of gov officials 3.32 .98 Gov net debt (% GDP)e -.93 1.51 Gov effectiveness in reducing poverty/inequality 3.57 1.06 Inflationf -1.01 1.23 Transparency of government policy-making 3.99 .90
Decentralization of economic policy-making 3.02 .90 Freedom of the press 5.09 1.11 Voice and Accountabilityd .25 .89 Notes: Based on a panel of 134 countries over 2001-2008. Unless otherwise noted the source is the EOS. a Source: WDI.
bSource: WHO. cSource: UN. d Source: World Bank Governance indicators. e Source: EIU. f Source: IMF. * The MFP indicators are 3-year weighted averages. We define a “neutral” zone for each indicator, and compute their deviation on a log scale. Table A2: Summary of Factor Analysis and Grouping Adequacy
FA (first factor) Grouping Adequacy
Eigen value
Proportion of Variance Explained
Cronbach's alpha
Microeconomic competitiveness (MICRO) 4.666 0.933 0.981 Company Operations and Strategy 12.632 0.790 0.981 Factor (Input) Conditions 22.209 0.617 0.979 Demand conditions 4.684 0.781 0.938 Supporting and related industries and clusters 6.228 0.778 0.956 Context for strategy and rivalry 10.054 0.503 0.945
Social infrastructure and political institutions (SIPI) 20.595 0.644 0.979 Notes: To compute our variables we retain the first factor from the principal component factor analysis. Table A3: Robustness of country competitiveness score/rankings in 2010 Absolute gap between base and median competitiveness score/rank
Score gap Ranking gap Bootstrapped Analysis
(Estimation of equation 1) Average (std dev)
Max score shift
Average (std dev)
Max rank shifts
Random set of countries and randomly drop up to 1 year
.003
(.002) 0.012 .582
(.652)
2
Random set of controls (dropping up to all controls)
.015
(.011) 0.073 .843
(1.075)
4
Notes: Based on 1,500 bootstrapped weights.
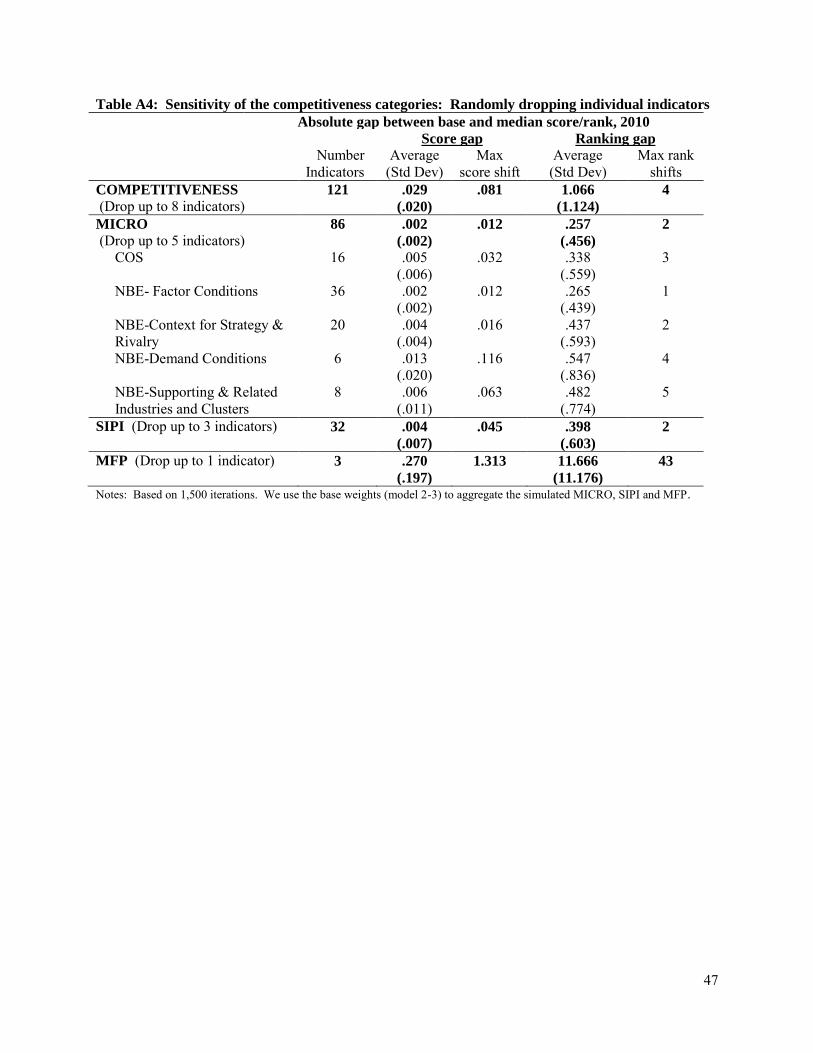
47
Table A4: Sensitivity of the competitiveness categories: Randomly dropping individual indicators
Absolute gap between base and median score/rank, 2010
Score gap Ranking gap
Number Indicators
Average (Std Dev)
Max score shift
Average (Std Dev)
Max rank shifts
COMPETITIVENESS (Drop up to 8 indicators)
121 .029
(.020)
.081 1.066
(1.124)
4
MICRO
(Drop up to 5 indicators) 86 .002
(.002)
.012 .257
(.456)
2
COS 16 .005 (.006)
.032 .338 (.559)
3
NBE- Factor Conditions 36 .002 (.002)
.012 .265 (.439)
1
NBE-Context for Strategy & Rivalry
20 .004 (.004)
.016 .437 (.593)
2
NBE-Demand Conditions 6 .013 (.020)
.116 .547 (.836)
4
NBE-Supporting & Related Industries and Clusters
8 .006 (.011)
.063 .482 (.774)
5
SIPI (Drop up to 3 indicators) 32 .004
(.007)
.045 .398
(.603)
2
MFP (Drop up to 1 indicator) 3 .270
(.197)
1.313 11.666
(11.176)
43
Notes: Based on 1,500 iterations. We use the base weights (model 2-3) to aggregate the simulated MICRO, SIPI and MFP.