Embed Size (px)
Citation preview

SM & T Standards Measurement & Testing Project No. SMT4-CT97-2165
UNCERT COP 04: 2000
Manual of Codes of Practice for the Determination of Uncertainties in
Mechanical Tests on Metallic Materials
Code of Practice No. 04
The Determination of Uncertainties in Critical Crack Tip Opening Displacement (CTOD) Testing
L.M. Plaza
INASMET Centro Tecnológico de Materiales
Camino de Portuetxe, 12 ES-20009 San Sebastián
SPAIN
Issue 1
September 2000

S M & T Standards Measurement & Testing Project No. SMT4-CT97-2165
UNCERT COP 04: 2000
CONTENTS 1 SCOPE 2 SYMBOLS AND DEFINITIONS 3 INTRODUCTION 4 A PROCEDURE FOR THE ESTIMATION OF UNCERTAINTY IN CTOD
PARAMETER DETERMINATION
Step 1- Identifying the parameters for which uncertainty is to be estimated Step 2- Identifying all sources of uncertainty in the test Step 3- Classifying the uncertainty according to Type A or B Step 4- Estimating the standard uncertainty for each source of uncertainty Step 5- Computing the combined uncertainty uc Step 6- Computing the expanded uncertainty U Step 7- Reporting of results
5 REFERENCES ACKNOWLEDGEMENTS
APPENDIX A Mathematical formulae for calculating uncertainties in CTOD parameter determination APPENDIX B A worked example for calculating uncertainties in CTOD parameter determination

S M & T Standards Measurement & Testing Project No. SMT4-CT97-2165
UNCERT COP 04: 2000
Page 1 of 24
1. SCOPE This procedure covers the evaluation of uncertainty in the determination of Critical Crack Tip Opening Displacement (CTOD) of metallic materials according to the testing Standards
British Standard, BS 7448. Part 1-1991: Amd 1: August 1999. “Fracture Mechanics Toughness Tests. Part 1. Method for determination of KIC, critical CTOD and critical J values of metallic materials”. ASTM E1290-93 “Crack-Tip Opening Displacement (CTOD) Fracture Toughness Measurement”
These standards give a method for determining critical crack tip opening displacement (CTOD) for metallic materials. The method uses fatigue precracked specimens. The tests are carried out in displacement control with monotonic loading, and at a constant rate of increase in stress intensity factor within the range 0.5 – 3 MPa m s-1 during the initial elastic deformation. The specimens are loaded to the maximum force associated with plastic collapse. The method is especially appropriate to materials that exhibit a change from ductile to brittle behaviour with decreasing temperature. No other influences of environment are covered. 2. SYMBOLS AND DEFINITIONS For a complete list of symbols and definitions of terms on uncertainties, see Reference 1, Section 2. The following are the symbols and definitions used in this procedure.
a nominal crack length B specimen thickness ci sensitivity coefficient CoP Code of Practice CT Compact Tension Test Specimen dv divisor associated with the assumed probability distribution, used to
calculate the standard uncertainty E Young’s modulus of elasticity F Applied applied Force f mathematical function of (a/W) g Poisson’s ratio k coverage factor used to calculate expanded uncertainty K Stress Intensity Factor: the magnitude of the stress field near the
crack tip for a particular mode in a homogeneous, ideally linear-elastic body.
n number of repeat measurements p confidence level q random variable _
q arithmetic mean of the values of the random variable q

S M & T Standards Measurement & Testing Project No. SMT4-CT97-2165
UNCERT COP 04: 2000
Page 2 of 24
s span between outer loading points in three point bend test S experimental standard deviation (of a random variable) determined
from a limited number of measurements, n Sy proof strength SE (B) three-point bend specimen u standard uncertainty uc combined standard uncertainty U expanded uncertainty V value of a measurand Vp plastic component of notch opening displacement W effective width of test specimen xi estimate of input quantity Y measurand y test (or measurement) mean result z distance of the notch opening gauge location above the surface of
the specimen δδ crack tip opening displacement
3. INTRODUCTION It is good practice in any measurement to evaluate and report the uncertainty associated with the test results. A statement of uncertainty may be required by a customer who wishes to know the limits within which the reported result may be assumed to lie, or the test laboratory itself may wish to develop a better understanding of which particular aspects of the test procedure have the greatest effect on results so that this may be monitored more closely. This Code of Practice (CoP) has been prepared within UNCERT, a project to simplify the way in which uncertainties are evaluated funded by the European Commission’s Standards, Measurement and Testing programme under reference SMT4-CT97-2165. The aim is to produce a series of documents in a common format that is easily understood and accessible to customers, test laboratories and accreditation authorities. This CoP is one of seventeen produced by the UNCERT consortium for the estimation of uncertainties associated with mechanical tests on metallic materials. Reference 1 is divided into six sections as follows with all individual CoPs included in Section 6.
1. Introduction to the evaluation of uncertainty 2. Glossary of definitions and symbols 3. Typical sources of uncertainty in materials testing 4. Guidelines for estimation of uncertainty for a test series 5. Guidelines for reporting uncertainty 6. Individual Codes of Practice (of which this is one) for the estimation of
uncertainties in mechanical tests on metallic materials This CoP can be used as a stand-alone document. For further background information on measurement uncertainty and values of standard uncertainties of the equipment and instrumentation used commonly in materials testing, the user may need to refer to Section 3 in Reference 1. The individual CoPs are kept as simple as possible by

S M & T Standards Measurement & Testing Project No. SMT4-CT97-2165
UNCERT COP 04: 2000
Page 3 of 24
following the same structure: • The main procedure • Quantifying the major contributions to the uncertainty for that test type
(AppendixA) • A worked example (Appendix B)
This CoP guides the user through the various steps to be carried out in order to estimate the uncertainty in the determination of the CTOD parameter. 4. A PROCEDURE FOR ESTIMATING THE UNCERTAINTY IN THE
DETERMINATION OF CRITICAL CRACK TIP OPENING DISPLACEMENT (CTOD), USING A THREE POINT BEND TEST SPECIMEN (SE (B))
Step 1. Identifying the Parameters for Which Uncertainty is to be Estimated The first step is to list the quantities (measurands) for which the uncertainties must be calculated. Table 1 shows the parameter that is usually reported in the test. This measurand is not measured directly, but is determined from other quantities (or measurements).
Table 1 Measurand and Measurements, their units and symbols
Measurand Units Symbol Crack tip opening displacement mm δδ Measurements Thickness of the specimen mm B Width of the specimen mm W Crack length mm a
Applied force N F (Fc, Fu, Fm) (See Fig A1)
Plastic component of notch opening displacement mm Vp Span between outer loading points in three point bend test mm s Distance of the notch opening gauge location above the surface notch specimen mm z
Step 2. Identifying all Sources of Uncertainty in the Test In the Step 2, the user must identify all possible sources of uncertainty that may have an effect (either directly or indirectly) on the test. The list cannot be identified comprehensively beforehand, as it is associated uniquely with the individual test procedure and apparatus used. This means that a new list should be prepared each time a particular test parameter changes (e.g. when a plotter is replaced by a computer). To help the user list all sources, five categories have been defined. The following table (Table 2) lists the five categories and gives some examples of sources of uncertainty in each category for the test method applied.

S M & T Standards Measurement & Testing Project No. SMT4-CT97-2165
UNCERT COP 04: 2000
Page 4 of 24
It is important to note that Table 2 is not exhaustive and is for guidance only. Relative contributions may vary according to the material tested and the test conditions. Individual laboratories are encouraged to prepare their own list to correspond to their own test facility and assess the associated significance of the contributions.
Table 2 Sources of Uncertainty, their Type and their likely contribution to
Uncertainties on Measurands and Measurements (1 = major contribution, 2 = minor contribution, blank = no influence, * = indirectly affected)
Sources of uncertainty Measurand and Measurements
Type 1 d B W a F VP s z 1. Apparatus Load cell B *2 1 Extensometer B *2 1 Plotter X B *2 1 Plotter Y B *2 1 Caliper B *2 1 1 1 Knife edges thickness 2 B *2 1 1 2. Method Span B *2 2 2 1 Alignment B *2 2 2 Perpendicularity B *2 2 2 Speed B *2 2 2 3. Environment Laboratory ambient temperature and humidity
B *2 2 2
4. Operator Graph interpretation A *1 1 Distance between knife edges 2 A *2 2 Error in measuring specimen dimensions A 2 Crack length measurement A *1 1 5. Test Piece Specimen thickness B *2 1 2 2 2 Specimen width B *1 1 2 2 2
1 See Step 3 2
The specimen must be provided with a pair of accurately machined knife-edges that support the gauge arms and serve as the displacement reference points
Step 3. Classifying the Uncertainty According to Type A or B In this third step, which is in accordance with Reference 2, ‘Guide to the Expression of Uncertainties in Measurement’, the sources of uncertainty are classified as Type A or B, depending on the way their influence is quantified. If the uncertainty is evaluated by statistical means (from a number of repeated observations), it is classified Type A, if it is evaluated by any other means it should be classified Type B (see Table 2). The values associated with Type B uncertainties can be obtained from a number of sources including a calibration certificate, manufacturer’s information, or an expert’s estimation. For Type B uncertainties, it is necessary for the users to estimate for the

S M & T Standards Measurement & Testing Project No. SMT4-CT97-2165
UNCERT COP 04: 2000
Page 5 of 24
most appropriate probability distribution for each source (further details are given in Section 2 of Reference 1). It should be noted that, in some cases, an uncertainty could be classified as either Type A or Type B depending on how it is estimated. Step 4. Estimating the Standard Uncertainty for each Source of Uncertainty In this step the standard uncertainty, u(xi), for each measurement is estimated (see Appendix A). The standard uncertainty is defined as one standard deviation and is derived from the uncertainty of the input quantity divided by the parameter dv, which is associated with the assumed probability distribution. The divisors for the distributions most likely to be encountered are given in Section 2 of Reference 1. The significant sources of uncertainty and their influence on the evaluated quantity are summarised on Table 3. This table is structured in the following manner: • column ¬: sources of uncertainty • column : source’s value. There are two types:
§ (1) permissible range for the measurement according to the test standard § (2) maximum range between measures on the same test made by several
trained operators • column ®: measurements affected by each source • column ¯: measurement values obtained in a real test • column °: source of uncertainty type • column ±: assumed probability distribution • column ²: correction factor for Type B sources (dv) • column ³: effect on the measurement uncertainty produced by the input quantity
uncertainty This column is obtained by two different ways: § if the influence of the source of uncertainty on the measurement is
proportionally direct. (column ).(column ¯) /(column ²)
§ if the influence is not direct it should be obtained by calculating the measurement for both the maximum and minimum values of the range in column without variation in the rest of the sources of uncertainty and applying the appropriate correction factor for the probability (column ²).

S M & T Standards Measurement & Testing Project No. SMT4-CT97-2165
UNCERT COP 04: 2000
Page 6 of 24
Table 3 Example Worksheet for Uncertainty Calculations in CTOD Tests
Column No. ¬ ® ̄ ° ± ² ³
Sources of Uncertainty Measurements Uncertainties
Source Value (1) or (2)
Measurement Affected
Nominal or Averaged
Value (Units) Type Probabl.
Distribt. Divisor
(dv)
Effect on Uncertainty in Measurement
Apparatus
Load cell F (kN) B Rectang. 3 u(load cell)
Extensometer VP (mm) B Rectang. 3 u(extensom)
Plotter Y VP (mm) B Rectang. 3 u(plotterY)
Plotter X The influence on Uncertainty is Negligible
Knife edges thickness z VP
(mm) B Rectang. 3 u(knife edges)
Caliper
W B a
(mm) (mm) (mm)
B Rectang. 3 u(caliper)
Method
Span s F VP
(mm) (N)
(mm) B Rectang. 3 u(span)
Alignment F VP
(N) (mm) B Rectang. 3 u(alignm)
Perpendicularity F VP
(N) (mm)
B Rectang. 3 u(perpen)
Distance between knife edges
VP (mm) B Rectang. 3 u(distance)
Speed F VP
(N) (mm)
B Rectang. 3 u(speed)
Environment
Room temperature F VP
(N) (mm)
B Rectang. 3 u(room temp)
Operator Graph interpretation VP (mm) A normal 1 u(graph) B Measurement B (mm) A normal 1 u(B msrment.) W Measurement W (mm) A normal 1 u(W msrment.) Crack length measurement
a (mm) A normal 1 u(a msrment.)
Test Piece Specimen thickness B (mm) B Rectang. 3 u(thickness)
Specimen width W (mm) B Rectang. 3 u(width)
(1) permissible range for the source according to the test standard (2) maximum range between measures made on the same test by several trained operators
Step 5. Computing the Combined Uncertainty uc Assuming that individual uncertainty sources are uncorrelated, the combined uncertainty of the measurand, uc(y), can be computed using the root sum squares:

S M & T Standards Measurement & Testing Project No. SMT4-CT97-2165
UNCERT COP 04: 2000
Page 7 of 24
[ ]∑=
⋅=N
iiic xucyu
1
2)()( (1)
where ci is the sensitivity coefficient associated with the measurement xi. This uncertainty corresponds to plus or minus one standard deviation on the normal distribution law representing the studied quantity. The combined uncertainty has an associated confidence level of 68.27%. Step 6. Computing the Expanded Uncertainty U The expanded uncertainty, U, is defined in Reference 2 as “the interval about the result of a measurement that may be expected to encompass a large fraction of the distribution of values that could reasonably be attributed to the measurand”. It is obtained by multiplying the combined uncertainty, uc, by a coverage factor, k, which is selected on the basis of the level of confidence required. For a normal probability distribution, the most generally used coverage factor is 2, which corresponds to a confidence level interval of 95.4% (effectively 95% for most practical purposes). The expanded uncertainty, U, is, therefore, broader than the combined uncertainty, uc. Where the customer (such as aerospace and electronics industries) demands a higher confidence level, a coverage factor of 3 is often used so that the corresponding confidence level increases to 99.73%. In cases where the probability distribution of uc is not normal (or where the number of data points used in Type A analysis is small), the value of k should be calculated from the degrees of freedom given by the Welsh-Satterthwaite method (see Reference 1, Section 4 for more details). Step 7. Reporting of Results Once the expanded uncertainty has been estimated, the results should be reported in the following format: V = y ± U where: V is the estimated value of the measurand y is the test (or measurand) mean result U is the expanded uncertainty associated with y An explanatory note, such as that given in the following example should be added (change where appropriate): The reported expanded uncertainty is based on a standard uncertainty multiplied by a coverage factor, k=2, which for a normal distribution corresponds to a coverage probability, p, of approximately 95%. The uncertainty evaluation was carried out in accordance with UNCERT COP 04:2000.

S M & T Standards Measurement & Testing Project No. SMT4-CT97-2165
UNCERT COP 04: 2000
Page 8 of 24
5. REFERENCES 1. Manual of Codes of Practice for the determination of uncertainties in
mechanical tests on metallic materials. Project UNCERT, EU Contract SMT4-CT97-2165, Standards Measurement & Testing Programme, ISBN 0 946754 41 1, Issue 1, September 2000.
2. BIPM, IEC, IFCC, ISO, IUPAC, OIML, Guide to the expression of
Uncertainty in Measurement. International Organisation for Standardisation, Geneva, Switzerland, ISBN 92-67-10188-9, First Edition, 1993. [This Guide is often referred to as the GUM or the ISO TAG4 document after the ISO Technical Advisory Group that drafted it.]
3. British Standard, BS 7448. Part 1-97. “Fracture Mechanics Toughness Tests.
Part 1. Method for determination of KIC, critical CTOD and critical J values of Metallic Materials”.
4. ASTM E1290-93 “Crack-Tip Opening Displacement (CTOD) Fracture
Toughness Measurement” 5. ASTM E399-90 “Plane-Strain Fracture Toughness of Metallic Materials” ACKNOWLEDGEMENTS This document was written as part of project “Code of Practice for the Determination of Uncertainties in Mechanical Tests on Metallic Materials”. The project was partly funded by the Commission of European Communities through the Standards, Measurement and Testing Programme Contract No. SMT4-CT97-2165. The author gratefully acknowledges the efforts of Mrs. Yeyes San Martín of INASMET in the development of this Code of Practice. Many thanks are also due to many colleagues from UNCERT for invaluable helpful comments.

S M & T Standards Measurement & Testing Project No. SMT4-CT97-2165
UNCERT COP 04: 2000
Page 9 of 24
APPENDIX A
Mathematical Formulae for Calculating Uncertainties in Crack Tip Opening Displacement (CTOD) Parameter Determination Testing, using SE (B) specimens
The formula for the calculation of the Crack Tip Opening Displacement (CTOD) Fracture Toughness for a SE (B) specimen is:
zaW
VaWESgK P
Y ++−
+−
=6.04.0)(4.0
2)1( 22
δ (A1)
where K is a stress intensity factor, calculated from equation
fBW
FsK
5.1= (A2)
where f is a mathematical function of Wa
, given in next equation
23
221
)1)(21(2
)(7.2)(93.315.2)1()(99.1)(3)(
Wa
Wa
Wa
Wa
Wa
Wa
Wa
Wa
f−+
+−
−−
= (A3)
where: g is the Poisson’s ratio Sy is the 0.2% proof strength at the temperature of the fracture test E is the Young’s modulus at the test temperature VP is the plastic component of notch opening displacement. It is obtained by drawing
a line parallel to the tangent of the initial linear part of the record from point F (Fc, Fu or Fm); the VP value is the distance between the origin and the intersection of this parallel with X-axis (see Figure A1).
Displacement, VO
Fc
Vc
VpVpVp Vp Vp
F c
Vc
Fc
Vc
Fu
Vu
Fu
Vu
Fm
Vm
Load, F
Figure A1. Definition of F (Fc, Fu or Fm) and VP The derived measurand δδ (y) is a function of eight measurements F, f, VP, z, s, a, B and

S M & T Standards Measurement & Testing Project No. SMT4-CT97-2165
UNCERT COP 04: 2000
Page 10 of 24
W (xi), and each xi is subject to uncertainty u(xi). The general combined standard uncertainty uc(y) is expressed by equation (1) in main procedure:
[ ]∑=
=N
iiic xucyu
1
2)()( (A4)
where i
i xy
c∂∂= (A5)
Using these formulae, it is possible to write the combined standard uncertainty of δδ parameter:
22222222
222222222
)()()()(
)()()()()]([
zucsucVucBuc
aucWucfucFucu
zsPVB
aWfFc
P++++
++++=δ (A6)
The sensitivity coefficients (ci )for equation A6 are given by:
FK
AKF
cF ∂∂=
∂∂= δ
(A7)
where 2
3BW
sfFK
=∂∂
(A8)
and ESg
Ay
21−= (A9)
fK
AKf
c f ∂∂=
∂∂= δ
(A10)
where 2
3WB
sFfK
×
×=
∂∂
(A11)
2)6.04.0(
)(4.0
zaW
zaVWK
AKW
c PW
++
++
∂∂=
∂∂= δ
(A12)
where 2
5
5.1
BW
FsfWK
−=∂∂
(A13)
2)6.04.0(
)(4.0
zaW
zWVa
c Pa ++
+−=
∂∂= δδ
(A14)

S M & T Standards Measurement & Testing Project No. SMT4-CT97-2165
UNCERT COP 04: 2000
Page 11 of 24
BK
AKB
cB ∂∂=
∂∂= δ
(A15)
where 2
32WB
FsfBK −=
∂∂
(A16)
zaW
aWV
cP
VP ++−=
∂∂=
6.04.0)(4.0δ
(A17)
sK
AKs
cs ∂∂=
∂∂= δ
(A18)
where 2
3BW
FfsK
=∂∂
(A19)
2)6.04.0(
)(4.0
zaW
VaWz
c Pz ++
−−=
∂∂= δ
(A20)
A6 equation is composed by eight terms that will be analysed in next paragraphs. A.1 UNCERTAINTY IN LOAD ( )(Fu ) F is a measurement affected by different sources of uncertainty (see Table 2 and Table 3 in the main procedure), but its influence can be considered negligible except for the load cell. So:
)()( cellloaduFu = (A21)
u(load cell) can be estimated using Table 3 in this procedure. A.2 UNCERTAINTY IN f ( )( fu ) f is a mathematical function of a/W (equation A3). Assuming that this source of uncertainty (f) is considered as Type A, the contribution to total uncertainty can be calculated from the standard deviation of the arithmetic mean:
n
fsfsfu j )()()( ==
− (A22)
Where:
∑=
−−
=n
jjj ff
nfs
1
2_
)(1
1)( (A23)
Using the maximum and the minimum values to calculate s(fj), (n=2):

S M & T Standards Measurement & Testing Project No. SMT4-CT97-2165
UNCERT COP 04: 2000
Page 12 of 24
2)ff()ff(
2
)ff()ff(12
1
)f(u2
_
min2
_
max
2_
min2
_
max −+−=
−+−
−= (A24)
Where:
)()(max
minmin
min
maxmax W
affand
W
aff == (A25)
)W(u2WW
)W(u2WW
)a(u2aa
)a(u2aaand
0min
0max
0min
0max
−=+=
−=+=
(A26)
(assuming that both a and W have a normal probability distribution, k=2) A.3 UNCERTAINTY IN SPECIMEN WIDTH ( )(Wu ) W is a measurement affected by three sources of uncertainty (see Table 2 and Table 3). Assuming that individual uncertainty sources are uncorrelated, the combined uncertainty in W can be computed using the root sum squares:
2222 )()()()()( widthutmeasuremenWucaliperusuWu i ++== (A27) A.4 UNCERTAINTY IN CRACK LENGTH ( )(au ) a is a measurement affected by two sources of uncertainty (see Table 2 and Table 3). Assuming that individual uncertainty sources are uncorrelated, the combined uncertainty in a can be computed using the root sum squares:
222 )()()()( tmeasuremenlengthcrackucaliperusuau i +== (A28) The term u(si) can be calculated using Table 3 in this procedure. A.5 UNCERTAINTY IN B ( )(Bu ) B is a measurement affected by three sources of uncertainty (see Table 2 and Table 3 in the procedure). Assuming that the individual uncertainty sources are uncorrelated, the combined uncertainty in B can be computed using the root sum squares:
2222 )()()()()( thicknessutmeasuremenBucaliperusuBu i ++== (A29) The terms u(si) can be calculated using Table 3 in this procedure.

S M & T Standards Measurement & Testing Project No. SMT4-CT97-2165
UNCERT COP 04: 2000
Page 13 of 24
A.6 UNCERTAINTY IN THE PLASTIC COMPONENT OF NOTCH OPENING
DISPLACEMENT ( )( PVu ) VP is a measurement affected by five sources of uncertainty (see Table 2 and Table 3 in the procedure). Assuming that the individual uncertainty sources are uncorrelated, the combined uncertainty in VP can be computed using the root sum squares:
22
2222
)()(
)()()()()(
edgesknifebetweendistanceuthicknessedgesknifeu
tioninterpretagraphuYplotteruerextensometusuVu iP
++
+++==
(A30) (u(si) is the standard uncertainty of each source that contributes to F combined uncertainty). The terms u(si) can be calculated using Table 3 in this procedure. A.7 UNCERTAINTY IN THE SPAN ( )(su ) It is directly obtained from data in Table 3. A.8 UNCERTAINTY IN THE KNIFE EDGES THICKNESS ( )(zu ) It is directly obtained from data in Table 3 The combined uncertainty of each measurement is shown in Table A1. Table A1 Formulae for calculating Combined Uncertainties Measurement Sources of uncertainty (si) u (si)
(Units) Uncertainty of Measurements u(xi)
Applied force F
Load cell (kN) )()( cellloaduFu =
Extensometer (mm) Plotter Y (mm) Graph Interpretation (mm) Knife Edges Thickness (mm)
Plastic component of notch opening displacement VP Distance between Knife
Edges (mm) 2
2
2
22
)(
)(
)(
)()(
)(
edgesknifebetweendistanceu
thicknessedgesknifeu
tioninterpretagraphu
Yplotteruerextensometu
Vu P
+
++
++
++
=
Knife edges thickness z
Knife Edges Thickness (mm) )()( thicknessedgesknifeuzu =
Caliper (mm) W measurement (mm)
Specimen width W Specimen Width (mm)
2
22
)(
)()()(
widthu
tmeasuremenWucaliperuWu
+
++=
Caliper (mm) B measurement (mm)
Specimen thickness B Specimen Thickness (mm)
2
22
)(
)()()(
thicknessu
tmeasuremenBucaliperuBu
+
++=
Caliper (mm) Crack length a Crack Length Measurement (mm)
22 )()()( tmeasuremenlengthcrackucaliperuau +=
Span s
Span (mm) u(s) = u(span)

S M & T Standards Measurement & Testing Project No. SMT4-CT97-2165
UNCERT COP 04: 2000
Page 14 of 24
APPENDIX B
A Worked Example for Calculating Uncertainties in Crack Tip Opening
Displacement (CTOD) Parameter Determination Testing
B1. Introduction A customer asked a testing laboratory to carry out a fracture test to determinate the Crack Tip Opening Displacement (CTOD) at room temperature, according to British Standard, BS 7448. Part 1-1991, on three point bend specimens. The mechanical properties of the material were: • proof strength at 0.2% at the test temperature: 602 MPa • Young’s modulus: 210,000 MPa • Poisson’s ratio: 0.3. The laboratory has considered the sources of uncertainty in its test facility and has found that the sources of uncertainty in the test results are identical to those described in Table 2 of the Main Procedure. B2. Estimation of Input Quantities to the Uncertainty Analysis 1 All tests were carried out according to the laboratory’s own procedure using an
appropriately calibrated tensile test facility. The test facility was located in a temperature-controlled environment, at room temperature.
2 The specimen was a three point bend type, and its dimensions were:
thickness B = 18 mm ± 0.5% width W = 36 mm ± 0.5%
The dimensions of the specimen were measured using a caliper with an uncertainty of 0.05 mm, typical for calipers used in the laboratory.
3 The crack length (a) was measured with the same caliper and the value obtained
was 17.57 mm. 4 The test was carried out on a universal test machine using a strain rate of
0.4 kNs-1. (A constant loading rate of 0.3 – 1.5 kNs-1 for a standard bend specimen corresponds to a rate of increase in stress intensity factor within the
range 0.55 – 2.75 MPa m s-1, according to ASTM E 399 Standard, Clause A3.4.2.1).
5 The machine was calibrated to Grade 1 of BS 1610. 6 Strain was measured using a clip gauge extensometer with a nominal gauge
length of 10 mm. The extensometer complied with Class 0.5, specification according to EN 10002-4:1994.

S M & T Standards Measurement & Testing Project No. SMT4-CT97-2165
UNCERT COP 04: 2000
Page 15 of 24
7 The thickness of the knife-edges attached to the specimen were 1.5 mm (BS
7448 Clause 5.1.3 permits a thickness of 1.5 - 2 mm) and were attached at a distance of 10 mm. This distance was determined by the extensometer, because it is impossible to calibrate the extensometer if the distance between edges is not within the nominal value ± 1%
8 The line of action of the applied force passed midway between the centres of the
rollers within ± 1% of the distance between these centres. The crack tip midway squared to the roller axes within ±2º.
9 The span for the test method was 144 mm ± 0.5%, according to the test standard. 10 The accuracy of the plotter used to record the load-displacement curve was
within ±0.5% in both axes.
The curve obtained in this test is represented in Figure B1. The maximum load value recorded by the machine FC was 33,800 N. The value indicated in Figure B1 as VP was obtained graphically by the operator (VP = 0.42 mm), according to the procedure described in Appendix A of this CoP.
Load, kN
Displacement, mm
0
5
10
15
20
25
0 0.2 0.4 0.6 0.8 1.0 1.2
30Tg (F)
35
F
II Tg (F)
Fc
Figure B1. Test Record
11 An indication of the uncertainty associated with interpreting the graph was obtained using another test record (Figure B2). Four trained operators analysed the record and obtained the values indicated in Table B1.

S M & T Standards Measurement & Testing Project No. SMT4-CT97-2165
UNCERT COP 04: 2000
Page 16 of 24
Load, kN
Displacement, mm
0
5
10
15
20
25
0 0.1 0.2 0.3 0.4 0.5 0.6
30Tg (F)
35
F
II Tg (F)
Figure B2. Test Record used to establish the Uncertainty in Interpreting the Graph B1
Table B1 Uncertainty in Interpreting the Graph B2
VP (mm) Operator 1 0.273 Operator 2 0.274 Operator 3 0.265 Operator 4 0.265
Mean 0.269
The uncertainty for this input value is its standard deviation:
%829.1mm005.0
])269.0265.0(2)269.0274.0()269.0273.0[(31
)VV(1n
1u
222
4
1j
2_
j
≡=
=−⋅+−+−=
=−−
= ∑=
12 The uncertainties associated with the error in measurements (B, W and a) were
obtained in the same manner as above (using a compact tension test specimen with the same nominal dimensions than the used in this example B = 18 mm and W = 36 mm)

S M & T Standards Measurement & Testing Project No. SMT4-CT97-2165
UNCERT COP 04: 2000
Page 17 of 24
Table B2 Uncertainty in Dimensions Measurement
B (mm) W (mm) a (mm) Operator 1 18.02 35.95 19.14 Operator 2 17.98 36.04 19.30 Operator 3 18.01 35.97 19.27 Operator 4 17.98 36.05 19.30
Mean 17.998 36.003 19.253 Standard Deviation 0.021 0.050 0.076
Uncertainty* (Percentage)(*)
0.115% 0.139% 0.396%
(*) mean
iqs 100)((%)yuncertaint
⋅=
The highest uncertainty associated with all these measurements was in the crack length, so an uncertainty of 0.4% has been selected for both B, W and a.
13 The influence of the knife-edges thickness was studied using a Computer
Assistant Design Program:
9.90000010.000000
10.420000
0.617898°
0.617898°
10.320006
10.100000
10.519994
10.32006-9.9=0.420006 10.519994-10.1=0.419994
Fig. B3.1 Fig. B3.2 Fig. B3.3
Figure B3. Uncertainty in Distance between Knife Edges
First of all, with a distance of 10 mm between knife edges, the angle for a VP of 0.42 mm is calculated (Figure B3.1). Then putting the knife edges at both the maximum and the minimum distances allowed, and with the angle calculated in first step, maximum and minimum VP values are obtained (Figures B3.2 and B3.3).

S M & T Standards Measurement & Testing Project No. SMT4-CT97-2165
UNCERT COP 04: 2000
Page 18 of 24
Then, the influence of the knife edges distance on VP is:
%0014.01062
419994.0420006.02
)( 6 ≡⋅±=−±=−
±= − mmVV
distanceu minmax
14 The influence of the knife edges thickness was obtained using a CAD program
too: First of all, with knife edges of 1.5 mm thickness, the angle for a VP of 0.42 mm is calculated (Figure B4.1). Then with knife edges of 2 mm thickness (maximum allowed), and with the angle calculated in first step, VP value is obtained (Figure B4.2). Then, the influence of the knife edges thickness on VP is:
%284.1005.02
42.0430784.02
)( ≡±=−±=−
±= mmVV
thicknessu minmax
Fig. B4.1 Fig. B4.2
Figure B4. Uncertainty in Knife Edges Thickness
10.00000
10.42000 10.43078
0.617898°
10.000001.5 2.0
1.5 2.0

S M & T Standards Measurement & Testing Project No. SMT4-CT97-2165
UNCERT COP 04: 2000
Page 19 of 24
B3 Example of Uncertainty Calculations and Reporting of Results B3.1 Calculations Firstly, Table 3 in main procedure should be completed. Column ¬ ® ¯ ° ± ² ³
Sources of Uncertainty Measurements Uncertainties
Source Value (1) or (2)
Measurement Affected
Nominal or Averaged
Value (Units) Type Probabl.
Distribt. Divisor
(dv)
Effect on Uncertainty in Measurement
Apparatus
Load cell )1(%1± F 33,800 N B Rectang. 3 195 N(A)
Extensometer )1(%5.0± VP 0.42 mm B Rectang. 3 0.001 mm(A)
Plotter Y )1(%5.0± VP 0.42 mm B Rectang. 3 0.001 mm(A)
Plotter X The influence on Uncertainty is Negligible
Knife edges thickness
1.5-2 mm(1)
)(%284.1 B± z
VP
1.5 mm 0.42 mm
B Rectang. 3 0.144 mm(E) 0.005 mm(B)
Caliper )1(05.0 mm±
W B a
36 mm 18 mm
17.57 mm B Rectang. 3 0.029 mm(C)
Method
Span )1(%5.0± s F VP
144 mm 33,800 N 0.42 mm
B Rectang. 3 0.416 mm(A)
Nglg. (D) Nglg. (D)
Alignment s×± %1 F VP
33,800 N 0.42 mm
B Rectang. 3 Nglg. (D)
Perpendicularity )1(2° F VP
33,800 N 0.42 mm
B Rectang. 3 Nglg. (D)
Distance between knife edges
)1(%1± )(%0014.0 B±
- VP
0.42 mm B Rectang. 3 -
(B)4 mm106 −×
Speed 0.3–1.5 kNs-1
(1) F VP
33,800 N 0.42 mm
B Rectang. 3 Nglg.(D)
Environment Room temperature
)1(2 C°± F VP
33,800 N 0.42 mm
B Rectang. 3 Nglg.
Operator Graph Interpretation
(2)%829.1± VP 0.42 mm A normal 1 0.008 mm(A)
B Measurement )2(%4.0± B 18 mm A normal 1 0.072 mm(A)
W Measurement )2(%4.0± W 36 mm A normal 1 0.144 mm(A)
A Measurement )2(%4.0± a 17.57 mm A normal 1 0.070 mm(A)
Test Piece Specimen thickness
)1(%5.0± B 18 mm B Rectang. 3 0.052 mm(A)
Specimen width )1(%5.0± W 36 mm B Rectang. 3 0.104 mm(A)
(1) permissible range for the source according to the test standard (see next paragraphs) (2) maximum range between measures made on the same test by several trained operators
Nglg. = negligible if compliant to standard (see next paragraphs) (A toE) see next paragraphs (Column ³) Where:

S M & T Standards Measurement & Testing Project No. SMT4-CT97-2165
UNCERT COP 04: 2000
Page 20 of 24
Column : • Load Cell: according to the BS 7448, the force sensing
device shall comply with grade 1 of BS 1610 (accuracy within %1± )
• Extensometer: our extensometers comply with grade 0.5 (accuracy within %5.0± )
• Plotter: our plotter complies with grade 0.5 (accuracy within %5.0± )
• Knife edges: according to the test standard the knife edges thickness must be between 1.5 and 2 mm. Their influence has been calculated geometrically using a CAD program (see B2. Estimation of input quantities to the uncertainty analysis)
• Caliper: generally uncertainty of 0.05 mm is typical for calipers used to measure both test piece dimensions and crack length
• Span: according to the test standard, span must be adjusted to %5.0±
• Alignment: according to the test standard, the line of action of the applied force must pass midway between the centres of the rollers within
%1± of the distance between these centres. • Perpendicularlity: according to the test standard, the crack tip
midpoint must be perpendicular to the roller within °2
• Distance between edges: this distance is determined by the
extensometer, because it is impossible to calibrate the extensometer if the distance between edges is not within the nominal value
%1± Their influence has been calculated geometrically using a CAD program (see B2. Estimation of input quantities to the uncertainty analysis)
• Room temperature: this influence is considered negligible for
metallic materials, because only small variations C2°± are allowed by the test standard
• Graph Interpretation: this is an important contribution to total
uncertainty because of the manual method used to obtain VP value from the test record
• Specimen Thickness: according to the test standard, the tolerance for
S M & T Standards Measurement & Testing Project No. SMT4-CT97-2165
UNCERT COP 04: 2000
Page 21 of 24
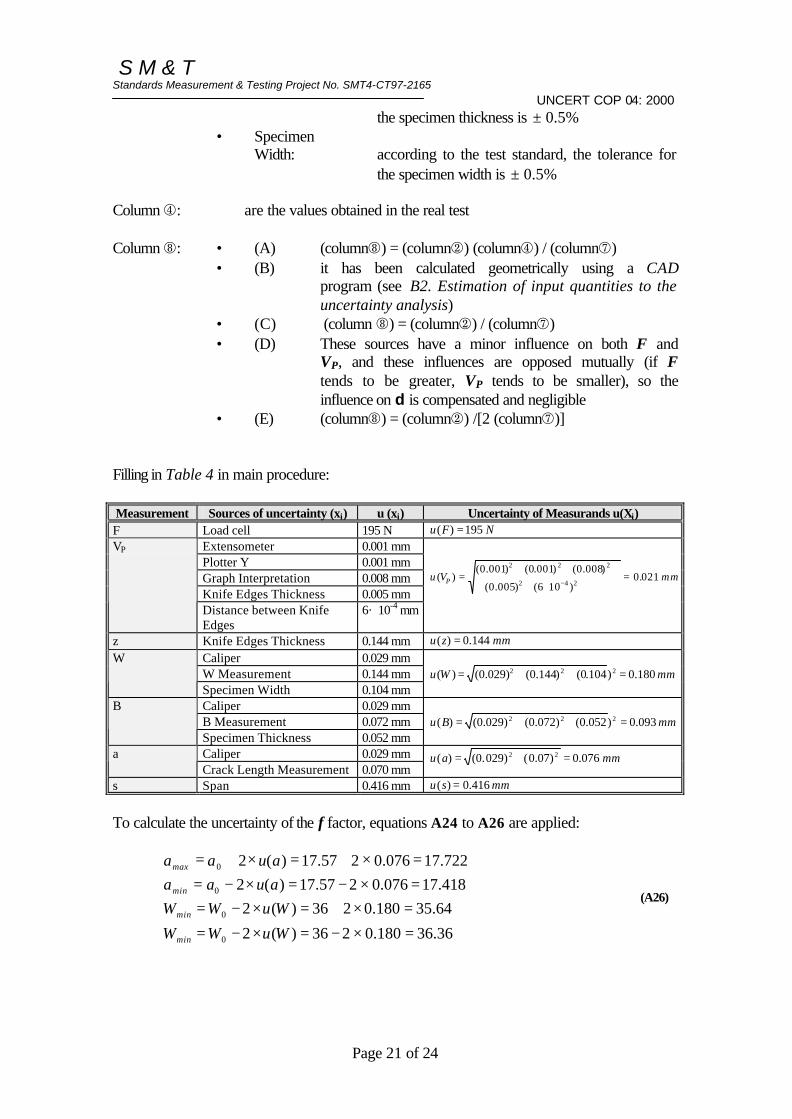
the specimen thickness is %5.0± • Specimen
Width: according to the test standard, the tolerance for the specimen width is %5.0±
Column ¯: are the values obtained in the real test Column ³: • (A) (column³) = (column) (column¯) / (column²) • (B) it has been calculated geometrically using a CAD
program (see B2. Estimation of input quantities to the uncertainty analysis)
• (C) (column ³) = (column) / (column²) • (D) These sources have a minor influence on both F and
VP, and these influences are opposed mutually (if F tends to be greater, VP tends to be smaller), so the influence on d is compensated and negligible
• (E) (column³) = (column) /[2 (column²)] Filling in Table 4 in main procedure: Measurement Sources of uncertainty (xi) u (xi) Uncertainty of Measurands u(Xi) F Load cell 195 N NFu 195)( =
Extensometer 0.001 mm Plotter Y 0.001 mm Graph Interpretation 0.008 mm Knife Edges Thickness 0.005 mm
VP
Distance between Knife Edges
6· 10-4 mm
mmVu P 021.0)106()005.0(
)008.0()001.0()001.0()(
242
222
=⋅++
+++=
−
z Knife Edges Thickness 0.144 mm mmzu 144.0)( =
Caliper 0.029 mm W Measurement 0.144 mm
W
Specimen Width 0.104 mm mmWu 180.0)104.0()144.0()029.0()( 222 =++=
Caliper 0.029 mm B Measurement 0.072 mm
B
Specimen Thickness 0.052 mm mmBu 093.0)052.0()072.0()029.0()( 222 =++=
Caliper 0.029 mm a Crack Length Measurement 0.070 mm
mmau 076.0)07.0()029.0()( 22 =+=
s Span 0.416 mm mmsu 416.0)( =
To calculate the uncertainty of the f factor, equations A24 to A26 are applied:
36.36180.0236)(2
64.35180.0236)(2
418.17076.0257.17)(2
722.17076.0257.17)(2
0
0
0
0
=×−=×−==×+=×−==×−=×−==×+=×+=
WuWW
WuWW
auaa
auaa
min
min
min
max
(A26)

S M & T Standards Measurement & Testing Project No. SMT4-CT97-2165
UNCERT COP 04: 2000
Page 22 of 24
494.2)36.36
418.17()(
639.2)64.35
722.17()(
564.2)36
57.17()(
===
===
===−
fWa
ff
fW
aff
fWa
ff
max
minmin
min
maxmax (A25)
073.02
)564.2494.2()564.2639.2(2
)()()(
222_
2_
=−+−=−+−
=ffff
fu minmax
(A24)
Now partial derivatives (equations A7 to A20) are obtained:
FK
AKF
cF ∂∂=
∂∂= δ
(A7)
2922
10198.7000,210602
3.011 −−×=×−=−= MPa
ESg
Ay
(A9)
23
23
23 25.210,3564.2
3618
144800,33 −=×
×
×== mmNfBW
FsK (A2)
23
23
23 095.0
3618
564.2144 −=
×
×==∂∂
mmBW
sfFK
(A8)
mmN
FK
AKF
cF
16
9
1019.2
095.025.210,310198.7
−−
−
×=
=×××=∂∂=
∂∂= δ
(A7)
fK
AKf
c f ∂∂=
∂∂= δ
(A10)
23
23
23 8.251,1
3618
144800,33 −=
×
×==∂∂
mmNBW
FsfK
(A11)
mmfK
AKf
c f29 1089.28.251,125.210,310198.7 −− ×=×××=
∂∂=
∂∂= δ
(A10)
2)6.04.0(
)(4.0
zaW
zaVWK
AKW
c PW
++
++
∂∂=
∂∂= δ
(A12)

S M & T Standards Measurement & Testing Project No. SMT4-CT97-2165
UNCERT COP 04: 2000
Page 23 of 24
25
25
25 76.133
3618
564.2144800,335.15.1 −−=
×
×××−=−=∂∂
mmNBW
FsfWK
(A13)
32
9
2
1049.1)5.157.176.0364.0(
)5.157.17(42.04.0
)76.133(25.210,310198.7
)6.04.0(
)(4.0
−
−
×=+×+×
+×+
+−×××=
=++
++
∂∂=
∂∂=
zaW
zaVWK
AKW
c PW
δ
(A12)
009.0)5.157.176.0364.0(
)5.136(42.04.0)6.04.0(
)(4.022 −=
+×+×+×−=
+++−
=∂∂=
zaW
zWVa
c Pa
δδ (A14)
BK
AKB
cB ∂∂=
∂∂= δ
(A15)
25
2322
32347.178
3618
564.2144800,33 −−=
×
××−=−=∂∂
mmNWB
FsfBK
(A16)
39 1012.4)347.178(25.210,310198.7 −− ×−=−×××=∂∂=
∂∂=
BK
AKB
cBδ
(A15)
279.05.157.176.0364.0
)57.1736(4.06.04.0
)(4.0 =+×+×
−=++
−=∂∂=
zaWaW
Vc
PVP
δ (A17)
sK
AKs
cs ∂∂=
∂∂= δ
(A18)
25
23
23 293,22
3618
564.2800,33 −=
×
×==∂∂
mmNBW
FfsK
(A19)
49 1015.5293.2225.210,310198.7 −− ×=×××=∂∂=
∂∂=
sK
AKs
csδ
(A18)
004.0)5.157.176.0364.0(
42.0)57.1736(4.0)6.04.0(
)(4.022 −=
+×+××−×−=
++−
−=∂∂=
zaW
VaWz
c Pz
δ (A20)
The combined standard uncertainty for d will be (equation A6):

S M & T Standards Measurement & Testing Project No. SMT4-CT97-2165
UNCERT COP 04: 2000
Page 24 of 24
25
22224
22223
22223
222226
22z
22s
2P
2V
22B
22a
22W
22f
22F
2c
mm1024.4
144.0)004.0(416.0)1015.5(
021.0279.0093.0)1012.4(
076.0)009.0(180.0)1049.1(
073.0)1089.2(195)10195.2(
)z(uc)s(uc)V(uc)B(uc
)a(uc)W(uc)f(uc)F(uc)](u[
P
−
−
−
−
−−
×=
×−+××+
+×+××−+
+×−+××+
+××+××=
=++++
++++=δ
(A6)
mmuc 006.0)( =δ
The expanded uncertainty with a confidence interval of 95.4% is obtained multiplying the combined standard uncertainty by a coverage factor of 2:
mmU 012.02006.0)( =×=δ The value of d is calculated with equation A1:
mm
zaWVaW
ESgK P
Y
154.05.157.176.0364.0
42.0)57.1736(4.0000,2106032
)3.01(25.210,3
6.04.0)(4.0
2)1(
22
22
=+×+×
×−×+
××−×
=
=++×−×
+−
=δ
B3.2 Reported Results The Critical Crack Tip Opening Displacement (CTOD) is 0.154 ± 0.012 mm The above reported expanded uncertainty is based on a standard uncertainty multiplied by a coverage factor k=2, which for a normal distribution corresponds to a coverage probability, p, of approximately 95%. The uncertainty evaluation was carried out in accordance with UNCERT COP 04:2000.