Embed Size (px)
Citation preview
S M & T Standards Measurement & Testing Project No. SMT4-CT97-2165
UNCERT COP 07: 2000
Manual of Codes of Practice for the Determination of Uncertainties in Mechanical Tests on Metallic Materials
Code of Practice No. 07
The Determination of Uncertainties in Tensile Testing
W. GABAUER
VOEST-ALPINE STAHL LINZ GmbH Voest-Alpine Straße 3
4031 Linz AUSTRIA
Issue 1
September 2000
S M & T Standards Measurement & Testing Project No. SMT4-CT97-2165
UNCERT COP 07: 2000
CONTENTS 1. SCOPE 2. SYMBOLS AND DEFINITIONS 3. INTRODUCTION 4. A PROCEDURE FOR THE ESTIMATION OF UNCERTAINTY IN TENSILE
TESTING Step 1- Identifying the parameters for which uncertainty is to be estimated
Step 2- Identifying all sources of uncertainty in the test Step 3- Classifying the uncertainty according to Type A or B Step 4- Estimating the standard uncertainty for each source of uncertainty Step 5- Computing the combined uncertainty uc Step 6- Computing the expanded uncertainty U Step 7- Reporting of results
5. REFERENCES ACKNOWLEDGMENTS
APPENDIX A Mathematical formulae for calculating uncertainties in tensile testing
APPENDIX B A worked example for calculating uncertainties in tensile testing
S M & T Standards Measurement & Testing Project No. SMT4-CT97-2165
UNCERT COP 07: 2000
Page 1 of 33
1. SCOPE This procedure covers the evaluation of uncertainty in tensile test results obtained from tests at ambient or elevated temperature, carried out according to any of the following Standards: EN 10002-Part 1-1990: “Tensile testing - Method of testing at ambient
temperature” EN 10002-Part 5-1990: “Tensile testing - Method of testing at elevated
temperature” ASTM E8-1998: “Standard Test Methods for Tension Testing of Metallic
ASTM E111-1997: “Standard Test Method for Young’s Modulus, Tangent
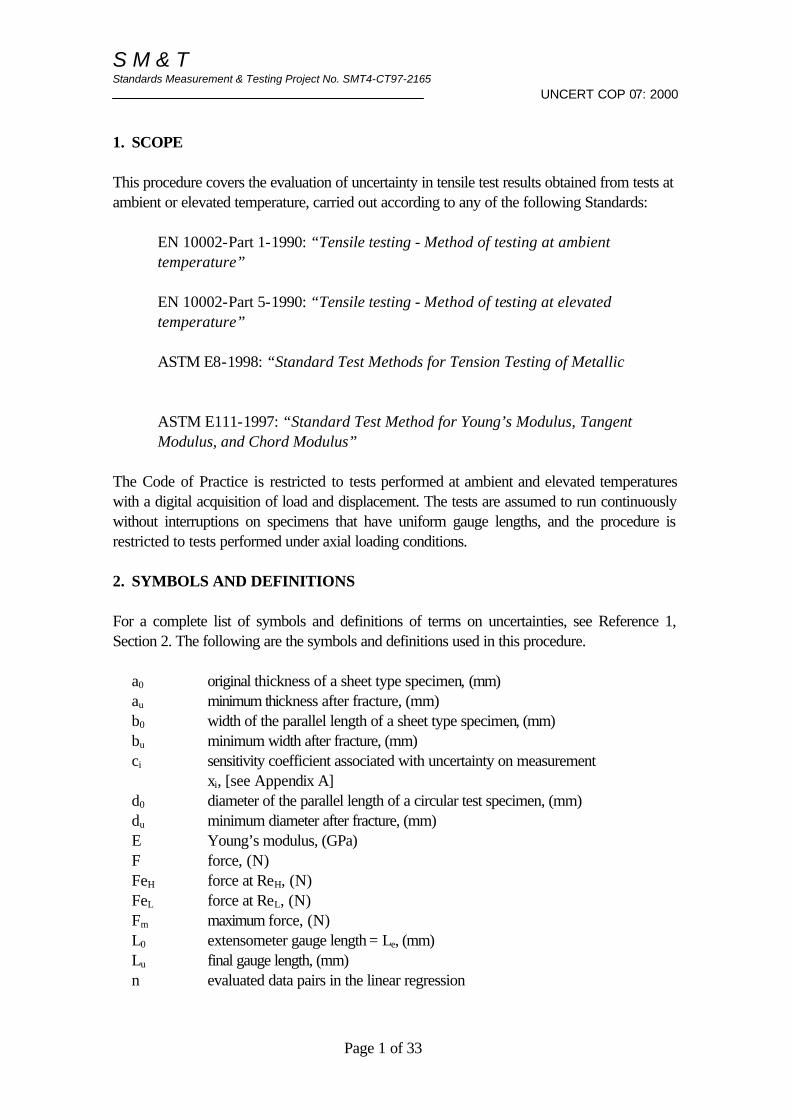
Modulus, and Chord Modulus” The Code of Practice is restricted to tests performed at ambient and elevated temperatures with a digital acquisition of load and displacement. The tests are assumed to run continuously without interruptions on specimens that have uniform gauge lengths, and the procedure is restricted to tests performed under axial loading conditions. 2. SYMBOLS AND DEFINITIONS For a complete list of symbols and definitions of terms on uncertainties, see Reference 1, Section 2. The following are the symbols and definitions used in this procedure.
a0 original thickness of a sheet type specimen, (mm) au minimum thickness after fracture, (mm) b0 width of the parallel length of a sheet type specimen, (mm) bu minimum width after fracture, (mm) ci sensitivity coefficient associated with uncertainty on measurement
xi, [see Appendix A] d0 diameter of the parallel length of a circular test specimen, (mm) du minimum diameter after fracture, (mm) E Young’s modulus, (GPa) F force, (N) FeH force at ReH, (N) FeL force at ReL, (N) Fm maximum force, (N) L0 extensometer gauge length = Le, (mm) Lu final gauge length, (mm) n evaluated data pairs in the linear regression
S M & T Standards Measurement & Testing Project No. SMT4-CT97-2165
UNCERT COP 07: 2000
Page 2 of 33
ReH upper yield strength, (MPa) ReL lower yield strength, (MPa) Rm ultimate tensile strength, (MPa) Rp stress at a permanent strain, (MPa) S0 original cross-sectional area, (mm2) Su minimum cross-sectional area after fracture, (mm2) u(xi) standard uncertainty uC(y) combined uncertainty on the mean result of a measurement Z percentage reduction in area ε strain (extension) σ stress e (∆L) displacement increment, (mm)
3. INTRODUCTION It is good practice in any measurement to evaluate and report the uncertainty associated with the test results. A statement of uncertainty may be required by a customer who wishes to know the limits within which the reported result may be assumed to lie, or the test laboratory itself may wish to develop a better understanding of which particular aspects of the test procedure have the greatest effect on results so that this may be controlled more closely. This Code of Practice (CoP) has been prepared within UNCERT, a project funded by the European Commission’s Standards, Measurement and Testing programme under reference SMT4-CT97-2165 to simplify the way in which uncertainties are evaluated. The aim is to avoid ambiguity and provide a common format which is easily understood and accessible to customers, test laboratories and accreditation authorities. This CoP is one of seventeen produced by the UNCERT consortium for the estimation of uncertainties associated with mechanical tests on metallic materials. The Codes of Practice have been collated in a single Manual [1] that has the following sections.
1. Introduction to the evaluation of uncertainty 2. Glossary of definitions and symbols 3. Typical sources of uncertainty in materials testing 4. Guidelines for the estimation of uncertainty for a test series 5. Guidelines for reporting uncertainty 6. Individual Codes of Practice (of which this is one) for the estimation of uncertainties in
mechanical tests on metallic materials. This CoP can be used as a stand-alone document. For further background information on measurement uncertainty and values of standard uncertainties of the equipment and instrumentation used commonly in material testing, the user may need to refer to Section 3 of the Manual [1]. The individual CoPs are kept as simple as possible by following the same structure; viz:
S M & T Standards Measurement & Testing Project No. SMT4-CT97-2165
UNCERT COP 07: 2000
Page 3 of 33
• The main procedure. • Details of the uncertainty calculations for the particular test type (Appendix A) • A worked example This CoP guides the user through the various steps to be carried out in order to estimate the uncertainty in tensile testing.
4. A PROCEDURE FOR THE ESTIMATION OF UNCERTAINTY IN
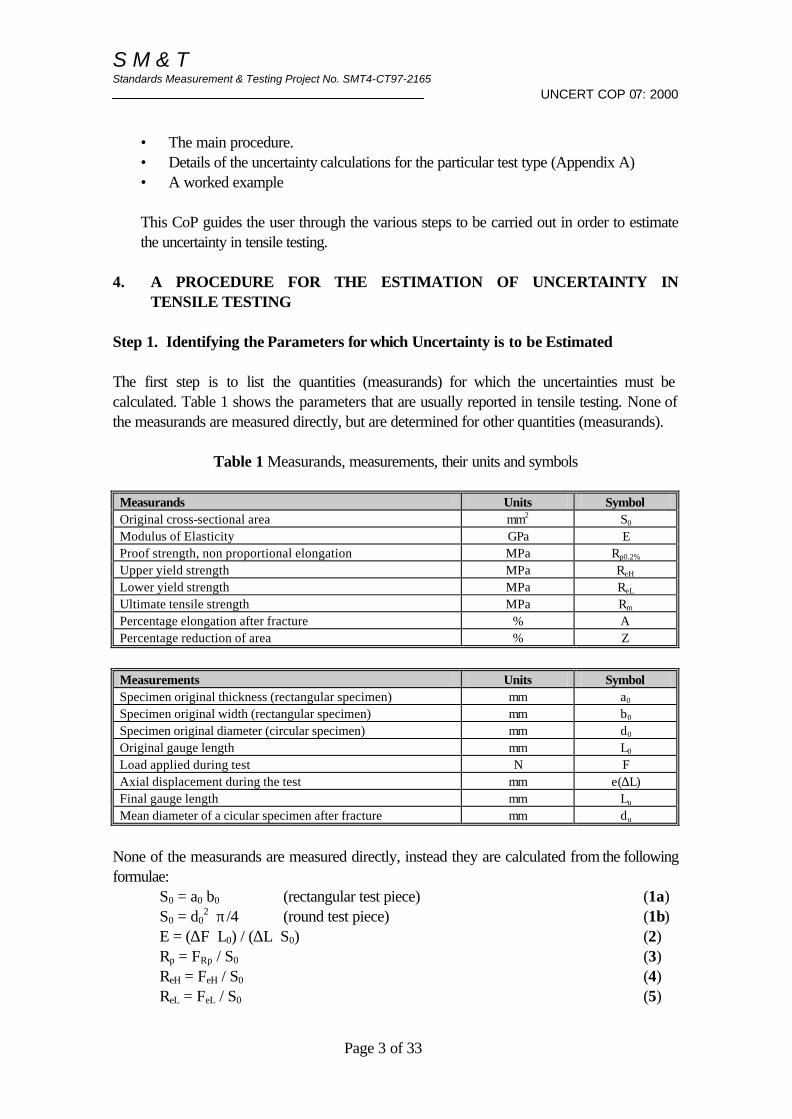
TENSILE TESTING Step 1. Identifying the Parameters for which Uncertainty is to be Estimated The first step is to list the quantities (measurands) for which the uncertainties must be calculated. Table 1 shows the parameters that are usually reported in tensile testing. None of the measurands are measured directly, but are determined for other quantities (measurands).
Table 1 Measurands, measurements, their units and symbols
Measurands Units Symbol Original cross-sectional area mm2 S0 Modulus of Elasticity GPa E Proof strength, non proportional elongation MPa Rp0.2% Upper yield strength MPa ReH Lower yield strength MPa ReL Ultimate tensile strength MPa Rm Percentage elongation after fracture % A Percentage reduction of area % Z
Measurements Units Symbol Specimen original thickness (rectangular specimen) mm a0 Specimen original width (rectangular specimen) mm b0 Specimen original diameter (circular specimen) mm d0 Original gauge length mm L0 Load applied during test N F Axial displacement during the test mm e(∆L) Final gauge length mm Lu Mean diameter of a cicular specimen after fracture mm du
None of the measurands are measured directly, instead they are calculated from the following formulae:
S0 = a0 b0 (rectangular test piece) (1a) S0 = d0
2 π/4 (round test piece) (1b) E = (∆F L0) / (∆L S0) (2) Rp = FRp / S0 (3) ReH = FeH / S0 (4) ReL = FeL / S0 (5)
S M & T Standards Measurement & Testing Project No. SMT4-CT97-2165
UNCERT COP 07: 2000
Page 4 of 33
Rm = Fm / S0 (6) A = (Lu - L0) 100/L0 (7) Z = (S0 - Su) 100/S0 (8)
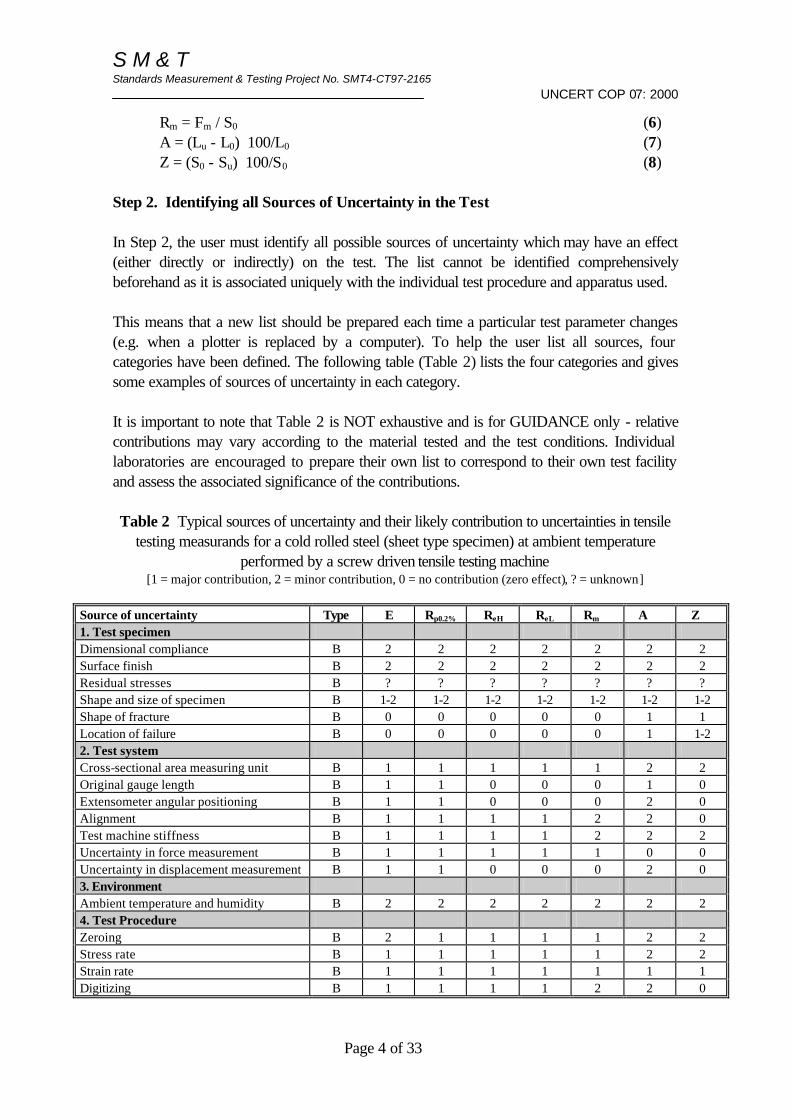
Step 2. Identifying all Sources of Uncertainty in the Test In Step 2, the user must identify all possible sources of uncertainty which may have an effect (either directly or indirectly) on the test. The list cannot be identified comprehensively beforehand as it is associated uniquely with the individual test procedure and apparatus used. This means that a new list should be prepared each time a particular test parameter changes (e.g. when a plotter is replaced by a computer). To help the user list all sources, four categories have been defined. The following table (Table 2) lists the four categories and gives some examples of sources of uncertainty in each category. It is important to note that Table 2 is NOT exhaustive and is for GUIDANCE only - relative contributions may vary according to the material tested and the test conditions. Individual laboratories are encouraged to prepare their own list to correspond to their own test facility and assess the associated significance of the contributions.
Table 2 Typical sources of uncertainty and their likely contribution to uncertainties in tensile
testing measurands for a cold rolled steel (sheet type specimen) at ambient temperature performed by a screw driven tensile testing machine
[1 = major contribution, 2 = minor contribution, 0 = no contribution (zero effect), ? = unknown]
Source of uncertainty Type E Rp0.2% ReH ReL Rm A Z 1. Test specimen Dimensional compliance B 2 2 2 2 2 2 2 Surface finish B 2 2 2 2 2 2 2 Residual stresses B ? ? ? ? ? ? ? Shape and size of specimen B 1-2 1-2 1-2 1-2 1-2 1-2 1-2 Shape of fracture B 0 0 0 0 0 1 1 Location of failure B 0 0 0 0 0 1 1-2 2. Test system Cross-sectional area measuring unit B 1 1 1 1 1 2 2 Original gauge length B 1 1 0 0 0 1 0 Extensometer angular positioning B 1 1 0 0 0 2 0 Alignment B 1 1 1 1 2 2 0 Test machine stiffness B 1 1 1 1 2 2 2 Uncertainty in force measurement B 1 1 1 1 1 0 0 Uncertainty in displacement measurement B 1 1 0 0 0 2 0 3. Environment Ambient temperature and humidity B 2 2 2 2 2 2 2 4. Test Procedure Zeroing B 2 1 1 1 1 2 2 Stress rate B 1 1 1 1 1 2 2 Strain rate B 1 1 1 1 1 1 1 Digitizing B 1 1 1 1 2 2 0
S M & T Standards Measurement & Testing Project No. SMT4-CT97-2165
UNCERT COP 07: 2000
Page 5 of 33
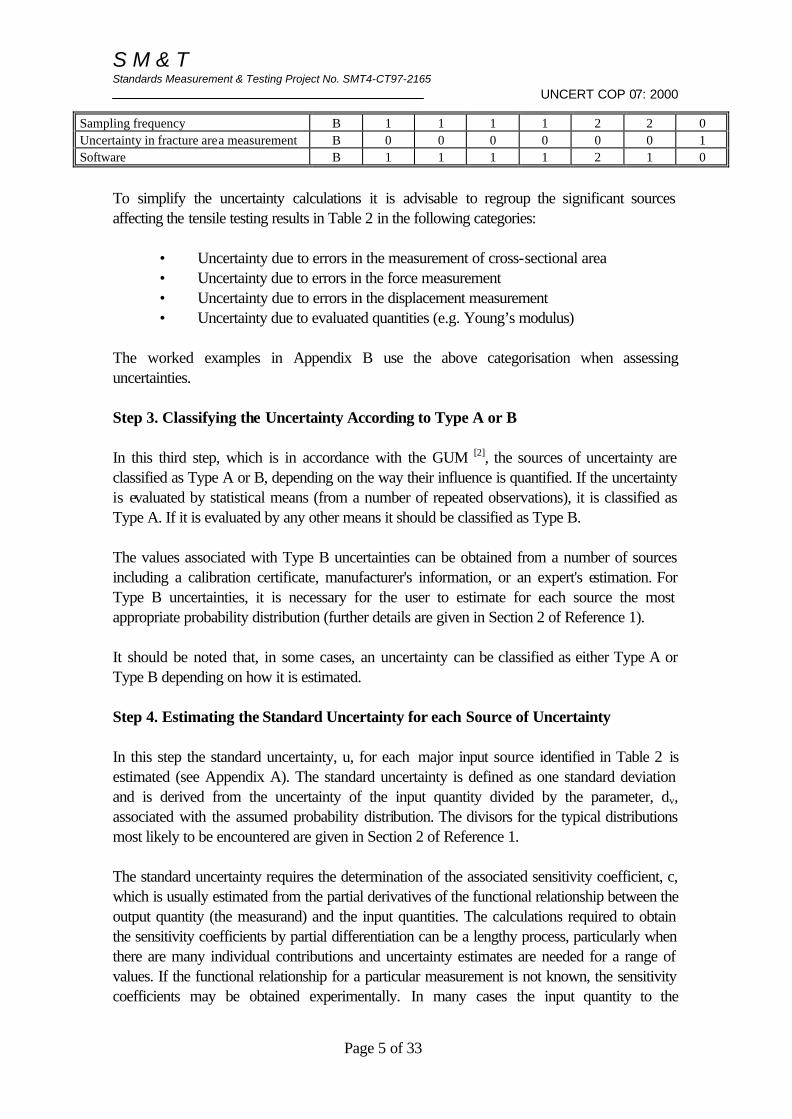
Sampling frequency B 1 1 1 1 2 2 0 Uncertainty in fracture area measurement B 0 0 0 0 0 0 1 Software B 1 1 1 1 2 1 0
To simplify the uncertainty calculations it is advisable to regroup the significant sources affecting the tensile testing results in Table 2 in the following categories:
• Uncertainty due to errors in the measurement of cross-sectional area • Uncertainty due to errors in the force measurement • Uncertainty due to errors in the displacement measurement • Uncertainty due to evaluated quantities (e.g. Young’s modulus)
The worked examples in Appendix B use the above categorisation when assessing uncertainties. Step 3. Classifying the Uncertainty According to Type A or B In this third step, which is in accordance with the GUM [2], the sources of uncertainty are classified as Type A or B, depending on the way their influence is quantified. If the uncertainty is evaluated by statistical means (from a number of repeated observations), it is classified as Type A. If it is evaluated by any other means it should be classified as Type B. The values associated with Type B uncertainties can be obtained from a number of sources including a calibration certificate, manufacturer's information, or an expert's estimation. For Type B uncertainties, it is necessary for the user to estimate for each source the most appropriate probability distribution (further details are given in Section 2 of Reference 1). It should be noted that, in some cases, an uncertainty can be classified as either Type A or Type B depending on how it is estimated. Step 4. Estimating the Standard Uncertainty for each Source of Uncertainty In this step the standard uncertainty, u, for each major input source identified in Table 2 is estimated (see Appendix A). The standard uncertainty is defined as one standard deviation and is derived from the uncertainty of the input quantity divided by the parameter, dv, associated with the assumed probability distribution. The divisors for the typical distributions most likely to be encountered are given in Section 2 of Reference 1. The standard uncertainty requires the determination of the associated sensitivity coefficient, c, which is usually estimated from the partial derivatives of the functional relationship between the output quantity (the measurand) and the input quantities. The calculations required to obtain the sensitivity coefficients by partial differentiation can be a lengthy process, particularly when there are many individual contributions and uncertainty estimates are needed for a range of values. If the functional relationship for a particular measurement is not known, the sensitivity coefficients may be obtained experimentally. In many cases the input quantity to the
S M & T Standards Measurement & Testing Project No. SMT4-CT97-2165
UNCERT COP 07: 2000
Page 6 of 33
measurement may not be in the same units as the output quantity. For example, one contribution to Rp0.2 is the test temperature. In this case the input quantity is temperature, but the output quantity is the stress which is MPa. In such a case, a sensitivity coefficient, cT (corresponding to the partial derivative of the proof strength / test temperature relationship), is used to convert from temperature to MPa (for more information see Appendix A). Step 5. Computing the Combined Uncertainty uc
Assuming that individual uncertainty sources are uncorrelated, the measurand's combined uncertainty, uc(y), can be computed using the root sum squares:
2
1
)]([)( ii
N
ic xucyu ∑
== (9)
where ci is the sensitivity coefficient associated with xi. This uncertainty corresponds to plus or minus one standard deviation on the normal distribution law representing the studied quantity. The combined uncertainty has an associated confidence level of 68.27%. Step 6. Computing the Expanded Uncertainty U The expanded uncertainty, U, is defined in Reference 2 as “the interval about the result of a measurement that may be expected to encompass a large fraction of the distribution of values that could reasonably be attributed to the measurand”. It is obtained by multiplying the combined uncertainty, uc, by a coverage factor, k, which is selected on the basis of the level of confidence required. For a normal probability distribution, the most generally used coverage factor is 2 which corresponds to a confidence interval of 95.4% (effectively 95% for most practical purposes). The expanded uncertainty, U, is, therefore, broader than the combined uncertainty, uc.. Where a higher confidence level is demanded by the customer (such as for Aerospace and electronics industries), a coverage factor of 3 is often used so that the corresponding confidence level increases to 99.73%. In cases where the probability distribution of uc is not normal (or where the number of data points used in Type A analysis is small), the value of k should be calculated from the degrees of freedom given by the Welsh-Satterthwaite method (see Reference 1, Section 4 for more details). Tables B1 to B4 in Appendix B shows the recommended format of the calculation worksheets for estimating the uncertainty in Young’s modulus and proof stress for a rectangular test piece. Appendix A presents the mathematical formulae for calculating uncertainty contributions. Step 7. Reporting of Results Once the expanded uncertainty has been estimated, the results should be reported in the following way:
S M & T Standards Measurement & Testing Project No. SMT4-CT97-2165
UNCERT COP 07: 2000
Page 7 of 33
V= y ± U (10) where V is the estimated value of the measurand, y is the test (or measurement) mean result, U is the expanded uncertainty associated with y. An explanatory note, such as that given in the following example should be added (change when appropriate): The reported expanded uncertainty is based on a standard uncertainty multiplied by a coverage factor, k = 2, which for a normal distribution corresponds to a coverage probability, p, of approximately 95%. The uncertainty evaluation was carried out in accordance with UNCERT COP 07:2000. 5. REFERENCES 1. Manual of Codes of Practice for the determination of uncertainties in mechanical
tests on metallic materials. Project UNCERT, EU Contract SMT4-CT97-2165, Standards Measurement & Testing Programme, ISBN 0-946754-41-1, Issue 1, September 2000.
2. BIPM, IEC, IFCC, ISO, IUPAC, OIML, “Guide to the Expression of Uncertainty
in Measurement”. International Organisation for Standardisation, Geneva, Switzerland, ISBN 92-67-10188-9, First Edition, 1993. [This Guide is often referred to as the GUM or the ISO TAG4 document after the ISO Technical Advisory Group that drafted it.]
BSI (identical), “Vocabulary of metrology, Part 3. Guide to the expression of
uncertainty in measurement”, PD 6461: Part 3 : 1995, British Standards Institution. 3. ISO 5725 ; Accuracy (trueness and precision) of measurement methods and results Part 1: 1994(E) General principles and definitions Part 2: 1994(E) Basic method for the determination of repeatability and reproducibility
of standard measurement method Part 3: 1994(E) Intermediate measures of the precision of a standard measurement
method Part 4: 1994(E) Basic methods for the determination of the trueness of a standard
measurement method Part 5: 1998(E) Alternative methods for the determination of the precision of a standard
measurement method Part 6: 1994(E) Use in practice of accuracy values 4. ISO 3534 Part 3: 1999(E/F) Statistics - Vocabulary and symbols - design of
experiments 5. ISO Guide 33: 1989(E) Uses of certified reference materials
S M & T Standards Measurement & Testing Project No. SMT4-CT97-2165
UNCERT COP 07: 2000
Page 8 of 33
6. ISO Guide 35: 1989(E) Certification of reference materials - General and statistical principles
7. Malcolm S. Loveday, “Room Temperature Tensile Testing: A Method for Estimating
Uncertainty of Measurement,” Measurement Note CMMT (MN) 048, July 1999; Centre for Materials Measurement and Technology, National Physical Laboratory, Teddington, TW11 0LW
8. Thomas G. F. Gray and James Sharp, “Influence of Machine Type and Strain Rate
Interaction in Tension Testing,” Factors That Affect the Precision of Mechanical Tests, ASTM STP 1025, R. Papirno and H. C. Weiss, Eds., American Society for Testing and Materials, Philadelphia, 1989, pp. 187-205.
9. Bruce W. Christ, - Fracture and Deformation Division, Center for Materials Science,
National Bureau of Standards, “Effect of Specimen Preparation, Setup, and Test Procedures on Test Results”.
10. Günter Robiller, “Problems of the computer-controlled tensile test,”
Materialprüfung 31 (1989) 11-12, Carl Hanser Verlag, München 11. Bodo Hesse, Hans-Martin Sonne, and Günter Robiller, “Reliable proof stress
determination with computerized tensile test,” Materialprüfung 33 (1991) 7-8, Carl Hanser Verlag, München
12. Hans-Martin Sonne and Alois Wehrstedt, “Computer-aided Tension Test - Problems
of Performance on the Basis of the Standard,” Materialprüfung 37 (1995) 4, Carl Hanser Verlag, München
13. Thomas H. Courtney, “Mechanical Behavior of Materials” McGraw-Hill series in
materials science and engineering (ISBN 0-07-013265-8). 14. Wilfried J. Bartz, Herausgeber, “Mechanische Werkstoffprüfung - Grundlagen,
Prüfmethoden, Anwendungen” expert verlag (ISBN 3-8169-1035-1) 15. Horst Blumenauer, Herausgeber, “Werkstoffprüfung” Dt. Vlg. für Grundstoffindustrie,
Leipzig , Stuttgart (ISBN 3-342-00547-5) 16. Friedhelm Richter, “Physikalische Eigenschaften von Stählen und ihre
Temperaturabhängigkeit - Polynome und graphische Darstellungen,” STAHLEISEN - SONDERBERICHTE HEFT 10, Verlag STAHLEISEN M.B.H.; Düsseldorf 1983 (ISBN 3-514-00294-0)
17. Franz Adunka, “Meßunsicherheiten - Theorie und Praxis” Vulkan Vlg Essen (ISBN
3-8027-2186-1)
S M & T Standards Measurement & Testing Project No. SMT4-CT97-2165
UNCERT COP 07: 2000
Page 9 of 33
18. John Mandel, “The Statistical Analysis of Experimental Data” Dover Publications
(ISBN 0-486-64666-1) 19. Eberhard Scheffler, “Statistische Versuchsplanung und -auswertung: eine
Einführung für den Praktiker” Dt. Vlg. für Grundstoffindustrie, Leipzig, Stuttgart (ISBN 3-342-00366-9)
ACKNOWLEDGMENTS This document was written as part of project “Code of Practice for the Determination of Uncertainties in Mechanical Tests on Metallic Materials”. The project was partly funded by the Commission of European Communities through the Standards, Measurement and Testing Programme, Contract No. SMT4-CT97-2165. The author gratefully acknowledges the helpful comments made by many colleagues from UNCERT.
S M & T Standards Measurement & Testing Project No. SMT4-CT97-2165
UNCERT COP 07: 2000
Page 10 of 33
APPENDIX A
MATHEMATICAL FORMULAE FOR CALCULATING UNCERTAINTIES IN TENSILE TESTING
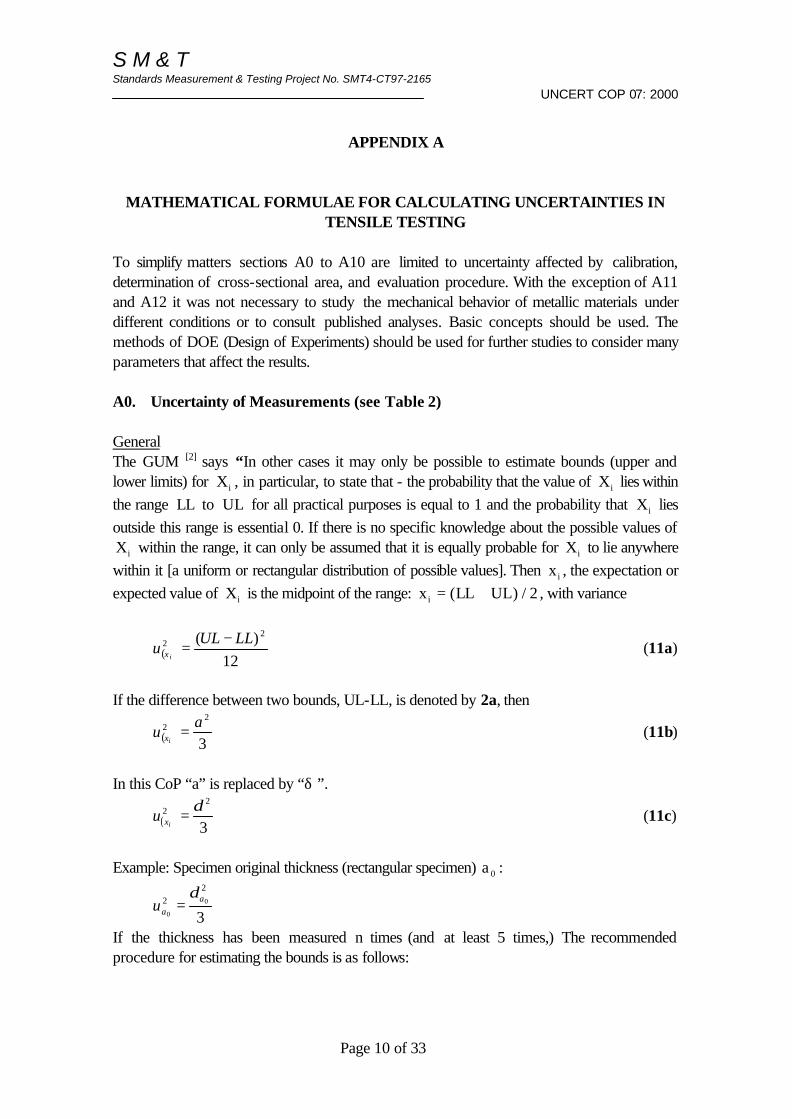
To simplify matters sections A0 to A10 are limited to uncertainty affected by calibration, determination of cross-sectional area, and evaluation procedure. With the exception of A11 and A12 it was not necessary to study the mechanical behavior of metallic materials under different conditions or to consult published analyses. Basic concepts should be used. The methods of DOE (Design of Experiments) should be used for further studies to consider many parameters that affect the results. A0. Uncertainty of Measurements (see Table 2) General The GUM [2] says “In other cases it may only be possible to estimate bounds (upper and lower limits) for Xi , in particular, to state that - the probability that the value of Xi lies within the range LL to UL for all practical purposes is equal to 1 and the probability that Xi lies outside this range is essential 0. If there is no specific knowledge about the possible values of Xi within the range, it can only be assumed that it is equally probable for Xi to lie anywhere within it [a uniform or rectangular distribution of possible values]. Then x i , the expectation or expected value of Xi is the midpoint of the range: x LL ULi = +( ) / 2 , with variance
( ) 12)( 2
2 LLULu
ix
−= (11a)
If the difference between two bounds, UL-LL, is denoted by 2a, then
( ) 3
22 a
uix = (11b)
In this CoP “a” is replaced by “δ ”.
( ) 3
22 δ=
ixu (11c)
Example: Specimen original thickness (rectangular specimen) a 0 :
3
2
2 0
0
aau
δ=
If the thickness has been measured n times (and at least 5 times,) The recommended procedure for estimating the bounds is as follows:
S M & T Standards Measurement & Testing Project No. SMT4-CT97-2165
UNCERT COP 07: 2000
Page 11 of 33
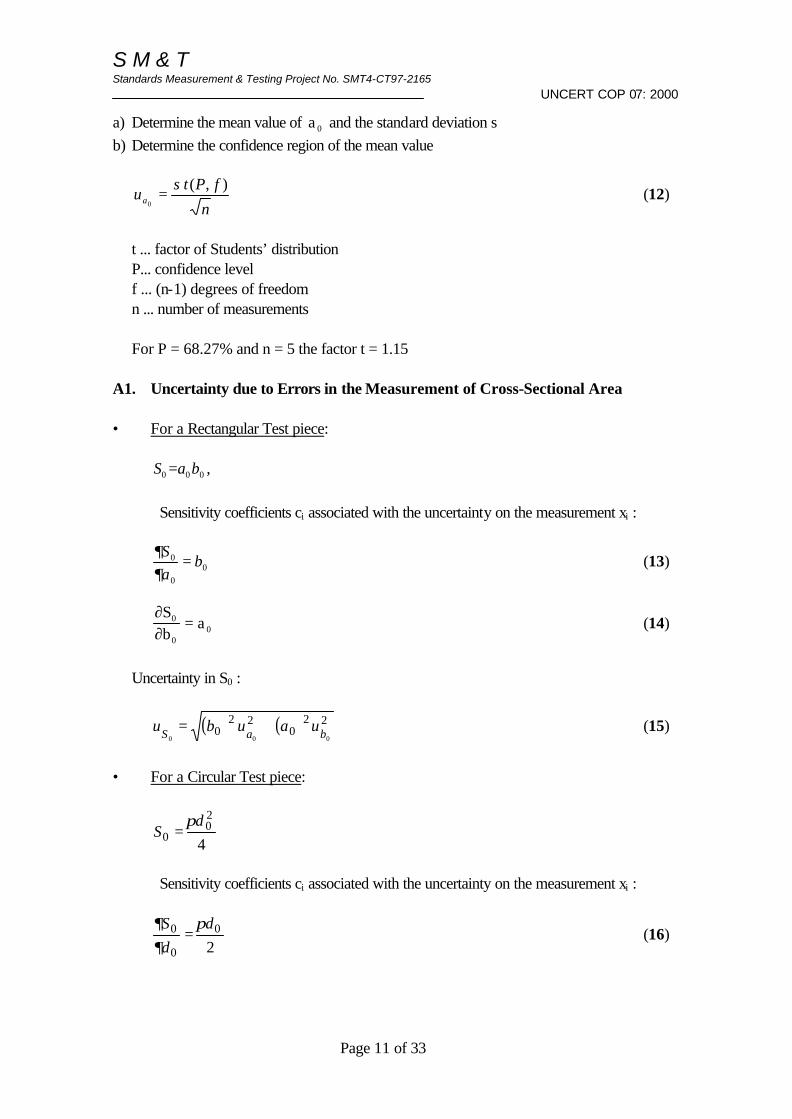
a) Determine the mean value of a 0 and the standard deviation s b) Determine the confidence region of the mean value
n
fPtsua
),(0
= (12)
t ... factor of Students’ distribution P... confidence level f ... (n-1) degrees of freedom n ... number of measurements For P = 68.27% and n = 5 the factor t = 1.15 A1. Uncertainty due to Errors in the Measurement of Cross-Sectional Area • For a Rectangular Test piece: 000 baS = ,
Sensitivity coefficients ci associated with the uncertainty on the measurement xi :
0
0
0 baS =
∂∂
(13)
∂∂Sb
a0
00= (14)
Uncertainty in S0 :
( ) ( ) 220
220
000 baS uaubu += (15)
• For a Circular Test piece:
4
20
0d
Sπ
=
Sensitivity coefficients ci associated with the uncertainty on the measurement xi :
2
0
0
0 d
d
S π∂∂
= (16)
S M & T Standards Measurement & Testing Project No. SMT4-CT97-2165
UNCERT COP 07: 2000
Page 12 of 33
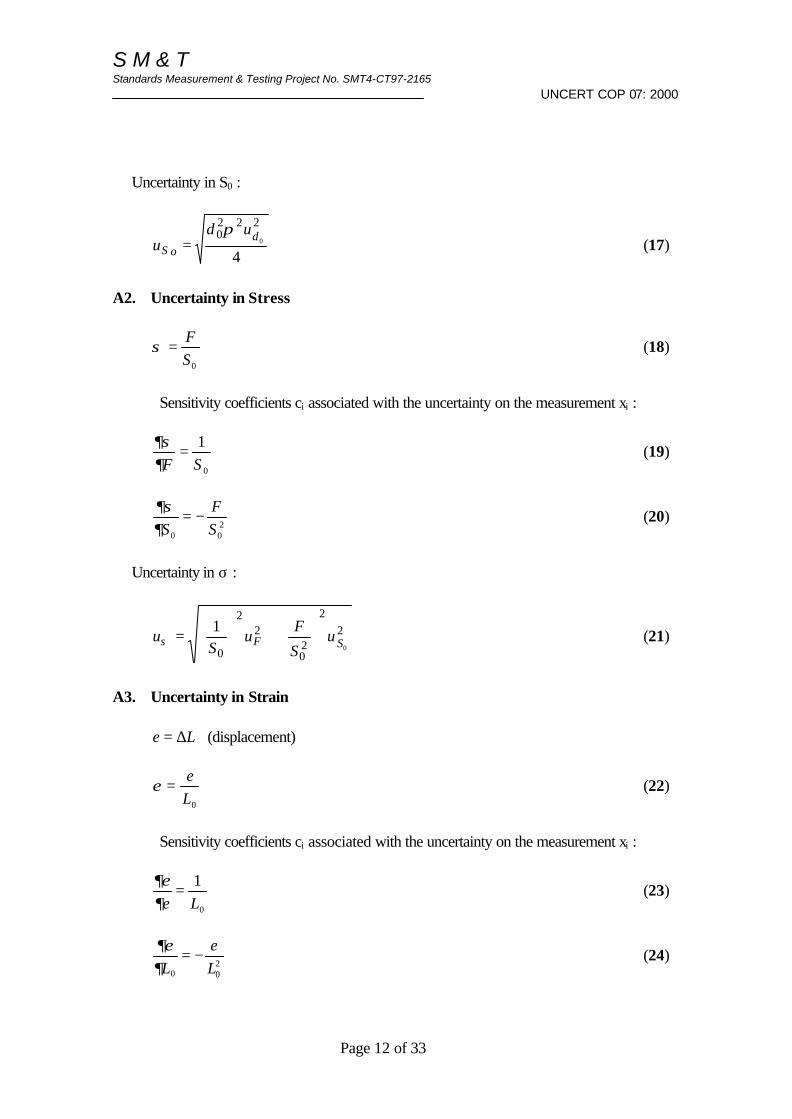
Uncertainty in S0 :
4
2220
0doS
udu
π= (17)
A2. Uncertainty in Stress
0S
F=σ (18)
Sensitivity coefficients ci associated with the uncertainty on the measurement xi :
0
1SF
=∂∂σ
(19)
200 S
FS
−=∂∂σ
(20)
Uncertainty in σ :
22
20
22
00
1SF u
S
Fu
Su
+
=σ (21)
A3. Uncertainty in Strain Le ∆= (displacement)
0L
e=ε (22)
Sensitivity coefficients ci associated with the uncertainty on the measurement xi :
0
1Le
=∂∂ε
(23)
200 L
eL
−=∂∂ε
(24)
S M & T Standards Measurement & Testing Project No. SMT4-CT97-2165
UNCERT COP 07: 2000
Page 13 of 33
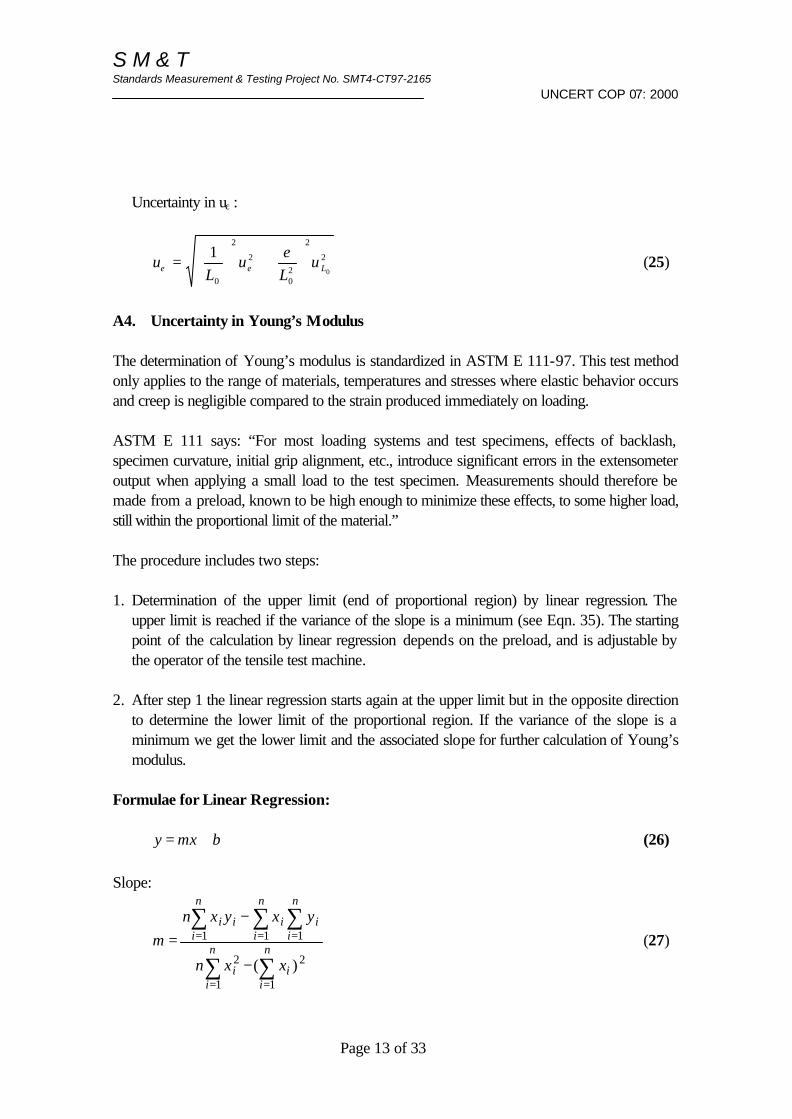
Uncertainty in uε :
2
2
20
2
2
00
1Le u
Le
uL
u
+
=ε (25)
A4. Uncertainty in Young’s Modulus The determination of Young’s modulus is standardized in ASTM E 111-97. This test method only applies to the range of materials, temperatures and stresses where elastic behavior occurs and creep is negligible compared to the strain produced immediately on loading. ASTM E 111 says: “For most loading systems and test specimens, effects of backlash, specimen curvature, initial grip alignment, etc., introduce significant errors in the extensometer output when applying a small load to the test specimen. Measurements should therefore be made from a preload, known to be high enough to minimize these effects, to some higher load, still within the proportional limit of the material.” The procedure includes two steps: 1. Determination of the upper limit (end of proportional region) by linear regression. The
upper limit is reached if the variance of the slope is a minimum (see Eqn. 35). The starting point of the calculation by linear regression depends on the preload, and is adjustable by the operator of the tensile test machine.
2. After step 1 the linear regression starts again at the upper limit but in the opposite direction
to determine the lower limit of the proportional region. If the variance of the slope is a minimum we get the lower limit and the associated slope for further calculation of Young’s modulus.
Formulae for Linear Regression:
bmxy += (26)
Slope:
∑ ∑
∑ ∑ ∑
= =
= = =
−
−=
n
i
n
iii
n
i
n
i
n
iiiii
xxn
yxyxn
m
1 1
22
1 1 1
)(
(27)
S M & T Standards Measurement & Testing Project No. SMT4-CT97-2165
UNCERT COP 07: 2000
Page 14 of 33
Intercept equation:
n
xmy
b
n
i
n
iii∑ ∑
= =−
= 1 1 (28)
Empirical covariance (Sxy):
−−
= ∑∑ ∑
=
= =n
i
n
i
n
iii
iixy n
yx
yxn
S1
1 1
11
(29)
Standard deviation of x-values:
−−
= ∑∑
=
=n
i
n
ii
ix n
x
xn
S1
2
12
11
(30)
Standard deviation of y-values:
−−
= ∑∑
=
=n
i
n
ii
iy n
y
yn
S1
2
12
11
(31)
Correlation coefficient (r):
yx
xy
SS
Sr = (32)
Standard deviation of the slope (Sm):
S M & T Standards Measurement & Testing Project No. SMT4-CT97-2165
UNCERT COP 07: 2000
Page 15 of 33
( )( ) 2
22
2
1
x
ym
Sn
SrS
−
−= (33)
Standard deviation of the intercept (Sb):
n
n
x
SnSS
n
ii
x
mb
2
12
2)1(
+−=
∑=
(34)
Bound regarding the upper and the lower proportional limit for the determination of Young’s modulus:
( ) →=m
SS m
relm minimum (35)
The data pair for the minimum of ( )Sm rel represents the upper and the lower proportional limit.
Combined Uncertainty of E : The linear regression is used to determine the linear relationship between force and displacement.
0
0
0
0
S
Lm
eS
FLE E== (36)
EE bemF += (37)
Therefore:
26.; EqnseeyF = 26.; Eqnseexe =
27.; EqnseemmE = 28.; EqnseebbE =
29.;, EqnseeSS xyFe = 30.; EqnseeSS xe =
31.; EqnseeSS yF = 32.; EqnseerrE =
S M & T Standards Measurement & Testing Project No. SMT4-CT97-2165
UNCERT COP 07: 2000
Page 16 of 33
33.; EqnseeSS mmE= 34.; EqnseeSS bbE
=
( ) ( ) 35.; EqnseeSS relmm relE=
Sensitivity coefficients ci associated with the uncertainty on the measurement xi :
0
0
SL
mE
E
=∂∂
(38)
00 S
mLE E=
∂∂
(39)
20
0
0 SLm
SE E−=
∂∂
(40)
22
20
022
0
22
0
000 S
EL
EmE u
S
Lmu
Sm
SSL
uE
+
+
= (41)
A5. Uncertainty in the Determination of Proof Stress elzIPp eeee −+= (permanent displacement) (42)
IPe ... Input data n displacement; (e.g. recorded in ASCII-file)
E
Ezz m
beFpoZerocalculatede −=⇒=− 0int;... see Eqn. (37) (43)
E
IPel m
Fe = (elastic displacement) (44)
F Input data of forceIP ... ; (e.g. recorded in ASCII-file)
E
IPEIPpzE m
Fbeeeb
−+=⇒≤⇒≥ 00 (45)
S M & T Standards Measurement & Testing Project No. SMT4-CT97-2165
UNCERT COP 07: 2000
Page 17 of 33
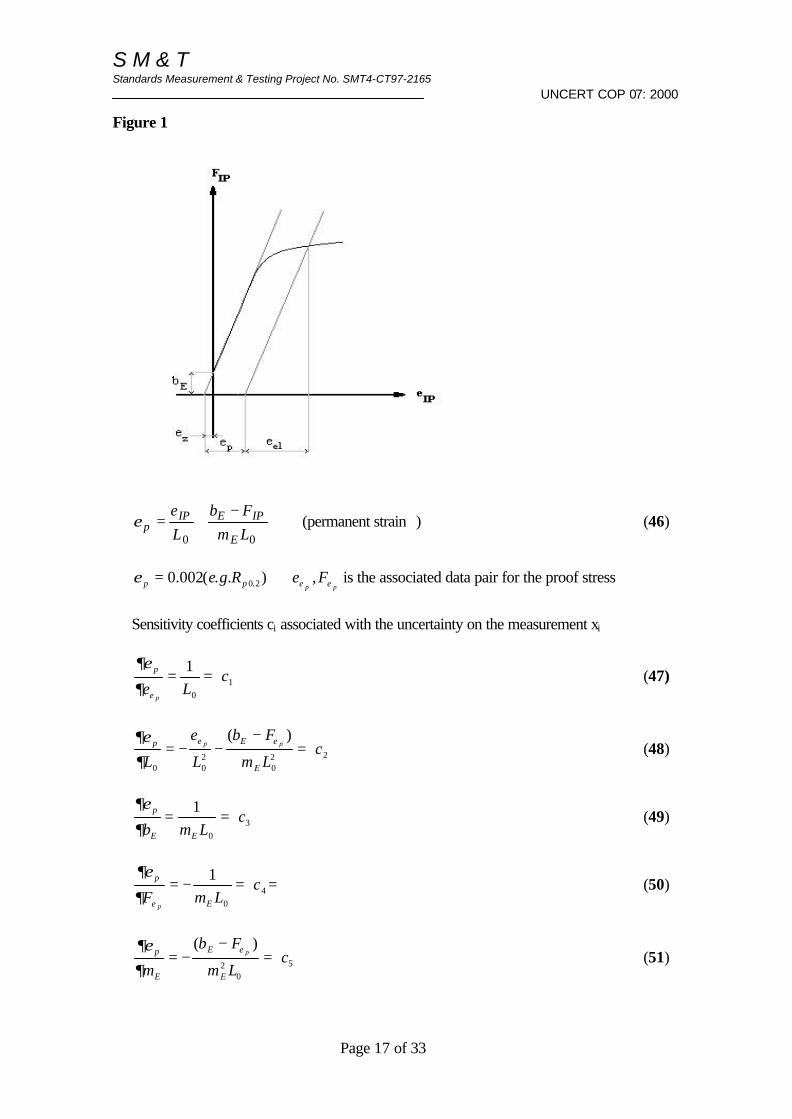
Figure 1
00 Lm
Fb
L
e
E
IPEIPp
−+=ε (permanent strain ) (46)
ppFeRge pp εεε ,)..(002.0 2.0 ⇒= is the associated data pair for the proof stress
Sensitivity coefficients ci associated with the uncertainty on the measurement xi
1
0
1c
Lep
p ==ε∂
∂ε (47)
220
200
)(c
Lm
Fb
L
e
L E
Ep pp =−
−−= εε
∂∂ε
(48)
3
0
1c
Lmb EE
p ==∂
∂ε (49)
4
0
1c
LmF E
p
p
=−=ε∂
∂ε= (50)
5
02
)(c
Lm
Fb
m E
E
E
p p =−
−= ε
∂∂ε
(51)
S M & T Standards Measurement & Testing Project No. SMT4-CT97-2165
UNCERT COP 07: 2000
Page 18 of 33
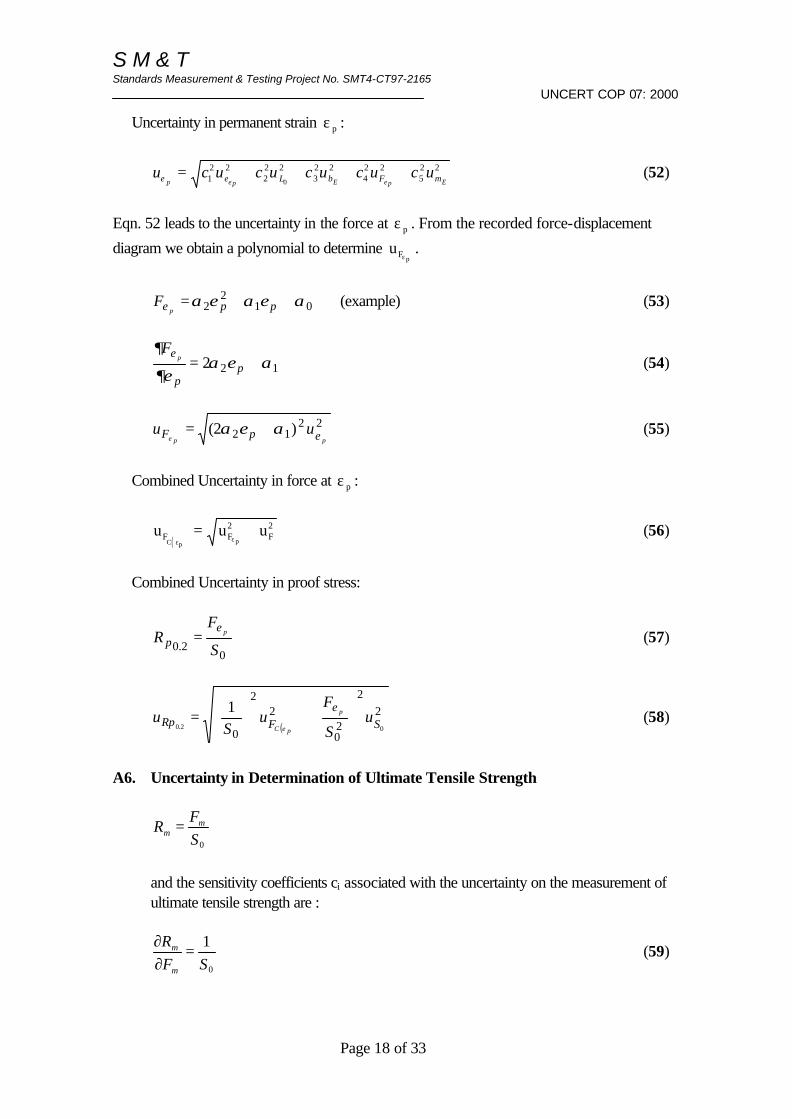
Uncertainty in permanent strain ε p :
225
224
223
222
221 0 EpEpp mFbLe ucucucucucu ++++=
εεε (52)
Eqn. 52 leads to the uncertainty in the force at ε p . From the recorded force-displacement
diagram we obtain a polynomial to determine uF pε.
012
2 αεαεαε ++= pppF (example) (53)
122 αεα∂ε
∂ ε+= p
p
pF
(54)
2212 )2(
ppuu pF εαεα
ε+= (55)
Combined Uncertainty in force at ε p :
( )
u u uF F FC p pε ε
= +2 2 (56)
Combined Uncertainty in proof stress:
0
2.0 S
FR p
pε
= (57)
( )
22
20
22
002.0
1SFRp u
S
Fu
Su p
pC
+
=
ε
ε (58)
A6. Uncertainty in Determination of Ultimate Tensile Strength
0S
FR m
m =
and the sensitivity coefficients ci associated with the uncertainty on the measurement of ultimate tensile strength are :
0
1SF
R
m
m =∂∂
(59)
S M & T Standards Measurement & Testing Project No. SMT4-CT97-2165
UNCERT COP 07: 2000
Page 19 of 33
200 S
FSR mm −=
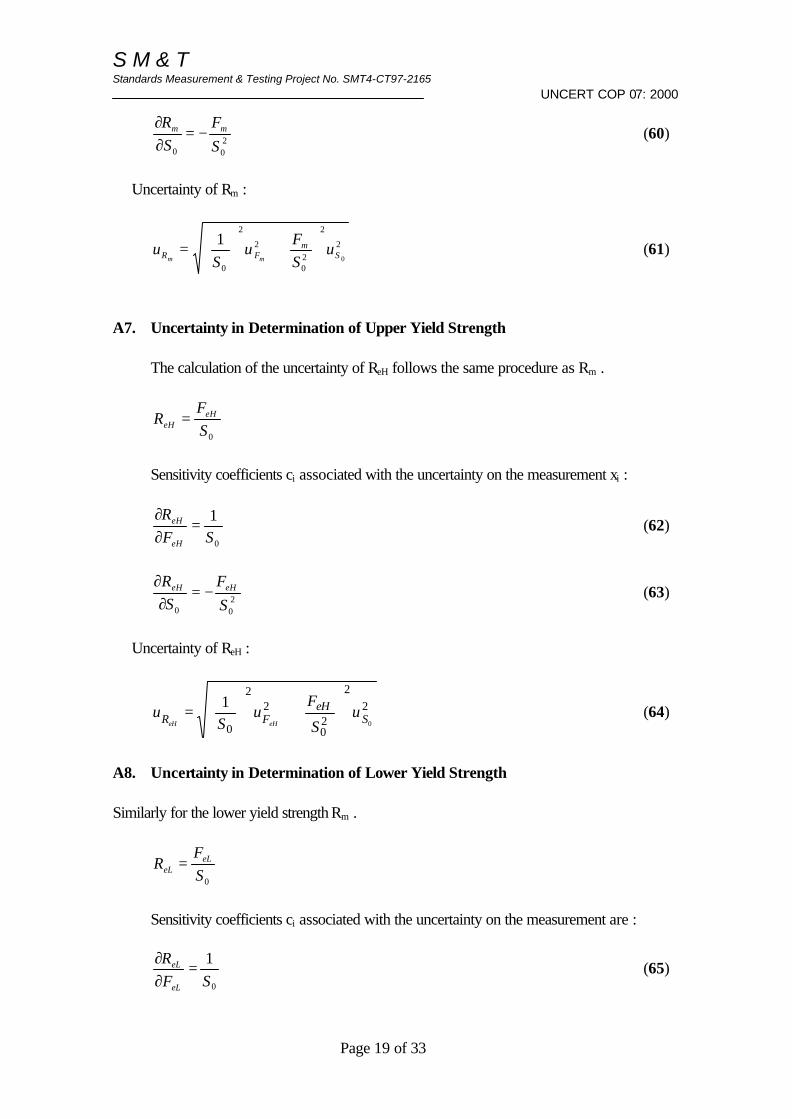
∂∂
(60)
Uncertainty of Rm :
2
2
20
2
2
00
1S
mFR u
SF
uS
umm
+
= (61)
A7. Uncertainty in Determination of Upper Yield Strength
The calculation of the uncertainty of ReH follows the same procedure as Rm .
0S
FR eH
eH =
Sensitivity coefficients ci associated with the uncertainty on the measurement xi :
0
1SF
R
eH
eH =∂∂
(62)
200 S
FSR eHeH −=∂
∂ (63)
Uncertainty of ReH :
22
20
22
00
1S
eHFR u
S
Fu
Su
eHeH
+
= (64)
A8. Uncertainty in Determination of Lower Yield Strength Similarly for the lower yield strength Rm .
0S
FR eL
eL =
Sensitivity coefficients ci associated with the uncertainty on the measurement are :
0
1SF
R
eL
eL =∂∂
(65)
S M & T Standards Measurement & Testing Project No. SMT4-CT97-2165
UNCERT COP 07: 2000
Page 20 of 33
200 S
FSR eLeL −=
∂∂
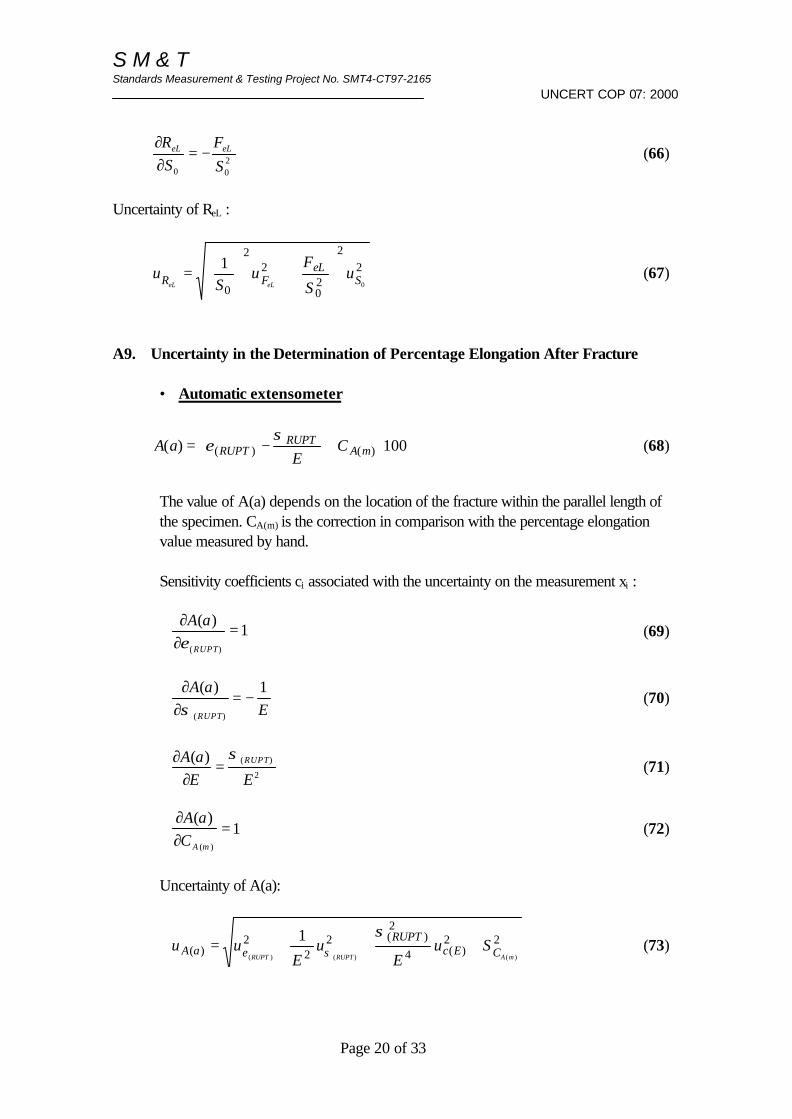
(66)
Uncertainty of ReL :
22
20
22
00
1S
eLFR u
S
Fu
Su
eLeL
+
= (67)
A9. Uncertainty in the Determination of Percentage Elongation After Fracture
• Automatic extensometer
100)( )()(
+−= mA
RUPTRUPT C
EaA
σε (68)
The value of A(a) depends on the location of the fracture within the parallel length of the specimen. CA(m) is the correction in comparison with the percentage elongation value measured by hand. Sensitivity coefficients ci associated with the uncertainty on the measurement xi :
1)(
)(
=∂∂
RUPT
aAε
(69)
EaA
RUPT
1)(
)(
−=∂∂σ
(70)
2
)()(EE
aA RUPTσ=
∂∂
(71)
1)(
)(
=∂∂
mACaA
(72)
Uncertainty of A(a):
22)(4
2)(2
22
)()()()(
1mARUPTRUPT CEc
RUPTaA Su
Eu
Euu +++=
σσε (73)
S M & T Standards Measurement & Testing Project No. SMT4-CT97-2165
UNCERT COP 07: 2000
Page 21 of 33
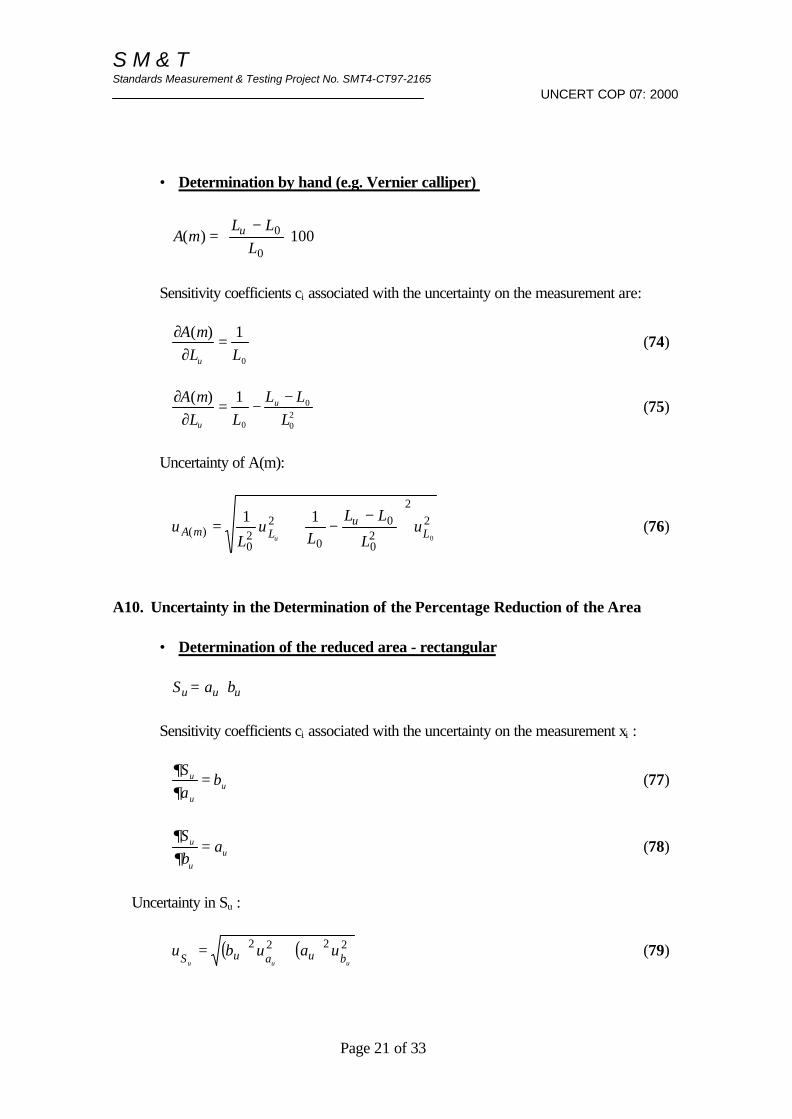
• Determination by hand (e.g. Vernier calliper)
100)(0
0
−=
LLL
mA u
Sensitivity coefficients ci associated with the uncertainty on the measurement are:
0
1)(LL
mA
u
=∂
∂ (74)
20
0
0
1)(L
LLLL
mA u
u
−−=∂
∂ (75)
Uncertainty of A(m):
22
20
0
0
220
)(0
11L
uLmA u
L
LLL
uL
uu
−−+= (76)
A10. Uncertainty in the Determination of the Percentage Reduction of the Area
• Determination of the reduced area - rectangular uuu baS =
Sensitivity coefficients ci associated with the uncertainty on the measurement xi :
uu
u baS =
∂∂
(77)
uu
u abS
=∂∂
(78)
Uncertainty in Su :
( ) ( ) 2222
uuu buauS uaubu += (79)
S M & T Standards Measurement & Testing Project No. SMT4-CT97-2165
UNCERT COP 07: 2000
Page 22 of 33
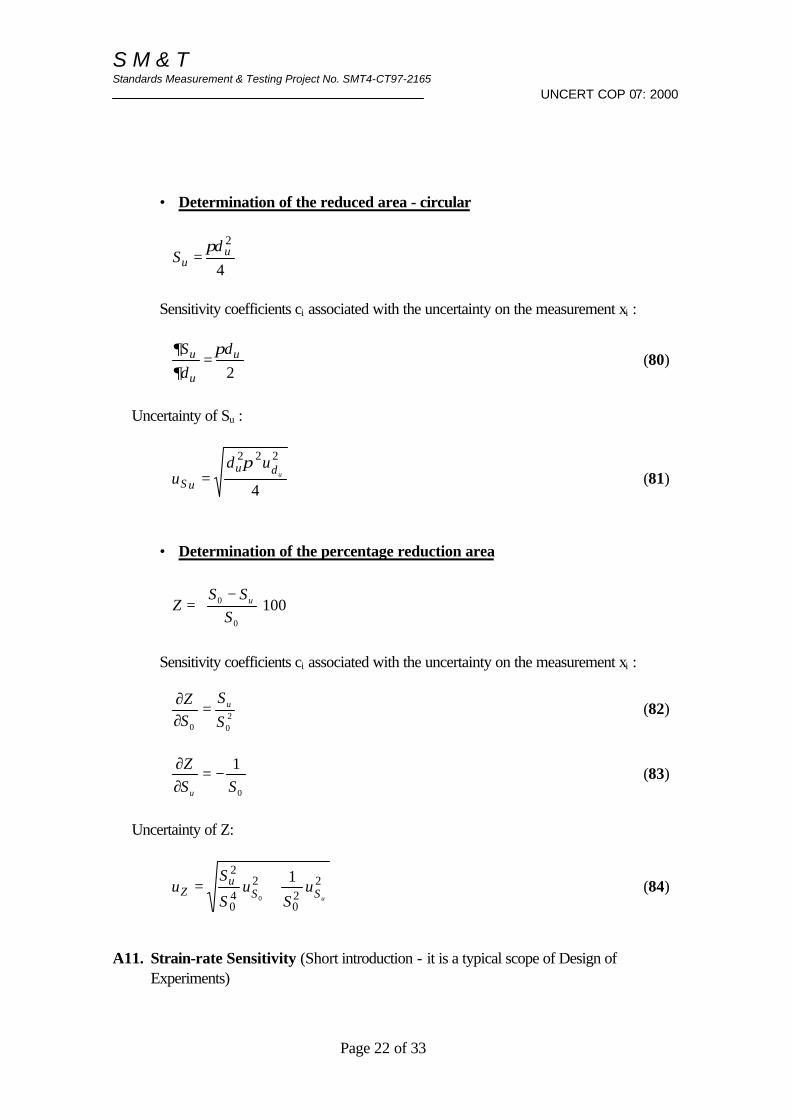
• Determination of the reduced area - circular
4
2u
ud
Sπ
=
Sensitivity coefficients ci associated with the uncertainty on the measurement xi :
2
u
u
u d
d
S π∂∂
= (80)
Uncertainty of Su :
4
222udu
uS
udu
π= (81)
• Determination of the percentage reduction area
1000
0
−=
SSS
Z u
Sensitivity coefficients ci associated with the uncertainty on the measurement xi :
200 S
SSZ u=
∂∂
(82)
0
1SS
Z
u
−=∂∂
(83)
Uncertainty of Z:
220
240
2 10 uSS
uZ u
Su
S
Su += (84)
A11. Strain-rate Sensitivity (Short introduction - it is a typical scope of Design of Experiments)
S M & T Standards Measurement & Testing Project No. SMT4-CT97-2165
UNCERT COP 07: 2000
Page 23 of 33
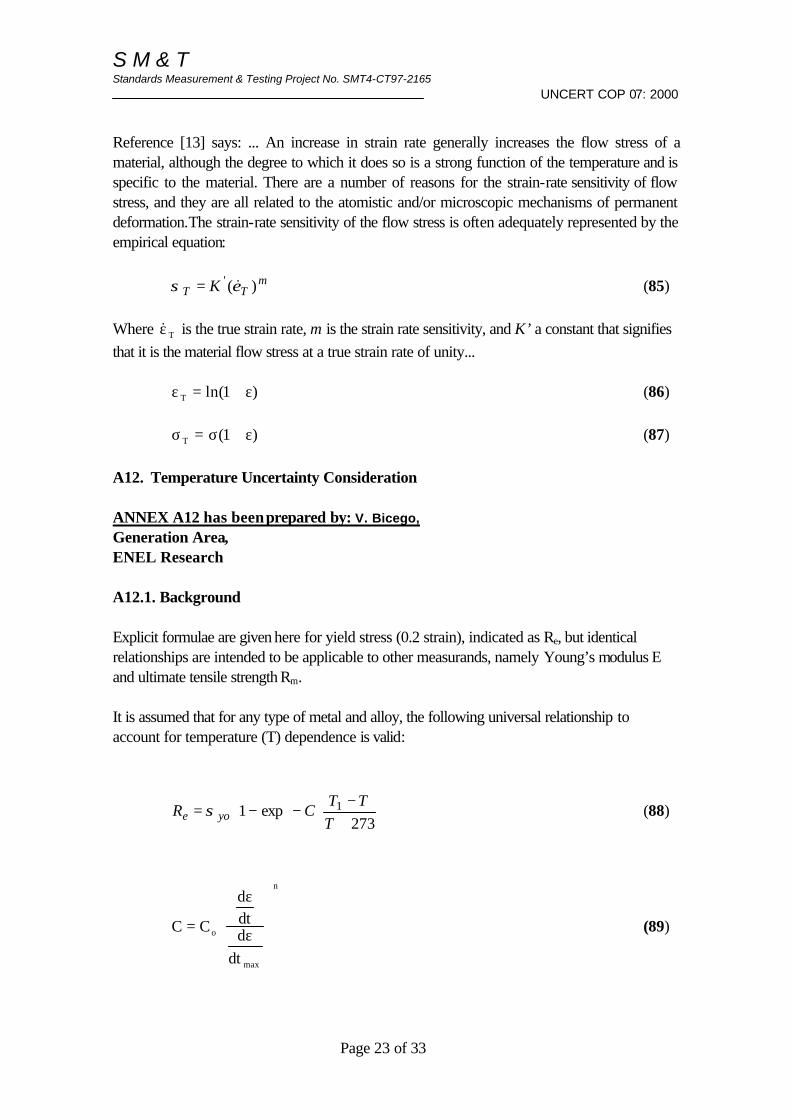
Reference [13] says: ... An increase in strain rate generally increases the flow stress of a material, although the degree to which it does so is a strong function of the temperature and is specific to the material. There are a number of reasons for the strain-rate sensitivity of flow stress, and they are all related to the atomistic and/or microscopic mechanisms of permanent deformation.The strain-rate sensitivity of the flow stress is often adequately represented by the empirical equation:
mTT K )(' εσ &= (85)
Where &ε T is the true strain rate, m is the strain rate sensitivity, and K’ a constant that signifies that it is the material flow stress at a true strain rate of unity...
ε εT = +ln( )1 (86)
σ σ εT = +( )1 (87) A12. Temperature Uncertainty Consideration ANNEX A12 has been prepared by: V. Bicego, Generation Area, ENEL Research A12.1. Background Explicit formulae are given here for yield stress (0.2 strain), indicated as Re, but identical relationships are intended to be applicable to other measurands, namely Young’s modulus E and ultimate tensile strength Rm. It is assumed that for any type of metal and alloy, the following universal relationship to account for temperature (T) dependence is valid:
+−−−=273
exp1 1
TTT
CR yoe σ (88)
C C
ddtd
dt
o
n
=
ε
ε
max
(89)
S M & T Standards Measurement & Testing Project No. SMT4-CT97-2165
UNCERT COP 07: 2000
Page 24 of 33
d
dtε
max is the max. strain rate allowed by the test standard code; e.g. 10-3s-1 (e.g. ASTM)
T is the test temperature, in °C σyo is a coefficient that needs not to be determined (as relative uncertainties are dicussed
below, not absolute uncertainties) n T, 1 and Co are numerical coefficients, whose values are reported below. A12.3. Uncertainty Evaluation Procedure This method provides values of uncertainties in tensile data due to temperature uncertainties, and is applicable to tests at room temperature and above for 4 classes of metals and alloys. The explicit coefficients contained in the uncertainty equations given here below have not been derived yet for other materials. No evaluation of uncertainties due to temperature uncertainties are necessary provided that the temperature and the strain rate limits indicated in the test standard procedure (e.g. ASTM) are followed, and provided the test temperature is lower than
300°C for iron and ferritic steels, 300°C for austenitic steels, 600°C for Ni and Ni base superalloys, 100°C for Aluminium and its alloys.
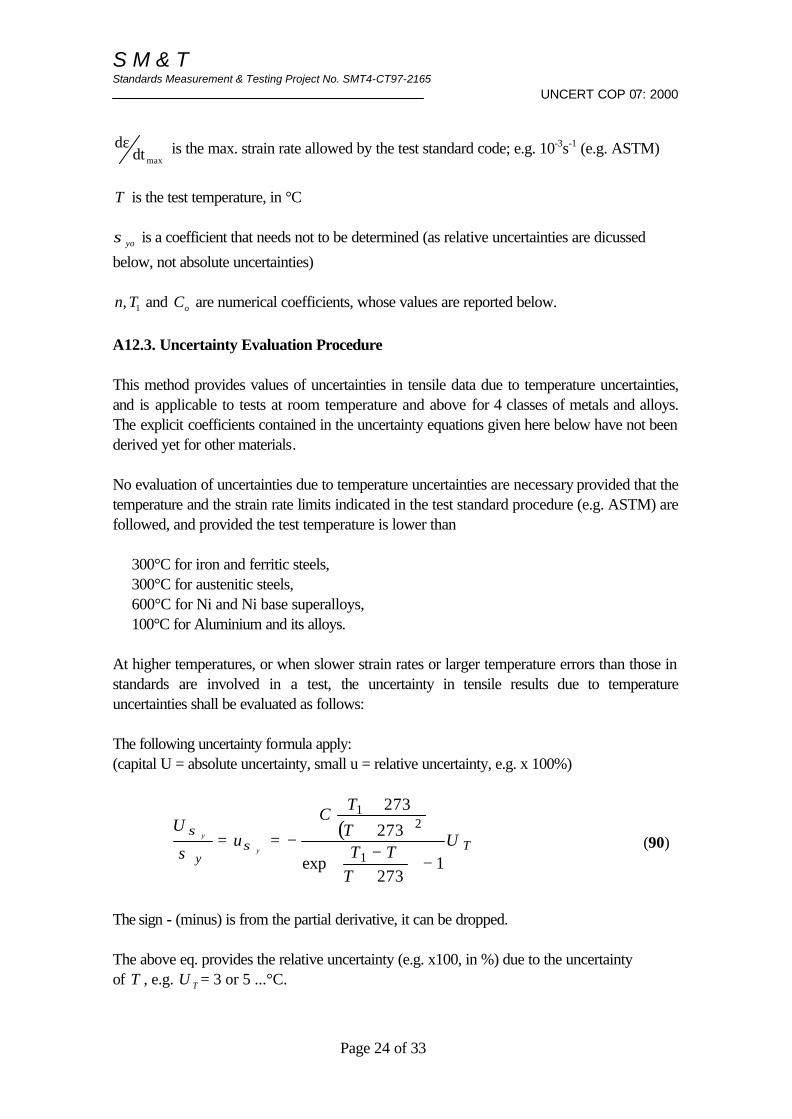
At higher temperatures, or when slower strain rates or larger temperature errors than those in standards are involved in a test, the uncertainty in tensile results due to temperature uncertainties shall be evaluated as follows: The following uncertainty formula apply: (capital U = absolute uncertainty, small u = relative uncertainty, e.g. x 100%)
( )T
yU
TTT
T
TC
uU
y
y
1273
exp
273
273
1
21
−
+−
++
−== σσ
σ (90)
The sign - (minus) is from the partial derivative, it can be dropped. The above eq. provides the relative uncertainty (e.g. x100, in %) due to the uncertainty of T , e.g. U T = 3 or 5 ...°C.
S M & T Standards Measurement & Testing Project No. SMT4-CT97-2165
UNCERT COP 07: 2000
Page 25 of 33
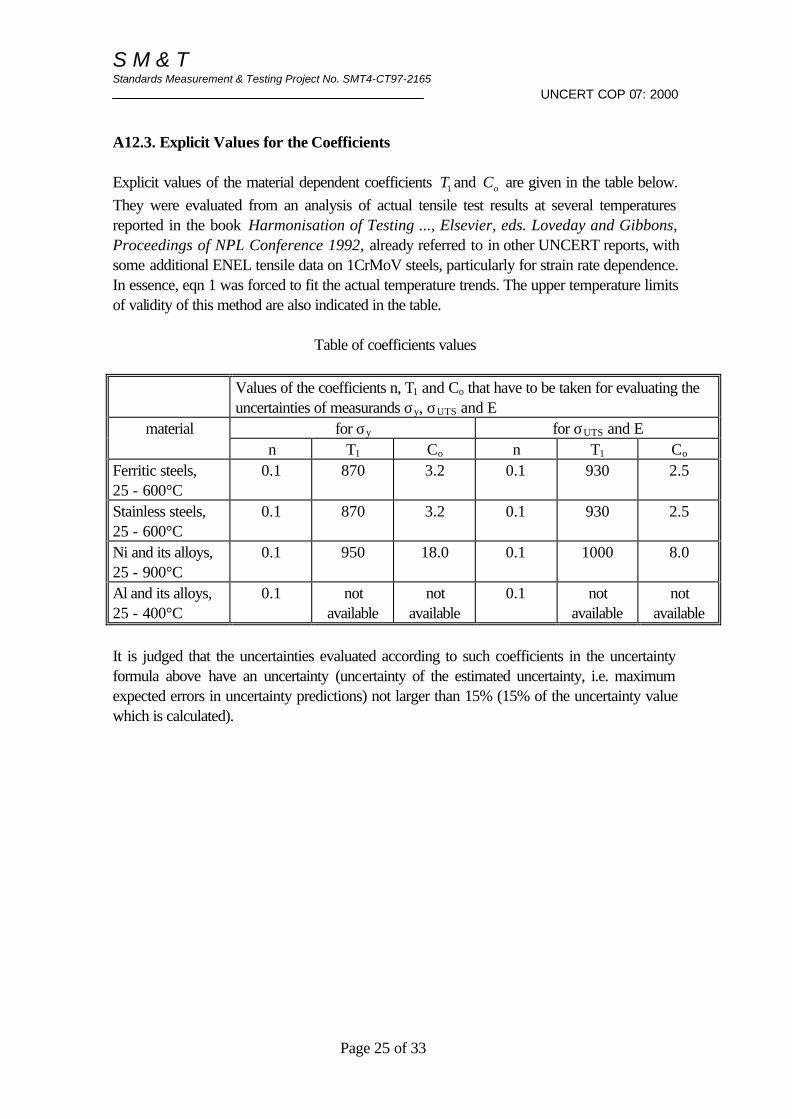
A12.3. Explicit Values for the Coefficients Explicit values of the material dependent coefficients T1 and Co are given in the table below. They were evaluated from an analysis of actual tensile test results at several temperatures reported in the book Harmonisation of Testing ..., Elsevier, eds. Loveday and Gibbons, Proceedings of NPL Conference 1992, already referred to in other UNCERT reports, with some additional ENEL tensile data on 1CrMoV steels, particularly for strain rate dependence. In essence, eqn 1 was forced to fit the actual temperature trends. The upper temperature limits of validity of this method are also indicated in the table.
Table of coefficients values
Values of the coefficients n, T1 and Co that have to be taken for evaluating the
uncertainties of measurands σy, σUTS and E for σy for σUTS and E material
n T1 Co n T1 Co Ferritic steels, 25 - 600°C
0.1 870 3.2 0.1 930 2.5
Stainless steels, 25 - 600°C
0.1 870 3.2 0.1 930 2.5
Ni and its alloys, 25 - 900°C
0.1 950 18.0 0.1 1000 8.0
Al and its alloys, 25 - 400°C
0.1 not available
not available
0.1 not available
not available
It is judged that the uncertainties evaluated according to such coefficients in the uncertainty formula above have an uncertainty (uncertainty of the estimated uncertainty, i.e. maximum expected errors in uncertainty predictions) not larger than 15% (15% of the uncertainty value which is calculated).
S M & T Standards Measurement & Testing Project No. SMT4-CT97-2165
UNCERT COP 07: 2000
Page 26 of 33
APPENDIX B
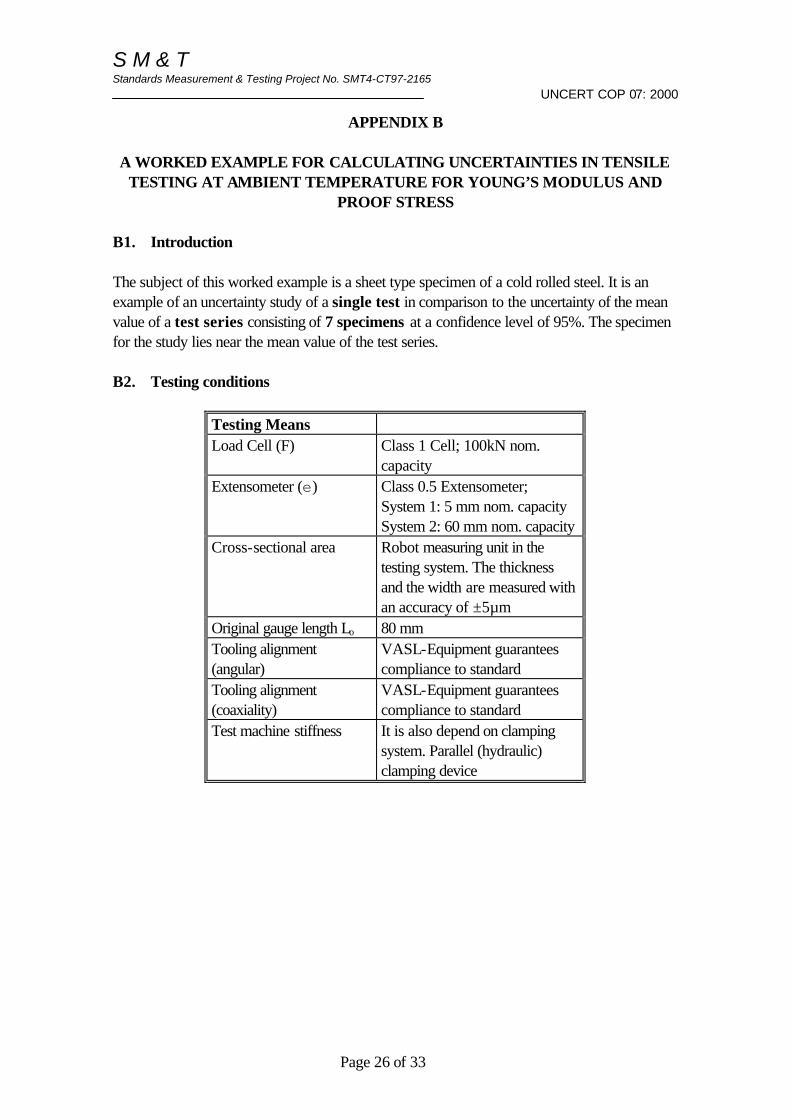
A WORKED EXAMPLE FOR CALCULATING UNCERTAINTIES IN TENSILE TESTING AT AMBIENT TEMPERATURE FOR YOUNG’S MODULUS AND
PROOF STRESS B1. Introduction The subject of this worked example is a sheet type specimen of a cold rolled steel. It is an example of an uncertainty study of a single test in comparison to the uncertainty of the mean value of a test series consisting of 7 specimens at a confidence level of 95%. The specimen for the study lies near the mean value of the test series. B2. Testing conditions
Testing Means Load Cell (F) Class 1 Cell; 100kN nom.
capacity Extensometer (e) Class 0.5 Extensometer;
System 1: 5 mm nom. capacity System 2: 60 mm nom. capacity
Cross-sectional area Robot measuring unit in the testing system. The thickness and the width are measured with an accuracy of ±5µm
Original gauge length Lo 80 mm Tooling alignment (angular)
VASL-Equipment guarantees compliance to standard
Tooling alignment (coaxiality)
VASL-Equipment guarantees compliance to standard
Test machine stiffness It is also depend on clamping system. Parallel (hydraulic) clamping device
S M & T Standards Measurement & Testing Project No. SMT4-CT97-2165
UNCERT COP 07: 2000
Page 27 of 33
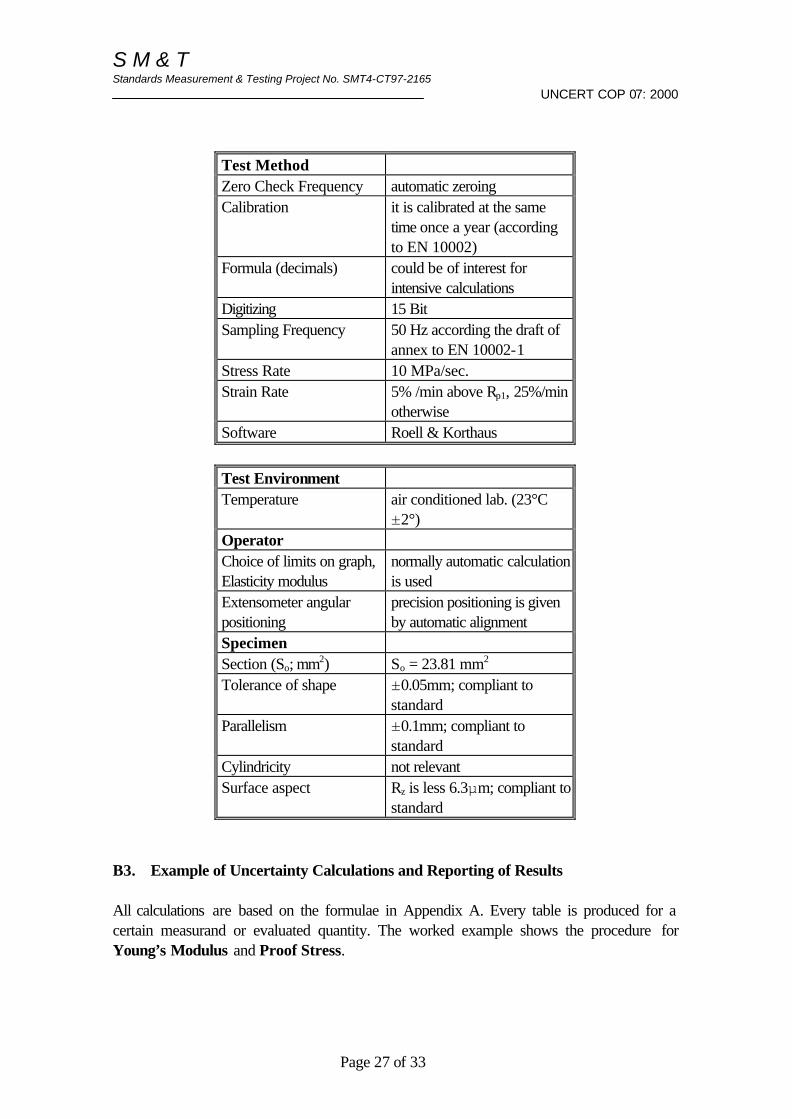
Test Method Zero Check Frequency automatic zeroing Calibration it is calibrated at the same
time once a year (according to EN 10002)
Formula (decimals) could be of interest for intensive calculations
Digitizing 15 Bit Sampling Frequency 50 Hz according the draft of
annex to EN 10002-1 Stress Rate 10 MPa/sec. Strain Rate 5% /min above Rp1, 25%/min
otherwise Software Roell & Korthaus
Test Environment Temperature air conditioned lab. (23°C
±2°) Operator Choice of limits on graph, Elasticity modulus
normally automatic calculation is used
Extensometer angular positioning
precision positioning is given by automatic alignment
Specimen Section (So; mm2) So = 23.81 mm2 Tolerance of shape ±0.05mm; compliant to
standard Parallelism ±0.1mm; compliant to
standard Cylindricity not relevant Surface aspect Rz is less 6.3µm; compliant to
standard B3. Example of Uncertainty Calculations and Reporting of Results All calculations are based on the formulae in Appendix A. Every table is produced for a certain measurand or evaluated quantity. The worked example shows the procedure for Young’s Modulus and Proof Stress.
S M & T Standards Measurement & Testing Project No. SMT4-CT97-2165
UNCERT COP 07: 2000
Page 28 of 33
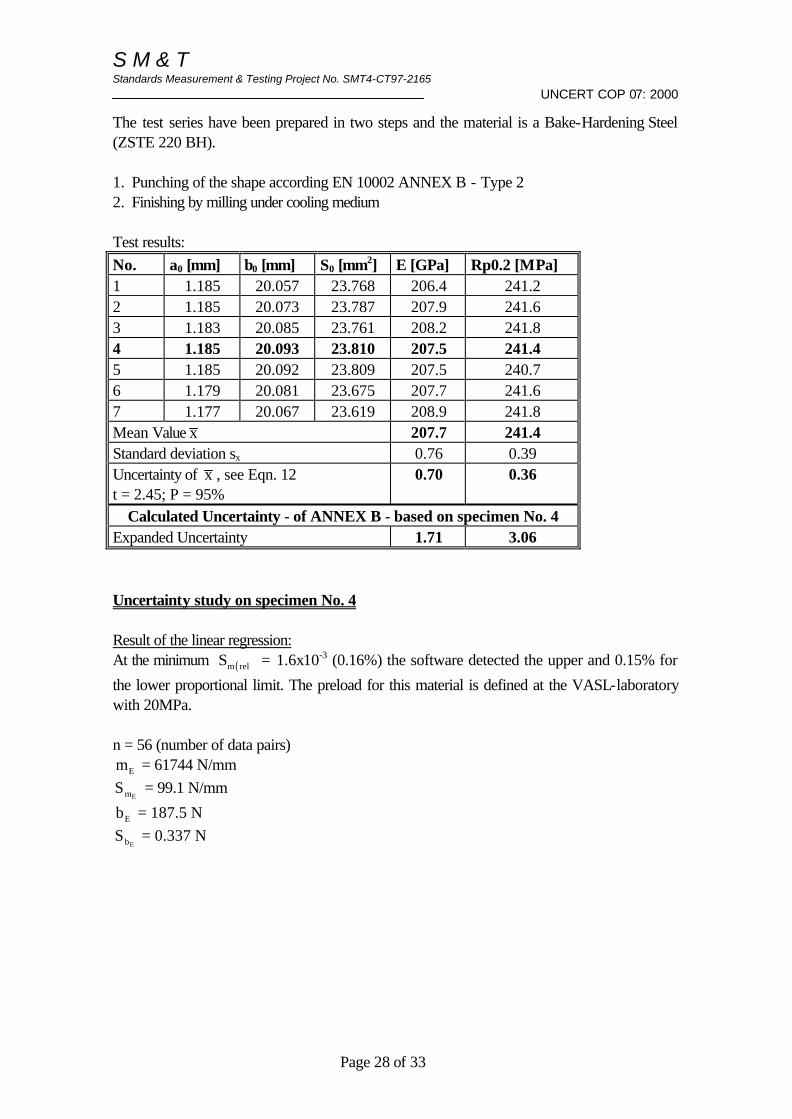
The test series have been prepared in two steps and the material is a Bake-Hardening Steel (ZSTE 220 BH). 1. Punching of the shape according EN 10002 ANNEX B - Type 2 2. Finishing by milling under cooling medium Test results: No. a0 [mm] b0 [mm] S0 [mm2] E [GPa] Rp0.2 [MPa] 1 1.185 20.057 23.768 206.4 241.2 2 1.185 20.073 23.787 207.9 241.6 3 1.183 20.085 23.761 208.2 241.8 4 1.185 20.093 23.810 207.5 241.4 5 1.185 20.092 23.809 207.5 240.7 6 1.179 20.081 23.675 207.7 241.6 7 1.177 20.067 23.619 208.9 241.8 Mean Value x 207.7 241.4 Standard deviation sx 0.76 0.39 Uncertainty of x , see Eqn. 12 t = 2.45; P = 95%
0.70 0.36
Calculated Uncertainty - of ANNEX B - based on specimen No. 4 Expanded Uncertainty 1.71 3.06
Uncertainty study on specimen No. 4 Result of the linear regression: At the minimum ( )relmS = 1.6x10⁻³ (0.16%) the software detected the upper and 0.15% for
the lower proportional limit. The preload for this material is defined at the VASL-laboratory with 20MPa. n = 56 (number of data pairs) mE = 61744 N/mm SmE
= 99.1 N/mm
bE = 187.5 N SbE
= 0.337 N
S M & T Standards Measurement & Testing Project No. SMT4-CT97-2165
UNCERT COP 07: 2000
Page 29 of 33
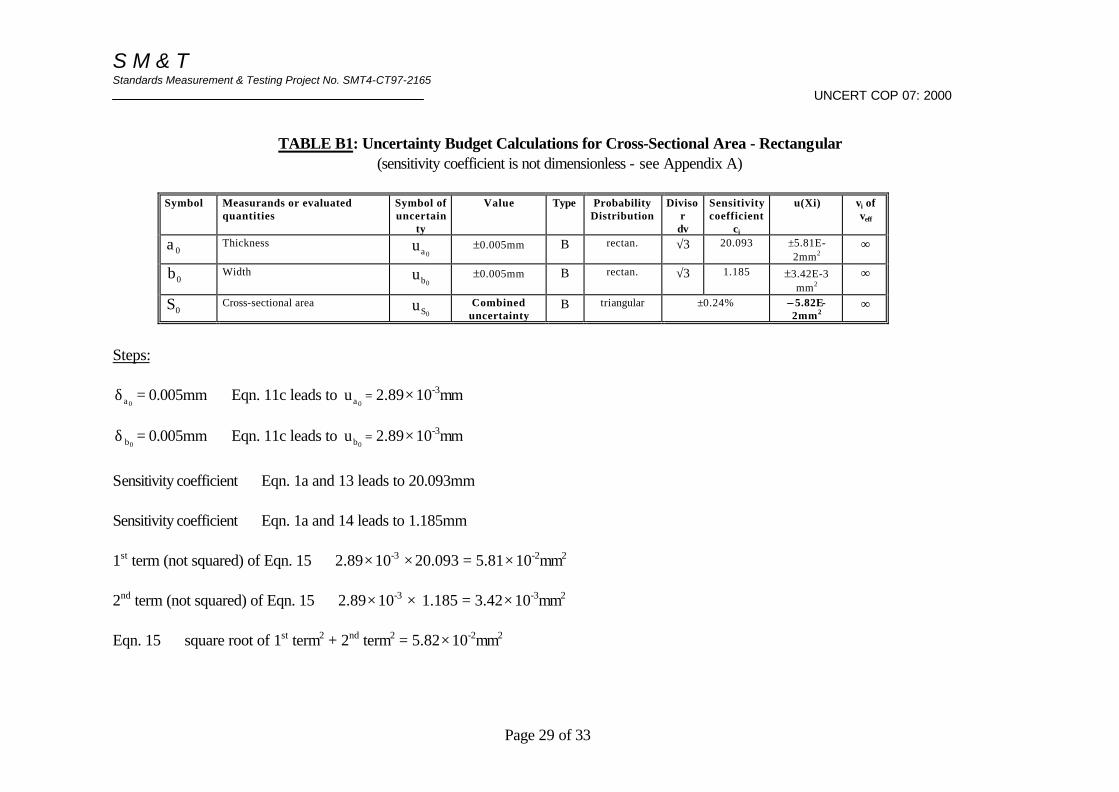
TABLE B1: Uncertainty Budget Calculations for Cross-Sectional Area - Rectangular
(sensitivity coefficient is not dimensionless - see Appendix A)
Symbol Measurands or evaluated quantities
Symbol of uncertain
ty
Value Type Probability Distribution
Divisor
dv
Sensitivity coefficient
ci
u(Xi) vi of veff
a 0 Thickness ua 0 ±0.005mm B rectan. √3 20.093 ±5.81E-
2mm2 ∞
b0 Width ub0 ±0.005mm B rectan. √3 1.185 ±3.42E-3
mm2 ∞
S0 Cross-sectional area uS0 Combined
uncertainty B triangular ±0.24% ±± 5.82E-
2mm2 ∞
Steps: δa 0
= 0.005mm ⇒ Eqn. 11c leads to ua 0= 2.89× 10⁻³mm
δ b0= 0.005mm ⇒ Eqn. 11c leads to ub0
= 2.89× 10⁻³mm
Sensitivity coefficient ⇒ Eqn. 1a and 13 leads to 20.093mm Sensitivity coefficient ⇒ Eqn. 1a and 14 leads to 1.185mm 1st term (not squared) of Eqn. 15 ⇒ 2.89× 10-3 × 20.093 = 5.81× 10⁻²mm2 2nd term (not squared) of Eqn. 15 ⇒ 2.89× 10-3 × 1.185 = 3.42× 10⁻³mm2 Eqn. 15 ⇒ square root of 1st term2 + 2nd term2 = 5.82× 10⁻²mm2
S M & T Standards Measurement & Testing Project No. SMT4-CT97-2165
UNCERT COP 07: 2000
Page 30 of 33
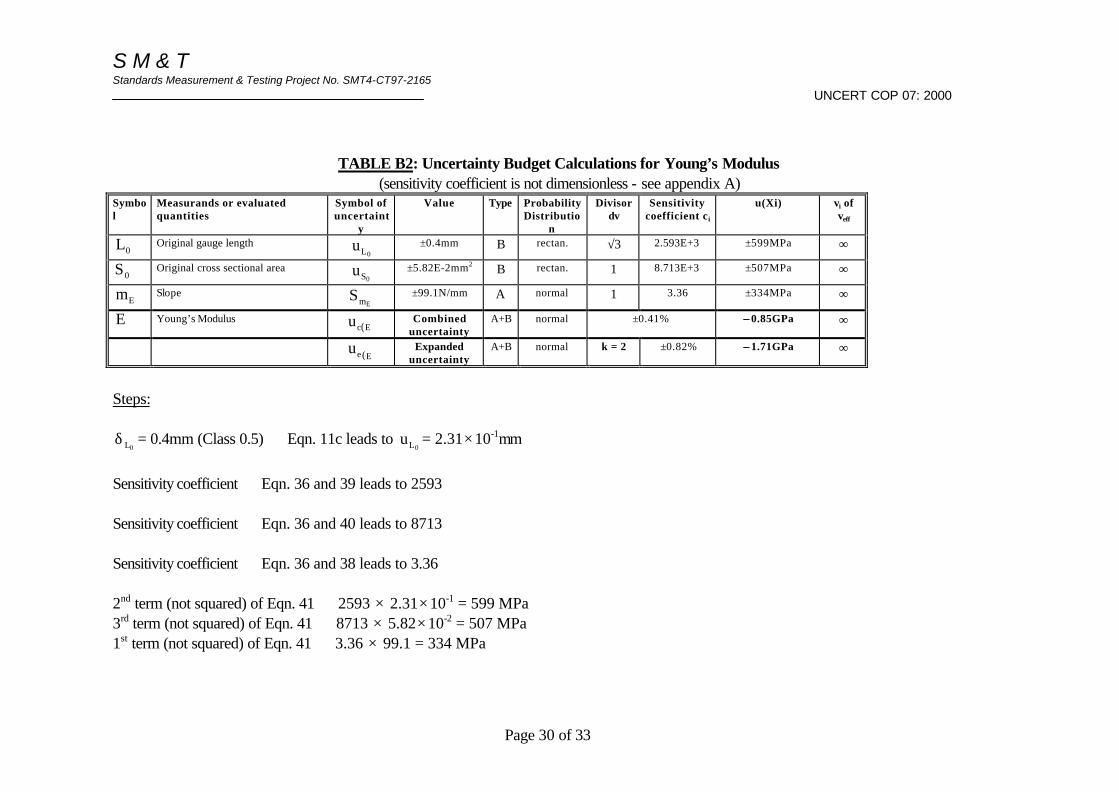
TABLE B2: Uncertainty Budget Calculations for Young’s Modulus (sensitivity coefficient is not dimensionless - see appendix A)
Symbol
Measurands or evaluated quantities
Symbol of uncertaint
y
Value Type Probability Distributio
n
Divisor dv
Sensitivity coefficient ci
u(Xi) vi of veff
L0 Original gauge length uL0 ±0.4mm B rectan. √3 2.593E+3 ±599MPa ∞
S0 Original cross sectional area uS0 ±5.82E-2mm2 B rectan. 1 8.713E+3 ±507MPa ∞
mE Slope SmE ±99.1N/mm A normal 1 3.36 ±334MPa ∞
E Young’s Modulus ( )uc E Combined
uncertainty A+B normal ±0.41% ±± 0.85GPa ∞
( )ue E
Expanded uncertainty
A+B normal k = 2 ±0.82% ±± 1.71GPa ∞
Steps: δ L0
= 0.4mm (Class 0.5) ⇒ Eqn. 11c leads to uL0= 2.31× 10⁻¹mm
Sensitivity coefficient ⇒ Eqn. 36 and 39 leads to 2593 Sensitivity coefficient ⇒ Eqn. 36 and 40 leads to 8713 Sensitivity coefficient ⇒ Eqn. 36 and 38 leads to 3.36 2nd term (not squared) of Eqn. 41 ⇒ 2593 × 2.31× 10-1 = 599 MPa 3rd term (not squared) of Eqn. 41 ⇒ 8713 × 5.82× 10-2 = 507 MPa 1st term (not squared) of Eqn. 41 ⇒ 3.36 × 99.1 = 334 MPa
S M & T Standards Measurement & Testing Project No. SMT4-CT97-2165
UNCERT COP 07: 2000
Page 31 of 33
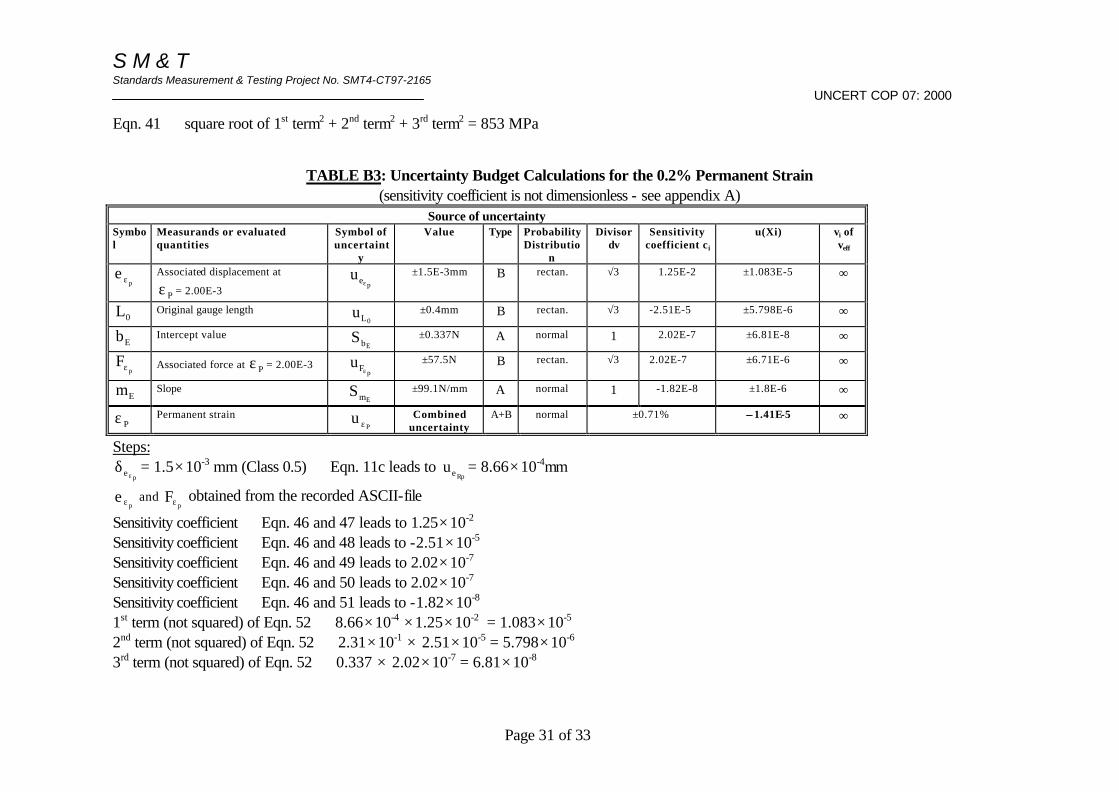
Eqn. 41 ⇒ square root of 1st term2 + 2nd term2 + 3rd term2 = 853 MPa
TABLE B3: Uncertainty Budget Calculations for the 0.2% Permanent Strain (sensitivity coefficient is not dimensionless - see appendix A)
Source of uncertainty Symbol
Measurands or evaluated quantities
Symbol of uncertaint
y
Value Type Probability Distributio
n
Divisor dv
Sensitivity coefficient ci
u(Xi) vi of veff
epε Associated displacement at
Pε = 2.00E-3 ue pε
±1.5E-3mm B rectan. √3 1.25E-2 ±1.083E-5 ∞
L0 Original gauge length uL0 ±0.4mm B rectan. √3 -2.51E-5 ±5.798E-6 ∞
bE Intercept value SbE ±0.337N A normal 1 2.02E-7 ±6.81E-8 ∞
Fpε Associated force at Pε = 2.00E-3 uF pε
±57.5N B rectan. √3 2.02E-7 ±6.71E-6 ∞
mE Slope SmE ±99.1N/mm A normal 1 -1.82E-8 ±1.8E-6 ∞
Pε Permanent strain P
u ε Combined uncertainty
A+B normal ±0.71% ±± 1.41E-5 ∞
Steps: δ
εe p= 1.5× 10⁻³ mm (Class 0.5) ⇒ Eqn. 11c leads to ue Rp
= 8.66× 10⁻⁴mm
epε and F
pε obtained from the recorded ASCII-file
Sensitivity coefficient ⇒ Eqn. 46 and 47 leads to 1.25× 10⁻² Sensitivity coefficient ⇒ Eqn. 46 and 48 leads to -2.51× 10⁻⁵ Sensitivity coefficient ⇒ Eqn. 46 and 49 leads to 2.02× 10⁻⁷ Sensitivity coefficient ⇒ Eqn. 46 and 50 leads to 2.02× 10⁻⁷ Sensitivity coefficient ⇒ Eqn. 46 and 51 leads to -1.82× 10⁻⁸ 1st term (not squared) of Eqn. 52 ⇒ 8.66× 10-4 × 1.25× 10-2 = 1.083× 10⁻⁵ 2nd term (not squared) of Eqn. 52 ⇒ 2.31× 10-1 × 2.51× 10-5 = 5.798× 10⁻⁶ 3rd term (not squared) of Eqn. 52 ⇒ 0.337 × 2.02× 10-7 = 6.81× 10⁻⁸
S M & T Standards Measurement & Testing Project No. SMT4-CT97-2165
UNCERT COP 07: 2000
Page 32 of 33
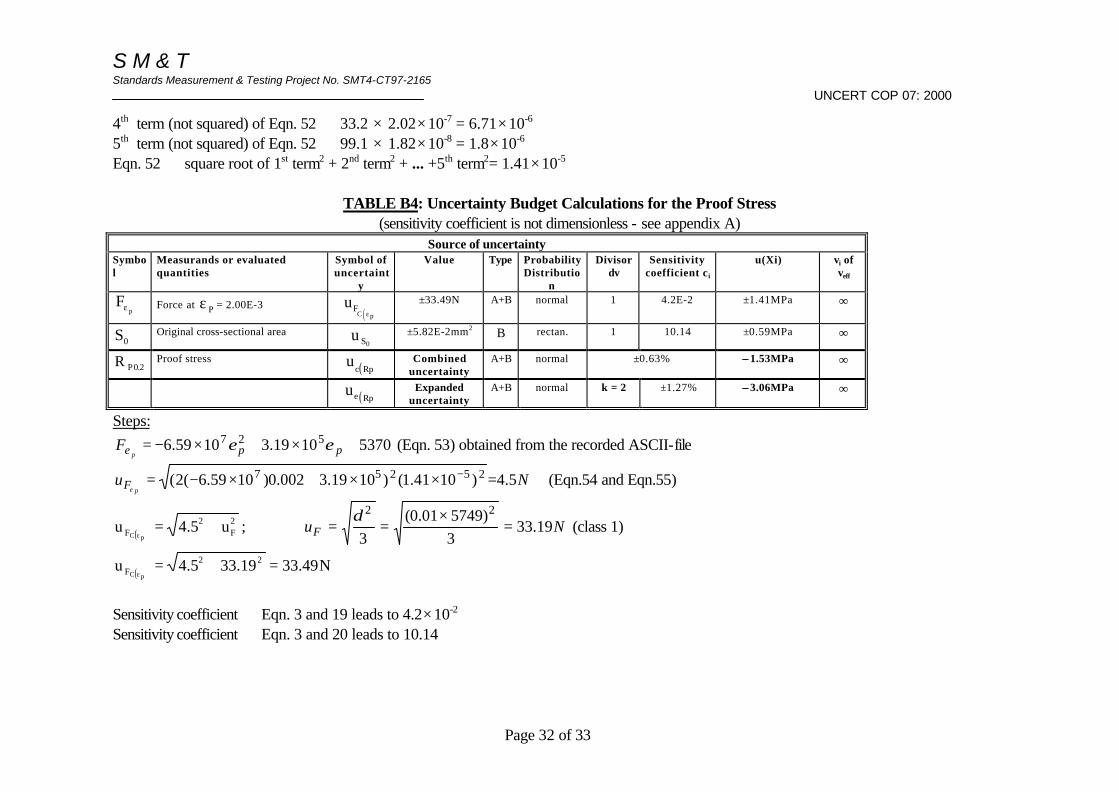
4th term (not squared) of Eqn. 52 ⇒ 33.2 × 2.02× 10-7 = 6.71× 10⁻⁶ 5th term (not squared) of Eqn. 52 ⇒ 99.1 × 1.82× 10-8 = 1.8× 10⁻⁶ Eqn. 52 ⇒ square root of 1st term2 + 2nd term2 + ... +5th term2= 1.41× 10⁻⁵
TABLE B4: Uncertainty Budget Calculations for the Proof Stress (sensitivity coefficient is not dimensionless - see appendix A)
Source of uncertainty Symbol
Measurands or evaluated quantities
Symbol of uncertaint
y
Value Type Probability Distributio
n
Divisor dv
Sensitivity coefficient ci
u(Xi) vi of veff
Fpε Force at Pε = 2.00E-3
( )uF
C pε ±33.49N A+B normal 1 4.2E-2 ±1.41MPa ∞
0S Original cross-sectional area 0Su ±5.82E-2mm2 B rectan. 1 10.14 ±0.59MPa ∞
2.0PR Proof stress ( )u
c Rp Combined
uncertainty A+B normal ±0.63% ±± 1.53MPa ∞
( )ue Rp
Expanded uncertainty
A+B normal k = 2 ±1.27% ±± 3.06MPa ∞
Steps:
53701019.31059.6 527 +×+×−= pppF εεε (Eqn. 53) obtained from the recorded ASCII-file
NupF 5.4)1041.1()1019.3002.0)1059.6(2( 25257 =××+×−= −
ε (Eqn.54 and Eqn.55)
( )2F
2F u5.4u
pC+=
ε; NuF 19.33
3)574901.0(
3
22
=×
==δ
(class 1)
( ) N49.3319.335.4u 22F pC
=+=ε
Sensitivity coefficient ⇒ Eqn. 3 and 19 leads to 4.2× 10⁻² Sensitivity coefficient ⇒ Eqn. 3 and 20 leads to 10.14
S M & T Standards Measurement & Testing Project No. SMT4-CT97-2165
UNCERT COP 07: 2000
Page 33 of 33
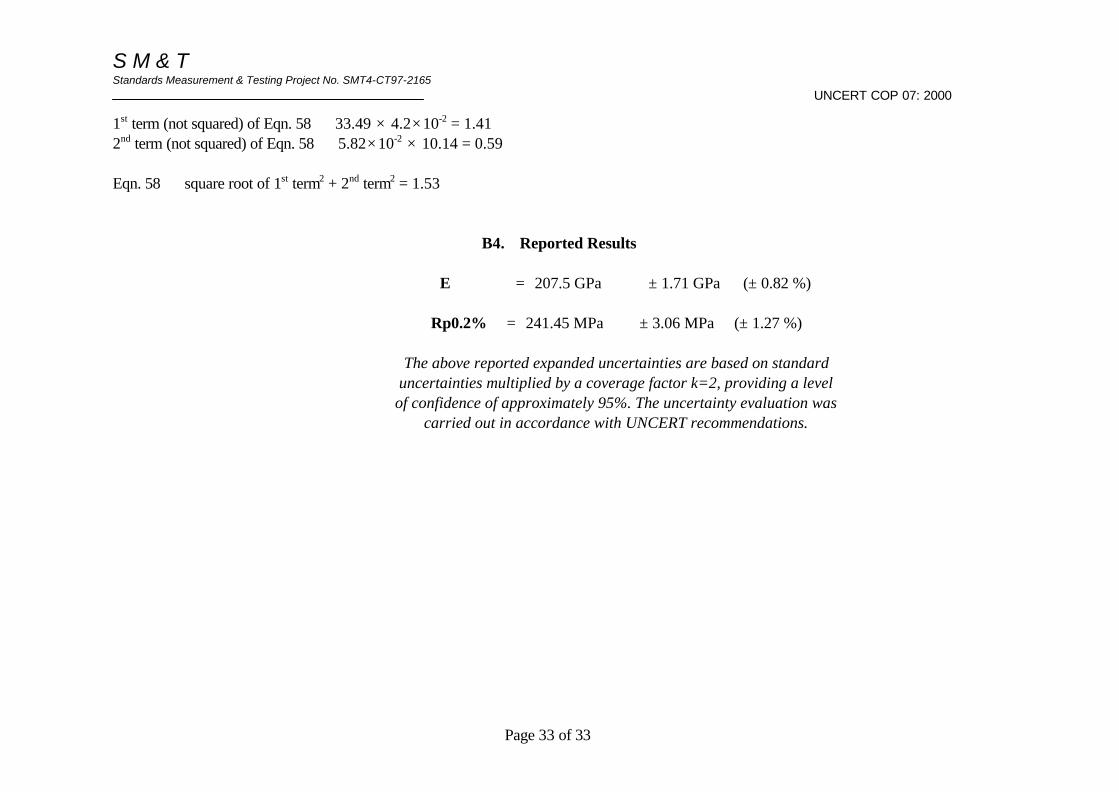
1st term (not squared) of Eqn. 58 ⇒ 33.49 × 4.2× 10-2 = 1.41 2nd term (not squared) of Eqn. 58 ⇒ 5.82× 10-2 × 10.14 = 0.59 Eqn. 58 ⇒ square root of 1st term2 + 2nd term2 = 1.53
B4. Reported Results
E = 207.5 GPa ± 1.71 GPa (± 0.82 %)
Rp0.2% = 241.45 MPa ± 3.06 MPa (± 1.27 %)
The above reported expanded uncertainties are based on standard uncertainties multiplied by a coverage factor k=2, providing a level of confidence of approximately 95%. The uncertainty evaluation was
carried out in accordance with UNCERT recommendations.