Embed Size (px)
Citation preview

THE D I E L E C T R I C FAILURE MECHANISM OF A
H I G H VOLTAGE FEEDTHROUGH
by
Robert C . H a l l
Submitted i n P a r t i a l F u l f i l l m e n t of t h e Requirements
f o r t h e Degree of
Master of Science
i n t h e
E l e c t r i c a l Engineer ing
Program
Dean of t h e Graduate School Date
YOUNGSTOWN STATE UNIVERSITY
December, 1987

ABSTRACT
THE DIELECTRIC FAILURE MECHANISM OF A
HIGH VOLTAGE FEEDTHROUGH
Robert C. Hall
Master of Science
Youngstown State University, 1987
This paper summarizes the investigation into a series
of dielectric failures that occurred in the high voltage feed-
through of an electrostatic spray painting system. The feed-
through, or well, is where the high voltage cable interfaces
to the high voltage power supply. Each well failed by forming
conductive, carbon paths, called arc-tracks, along its surface.
These arc-tracks bridge the distance between the high voltage
electrode and ground.
This paper evaluates the field evidence and discusses
the relevant literature. The distinctions between solid di-
electric breakdown and surface arc-tracking are presented and
discussed. A series of experiments is run to determine the
necessary conditions for the formation of arc-tracks. Finally,.
possible solutions are evaluated and the final solution is
presented.

iii
TABLE O F CONTENTS
A B S T R A C T . . . . . . . . . . . . . . . . . . . . ,
TABLE O F CONTENTS . . . . . . . . . . , . . , , . . L I S T OF SYMBOLS . . . . . . . . , , , , , , , ,
L I S T OF F I G U R E S . . . . . . . . , . , . , , , . . L I S T OF TABLES . . . . . . . , . , , , . . , . . ,
CHAPTER
I . I N T R O D U C T I O N . . . . . . . . . . . . . . . . 11. S O L I D D I E L E C T R I C BREAKDOWN . . . . . . , , .
111. SURFACE DISCHARGES AND ARC-TRACKING . . . . I V . EXPERIMENTAL R E S U L T S . . . . . . . . , , . ,
E x p e r i m e n t 1 . . . . . . . . . . . . . . ,
E x p e r i m e n t 2 . . . . . . . , . , , . . , . E x p e r i m e n t 3 . . . . . . . , . , , , . . ,
V . D I S C U S S I O N O F R E S U L T S . . . . , , . , , , ,
V I . SOLIJTIONS . . . , . , , . , , . . . . . ,
A P P E N D I X A. E x p e r i m e n t a l Procedures , . , , . , . . B I B L I O G R A P H Y . . . . . , . , . . , . , . . , , , ,
PAGE
ii
iii
i v
V
v i

LIST QF SYMBOLS
SYMBOL
e Elec t ron ic charge
E E l e c t r i c f i e l d i n t e n s i t y
i ( E ) I n j e c t i o n cur ren t
i~ Thermionic cu r ren t
I Current
J Current dens i ty
k Boltzmann' s constant
n E lec t ron volume dens i ty
91 Linear charge dens i ty
r Radius
T Temperature
v Average e l e c t r o n v e l o c i t y
V Voltage
6 Rela t ive d i e l e c t r i c constant
,& Elec t ron mobi l i ty
9 R e s i s t i v i t y
5 C onduct iv i ty
4 Work funct ion
UNITS OR REFERENCE
A
~ / m ~ or i in^ ~ V / K
-2 m
C/inch
inch
none
2 m /vol t -sec
A-m o r n - i n c h

LIST OF FIGURES
FIGURE PAGE
1 . Block Diagram of E l e c t r o s t a t i c System . . . . . . . 2
2 . High Voltage Cable Cross S e c t i o n . . . . . . 5
3 . E l e c t r o s t a t i c Power Supply Block Diagram . . . . 7
4 . M u l t i p l i e r Assembly . . . . . . . . . . . . . . . . 9
5. Cross S e c t i o n of High Voltage Feedthrough o r Well . 10
6 . Sample Arc- tracked Wells from E l e c t r o s t a t i c U n i t s . . . . . . . . . . . . . . . . . . . . i n F i e l d 12
7 . Ground I n s u l a t i o n F a i l u r e Under Transformer . . . . . . . . . . . . . . . . . . . . Windings 28
8 . Surface Flashover i n Shee t I n s u l a t i o n T e s t . . . . 28
9 . T e s t S e t Up f o r Experiment 1 . . . . . . . . . . . 45
10 . T e s t S e t Up f o r Experiment 2 . . . . . . . . . . . 48
11 . Arc- tracked Wells from Experiment 2. A f t e r Moisture App l i ca t ion . . . . . . . . . . . . . . . . . . . 51
1 2 . Sample Glass-melamine Wells from Experiment 3 . . . 53
.

LIST OF TABLES
TABLE PAGE
1. Summary of Arc Discharge S e v e r i t y Levels . . . 30
2 . Summary of ASTM T e s t s f o r Arc and Track Res i s- tance . . . . . . . . . . . . . . . . , . . 33
3. Summary of Cable End Contamination Used i n E x- p e r i m e n t 2 . . . . . . . . . . . . . . . . . 47
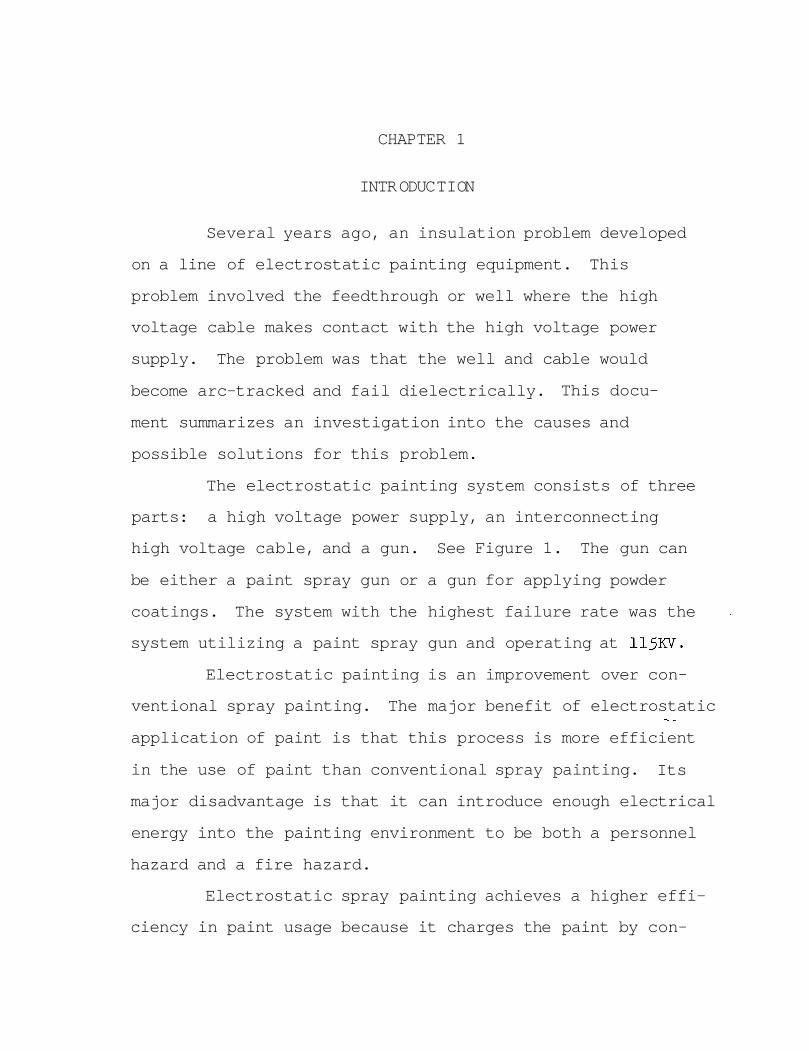
CHAPTER 1
INTR ODUC TI ON
Several years ago, an insulation problem developed
on a line of electrostatic painting equipment. This
problem involved the feedthrough or well where the high
voltage cable makes contact with the high voltage power
supply. The problem was that the well and cable would
become arc-tracked and fail dielectrically. This docu-
ment summarizes an investigation into the causes and
possible solutions for this problem.
The electrostatic painting system consists of three
parts: a high voltage power supply, an interconnecting
high voltage cable, and a gun. See Figure 1. The gun can
be either a paint spray gun or a gun for applying powder
coatings. The system with the highest failure rate was the -
system utilizing a paint spray gun and operating at 115KV.
Electrostatic painting is an improvement over con-
ventional spray painting. The major benefit of electrostatic - -
application of paint is that this process is more efficient
in the use of paint than conventional spray painting. Its
major disadvantage is that it can introduce enough electrical
energy into the painting environment to be both a personnel
hazard and a fire hazard.
Electrostatic spray painting achieves a higher effi-
ciency in paint usage because it charges the paint by con-


duct ion. The e l e c t r i c charge, together with the e l e c t r i c
f i e l d developed from the charging e lec t rode on t h e spray
gun t o the grounded piece t o be pa in ted , fo rces the charged
pa in t p a r t i c l e s t o be a t t r a c t e d t o the piece t o be pa in ted .
Thus t h e p a i n t doesn ' t g e t blown p a s t t h e piece t o be pa in ted .
Even p a i n t p a r t i c l e s t h a t do t r a v e l pas t t h e piece t o be
painted s t i l l can fol low t h e f i e l d l i n e s t o t he back of
the p iece . This e f f e c t o f pa in t ing t h e back s i d e of the
piece i s termed " e l e c t r o s t a t i c wrap."
The increase i n pa in t ing e f f i c i e n c y means t h a t more
of the p a i n t t h a t i s sprayed from the gun reaches t h e piece
t o be pa in ted . Typical e f f i c i e n c i e s f o r conventional spray
a p p l i c a t i o n s range from 20% t o 40%. With e l e c t r o s t a t i c s ,
e f f i c i e n c i e s range from 60% t o over 90%. 1
The higher e f f i c i e n c y r e s u l t s i n reduced p a i n t con-
sumption and an immediate c o s t savings. However, t h i s
increased e f f i c i e n c y a l s o produces s e v e r a l i n d i r e c t ben-
e f i t s . Since l e s s pa in t i s used, l e s s o v e r a l l so lven t i s
used. This he lps a p lan t s t a y wi th in so lvent emission
l i m i t s . The increased e f f i c i e n c y a l s o means t h e r e i s l e s s . . .
p a i n t overspray t h a t can c o l l e c t on the spray booth and
the conveyor. A reduct ion i n overspray a l s o means a r e -
duct ion i n cleanup c o s t s ,
I Gerald L. Schneberger, Understanding P a i n t and Pa in t ing Processes (Wheaton, I l l i n o i s : Hitchcock Publishing Company, 1979) , p. 1 C .

The major drawback assoc ia ted with e l e c t r o s t a t i c
spray pa in t ing i s the in t roduc t ion o f e l e c t r i c energy i n t o
the hazardous atmosphere of the spray a r e a . The high vol-
tage e l e c t r o s t a t i c s can c o n s t i t u t e both a danger t o person-
n e l ( a s a shock hazard) and an i g n i t i o n source.
Every e l e c t r o s t a t i c system has a high capaci tance
t o ground. I t i s the r e l e a s e of t h e energy s t o r e d i n t h i s
capaci tance t h a t can cause shocks t o personnel or t h a t can
produce a spark s u f f i c i e n t t o i g n i t e so lvent vapors . The
e l e c t r o s t a t i c system s tud ied here has d i s c r e t e r e s i s t o r s
spaced along t h e length of the cable and i n s i d e the spray
gun, These r e s i s t o r s serve t o l i m i t t h e r e l e a s e of
energy from the ground capaci tance when the gun 's charging
e lec t rode becomes grounded. These r e s i s t o r s l i m i t t h e
energy such t h a t t h i s e l e c t r o s t a t i c system cannot harm
personnel nor i g n i t e so lvent vapors.
The high vol tage cable t h a t connects the gun t o
the power supply i s a coax ia l , polyethylene cab le . See
Figure 2 . The outs ide diameter of the polyethylene i s
,375". A copper ground b r a i d surrounds the polyethylene . .
and a b lue polyurethane jacket surrounds t h e ground byaid
f o r abras ion and chemical r e s i s t a n c e . The conductor of
the cable i s made up o f d i s c r e t e 20M r e s i s t o r s equal ly
spaced along the length . The r e s i s t o r s a r e connected by
a carbon-loaded, conductive PVC tubing . The outs ide
diameters of the tubing and of the r e s i s t o r s a r e equal .
A s mentioned previously, the purpose of the r e s i s t o r s i s


t o l i m i t t he discharge energy de l ivered t o the gun t i p ,
if t h e gun should become grounded. This i s a s a f e t y mea-
sure t h a t makes the system s a f e t o operate i n t h e so lvent -
r i c h , hazardous atmosphere i n a pa in t spray booth.
I n order t o make the t r a n s i t i o n from the cable t o
the high vol tage power supply, the ground b r a i d i s removed
from both ends of t he cable and i s terminated t o female
b rass f i t t i n g s . This f e a t u r e allows the cable ends t o be
i n s e r t e d i n t o the power supply and i n t o the gun and s t i l l
maintain s u f f i c i e n t d i s t ance from the t i p o f the cable t o
ground. The t i p conta ins a b rass contac t t ack .
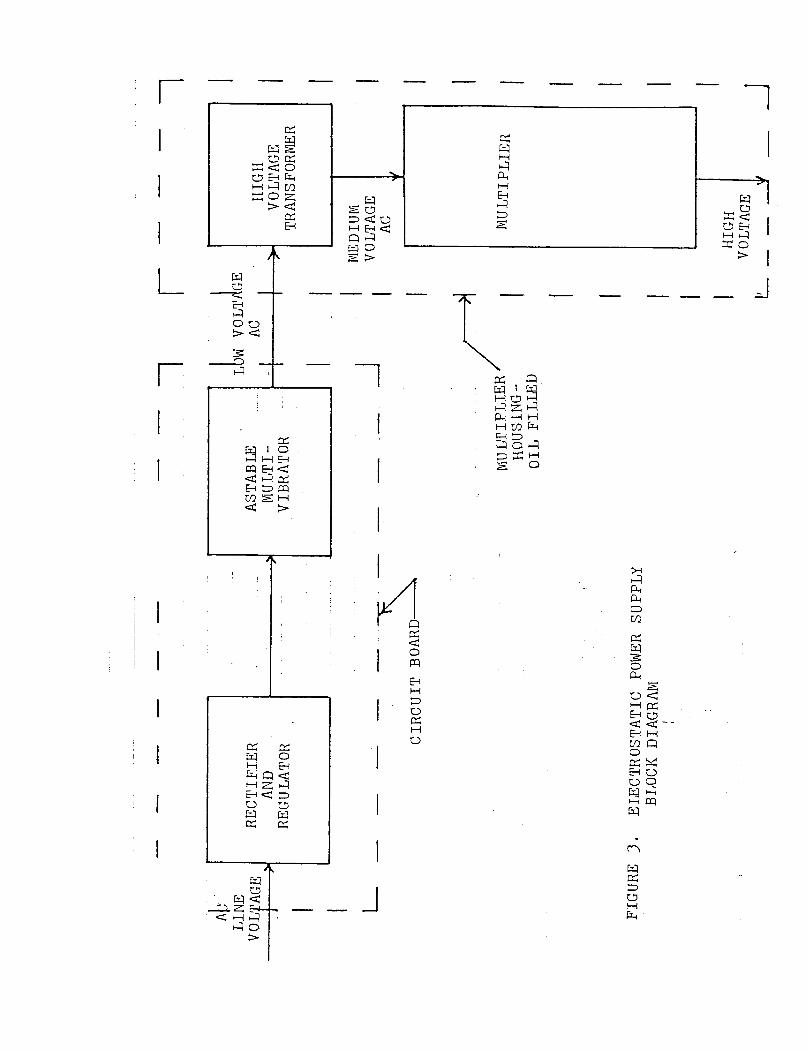
The high-voltage power supply i s of an a l l s o l i d -
s t a t e design and c o n s i s t s of a p r in ted c i r c u i t board, a
high vol tage t ransformer, and a Cockroft-Watson vol tage
m u l t i p l i e r . See Figure 3. The f i r s t ha l f o f t h e p r in ted
c i r c u i t board accepts a low AC vo l t age , r e c t i f i e s i t , and
r e g u l a t e s the r e s u l t i n g DC vo l t age . The r e g u l a t o r output
i s a d j u s t a b l e t o between 10 and 1 5 V . The second half of
t h e p r in ted c i r c u i t board t akes the DC vol tage and uses
an a s t a b l e mul t iv ib ra to r switching c i r c u i t t o produce a . .
5 KHz square wave. This square wave i s s e n t t o the high
vol tage t ransformer.
The high vol tage t ransformer s t e p s the vol tage up
t o 14 KV and sends the high vol tage square wave t o the
m u l t i p l i e r c i r c u i t .
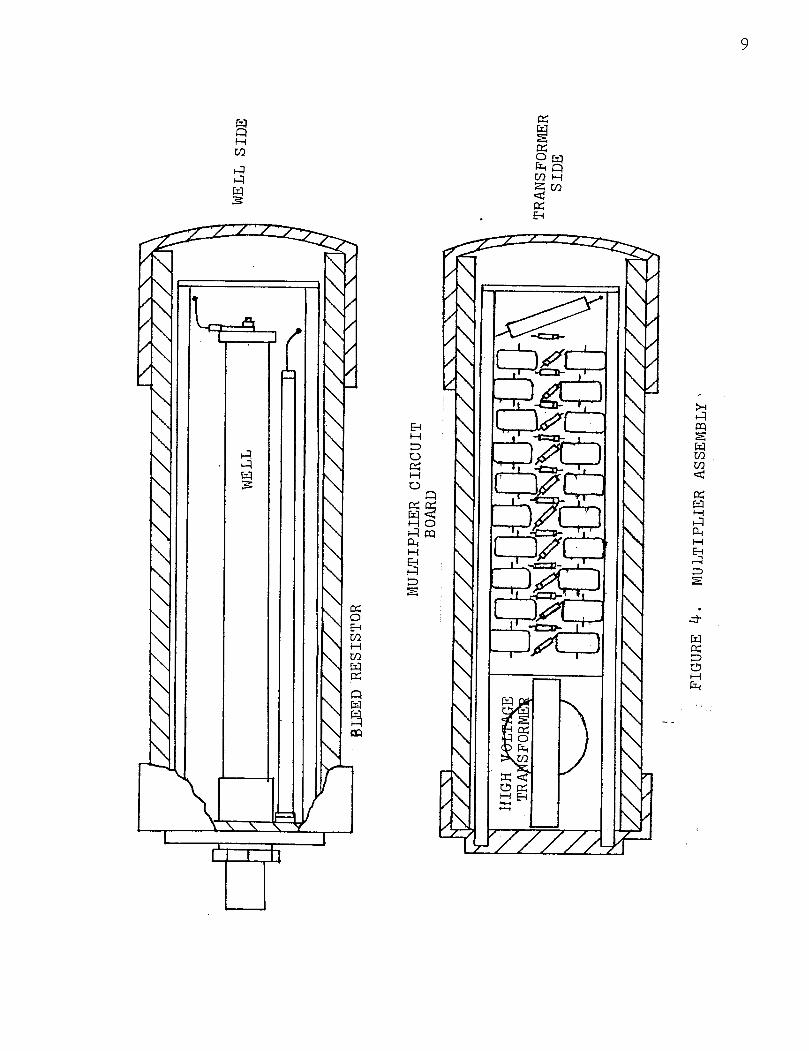
The m u l t i p l i e r c i r c u i t i s a s e r i e s of diode-capaci-
t o r doubling c i r c u i t s i n a cascade arrangement. Each of
the t e n s t ages approximately doubles the inpu t vo l t age .

The multiplier circuit also rectifies the input square
wave so that the multiplier's output is a negative 115KVDC.
A bleed off resistor of 17Gfkshunts the high voltage out-
put to discharge the capacitors when the unit is switched
off.
The polarity of the output voltage of the multi-
plier is determined by the orientation of the diodes.
While a positive voltage could have just as easily been
produced, negative voltage has historically been used in
electrostatic painting applications. 2
Both the high voltage transformer and the multi-
plier are immersed in insulating, transformer oil. The
assembly of the transformer and the multiplier are inside
a cylindrical PVC pipe. See Figure 4.
To accommodate the connection to the high voltage
cable, a dry well is inserted through the bottom end of
the multiplier. The well is also made of PVC and has an
inside diameter only slightly larger (.40625") than the
outside diameter of the cable. The top or high voltage
end of the well has a steel spring to make contact with - -
the cable end and to compensate for small variations in
the length of the cable end. The bottom or ground end
of the well has a brass threaded adapter that connects
to the ground braid of the cable as well as to an earth
ground. See Figure 5.
L Schneberger, p. 75.

THREADED ADAPTER CONTACT S P R I N G
. ( H I G H VOLTAGE ELECTRODE) \
1 PVC COUPLING
CROSS S E C T I O N OF H I G H VOLTAGE WEDTHROUGH OR WELL

The i n s u l a t i o n problem began showing up i n f i e l d
u n i t s i n the f a l l of 1980, about nine months a f t e r the
l l j K V system was f i r s t introduced f o r s a l e . I t was f i r s t
noted a s a high cur ren t condi t ion (7160 microamps) on the
power supply ' s microammeter and a corresponding drop i n
the vol tage a t the t i p of t h e gun. The power supply,
cable , and gun a r e designed t o have high e f f e c t i v e r e s i s -
tances . Therefore, with a cu r ren t t h i s high, t h e vol tage
a t t h e gun t i p , a v a i l a b l e t o charge t h e p a i n t , was essen-
t i a l l y zero.
The cause of t h i s high cur ren t draw turned out t o
be cu r ren t on t h e i n s i d e su r face of the we l l and the su r-
face of the cable end i n s i d e the we l l . Both o f these
su r faces were normally e x c e l l e n t i n s u l a t o r s .
I n the l e s s severe cases , when the cable was r e -
moved and the high vol tage was turned on, v i s i b l e and
audib le a r c i n g i n s i d e the we l l was not iced . Often these
a r c s were of s u f f i c i e n t i n t e n s i t y and dura t ion t o r e g i s t e r
on t h e power s u p p l i e s ' microammeter.
I n the more severe cases , the cable had become s o . .
d i s t o r t e d t h a t it could no t be removed from t h e w e l l - -
through t h e threaded adap te r . A l s o , once t h e cable was
f i n a l l y removed, and the high vol tage was switched on, t h e
microammeter ind ica ted a dead s h o r t . The c u r r e n t e a s i l y
flowed down t h e su r face of t h e we l l with no a r c i n g . See
Figure 6.

This paper . - w i l l review t h e p e r t i n e n t l i t e r a t u r e
on s o l i d d i e l e c t r i c s and t h e experiments r u n t o g a i n
i n s i g h t t o t h e w e l l f a i l u r e mechanism. It w i l l a l s o de-
ve lop t h e cause of t h e w e l l f a i l u r e and d i s c u s s s e v e r a l
p o s s i b l e a l t e r n a t i v e s o l u t i o n s , as w e l l as t h e s o l u t i o n
f i n a l l y implemented.

CHAPTER I1
SOLID DLELECTRIC BREAKDOWN
Breakdown of a l l d i e l e c t r i c s , s o l i d , l i q u i d s , and
g a s e s , has been of i n t e r e s t eve r s i n c e t h e r i s e of t h e
e l e c t r i c power i n d u s t r y i n t h e end of t h e l a s t cen tu ry .
The va r ious i n v e s t i g a t i o n s i n t o t h i s a r e a have t aken
many d i f f e r e n t approaches . Some of t hese have been s t r i c t l y
e m p i r i c a l , whi le o t h e r s have been t h e o r e t i c a l . S o l i d
i n s u l a t i o n , i n p a r t i c u l a r , has been t h e most d i f f i c u l t
a r e a i n which t o develop a theo ry of d i e l e c t r i c break-
down. There a r e many d i f f e r e n t mechanisms of s o l i d d i -
e l e c t r i c breakdown and many v a r i a b l e s t h a t have a n e f f e c t
on each mechanism. The fo l lowing i s meant t o be only a
g e n e r a l i n t r o d u c t i o n t o t h e s u b j e c t of s o l i d d i e l e c t r i c
breakdown. -
S o l i d i n s u l a t i o n s come i n a wide v a r i e t y of s t r u c -
t u r e s and chemical make-up. The h igh ly s t r u c t u r e d c r y s t a l s
of t h e a l k a l i - h a l i d e s ( such as sodium c h l o r i d e and potassium - -
c h l o r i d e ) have been t h e s u b j e c t of much t h e o r e t i c a l and
exper imental work. Yet t h e conc lus ions reached here a r e
n o t e a s i l y t r a n s f e r r e d t o t h e r e a l world i n s u l a t i o n s , j u s t
as t h e a l k a l i - h a l i d e s themselves have no a p p l i c a t i o n i n
t h e p r a c t i c a l world of e l e c t r i c a l i n s u l a t i o n . The r e a l
world i n s u l a t i o n s tend t o be of amorphous molecular s t r u c -
t u r e s and of vary ing degrees of p u r i t i e s . They t end t o

be of a wide variety of chemical compositions, from the -.
inorganics, such as mica or the various glasses, to the
organic polymers such as polyethylene.
The experimental work that is used to study con-
duction and breakdown in these insulations also presents
many problems. First, there is the type of voltage to be
used, d.c., power frequency, high frequency, or impulse
waveforms of various shapes. The time of application
changes the breakdown strength, as does the rate of rise
of the voltage. Conduction can decay with time and can
also be field dependent as different charge carriers move
at different rates and react to different field strengths.
The effects of external discharges, the temperature of the
insulation, and the thermal conductivities of the insula-
tion and of the electrodes all have to be taken into account.
As if there wasn't enough confusion already, there
are many different mechanisms of conduction and of break-
down. Basically, the theories of solid dielectric break-
down involve two separate methods of breakdown, thermal
breakdown and intrinsic breakdown. These two modes have - -
been recognized for many years. If the breakdown occurs
as a continuation of the conduction process, it can be
classified as thermal breakdown. If the breakdown occurs
because of an instability, such as collision ionization,
than it can be classified as intrinsic. The classifica-
tions are convenient but it is often difficult to force
any given situation to fit either of the classifications.

Furthermore, each classification has many theories as to --
the actual mechanism of breakdown.
It is generally agreed that most dielectric fail-
ures encountered in the design and use of electrical ma-
chinery can be classified as thermal breakdowns. The time
it takes for failure to occur and the type of voltage
(steady, 6 0 ~ ~ ) applied are two indications. Nevertheless,
no real means exists to compare different insulations as
to their ability to perform in this manner, other than
actual life te,sting on models of specific apparatus.
In the area of solid insulation, there have been
various theories developed. Also, various empirical
methods of applying solid insulation have been developed.
These empirical methods vary depending on the type of
apparatus involved, the type of voltages used and the
practices of various manufacturers. But, more significantly,
the empirical methods often do not make use of the theories. -
Breakdown in a dielectric is hard to define. While
it could be thought of as current flow in a normally non-
conducting material, it is better to visualize it as an
inability of the insulation to hold voltage. While current
flow in an ideal dielectric is impossible, current can flow
in a real dielectric without causing breakdown.
Non-breakdown current in a real dielectric can be
broken into two parts: the conduction current and the
polarization current. The polarization current is due to
one or more of the three mechanisms of polarization:

1. displacement of the centers of positive and negative charge --
2. relative motion of the ions in an ionic crystal
3. rotation of dipolar molecules 3
Conduction current, on the other hand, is actual transport
of charges through the dielectric. In a solid dielectric,
these charges are mostly electrons. 4
Basically, conduction in insulation can be explained
by the same equations as in solid-state electronics. For
an electric field E, a current density J flows. In solid
insulation the current is made up primarily of electrons,
although the movement of slow moving positive ions is not
unusual. The current density is dependent on the number of
electrons, and the mobility of the electrons, as well as the
electronic charge. Thus,
J = nev (1) -
where: n = electron volume density
e = electronic charge
v = average electron velocity in the applied field.
2 where : A = mobility in m /volt-sec
E = the applied field
Equation 1 can be rewritten as
'R .w. Sillars , Electrical Insulating Materials and Their Application (New York: Peregrinus PublEshing Co., ,19731, -- .- PP* 38-40.
4 J.J. O'Dwyer, The Theory of Dielectric Breakdown of -- Solids ( ~ e w York: Oxford University Press, 19641, p. 6.

where: 6 = conductivity. --
Then the resistivity can be defined as the inverse of the
conductivity
Q = 1 / ~ = l/nep (415
In solid insulation, unlike in metallic conductors, the
resistivity tends to decrease exponentially with temperature. 6
The dielectric constant, , is a measure of the amount of polarization in the material. The value of at a partic-
ular frequency and temperature is enough to tell something
about the material. Also the variations of with frequency
and temperature can tell a great deal about the structure of
the material. A large dielectric constant indicates the
rotation of large ions under the influence of the field.
As the frequency is increased, these large particles lose
the ability to follow the field. Therefore the dielectric
constant drops. Eventually, only the displacement of the
electron cloud will occur, and the dielectric constant will
level out at a much lower value.
The variation with temperature is not so well estab-
lished. However, it is still a good indication of the
structure of the -material. A dielectric constant that in-
creases with increasing temperature could indicate an easing
of the molecular bonds so that the molecules can rotate more
5~acob Millman and Christos C. Halkias, Inte rated Electronics: ---- Analog and Digital Circuits and S y = h York: McGraw-Hill ~ook~ompany, 1972),<r

easily. This could -- be due to a weakening of the structure
or the presence of more charge carriers. An€ decreasing
with increasing temperature might indicate either a
strengthening of the crystal or more energetic molecules
that do not follow the field as well. This effect might
also indicate a thermosetting type of material if it is
not reversible as temperature drops. 7
As mentioned previously, there are two major cat-
egories of insulation breakdown, thermal breakdown and
intrinsic breakdown. Thermal breakdown is more frequently
encountered and tends to occur at lower voltage levels.
Intrinsic breakdown is rarely encountered outside the
laboratory. The various theories of intrinsic breakdown
predict much higher values of breakdown voltage for in-
trinsic breakdown than have been encountered even under
laboratory conditions.
Thermal breakdown was probably the first breakdown -
mechanism noted historically. Thermal breakdown simply
realizes that every insulation has a temperature above which
the dielectric will be unable to support voltage. Nacro-
scopically, the insulation may degrade, change phase, 02-go
through a chemical reaction because of the temperature and
the time factor. From an analytic point of view, if the
heat entering the dielectric exceeds the amount of heat that
can be dissipated, thermal breakdown will result .' Thermal
7~illars, pp. 145-147, 8 O'Dwyer, pp. 46-47.

breakdown makes no distinction as to where the heat comes --
2 from. The insulation could be heated by the I R losses in
the conductor around which it is wrapped. This would
typically occur in power frequency apparatus such as trans-
formers and generators. Or, the dielectric could be heated
by conduction or polarization currents in itself. This
can occur in high frequency applications or with lossy
dielectrics at any frequency. A condition of thermal
runaway can occur as the losses increase with temperature,
and the heat cannot be dissipated by the dielectric. This
condition is aggravated by the decrease in insulation
resistivity as the temperature increases. Higher current
2 means even higher I R losses and an even more rapid temper-
ature rise.
Intrinsic breakdown is sometimes divided into disrup-
tive or intrinsic breakdown and avalanche or conduction
breakdown. However, recently O'Dwyer has advocated a return -
to a single category, intrinsic or purely electrical break-
down. Regardless of the nomenclature, this type of break-
down is caused by the field strength becoming so high that
electrons are stripped from the atoms and conduct current. 9
This condition must occ.ur solely because of the field
strength (hence the name purely electrical) and it must hap-
pen in a very short time span. In effect, it is the ultimate
dielectric strength of the material and it is very hard to
90'~wyer, pp. 7 - 9 .

verify, even in the laboratory, because the test specimens --
will normally fail by thermal breakdown first.
One of the difficulties encountered in the study of
dielectric breakdown is the inability of investigators to
identify factors that precede breakdown. The intuitive
approach is to suspect that conduction current in solid
dielectrics is of a similiar mechanism as breakdown current.
Then, by studying conduction, insight can be gained into the
breakdown process. This train of thought produces the con-
duction or avalanche theories of intrinsic breakdown. Several
of these theories have been well developed. But there is
also the disruptive type of breakdown which has almost no
formal theories. Instead, both O'Dwyer and Whitehead sug-
gest that electron instabilities exist that allow electron-
lattice collisions that are ionizing. 10
By contrast, semiconductor theories dealing with
current in semiconductors postulate that electron-lattice
interaction are always non-ionizing.
While thermal breakdown takes time on the order of
milliseconds or more to occur, intrinsic breakdown occurs
on the order of microseconds. On a microscopic level i ~ -
the dielectric, free electrons can exist for a variety of
reasons such as thermal agitation, impurities, defects, or
some absorption of energy. Once the electrons are free of
the solid structure, they can be accelerated by the electric
L U O'Dwyer, pp. 17-27.
field. The energy the free electrons absorb from the field - -
can be passed to the other free electrons, to trapped elec-
trons, and to the solid structure, i.e., the atoms. If this
energy can produce more free electrons and if the free
electrons experience a net increase in energy, breakdown
can occur. This explanation hints at the avalanche theory,
but it is not limited to avalanche breakdown. For example,
it could be possible for enough free electrons to exist
without the electric field. The field could only be
necessary to move them in the same direction.
This type of picture is also easily explained by
solid-state theory. While in an ideal dielectric the
energy gap between the conduction and the valence bonds,
i.e., between the free electron energy level and the bound
electron energy level, would be unbridgeable, in a real
dielectric, imperfection levels exist that sufficiently
narrow this gap. Once the imperfections are there, elec-
trons can rather easily move from a bound imperfection
level to the conduction state by one of the mechanisms
previously mentioned. In the conduction state, they can
receive energy from the field and transfer this energy t o
each other or to bound imperfection electrons. These
bound electrons can either give up the energy to the solid
structure or they can use it to jump to the conduction
state. If more energy is gained from the field than is
IJ. O'Dwyer, pp. 59-60.

lost to the solid structure, enough electrons are moved to
the conduction state so that an electron gas phase can exist.
With the continued application of the field, breakdown can
occur as the electrons bridge the distance between the
electrodes. 12
Unlike the theoretical aspects of conduction in
semi-conductors which support the practical world of
solid-state electronics, the theoretical view of conduction
in insulation is far from the practical world of insulation
of electrical devices. The majority of the work has been
done on very pure, crystalline materials such as the alkali-
halides. Nevertheless, the theories do offer a starting
point. Two theories in particular will be briefly described.
First, there are two low temperature conduction
theories, one by von Hippel and one by Frohlich. While both
theories predict high breakdown strengths, which have never
been fully realized, and an increase in dielectric strength
with temperatures, von Hippel assumes that ten times the
thermal energy (approximately .025eV] will be sufficient to
lift an electron into the conduction band. Frohlich on the
other hand uses the binding energy between the electron-and
the lattice, which is on the order of 10eV. 13
In the practical world, dielectric strength de-
creases with temperature. To accommodate this fact, Frohlich
120'Dwyer, pp. 62-71.
130'~wyer, pp. 17-26.

has also proposed a high temperature theory (i.e. room - -
temperature and above). This theory proposes that free
electrons have a temperature different from that of the
crystal structure. Energy transfer from the electrons
to the lattice can only happen if the temperature of the
electrons is greater than that of the lattice. An electric
field can increase the electron temperature so that they
can supply energy to the lattice. This would result in
further ionization and an increase in the electron con-
centration. Breakdown would quickly follow. This theory
predicts a decrease in dielectric strength with increasing
temperature. 14
The low temperature theory and the high temperature
theory are not mutually exclusive. Experiments have shown
both theories hold in their respective temperature ranges.
In fact, a critical temperature exists for each material
which marks the transition from the low temperature behavior,
This temperature is usually well below room temperature. 15
While the intrinsic breakdown theory is well accepted,
certain aspects of it are subject to disagreement. The - -
method of generating conduction electrons, the way the
electrons absorb energy from the field, whether or not the
field alone is sufficient to raise electrons into the con-
14~'~wyer, pp. 41-45.
1 5 ~ . ~ . Zaky and R. Hawley, Dielectric Solids (London: - Routledge and Kegan Paul, 1970) , pp. 147-153.

duction state, and whether or not the free electrons all - -
move in the direction of the field are areas that still
need clarification. A further disadvantage of the intrin-
sic breakdown theory is that it leads to a postulated in-
trinsic breakdown strength. This value is difficult to
find experimentally because other effects, such as edge
discharge from the electrodes, cause other breakdown
mechanisms to come into play before the intrinsic strength
is reached. Lastly, examples of intrinsic breakdown in
non-laboratory conditions are rare. Usually, either some
other mechanism is the more likely candidate, or the
evidence is so disturbed that no mechanism can be identified.
Intrinsic breakdown has therefore tended to remain a lab-
oratory theory with little practical applications.
In the real world, many factors have an affect on
the dielectric strength of any given insulation/electrode
system. Some of these factors are corona, edge or surface -
discharges, temperature, humidity, and chemical reactions.
As was mentioned earlier, it is often necessary to test
the actual insulation structure either in full size or in
scale models to really determine how the insulation wilP-
react. Scale model testing has the disadvantage of accen-
tuating electrode effects so that the test may not be com-
parable to the full scale.
Because of these concerns, both model testing and
specialized, standardized tests are performed for a relative
ranking of insulations. ASTM ~3638, Standard Test Method

for Comparative Tracking Index of Electrical Insulating --
Materials contains the following disclaimer:
The conditions specified herein are intended . . , to produce a condition conducive to the formation of surface discharges and possible subsequent tracking. Test conditions are chosen to reproducibly and con- veniently accelerate a process; for this reason, they rarely reproduce the varied conditions found in actual service. Therefore, while tracking tests serve to differentiate materials under given conditions, results of tracking tests cannot be used to infer either direct or comparative service behavior of an application design. Rather, tracking test results provide a tool for judging the suitability of materials for a given application. The suitability can only be verified through testing the design in actual end use or under con itions which simulate end use as closely as possible. 12
Indeed, it may take several standardized tests on a set of
different materials to gain a true picture of how the in-
sulations will react in real life. The American Society for
Testing Materials (ASTM) currently lists over 25 testing
standards for breakdown strength under various conditions
and configurations for solid insulation alone. Furthermore,
ASTM tests are primarily aimed at the electric power industry
and tend to be more concerned about power frequency and im-
pulse testing than for either DC or high frequency voltages.
16~merican Society for Testing Materials, "Standard Test Method for Comparative Tracking Index of Electrical Insulating Materials,"ASTM ~3638-77.

CHAPTER I11
SURFACE DISCHARGES AND ARC -TRACKING
Many of the problems encountered both in applying
solid dielectrics and in studying solid dielectric break-
down are due to surface effects. Surface effects include
contamination and moisture effects as well as surface
corona and several levels of arcing discharges. These
effects are often the limiting factor in the application
of any solid dielectric.
Creepage distance is one good example. In power
transformer design, for instance, a sheet of solid insula-
tion is used from the end of layer of conductor winding
to the grounded iron core. This solid insulation also
serves as layer to layer insulation, but under failure -
conditions, failure will almost always occur as a flash-
over along the surface from the winding to the grounded
core. See Figure 7.
Similarly, a common test for the dielectric - -
strength of sheet insulation employs two, two inch diameter
brass electrodes with the sheet of insulation under test
sandwiched between the brass electrodes. The failure
mode being tested for is one of puncture between the two
electrodes. As the thickness of the insulation grows, the
dielectric strength only increases until flashover becomes
the failure mechanism. Increasing the insulation further

m FLASHOVER F A I L U R E
I=E%%' / ' GROUND I N S U L A T I
TRANSFORMER CORE ( G R O U N D)
F I G U R E 7 * GROUND I N S U L A T I O N F A I L U R E , UNDER TRANSFORPdER WINDINGS
p r o d u c e s only a m i n i m a l increase i n d i e l e c t r i c s t reng th . T h i s -
-
i s i l l u s t r a t e d i n Figure 8 .
FLASHOVER - H I G H VOLTAGE E I X C T R O D E
F A I L U R E - -
- S h E E T I N S U L A T I O N
GROUND E ~ C TR ODE - -
F I G U R E 8 . SURFACE FLASHOVER I N S H E E T I N S U L A T I O N T E S T

Another good example, is the insulation clearance --
between an isolated point and ground. If the same voltage
is applied across the surface of an insulator, much more
distance is required to prevent breakdown. Operation in
moist or contaminated environments requires even greater
distances along the surface. To accommodate this long
creepage length, stand-off and suspension insulators
typically have fluted or rippled surfaces as do high
voltage electrical bushings. Often the design of the
fluting produces areas where water cannot lie for use
outdoors.
While an insulating surface can usually recover
from a single flashover, repeated flashovers can lead to
insulation degradation and eventually to insulation failure.
Any type of arcing from surface or edge corona to very
powerful, high current arcs can cause deterioration of
solid insulation surfaces.
Again using the example of the breakdown test
using the two inch diameter brass electrodes, corona
from the radiused edge of the electrode will cause visible
surface degradati-on. Sometimes, the insulation will - -
fail in this deteriorated ring, rather than under the
electrodes.
Similarly, in actual electrical equipment, surface
coronas and low level arcing can cause deterioration. The
resulting weakness then fails either under an over-voltage
transient or when its strength drops below the operating

30
voltage. The exact mechanisms of breakdown vary with the
type of corona or arcing and with the insulation material
itself. Often, the ultimate breakdown is a thermal break-
down, but this is preceded by many, different effects as
the arcing progresses.
There are different ways to classify arcs. They
can be by current alone, by voltage alone, or by the
energy in the arc (which is voltage and current). While
it can generally be said that there are high voltage,
low current arcs and low voltage, high current arcs, a
more quantitative measure of the voltage and current is
necessary.
Mandelcorn has theorized several levels of arcing
or discharge based on the power density. These levels
he terms low, intermediate, and high. Table 1 lists the
respective voltages and currents involved in each level.
TABLE 1
SUMMARY OF ARC DISCHARGE SEVERITY BVELS
SEVERITY LEVEL 2 Low Intermediate High
Power ~ensity . (M/cm ) 103 10 100 - - Discharge Voltage (~/cm) lo4 103 10-100 Discharge Current (A) 10 6 102 1-1000 Temperature ( C) 100 50 0 1,000
Also listed in this table is a temperature range
that is caused by the heating action of the arc. Elevated
temperatures cause deterioration of the insulation by var-
ious mechanisms. These mechanisms depend upon the type
of insulation material and upon the atmosphere in which

t h e discharges take -- place . I n t h e extreme, t h e temperature
w i l l cause carboniza t ion , which makes the i n s u l a t i o n conduc-
t i v e . 1 7
There a r e a l s o o ther mechanisms of d e t e r i o r a t i o n ,
bes ides h e a t , f o r each l e v e l . Again, these mechanisms a r e
dependent upon t h e type of i n s u l a t i o n and upon the atmosphere
i n which t h e discharges occur. These mechanisms include de-
gradat ion by UV r a d i a t i o n , by a c t i v e oxid izers such a s ozone,
by l i b e r a t e d chemical r a d i c a l s such a s 0 - , COOH-, and by
a t t a c k by var ious a c i d s and o ther compounds. l8 There a r e
o ther mechanisms t h a t come i n t o play such a s the d r i v i n g of f
o f v o l a t i l e s and p l a s t i c i z e r s , embrit t lement, and even
melt ing i n t h e case of some thermoplast ic m a t e r i a l s .
The s e r i e s o f t e s t s l i s t e d i n ASTM f o r a rc- t rack-
ing takes a very s i m i l a r course a s Mandelcorn i n a r c c l a s s i f i -
c a t i o n by c u r r e n t . ASTM ~ 4 9 5 i s s p e c i f i c a l l y designed t o
t e s t f o r t h e e f f e c t s o f high vo l t age , low cur ren t a r c s c lose
t o t h e su r face of the i n s u l a t i o n . The t e s t c o n s i s t s of t h e
use of t w o e l ec t rodes placed on t h e sur face of t h e i n s u l a t i o n
so t h a t with an appl ied vol tage an a r c forms between the
e l ec t rodes . The -e l ec t rodes can be e i t h e r s t a i n l e s s s t e e l
s t r i p s o r tungsten rods . I n e i t h e r case , t h e vol tage i s i n -
1 7 ~ y o n Mandelcorn, "The E f f e c t s of E l e c t r i c D i s - charges Between Elec t rodes Across I n s u l a t i o n Surfaces , P a r t 1 , " AIEE Transac t ions , p t . 111, August, 1961, 482.
181VIandelcorn, "Ef fec t s of E l e c t r i c Discharges, " 483-485.

creased u n t i l a r c i n g occurs . The time u n t i l f a i l u r e i s -- -
r eco rded , g e n e r a l l y i n seconds. This i s a p a r t i c u l a r l y
s eve re t e s t and u s u a l l y f a i l s i n s u l a t i o n s i n r e l a t i v e l y
s h o r t t ime . Four g e n e r a l types of f a i l u r e have been
recognized.
1. Some ino rgan ic i n s u l a t i o n s become heated enough t o become incandescen t . I n t h i s c o n d i t i o n , t hey a r e con.ducting. However, when they c o o l , t hey r e g a i n t h e i r i n s u l a t i n g a b i l i t y .
2 . Some organic i n s u l a t i o n s b u r s t i n t o f lames .
3 . Some organics f a i l by t r a c k i n g . That i s a t h i n wiry l i n e i s formed between t h e e l e c t r o d e s .
4. Some i n s u l a t i o n s f a i l by ca rbon iza t ion of t h e s u r f a c e . I 9
I n r ega rds t o Number 2 , i t should be remembered t h a t most
s o l i d i n s u l a t i o n s a l s o have s t r u c t u r a l u se s . The re fo re ,
t hey a r e considered as f a i l e d i f t hey burn.
I n t h e r e a l world , s o l i d i n s u l a t i o n s a r e s u b j e c t e d
t o va r ious types of d i r t and contaminat ion as w e l l as ex-
tremes of humidity. These cond i t i ons u s u a l l y impai r t h e
s u r f a c e s ' a b i l i t y t o hold vo l t age wi th minimal leakage cu r-
r e n t . Therefore , t h e ASTIR has adopted many t e s t s t o eva lua t e
a r c and t r a c k r e s i s t a n c e under c o n t r o l l e d contaminat ion a n d - -
humidity c o n d i t i o n s . Table 2 summarizes t h e s e t e s t s .
These t e s t s va ry i n t h e i r s e v e r i t y a s w e l l a s i n
t h e type of a r c employed. A s men.tioned p rev ious ly , ~ 4 9 5 uses
- I 9 ~ m e r i c a n Soc ie ty f o r T e s t i n g M a t e r i a l s , "Standard
Method of Tes t f o r High Voltage Low Cur ren t , Dry Arc Res i s tance of S o l i d E l e c t r i c a l I n s u l a t i o n , " ASTM ~4.95-73.
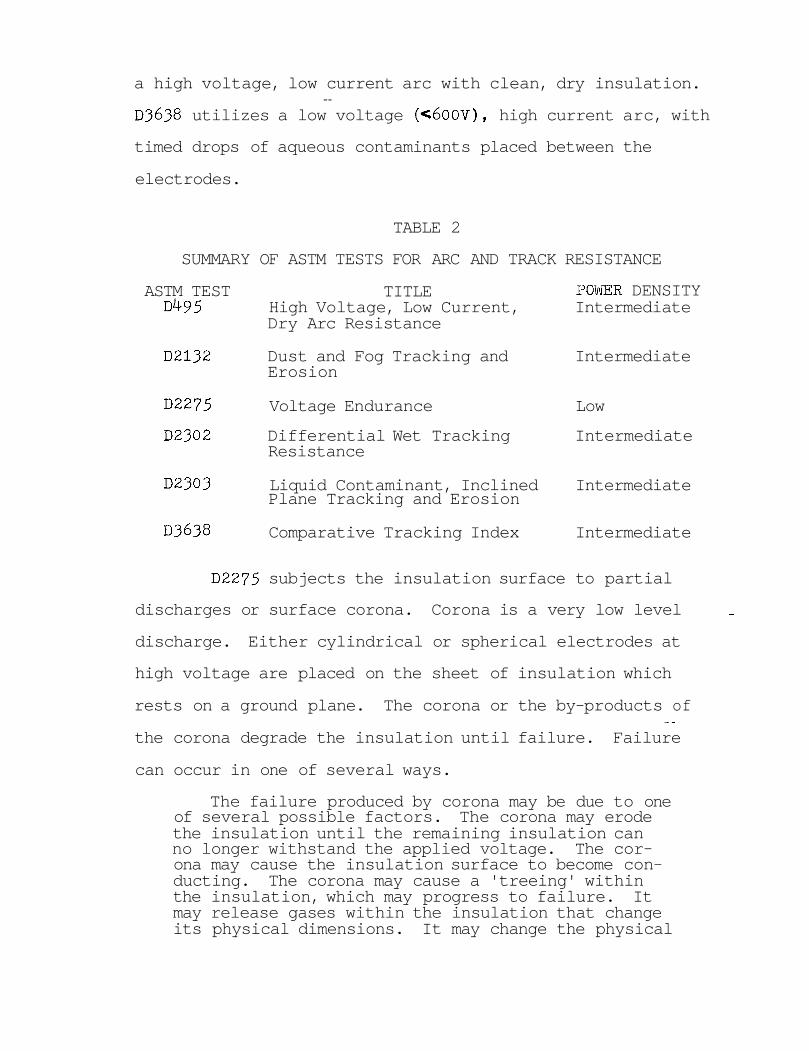
a high voltage, low current arc with clean, dry insulation. --
~3638 utilizes a low voltage (C~OOV), high current arc, with
timed drops of aqueous contaminants placed between the
electrodes.
TABLE 2
SUMMARY OF ASTM TESTS FOR ARC AND TRACK RESISTANCE
ASTM TEST TITLE POWR DENSITY ~ 4 9 . 5 High Voltage, Low Current, Intermediate
Dry Arc Resistance
D2132 Dust and Fog Tracking and Intermediate Erosion
D-2275 Voltage Endurance Low
D2302 Differential Wet Tracking Intermediate Resistance
D2303 Liquid Contaminant, Inclined Intermediate Plane Tracking and Erosion
~3638 Comparative Tracking Index Intermediate
D227j subjects the insulation surface to partial
discharges or surface corona. Corona is a very low level -
discharge. Either cylindrical or spherical electrodes at
high voltage are placed on the sheet of insulation which
rests on a ground plane. The corona or the by-products of - -
the corona degrade the insulation until failure. Failure
can occur in one of several ways.
The failure produced by corona may be due to one of several possible factors. The corona may erode the insulation until the remaining insulation can no longer withstand the applied voltage. The cor- ona may cause the insulation surface to become con- ducting. The corona may cause a 'treeing' within the insulation, which may progress to failure. It may release gases within the insulation that change its physical dimensions. It may change the physical

p r o p e r t i e s of a n i n s u l a t i n g m a t e r i a l t o e m b r i t t l e o r c r a c k , and th-us make it u s e l e s s . 20
D2132 s u b j e c t s t h e i n s u l a t i o n t o a r c s caused by conduct ion
through l iquid- contaminant s u r f a c e f i l m s . Three s t r i p
e l e c t r o d e s a r e placed on an i n s u l a t i o n sample which r e s t s
on a ground p l ane . The i n s u l a t i o n i s covered wi th a s p e c i -
f i c d ry contaminant and water i s cont inuously sprayed onto
t h e i n s u l a t i o n s u r f a c e f o r t h e d u r a t i o n of t h e t e s t . A
phenomenon c a l l e d "d ry banding" occurs where t h e i n s u l a t i o n
exper iences l o c a l i z e d h e a t i n g (due t o conduct ion> which
causes evapora t ion of t h e f i l m . Arcing t h e n occurs a c r o s s
t h e dry band. I f t r a c k i n g occurs , t h e c a r b o n i z a t i o n f u r -
t h e r concen t r a t e s t he f i e l d and i n t e n s i f i e s t h e dry banding
and t h e a rc ing ." I n s u l a t i o n s can a l s o f a i l by e r o s i o n
r a t h e r t han t r a c k i n g . I n e r o s i o n , t h e a r c i n g v o l a t i l i z e s
t h e i n s u l a t i o n , forming channels i n t h e s u r f a c e .
D2303 i s a similar t e s t where t h e i n s u l a t i o n samples
a r e cont inuous ly bathed i n a s p e c i a l contaminant s o l u t i o n , -
while under v o l t a g e . However, i n t h i s t e s t , t h e a r c cur-
r e n t i s l i m i t e d by a n e x t e r n a l r e s i s t a n c e t o a much lower
va lue than i n D2132. - -
A more severe t e s t i s D2302. I n t h i s t e s t t h e spec-
imen and e l e c t r o d e assembly a r e p a r t i a l l y immersed i n water
'O~merican Soc ie ty f o r Tes t ing M a t e r i a l s , "Standard Method of T e s t f o r Voltage Endurance of S o l i d E l e c t r i c a l I n s u l a t i n g M a t e r i a l s Subjec ted t o P a r t i a l Discharges (Corona) on t h e Sur face ," ASTM D2275-75.
"8. Kurtz , "Tracking, " -.- IEEE E l e c t r i c a l --- I n s u l a t i o n Magazine, May, 1987, 12-13.

while subjected to increased -- voltage levels (and power
levels) until failure occurs.
All of these standardized tests were developed
in response to specific problem areas encountered in
actual practice. All except D227j produce power densities
in Mandelcorn's intermediate range. This middle third is
a very wide range, covering most real world situations.
Various investigations have been performed to
investigate the effects of surface discharges and the mechan-
isms in.volved in these effects. These investigations usually
concentrate on one specific level of discharge. These
levels vary, as with the ASTM tests, from the low level sur-
face coronas or partial discharges through successively
higher power levels of arcing. One difference between the
effects of the different levels is the time to breakdown.
Another is the mechanisms involved in the degradation process.
The lower power levels, which are also slower, tend to have -
more mechanisms involved, while the higher power levels tend
to create surface temperatures that cause carbonization.
In the low power level caregory, Molter, et al., list - -
five mechanisms that come into play for surface corona:
thermal, oxydative, radiative, mechanochemical, and chemical. 22
Dakin, et al., reports electron bombardment to be the primary
22~evin D. Wolter, Julian F. Johnson, and John Tanaka, "Degradation Product Analysis for Polymeric Dielectric Materials Exposed to Partial Discharges," IEEE Transactions on Electrical Insulation, - October, 1978, 327-33.

mechanism with attack by ozone and oxides of nitrogen to be --
the secondary mechanisms. 23
In the intermediate power density range, Mandelcorn,
Hoff, and Sprengling found no one dominating mechanism other
than carbonization or erosion. 24 As mentioned previously,
this range is very wide, and at the higher end, almost all
insulations failed in very short time.
Little or no work has been published regarding
testing in the high power density range. Few laboratories
are equipped to handle the combined voltage and currents at
this level. Also, few insulations can pass this test.
Another critical parameter is what type of solid
dielectric is being tested. Generally, all organic insul-
ations are degraded by discharges. On the other hand,
most inorganic insulations are very resistant to deterioration
by discharges.
The organics are degraded by several different mechan-
isms. Under the lower power level discharges, chemical and
thermal reactions are prevalent depending on the specific
insulation. For instance, polyethylene has a low melting
point, and tends -to erode or melt under arcing. Also, it is readily oxidized by ozone, by ultraviolet radiation, and by
acids formed as by-products of its degradation. 25
23~.N. Dakin, H.M. Philofsky, W.C. Divens, "Effects of Electric Discharges on the Breakdown of Solid In~ulation,~' AIEE Transactions pt 111, May, 19-54, 160. -- --- 9
24#andelcorn, "Effects of Electric Discharges, " 482-486.
2%iolter, Johnson, and Tanaka, 32'7-330.

Other organics are de-polymerized by the arcing. --
Their molecular chains are broken down and the lighter,
more volatile constituents are driven off. Other organics,
such as PVC, lose their plasticizer and become less flex-
ible. 26 Some types of Teflon absorb low energy electrons
easily because of fluorine's affinity for electrons. This
causes the molecular chain to decompose.
Inorganics on the other hand, tend to be very resis-
tant to corona and low level discharges. The surface of
most inorganics is only slowly disrupted. There are no
volatiles to be driven off. Finally, they tend to have a
regular structure, which makes it easier to recombine when
a molecule is dislodged. 27
Mandelcorn, Hoff, and Sprengling have run some tests
at higher power level on inorganic insulations. They have
found that if the arcing is intense enough to develop sur-
face temperatures of 500' C, carbonization occurs and the -
insulators allow conduction. However, if the arcing intensity
is increased to 800°c, the carbon burns off and the conduction
decreases. 28
In summary, the results of arcing and discharge-are
three: chemical breakdown, carbonization or tracking, and
L W H.L. Saums and M.W. Pendleton, Materials for Elec- trical Insulating and Dielectric -- ~unction~~ochelle?ark, New Jersey: Hayden Book Co., 1973), p.81.
27~akin, Philof sky, and Divens , 160.
28~. Mandelcorn, R.E. Hoff, and G.R. Sprengling, "The Effects of Electric Discharges Between Electrodes Across In- sulation Surfaces, Part 111;" AIEE Transactions, pt -- 111, August, 1961, 491.
mechanical. By far, the most common is tracking. In a --
tracking failure, the arcing is intense enough, at least
at the end of the process, to carbonize the surface. Cur-
rent flows through these carbonized tracks, eventually
bridging the electrodes and failing the insulation. The
great majority of organic insulations (including most
phenolics, epoxies, and polyesters) will fail in this way.
Those that do not fail by tracking (such as polyethylene or
acrylic) will erode or melt as the arcs move across the
surface. This process also leads to failure.
The chemical breakdown is a secondary or supplemental
effect. Under lower level discharges, the chemical break-
down and subsequent attack can degrade the insulation
enough to cause more intense arcing. Or, the insulation's
properties change enough that it is mechanically weakened.
Thus, it may no longer be able to support weight or it may
become brittle and unable to flex with the movement of the
conductors.
In most of the standardized ASTM tests and in most of
the laboratory investigations, external resistances limit the
current available-to the arcing. This allows the levelof
arcing to remain fixed through the experiment. While this
is useful in studying the degradation mechanisms in the low
and intermediate power density levels, it is not how arcing
typically attacks solid insulation in the real world.
In actual practice, especially in power frequency
apparatus, the resistance of the insulation itself is the

controlling factor for the discharge current. As the sur- --
face resistance decreases, the discharge current increases,
carrying the reaction into higher power density regions
until failure occurs. Two scenarios are presented to il-
lustrate this point for dry and wet conditions.
For a relatively clean and dry surface separating
a high voltage electrode from ground, continuous corona
occurs near the junction of the high voltage electrode to
the insulation surface. This corona erodes the area adjacent
to the electrode. If there is a ground point on the other
side of the sheet insulation, the erosion will eventually
decrease the insulation thickness so that an over-voltage
transient will puncture the insulation.
Or, if the nearest ground is at the end of the insul-
ation opposite the high voltage, the erosion increases the
likelihood of a flashover occurring during the over-voltage.
The flashover starts a carbon track or whisker forming on
the surface. Successive flashovers form new tracks or
lengthen existing ones. As the carbon tracks grow, they
distort the electric field, concentrating the electric field ..
- - intensity across smaller portions of the insulation. They
also provide a low resistance path for the discharge current.
Eventually, either an over-voltage succeeds in connecting a
track to ground or the electric field becomes high enough
that even the operating voltage causes arcing and the tracking
reaches ground.

The second scenario again involves an insulating
surface separating a high voltage connection from ground.
However, in this scenario, the surface is exposed to con-
tamination and moisture. Water being effectively a polar
solvent, the moisture disassociates some of the contamina-
tion into ions. The water itself also disassociates to a
small degree. Now, the ions are free to carry a leakage
current over the surface. The current will raise the temper-
ature of the moisture and, where the moisture film is thin-
nest, the water will evaporate leaving a dry-band. This
narrow dry-band will see almost the full voltage across it.
It cannot sustain this voltage and arcing will occur. The
arcing will form carbon tracks and essentially short out
this part of the insulation. The temperature caused by the
arcing will cause further evaporation, but the new dry-
bands will still be seeing an extremely high field and the
arcing will continue to intensify. Failure occurs in short -
order as the tracks bridge to ground and to the high voltage
electrode. The writer personally observed such a failure
mechanism that occurred in the bottom of an oil-filled trans- - -
former .

CHAPTER IV
EXPERIIVENTAL RESULTS
The problem with the well in the electrostatic power
supplies is clearly an arc-tracking phenomenon. However,
not all wells fail, so the corlditions that need to exist
to start the failure mechanism must be identified. Also,
the sequence of events that leads from the initial conditions
to final failure must be discovered. Only then, can a so-
lution be identified.
In an effort to investigate the failure mechanism,
the initial field evidence was analyzed and a test pro-
gram was undertaken. The following is a summary of that
effort.
The early observations and evidence relating to the
well failures included a yellowing of the polyethylene
cable and a tarnishing of the brass tack used as the cable
termination. These symptoms were accompanied by a "wetness"
on the cable and a sharp, acidic odor. In the early stages, - -
with the cable removed, the wells emitted sharp snapping,
popping and hissing noises. There were blue arcs constantly
visible. The surface of the polyethylene cable was eroded
resulting in an alligator-skin appearance. In the later
stages, the wells had carbon tracks formed on their inside
surfaces and would carry appreciable (-100 to 200,UA) cur-
rent even without the cable present.

Based on these observations and on the literature, -- -
the following hypothesis was developed. The degradation
process occurs in three phases. In the first phase, a low
level corona in the presence of moisture starts to degrade
both the cable and the well. Toriyama reports that the
corona discharge produces short-lived active radicals such
as 02*, 0 and others that oxidize the surface of the 3
polyethylene producing H20 and C02 Furthermore, ozone
penetrates the polyethylene and produces carbolic acid. 29
The increased moisture leads to the next phase which
is a wet tracking degradation mechanism. As the moisture
collects, especially where the cable is thrust laterally
against the inside diameter of the well, the field dis-
tribution becomes concentrated around the water. This
causes surface discharges or scintillations. Mandelcorn
states that wet tracking degradation results from two
mechanisms, thermal degradation and the formation of
electrically conducting active products. 30 The heat gen-
erated degrades both the PVC and the polyethylene. The
formation of carbon tracks further concentrates the stress -. which results in -further arcing.
The third phase is one of pure arc-tracking. As more
of the well is tracked the stress across the remaining
29~. T oriyama, et al, "Degradation of Polyethylene by Partial Discharge," IEEE Transactions on Electrical Insulation, - August, 1967, 88-89.
30~andelcorn, "Effects of Electrical Discharges, " 483.

insulating surface is further concentrated causing more -- -
severe arcing. Rapidly, the whole length of the surface
is tracked and current flows freely from the high voltage
electrode to ground.
There are three conditions necessary for this pro-
cess to occur. The presence of the cable in the well, the
PVC well material, and moisture. Corona is also necessary,
but corona at this voltage level (115KV) is almost unavoid-
able with the allowable dimensions of the electrodes in-
volved (i.e., the contact spring and the grounded cable adap-
ter).
The presence of the cable is necessary because, with
the contact spring and its own natural flexibility, it gets
somewhat compressed inside the well. This compression forces
the cable to assume an "s-bend1' shape, so that it contacts
the inside of the well at several random locations. The
interface between PVC well and PE cable becomes a weak point, -
concentrating the stress and collecting and distributing the
moisture by capillary action.
The moisture is necessary from several aspects. First, . .
it intensifies the corona and helps carry about the by-pro-
ducts of the corona attack. Second, by wetting the surfaces,
it allows surface currents to flow, and it causes concentra-
tions of the electric field. Third, when enough moisture is
present, it enables the typical scintillation of a wet track-
ing mechanism.

The PVC well material is necessary because PVC -- -
does arc-track and therefore, the well reaches final and
permanent failure. There are many materials like PVC
that arc-track.
There are also many materials that, while not
tracking, will not stand up to the temperatures involved
in arcing. There are also materials that are more track
resistant than PVC. For the well to progress to permanent
failure, the well material must form carbon tracks.
A series of experiments was performed to evaluate
this hypothesis.
Experiment 1
This test involved finding some wells in customer's
plants that appeared to be in the early stages of failure.
This condition was diagnosed by listening to the well for
sounds of popping and hissing. If these sounds persisted
after cleaning the well with a suitable solvent (Freon TF),
the multiplier assembly was returned to the lab where it
could be tested.
Four such multipliers were discovered at the Fontis-c
Motor Division plant in Pontiac, Michigan. These multipliers
were returned to the laboratory where the wells were examined
with a borescope. All the wells showed incipient tracks.
Two of the Pontiac wells were reassembled in power
supplies and fitted with cables and guns. Two similar con-
trol systems were also assembled. All four wells and a11

- - 0 a; H B tn' U W - W H

fou r cab le ends were thoroughly c leaned w i t h Freon TF --
before assembly. The f o u r systems were t hen opera ted a t
f u l l v o l t a g e , b u t were cyc led on and o f f .
The HV cab le on one of t h e Pont iac w e l l s f a i l e d t o
ground i n l e s s t han 48 hours , b u t t h e w e l l was n o t de-
grad ing .
A f t e r 6 days w i th s t i l l no i n c r e a s e i n c u r r e n t ,
each of t h e w e l l s was aud ib ly i n spec t ed f o r s i g n s of
a r c i n g . Only t h e f i r s t Porltiac w e l l showed a cont inuous
a r c i n g n o i s e and it a l s o showed a yel lowing on t h e poly-
e thy lene of t h e c a b l e . By day 9 , one of t h e c o n t r o l w e l l s
w a s beginning t o h i s s and c r a c k l e . Also a t t h i s t ime t h e
f i r s t Pon t i ac w e l l would draw 10-20&A on i t s i n s i d e s u r -
f a c e wi thout t h e cab le p r e s e n t . The cab le w a s yel lowing
e s p e c i a l l y nea r t h e th readed cab le a d a p t e r (grounded e l e c -
t r o d e ) . The second Pont iac w e l l showed a s t eady c r a c k l i n g
and w a s a l s o beginning t o yellow t h e po lye thy lene . -
Af te r 41 days , no f u r t h e r degrada t ion had occurred
and t h e exper iment w a s t e rmina t ed . I n h i n d s i g h t , t h i s
t e s t was r u n i n an humidity uncon t ro l l ed room i n t h e mid-
d l e of w i n t e r . -The l a c k of any ambient mois ture prevented
t h e r e a c t i o n i n t h e w e l l from p rog res s ing t o t h e second and
t h i r d s t a g e s .
Experiment 2 ---
In order t o expose new w e l l s t o a v a r i e t y of d i f -
f e r e n t mois ture c o n d i t i o n s , a more c o n t r o l l e d experiment
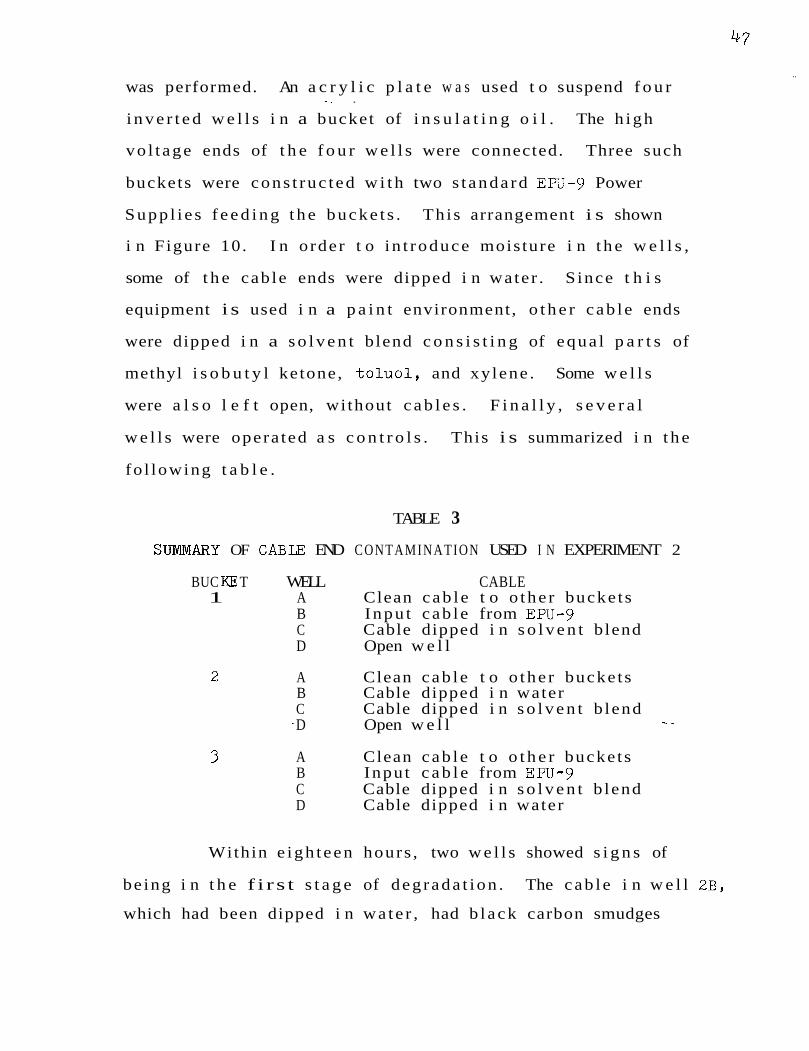
was performed. An a c r y l i c p l a t e w a s used t o suspend f o u r -- .
i n v e r t e d w e l l s i n a bucket of i n s u l a t i n g o i l . The h igh
vo l t age ends of t h e f o u r w e l l s were connected. Three such
buckets were cons t ruc t ed w i t h two s t anda rd EPU-9 Power
Supp l i e s f e e d i n g t h e bucke t s . This arrangement i s shown
i n Figure 10. I n o rder t o i n t roduce mois ture i n t h e w e l l s ,
some of t h e cab le ends were dipped i n wate r . S ince t h i s
equipment i s used i n a p a i n t environment, o t h e r cab le ends
were dipped i n a s o l v e n t b lend c o n s i s t i n g of equa l p a r t s of
methyl i s o b u t y l ketone, t o l u o l , and xy lene . Some w e l l s
were a l s o l e f t open, wi thout c a b l e s . F i n a l l y , s e v e r a l
w e l l s were opera ted a s c o n t r o l s . This i s summarized i n t h e
fo l lowing t a b l e .
TABLE 3
SUMNIARY OF CABLE END CONTAMINATION USED I N EXPERIMENT 2
BUC KE T WELL CABLE 1 A Clean cab le t o o the r bucke ts
B Inpu t cab le from EPU-9 C Cable dipped i n s o l v e n t b lend D Open w e l l
A Clean cab le t o o the r bucke ts B Cable dipped i n water C Cable dipped i n s o l v e n t b lend
- D Open w e l l - -
A Clean cab le t o o t h e r bucke ts B Input c a b l e from EPU-9 C Cable dipped i n s o l v e n t b lend D Cable dipped i n water
Within e igh teen hours , two w e l l s showed s i g n s of
be ing i n t h e f i r s t s t a g e of deg rada t ion . The cab le i n w e l l Z B ,
which had been dipped i n wa te r , had b l ack carbon smudges


a t t h e t a c k end and had a yellow s t a i n nea r t h e grounded -- .
cab le a d a p t e r . The w e l l i t s e l f had v i s i b l e a r c i n g i n s i d e ,
when i t was energ ized wi thout t h e cab le . However, a bore-
scope examination showed only h a i r l i n e a r c - t r a c k s .
Well 3 D , t h e o the r w e l l w i t h a cab le dipped i n
wa te r , w a s f u r t h e r a long i n t h e degrada t ion process . There
had been enough a r c i n g t o r a i s e t h e temperature of t h e
cab le enough t o s o f t e n i t . With t h e a p p l i e d f o r c e of t h e
s p r i n g , t h e cab le had a c t u a l l y swol len o r i nc reased i t s
diameter such t h a t i t w a s d i f f i c u l t t o remove. Borescope
examination showed t h e w e l l had a s i n g l e , heavy a r c - t r a c k .
Both w e l l s and bo th cab le ends were r e p l a c e d . The
cab le end t h a t was i n s e r t e d i n t o w e l l 3D had a t e f l o n h e a t
s h r i n k tube f i t t i g h t l y over i t . I n s t e a d of d ipp ing t h e
cab le ends i n wa te r , 1 . 0 cc of wate r was added t o each of
t h e w e l l s .
Within 48 hours , w e l l 2B had f a i l e d aga in . This
t ime , t h e a r c i n g had r a i s e d t h e temperature enough t o s o f t e n
t h e polyethylene and t o s w e l l t h e cab le s o t h a t it was un-
a b l e t o be removed.
A f t e r ano the r 24 hours , w e l l 3 D , which had t h e Geflon
h e a t s h r i n k a p p l i e d t o t h e cab le end, showed evidence o f
t r e e i n g on t h e polyethylene as w e l l as a yel lowing nea r t h e
ground e l e c t r o d e . Also t h e t e f l o n had one spo t of h e a t
d i s t o r t i o n . The w e l l i t s e l f had sounds of a r c i n g wi thout
t h e c a b l e . Within 36 more hours , t h e w e l l and cab le had
progressed t o f a i l u r e . A s w i th t h e o t h e r w e l l s , t h e cab le
had sof tened and expanded s o t h a t i t could n o t be removed. -- -
These w e l l s and cab le s a r e shown i n Figure 11.
Since t h e two w e l l s t h a t had been l e f t open had
n o t shown any s i g n s of a r c i n g , 1 . 0 cc of water w a s added
t o bo th w e l l s 1D and 2D. These w e l l s r a n f o r 15 days
wi thout any i n d i c a t i o n of a r c i n g o r degrada t ion .
The conc lus ions t h a t can be drawn from t h e s e two
experiments a r e as fo l lows . F i r s t , mois ture i s a b s o l u t e l y
necessary t o s t a r t and t o s u s t a i n t h e r e a c t i o n . Second,
an open w e l l , one wi thout a c a b l e , w i l l no t beg in t h e f a i l -
u re p roces s , even wi th wate r p r e s e n t . Thi rd , t h e presence
of s o l v e n t had no e f f e c t .
Another experiment w a s r u n t o eva lua t e t h e r o l e
t h a t t h e PVC m a t e r i a l of t h e w e l l p lays i n t h e deg rada t ion
process .
Experiment - 3
The same arrangement used i n Experiment 2 w a s used,
bu t w e l l s made from a glass-melamine m a t e r i a l (NEMA grade
G - 9 ) were used. The glass-melamine m a t e r i a l i s much more
t r a c k r e s i s t a n t t h a n t h e PVC. - -
Two glass-melamine w e l l s were cons t ruc t ed by i n s e r t -
i n g t h e glass-melamine w e l l i n t o t h e PVC end coupl ing . These
w e l l s were t h e n i n s t a l l e d i n t h e same appara tus of Experiment
2 . One of t h e s e ( B ) had 2 . 0 cc of water added t o t h e w e l l
while t h e o t h e r ( D ) w a s t h e c o n t r o l . Two PVC w e l l s were
a l s o used, A had t h e i n p u t power cab le and C w a s l e f t open.

A f t e r 27 hours of o p e r a t i o n , t h e cab le s and w e l l s - -
were examined, Well D w a s u n a f f e c t e d , while t h e cab le i n
w e l l B showed a yel lowing nea r t h e grounded, th readed cab le
a d a p t e r . Nhen t h e t e s t was r e- ene rg i zed , w e l l B drew
excess ive c u r r e n t . Within 30 minutes , t h e cab le i n w e l l B
had become a l l i g a t o r - s k i n n e d and a ho le had melted down t o
t h e conductor oppos i te t h e grounded cab le a d a p t e r . The
w e l l showed v i s i b l e a r c s when opera ted wi thout t he c a b l e .
However, no a r c t r a c k s had formed.
Well B w a s removed from t h e t e s t and 4.0 cc of
wate r were added t o w e l l D and t h e t e s t was resumed. Within
2 hour s , w e l l D was a r c i n g v i o l e n t l y enough t o cause r i p p l e s
i n t h e o i l i n t h e bucke t . Upon examination, t h e cab le
showed seve re d e t e r i o r a t i o n oppos i te t h e PVC coupl ing ,
b u t showed no d e t e r i o r a t i o n oppos i te t he glass-melamine
w e l l . Also, t h e w e l l showed t r a c k i n g only on t h e PVC coupl ing ,
no t a long t h e glass-melamine.
To e l imina t e t h e PVC m a t e r i a l , a b r a s s a d a p t e r w a s
machined t o j o in t h e glass-melamine w e l l t o t h e grounded,
th readed cab le a d a p t e r . One w e l l w a s f i t t e d wi th t h i s and
t h e t e s t w a s r epea t ed . 2.0 cc of water were added t o the-
w e l l and a c l e a n cab le end was i n s e r t e d . I n 1 .5 hour s , t he
w e l l had aud ib l e and v i s i b l e a r c s , bu t t h e r e w a s n o t t r a c k -
i n g . I n s t e a d the sur face of t he cable had become a l l i g a t o r -
sk inned . These we l l s a r e i l l u s t r a t e d i n Figure 12.
The conclusions of t h i s experiment a r e a s fo l lows .
F i r s t , t h e PVC i s necessary f o r a r c- t r a c k i n g t o occur . A

a) ASSEMBLED GLASS-mLAMINE WELLS.
b) SECTIONED WELLS BEFORE AND AFTER TEST.
FIGURE 12. SAlVlPU GyLSS-MEJAMINE WELLS FROM EXPERIMENT 3 -

highly track resistant material will not arc-track under - - -
these conditions. However, since the high electric field
and the corona exist regardless of material, removal of the
PVC will not prevent corona, arcing, and the deterioration
of the polyethylene cable. It would appear, however, that
replacement of the PVC with some highly track resistant
material will prevent the well from permanent failure by
arc-tracking.

CHAPTER V
DISCUSSION OF RESULTS
While t h e hypothes i s appears t o have a c l e a r l y de-
f i n e d cause and e f f e c t r e l a t i o n s h i p between t h e f a i l e d we l l s
and t h e a p p l i c a b l e v a r i a b l e s , t h e r e i s always a p o s s i b i l i t y
t h a t t h e r e a r e o the r f a c t o r s n o t d iscovered by t h e exper iments .
This i s p a r t i c u l a r l y t r u e when t h e r e i s no s o l i d t h e o r e t i c a l
b a s i s f o r t h e f a i l u r e mechanisms. Therefore , s e v e r a l a r e a s
were i n v e s t i g a t e d i n a n e f f o r t t o pu t t h e w e l l f a i l u r e
hypothes i s on a more t h e o r e t i c a l f o o t i n g .
F i r s t , s i n c e much of t h e degrada t ion of t h e cab le
and t h e w e l l has a thermal cause , t h e r e may be a n e f f e c t from
h e a t i n g due t o t h e normal i n s u l a t i o n leakage c u r r e n t . This
leakage c u r r e n t , caused by t h e DC e l e c t r i c f i e l d , would be
due p r i m a r i l y t o conduction through t h e d i e l e c t r i c s , o r
a long t h e i n t e r f a c e s o r s u r f a c e s between t h e d i e l e c t r i c s .
The t o t a l f i e l d can be examined by s tudy ing t h e
a x i a l and r a d i a l components, s e p a r a t e l y . C l e a r l y , t h e - -
h i g h e s t f i e l d i s t h e r a d i a l component a t t h e grounded,
th readed cab le a d a p t e r a t t h e open end of t h e w e l l . During
t h e experiments t h i s r e g i o n i n v a r i a b l y showed a yel lowing
of t h e polyethylene of t h e cab le due t o corona caused by
t h i s h igh , l o c a l f i e l d . I n t h e case of a DC v o l t a g e on a
d i e l e c t r i c , t h e i n i t i a l f i e l d i s determined by t h e d i e l e c t r i c
c o n s t a n t s of t h e i n s u l a t i o n s . Then, i n t h e s t e a d y s t a t e ,

the field becomes a function of the conductivities of the -- .
insulations.
Standard equations for the initial electric field
are given by Kraus and Carver:
Er = q1/2g6r (5)
v = qlln(ro/ri)/2m (6)
Ihere: ql = linear charge density in)
r = outside radius (in) 0
r = inside radius (in) i
Eliminating ql from the two equations produces:
Er = v/(rln(ro/ri 1 1 ( 7 )
Thus the field is not constant throughout the radius, but
decreases as the distance from the center increases. 31
Extending this equation to the case of two series,
cylindrical dielectrics, produces:
EpE = ~/r(lnr~/r~+l~r,/r) (8)
Eair = (GpE/cair)EpE (93 Where : = electric field intensity in the polyethylene
Eair = electric field intensity in the air
= relative dielectric constant in the polyethylene - -
€air = relative dielectric constant of the air
r = inside radius (i.e. radius of conductor) i
ro = outside radius of the polyethylene
r = outside radius of the air 0
J A John D. Kraus and Keith R. Carver, Electromagnetics, ( ~ e w York: McGraw-Hill Book Company, 1973), pp. 79-81
The cable outside diameter is ,375" and the air -- .
outside diameter is ,40625". usingem = 2.2 andsair - -
1, Em = (76/@v/inch. For r = .045, Em = 1-70 ~v/inch,
and for r = ,1875, EpE = .41~v/inch. According to Rogers,
polyethylene has a mean breakdown strength of approximately
1.27 ~v/inch, which makes the initial field at the center
a bit too high.32 However, the bulk of the cable is not
over-stressed.
For the air, Eair = 2,2(76/r)~V/inch. At the cable/
air boundary, Eair = 892KV/inch. This value is well above
the mean breakdown strength of the air. Even at the inter-
face of the air with the ground electrode, Eair = 823KV/inch.
This means that the air cannot sustain this electric field
intensity, so it doesn't supply any insulating properties
and in effect, the field intensity in the polyethylene is
marginally higher.
To calculate the leakage current, the resistivity
of the polyethylene must be taken into account. According
to Rogers, polyethylene has a conductivity (6) of 3 . 6 7 ~
15 O m or a resistivity ( of 2.72~10 a - m or 107.28~
15 10 a-inch. 33 Ca-lculating the current density in the radial
direction,
"E .C . Rogers and D. J. Skipper, "Gaseous Discharge Phenomena in High Voltage D.C. Cable Dielectrics, "The - Proceedings of the IEE, June, 1960, 243.
33~ogers and Skipper, "D.C. Cable Dielectrics, " 248.

Jr r -- .
15 = E /p = (76/r~~/inch)/(107.28~10 A-inch)
= (708.43~10~~/r)A/inch~ (10
Then the current per unit axial length is
The cable is under this high field intensity for an axial
distance of 1 inch, so the total leakage current is 4.45 PA.
The heating effect of this current is negligible.
In the steady state, when the field is determined
by the resistivity of the dielectric, the field intensity
is given by
As before, the total current per unit length is
Er = 1,p/ar (14.1
V = S ~ ~ d r = I, Qln(ro/ri)/2n (15)
Solving for I and using the values for the cable produces
I, = 2pv/pln(r0/ri) = 4 . 7 1 ~ ~ ~ (161
which is very close to the initial leakage current and is
likewise negligible.
The axial- field component is easier to calculate-with
the help of some simplifying assumptions. Assume that the
only ground point is the grounded, threaded cable adapter.
Thus the entire 115KV is stressed across the length of the
j4~ranko D. Popovic, Introductory Engineering Electro- magnetics (~eading, Massachusetts: Addison-~esley-publishing Company, 19711, pp. 209-211.

well. The average field strength then is -- .
E = 115~~/8inch = 14 .b~~/inch
Again, using the resistivity of polyethylene (107.28~
15 10 a-inch) , the leakage current density is
J = (14,4~~/inch)/(107. 28x101~-inch)
= 134.23~10-~~~/inch~ (18) 2 The cross sectional area of the polyethylene is .IlOinch .
Therefore the leakage current I = 14. 77x10-15~, which is
negligible.
The conclusion is that leakage current alone could
not be heating the polyethylene or the PVC sufficiently to
cause the degradation seen in the failed wells.
Another area to consider is charge injection from
the metal electrodes onto the surfaces of the polyethylene
and the PVC. Charge emission from electrodes typically
occurs under either very high local field strengths or at
elevated electrode temperatures. Two types of emission will -
be studied: Shottky injection and tunneling.
Shottky injection is a type of thermionic injection.
The potential barrier is lowered due to the combined applied - .
and imaged field: The resulting injection current is - -
where: i = Thermionic current with no applied field T
0 = work function (eV)
k = Boltemann's constant = 8.63x10-'e~/k
T = temperature (K)

For 4 = keV, i, is very small at room temperature: --
This brief analysis shows that Shottky emission is
not a factor in the failure mode of the well. 35
Tunnel injection occurs when the wavelength of the
probability wave of an electron is larger than the thickness
of the potential barrier. This emission produces a current
density given by
10 2 J = 1.jkxl0- (E /+)e~~(-6.83~10~+~/~/~)
2 where: J = current density (~/m 1
E = electric field intensity (V/m)
4 = work function (eV)
8 For any field less than 10 ~ / m , J is essentially zero. 36
These alternative mechanisms were investigated in
an attempt to see if the well failure mechanism could be
other than arc-tracking. Instead, these alternatives were
shown not to be a factor in the well failures. Even though
arc-tracking cannot be theoretically developed and proven,
it is the only mechanism that agrees with all the evidence.
The hypothesis is therefore proven by the exper-<
iments and by the evidence from field failures. Considering
the operating voltage and the electrode configuration at
"~oland Coelho, Physics of Dielectrics for the - -.. -- E n g i n e ~ (New York: Elsevier Scientific Publishing Company, 197% PP. 116-1170
36~oelho, Physics of Dielectrics, pp. 119-122.

both the high voltage end and at the ground end of the well, -- .
the design is at the borderline of corona occurrence. With
the slightest bit of contamination, moisture, or a sharper
than normal edge on an electrode, corona will be present.
Both Toriyama and Walter have shown that polyethylene
is degraded by corona and the by-products of corona in air.
These by-products included ozone and activated radicals.
As the polyethylene degrades, it releases Hz, H20, and car-
bolic acid. The acid further oxides the polyethylene. 37
Both the ozone and the carbolic acid also attack the steel
contact spring and the brass tack. The acid also produces
the sharp, acidic odor.
If there is a good supply of moisture to begin with,
the reaction noted above is further catalyzed. The amount
of water generated by the degradation of the polyethylene
is very small in comparison to the moisture that starts
the reaction. The initial supply of moisture also serves
to carry the carbolic acid and the activated radicals to
the surface of the PVC. This solution allows surface
currents to begin flowing along the surfaces of the PVC - .
and the polyethylene, much as in ASTM D2303 "Liquid Con-
taminant, Inclined Plane Tracking and Erosion Test." As
the current moves through the solution, the field becomes
concentrated across the areas that are still dry. This
causes higher energy discharges.
37~oriyama, et al, "Degradation of Polyethylene, " 90.

The mois ture -- t ends t o c o l l e c t where t h e c a b l e end
i s t h r u s t l a t e r a l l y a g a i n s t t h e w a l l of t h e w e l l by t h e
s p r i n g f o r c e . This u s u a l l y occurs somewhere between t h e
two ends of t h e w e l l . Therefore , t h e concen t r a t i on of t h e
f i e l d r e s u l t s a t each e l e c t r o d e . This c o n c e n t r a t i o n pro-
duces more and s t r o n g e r corona.
E v e n t u a l l y , t h e corona grows i n t o more e n e r g e t i c
d i s cha rges . These d i scha rges beg in t h e d e t e r i o r a t i o n of
t h e PVC. The PVC degrades t he rma l ly as t h e a r c s h e a t t h e
s u r f a c e . I n i t i a l l y i t g i v e s off p l a s t i c i z e r s and o t h e r
v o l a t i l e s and probably becomes somewhat b r i t t l e . A s t h e
a r c temperature i n c r e a s e s , carbon t r a c k s beg in t o form.
If t h e r e a c t i o n is s topped a t t h i s p o i n t by removing
t h e c a b l e , t h e w e l l w i l l show t h e v i s i b l e and a u d i b l e s i g n s
of a r c i n g . Furthermore, t h e c a b l e ' s c o n t a c t t a c k w i l l be
t a r n i s h e d and t h e r e w i l l be a n a c i d i c odor. The po lye thy lene
of t h e cab le w i l l show yellowed a r e a s i n d i c a t i n g ox ida t ion .
This i s e s p e c i a l l y t r u e oppos i t e t h e ground e l e c t r o d e . The
su r f ace may a l s o be eroded i n a n a l l i g a t o r - s k i n f a s h i o n by
a r c i n g and s u r f a c e c u r r e n t s . ..
- - If t h e r e a c t i o n i s a l lowed t o con t inue , t he carbon
t r a c k s f u r t h e r i n t e n s i f y t h e f i e l d a c r o s s t h e a r e a s of t h e
w e l l t h a t a r e s t i l l i n s u l a t i n g . Th i s causes a f u r t h e r i n -
c rease i n t h e a r c i n t e n s i t y . From t h i s po in t on, t h e r e -
a c t i o n p rog res se s q u i c k l y t o f a i l u r e .
Rapidly t h e r e s t of t h e i n s u l a t i n g a r e a s w i l l be
b r idged by a r c - t r a c k s . A t f i r s t t h e t r a c k s w i l l be t h i n ,

b u t as t h e f u l l c u r r e n t -- . a v a i l a b l e beg ins t o f low through
t h e carbon, t h e t r a c k s w i l l widen. Once t h e c u r r e n t can
flow e a s i l y , t h e a r c i n g w i l l c ea se . Only t h e high e f f e c -
t i v e r e s i s t a n c e of t h e power supply and m u l t i p l i e r l i m i t
t h e c u r r e n t and prevent t h e t r a c k s from burning through
t h e PVC . Once t h e i n i t i a l t r a c k i n g occurs , t h e process i s
i r r e v e r s i b l e . P r i o r t o t h e t r a c k i n g , removal of t h e
cab le and c l ean ing t h e w e l l w i t h a s u i t a b l e s o l v e n t , such
as Freon TF, w i l l p revent f u r t h e r degrada t ion . This i s
probably a r e s u l t of t h e s o l v e n t d ry ing t h e mo i s tu re .
However, once carbon t r a c k s form, t hey cannot be removed.

CHAPTER V I
S OLIJT I ONS
Based on t h e exper imental evidence and on t h e
l i t e r a t u r e r e sea rched , t h e r e a r e s e v e r a l pos s ib l e s o l u t i o n s
t o pursue. However, t h e s u c c e s s f u l s o l u t i o n w i l l n o t only
prevent t h e a r c - t r a c k i n g , b u t i t w i l l a l s o s a t i s f y t h e prac-
t i c a l c o n s i d e r a t i o n s . These c o n s i d e r a t i o n s i nc lude t h e
s i z e l i m i t a t i o n s and t h e a v a i l a b l e manufacturing methods.
S ince t h e corona i s t h e s ta r t of t he degrada t ion
p roces s , one p o s s i b l e s o l u t i o n would be t o e l i m i n a t e t h e
corona by b e t t e r e l e c t r o d e des ign . Both t h e h igh v o l t a g e
c o n t a c t s p r i n g and t h e th readed a d a p t e r t h a t i s t h e ground
e l e c t r o d e have s h a r p f e a t u r e s t h a t have high f i e l d con-
c e n t r a t i o n s .
However, a t t h e f u l l v o l t a g e of t h e power supp ly , -
t h e necessary r a d i u s e s would cause a two t o t h r e e t imes
i n c r e a s e i n t h e diameter of t h e w e l l . This would make t h e . .
w e l l l a r g e r t h a n t h e e n t i r e m u l t i p l i e r housing. Also , t h e r e
i s no good way t o s h i e l d t h e h e l i x of t h e s p r i n g wi thout
adding o the r s h a r p c o r n e r s .
Another p o s s i b i l i t y would be t o l eng then t h e w e l l
t o reduce t h e s t r e s s on t h e s u r f a c e . However, t h e w e l l
i s a l r e a d y t h e l onges t p a r t of t h e m u l t i p l i e r . The m u l t i -
p l i e r i s a l s o a t t h e maximum s i z e f o r t h e c u r r e n t power
supply enc losu re ,

Another approach i s t o r e p l a c e t h e PVC w e l l w i t h a -- .
more t r a c k - r e s i s t a n t t ub ing . Th i s new m a t e r i a l could then
wi ths tand t h e corona without a l lowing t h e degrada t ion pro-
c e s s t o occur . Two m a t e r i a l s were looked a t i n t h i s r e g a r d .
The f i rs t m a t e r i a l was a f i b e r g l a s s r e i n f o r c e d
melamine r e s i n t ub ing wi th a NEMA grade of G-9. NEMA
ranks bo th tubes and s h e e t s of va r ious organic m a t e r i a l s
by d i f f e r e n t c l a s s i f i c a t i o n s . A r a t i n g of G-9 i n d i c a t e s
t h a t t h e m a t e r i a l has s u p e r i o r a r c r e s i s t a n c e and thermal
s t a b i l i t y . Ma te r i a l s wi th a G-9 r a t i n g a r e used e x t e n s i v e l y
i n h igh vo l t age power f requency a p p l i c a t i o n s .
There were two problems encountered wi th t h e G-9 tubes .
F i r s t , whi le t h e G - 9 m a t e r i a l performed b e t t e r i n t h e
t e s t s t han t h e PVC, t h e G-9 m a t e r i a l d i d show some d e t e r -
i o r a t i o n under t h e more extreme a r c i n g c o n d i t i o n s . With
1 . 0 c c of wate r i n t h e G-9 w e l l s , t h e a r c i n g caused t h e
s u r f a c e t o become r u t t e d . It appeared t h a t t h e g l a s s
f i b e r s had become exposed.
The second problem wi th t h e G-9 tubes was a manu-
f a c t u r i n g concern. The PVC w e l l i s e a s i l y assembled wi th
PVC cement. The cemented j o i n t s a r e bo th s t r o n g and oil-i
t i g h t , Obtaining an easi ly- cemented and a r e l i a b l e j o i n t
was much ha rde r wi th t h e G-9 tube . Also, t h e t ub ing i s
n o t e a s i l y machined f o r a th readed j o i n t .
For t h e s e two r easons , t h e 12-9 m a t e r i a l w a s judged
t o be a n u n s u i t a b l e s o l u t i o n t o t h e a r c- t r a c k i n g problem.

Another material investigated was acrylic. Acrylic,
which is also known as plexiglass, is superior to the G - 9
glass-melamine in that it is easily glued with conventional
glues and techniques and it can be machined. Acrylic also
is superior to PVC in its performance under arcing. Under
tests run according to ASTM ~495, PV(: shows an arc resistance
of 60-80 seconds while acrylics are listed as "no track."
As mentioned previously, ASTM ~495 "Standardized
li Test for High Voltage, Low Current, Dry Arc Resistance of / I Solid Electrical Insulation'Yests for arc resistance with
an intermediate power density from a high voltage, low cur-
rent arc under clean and dry conditions. Since the arcing
in the well occurs under moist and contaminated conditions,
good performance in the ~495 test may not be sufficient for
similar service as the high voltage well. Therefore, the
acrylic wells were thoroughly tested under moist and con-
taminated conditions. -
A test similar to the one used to create arc-tracking
in the PVC wells was set up. Five-gallon buckets were filled
with transformer oil and several inverted wells were placed
in each bucket. -All the wells in a giver1 bucket were con-
nected in parallel. One well received the cable from the
high voltage power supply. The other wells had short cables
installed to simulate actual conditions. Half of the buckets
were sprayed with water, while the other half were dry.
None of the wells failed due to the arcing. However, -
the testing did show up a serious mechanical deficiency.

The acrylic material is very notch sensitive and is prone --=
to stress cracking. The machined threads were the cause
of a stress concentration that resulted in over 40% of the
wells failing mechanically. The acrylic was also very
sensitive to surface crazing caused by degreasing solvents.
The acrylic well was not used as a solution to the
arcing well problem because of these mechanical short-
comings.
Finally, attention was turned to improving the well
and cable surface conditions by eliminating the moisture
and contamination. During the early stages of the problem,
some methods of improving these conditions were implemented,
but with only marginal success. These methods included
shipping the power supply with a silica gel dessicant
inside the well. Also, various O-rings and seals were
added where the threaded adapter screwed into the well.
None of these methods produced a major improvement in
the problem.
The final method to improve the surface was to
replace the air in the well with something with a higher
dielectric strength. Various dielectric greases and gases
were considered, but the solution that was implemented
involved inverting the entire multiplier well assembly and
filling the well with transformer oil.
Transformer oil has been used successfully for many
years in HVDC cables and has several times the dielectric
strength of air. The oil drastically decreases the amount

of corona generated by the electrodes. Also, the oil --. -
displaces all the air in the well and increases the sur-
face dielectric strength. Finally, the oil is compatible
with both the PVC and the polyethylene, The power sup-
plies have been operating in this way for four years with-
out a single arc-tracking failure.

APPENDIX A
E x p e r i m e n t a l P rocedures -

EXPERIMENTAL PROCEDURES --
Experiment 1
Procedure :
Four complete systems c o n s i s t i n g of a n e l e c t r o s t a t i c
power supply , a h igh vo l t age c a b l e , and a e l e c t r o s t a t i c sp ray
gun, were s e t up and operated i n an e f f o r t t o cause w e l l f a i l -
u r e s . Normal corona c u r r e n t from t h e gun e l e c t r o d e i s 40-50 A .
The c u r r e n t be ing supp l i ed by t h e power supply was p e r i o d i c a l l y
recorded .
Data a:
CURRENT ( A )
SYSTEM OHRS 48HRS --- 7 2 ~ ~ s 1 4 4 ~ ~ s 2 1 . 6 ~ ~ s 6 0 0 ~ ~ s 1 50 50 52 5 0 50 __a_O__ 2 40 45 45 35 40
60 58
3 4
65 65 65 65 70 50 Fa i l* 60* 40 50 50
*Cable had f a i l e d , w a s r e p l a c e d .
Experiment 2
Purpose :
To e v a l u a t e mois ture and contaminat ion as a cause of
t h e a r c- t r a c k i n g . . .
For s e t up, s e e F igure 10 , and s e e Table 3 f o r Cable
end contaminat ion. The fol lowing n o t e s a r e e x c e r p t s from t h e
l a b notebook.
Tes t began on 3/2/81 a t 2:20 pm. Each power supply
w a s r ead ing 110 A .
3/3/8 1
Curren t down t o 100 A .

But a t 9:lO am, c u r r e n t jumped t o 150 A and w e l l 2B -- .
began a r c i n g . Cable end has b l ack carbon smudges on t h e t a c k
end and a yellow s t a i n nea r t h e swive l f i t t i n g . There was a
d i s t i n c t smel l of a c i d . The w e l l i t s e l f had v i s i b l e a r c s
when energized without t h e c a b l e .
N e l l 3D was worse o f f . The cab le end had swol len
from h e a t and was hard t o remove.
Well 3D was rep laced wi th a new we l l and a cab le end
wi th a Tef lon h e a t s h r i n k tub ing over t h e po lye thylene . Well
2B was r ep laced wi th a new w e l l and a s tandard cab le end.
Both w e l l s r ece ived l .Occ of water .
- The t e s t was resumed a t 2:50 pm. Current on both
u n i t s was 105 A .
Subsequent borescope examinations of t h e f a i l e d we l l s
showed a s i n g l e heavy t r a c k on 3D, bu t only h a i r - l i n e t r a c k s
on w e l l 2B.
3/5/8 1-
Curren t has dropped t o 90 A .
But a t 1:00 pm, t h e c u r r e n t was a t 110 A . By 1:10,
one u n i t was a t 150 A and t h e o the r was a t 165 A .
Bucket 2 appeared t o be drawing t h e high cur re r r t , s o
i t was t aken a p a r t and examined.
2A -- Incoming power-no degrada t ion .
2B -- Water doped-was unable t o remove cab le from w e l l because of swe l l ing .
2C -- Solvent doped-showed f a i n t s i g n s of t r a c k i n g and showed a carbon near t h e cab le a d a p t e r .

Bucket 3 w a s t h a n examined. --- -
3 A & 3 B -- c l e a n end t o o t h e r w e l l s and i n p u t power cab le - bo th OK.
3 C -- Solvent doped-looked OK.
3D -- Tef lon h e a t s h r i n k - s t i l l wet , b u t no deg rada t ion .
Cont inuing t o Bucket l - a l l w e l l s OK.
R e s t a r t e d t h e t e s t , wi thout w e l l 2B, a t 1:50 pm.
Current was 100 A .
3/6/81
S e t c u r r e n t l i m i t e r s a t 150 A f o r ope ra t ion over t h e
weekend. Examined t h e w e l l s :
3D -- Tef lon t r e e i n g apparen t on s u r f a c e of t h e po lye thy lene underneath t h e Tef lon h e a t s h r i n k . One s p o t of h e a t d i s t o r t i o n on t h e Tef lon and yel lowing nea r t h e cab le a d a p t e r . The w e l l a r c s wi thout t h e cab le i n i t .
2C -- Polyethylene showed some a l l i g a t o r - s k i n .
1 B -- Cable has f a i l e d d i e l e c t r i c a l l y .
A l l o t h e r w e l l s OK.
Removed w e l l 1 B and resumed t e s t . 3 D a r c i n g v i o l e n t l y
and r i p p l i n g o i l .
3/9/8 1
Terminated t e s t . Cur ren t l i m i t e r s had t r i p p e d .
3 D had swol len s o t h a t it could n o t be removed ( ~ e f i o n ) .
Experiment 3
Excerp ts from l a b notebook:
3/3 1/8 1.
Reconfigured t h e t e s t s e t up s o t h a t #3 bucket i s d r i v e n
by #1 power supply and t h e i n p u t power goes i n t o w e l l 3 A . The
c a b l e end former ly i n 3 A , now goes i n t o 3 B and a new one goes
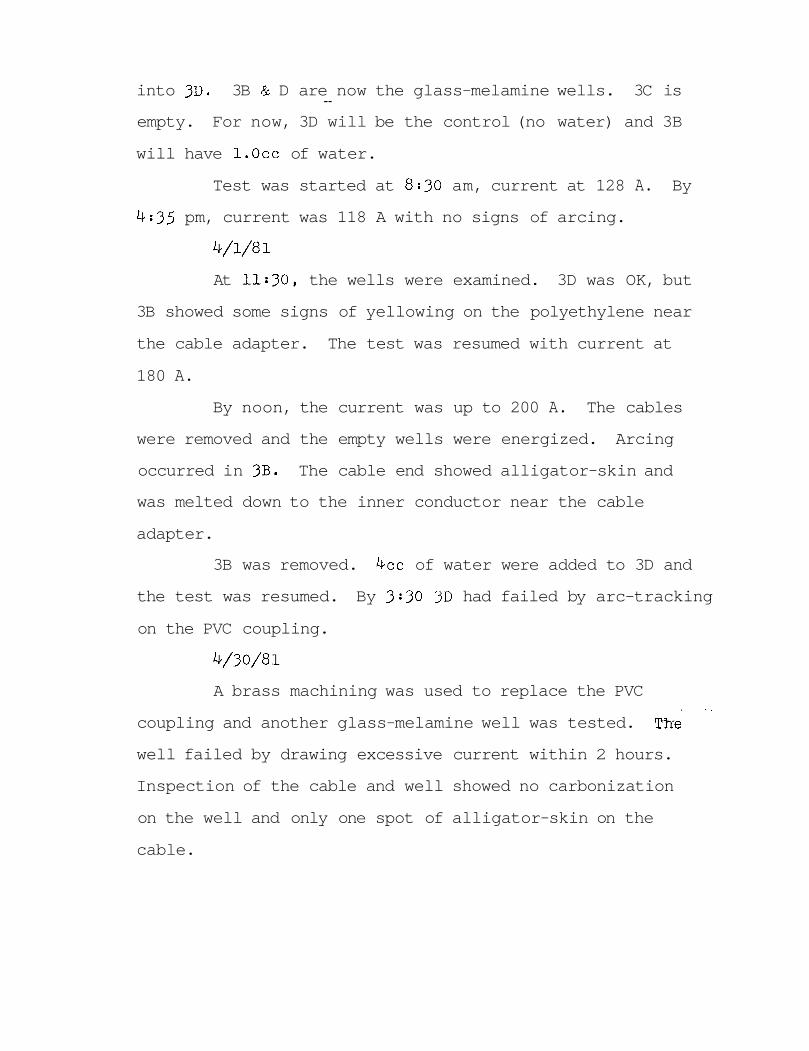
into 3D. 3B & D are now the glass-melamine wells. 3C is --
empty. For now, 3D will be the control (no water) and 3B
will have 1 . 0 ~ ~ of water.
Test was started at 8:30 am, current at 128 A. By
4:35 pm, current was 118 A with no signs of arcing.
4/1/8 1
At 11:30, the wells were examined. 3D was OK, but
3B showed some signs of yellowing on the polyethylene near
the cable adapter. The test was resumed with current at
180 A.
By noon, the current was up to 200 A. The cables
were removed and the empty wells were energized. Arcing
occurred in 3B. The cable end showed alligator-skin and
was melted down to the inner conductor near the cable
adapter.
3B was removed. 4cc of water were added to 3D and
the test was resumed. By 3:30 3 D had failed by arc-tracking
on the PVC coupling.
4/30/81
A brass machining was used to replace the PVC . ..
coupling and another glass-melamine well was tested. Th-e
well failed by drawing excessive current within 2 hours.
Inspection of the cable and well showed no carbonization
on the well and only one spot of alligator-skin on the
cable.

-- . BIBLIOGRAPHY
Books
Coelho, Roland. Physics of Dielectrics for the Engineey. New York: Elsevier Scientific Publishing Company, 1979
Kraus, John D. and Carver, Keith R. Electromagnetics. -- New Y ork: McGraw-Hill Book Company, 1973.
Millman, Jacob and Halkias, Christos C. Integrated Electronics : Analog and Digital Circuits and Systems. New York: McGraw-Hill Book Company, 19727
O'Dwyer, J.J. The Theory of Dielectric --- Breakdown of Solis. New York: Oxford University Press, 1964.
Popovic, Branko D. Introductory Engineering Electromagnetics. Reading, Massachusetts: Addison-Wesley Publishing Company, 1971.
S ~ U ~ S , H.L. and Pendleton, W.W. Materials ------ for Electrical Insulating and Dielectric Functions. Rochelle Park, --- New Jersey: Hayden Book Co. , 1973.
Schneberger, Gerald L. Understanding Paint and Painting --- Pro- cesses. Wheaton, 11liZis: Hitchcock Publishing C ompany, 19 79 -
Sillars, R.W. Electrical Insulating Materials and Their -- Appli- cation. New York: Peregrinus Publishing Company , 1973~ --
Zaky, A.A. and Hawley, R. Dielectric - Solids. London: Rout- ledge and Kegan Paul, 1970.
Articles . .
American Society for Testing Materials. "Standard Method of Test for High Voltage Low Current, Dry Arc Resistance of Solid Electrical Insulation." ASTM D495-73.
American Society for Testing Materials. "Standard Method of Test for Voltage Endurance of Solid Electrical Insul- ating Materials Subjected to Partial Discharges (Cor- ona) on the Surface." ASTM D2275-75.
American Society for Testing Materials. "Standard Test Method for Comparative Tracking Index of Electrical Insulating Materials." ASTM ~3638-77.

Dakin, T . W . , Ph i los f sy , H . M . , and Divens, W . C . "Ef fec t s of E l e c t r i c a l Discharges on t h e Breakdown of S o l i d In- s u l a t i o n . " AIEE ~ r a n s a c t i o n s , p t 111, May, 1954, 155-162.
Kurtz, M. "Tracking." IEEE E l e c t r i c a l ---.- I n s u l a t i o n Magazine, May, 1987, 12-14.
Mandelcorn, Lyon. 'The E f f e c t s of E l e c t r i c a l Discharges Be- tween Elec t rodes Across I n s u l a t i o n Surfaces , P a r t I . " AIEE Transact ions, p t 111, August, 1961, 481-485.
Mandelcorn, L., Hoff, R . E . , and Sprengling, G . R . "The E f f e c t s of E l e c t r i c Discharges Between Elec t rodes Across In- s u l a t i o n Surfaces , P a r t 111." AIEE Transact ions, - p t E, August, 1961, 486-494.
Rogers, E.C. and Skipper , D . J . "Gaseous Discharge Phenomena i n High Voltage D . C . Cable D i e l e c t r i c s . " The Pro- ceedings of the I E E , June, 1960, 241-254.
Wolter, Kevin D . , Johnson, J u l i a n F . , and Tanaka, John. "De- grada t ion Product Analysis f o r Polymeric D i e l e c t r i c Mater ia ls Exposed t o P a r t i a l Discharges." IEEE Tran- -- ~ a c t i o n s on E l e c t r i c a l I n s u l a t i o n , --- October, 1978, 327-336
Toriyama, Y . , e t a l . "Degradation of Polyethylene by P a r t i a l Discharge." IEEE Transact ions ---- on E l e c t r i c a l I n s u l a t i o n -P
August, 1967, 83-92.


![[Failure Mechanism in Spinning]](https://img.pdfslide.net/doc/110x75/577cd9b61a28ab9e78a4004c/failure-mechanism-in-spinning.jpg)