Embed Size (px)
Citation preview
January 2012
JAPAN INTERNATIONAL COOPERATION AGENCY
KOKUSAI KOGYO CO.,LTD
AERO ASAHI CORPORATION
THE DIGITAL TOPOGRAPHIC MAPPING PROJECTFOR
RECONSTRUCTION OF NORTHERN REGION
FINAL REPORT(Summary)
Democratic Socialist Republic of Sri LankaSurvey Department of Sri Lanka (SDSL)

1 USD = 77.95 Yen 1 LKD = 0.685 Yen

i
PREFACE
In response to a request from the Government of Sri Lanka, the Government of Japan
decided to conduct “The Digital Topographic Mapping Project for Reconstruction of Northern Region in the Democratic Socialist Republic of Sri Lanka” and entrusted the study to the Japan International Cooperation Agency (JICA).
JICA selected and dispatched a study team, headed by Mr. Akira NISHIMURA of
KOKUSAI KOGYO CO., LTD., and consisting of KOKUSAI KOGYO CO., LTD. and AERO ASAHI CORPORATION, between February 2010 and November 2011.
The team held discussions with the officials concerned of the Government of Sri Lanka
and conducted field surveys in the study area. Upon returning to Japan, the team conducted further studies and prepared this final report.
I hope that this report will contribute to the promotion of digital topographic mapping in
Sri Lanka and to the enhancement of friendly relations between our two countries. Finally, I wish to express my sincere appreciation to the officials concerned of the
Government of Sri Lanka for their close cooperation extended to the study. January 2011
Kiyofumi KONISHI Director General Economic Infrastructure Department Japan International Cooperation Agency

ii
Letter of Transmittal
Mr. Kiyofumi KONISHI Director General Economic Infrastructure Department Japan International Cooperation Agency It is a great honor to submit herewith the final report of Digital Topographic Mapping Project for Reconstruction of Northern Region in the Democratic Socialist Republic of Sri Lanka. This report incorporates the suggestions received from the Japan International Cooperation Agency (JICA) and concerned authorities, as well as the agencies concerned of the Government of Sri Lanka including the Survey Department of Sri Lanka (SDSL). During the Study, a digital topographic map at the scale level of 1:10,000 for part of the Northern Region was developed, and the techniques (GPS survey, leveling, digital aerial triangulation, digital plotting/editing, GIS structualization and map symbolization) concerned with this work were transferred to the SDSL. Furthermore, activities (seminar/workshop) concerning the dissemination of geographic information were implemented. In the final part of this report, specific issues and recommendations are made based on the results of the study, and the work manual (Guideline), which covers developing, maintaining and managing the geospatial data and GIS database, is attached in the report. From the viewpoint of maintaining and developing the results of the study, I hope that these issues, recommendations and the work manual (Guideline) are promptly accepted for implementation and the manual used by the agencies concerned of the Government of Sri Lanka. On behalf of the study team, I would like to express my sincere gratitude to JICA, the Ministry of Foreign Affairs, the Ministry of Land, Infrastructure, Transport and Tourism, and the agencies concerned for the valuable advice and cooperation they provided us during the implementation of this study. I would also like to extend my deep appreciation to the agencies concerned of the Government of Sri Lanka, including SDSL, for their generous assistance and cooperation during our stay in Sri Lanka. January 2011
Akira NISHIMURA Team Leader Digital Topographic Mapping Project for Reconstruction of Northern Region in the Democratic Socialist Republic of Sri Lanka
Location map of Digital Topographic Mapping Project for
Reconstruction of Northern Region in Sri Lanka
Democratic Socialist Republic of Sri Lanka
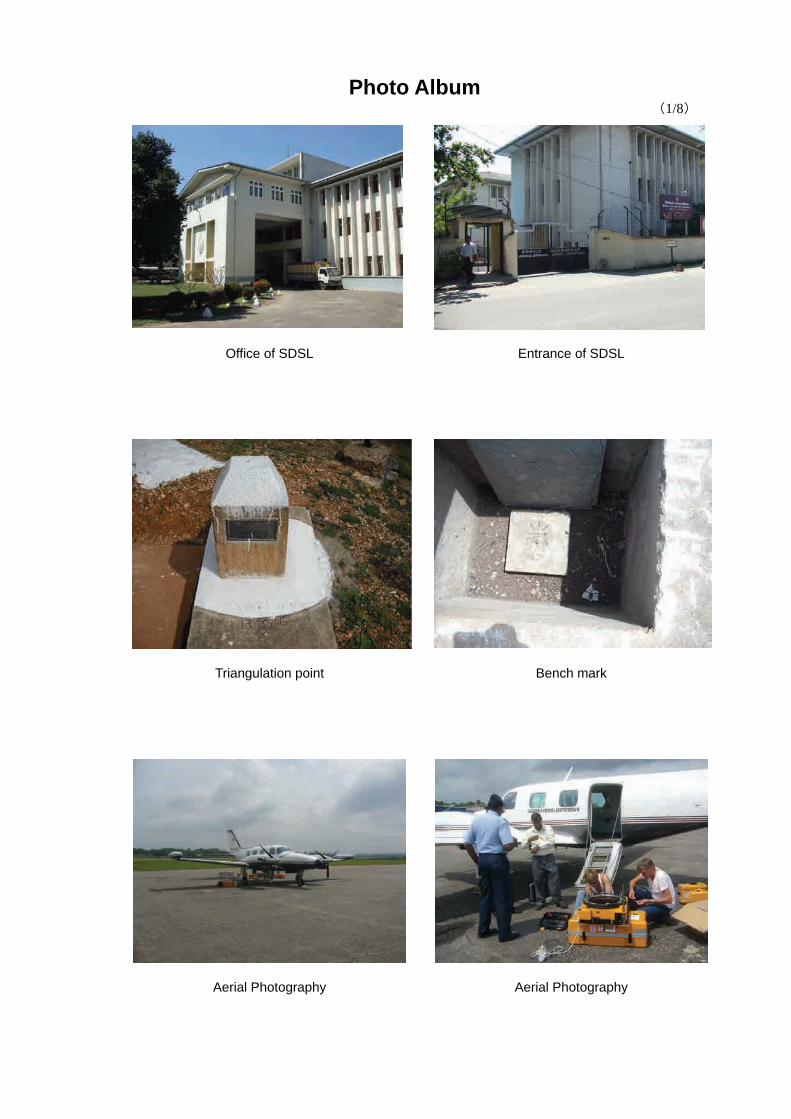
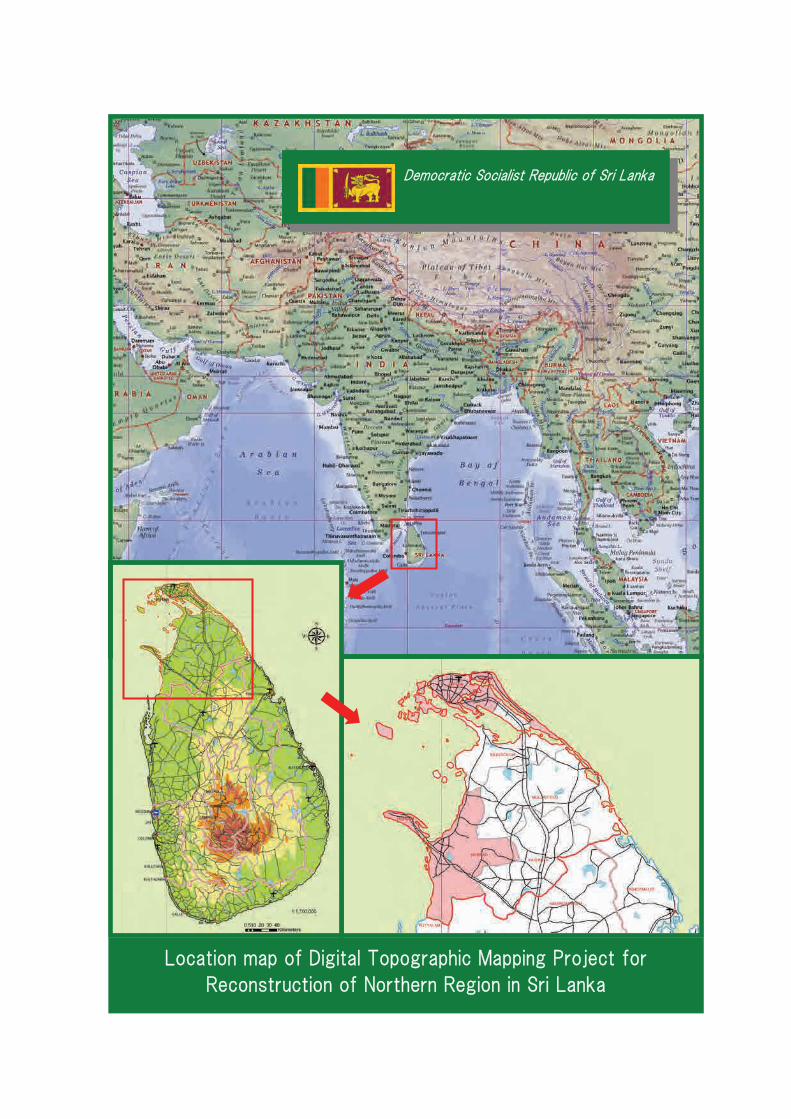
Photo Album (1/8)
Office of SDSL Entrance of SDSL
Triangulation point Bench mark
Aerial Photography Aerial Photography
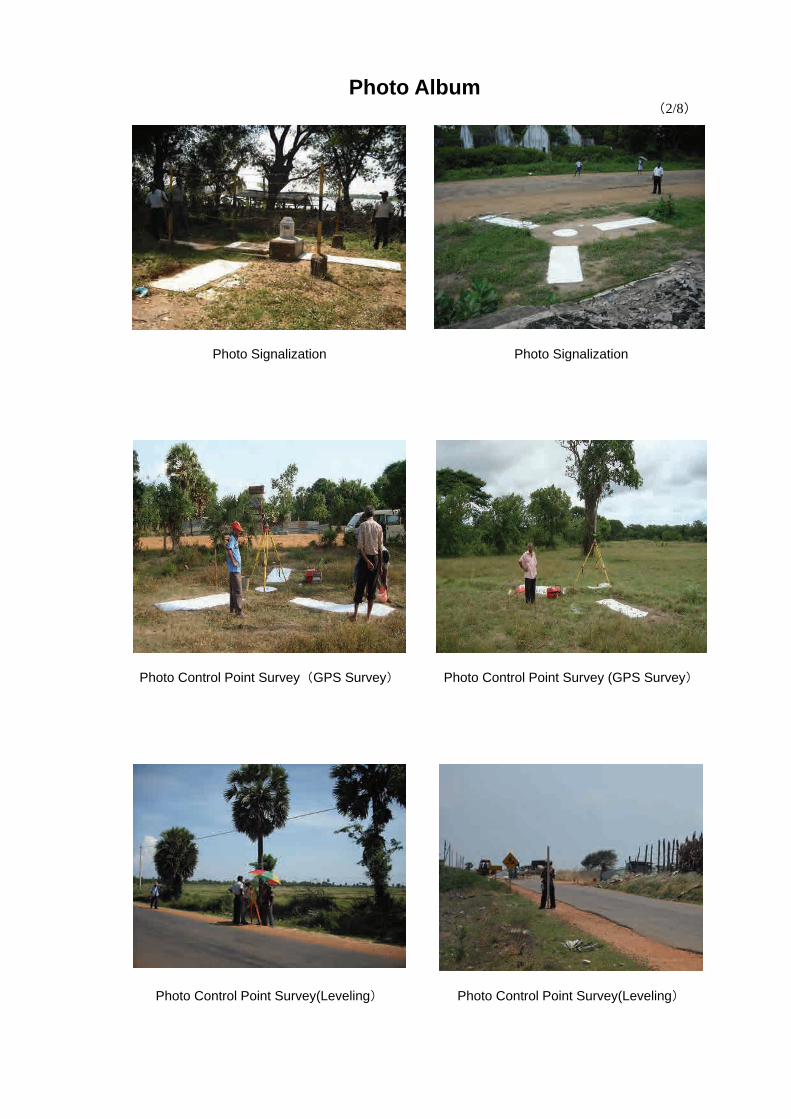
Photo Album (2/8)
Photo Signalization Photo Signalization
Photo Control Point Survey(GPS Survey) Photo Control Point Survey (GPS Survey)
Photo Control Point Survey(Leveling) Photo Control Point Survey(Leveling)
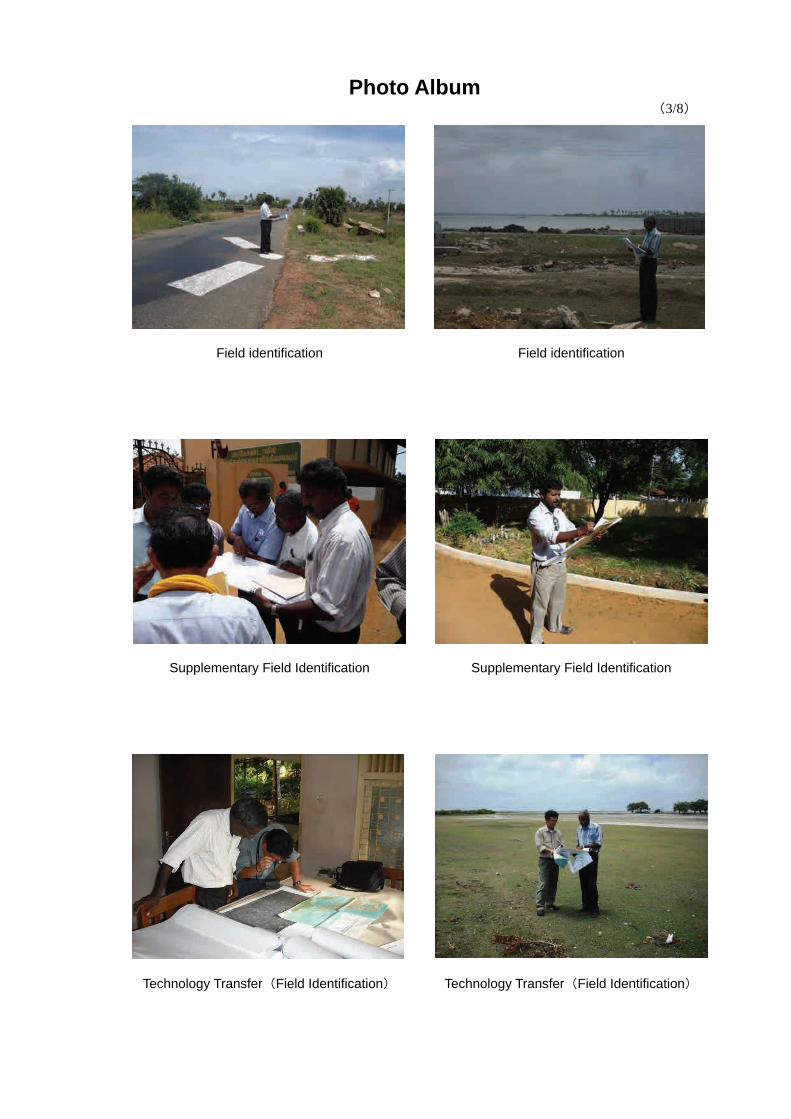
Photo Album (3/8)
Field identification Field identification
Supplementary Field Identification Supplementary Field Identification
Technology Transfer(Field Identification) Technology Transfer(Field Identification)
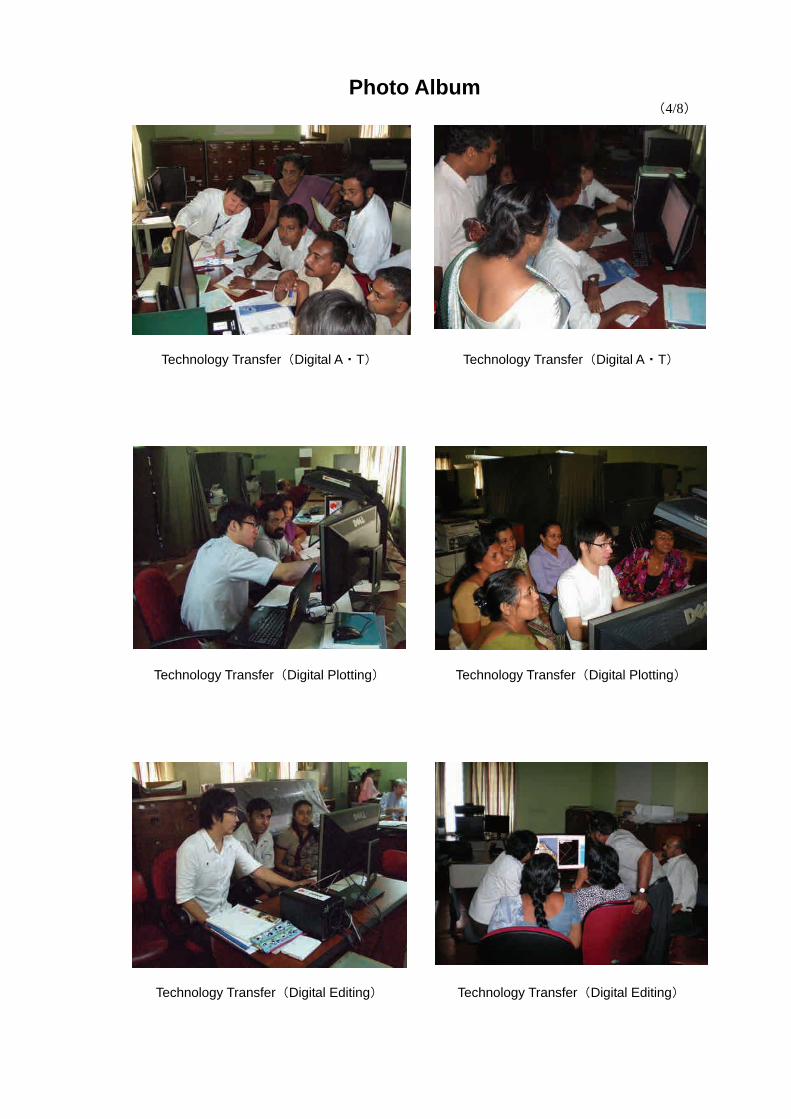
Photo Album (4/8)
Technology Transfer(Digital A・T) Technology Transfer(Digital A・T)
Technology Transfer(Digital Plotting) Technology Transfer(Digital Plotting)
Technology Transfer(Digital Editing) Technology Transfer(Digital Editing)
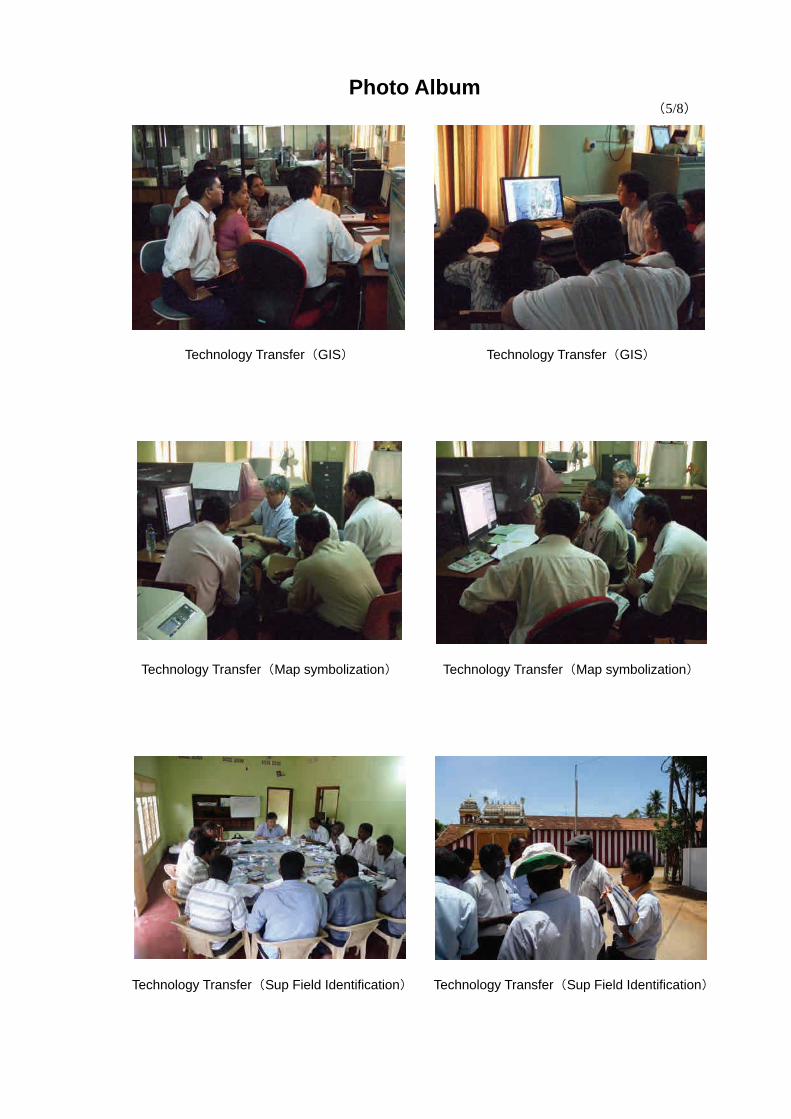
Photo Album (5/8)
Technology Transfer(GIS) Technology Transfer(GIS)
Technology Transfer(Map symbolization) Technology Transfer(Map symbolization)
Technology Transfer(Sup Field Identification) Technology Transfer(Sup Field Identification)
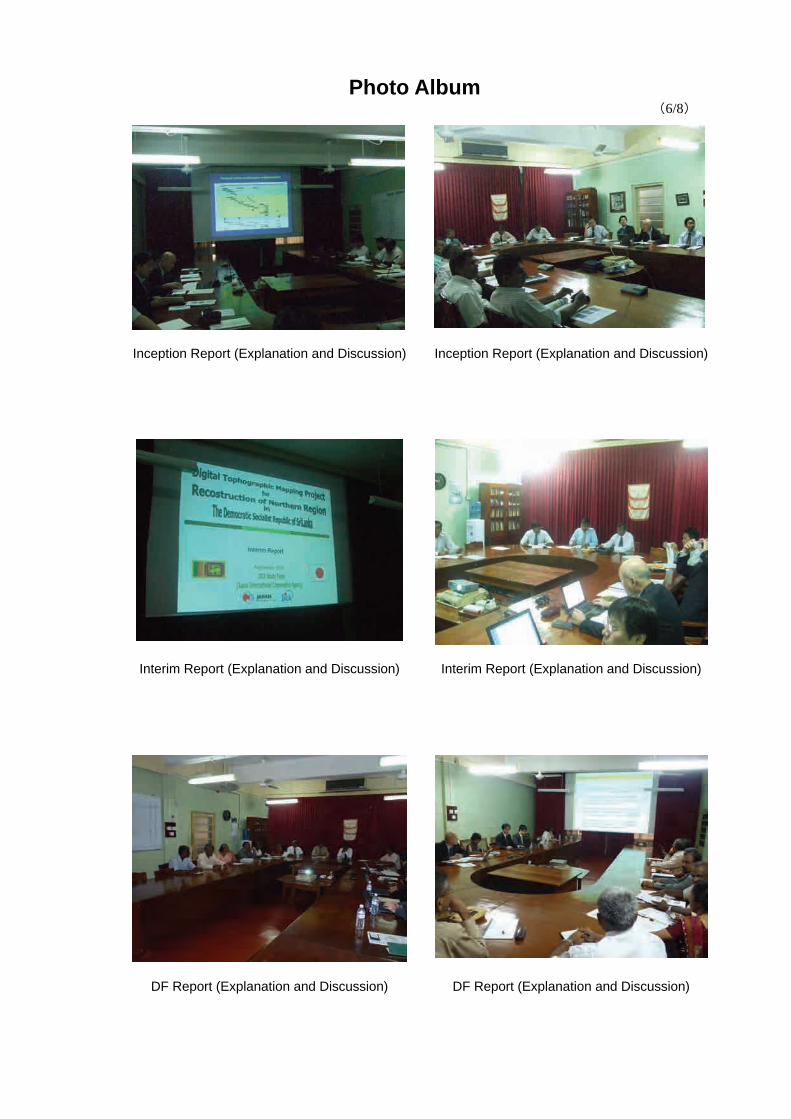
Photo Album (6/8)
Inception Report (Explanation and Discussion) Inception Report (Explanation and Discussion)
Interim Report (Explanation and Discussion) Interim Report (Explanation and Discussion)
DF Report (Explanation and Discussion) DF Report (Explanation and Discussion)
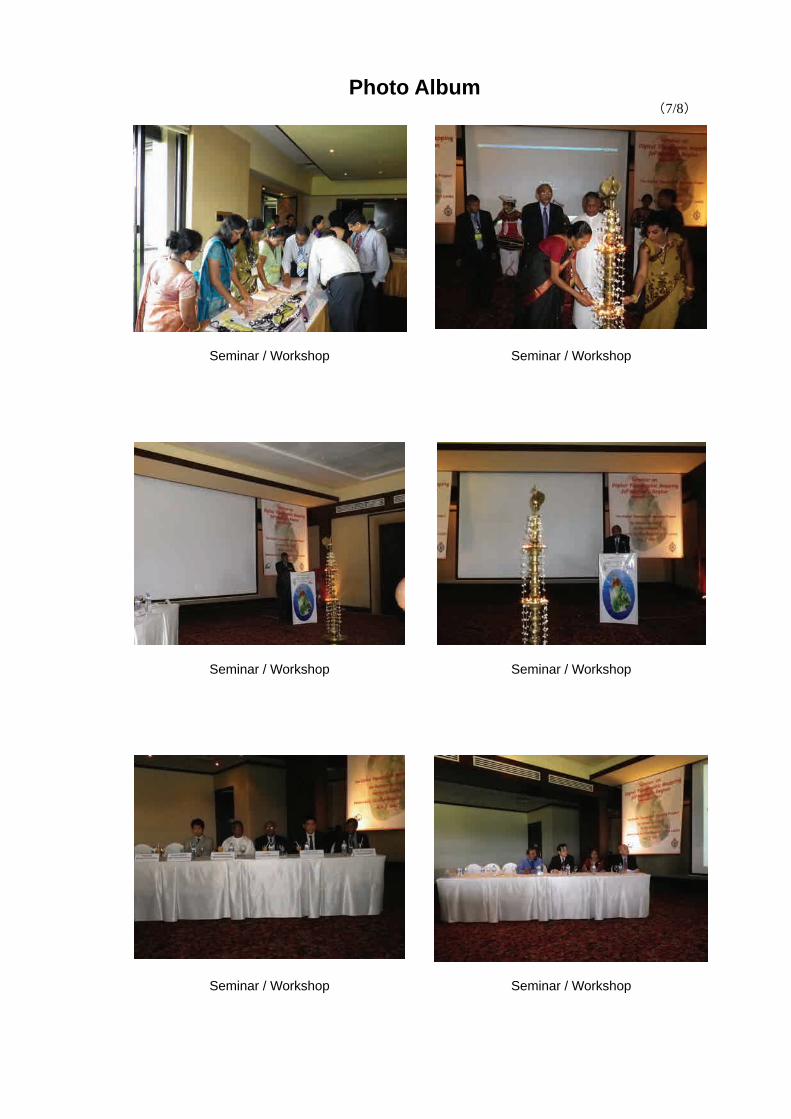
Photo Album (7/8)
Seminar / Workshop Seminar / Workshop
Seminar / Workshop Seminar / Workshop
Seminar / Workshop Seminar / Workshop
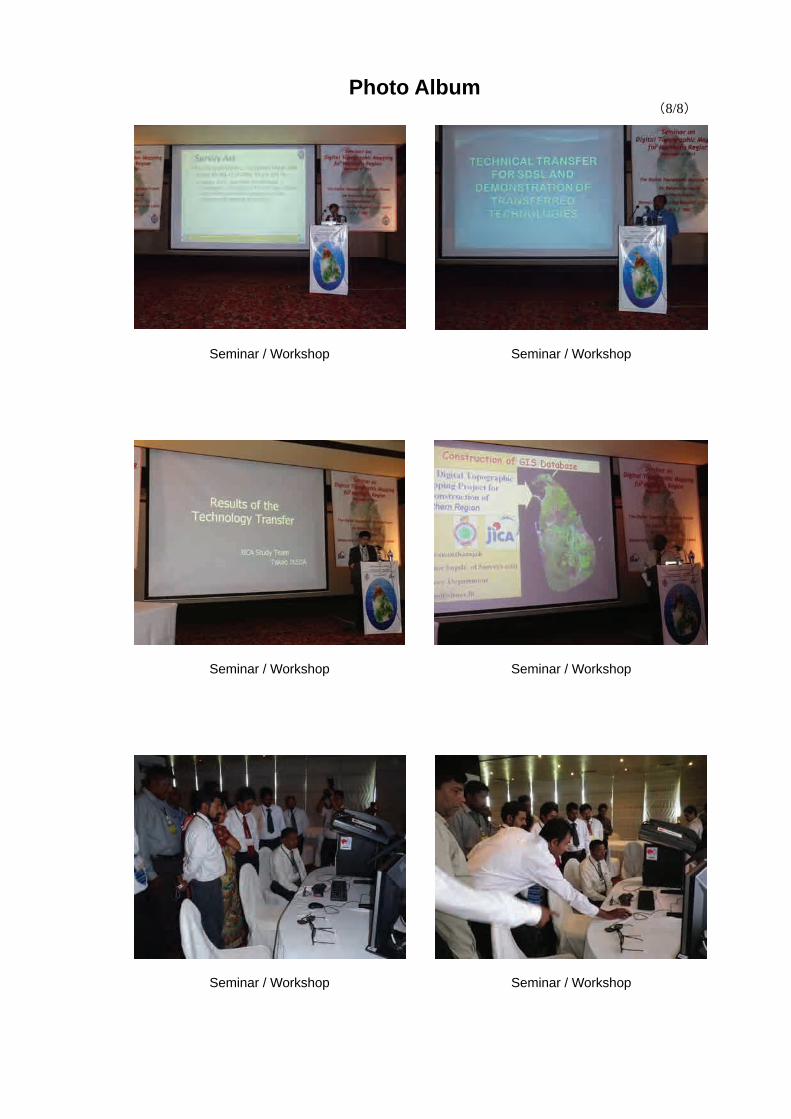
Photo Album (8/8)
Seminar / Workshop Seminar / Workshop
Seminar / Workshop Seminar / Workshop
Seminar / Workshop Seminar / Workshop
1
Executive Summary 1. Outline of the Study 1.1 Objective of the Study
Nearly 30 years of armed conflict in Sri Lanka came to an end in May 2009. This long armed conflict inflicted severe damage on people’s lives and on the social infrastructure required for their livelihoods, especially in the Northern Region.
The reconstruction of the region and the livelihoods of its people has always been an important issue since the end of the armed conflict. The formulation of reconstruction plans and their implementation requires the latest geographic information.
Against this background, this Study was implemented for the following objectives: a. Aerial photographs of the entire Northern Province of Sri Lanka b. Production of 1/10,000-scale digital topographic maps of Mannar and Jaffna
Districts in Sri Lanka c. Technology transfer for the production of digital topographic maps through
implementation of a and b.
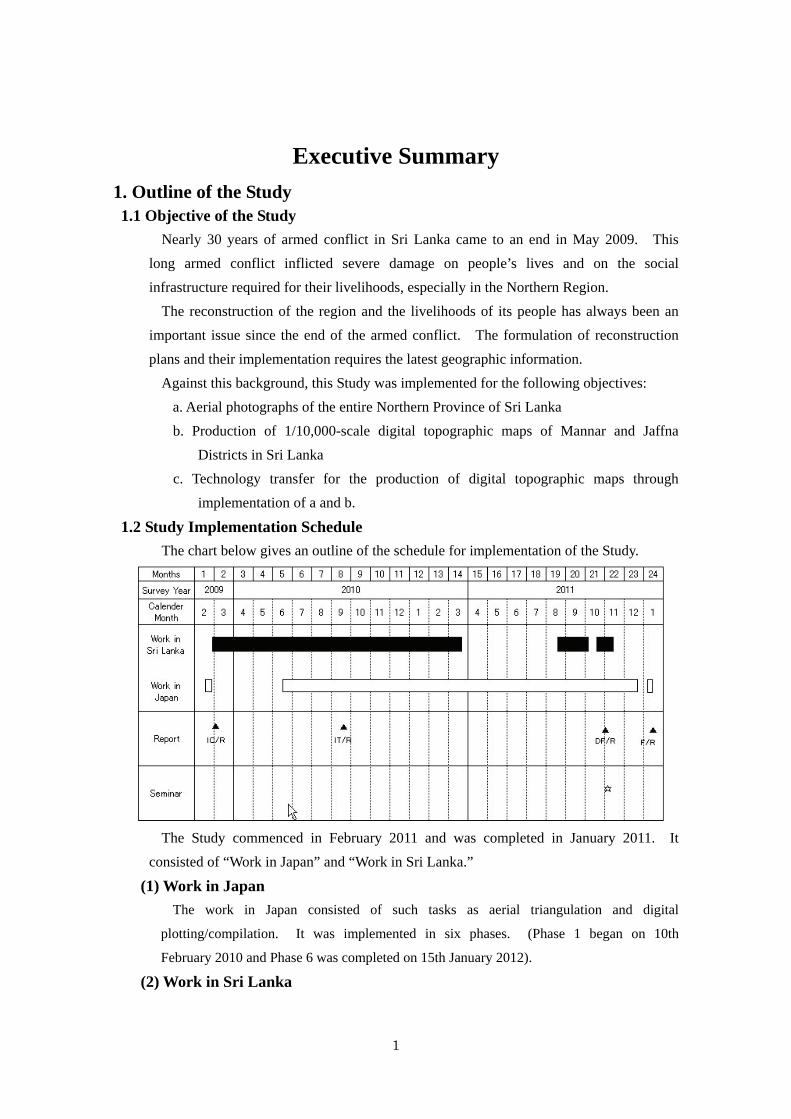
1.2 Study Implementation Schedule The chart below gives an outline of the schedule for implementation of the Study.
The Study commenced in February 2011 and was completed in January 2011. It
consisted of “Work in Japan” and “Work in Sri Lanka.”
(1) Work in Japan The work in Japan consisted of such tasks as aerial triangulation and digital
plotting/compilation. It was implemented in six phases. (Phase 1 began on 10th
February 2010 and Phase 6 was completed on 15th January 2012).
(2) Work in Sri Lanka
2
The work in Sri Lanka consisted of such tasks as control point survey and the transfer of various technologies. It was implemented in six phases. (Phase 1 began on 28th February 2010 and Phase 6 was completed on 9th November 2011).
1.3 Implementation of the Survey 1.3.1 Implementation of the Digital Topographic Mapping
Digital photogrammetry was used to carry out the following work in order to achieve objectives ‘a’ and ‘b’ of the Study.
(1)Discussion of Specifications Discussions were held between the Survey Department of Sri Lanka (SDSL) and the
Study Team on the geodetic reference system (ellipsoid of reference and coordinate system) and the digital map specifications required for the production of digital topographic maps. Discussions were also held on the areas to be mapped in Mannar and Jaffna Districts.
(2) Aerial Photography The aerial photography was subcontracted to a local company, Finnmap FM
International, which was awarded the contract in a competitive tender. The subcontractor took aerial photographs of the entire Northern Region over two
periods, the first in June 2010 and the second in March 2011, after permits had been obtained from the various relevant authorities, including the Ministry of Defence and the Civil Aviation Authority. The main specifications for the aerial photography were as follows:
* Scale of photography: 1/20,000 * Type of photography: Colour photography * Method of photography: GPS/IMU method * Percentage of duplicate coverage: Overlap: 60 % (standard)
Sidelap 30 % (standard)
(3) Photo Control Point Survey Photo control point survey (GPS survey and levelling) to establish photo control
points required for the subsequent aerial triangulation was implemented with technical assistance from SDSL. Before the implementation of the photo control point survey, air photo signals had been placed at all photo control points (horizontal control points).
1) GPS Survey The GPS receivers of SDSL were used for 8-hour continuous observation of the
existed control points and 1-hour simultaneous observation of newly-established photo control points.
After the analysis of the observed data, the coordinates of each photo control point
3
were calculated in the geodetic reference system stipulated in the specifications. The elevation of each of the photo control points was measured, wherever possible, in the levelling work described below.
2) Levelling Levelling was carried out on the routes deduced from the data on aerial photographs
and satellite imagery, with technical assistance from SDSL and its equipment. Sketches of the vertical control points established in the levelling work were made
and used as reference materials for pricking on aerial photographs. As mentioned above, the elevations of the horizontal control points surveyed in the
GPS surveying were measured, wherever possible, in the levelling.
(4) Field Identification Field identification was implemented in Jaffna District and elsewhere using the aerial
photographs, with technical assistance from SDSL. 1) Photo Interpretation for Field Identification
Before the field surveys, aerial photographs were interpreted in the office. In the photo interpretation, interpretable features were identified on aerial
photographs in accordance with the established map symbol specifications. 2) Field Identification
Field surveys were carried out with the aerial photographs used in the photo interpretation. Feature data which could not be obtained from photo interpretation (such as data on features which could not be identified in the photographs, names of roads and structures, etc.) were collected in the surveys.
(5)Aerial Triangulation Aerial triangulation was implemented separately for the area for which digital
topographic maps were to be produced and for the entire Northern Region including the area for which digital topographic maps were to be produced, because of the delay in carrying out the aerial photography.
1) Aerial Triangulation for Digital Topographic Mapping Aerial triangulation for digital topographic mapping was implemented in four blocks,
namely, the southern part of Jaffna District, the islands, the northern part of Jaffna District and Mannar District, over two periods.
Before the implementation of the aerial triangulation, the number and locations of photo control points in each block were evaluated for the purpose of accuracy control. It was concluded from this evaluation that aerial triangulation with the established photo control points would satisfy the degree of accuracy required for the 1/10,000-scale digital topographic maps if it was used together with the results of the GPS/IMU

4
analysis. After the evaluation, aerial triangulation using the bundle method was implemented
for the image data obtained from the aerial photography and the results of the photo control point survey.
2) Aerial Triangulation of the entire Northern Province Digital and analog aerial triangulation of the entire Northern Region was carried out.
Part of the island area was excluded from the calculation of the aerial triangulation of the entire region. Instead, the orientation elements required for plotting were calculated separately. a. Digital aerial triangulation of the entire Northern Region
Digital aerial triangulation of the entire Northern Region was carried out using the same method as the aerial triangulation of the area for digital topographic mapping.
b. Analog aerial triangulation of the entire Northern Region Analog aerial triangulation of the entire Northern Region was carried out by means
of the following procedures: Selection of points: Tie points were established in overlapped aerial photograph. Pricking: Tie points selected as described above and other points was pricked on
diapositive film. Observation: Machine coordinates of the pricked tie points and photo control points
were observed. Inner orientation: The machine coordinates of the tie points and photo control points
were transformed into photographic coordinates in the inner orientation.
Relative orientation: The photographic coordinates of the tie points and photo control points were transformed into model coordinates in the relative orientation.
Adjustment calculation by the bundle method: Adjustment calculation by the bundle method was carried out using the photographic coordinates of the tie points and photo control points and the results of the photo control point survey.
(6)Digital Plotting/Compilation Digital plotting and compilation was carried out using the results of the aerial
triangulation and the field identification in accordance with the map symbol specifications. 1) Digital Plotting
Digital data of topographic features were obtained in accordance with the map
5
symbol specifications, using various types of digital plotters. The digital data of topographic features that were obtained are either point, line or polygon in form, in accordance with the map symbol specifications.
2) Digital Compilation Digital compilation was carried out using the digitally-plotted data and CAD software
for data compilation, MicroStationV8. In practice, in the digital compilation each symbol was moved to the appropriate
location, annotations and administrative boundaries were added and consistency between topographic features data was established. In the final stage, items for supplementary field verification were identified.
7) Supplementary Field Verification Uncertainties identified in the digital plotting/compilation were eliminated and
administrative boundaries and names were confirmed definitively in the supplementary field verification. The supplementary field verification was implemented with technical assistance from SDSL. 1) Implementation Period and Organizations Involved
The supplementary field verification was implemented over two periods, with technical assistance from SDSL. Eleven teams of SDSL staff members carried out the supplementary field verification in the period of October 2010 and 12 teams in the period of September 2009.
2) Details of the Work Data on administrative boundaries and names, road classifications and the results of
the control point were obtained in the indoor work. Meanwhile, uncertainties identified in the digital plotting/compilation were eliminated and data on additional features to be represented on the maps were obtained in the field work. Data on road kilometer posts, high-voltage transmission lines and a disused railroad, the names of major road intersections and major facilities and annotations were also obtained.
(8) Supplementary Digital Compilation The results of the supplementary field verification (the results of the elimination of
uncertainties, acquisition of data on road kilometer posts, high-voltage transmission lines, etc.) were added to the topographic map data in such a way as to maintain data consistency with nearby features.
(9)Digital Data Structuralization The data processed in the digital compilation after field completion were structuralized.
1) Structuralizing Compilation The data processed in the supplementary digital completion were inspected and
6
corrected for logical errors and were structuralized topologically. 2) Data Format Conversion
The data processed in the structuralizing compilation were converted into data in DXF and SHPE formats per each map sheet.
(10) Map Symbolization AI data for printing 1/10,000-scale maps were produced from the structuralized digital
topographic map data. 1) Map Symbolization of Topographic Map Data
Map symbols were created in accordance with the map symbol specifications and correspondence was established between the symbols created and each topographic feature data. The order of feature layers was rearranged for better representation on the output topographic maps. Where two or more feature symbols overlap, the location of symbols on the map was transferred so as to make all the symbols distinguishable.
2) Map Symbolization of Marginal Information Topographic features in legends included in marginal information were symbolized in
accordance with the map symbol specifications. The other marginal information was also symbolized.
3) Integration of Symbolized Topographic Map Data and Symbolized Marginal Information Data AI data for output maps were produced by integrating symbolized topographic map
data and marginal information data and adding data such as the map sheet number and title to each sheet.
(11)Production of Digital Data File Vector data in DXF and SHPE formats produced in the digital data structuralization and
symbolized AI data converted into raster format (PDF format) were stored on DVDs and other recording media.
1.3.2Implementation of Technology Transfer Technologies in the technical fields relevant to digital photogrammetry were transferred
to the counterparts in order to achieve objective ‘c’ of this Study.
(1) Photo Control Point Survey Since SDSL already had sufficient experience in photo control point survey
(GPS survey and levelling), the focus of the technology transfer in photo control point survey was on the technologies required for the implementation of aerial triangulation.
7
1) GSP Survey Methods of calculating the number of photo control points and distributing
photo control points required for the implementation of aerial triangulation were transferred to the counterparts.
2) Levelling Methods of calculating the number of vertical control points and distributing
vertical control points required for implementing aerial triangulation and for determining levelling routes were transferred to the counterparts.
3) Installation of Air Photo Signal and Pricking Since the focus of the technology transfer was on the implementation of aerial
triangulation, technologies for installing air photo signals and pricking, including the preparation of detailed drawing of air photo signals and pricking points, were also transferred to the counterparts.
(2) Field Identification Since SDSL had no experience of field identification using aerial photographs,
technologies required for this, including indoor photo interpretation and practical work in field identification, were transferred to the counterparts.
(3) Aerial Triangulation SDSL had abundant experience in analog aerial triangulation and knew the
general technologies for aerial triangulation. Therefore, technology transfer in aerial triangulation was implemented with the focus on how to use the software for digital aerial triangulation introduced in this project.
(4) Digital Plotting/Compilation SDSL had abundant experience in digital plotting/compilation. SDSL owns
digital plotters, though none of them are of the same model as the plotter used in this Study, and is routinely implementing digital plotting work. Similarly, SDSL is implementing digital compilation using an older version of the digital compilation software which was introduced in the project.
Under these circumstances, the technology transfer in digital plotting/compilation was implemented with the focus on how to use the digital plotting system to be introduced in the project, and how to use the latest digital compilation software.
(5) Supplementary Field Verification SDSL had abundant experience in supplementary field verification using output
maps of digitally edited data. Based on this, technology transfer in supplementary field verification included the following:

8
a. How to eliminate uncertainties identified in the digital plotting/compilation; b. How to make a final confirmation on certain features c. How to create and use annotation data files d. Schedule management and accuracy control technologies
(6) Digital Data Structuralization SDSL had experience in various kinds of works in which Arc GIS software was used.
Therefore, the focus of the technology transfer in digital data structuralization was on the
development and use of technologies to facilitate and automate data processing (including
structuralization), in which the staff of SDSL were involved routinely in their work, instead of
the basic operation of the latest ArcGIS software introduced in the project.
(7)Map Symbolization Technologies for the use of the software introduced in the project (Adobe Illustrator) for
transforming the data processed in the supplementary digital completion into AI data for maps
to be printed out were transferred to the counterparts in the technology transfer in map
symbolization. The actual technologies transferred are listed below.
a. Establishment of printing environments
b. Basic operation of Adobe Illustrator CS5
c. Production of topographic map symbols in accordance with the map symbol
specifications
d. Special map symbolization technologies (change of scale, rearrangement of the layer
order, trimming, etc.);
e. Production of data files for printout topographic maps
1.3.3 Other Work (1)Holding of Seminar/Workshop
A seminar/workshop was held on 4th November 2011 with the participation of the Secretary
of the Ministry of Land and Land Development, the ministry in charge of SDSL.
At the seminar/workshop, the process by which the project was implemented and the results
of its implementation were presented, and the results of the technology transfer (including
demonstrations) was revealed to a wide public audience. Samples of the digital topographic
maps that had been produced were also shown at the seminar/workshop. SDSL announced
its plan to produce digital topographic maps of the unmapped areas of the Northern Region.
In addition, the guidelines for the future production of geospatial data by SDSL were
presented.
(2)Reports 1) Preparation of the Reports
The following reports were prepared in the project:
9
a. Inception Report: Describing the outline of the project and methods of implementation.
b. Interim Report: Describing the achievements of project implementation by the end of September 2010 and the work scheduled for implementation thereafter.
c. Draft Final Report: Describing the progress and results of the implementation of the project in its entirety.
d. Final Report: Describing the progress and results of the implementation of the project in its entirety, tasks remaining and recommendations for future activities.
2) Explanation and Discussion of the Reports After the completion of the Inception Report, Interim Report and Draft Final Report
respectively, an explanation of the report was given to SDSL and discussions were held with them on the report.
At each explanation/discussion meeting, the SDSL side approved the report after raising some technical questions and making a few requests.
1.4 Results of the Implementation of the Survey 1.4.1 Results of the Production of Digital Topographic Mapping
(1) Discussion of the Specifications In discussions between the SDSL and the Study Team, it was decided to use the
following geodetic reference system in the project: Reference ellipsoid: Everest 1830 Coordinate system: Sri Lanka Datum 1999 (SLD-99-2) Projection method: Transverse Mercator projection
The map symbol specifications for 1/10,000-scale digital topographic maps were established. The areas in Mannar and Jaffna Districts for topographic mapping (100 map sheets covering an area of 2,008.2 km2) were also determined.
(2) Aerial Photography Aerial photography of the entire target area of approximately 9,000 km2 (2,494
photographs from 61 flight courses) was eventually completed after many difficulties.
(3) Photo Control Point Survey One hundred and five control points were established in GPS survey, and levelling was
carried out over a length of approximately 550 km over several phases.
(4) Field Identification Field identification was carried out in a 36 km2 area in Jaffna District.
(5)Aerial Triangulation
10
While aerial triangulation was implemented initially for the area for topographic mapping,
in the end digital aerial triangulation (2,127 photographs from 61 flight courses) and analog
aerial triangulation (2,031 photographs from 61 flight courses) of the entire region were
carried out.
(6) Digital Plotting/Compilation Data for the area of 2,008.2 km2 on the 100 map sheets were digitally plotted and
compiled.
(7)Supplementary field verification Supplementary field verification of the area of 2,008.2 km2 on the 100 map sheets was
implemented over two phases. (8) Supplementary Digital Compilation, Digital Data Structuralization and Map
Symbolization
Supplementary digital compilation, digital data structuralization and map symbolization of topographic map data on the area of 2,008.2 km2 on the 100 map sheets were implemented.
(9)Production of Digital Data File Files in the various formats of topographic map data corresponding to the area of
2,008.2 km2 on the 100 map sheets were produced.
1.4.2 Results of the Implementation of Technology Transfer (1)Photo Control Point Survey
1) GPS Survey The counterparts have fully mastered how to calculate the number of photo control
points for GPS survey. At the same time, they are not considered to have sufficiently mastered the method of distributing photo control points, because of a lack of practice.
2) Levelling The counterparts have completely mastered how to select levelling routes and how to
make reasonable observations.
(2)Field Identification Because only a limited amount of field identification has been carried out, it is not
considered that the counterparts have sufficiently mastered the technologies for field identification. They will need more experience to gain complete mastery of the technologies.
(3)Aerial Triangulation The counterparts have become able to make full use of the software for digital aerial
triangulation that was introduced. This proves that they have completely mastered the technologies used in the aerial triangulation.

11
(4) Digital Plotting/Compilation The counterparts have completely mastered the use of the latest digital
plotting/compilation system introduced in the project, partly due to their prior practical experience in digital plotting/compilation.
(5) Supplementary Field Verification The counterparts have completely mastered the technology in supplementary field
verification partly due to their prior practical experience in supplementary field verification. However, they have yet to master the technology for the preparation of a supplementary field verification manual.
(6) Digital Data Structuralization The transferred technologies were at higher levels than originally planned and the
counterparts have fully mastered the technologies that enable them to use the software to facilitate and automate data structuralization.
(7) Map Symbolization Although the counterparts had not had experience in map symbolization using the map
symbolization software that was introduced, they have completely mastered the basics of it and have become able to carry out map symbolization.
1.5 Production of Project The implementation of the Study has produced the following outputs:
(1) Study Reports a. Inception Report in English, 25 copies b. Interim Report in English, 25 copies c. Draft Final Report
Main in English, 25 copies Summary in English, 25 copies
d. Final Report Main in English, 25 copies Summary in English, 25 copies
(2) Products a. Aerial photographs
Exposed films 1 set Digital data files 1 set Contact prints 2 sets Aerial photography index maps 1 set
b. Field survey results 1 set c. Aerial triangulation results 1 set
12
d. Digital data files (scale 1/10,000 topographic maps) 1 set
2. Efforts toward the Development of Digital Topographic Maps 2.1 Effective Use of the Project Outputs 2.1.1 Effective Use of the Digital Topographic Maps
Digital topographic maps covering approximately a quarter of the entire Northern Region were produced in this project in accordance with the specifications.
The following are required for the use of the digital topographic maps that were produced:
*Publication and dissemination of the specifications for the digital topographic maps *Public availability of the digital topographic maps and the implementation of publicity
activities to promote their use *Establishment of a mechanism for the supply of digital topographic maps (including a
pricing policy and supply method)
2.1.2 Effective Use of the Results of the Technology Transfer The Study Team has evaluated the results of the technology transfer carried out
during the implementation period of this project. Apart from the evaluation by the study Team, SDSL should implement an independent evaluation of the results of the technology transfer using the reports of the recipients of the technology transfer. This evaluation will mark the first step for SDSL toward the effective use of the results of the technology transfer.
2.2 Tasks based on the Results of the Technology Transfer Since the technology transfer was carried out over a number of different technical fields,
some difference has been noted in the level of the results of the technology transfer depending on the technical field.
The level of mastery is high in the fields where SDSL had prior experience in the use of similar technologies (observation and analytical calculation in the photo control point survey, digital plotting/compilation, supplementary field verification and digital data structuralization). The level of mastery of the transferred technologies is also high in those fields where the transferred technologies have been used repeatedly (installation of air photo signals and production of sketches of pricked points).
At the same time, the level of mastery of the transferred technologies is low in technical fields in which the counterparts had little prior experience or where the transferred technologies have not been used repeatedly (distribution of photo control points and map symbolization).
These findings reveal the need for improvement in the level of mastery of the transferred

13
technologies in those technical fields where the level of mastery is low, by means of repeated practice, dissemination of the mastered technologies and improvement in productivity of the mastered technologies.
2.3 Production of Digital Topographic Maps for the Remaining Unmapped Areas in the Northern Region At the end of the completion of the Project there have been high expectations for the
production of digital topographic maps of the unmapped area of the Northern Region.
2.3.1 The Map Production Project for the Unmapped Areas in the Northern Region by SDSL
SDSL announced its plan for the production of digital topographic maps of the unmapped areas based on the relevant government office. The announced plan assumes completion of digital plotting/compilation of the entire area, which is to be carried out according to the order of priority of each map sheet by June 2014. In an alternative plan, which assumes doubling of the work force, the date for the completion is set in March 2013.
2.3.2 Issues Requiring Attention in the Production of Digital Topographic Maps of the Unmapped Areas of the Northern Region
There are several issues requiring attention (in the processes following digital plotting, in particular) before SDSL’s plan for the production of the digital topographic maps can be implemented.
(1) Improvement of the Technical Capacity to Produce Digital Topographic Maps The results of the Project include the results of the digital and analog aerial triangulation.
While it is expected that these outputs will be used in the production of digital topographic maps, the following issues require attention:
*Effective use of the results of the digital and analog aerial triangulation *Dissemination of technical capacity and improvement of productivity in digital
plotting/compilation *Establishment of an implementation mechanism and improvement of productivity in
supplementary field verification *Improvement of productivity in map symbolization.
(2) Production Plan of Digital Topographic Maps of the Unmapped Areas of the Northern Region SDSL has already formulated a plan for the production of digital topographic maps of
the remaining areas. However, the following issues require attention while details of the plan are being finalized.

14
*Human and material resources available to SDSL as inputs to the map production plan *Production per unit time in each technical process following digital plotting (digital
compilation, supplementary field verification and map symbolization).
(3)Production of Digital Topographic Maps of the Unmapped Areas of the Northern Region After the production of digital topographic maps commences, measures must be taken
to ensure the quality of the maps, i.e. accuracy control in each process and evaluation of the quality of final products.
- i -
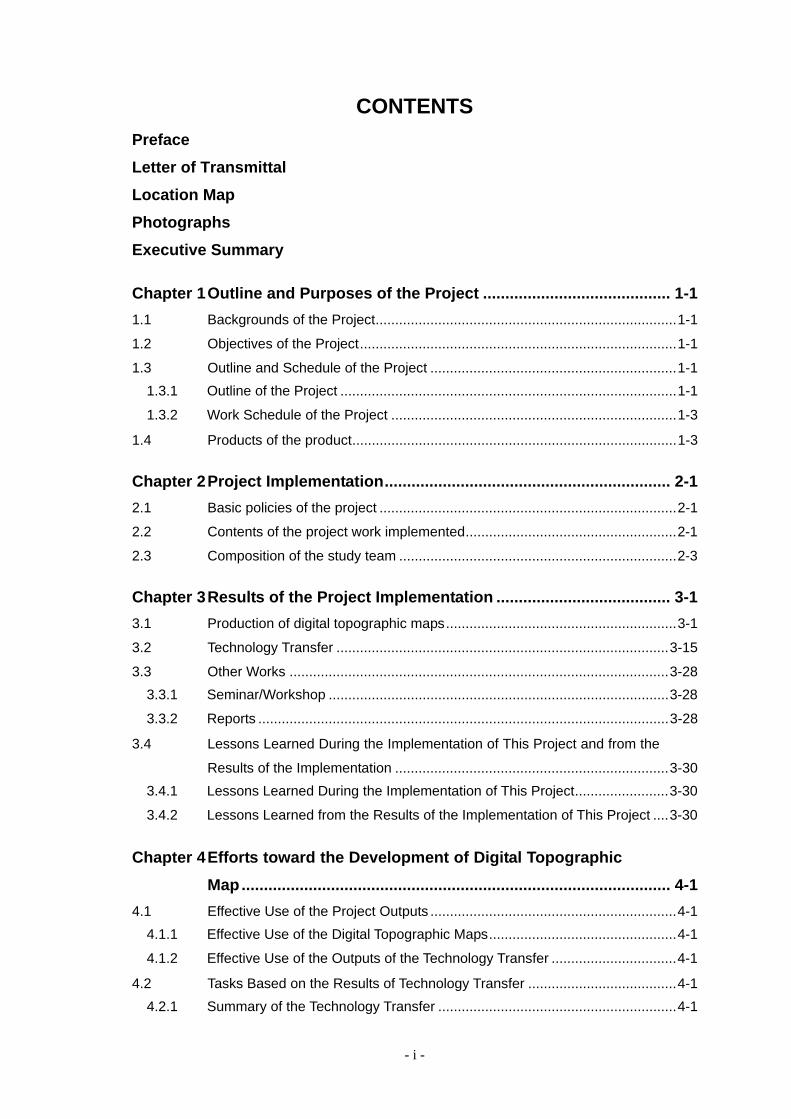
CONTENTS Preface Letter of Transmittal Location Map Photographs Executive Summary
Chapter 1 Outline and Purposes of the Project .......................................... 1-1 1.1 Backgrounds of the Project.............................................................................1-1 1.2 Objectives of the Project.................................................................................1-1 1.3 Outline and Schedule of the Project ...............................................................1-1
1.3.1 Outline of the Project ......................................................................................1-1 1.3.2 Work Schedule of the Project .........................................................................1-3
1.4 Products of the product...................................................................................1-3
Chapter 2 Project Implementation................................................................ 2-1 2.1 Basic policies of the project ............................................................................2-1 2.2 Contents of the project work implemented......................................................2-1 2.3 Composition of the study team .......................................................................2-3
Chapter 3 Results of the Project Implementation ....................................... 3-1 3.1 Production of digital topographic maps...........................................................3-1 3.2 Technology Transfer .....................................................................................3-15 3.3 Other Works .................................................................................................3-28
3.3.1 Seminar/Workshop .......................................................................................3-28 3.3.2 Reports .........................................................................................................3-28
3.4 Lessons Learned During the Implementation of This Project and from the
Results of the Implementation ......................................................................3-30 3.4.1 Lessons Learned During the Implementation of This Project........................3-30 3.4.2 Lessons Learned from the Results of the Implementation of This Project ....3-30
Chapter 4 Efforts toward the Development of Digital Topographic Map................................................................................................ 4-1
4.1 Effective Use of the Project Outputs ...............................................................4-1 4.1.1 Effective Use of the Digital Topographic Maps................................................4-1 4.1.2 Effective Use of the Outputs of the Technology Transfer ................................4-1
4.2 Tasks Based on the Results of Technology Transfer ......................................4-1 4.2.1 Summary of the Technology Transfer .............................................................4-1

- ii -
4.3 Production of Digital Topographic Maps for the Remaining Unmapped
Areas in the Northern Province....................................................................... 4-2 4.3.1 Improvement of Technical Abilities for Making Digital Topographic Maps....... 4-2 4.3.2 Formulation of a Project to Produce Digital Topographic Maps of the
Remaining Unmapped Areas in the Northern Region..................................... 4-3 4.3.3 Project to Produce Digital Topographic Maps of the Remaining
Unmapped Areas in the Northern Region....................................................... 4-3 4.3.4 Project to Produce Digital Topographic Maps of the Remaining
Unmapped Areas in the Northern Province .................................................... 4-4

- iii -
LIST OF TABLES
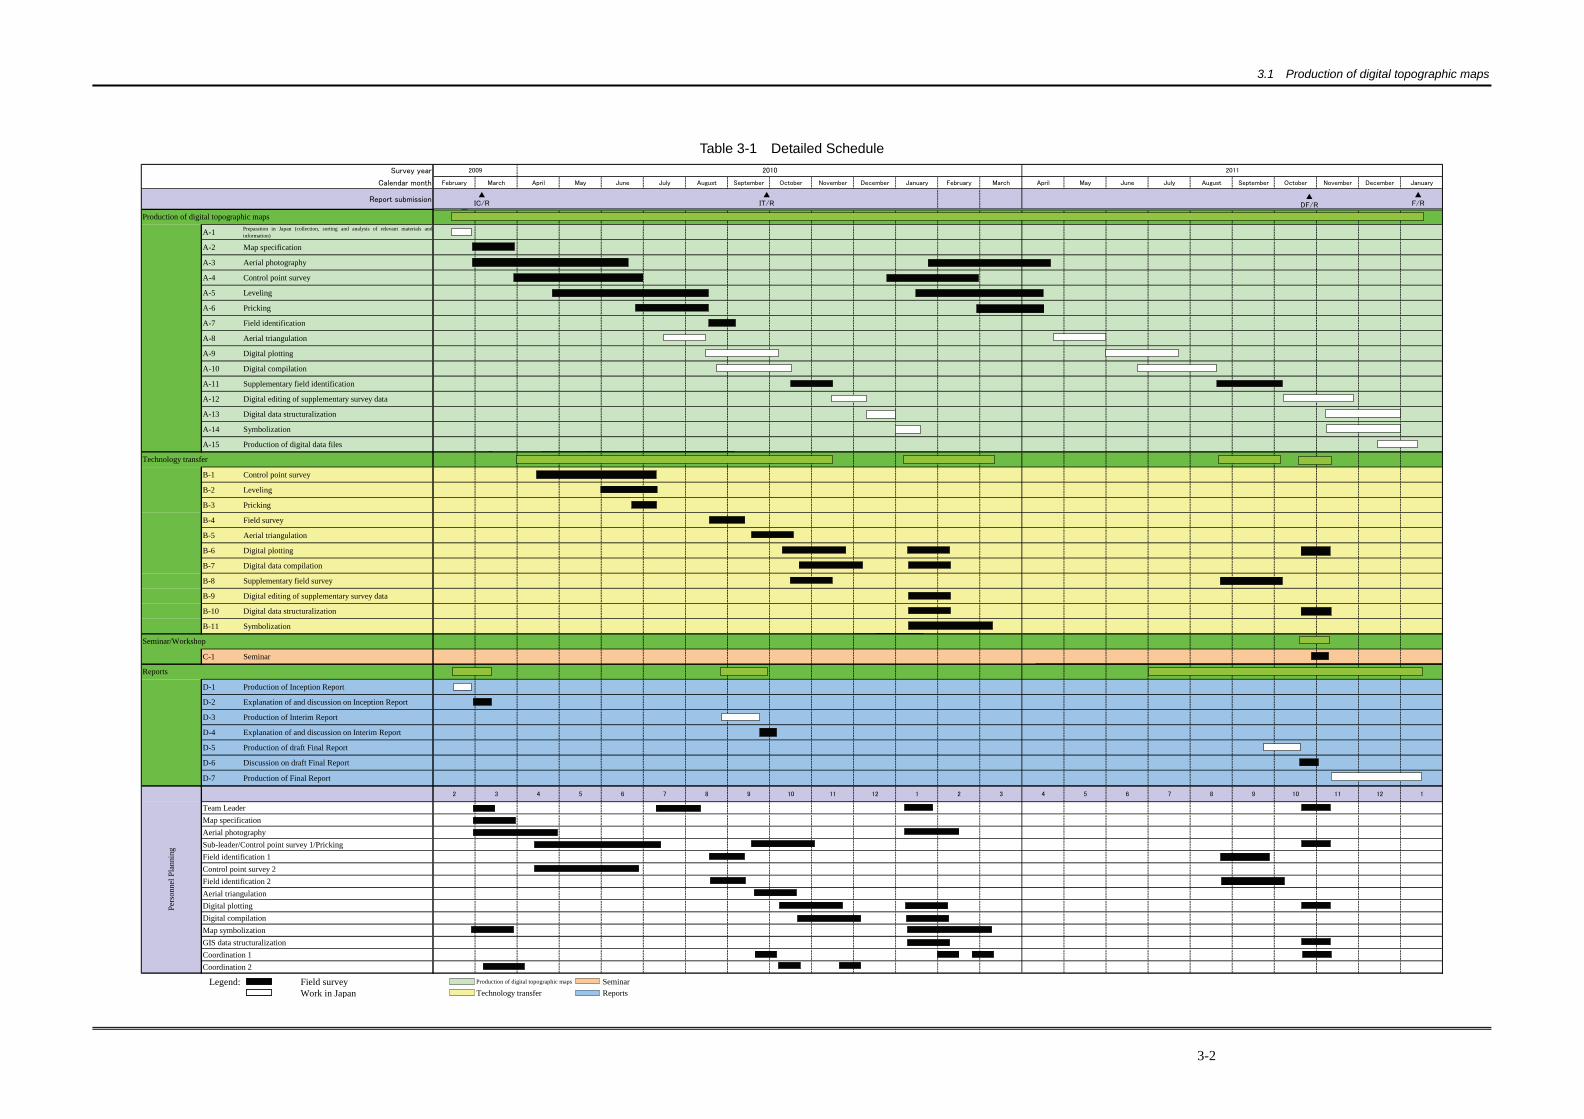
Table 3-1 Detailed Schedule ...........................................................................................3-2
LIST OF FIGURES
Fig 1-1 Implemented Aerial photography and Plotting targeted areas.............................1-2 Fig 2-1 Flowchart.............................................................................................................2-2 Fig 3-1 plotting area and 1/10,000sheet division.............................................................3-3 Fig 3-2 Implementation area of aerial triangulation in the target area for topographic
mapping..............................................................................................................3-9 Fig 3-3 Flowchart of the aerial triangulation technology transfer ...................................3-18
LIST OF PICTURES
Picture 3-1 Aircraft for aerial photo..................................................................................3-4 Picture 3-2 Setting up the aerial camera .........................................................................3-4 Picture 3-3 Observation of Levelling................................................................................3-7 Picture 3-4 Selection of the pricking point .......................................................................3-7 Picture 3-5 Preparation of field identification .................................................................3-17 Picture 3-6 Field identification in the field ......................................................................3-17 Picture 3-7 Training of trainees in technology transfer ..................................................3-20 Picture 3-8 Scene practice ............................................................................................3-22 Picture 3-9 Scene of practice done by trainees .............................................................3-22 Picture 3-10 Supplementary field verification ................................................................3-24 Picture 3-11 Data structualization of digital data ...........................................................3-25 Picture 3-12 Map symbolization ....................................................................................3-26

1.1 Backgrounds of the Project
1-1
Chapter 1 Outline and Purposes of the Project
1.1 Backgrounds of the Project
In the Socialist Republic of Sri Lanka (hereinafter Sri Lanka) the civil war that lasted nearly 30 years
ended in May 2009 when government forces and took control of the whole country. However, the
Northern Province is faced with urgent issues such as mine clearance, rebuilding infrastructure, and
repatriating the internally displaced persons (IDP).
The Government of Japan has made 'assistance for consolidation of peace and reconstruction' a main
pillar of its country specific assistance plan for Sri Lanka; based on this JICA has made 'improving
resident's livelihoods and social environment in war affected areas' one of its development issues.
On the other hand, JICA undertook a series of information gathering and confirmation surveys in
Northern Province from September 2009. These surveys confirmed the needs and high expectations of
assistance in fields closely related to the livelihoods and waste management in communities and local
governments in Jaffna and Mannar districts.
This project is to undertake aerial photography to grasp the situation in the Northern Province to
contribute to its recovery, and to make 1:10,000 scale topographic maps needed to establish a recovery
plan for an area covering approx. 2,000 km2 of Mannar and Jaffna districts.
Moreover, in the process, the project's purpose is to transfer digital topographic mapping techniques.
Further, the counterpart (hereinafter C/P) organisation is the Survey Department of Sri Lanka
(hereinafter SDSL).
1.2 Objectives of the Project
The objectives of this Project were as follows:
(1) Aerial photography of the entire Northern Region of Sri Lanka.
(2) Production of 1:10,000-scale topographic maps of Mannar and Jaffna Districts of Sri Lanka.
(3) Technology transfers for production of digital topographic maps through implementation of (1) and (2)
mentioned above.
1.3 Outline and Schedule of the Project
1.3.1 Outline of the Project
(1) Digital topographic map production
The target areas by project objective were as follows:
(1) Aerial photography: Approximately 9,000 km2 area of Northern Region
1.3 Outline and Schedule of the Project
1-2
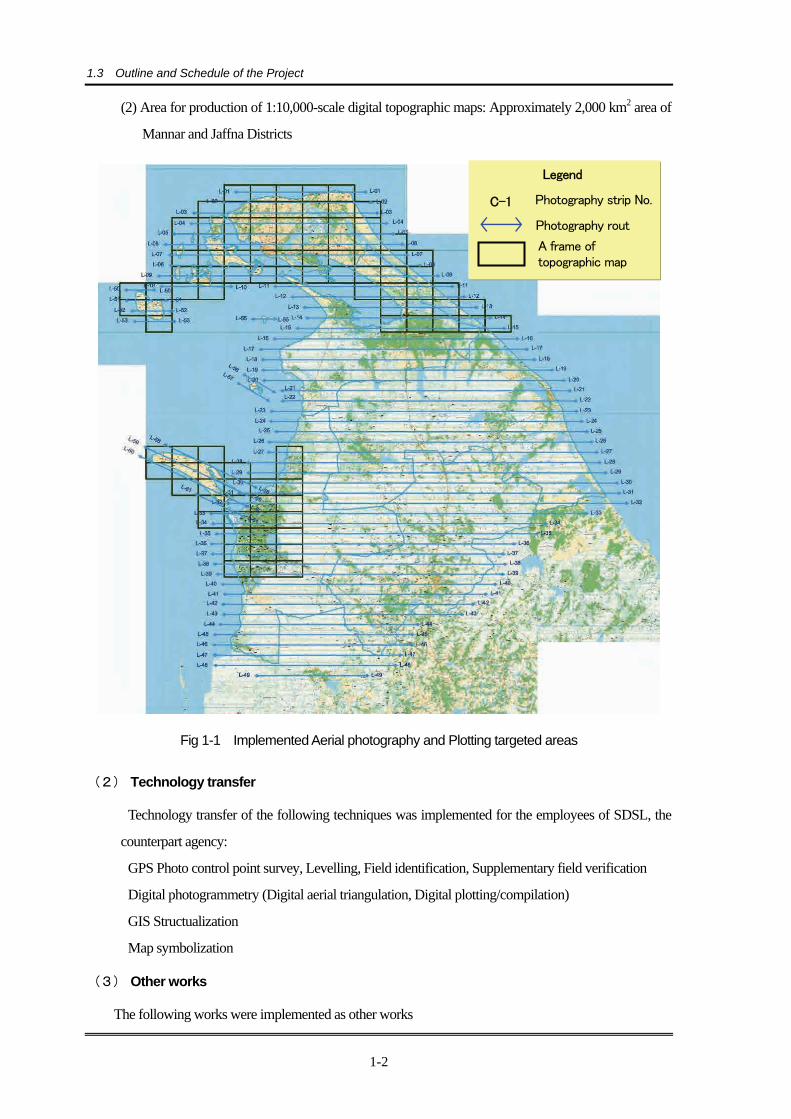
(2) Area for production of 1:10,000-scale digital topographic maps: Approximately 2,000 km2 area of
Mannar and Jaffna Districts
Fig 1-1 Implemented Aerial photography and Plotting targeted areas
(2) Technology transfer
Technology transfer of the following techniques was implemented for the employees of SDSL, the
counterpart agency:
GPS Photo control point survey, Levelling, Field identification, Supplementary field verification
Digital photogrammetry (Digital aerial triangulation, Digital plotting/compilation)
GIS Structualization
Map symbolization
(3) Other works
The following works were implemented as other works
Photography rout
Photography strip No.
Legend
C-1
A frame of topographic map

1.4 Products of the product
1-3
Holding of seminar/workshop
Explanation of and discussion on various reports
1.3.2 Work Schedule of the Project
The outline of work schedule for the project was as follows.
Month(s) 1 2 3 4 5 6 7 8 9 10 11 12 13 14 15 16 17 18 19 20 21 22 23 24Survey year
Calendar Month
2 3 4 5 6 7 8 9 10 11 12 1 2 3 4 5 6 7 8 9 10 11 12 1
Work inSri Lanka
Work inJapan
Reports
Seminar
2009 2010 2011
▲IC/R
▲IT/R
▲DF/R
▲F/R
1.4 Products of the product
(1) Project reports
The following reports were made and submitted:
a. Inception report English 25sets
b. Interim report English 25sets
c. Draft final report
Main report English 25sets
Summary English 25sets
d. Final report
Main report English 25sets
Summary English 25sets
(2) Products
The following products were made and submitted during this project
a. Aerial photography(scale 1/20,000:color)
Exposed film 1 set
Digital data file 1 set
Contact prints 2 sets
Aerial photograph index map 1 set

1.4 Products of the product
1-4
b. Field survey result 1 set
c. Aerial triangulation result 1 set
d. Digital data file (scale 1/10,000topographic map) 1 set

2.1 Basic policies of the project
2-1
Chapter 2 Project Implementation
2.1 Basic policies of the project
On the basis of the objectives of the Project, the following basic implementation policies had been
established:
(1) Basic Polices
Basic Policy 1: Aerial photography will be carried out at appropriate times and the results of
the photography will be promptly used in the subsequent works.
Basic Policy 2: Topographic maps will be produced in accordance with specifications to be
determined in a discussion based on the conventional specifications of SDSL
and JICA’s specifications for their use in drafting a future reconstruction plan
Basic Policy 3: Technology transfer to SDSL will be implemented in such a way that SDSL will
be able to produce digital topographic maps of the remaining area
independently after the completion of the Project
2.2 Contents of the project work implemented
(1) Contents of project
To achieve the objectives, the project work was divided into four parts and was implemented.
Part 1:Production of digital topographic maps
Part 2:Technology transfer
Part 3:Seminar/Workshop
Part 4:Production of, Explanation of and Discussion on various reports
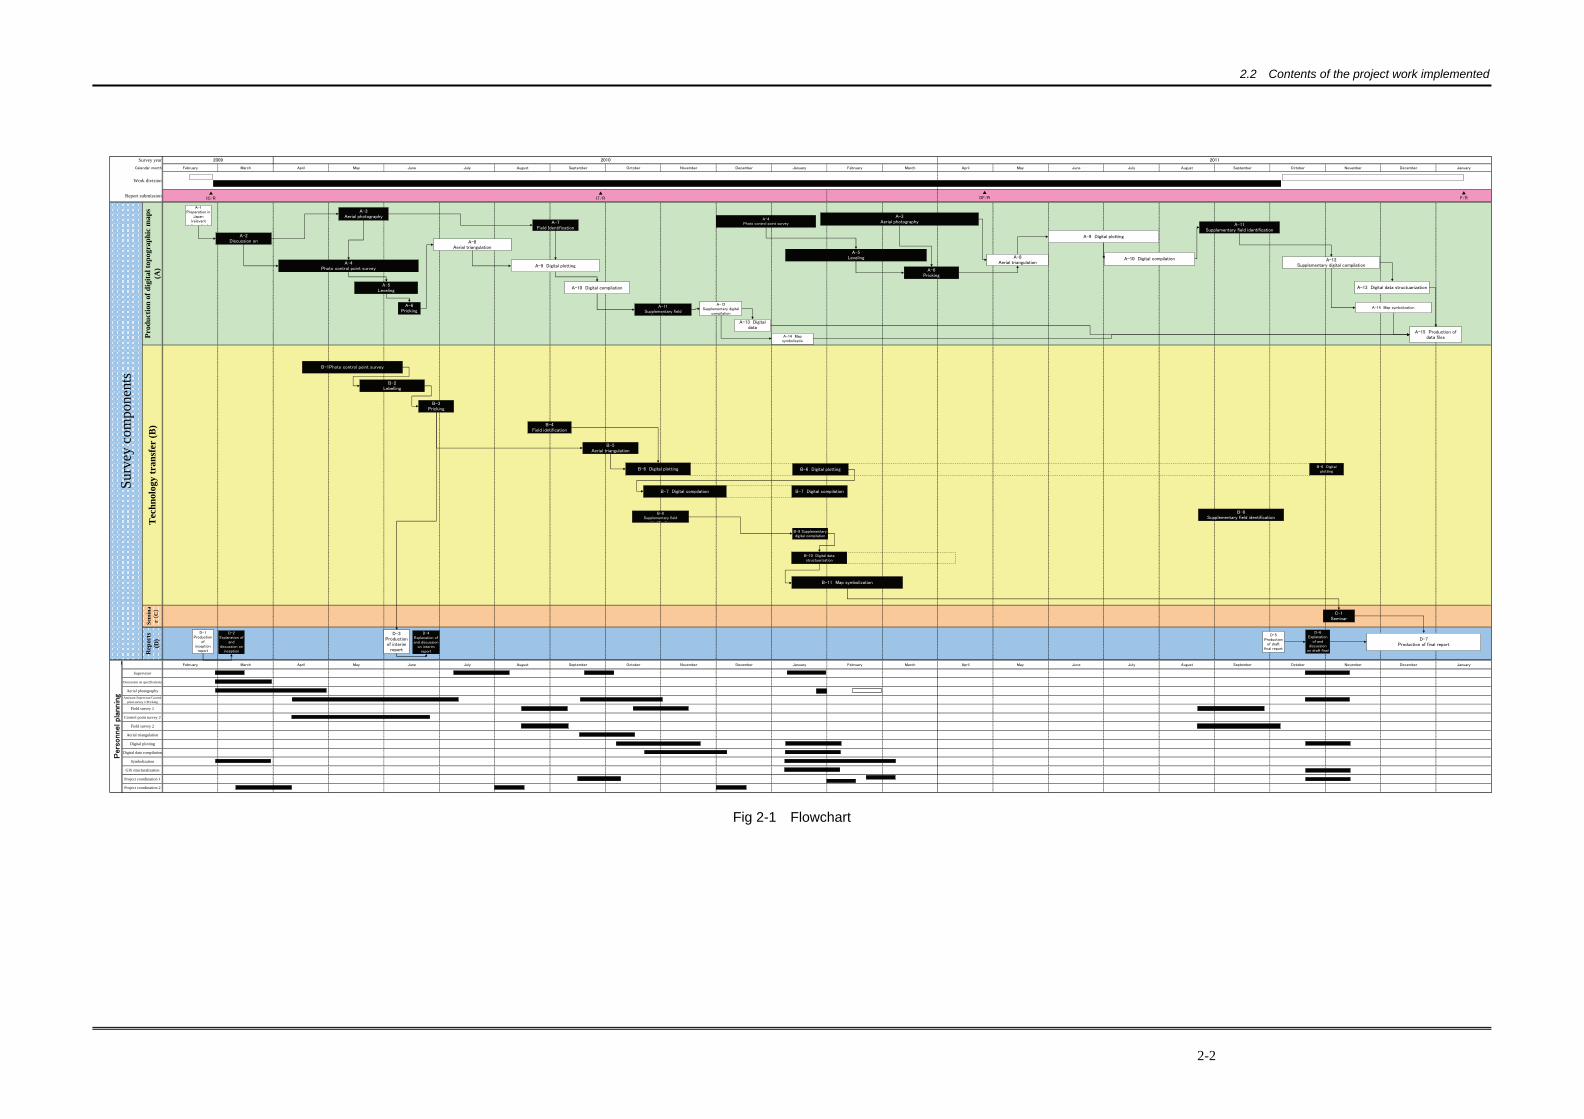
(2) Flow chart
The following is a flowchart of project works.
2.2 Contents of the project work implemented
2-2
Survey year
Calendar month February March April May June July August September October November December January February March April May June July August September October November December January
Work division
Report submission
February March April May June July August September October November December January February March April May June July August September October November December January
Digital data compilation
Digital plotting
Project coordination 1
2011
Sem
ina
r (
C)
Discussion on specifications
Aerial triangulation
Surv
ey c
ompo
nent
s
Field survey 2
2009
Project coordination 2
Field survey 1
Pers
onnel pla
nnin
g
Supervisor
Aerial photographyAssistant Supervisor/Control
point survey 1/Pricking
Control point survey 2
Symbolization
GIS structuralization
Prod
uctio
n of
dig
ital t
opog
raph
ic m
aps
(A)
Rep
orts
(D)
2010
Tec
hnol
ogy
tran
sfer
(B)
A-1Preparation in
Japan(relevant
information)
A-8Aerial triangulation
▲IC/R
▲IT/R
▲DF/R
A-2Discussion on
A-3Aerial photography
A-4Photo control point survey
A-7Field Identification
A-5Leveling
A-6Pricking
▲F/R
A-9 Digital plotting
D-2Explanation of
anddiscussion on
inception
A-10 Digital compilation
A-11Supplementary field
Id tifi ti
A-12Supplementary digital compilation
A-13 Digital data structuarization
A-14 Map symbolization
A-15 Production ofdata files
B-2Lebelling
B-3Pricking
B-6 Digital plotting
B-7 Digital compilation
B-8Supplementary field
identification
B-10 Digital datastructuarization
B-11 Map symbolization
B-5Aerial triangulation
B-6 Digital plotting
B-7 Digital compilation
B-9 Supplementarydigital compilation
C-1Seminar
D-1Production
ofinception
report
D-4Explanation ofand discussion
on interimreport
D-3Productionof interim
report
D-6Explanation
of anddiscussion
on draft final
D-5Production
of draftfinal report
D-7Production of final report
B-1Photo control point survey
B-4Field idntification
A-11Supplementary field identification
A-3Aerial photography
A-4Photo control point survey
A-5Leveling
A-6Pricking
A-8Aerial triangulation
A-9 Digital plotting
A-10 Digital compilation
A-12Supplementary digital
compilation
A-13 Digitaldata
t t i tiA-14 Mapsymbolizatio
B-6 Digitalplotting
B-8Supplementary field identification
Fig 2-1 Flowchart
2.3 Composition of the study team
2-3
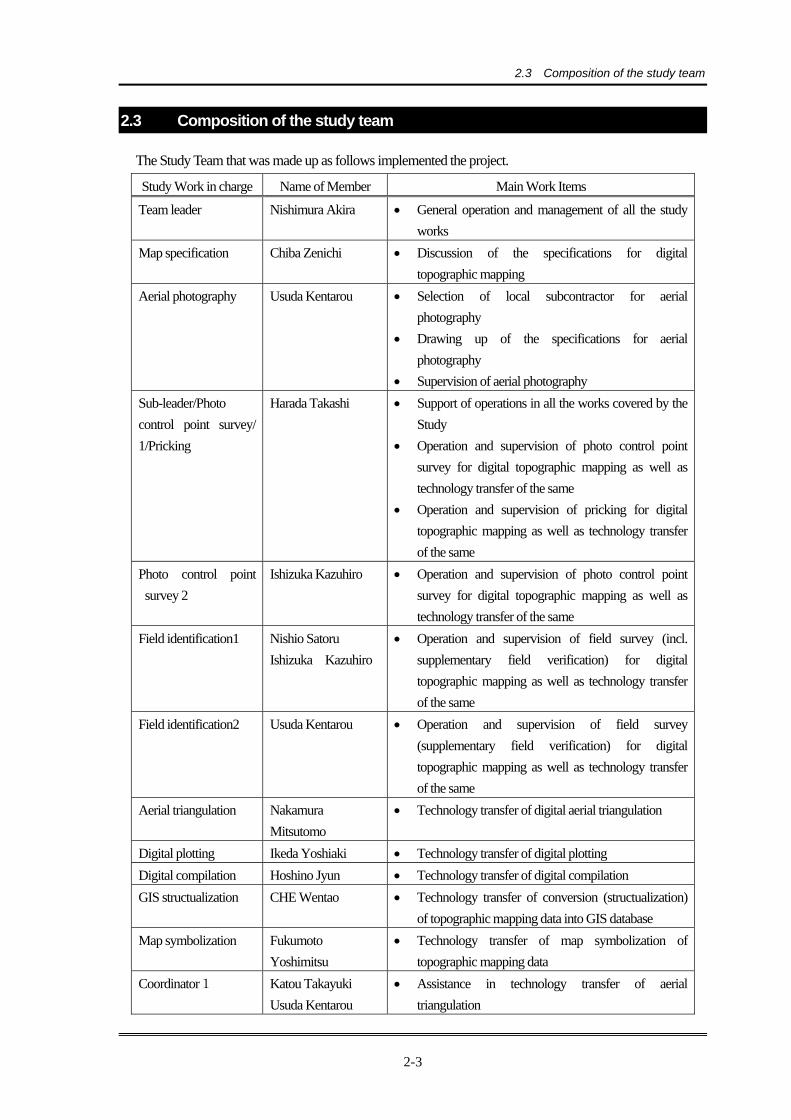
2.3 Composition of the study team
The Study Team that was made up as follows implemented the project.
Study Work in charge Name of Member Main Work Items
Team leader Nishimura Akira • General operation and management of all the study works
Map specification Chiba Zenichi • Discussion of the specifications for digital topographic mapping
Aerial photography Usuda Kentarou • Selection of local subcontractor for aerial photography
• Drawing up of the specifications for aerial photography
• Supervision of aerial photography Sub-leader/Photo control point survey/ 1/Pricking
Harada Takashi • Support of operations in all the works covered by the Study
• Operation and supervision of photo control point survey for digital topographic mapping as well as technology transfer of the same
• Operation and supervision of pricking for digital topographic mapping as well as technology transfer of the same
Photo control point survey 2
Ishizuka Kazuhiro • Operation and supervision of photo control point survey for digital topographic mapping as well as technology transfer of the same
Field identification1 Nishio Satoru Ishizuka Kazuhiro
• Operation and supervision of field survey (incl. supplementary field verification) for digital topographic mapping as well as technology transfer of the same
Field identification2 Usuda Kentarou • Operation and supervision of field survey (supplementary field verification) for digital topographic mapping as well as technology transfer of the same
Aerial triangulation Nakamura Mitsutomo
• Technology transfer of digital aerial triangulation
Digital plotting Ikeda Yoshiaki • Technology transfer of digital plotting Digital compilation Hoshino Jyun • Technology transfer of digital compilation GIS structualization CHE Wentao • Technology transfer of conversion (structualization)
of topographic mapping data into GIS database Map symbolization Fukumoto
Yoshimitsu • Technology transfer of map symbolization of
topographic mapping data Coordinator1 Katou Takayuki
Usuda Kentarou • Assistance in technology transfer of aerial
triangulation

2.3 Composition of the study team
2-4
Study Work in charge Name of Member Main Work Items
Takahashi Masahiko Ishijima Norio
• Coordination of the supervision assistance work for aerial photography
• Coordination of the Study works Coordinator2 Oouchi Yuuji
Hirahara Naomi • Coordination of the Study works
3.1 Production of digital topographic maps
3-1
Chapter 3 Results of the Project Implementation
3.1 Production of digital topographic maps
(1) Specification of digital topographic mapping
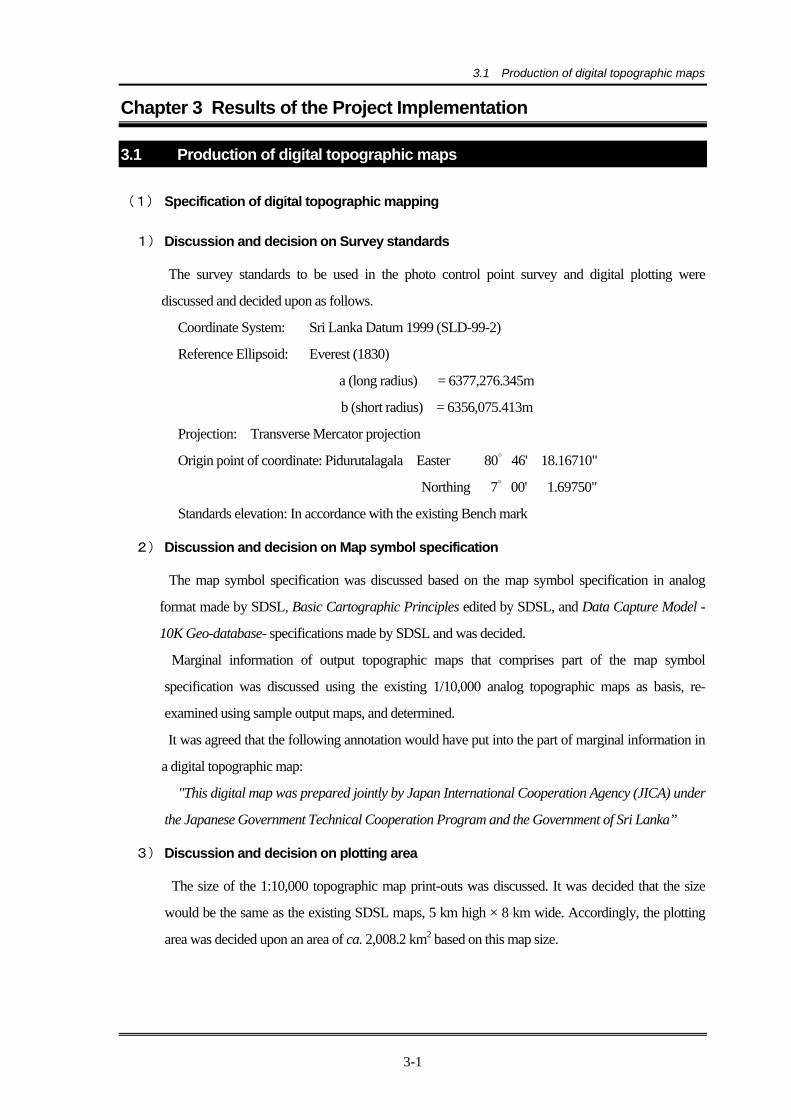
1) Discussion and decision on Survey standards
The survey standards to be used in the photo control point survey and digital plotting were
discussed and decided upon as follows.
Coordinate System: Sri Lanka Datum 1999 (SLD-99-2)
Reference Ellipsoid: Everest (1830)
a (long radius) = 6377,276.345m
b (short radius) = 6356,075.413m
Projection: Transverse Mercator projection
Origin point of coordinate: Pidurutalagala Easter 80゜46' 18.16710"
Northing 7゜00' 1.69750"
Standards elevation: In accordance with the existing Bench mark
2) Discussion and decision on Map symbol specification
The map symbol specification was discussed based on the map symbol specification in analog
format made by SDSL, Basic Cartographic Principles edited by SDSL, and Data Capture Model -
10K Geo-database- specifications made by SDSL and was decided.
Marginal information of output topographic maps that comprises part of the map symbol
specification was discussed using the existing 1/10,000 analog topographic maps as basis, re-
examined using sample output maps, and determined.
It was agreed that the following annotation would have put into the part of marginal information in
a digital topographic map:
"This digital map was prepared jointly by Japan International Cooperation Agency (JICA) under
the Japanese Government Technical Cooperation Program and the Government of Sri Lanka”
3) Discussion and decision on plotting area
The size of the 1:10,000 topographic map print-outs was discussed. It was decided that the size
would be the same as the existing SDSL maps, 5 km high × 8 km wide. Accordingly, the plotting
area was decided upon an area of ca. 2,008.2 km2 based on this map size.
3.1 Production of digital topographic maps
3-2
Table 3-1 Detailed Schedule Survey year
Calendar month February March April May June July August September October November December January February March April May June July August September October November December January
Report submission
A-1 Preparation in Japan (collection, sorting and analysis of relevant materials andinformation)
A-2 Map specification
A-3 Aerial photography
A-4 Control point survey
A-5 Leveling
A-6 Pricking
A-7 Field identification
A-8 Aerial triangulation
A-9 Digital plotting
A-10 Digital compilation
A-11 Supplementary field identification
A-12 Digital editing of supplementary survey data
A-13 Digital data structuralization
A-14 Symbolization
A-15 Production of digital data files
B-1 Control point survey
B-2 Leveling
B-3 Pricking
B-4 Field survey
B-5 Aerial triangulation
B-6 Digital plotting
B-7 Digital data compilation
B-8 Supplementary field survey
B-9 Digital editing of supplementary survey data
B-10 Digital data structuralization
B-11 Symbolization
C-1 Seminar
D-1 Production of Inception Report
D-2 Explanation of and discussion on Inception Report
D-3 Production of Interim Report
D-4 Explanation of and discussion on Interim Report
D-5 Production of draft Final Report
D-6 Discussion on draft Final Report
D-7 Production of Final Report
2 3 4 5 6 7 8 9 10 11 12 1 2 3 4 5 6 7 8 9 10 11 12 1
Team LeaderMap specificationAerial photographySub-leader/Control point survey 1/PrickingField identification 1Control point survey 2Field identification 2Aerial triangulationDigital plottingDigital compilationMap symbolizationGIS data structuralizationCoordination 1Coordination 2
Legend: Field survey Production of digital topographic maps Seminar Work in Japan Technology transfer Reports
20112009Pe
rson
nel P
lann
ing
Production of digital topographic maps
Technology transfer
Seminar/Workshop
Reports
2010
▲IC/R
▲IT/R
▲DF/R
▲F/R
3.1 Production of digital topographic maps
3-3
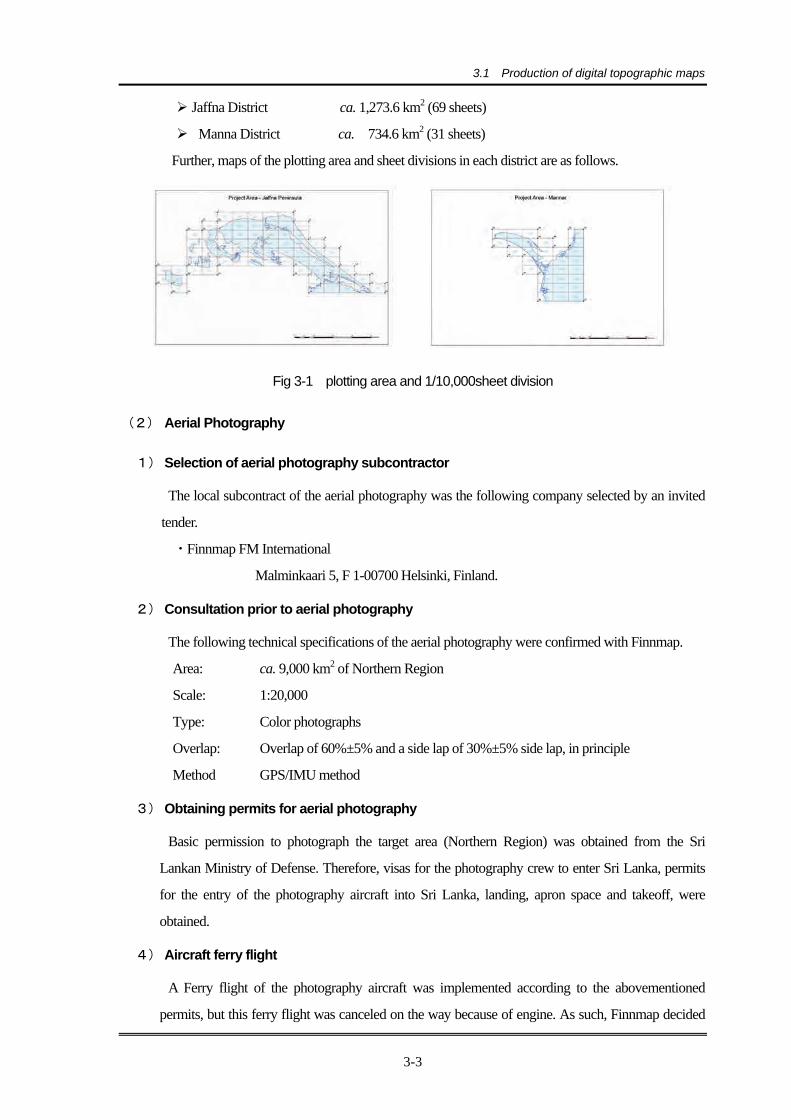
Jaffna District ca. 1,273.6 km2 (69 sheets)
Manna District ca. 734.6 km2 (31 sheets)
Further, maps of the plotting area and sheet divisions in each district are as follows.
Fig 3-1 plotting area and 1/10,000sheet division
(2) Aerial Photography
1) Selection of aerial photography subcontractor
The local subcontract of the aerial photography was the following company selected by an invited
tender.
・Finnmap FM International
Malminkaari 5, F 1-00700 Helsinki, Finland.
2) Consultation prior to aerial photography
The following technical specifications of the aerial photography were confirmed with Finnmap.
Area: ca. 9,000 km2 of Northern Region
Scale: 1:20,000
Type: Color photographs
Overlap: Overlap of 60%±5% and a side lap of 30%±5% side lap, in principle
Method GPS/IMU method
3) Obtaining permits for aerial photography
Basic permission to photograph the target area (Northern Region) was obtained from the Sri
Lankan Ministry of Defense. Therefore, visas for the photography crew to enter Sri Lanka, permits
for the entry of the photography aircraft into Sri Lanka, landing, apron space and takeoff, were
obtained.
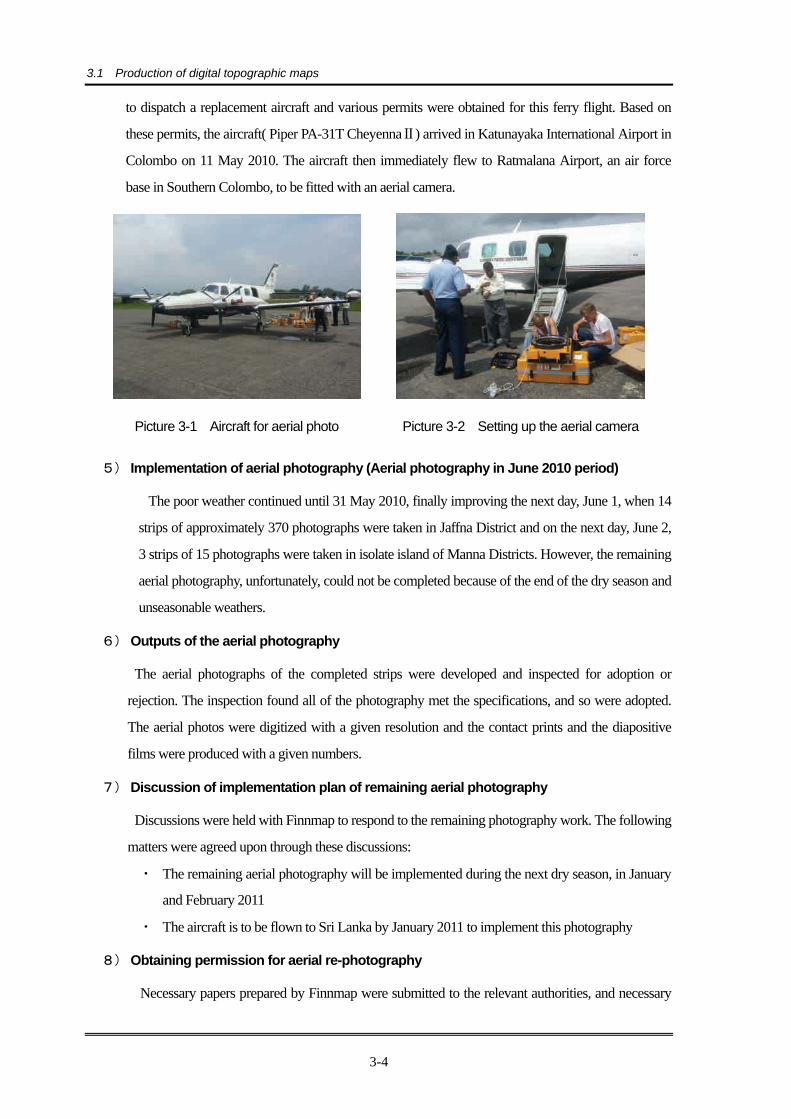
4) Aircraft ferry flight
A Ferry flight of the photography aircraft was implemented according to the abovementioned
permits, but this ferry flight was canceled on the way because of engine. As such, Finnmap decided
3.1 Production of digital topographic maps
3-4
to dispatch a replacement aircraft and various permits were obtained for this ferry flight. Based on
these permits, the aircraft( Piper PA-31T CheyennaⅡ) arrived in Katunayaka International Airport in
Colombo on 11 May 2010. The aircraft then immediately flew to Ratmalana Airport, an air force
base in Southern Colombo, to be fitted with an aerial camera.
Picture 3-1 Aircraft for aerial photo Picture 3-2 Setting up the aerial camera
5) Implementation of aerial photography (Aerial photography in June 2010 period)
The poor weather continued until 31 May 2010, finally improving the next day, June 1, when 14
strips of approximately 370 photographs were taken in Jaffna District and on the next day, June 2,
3 strips of 15 photographs were taken in isolate island of Manna Districts. However, the remaining
aerial photography, unfortunately, could not be completed because of the end of the dry season and
unseasonable weathers.
6) Outputs of the aerial photography
The aerial photographs of the completed strips were developed and inspected for adoption or
rejection. The inspection found all of the photography met the specifications, and so were adopted.
The aerial photos were digitized with a given resolution and the contact prints and the diapositive
films were produced with a given numbers.
7) Discussion of implementation plan of remaining aerial photography
Discussions were held with Finnmap to respond to the remaining photography work. The following
matters were agreed upon through these discussions:
・ The remaining aerial photography will be implemented during the next dry season, in January
and February 2011
・ The aircraft is to be flown to Sri Lanka by January 2011 to implement this photography
8) Obtaining permission for aerial re-photography
Necessary papers prepared by Finnmap were submitted to the relevant authorities, and necessary

3.1 Production of digital topographic maps
3-5
permits were obtained by the middle of January 2011.
9) Preparing for photography and aircraft re-entry
After obtaining the various permits, the aircraft arrived in Colombo on January 20, 2011. The
photography crew had also assembled in Colombo by that stage.
10) Implementation of aerial re-photography (Aerial photography in March 2011 period)
On January 26, 2011, the aerial camera and other instruments were equipped with the aircraft and
the aircraft went on a test flight and entered a standby state for aerial photography (Ratmalana
Airport, SLAF China Bay). In the February 2011 period, however, unfavorable weathers such as
downpours were encountered. The weather recovered in March 2011, and the aerial photography in
all the areas was completed in the period from March 6 to 11, 2011.
11) Cancellation of the Cross-line Aerial Photography
The cross-line aerial photography, which the sub-contractor had agreed to implement as an extra-
contractual work, could not be implemented because of the poor weather conditions and the priority
given to the aerial photography of the entire target area. The Study Team concluded that the
accuracy at the stage of the aerial triangulation could be guaranteed with the use of the outputs of
GPS/IMU and the number of control points used.
12) Outputs of aerial re-photography
After the exposed films were developed, the photography outputs were tested in various ways.
As a result, all the photos satisfied the specifications and were adopted. Production of outputs (scan
data, contact prints, and diapositive films of aerial photographs) followed afterward.
(3) Photo control point survey
The photo control point survey (GPS survey) was to be implemented for the entire photography
area. This was implemented with the aerial triangulation of the entire area of aerial photography (ca.
9,000km2) in mind.
1) Establishing the implementation plan of photo control point survey
A distribution plan of photo control points were established based on the form of the survey area
and the photography plan. The number of photo control points (horizontal location) was
determined in accordance with the Overseas Survey Specification of JICA.
2) Implementation plan of photo control point survey
Discussions were held with SDSL based on the established photo control point implementation
plan. The photo control point survey plan was reviewed and renewed by adding the additional

3.1 Production of digital topographic maps
3-6
information and an agreement on it was reached with SDSL. As a result, the total number of photo
control points was 105.
3) Installation of air-photo signals
Initially, the location of all photo control points was to be decided on aerial photographs by pricking.
However, as there was a request from SDSL including personnel support, all of the photo control
points were installed with air-photo signals basically.
4) Implementation of photo control point survey (GPS survey)
The photo control point survey (GPS survey) was performed with technical cooperation from
SDSL using GPS receivers owned by ISM (Institute of Surveying and Mapping).
The GPS survey observation consisted of continuous observation performed for about eight hours
using receivers installed at known points and concurrent observation performed for about one hour
at new photo control points and known points.
The horizontal analysis calculations performed included baseline analysis, check for closure errors
of arbitrary polygons derived from baselines after analysis, three-dimensional net adjustment, and
coordinate transformation.
For the closure errors and residuals at the GCP points, the standard deviations were within the
limits, causing no problem in the analysis calculation.
In the height analysis calculation, the elevations (orthometric heights) of four known points were
used to create a geoid model for this vicinity, and the elevations (orthometric heights) of newly
installed photo control points were obtained based on this model.
(4) Levelling
The levelling was implemented for the entire aerial photography area.
1) Establishment of the implementation plan of levelling
Levelling was planned for ca. 500 km (ca. 2 km intervals, install height control points by pricking)
mostly along main roads according to the aerial photography plan
2) Implementation plan of levelling
Discussions were held with SDSL on the details of the levelling implementation plan. As a result, it
was decided to implement the levelling based on the following:
・ In principle, fixed points will be installed approx. every 2 km along the levelling route
(550km).
・ Duplicate observation will be implemented for the entire levelling route (in order to prevent
errors such as misreading).
3.1 Production of digital topographic maps
3-7
・ The closure difference limit value of the duplicate observation will be 50mm√S (km).
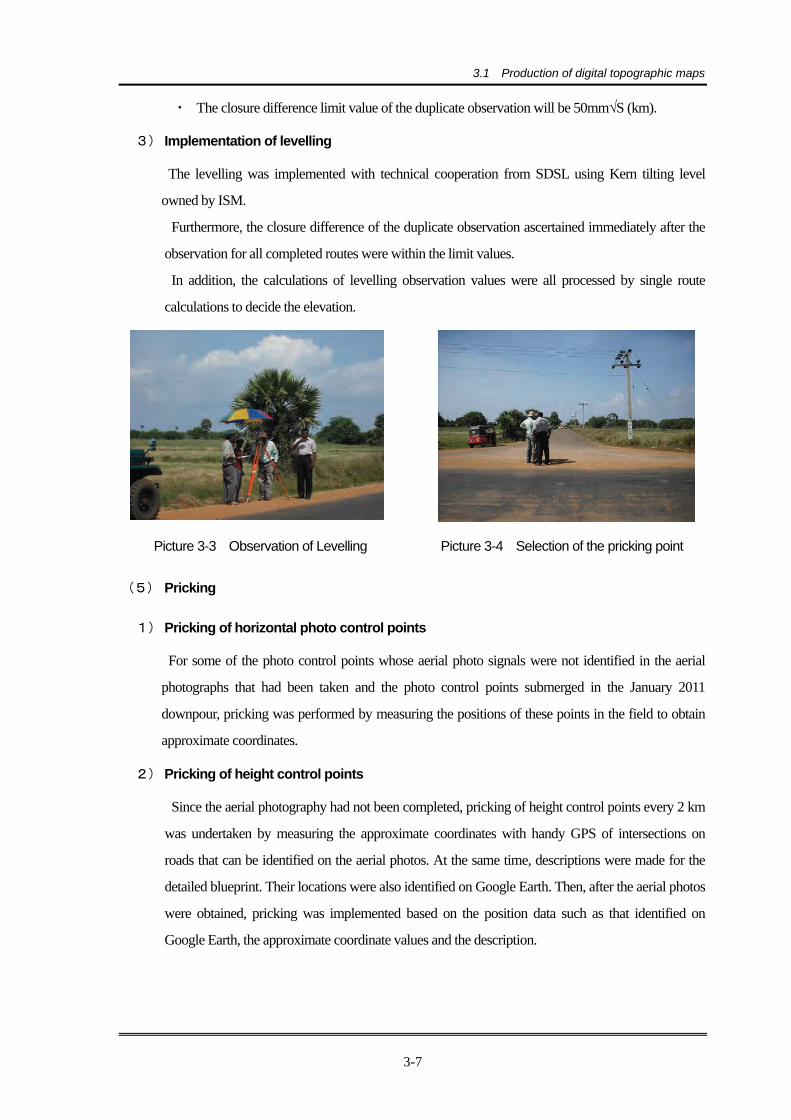
3) Implementation of levelling
The levelling was implemented with technical cooperation from SDSL using Kern tilting level
owned by ISM.
Furthermore, the closure difference of the duplicate observation ascertained immediately after the
observation for all completed routes were within the limit values.
In addition, the calculations of levelling observation values were all processed by single route
calculations to decide the elevation.
Picture 3-3 Observation of Levelling Picture 3-4 Selection of the pricking point
(5) Pricking
1) Pricking of horizontal photo control points
For some of the photo control points whose aerial photo signals were not identified in the aerial
photographs that had been taken and the photo control points submerged in the January 2011
downpour, pricking was performed by measuring the positions of these points in the field to obtain
approximate coordinates.
2) Pricking of height control points
Since the aerial photography had not been completed, pricking of height control points every 2 km
was undertaken by measuring the approximate coordinates with handy GPS of intersections on
roads that can be identified on the aerial photos. At the same time, descriptions were made for the
detailed blueprint. Their locations were also identified on Google Earth. Then, after the aerial photos
were obtained, pricking was implemented based on the position data such as that identified on
Google Earth, the approximate coordinate values and the description.
3.1 Production of digital topographic maps
3-8
(6) Field identification
1) Procedure of field identification
Field identification was conducted in consideration of the current situation of SDSL and the plotting
and compilation operations in Japan using the following techniques:
* A field identification technique using aerial photographs was applied.
* Photo interpretation keys were created only for part of vegetations, land uses, and hydrologies
for the sake of plotting and compilation operations.
2) Preparations for field identification
Color mosaic photos and black and white photos of the same scale as the plotting, 1:10,000, were
printed in preparation. Also, SDSL was requested to provide geographic information in its
possession, and it was provided.
3) Implementation structure of field identification
The implementation structure was made up of two surveyors from the photogrammetry in SDSL
headquarters for the preliminary photo interpretation using the aerial photographs (survey by
interpreting photographs). On the other hand, for the field identification outdoors, the
implementation structure was made up of two groups, each comprised of one SDSL worker and one
Study Team member.
4) Timing of field identification
The field identification was implemented over 25 days from 13th August to 8th September 2010.
5) Implementation of field identification
Two surveyors from SDSL undertook the (preliminary) photo interpretation. During the outdoor
part of the field identification, emphasis was placed on solving the queries and uncertain points that
came up in the (preliminary) photo interpretation, and the features in the field and those on the
photographs were visually collated and verified. Also, where necessary, the target feature was
surveyed and its location was identified by taking field photographs and using a handy GPS to
observe the coordinates.
6) Outputs of field identification
The following outputs were gained through the field identification:
a. Photo interpretation keys (13 topographic features)
b. Mosaic photos with the field identification information written on them
c. Photos of features taken in the field
3.1 Production of digital topographic maps
3-9
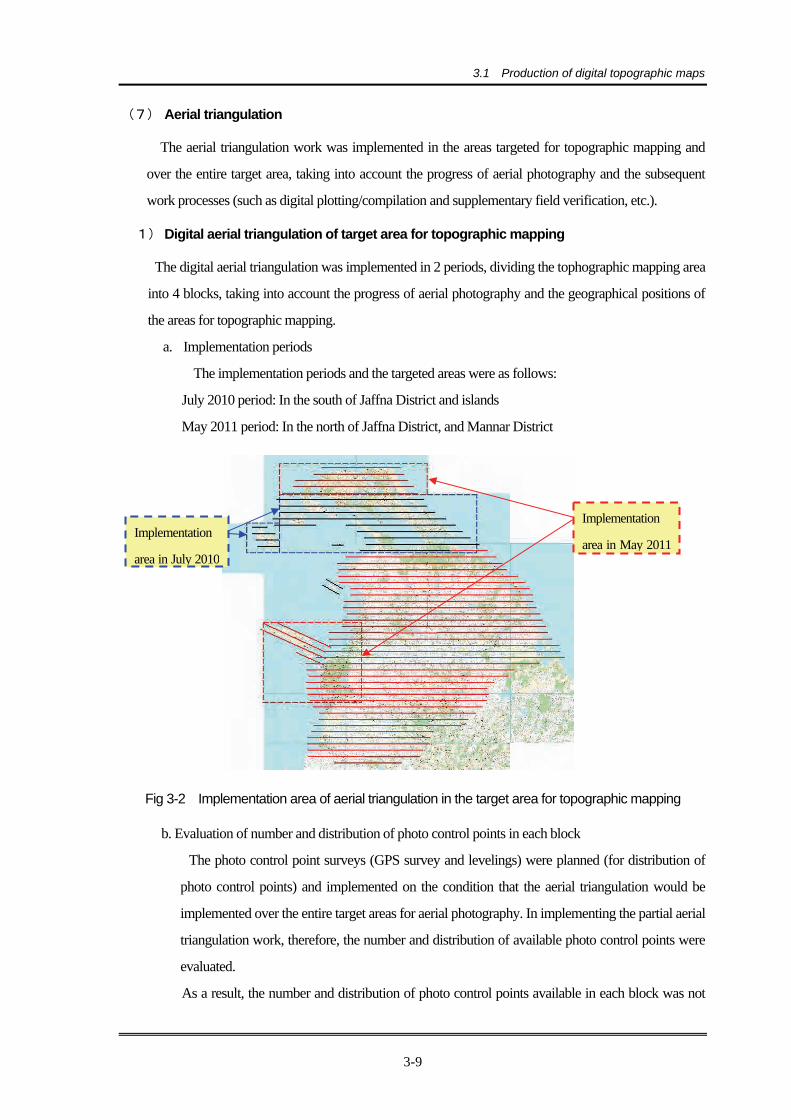
(7) Aerial triangulation
The aerial triangulation work was implemented in the areas targeted for topographic mapping and
over the entire target area, taking into account the progress of aerial photography and the subsequent
work processes (such as digital plotting/compilation and supplementary field verification, etc.).
1) Digital aerial triangulation of target area for topographic mapping
The digital aerial triangulation was implemented in 2 periods, dividing the tophographic mapping area
into 4 blocks, taking into account the progress of aerial photography and the geographical positions of
the areas for topographic mapping.
a. Implementation periods
The implementation periods and the targeted areas were as follows:
July 2010 period: In the south of Jaffna District and islands
May 2011 period: In the north of Jaffna District, and Mannar District
Fig 3-2 Implementation area of aerial triangulation in the target area for topographic mapping
b. Evaluation of number and distribution of photo control points in each block
The photo control point surveys (GPS survey and levelings) were planned (for distribution of
photo control points) and implemented on the condition that the aerial triangulation would be
implemented over the entire target areas for aerial photography. In implementing the partial aerial
triangulation work, therefore, the number and distribution of available photo control points were
evaluated.
As a result, the number and distribution of photo control points available in each block was not
Implementation
area in May 2011 Implementation
area in July 2010

3.1 Production of digital topographic maps
3-10
sufficient to meet the Work Specification, but by also using GPS/IMU results, it was judged that
the insufficiency was not at a level at which there was any problem with accuracy in digital
plotting of the 1/10,000 topographic maps.
c. Preparatory work
The aerial photos were scanned at the resolution of 1270 dpi (20µm). After that, the results
of photo control point surveys and levelings, GPS/IMU results and the camera calibration data
necessary were collected.
d. Verification of accuracy of POS data (GPS/IMU data)
The photo control points were observed using the results (exterior orientation elements) from
the collected POS data (GPS/IMU data) and the differences from the coordinate values obtained
in the field survey were within several meters. As these differences occurred in the same
direction, it was estimated that there was an error in the inclination of the POS data. Thus, the
weights of ω, φ, κ were set to low weights in the adjustment calculation.
e. Tie-point observations
Tie-points were automatically extracted in the duplicate parts of aerial photos to observe their
coordinates using the digital photogrammetry system. For the incomplete models such as
islands and coastal areas, tie-points were extracted manually to observe their coordinates.
The model coordinates were calculated using the observed coordinates. If the intersection
residuals in the calculated model coordinates between models did not meet the specifications, the
observations were repeated.
f. Photo control point observations
The photo control points obtained by photo control point surveys and levelings were identified
on aerial photos and their coordinates were observed in the digital photogrammetry system.
The resulting values of these photo control points (XY coordinates and elevation values) were also
input into this system.
g. Adjustment calculation by the bundle method and its results
The adjustment calculation in aerial triangulation was made by the bundle method using the
results of photo control point surveys, levelings and POS analysis (GPS/IMU analysis).
The control point residuals in each block which were the indexes for evaluation of the results of
adjustment calculation were lower than the limit values as shown below. Thus, the results of
adjustment calculation were good.
Limit value of standard deviation: 0.61m
Limit value of maximum value: 1.22m

3.1 Production of digital topographic maps
3-11
2) Digital aerial triangulation of entire area
Digital aerial triangulation of the entire area was carried out with a method similar to the one used in the
digital aerial triangulation of the topographic map production area. The result for the part of the island area
was separately prepared.
a. Quantity of work
The quantity of work in the digital aerial triangulation of the entire area was as follows:
Strips: 61 strips
Photo sheets: 2127 sheets
b. Results of adjustment calculation with bundle method
Adjustment calculation with bundle method for the aerial triangulation of the entire area was done
with data obtained from the photo control point survey and levelling and results of the POS analysis
(GPS/IMU analysis).
As a result of the calculation, the standard deviation and maximum of the photo control point
residuals were below the tolerance limits and the results of the digital aerial triangulation of the entire
area were accurate.
3) Analog aerial triangulation of entire area
Analogue aerial triangulation of the entire area was implemented in order to enable the
counterparts to perform plotting of the entire Northern Region also with an analogue plotter equipped
with encoder. The results of independent calculation of orientation elements required for plotting
were used for the plotting of the part of the island area.
a. Quantity of Work
The quantity of work implemented in the analogue aerial triangulation was as follows:
Number of flight courses: 61 strips
Number of photographs: 2031 sheets
The difference in the quantities of works between the digital and analogue aerial triangulation
derives from the fact that duplicate photographs taken in the same flight course were used in the
aerial triangulation.
b. Preparation
Diapositive films etc. of aerial photographs required for analogue aerial triangulation were
collected. The collected data were used for creation of aerial triangulation work plan maps, on which
the area of the aerial triangulation was established.
In accordance with the work plan maps, photo control points were confirmed and tie points were
selected on aerial photographs, and these points were pricked on diapositive films. The locations of
the pricked tie points and photo control points were measured and their machine coordinates were

3.1 Production of digital topographic maps
3-12
obtained.
Relative orientation was performed to create models, after inner orientation, which is a coordinate
transformation from machine coordinates to photographic coordinates, had been performed.
c. Adjustment Calculation with Bundle Method and the Results of the Calculation
Adjustment calculation with bundle method was performed using the photographic coordinates of
tie points and the results of the photo control point survey.
As a result of the calculation, the standard deviation and maximum of the photo control point
residuals were below the tolerance limits and the results of the analouge aerial triangulation of the
entire area were accurate.
The results of the adjustment calculation were used for the calculation of orientation elements of
each model.
(8) Digital plotting
1) Specifications
Plotting scale 1/10,000
Plotting area 2,008.2 km2
Plotted map sheets 100 sheets
Contour Intermediate contour 5m Index contour 25m Auxiliary
contour 2.5m
2) Equipment used
Digital stereo plotter SoftPlotter (BOEING);
Summit (DAT/EM); LPS (Leica);
ImageStation (INTERGRAPH) etc.
3) Digital plotting implementation
Using stereo models created from the photography image data and the aerial triangulation outputs,
the digital plotting work was implemented with reference to the field identification photos. The
stereo images that could not be plotted from only the field identification photos were interpreted
with reference to the photo interpretation keys to implement the digital plotting.
4) Results of digital plotting
The data for digital plotting was created in Bentley MicroStation V8DGN format
3.1 Production of digital topographic maps
3-13
(9) Digital compilation
1) Specifications
Compilation scale 1/10,000
Compilation area 2,008.2k ㎡
Compiled map sheets 100 sheets
2) Equipment used
Compilation CAD MicroStationV8(Bentley)
3) Digital compilation
Based on the results of the digital plotting, annotations and administrative boundaries were input
with reference to the field identification photos, existing maps (1/50,000) and existing data (Shape
file) in order to carry out the digital compilation work.
4) Results of digital compilation
The data for digital compilation was created in Bentley MicroStation V8DGN format.
(10) Supplementary field verification
1) Implementation Periods
The supplementary field verification consisting of data collection in Colombo and field works in
Jaffna and Mannar Areas was implemented in two periods.
[First period]
October 15th – November 13th 2010
[Second period]
August 28th – October 11th 2011
2) Inputs
The numbers of people engaged in the supplementary field verification were as follows:
[First period]: 28 people in 11 Teams (the Sri Lankan side) and two people (the Study Team)
[Second period]: 31 people in 12 Teams (the Sri Lankan side) and two people (the Study Team)
3) Description of the Work
The following works were implemented in the supplementary field verification:
a. Data collection in Colombo
The Study Team collected data on administrative boundaries and names, road classification,
control points and magnetic declination from SDSL and other sources.
b. Field works implemented in Jaffna and Mannar Areas
In the field works, the following activities were carried out: elimination of the uncertainties
3.1 Production of digital topographic maps
3-14
identified in the digital plotting/compilation; survey of additional topographic features
required to be represented on topographic maps; survey of kilometer posts along certain roads,
high-voltage power transmission lines, the abandoned railway and the abandoned station; and
identification of annotations (names of major road intersections and major facilities).
(11) Supplementary digital compilation
1) Specifications
Compilation scale 1/10,000
Compilation area 2,008.2k ㎡
Compiled map sheets 100 sheets
2) Equipment used
Compilation CAD MicroStationV8(Bentley)
3) Supplementary digital compilation
Supplementary digital compilation based on supplementary field verification was carried out.
4) Details
In the supplementary digital compilation, input and compilation of kilometer posts, power
transmission lines and other contents concerning the supplementary field verification were carried
out.
(12) Digital data structuarization
Digital data files with data that had been compiled digitally after supplementary completion were
structured.
1) Structural compilation
In the structural compilation, data was inspected and corrected for logical errors (edge mismatching,
undershoot, overshoot, areal overlap and inconsistency of area classification) and topologically structured (i.e.
all topographic features were classified into line, polygon or point data) in accordance with the map symbol
specifications. MicroStationV8 was used for the structural compilation.
2) Conversion of data format
Structurally compiled data was converted into DXF format and SHAPE format by sheet.
(13) Map symbolization
Structured digital topographic map data was used for production of 1:10,000-scale AI data.
3.2 Technology Transfer
3-15
1) Details of the symbolization work
The structured digital topographic map data was processed for map symbolization in which line types,
colors, symbols, etc. were produced and processed for the data in accordance with the map symbol
specifications and the order of the layers were rearranged. In addition, marginal information of topographic
map was symbolized.
Printout data for each map sheet was completed by integrating symbolized digital topographic map data
and symbolized marginal information data, and entering information such as map sheet number and title.
2) Quantity and outputs of the work
a. Quantity the work
* AI data (topographic map + marginal information): 100 sheets
b. Detalis of the output data
* File format: PostScript file (Adobe Illustrator CS5 format)
* Finished map size (including marginal information):
657 mm (north-south) x 883 mm (east-west)
(14) Production of digital data files
1) Production of Vector Data Files
A vector data file in the Shape format and a vector data file in the DXF format were produced for
each sheet of maps using the vector data in the respective formats generated by structuralizing digital
data. The produced data files were stored on such media as DVDs.
2) Production of Raster Data Files
Marginal information data of a map sheet was integrated with the topographic data processed in
the map symbolization of the same sheet. This data was converted into the PDF format and a raster
data file was produced for each sheet of the maps using the converted data. The produced raster
data files were stored on such media as DVDs.
3.2 Technology Transfer
(1) Photo control point survey
1) SDSL’s capacity for implementing photo control point (GPS) surveys
The SDSL already has much experience of GPS survey using GPS receivers and they have
sufficient capacity in the various techniques required to establish plans for various types of work such
as observation planning, GPS surveying, and analysis of observation data.

3.2 Technology Transfer
3-16
2) Implementation of technology transfer on photo control point survey
As mentioned above, because of SDSL's technical capacity in photo control point survey (GPS
survey), the technology transfer was implemented focusing on how to calculate the necessary
number of photo control points and method of photo control point distribution required for aerial
triangulation. Also, techniques were transferred on how to install air-photo signals and on making a
description of these.
3) Results of technology transfer of photo control point survey
The following are the results of the transfer of the various techniques that the technology transfer of
photo control point survey focused on:
* SDSL sufficiently understood how to calculate the number of photo control points. However,
further training and experience on how to distribute the photo control points is necessary.
* For installation of air-photo signals and making a description, they gained a sufficient
understanding as a result of repetitious studies.
(2) Levelling
1) SDSL’s capacity for implementing levelling
SDSL had a great deal of practical experience implementing, and had sufficient understanding of
general theory of levelling, observation, calculation, and output evaluation.
2) Implementation of technology transfer on levelling
From the aforementioned situation on SDSL’s capacity for implementing levelling, the technology
transfer was implemented with emphasis on planning levelling ( a selection of leveling routes and a
method of rational observations) for aerial triangulation.
3) Results of technology transfer on levelling
The outputs of technology transfer in this field were as follows:
* Technique for the selection of levelling routes was obtained sufficiently.
* Method of rational observation was also fully understood.
(3) Pricking
1) SDSL’s capacity for implementing pricking
SDSL was comparatively inexperienced in this technical field.
2) Implementation of technical transfer on pricking
Techniques were transferred for making descriptions of pricking points (obtaining approximate
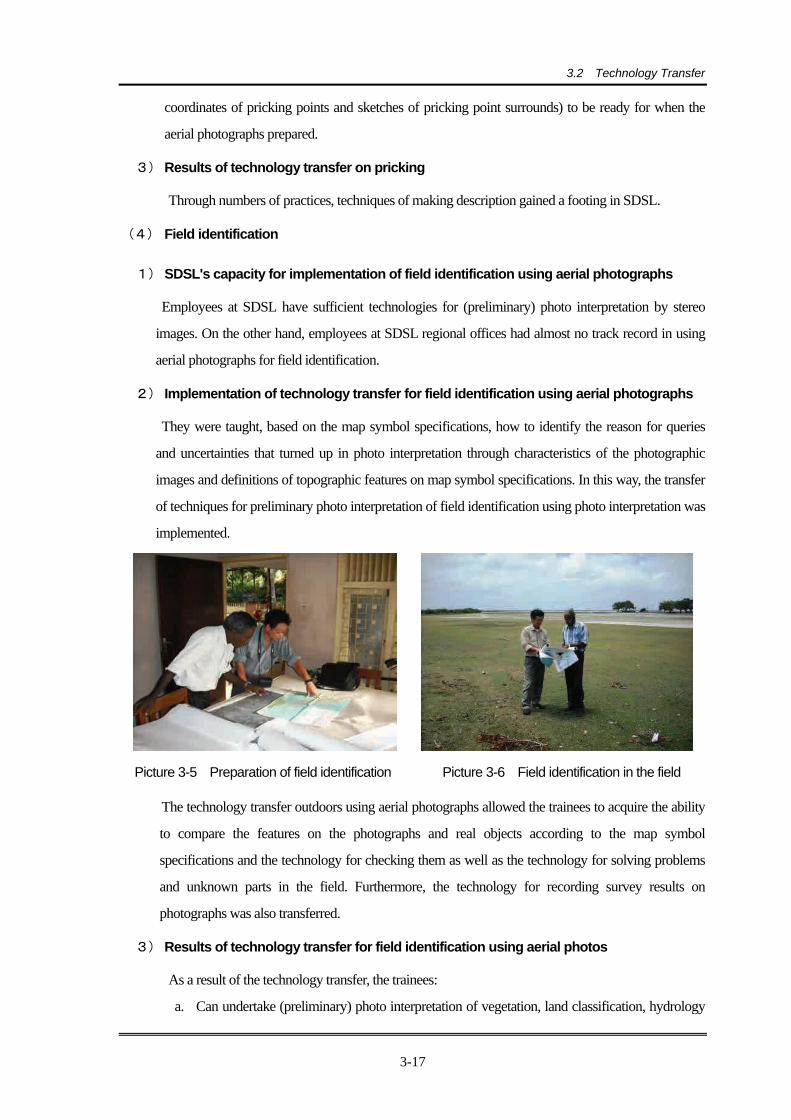
3.2 Technology Transfer
3-17
coordinates of pricking points and sketches of pricking point surrounds) to be ready for when the
aerial photographs prepared.
3) Results of technology transfer on pricking
Through numbers of practices, techniques of making description gained a footing in SDSL.
(4) Field identification
1) SDSL's capacity for implementation of field identification using aerial photographs
Employees at SDSL have sufficient technologies for (preliminary) photo interpretation by stereo
images. On the other hand, employees at SDSL regional offices had almost no track record in using
aerial photographs for field identification.
2) Implementation of technology transfer for field identification using aerial photographs
They were taught, based on the map symbol specifications, how to identify the reason for queries
and uncertainties that turned up in photo interpretation through characteristics of the photographic
images and definitions of topographic features on map symbol specifications. In this way, the transfer
of techniques for preliminary photo interpretation of field identification using photo interpretation was
implemented.
Picture 3-5 Preparation of field identification Picture 3-6 Field identification in the field
The technology transfer outdoors using aerial photographs allowed the trainees to acquire the ability
to compare the features on the photographs and real objects according to the map symbol
specifications and the technology for checking them as well as the technology for solving problems
and unknown parts in the field. Furthermore, the technology for recording survey results on
photographs was also transferred.
3) Results of technology transfer for field identification using aerial photos
As a result of the technology transfer, the trainees:
a. Can undertake (preliminary) photo interpretation of vegetation, land classification, hydrology
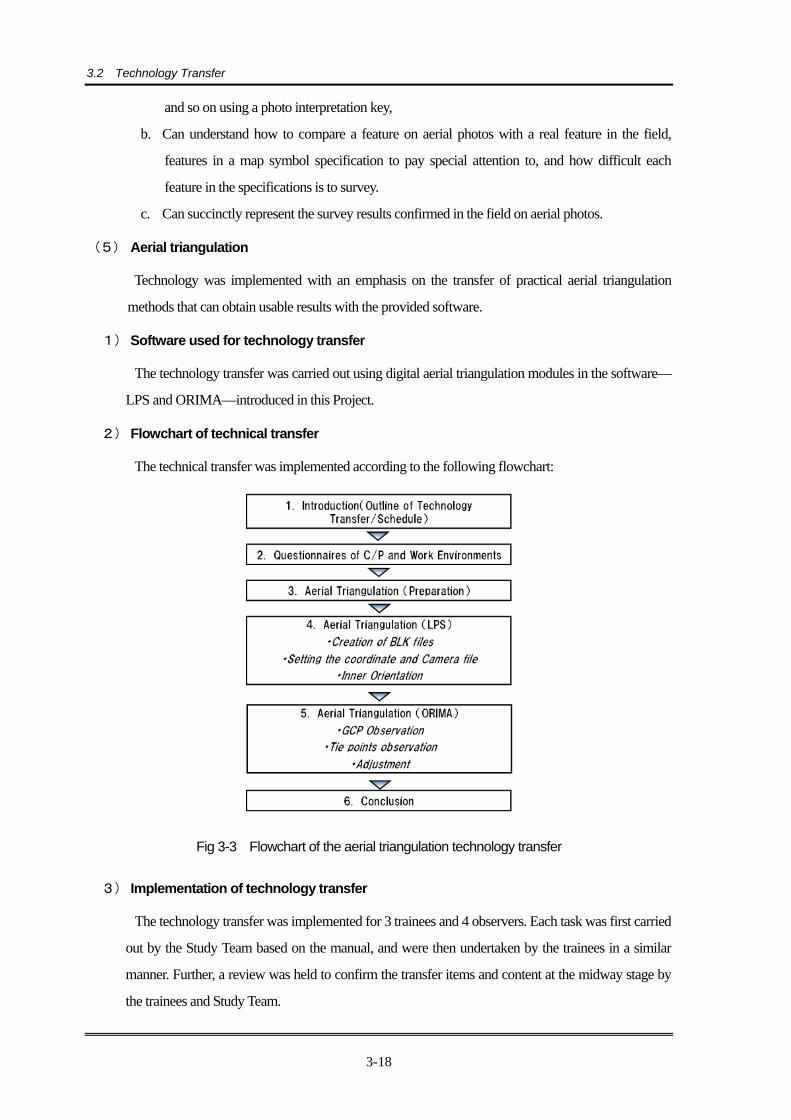
3.2 Technology Transfer
3-18
and so on using a photo interpretation key,
b. Can understand how to compare a feature on aerial photos with a real feature in the field,
features in a map symbol specification to pay special attention to, and how difficult each
feature in the specifications is to survey.
c. Can succinctly represent the survey results confirmed in the field on aerial photos.
(5) Aerial triangulation
Technology was implemented with an emphasis on the transfer of practical aerial triangulation
methods that can obtain usable results with the provided software.
1) Software used for technology transfer
The technology transfer was carried out using digital aerial triangulation modules in the software—
LPS and ORIMA—introduced in this Project.
2) Flowchart of technical transfer
The technical transfer was implemented according to the following flowchart:
Fig 3-3 Flowchart of the aerial triangulation technology transfer
3) Implementation of technology transfer
The technology transfer was implemented for 3 trainees and 4 observers. Each task was first carried
out by the Study Team based on the manual, and were then undertaken by the trainees in a similar
manner. Further, a review was held to confirm the transfer items and content at the midway stage by
the trainees and Study Team.
3.2 Technology Transfer
3-19
4) Results of technology transfer
a. Tasks using LPS
The preparatory operation for creating working files and the inner orientation operation were
transferred. The technology transfer of part of the operation using LPS in the aerial triangulation
was completed.
b. Tasks using ORIMA
The technology for presetting by ORIMA including reading of working files and photo control
point (GCP) data was transferred. Furthermore, the technologies for implementing relative
orientation, successive orientation, and adjustment calculation using the bundle method,
evaluating the calculation results, and establishing the final calculation results were also
transferred.
(6) Digital plotting
It was clear that SDSL had sufficient experience and the capacity of digital plotting in the
preliminary survey. Therefore, the technology transfer was carried out with an emphasis on adaptation
to the newly introduced hardware and software, keeping in mind the need to provide efficient work
schemes. The technology transfer was implemented for 11 trainees in 2 periods.
1) Equipment used
The technology transfer was carried out using the digital plotting system “LPS” and the digital
plotting module “PRO600” for LPS introduced to SDSL in this Project.
2) Contents of technology transfer
The technology transfer was carried out with emphasis on operation by repeating the explanations
and exercises for the following items in order to ensure the trainees gained a good familiarity with the
technology:
a. Preparation before start of digital plotting
b. Digital plotting work
c. Data check
d. Automatic contour production using DEM

3.2 Technology Transfer
3-20
Picture 3-7 Training of trainees in technology transfer
3) Results of technology transfer
The results of the technology transfer were as follows:
a. Preparation before start of digital plotting
A series of technologies, covering everything from creation of the project file to creation of
stereo models using the LPS, were transferred. The technologies covering the start of the
plotting module PRO600 to digital plotting were transferred, including the technologies for
setting various parameters and operating methods.
b. Digital plotting work
The various technologies for the digital plotting work were transferred using the stereo models
of the targeted areas.
c. Data check
Preset values for data check using the functions of PRO600 and implementation of the
checking, and method of correction was transferred.
d. Automatic contour production using DEM
The technology for the automatic production of contours as break lines from the plotted data
was transferred.
4) Evaluation of technology transfer
The trainees were at the level at which they were capable of carrying out the photo interpretation
and drawing on stereo models with no problem. In addition, through repeated exercises they became
familiar with the operation for making stereo models. As a result, it can be evaluated that they will be
capable of digital plotting on its own at the scale of 1/10,000.
(7) Digital compilation (including supplementary digital compilation)
The technology transfer of digital compilation was performed for 12 trainees in two periods.

3.2 Technology Transfer
3-21
1) Equipment used (software)
Technology transfer was implemented using CAD software "Microstation V8 XM Edition" and
"Bentley MAP" introduced in this project.
2) Description of technology transfer
Operation-based technology transfer was implemented by repetitiously providing explanation and
practice on the five items shown below in order to ensure that the trainees acquire the relevant
technology:
a. Understanding of 1/10,000 map symbol specifications
b. Basic technology for operating software of an introduced digital compilation system
c. Technology for setting a digital compilation environment according to the map symbol
specifications
d. Basic operations required for digital compilation
e. Quality control and data management
3) Results of technology transfer
The results of the implemented technology transfer were as follows:
a. Understanding of 1/10,000 map symbol specifications
The trainees have acquired a habit of checking the map symbol specifications as required in
case they find any unknown features while proceeding with the work and have understood the
importance of the map symbol specifications.
b. Basic technology for operating software of an introduced digital compilation system
All of the trainees learned the basic technologies for operating v8 without any particular
problem. The new functions added in v8 (such as zooming in/out and move of the screen)
were acquired as well.
c. Technology for setting a digital compilation environment according to the map symbol
specifications
The technology of making symbols was acquired without any problems. The technology of
making lines, which progresses from making of simple line types to making of gradually more
complex line types was adopted, was acquired. Additionally, the trainees also acquired the v8
environment setup technology
d. Basic operations required for digital compilation
The tools added or upgraded in v8 required to make 1/10,000 digital topographic map were
explained and demonstrated one by one. The trainees learned to use the tools through hands-
on practice.
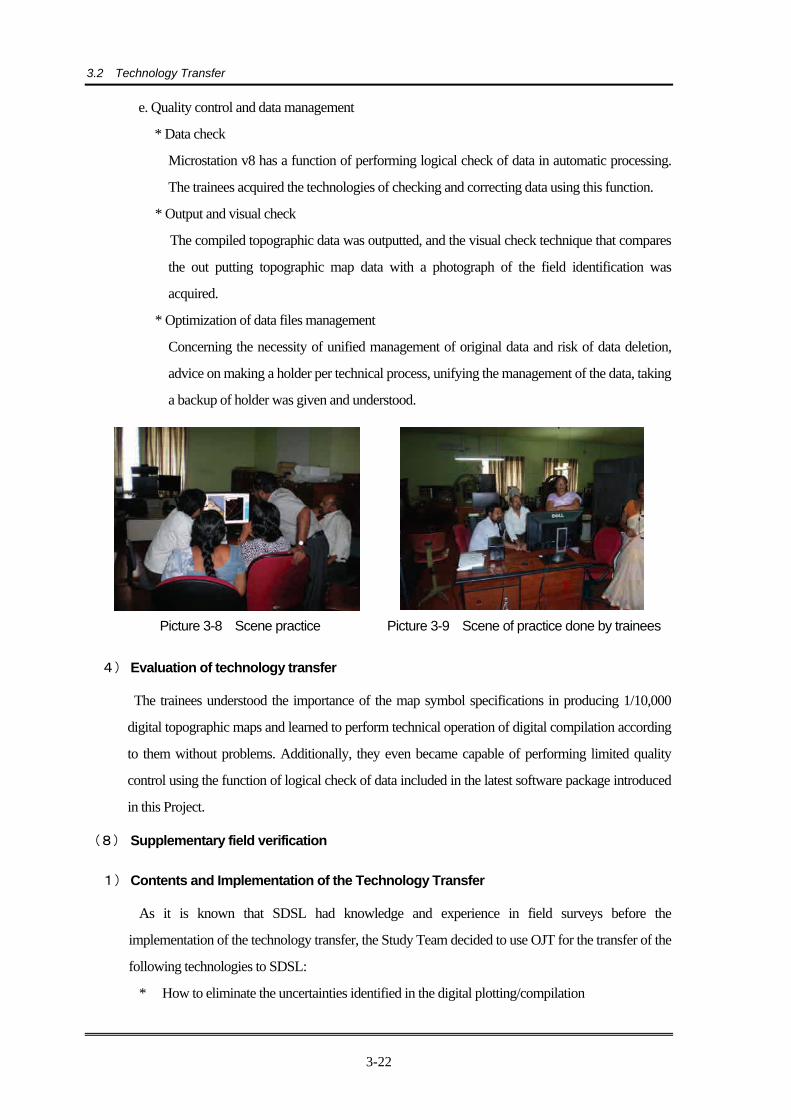
3.2 Technology Transfer
3-22
e. Quality control and data management
* Data check
Microstation v8 has a function of performing logical check of data in automatic processing.
The trainees acquired the technologies of checking and correcting data using this function.
* Output and visual check
The compiled topographic data was outputted, and the visual check technique that compares
the out putting topographic map data with a photograph of the field identification was
acquired.
* Optimization of data files management
Concerning the necessity of unified management of original data and risk of data deletion,
advice on making a holder per technical process, unifying the management of the data, taking
a backup of holder was given and understood.
Picture 3-8 Scene practice Picture 3-9 Scene of practice done by trainees
4) Evaluation of technology transfer
The trainees understood the importance of the map symbol specifications in producing 1/10,000
digital topographic maps and learned to perform technical operation of digital compilation according
to them without problems. Additionally, they even became capable of performing limited quality
control using the function of logical check of data included in the latest software package introduced
in this Project.
(8) Supplementary field verification
1) Contents and Implementation of the Technology Transfer
As it is known that SDSL had knowledge and experience in field surveys before the
implementation of the technology transfer, the Study Team decided to use OJT for the transfer of the
following technologies to SDSL:
* How to eliminate the uncertainties identified in the digital plotting/compilation

3.2 Technology Transfer
3-23
* How to make final confirmation of administrative boundaries, road classification and
annotations
* How to produce and use annotation data files
* Schedule management and accuracy control technologies
* How to prepare Supplementary Field Verification Manual
The OJT included explanation of the Work Manual and implementation of supplementary field
verification work by all the trainees at a single location.
2) Evaluation of the Outcome of the Technology Transfer
The following constitute the evaluation of the outcome of the transfer of each technology.
a. How to eliminate the uncertainties identified in the digital plotting/compilation
Since the counterparts eliminated the uncertainties in accordance with the (draft) Work
Manual and made few mistakes and omissions in representing the results of the elimination,
the Study Team considers that they have mastered the transferred technology sufficiently.
b. How to make final confirmation on administrative boundaries, road classification and
annotation
Since the counterparts made the final confirmation of each item in accordance with the (draft)
Work Manual, the Study Team considers that they have mastered the transferred technology
sufficiently.
c. How to produce and use annotation data files
Since the counterparts produced the annotation data files, the Study Team considers that they
have mastered the technology to produce the files sufficiently. Meanwhile, it has been
revealed to the Study Team that SDSL does not own sufficient number of equipment
including PCs and that the number of people who can use them is thus limited.
d. Schedule management and accuracy control technologies
Since the counterparts completed the predetermined amount of works in the predetermined
period, the Study Team considers that the counterparts have mastered the schedule
management technology. Since the counterparts also completed the Accuracy Control
Chart for each map sheet, the Study Team considers that they have mastered the accuracy
control technology as well.
e. How to prepare Supplementary Field Verification Manual
Although the Study Team had taught the counterparts the method used for the preparation of
the (draft) Work Manual, which was equivalent to the Supplementary Field Verification
Manual, the counterparts failed to revise it by the end of the technology transfer. Therefore,
it is difficult to conclude whether they have mastered the method or not.

3.2 Technology Transfer
3-24
Picture 3-10 Supplementary field verification
(9) Digital data structualization
The six SDSL trainees in the technology transfer for digital data structualization already had three to
five years' work experience. Therefore, the technology transfer was carried out by focusing on the
latest tools, latest technologies, and applied use of introduced software related to the digital data
structualization in everyday work of the trainees.
1) Equipment used (software)
The software used in the technology transfer was ArcGIS 10.0 by ESRI of the U.S.A.
2) Details of technology transfer
The technology transfer was implemented on the following items:
a. Transformation of dgn files of Microstation to File Geodatabase of ArcGIS
b. Data structualization
c. Data compilation
d. Data projective transformation
e. Attribute search and spatial search
f. Export of a large number of maps to PDF files using Data Driven Pages
g. Production of 3D data using TIN and Terrain
h. Mutual transformation between KML files and ArcGIS data
i. Building of a road network
j. Update of Personal Geodatabase
k. Use of Bing Map data as background data
l. Utilization of mosaic datasets
m. Use of attribute domains
n. Use of the batch processing mode of ArcToolbox
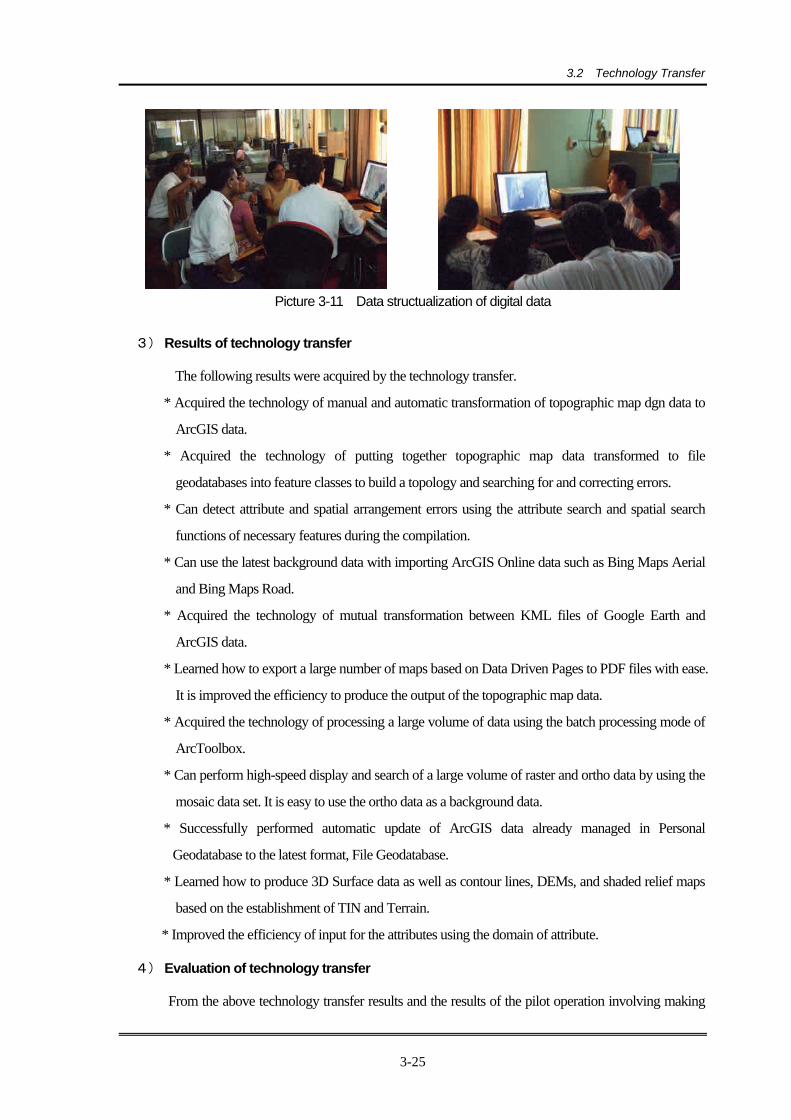
3.2 Technology Transfer
3-25
Picture 3-11 Data structualization of digital data
3) Results of technology transfer
The following results were acquired by the technology transfer.
* Acquired the technology of manual and automatic transformation of topographic map dgn data to
ArcGIS data.
* Acquired the technology of putting together topographic map data transformed to file
geodatabases into feature classes to build a topology and searching for and correcting errors.
* Can detect attribute and spatial arrangement errors using the attribute search and spatial search
functions of necessary features during the compilation.
* Can use the latest background data with importing ArcGIS Online data such as Bing Maps Aerial
and Bing Maps Road.
* Acquired the technology of mutual transformation between KML files of Google Earth and
ArcGIS data.
* Learned how to export a large number of maps based on Data Driven Pages to PDF files with ease.
It is improved the efficiency to produce the output of the topographic map data.
* Acquired the technology of processing a large volume of data using the batch processing mode of
ArcToolbox.
* Can perform high-speed display and search of a large volume of raster and ortho data by using the
mosaic data set. It is easy to use the ortho data as a background data.
* Successfully performed automatic update of ArcGIS data already managed in Personal
Geodatabase to the latest format, File Geodatabase.
* Learned how to produce 3D Surface data as well as contour lines, DEMs, and shaded relief maps
based on the establishment of TIN and Terrain.
* Improved the efficiency of input for the attributes using the domain of attribute.
4) Evaluation of technology transfer
From the above technology transfer results and the results of the pilot operation involving making
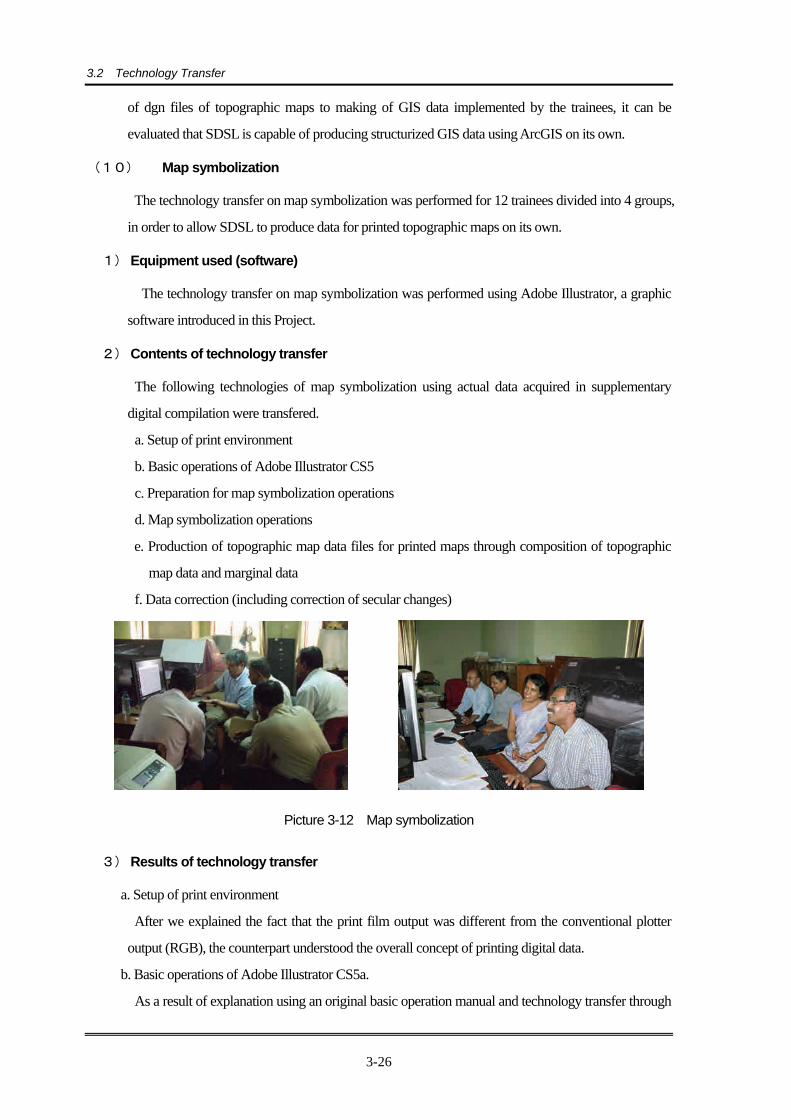
3.2 Technology Transfer
3-26
of dgn files of topographic maps to making of GIS data implemented by the trainees, it can be
evaluated that SDSL is capable of producing structurized GIS data using ArcGIS on its own.
(10) Map symbolization
The technology transfer on map symbolization was performed for 12 trainees divided into 4 groups,
in order to allow SDSL to produce data for printed topographic maps on its own.
1) Equipment used (software)
The technology transfer on map symbolization was performed using Adobe Illustrator, a graphic
software introduced in this Project.
2) Contents of technology transfer
The following technologies of map symbolization using actual data acquired in supplementary
digital compilation were transfered.
a. Setup of print environment
b. Basic operations of Adobe Illustrator CS5
c. Preparation for map symbolization operations
d. Map symbolization operations
e. Production of topographic map data files for printed maps through composition of topographic
map data and marginal data
f. Data correction (including correction of secular changes)
Picture 3-12 Map symbolization
3) Results of technology transfer
a. Setup of print environment
After we explained the fact that the print film output was different from the conventional plotter
output (RGB), the counterpart understood the overall concept of printing digital data.
b. Basic operations of Adobe Illustrator CS5a.
As a result of explanation using an original basic operation manual and technology transfer through
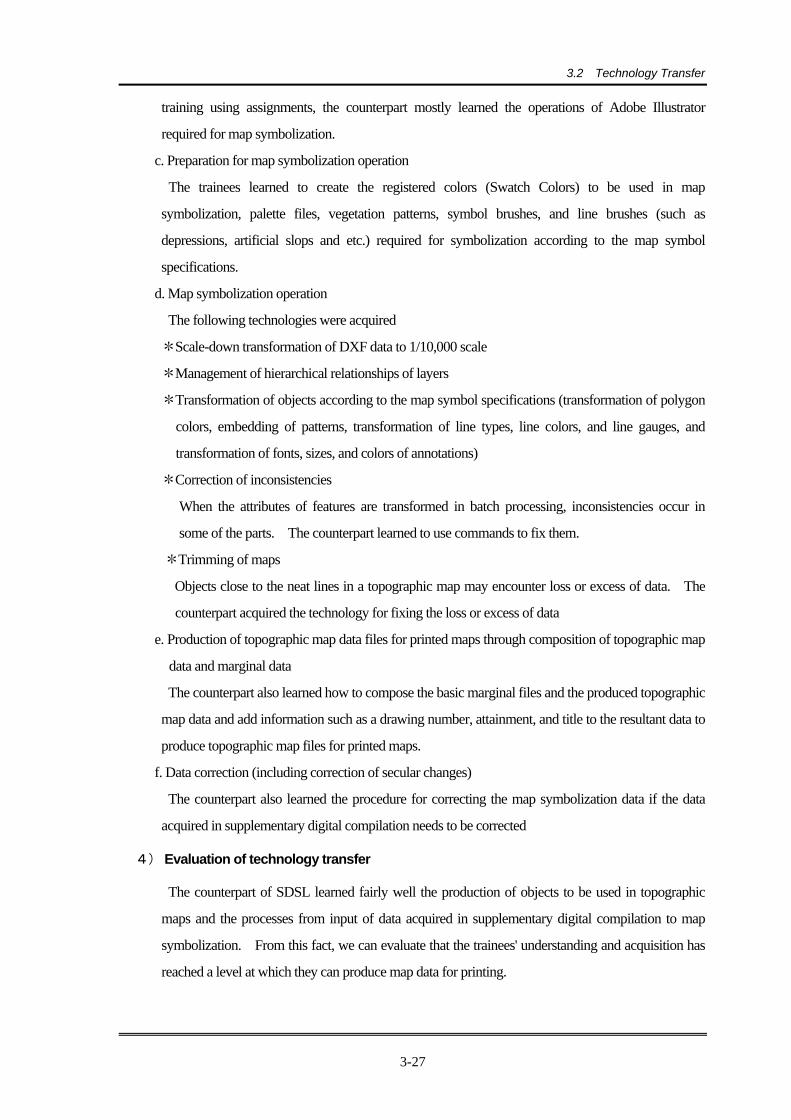
3.2 Technology Transfer
3-27
training using assignments, the counterpart mostly learned the operations of Adobe Illustrator
required for map symbolization.
c. Preparation for map symbolization operation
The trainees learned to create the registered colors (Swatch Colors) to be used in map
symbolization, palette files, vegetation patterns, symbol brushes, and line brushes (such as
depressions, artificial slops and etc.) required for symbolization according to the map symbol
specifications.
d. Map symbolization operation
The following technologies were acquired
*Scale-down transformation of DXF data to 1/10,000 scale
*Management of hierarchical relationships of layers
*Transformation of objects according to the map symbol specifications (transformation of polygon
colors, embedding of patterns, transformation of line types, line colors, and line gauges, and
transformation of fonts, sizes, and colors of annotations)
*Correction of inconsistencies
When the attributes of features are transformed in batch processing, inconsistencies occur in
some of the parts. The counterpart learned to use commands to fix them.
*Trimming of maps
Objects close to the neat lines in a topographic map may encounter loss or excess of data. The
counterpart acquired the technology for fixing the loss or excess of data
e. Production of topographic map data files for printed maps through composition of topographic map
data and marginal data
The counterpart also learned how to compose the basic marginal files and the produced topographic
map data and add information such as a drawing number, attainment, and title to the resultant data to
produce topographic map files for printed maps.
f. Data correction (including correction of secular changes)
The counterpart also learned the procedure for correcting the map symbolization data if the data
acquired in supplementary digital compilation needs to be corrected
4) Evaluation of technology transfer
The counterpart of SDSL learned fairly well the production of objects to be used in topographic
maps and the processes from input of data acquired in supplementary digital compilation to map
symbolization. From this fact, we can evaluate that the trainees' understanding and acquisition has
reached a level at which they can produce map data for printing.
3.3 Other Works
3-28
3.3 Other Works
3.3.1 Seminar/Workshop
(1) Holding Seminar/Workshop
The Seminar/Workshop was held on November 4th 2011 at Water Edge with approximately 150
participants, including the Deputy Minister and the Secretary of the competent ministry of SDSL.
The addresses of the guests of honour were followed by presentations on the outline of the Project
and public dissemination of the project outputs and a presentation on its future activity plan formulated
by SDSL on the basis of the outcome of this Project. There was also a presentation on the
specifications of the project outputs and some presentations by the Study Team and SDSL on the
outcome of the technology transfer.
Digital plotting, one of the outputs of the technology transfer was demonstrated and some of the
participants practiced digital plotting.
In the closing stage of the Seminar/Workshop, guidelines for construction of GIS database and
construction of various geospatial data sets expected to be implemented by SDSL were presented as a
recommendation. At the closing, a question-and-answer session for the entire Seminar/Workshop
was held. Then the participants were asked to fill in a questionnaire asking their requests to SDSL on
use and dissemination of the digital topographic maps produced in this Project and production of digital
topographic maps of the Northern Region.
3.3.2 Reports
(1) Production of Inception report (IC/R)
The Inception Report was produced by compiling the basic policies, procedures, implementation
system, schedule and so on.
(2) Explanation of and Discussion on Inception report
The explanation and discussion of the IC/R was held on 4th March 2010. Present on the Sri Lankan
side were nine members of SDSL management, and four members of the study team and one person
from the JICA Sri Lanka Office.
The content of the project including its purpose, target, basic policy, procedures, schedule, and
outputs, were explained based on the report. During the discussion after the explanation, there were
some questions and answers.
With those questions and answers, the Inception Report was approved. The above details were
compiled in the Minutes of Meeting and both parties signed it.
3.3 Other Works
3-29
(3) Production of Interim report (IT/R)
The Interim Report was produced detailing the progress of the project and evaluation of its
implementation as of the end of September 2010, and how and when the rest of the project will
proceed.
(4) Explanation of and Discussion on Interim report
Explanation of and discussion on Interim Report was held at the SDSL office on September 28th,
2010. Participating were six staff of SDSL, four members of the Study Team, and one from the
JICA Sri Lanka office.
In the explanation the implementation status of each component of the project up to the end of
September 2010 was explained according to the Interim Report. The mid-term results of the project
and their evaluation were also explained. Furthermore, the policies and plans for the remaining
operations were explained. The discussion after the explanation involved some questions and
answers.
With the discussion results, the questions and answers, the Interim Report was approved.
The above content was compiled in the minutes of meeting and signed by both parties.
(5) Production of Draft final report (DF/R)
The Draft Final Report covering the results and implementation status of the whole project has
been made. In addition, two guidelines (work manuals) were made, one so that SDSL can
independently produce, update and manage various data (geographic spatial data) in future, and
another for establishing the database and designing the system for a GIS.
(6) Explanation of and Discussion on Draft final report
Explanation of and Discussion on the Draft Final Report was held on November 1st 2011 at the
SDSL Office. Nine SDSL staff members, including the Surveyor General, five Study Team members
and one staff member of JICA Sri Lanka Office attended the Explanation/Discussion.
In the Explanation/Discussion, the Study Team explained the outline of the Project, implementation
of the Project, the outcome of the project implementation and production of digital topographic maps in
future in accordance with the Draft Final Report. After the explanation, discussion was held on the
addition of the description of the changes made in the original plan to the Report, attachment of
reference data required for future activities to the Report, a future plan to produce digital topographic
maps of the Northern Region and problems expected in the implementation of the plan. Discussion
was also held on lessons learned by the Study Team and SDSL from the project implementation.
After the question-and-answer session and discussion, the Draft Final Report was approved.
The minutes of the meeting describing the explanation and discussion mentioned above were

3.4 Lessons Learned During the Implementation of This Project and from the Results of the Implementation
3-30
prepared and approved by the parties involved with the signatures of the authorized personnel of the
respective parties.
(7) Production of Final report (F/R)
The Study Team produced the Final Report by making revisions and additions to the Draft Final
Report as required by the outcome of the Explanation of and Discussion on the Draft Final Report and
the progress and outcome of the works implemented after the completion of the Draft Final Report.
3.4 Lessons Learned During the Implementation of This Project and from the Results of the Implementation
3.4.1 Lessons Learned During the Implementation of This Project
(1) Aerial Photography
a. We became keenly aware of the importance of not only organizational relationships but also personal
relationships with the relevant personnel in facilitating the acquisition of permits during the process
of obtaining the various permits for the implementation of aerial photography.
b. From the experience of the engine trouble of the aircraft to be used for the aerial photography, we
recommend that the contractor for aerial photography should at least have the capacity to make
arrangements for a replacement aircraft and that arrangements for a replacement aircraft should be
confirmed or specified in the contract concluded with the contractor.
(2) Procurement of Equipment to be Used in the Project
a. With regard to the procurement of equipment for the project (including that for the technology
transfer), the required equipment (with specifications, brand names, quantities, etc.) and the locations
at which such equipment can be procured need to be clarified at the start of the project. The
equipment (specifications, brand nemes, quantities and composition), especially equipment that the
operability and sustainability of techniques are different based on the past experience, must be
discussed and decided upon with the C/P institution.
3.4.2 Lessons Learned from the Results of the Implementation of This Project
(1) Specifications for the Digital Topographic Maps to be Produced
Since a digital topographic map is viewed as a form of geospatial data, the map symbol
specifications will have to be converted to specifications for topographic maps which incorporate the
concept of a topographic map database in the GIS. Needless to say, the above-mentioned argument is

3.4 Lessons Learned During the Implementation of This Project and from the Results of the Implementation
3-31
based on the assumption that the purposes of use of the GIS have been clearly established.
(2) Aerial Photography
Taking into account increasingly abnormal weather conditions these days, this type of project must
be start before the dry season, which is the best time for aerial photography and the appropriate
resposes must be taken for the wether condition.
(3) Procurement of Equipment for the Project
Project components in which procured equipment is to be used should be highly independent of
other components and involve project team members and C/Ps who are not involved in any other
project component. Even within a limited project implementation period, the project
implementation schedule should allow some extra time.
(4) Technology Transfer
The fruits of the technology transfer are intangible. However, the output maps of the digital plotting,
the digital compilation and the map symbolization produced by the C/Ps using the transferred
technologies in the parts of the technology transfer are represented, albeit indirectly, the outputs of the
technology transfer.
4.1 Effective Use of the Project Outputs
4-1
Chapter 4 Efforts toward the Development of Digital Topographic Map
4.1 Effective Use of the Project Outputs
4.1.1 Effective Use of the Digital Topographic Maps
(1) Publication of Digital Topographic Maps and Their Specifications
The digital topographic maps and their specifications shall be made public. At the same time,
measures will be taken to make the relevant government offices and the general public widely aware
of the publication of the topographic maps and their specifications, including the conditions for their
use.
(2) Awareness Creation Activities to Promote Use of the Digital Topographic Maps
Awareness creation activities customized mainly for relevant government offices, local authorities
and donor organizations shall be conducted
(3) Supply System of the Digital Topographic Maps
A decision shall be made on copyrights, supply methods (supply points, supply media, etc.), prices
and etc. which are to be established.
4.1.2 Effective Use of the Outputs of the Technology Transfer
The Study Team is evaluating the output of the implemented technology transfer. SDSL is required to
evaluate the technology transfer themselves as a recipient organization of the implemented technology
transfer and to propose actions to be taken on the basis of the evaluation results. Such evaluation shall be the
first step for SDSL toward effective use of the output of the technology transfer.
4.2 Tasks Based on the Results of Technology Transfer
4.2.1 Summary of the Technology Transfer
In the project, the following technologies to be applied to making of 1:10,000 scale digital topographic
maps were transferred:
Photo Control point survey: Installation of air-photo signals, GPS survey, leveling, and pricking
Field identification: Field identification (using aerial photos) and supplementary field verification.
Digital photogrammetry: Digital aerial triangulation, digital plotting and compilation, digital data
structurization, map symbolization
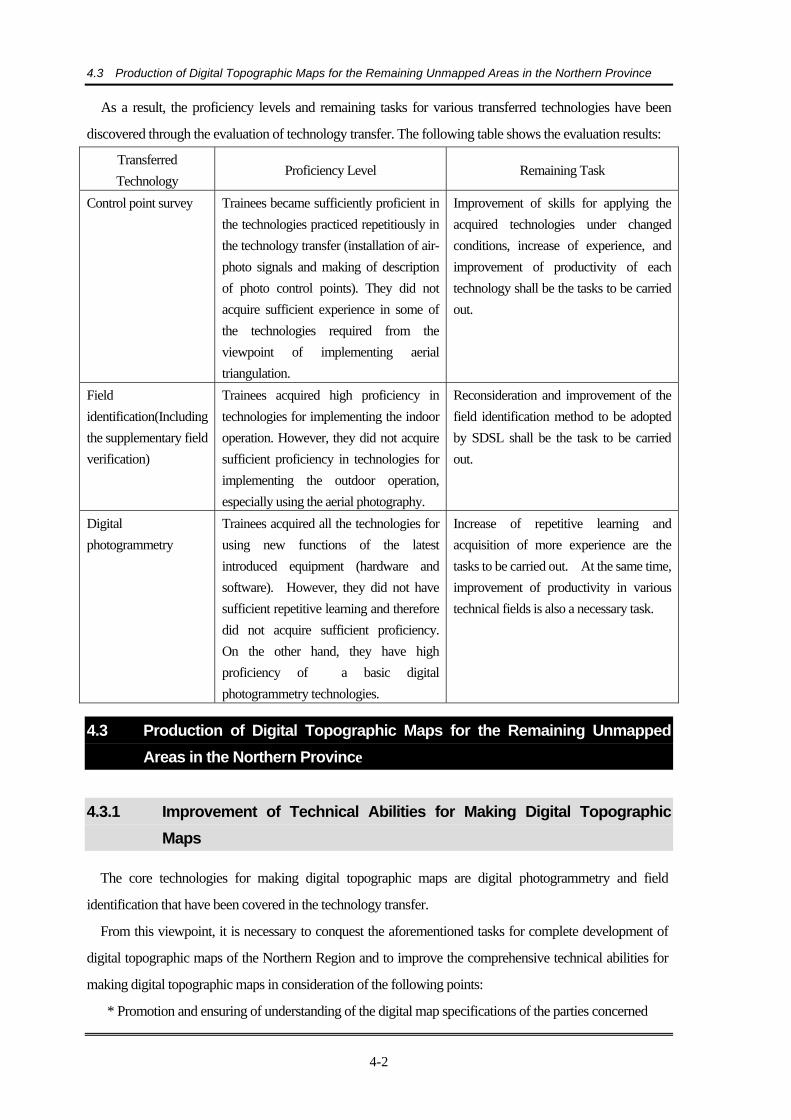
4.3 Production of Digital Topographic Maps for the Remaining Unmapped Areas in the Northern Province
4-2
As a result, the proficiency levels and remaining tasks for various transferred technologies have been
discovered through the evaluation of technology transfer. The following table shows the evaluation results:
Transferred Technology
Proficiency Level Remaining Task
Control point survey Trainees became sufficiently proficient in the technologies practiced repetitiously in the technology transfer (installation of air-photo signals and making of description of photo control points). They did not acquire sufficient experience in some of the technologies required from the viewpoint of implementing aerial triangulation.
Improvement of skills for applying the acquired technologies under changed conditions, increase of experience, and improvement of productivity of each technology shall be the tasks to be carried out.
Field identification(Including the supplementary field verification)
Trainees acquired high proficiency in technologies for implementing the indoor operation. However, they did not acquire sufficient proficiency in technologies for implementing the outdoor operation, especially using the aerial photography.
Reconsideration and improvement of the field identification method to be adopted by SDSL shall be the task to be carried out.
Digital photogrammetry
Trainees acquired all the technologies for using new functions of the latest introduced equipment (hardware and software). However, they did not have sufficient repetitive learning and therefore did not acquire sufficient proficiency. On the other hand, they have high proficiency of a basic digital photogrammetry technologies.
Increase of repetitive learning and acquisition of more experience are the tasks to be carried out. At the same time, improvement of productivity in various technical fields is also a necessary task.
4.3 Production of Digital Topographic Maps for the Remaining Unmapped Areas in the Northern Province
4.3.1 Improvement of Technical Abilities for Making Digital Topographic Maps
The core technologies for making digital topographic maps are digital photogrammetry and field
identification that have been covered in the technology transfer.
From this viewpoint, it is necessary to conquest the aforementioned tasks for complete development of
digital topographic maps of the Northern Region and to improve the comprehensive technical abilities for
making digital topographic maps in consideration of the following points:
* Promotion and ensuring of understanding of the digital map specifications of the parties concerned
4.3 Production of Digital Topographic Maps for the Remaining Unmapped Areas in the Northern Province
4-3
* Effective utilization of the project outputs
* Propagation of technologies acquired in the project
4.3.2 Formulation of a Project to Produce Digital Topographic Maps of the Remaining Unmapped Areas in the Northern Region
A project for production of digital topographic maps for the remaining unmapped areas in the Northern
Region shall be formulated taking into consideration the available technical capacities and the issues
mentioned below:
* To establish the priority order for digital map production within the unmapped areas
* Human and material resources of SDSL which can be mobilized for mapping
* Per-unit production at each technical stage
4.3.3 Project to Produce Digital Topographic Maps of the Remaining Unmapped Areas in the Northern Region
(1) Gathering of Information Required for the Map Production Project
Regarding the formulation of a project to produce digital topographic maps of the remaining areas,
Information needs to be gathered on priority areas, human and material resources available for map
mapping and per-unit production.
(2) Formulation of the Map Production Project
On the basis of the information gathered as mentioned above, a map production project shall be
formulated taking into consideration the needed periods and the degree of overlap with each process
involved in the project.
(3) The Map Production Project for the unmapping areas in the Northern Region by SDSL
SDSL has formulated plans to produce digital topographic maps with a priority order for the areas
to be mapped based on the requests of relevant government offices.
In these plans, SDSL has formulated two options: an ordinary plan aiming at completion of map
production by June 2014 and a fast track plan aiming at completion of map production by March
2013. In the formulation of the plans, SDSL used design figures of production per unit period in the
major processes for the formulation of map production schedules.
Regardless of whichever plan is adopted, securing necessary budget and human resources, in
addition to mapping productivity improvement will be vital to achieving the plan.

4.3 Production of Digital Topographic Maps for the Remaining Unmapped Areas in the Northern Province
4-4
4.3.4 Project to Produce Digital Topographic Maps of the Remaining Unmapped Areas in the Northern Province
Once the implementation of the digital topographic map production project in accordance with the
formulated map production project has begun, accuracy control measures will have to be carried out at each
process to maintain the product quality. At the same time, project implementation will need to be constantly
monitored in order to prevent any delays.