Embed Size (px)
Citation preview

Copyright © 2010 by Nicholas Bloom, Luis Garicano, Raffaella Sadun, and John Van Reenen
Working papers are in draft form. This working paper is distributed for purposes of comment and discussion only. It may not be reproduced without permission of the copyright holder. Copies of working papers are available from the author.
The distinct effects of Information Technology and Communication Technology on firm organization Nicholas Bloom Luis Garicano Raffaella Sadun John Van Reenen
Working Paper
11-023

The distinct e¤ects of Information Technology andCommunication Technology on �rm organization�
Nicholas Bloomy, Luis Garicano z, Ra¤aella Sadunxand John Van Reenen{
September 6, 2010
Abstract
Empirical studies on information communication technologies (ICT) typically aggregatethe �information�and �communication�components together. We show theoretically andempirically that this is problematic. Information and communication technologies havevery di¤erent e¤ects on the decisions taken at each level of an organization. Better infor-mation access pushes decisions down, as it allows for superior decentralized decision makingwithout an undue cognitive burden on those lower in the hierarchy. Better communicationpushes decisions up, as it allows employees to rely on those above them in the hierarchyto make decisions. Using an original dataset of �rms from the US and seven Europeancountries we study the impact of ICT on worker autonomy, plant manager autonomy andspan of control. Consistently with the theory we �nd that better information technologies(Enterprise Resource Planning, ERP , for plant managers and CAD=CAM for productionworkers) are associated with more autonomy and a wider span of control. By contrast, com-munication technologies (like data networks) decrease autonomy for both workers and plantmanagers. Treating technology as endogenous using instrumental variables (distance fromthe birthplace of ERP and heterogeneous telecommunication costs arising from di¤erentregulatory regimes) strengthen our results.
JEL No. O31, O32, O33, F23Keywords: organization, delegation, information technology, communication technol-
ogy, the theory of the �rm.
�This is an extensively revised version of Bloom et al (2009). We thank participants in seminars in the AEA,Chicago, Harvard/MIT, LSE, Microsoft and NBER for helpful comments.We would like to thank the ESRC forhelp with �nancing this research through the Centre for Economic Performance.
yStanford University, Centre for Economic Performance, NBER and CEPRzLondon School of Economics, Centre for Economic Performance and CEPRxHarvard University and Centre for Economic Performance{London School of Economics, Centre for Economic Performance, NBER and CEPR
1

1 Introduction
Most studies of the impact of information and communication technologies (ICT) on �rm orga-
nization, inequality and productivity (see below) treat ICT as an aggregate homogeneous cap-
ital stock. However, these technologies have at least two distinct components. First, through
the spread of cheap storage and processing of data, information stored in databases is becoming
cheaper to access. Second, through the spread of cheap wired and wireless communications,
agents �nd it easier to communicate with each other (e.g. e-mail and mobile devices). Reduc-
tions in the cost of accessing information stored in databases and of communicating information
among agents can be expected to have a very di¤erent impact on �rm organization. While
cheaper communication technology facilitates specialization, generating a reduction in the va-
riety of tasks performed by workers as agents rely more on others, cheaper information access
has an �empowering�e¤ect, allowing agents to handle more of the problems they face without
relying on others. This di¤erence matters not just for �rms�organization and productivity,
but also in the labor market, as information access and communication technology changes can
be expected to a¤ect the wage distribution in opposite directions.1 In this paper, we utilize
a new international �rm-level data set with directly measured indicators of organization and
technologies to study whether indeed ICTs have these distinct e¤ects.
Our starting point is the analysis in Garicano (2000) on the hierarchical organization of
expertise. Decisions involve solving problems and thus acquiring the relevant knowledge for
the decision. In determining at what hierarchical level decisions should be made, �rms face
a trade-o¤ between information acquisition costs and communication costs. Making decisions
at lower levels implies increasing the cognitive burden of agents at those levels. For example,
decentralizing from the corporate head quarters (CHQ) to plant managers over the decision
whether to invest in new equipment requires training plant managers to better understand
�nancial decision making, cash �ows, etc. To the extent that acquiring this knowledge is
expensive, the knowledge of the plant manager can be substituted for by the knowledge of
those at corporate head quarters. Relying more on the direction of corporate head quarters
reduces the cognitive burden on the plant manager and so lowers the total information acqui-
sition costs. But this comes at the price of increasing communication between levels in the
hierarchy, increasing total communication costs. From a cognitive perspective, decentralized
decision making thus implies an increase in the cost of information acquisition to economize
1For example, Garicano and Rossi-Hansberg (2006) analyze theoretically this impact on wages.
2

on communication costs: trading-o¤ knowing versus asking for directions.
The level at which decisions are taken thus responds to the cost of acquiring and com-
municating information. Reductions in the cost of communication allows for a reduction in
knowledge acquisition costs through the increasing use of �management by exception�, e.g. lo-
cal managers rely more on corporate managers for decision making. Reductions in the cost of
information access, on the other hand, reduce the cognitive burden imposed by decentralized
decision making and makes more decentralization e¢ cient. Consequently, information and
communication technologies a¤ect di¤erently the hierarchical level at which di¤erent decisions
are taken. Improvements in information technology should push decisions �down�leading to
decentralization while improvements in communication technology should push decisions �up�
leading to centralization.
In this paper, we study this cognitive view of hierarchy by testing for the di¤erential impact
on the organization of �rms of these two types of technologies (information vs. communication).
To do this, we extend Garicano (2000) to consider two types of decisions and discuss in each
case technologies that make it easier for agents to acquire the information necessary to make
them and their technologies that improve communication. This extension is methodologically
important as the data available to researchers on real authority has multiple types of decisions
(e.g. worker decisions on the production line vs. managerial decisions on investment). First,
we consider non-production decisions. These decisions can either be taken at the central
head quarters by corporate o¢ cers, or delegated to a business unit (in our case, the plant
manager). The speci�c decisions that we study are capital investment, hiring new employees,
new product introductions and sales and marketing decisions. The key piece of information
technology that has recently a¤ected information access by these managers is, as we discuss in
Section 3, Enterprise Resource Planning (ERP ). These ERP systems increase dramatically
the availability of information to decision makers in the company, that is they reduce the cost
of acquiring information to solve a problem2. It follows that they should increase the autonomy
of the plant manager.
Second, we consider factory �oor production decisions. These are decisions on the pro-
duction process that can either be taken by factory �oor employees or by those in the plant
hierarchy, such as which tasks to undertake and how to pace them. Here, a key technological
change in the manufacturing sectors we focus on is the introduction of Computer Assisted
Design/Computer Assisted Manufacturing (CAD=CAM). A worker with access to those ma-
2We present survey evidence consistent with our discussions with technology experts that ERP primarilyreduces information acquisition costs rather than reducing communication costs.
3

chines can solve problems better, and thus needs less access to his superiors in making decisions.
This technology should increase their autonomy and, by reducing the amount of help they need
from plant managers, increase the span of control of plant managers.
In sum, we expect �information technologies�(ERP and CAD=CAM) to decentralize de-
cision making respectively in non production decisions (from CHQ to plant managers) and in
production decisions (from plant managers towards production workers). On the other hand,
as we argued above, we expect communication technologies to centralize decision making. This
will be true both for production workers (so that plant-managers will take more of their deci-
sions), and also for plant-managers (so that the central head quarters will take more of their
decisions). A key technological innovation a¤ecting communication is the growth of networks.
We thus also test whether the availability of networks reduced the decision making autonomy
in production decisions of workers, and in non-production decisions of managers.
We utilize a new data set that combines plant-level measures of organization and ICT
across the US and Europe. The organizational questions were collected as part of our own
management survey work (see Bloom and Van Reenen, 2007) and were asked to be directly
applicable to the theories we investigate. The technology dataset is from a private sector
data source (Harte-Hanks) that has been used mainly to measure hardware utilization in large
publicly listed �rms (e.g. Bresnahan, Brynjolfsson and Hitt, 2002), whereas we focus on the
less used software components of the survey.
In terms of identi�cation, we mainly focus on conditional correlations between the di¤erent
ICT measures and three dimensions of the organization of the �rm, guided by our theoretical
predictions. But we also consider two instrumental variable strategies. First, we use the
distance from the birthplace of SAP, the �rst major ERP (and still the market leader) as an
instrument for ERP presence, drawing on the general observation (which is true in our data)
that the di¤usion of an innovation generally has a strong geographical dimension.3 Second,
we utilize the fact that the di¤erential regulation of the telecommunication industry across
countries generates exogenous di¤erences in the e¤ective prices of networks. We show that
industries that exogenously rely more on networks are at a greater disadvantage in countries
with high communication costs, and use this to identify the e¤ect of communication costs on
decentralization. Our IV results support a causal interpretation of the e¤ect of information
and communication technologies on �rm organizational.
3Examples of how geographical proximity is important for di¤usion include Holmes (2010), Gri¢ th, Lee andVan Reenen (2007), Skinner and Staiger (2005), Henderson, Ja¤e and Trajtenberg (2003) and (for a survey)Foster and Rosenzweig (2010). Becker and Woessmann (2009) use distance from Wittenberg as in instrumentfor the spread of Protestantism in Germany which they show fosters human capital. Note that in our regressionswe control for human capital, so this cannot be driving the results.
4

In short, the evidence is supportive of the theory. Technologies that lead to falling informa-
tion costs for non-production decisions (like ERP ) tend to empower plant managers (relative
to the CHQ) and technologies that lead to falling information costs for production decisions
(like CAD=CAM) tend to empower workers relative to plant managers. Information technolo-
gies also widen the span of control. By contrast, technologies that reduce communication costs
(like networks) lead to more centralization and have ambiguous e¤ects on the span of control
(in the theory and the data).
As we argued above, much previous empirical work on has tended to aggregate ICTs to-
gether as one homogenous technology due to data constraints, often simply measured by com-
puters per person or �ICT capital�. As noted above, this is problematic since hardware will
simultaneously reduce information and communication costs, and we show that these should
have very di¤erent e¤ects on �rm organization. One strand of the literature looks for com-
plementarities between ICT and organizational aspects of the �rm, but takes organization as
exogenous.4 A second branch tries to endogenize organization, but does not discriminate be-
tween types of ICT.5 A third branch, which we are perhaps closest to, looks more closely at the
e¤ects of ICT on organization but does so in the context of a single industry in a single coun-
try.6 What is unique about our study is the disaggregation of types of ICT and organization
across a number of industries and countries.
An alternative to our cognitive perspective is that hierarchies may be a solution to incentive
problems (e.g. Calvo and Weillisz, 1978; Aghion and Tirole, 1997; Dessein, 2002), linked to
automation (Autor et al, 2003) or the result of coordination issues (Cremer et al. 2007 and
Alonso et al, 2008). Although we do not reject the potential importance of other mechanisms,
we think our information perspective is �rst order and provide some empirical support for this
in a range of robustness tests.7
We proceed as follows. In Section 2 we discuss a basic theoretical framework that allows us
to study the impact of information and communication technologies. We then map the model
to the data by identifying some key factors that a¤ected information and communication costs
(Section 3). We then discuss our data (Section 4), and present our results (Section 5). The
4See the survey in Draca, Sadun and Van Reenen (2007). Examples include Bartel, Ichinowski and Shaw(2007), Black and Lynch (2001), Bloom, Sadun and Van Reenen (2007) and Bresnahan, Brynjolsson and Hitt(2002).
5For example see Acemoglu et al (2007), Caroli and Van Reenen (2001), Colombo and Delmastro (2004),Crepon et al (2004) and Aubert et al (2004). To explain the evidence for trend delayering described in Rajanand Wulf (2006), Guadalupe and Wulf (2008) emphasis competition rather than ICT.
6See, for example, Baker and Hubbard (2003, 2004) or the case studies in Blanchard (2004).7Our work also relates to the wider theoretical literature on �rm delegation. For example, see Baron and
Besanko (1992), Melumad et al (1995), Mookherjee (2006), Baker et al (1999), Radner (1993) and Hart andMoore (2005).
5

�nal section o¤ers some concluding comments.
2 Theory
2.1 Communication technology Centralizes; Information Technology Decen-tralizes
Garicano (2000) proposes a theory of a hierarchy as a cognitive device. In the model the role
of hierarchy is to facilitate the acquisition of knowledge by increasing its utilization rate. Here
we present a simpli�ed version of that theory, which allows us to extend it towards a setting
with di¤erent types of decisions (production and non-production).
Assumption 1. Production requires time and knowledge. Each production worker draws a
unit measure of problems (or tasks or decisions) in [0; 1] per unit of time. Production only
takes place if all the problems are dealt with by someone in the organization. We normalize to
1 the output per agent and per unit of time once problems are solved. Some problems occur
more often than others: problems are distributed according to a density function f(z): Agents
can only deal with a problem or task if they have the relevant knowledge.
Assumption 2. Knowledge acquisition is costly. The cost incurred by an agent i to acquire
the knowledge necessary to deal with all problems is ai: This cost may depend on the technology
available to di¤erent agents and their skill. Thus an agent who acquires the information
required to perform all the tasks produces net output 1� ai:8
Assumption 3. Knowledge can be communicated. The cost of training agents can be reduced
through a hierarchy in which production agents�autonomy is reduced, so that they only need
enough knowledge to deal with some problems - that is, those in (0; zp)- and ask for help on
the rest to an agent who is specialized in problem solving, whose knowledge we call zm(m for
manager). The communication or helping cost h is incurred whenever help is sought, that
is h is incurred per question posed. Clearly, communication is minimized if workers learn the
most common problems and ask help on the rest; thus without loss of generality, we reorder
problems so that f 0(z) < 0; i.e. more common problems have a lower index and are performed
by workers. That is �management by exception� is optimal, where workers do routine tasks
and managers deal with the exceptions.9 Figure 1 illustrates this task allocation.
8The cost of information acquisition was denoted �c�in earlier versions to be consistent with Garicano (2000).The change in notation was made to avoid confusion with communication, or helping, cost �h�.We assume thecost of learning is linear so that learning z problems costs az: This is without loss, as we can rede�ne problemsof tasks so that f(z) is the frequency of a renormalized (equal cost) problem.
9See Garicano (2000) for a formal proof and characterization of this result. In that paper, there are potentiallymany layers of problem solvers, and organizations can decide which problems to do and which ones not to deal
6

[Figure 1 about here]
The value of the additional layer of problem solvers is that by reducing lower level workers�
decision range, the cost of acquiring information is reduced. The cost of hierarchy is the time
wasted in communication, since problem solvers do not produce output, but instead use their
time to help others solve their problems.
Suppose a team must deal with N problems per unit of time. The team needs then N
production workers in layer 0 and nm managers or problem solvers. The pro�ts generated
by this hierarchy with N production workers, each receiving a wage wp, and nm managers
specialized in �problem solving�or �helping�, receiving a wage wm, is:10
� = N �N(apzp + wp)� nm(amzm + wm) (1)
that is, when the N production workers have autonomy zp they must learn the zp most common
problems. We further assume (although it is unnecessary for the results) that the learning
technology is such that managers know all the tasks that workers also know, and more, so that
knowledge overlaps.11 Thus since all tasks must be dealt with zm = 1. A production agent can
deal with a fraction F (zp) of the tasks and asks for help with probability (1� F (zp)): Thus amanager spends time h(1� F (zp)) helping each production worker. Since there are N agents,
the needed number of managers or problem solvers is Nh(1�F (zp)) = nm; resulting in a span,or ratio of workers per manager of s = N=nm. This constraint determines a trade-o¤ between
what the agents below can do and how many managers are needed. The more knowledge
acquired by lower level agents, the less managers are needed. Figure 2 provides an overview of
the model.
The problem of the hierarchy is to decide the size or span of the hierarchy (s) and the
degree of worker autonomy (zp) so as to maximize pro�ts per problem. Substituting for nm in
equation (1) we obtain:
with at all- while here all problems must be solved. It is shown that the organization set up in the model(characterized by �management by exception�) is optimal. Intuitively, if those lower in the hierarchy learntexceptions (rather than routine tasks), the tasks could be swapped, reducing communication costs. Here, in ourbasic model, there are only two layers and all problems are (eventually) solved; the only choice is who learnsthe solution. The model with two types of problems in Section 3.2. extends the framework in Garicano (2000).10We are solving throughout for the partial equilibrium e¤ects (taking wages as given) as is common in the
literature (see e.g. Milgrom and Roberts, 1990). For a general equilibrium analysis with heterogeneous workers(i.e. where wages are adjusting) see Garicano and Rossi-Hansberg (2006).11This overlapping knowledge assumption is used because it seems more reasonable in the empirical context,
but it is irrelevant for the comparative statics in the propositions here, as can be seen by replacing h(1 �F (zp))(am + wm) by h(1 � F (zp))(am(1 � zp) + wm): Overlapping knoweldge could result from learning thattakes place on the job or because the process of learning involves learning the �easy�tasks �rst.
7

�� = maxzp[N (1� (apzp + wp)� h(1� F (zp)) (am + wm))]
[Figure 2 about here]
The following comparative statics follow immediately.
Proposition 1 Communication Centralizes; Information Access Decentralizes
1. A drop in communication (or �helping�) costs (h) reduces worker autonomy (zp) and has
an ambiguous impact on span of control s = N=nm (more questions are asked, but each
one takes less time).
2. A reduction in the cost of acquiring information of all agents (a = am = ap), or one
a¤ecting only lower level agents, ap, increases lower level autonomy (zp) and increases
managerial span of control, s (as less questions are asked).
The formal proof of the above is straightforward. Note �rst that f 0(z) < 0 implies that the
second order conditions for optimization is met, @2�=@z2p < 0. Then the �rst result follows from
the fact that @2�@zp@h
> 0 . Second, letting ap = am = a; we have that at the optimum (using the
�rst order conditions): @2�@zp@a
< 0. Similarly @2�@zp@ap
< 0; i.e. if workers can learn cheaper they
do more.: The changes in span follow straightforwardly from s = N=nm = 1= (h(1� F (zp))) :The intuition for these results is as follows. (1) Higher communication cost raises the
value of additional worker knowledge, since that economizes on communication. (2) Higher
information acquisition costs for all agents raise the value of asking questions for workers,
economizing on expensive information acquisition. Essentially, while communication cost re-
ductions facilitate the reliance of specialist problem solvers and decrease what each worker can
do, reductions in the cost of acquiring information make learning cheaper and reduce the need
to rely on specialized problem solvers for help with solutions.
2.2 Extension: Production and Non Production Decisions
Middle managers perform two broadly di¤erent functions. First, they are at the top of the
production hierarchies, dealing with the problems that production workers could not handle,
as outlined in the model above. Second, they also are at the bottom of a non-production
hierarchy, potentially dealing with managerial decisions on things like hiring/�ring, investment,
product introduction and marketing delegated to them by central head quarters. To study the
implications of the multiple roles played by middle managers, we extend the model in the
8

simplest possible way considering a multilayer hierarchy involving corporate managers, middle
managers (in our data, plant managers) and production workers.
In this extension, corporate head quarters and middle-managers deal with non-production
(management) decisions, x, while middle-managers and production workers deal with produc-
tion decisions, z:
Production Decisions: As above, each production worker confronts one production decision
per unit of time, z 2 [0; 1]. He can deal with a measure zp of these production decisions. Thatis, for those z > zp; he asks a middle manager for help. Decisions are distributed according
to cdf F (zp); with pdf f(zp): As previously, optimality (management by exception) implies
f 0(zp) < 0; so that production workers specialize in the more common tasks. A cost h is
incurred each time the middle manager must be involved in production. Production workers
can acquire knowledge at cost ap and middle managers at cost am: A �rm that must deal with
N production problems requires, as previously, h(1� F (zp))N = nm middle managers.
Non-Production Decisions: The existence of a hierarchy generates non-production decisions.
In particular, each middle manager generates a measure 1 of non-production decisions per unit
of time, where non-production decisions x 2 [0; 1]; are drawn from a density function g(x),
again with g0(x) < 0 implied by optimality. If the middle manager has the knowledge to deal
with these decisions, he does so instantaneously. If he does not, he passes on the problem to
corporate head quarters. Similarly to production workers, middle managers acquire knowledge
so that they can take a fraction xm of those decisions (they can solve those problems). Thus
if the problem drawn is x < xm; a middle manager solves it; if not, the corporate manager
intervenes. A helping cost h is incurred as before when top managers have to intervene, that is
helping each middle manager costs (1�G(xm))h units of corporate manager�s time.12 For anagent i to learn to take (all) of the non-production problems costs ai; a cost dependent on the
technology available to manager i; thus training middle managers to deal with non production
problems costs amxm; while, analogously to the production decision case, corporate managers
can deal with all (a unit measure) of non-production problems at a cost ac (c for corporate),
with ac ? am. A hierarchy with nm non-production problems where middle managers have
knowledge xm requires (1�G(xm))hnm = nc corporate managers.Thus the pro�ts of a hierarchy with production workers, middle managers and corporate
managers are given by:
12We assume communication or helping cost h is the same for production and non-production decisions forsimplicity since in our empirical application we cannot distinguish di¤erent communication costs. Conceivably,some technologies may a¤ect communication costs di¤erently for production and non-production, and thatwould have to be taken into account in the formulation.
9
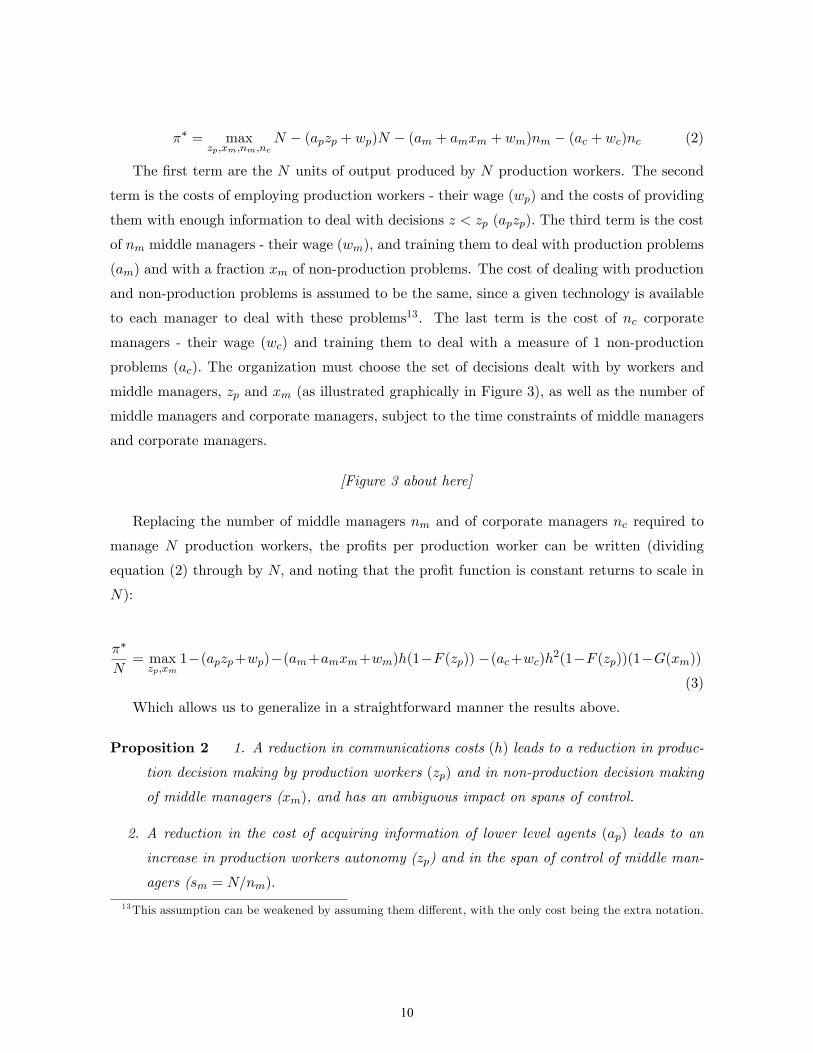
�� = maxzp;xm;nm;nc
N � (apzp + wp)N � (am + amxm + wm)nm � (ac + wc)nc (2)
The �rst term are the N units of output produced by N production workers. The second
term is the costs of employing production workers - their wage (wp) and the costs of providing
them with enough information to deal with decisions z < zp (apzp): The third term is the cost
of nm middle managers - their wage (wm), and training them to deal with production problems
(am) and with a fraction xm of non-production problems. The cost of dealing with production
and non-production problems is assumed to be the same, since a given technology is available
to each manager to deal with these problems13. The last term is the cost of nc corporate
managers - their wage (wc) and training them to deal with a measure of 1 non-production
problems (ac): The organization must choose the set of decisions dealt with by workers and
middle managers, zp and xm (as illustrated graphically in Figure 3); as well as the number of
middle managers and corporate managers, subject to the time constraints of middle managers
and corporate managers.
[Figure 3 about here]
Replacing the number of middle managers nm and of corporate managers nc required to
manage N production workers, the pro�ts per production worker can be written (dividing
equation (2) through by N; and noting that the pro�t function is constant returns to scale in
N):
��
N= maxzp;xm
1�(apzp+wp)�(am+amxm+wm)h(1�F (zp)) �(ac+wc)h2(1�F (zp))(1�G(xm))(3)
Which allows us to generalize in a straightforward manner the results above.
Proposition 2 1. A reduction in communications costs (h) leads to a reduction in produc-
tion decision making by production workers (zp) and in non-production decision making
of middle managers (xm), and has an ambiguous impact on spans of control.
2. A reduction in the cost of acquiring information of lower level agents (ap) leads to an
increase in production workers autonomy (zp) and in the span of control of middle man-
agers (sm = N=nm):
13This assumption can be weakened by assuming them di¤erent, with the only cost being the extra notation.
10

3. A reduction in the cost of acquiring information either by middle managers (am) or
by them and corporate managers (ac and am) increases autonomy of middle managers
in non-production decisions (xm); and the span of corporate managers (sc = nm=nc);
it reduces the autonomy of production workers (zp); and the span of control of middle
managers (sm):
We show these results formally in Appendix A.
In summary, the framework generates eight comparative static results for the direct impact
of the information cost and technology cost variables (ap; am; h) on the four organizational out-
comes (xm; zp; sm; sc) shown in propositions 1 and 2. We report tests of six of these predictions
for worker autonomy, plant manager autonomy and plant manager (xm; zp; sm) in the main
paper, as we have good measures of these organizational variables. We report results for the
remaining two predictions for CEO span (sc) in the Appendix because unlike plan manager
span we do not measure CEO span directly. From the theory there are also a further four
�cross�predictions of the indirect e¤ects of technology on organizational measures - such as
the impact of production information costs on plant manager autonomy. We also report tests
of these more subtle e¤ects in the Appendix.
3 Changes in Information and Communication Technology
The model suggests that two key aspects of information and communication technology mat-
ter: the cost of information access and the cost of communication. In this section we introduce
three technological changes that had impact on information and communication technology.
Concerning communication (or �helping�) technology, we focus on the introduction of intranets
(NETWORK). Concerning information access technology, we focus on the widespread adop-
tion of CAD=CAM technologies, and the introduction of large, real time, connected databases,
in the form most notably of �enterprise resource planning�(ERP ) systems. The reason we fo-
cus on these three technologies is that they are major advances in the manufacturing sector
that we study, as well as other sectors like retail, wholesale and banking.14 We also believe
they map clearly into reductions in communication costs (NETWORK) and reductions in
information acquisition costs for non-production decisions (ERP ) and production decisions
(CAD=CAM).
14This is based on reviewing the literature, US, UK, China and India factory visits and discussions withengineers and consultants at Sun Microsystems, EDS, HP, McKinsey and Accenture.
11

3.1 The Rise of Intranets: Facilitating Communication through the Orga-nization (h)
A �rst parameter that a¤ects the allocation of decisions in our model is communication costs.
An important shifter of these costs over last decade has been the introduction of corporate
intranets. These allow companies to connect all the plants to corporate head quarters, reducing
the cost of communication between head quarters and local managers. In the past, for exam-
ple, sharing documentation with head quarters required the use of fax or mail. These high
communication costs made speedy decisions from the centre head quarters extremely di¢ cult
and costly, leading to the delegation of day-to-day control of the plant to local management.
Once the leased-lines and corporate intranet are installed, the cost of communication between
local and central managers is reduced. This allows for the use of more experienced central
management to be swiftly alerted to signs of production problems - for example identifying
speci�c types of output variations as fault indicators - and able to provide swift decision mak-
ing support. Intranets also reduced the cost of communication inside the production plants,
facilitating the �ow of information between the shop �oor and the plant manager. These net-
work technologies are equally important in retail, wholesale and retail banking. Other general
communication technologies include cell phones and e-mail.
Given the model, we expect the rise of intranets, which reduces communication cost, to be
a centralizing technology, as it allows for �questions�to be more cheaply posed to the experts.
3.2 Computer Assisted Design and Manufacturing (CAD/CAM): Increas-ing Information Access at the Shop Floor (ap)
A second important parameter in our model is the change in information costs on the produc-
tion �oor. A crucial recent change in these costs has been the introduction of CAD/CAM.
New manufacturing orders generally require design, testing and redesign, typically by the
engineering department. In the past, the process traditionally started with the design being
provided by the supplier - for example an exhaust pipe for a new military vehicle - which the
engineers would mock-up and produce in a trial run. Once this was successful the engineers
would go to the manufacturing facility, e.g. the exhaust factory, to supervise a small scale pro-
duction run, and produce the �rst prototypes. The local manager would oversee this process,
working with the engineers to ensure his plant could implement the designs in-house, or have
these externally procured. These initial production runs would then be shown to the customer,
re�ned in a further design iteration, and �nally set-up for the full-scale production run by the
engineers. The introduction of CAD (computer aided design) allows the plant to directly de-
12

sign products, and CAM (computer automated manufacturing) enables the production team
to program up the Computer Numerical Control equipment to produce the key parts.15
In this way, CAD=CAM has increased the amount of information available to the produc-
tion team and enabled them to carry out the initial prototype design and production stage,
reducing the involvement of both the plant manager and the remotely based central head
quarters engineering team. Similar technologies in retail and banking, like customer databases
and relationship management tools, have empowered store-level employees to cross-sell other
products like insurance and credit (e.g. Hunter et al, 2001).
Given the theory described above, we expect CAD=CAM to be a decentralizing technology :
since workers have access to more/better information, they can make more decisions themselves
without consulting their superiors.
3.3 Connected Real Time Data Bases: Increasing Managerial InformationAccess (am; ac)
The cost of access to information by local plant manager (am) and central (ac) managers
has been directly a¤ected by the installation in �rms of Enterprise Resource Planning (ERP )
systems. ERP is the generic name for software systems that integrate several data sources
and processes of an organization into a uni�ed system. These applications are used to store,
retrieve and share information on any aspect of the production and sales process in real time.
This includes standard metrics like production, waste, deliveries, machine failures, orders and
stocks, but also broader metrics on human resource and a range of �nancial variables. An
ERP system is based on a common database and a modular software design. The main
sellers of ERP are SAP and Oracle, both used by more than half of large US business. The
introduction of ERP systems is typically the largest investment in information technology in
manufacturing related business: in 2006, ERP was estimated to represent just under one
third of all application IT spend in large US companies.16
To understand the impact of ERP consider again the example for an exhaust factory. After
the introduction of SAP 5.0, such a production plant would have all its data collected and
stored in one uni�ed computing system, allowing the plant manager (and all other managers)
to easily access and compare data across a range of processes. For example, if a �lter supplier
were to shut-down due to a �re, the plant manager could use his ERP system to generate
15Traditionally these would be used to drive numerically controlled programming tools (see for example, thedescription of their use in the valve industry in Bartel et al, 2007).16These estimates are from Shepard and Klein, (2006) who conducted 175 interviews with IT managers in
U.S. based companies with 1,000 or more employees. ERP systems are also increasingly common in larger �rmsin developing countries, see for example Bloom et al. (2010).
13

an on-line inventory of current �lter stocks, a read-out of work-in-progress, and customer
orders outstanding, to evaluate which customer orders were most at risk from shortages. This
would enable him to re-schedule �lter stocks towards the most imminent customer orders,
and pause production of less imminent orders until alternative suppliers could be found. He
would also able to call-up a list of alternative �lters and their suppliers to source a replacement
supplier. Once the local manufacturing sites and the company head quarters are integrated
in the company-wide ERP system, plant managers and the central head quarters have a
full company-level overview of production, inventory, orders and �nance across the company.
Therefore, the development of ERP enables managers to access timely information at an
unprecedented rate, empowering plant managers to make decisions on a range of activities
including investment, hiring, pricing and product choice17.
Given the theory, we expect ERP to be a decentralizing technology: as all managers have
better access to information, lower level managers can make more decisions without consulting
their superiors. In the data section below we show that indeed, ERP increases information
access by managers.
To sum up, three important technological changes that have been observed:
� A reduction in the cost of communicating information, particularly as a result of the
growth in corporate intranets (NETWORK).
� An improvement in the access to information by production workers and shop �oorworkers as a result of CAD=CAM and customer databases
� An improvement in the access to information by all managers across the organization asa result of the introduction of ERP
We believe that these changes map directly to the theory. Table 1 considers the e¤ects of
reductions in communication and information costs on three organizational outcomes; plant
manager autonomy in column (1); workers� autonomy in column (2); and plant manager�s
span in column (3). Falling communication costs (proxied by NETWORK) have negative
e¤ects on autonomy and ambiguous e¤ects on spans (each worker does more but will ask
more question). Falling information acquisition costs for non-production decisions (proxied by
ERP ) are instead predicted to raise autonomy for plant managers. Finally, falls in information
acquisition costs for production decisions (proxied by CAD=CAM) are predicted to increase
both worker autonomy and plant manager�s span (they can manage more workers if these
17By improving the access of managers to local time information ERP also allows managers to make betterdecisions (see Davenport et al, 2002).
14

workers are making more of their own decisions). To reiterate, the intuition is as in the previous
section: Better information access pushes decisions down, as it allows for superior decentralized
decision making without an undue cognitive burden on those lower in the hierarchy. Better
communication pushes decisions up, as it allows employees to rely on those further up the
hierarchy to make decisions.
3.4 Alternative Theoretical Channels
We close this section with a brief discussion of alternative hypothesis through which ICTs
could a¤ect the allocation of decisions and span and how we might distinguish them from the
cognitive approach we emphasis in this paper.
3.4.1 Agency and Incentives
It is di¢ cult to have a general view of how technology a¤ects agency without being precise
about the channels. Speci�cally, would we expect delegation to increase or decrease as a
consequence of ICT improvements? The key characteristic that will a¤ect whether delegation
should increase or decrease is the extent to which technical changes facilitate monitoring inputs
or monitoring outputs. As Prendergast (2002) showed, a technology that results in better
measures of output will increase delegation, as incentives can be used to align decision making.
On the other hand, a technology that facilitates monitoring of inputs will reduce delegation.
Speci�c technologies, and speci�c instances of the technology, may have stronger impact on
inputs or on outputs. For example, Baker and Hubbard (2004) have argued that a speci�c
piece of ICT, the on-board computers used in trucks, decrease the cost of monitoring a trucker�s
level of care in driving (an input). As a result, these on-board computers induced an increase
in vertical integration (less incentives and delegation). The opposite prediction may be easily
the consequence of a particular type of ICT. This may be particularly the case for ERP , which
provides better information about agents�production decisions and so can facilitate delegation
with monetary incentives.
Absent a speci�c technology like on board computers, we believe that there may be multiple
channels through which the technologies that we examine may a¤ect incentive con�icts. Rather
than formulating a large range of hypothesis on incentives and decision making, we simply
note that if technology a¤ects output monitoring, it should also a¤ect delegation and incentive
payments. We can explicitly test whether this is driving our results by controlling in our
regressions for the impact of ICT on delegation holding incentives constant. We perform this
exercise in Table A6 by including measures of the importance of incentive pay, and we show
15

that our key results appear robust to this extension.
3.4.2 Automation
Autor, Levy and Murnane (2003) have argued that the key way ICT impacts the division of
labor is through �automation�. Essentially, their argument is that the routine tasks of both
low human capital workers (like assembly line workers) and higher human capital workers (like
bank clerks) have been replaced by computerization and do not have to be either learned or
undertaken by workers or managers. In a bank, for example, information technology allows for
automatic sorting of checks.
We can extend our model to deal with this type of mechanism. Speci�cally, suppose that
a worker is in charge of tasks z0; the machine is in charge of tasks m and the manager of tasks
1� z0�m: The impact of automation is to increase the number of tasks m undertaken by the
machine. Straightforward comparative statics show that the number of tasks undertaken by
a worker is reduced, as the machine does the more routine tasks. Thus a worker does z0 �mtasks compared to z0 tasks before, while the manager continues to do 1 � z0 tasks, therebyreducing the share of tasks carried out by worker. The reason is that the marginal value of
learning an additional task does not get increased by the machine doing the most routine task,
so z0 stays constant. The span of control remains unchanged as the number of tasks done by
the manager 1� z0 are unchanged.Our data allows testing of this channel since, if any of our ICT measures is having an impact
through automation, then this will reduce the number of tasks done by lower level agents,
reducing their autonomy. By contrast, our perspective predicts increases in the number of
tasks done by lower level agents in response to falls in information acquisition costs. Another
distinguishing feature of our theory is that we obtain speci�c predictions on the impact of
networks, which the automation perspective is largely silent on.
3.4.3 Coordination
One key aspect of ERP is that, in unifying multiple previously unrelated databases, it fa-
cilitates coordination between previously independently operated business units. In fact, by
creating a common language, ERP facilitates the substitution of �hierarchical� communica-
tion by �horizontal�or peer-to-peer communication, as Cremer, Garicano and Prat (2007) have
noted. As a result, if coordination across units is becoming easier and less hierarchical, we
could also expect (similarly to the e¤ect we predict in our theory) ERP to result in �empow-
erment,� as managers of previously existing business units coordinate with those of others
16

without going through central management. This could also complement changes in incentives
towards horizontal communication, as in an Alonso et al. (2008) type model.
The pure coordination story where the main impact of the information and communication
changes is to decrease coordination costs, however, will be easy to tell apart from ours. First,
coordination theories do not have implications for spans of control. In fact, if horizontal
communication increases, we will see an increase in the amount of coordination that takes
place, and that could lead to a bigger role for managers and a smaller span when ERP is
introduced (contrary to our hypothesis). Second, if the changes in communication costs also
act through the coordination channel, they should also result in decentralization, rather then
centralization.
In other words, the coordination perspective does not result in a sharp distinction between
information costs (ERP and CAD=CAM) and communication costs (NETWORK). Both
reduce coordination costs, and thus result in the same impact on decentralization (larger) and
on spans (ambiguous). The data will allow us to di¤erentiate this perspective from ours, since
we expect changes in information and communication costs to have di¤erent organizational
outcomes.
4 Data
We use a new international micro dataset combining novel sources from the US and several
European countries. Our two main sources of data are the Center for Economic Performance
(CEP) management and organization survey and the Harte-Hanks ICT panel. We also match
in information from various external data sources such as �rm-level accounting data, industry
and macro-economic data.
4.1 The CEP management and organization survey
4.1.1 Overview
In the summer of 2006 a team of 51 interviewers ran a management and organizational practices
survey from the CEP (at the London School of Economics) covering over 4,000 �rms across
Europe, the US and Asia. In this paper we use data on approximately 1,000 �rms from the
US, France, Germany, Italy, Poland, Portugal, Sweden and the UK for which we were able
to match the organization data with ICT data from an independent database. Appendix C
provides detailed information on our sources, but we summarize relevant details here.
The CEP survey uses the �double-blind� technique developed in Bloom and Van Reenen
(2007) to try and obtain unbiased accurate responses to the survey questions. One part of
17

this double-blind methodology is that managers were not told they were being scored in any
way during the telephone survey. The other part of the double blind methodology is that
the interviewers knew nothing about the performance of the �rm as they were not given any
information except the name of the company and a telephone number. Since these �rms are
medium sized, large household names are not included.
The survey is targeted at plant managers in �rms randomly drawn from the population of
all publicly listed and private �rms in the manufacturing sector with between 100 and 5,000
employees. We had a response rate of 45% which was uncorrelated with �rm pro�tability or
productivity. The interviews took an average of 45 minutes with the interviewers running an
average of 78 interviews each, over a median of 3 countries, allowing us to remove interviewer
�xed e¤ects. We also collected detailed information on the interview process, including the
interview duration, date, time of day, day of the week, and analyst-assessed reliability score,
plus information on the interviewees�tenure in the company, tenure in the post, seniority and
gender. We generally include these variables plus interviewer �xed-e¤ects as �noise-controls�to
help control for any potential measurement error.
4.1.2 Measuring Plant Manager Autonomy
As part of this survey we asked four questions on plant manager autonomy. First, we asked how
much capital investment a plant manager could undertake without prior authorization from the
central head quarters. This is a continuous variable enumerated in national currency (which
we convert into US dollars using Purchasing Power Parities). We also asked where decisions
were e¤ectively made in three other dimensions: (a) hiring a new full-time permanent shop�oor
employee, (b) the introduction of a new product and (c) sales and marketing decisions. These
more qualitative variables were scaled from a score of one, de�ned as all decisions taken at the
corporate head quarters, to a �ve, de�ned as complete power (�real authority�) of the plant
manager, and intermediate scores varying degrees of joint decision making. In Table A2 we
detail the individual questions (D1 to D4) and scoring grids in the same order as they appeared
in the survey.
Since the scaling may vary across all these questions, we converted the scores from the
four decentralization questions to z-scores by normalizing each score to have a mean of zero
and standard deviation one. In our main econometric speci�cations, we take the unweighted
average across all four z-scores as our primary measure of overall decentralization18. We also
experiment with other weighting schemes and we also show what happens when the questions
18The resulting decentralization variable is itself normalized to mean zero and standard deviation one.
18

are disaggregated into their component parts.
4.1.3 Measuring Worker Autonomy
During the survey we also asked two questions about worker autonomy over production deci-
sions regarding the pace of work and the allocation of production tasks. These questions were
taken directly from Bresnahan et al. (2002) and are reported in Table A2 (questions D6 and
D7). These questions are scaled on a one to �ve basis, with a one denoting managers have full
control, and a �ve denoting workers have full control over the pace of work and allocation of
tasks. Our measure of workers�autonomy is a dummy taking value one whenever decisions on
both pace of work and allocation of production tasks are mostly taken by workers (i.e. both
variables take values higher than three19). Again, we experiment with other functional forms.
4.1.4 Measuring Span of Control
We also asked about the plant manager�s span of control in terms of the number of people
he directly manages, as reported in Table A1 (question D8). The interviewers were explicitly
trained to probe the number of people that directly report to him rather than the total number
in the hierarchy below him. Unfortunately, we do not have such a direct measure of CHQ span
(since we did not interview the CEO). But we try to get a sense of senior management�s (CHQ)
span of control by asking about whether the �rm was single or multi-plant �rm, with the idea
being that multi-plant �rms lead to larger spans at senior management level.
4.2 Harte-Hanks�ICT Data
We use an plant level ICT panel produced by the information company Harte-Hanks (HH). HH
is a multinational �rm that collects detailed hardware and software information to sell to large
ICT �rms, like IBM and Cisco, to use for marketing. This exerts a strong market discipline
on the data quality, as major discrepancies in the data are likely to be rapidly picked up by
HH customers�. For this reason, HH conducts extensive internal random quality checks on its
own data, enabling them to ensure high levels of accuracy.
The HH data has been collected annually for over 160,000 plants across Europe since the
late-1990s. They target plants in �rms with 100 or more employees, obtaining a 37% response
rate. We use the data for the plants we were able to match to the �rms in the management
survey. Since this matching procedure sometimes leads to multiple plants sampled in HH per
�rm, we aggregate ICT plant level data to the �rm level, using employment weights. A number
19Decisions on pace of work are taken mostly by workers 11% of the times. Similarly, decisions on theallocation of production tasks, are taken moslty by workers 12% of the times.
19

of papers, such as Bresnahan et al (2002) and Brynjolfsson and Hitt (2003), have previously
used the US HH hardware data, but few papers have used the software data. And certainly
no one has combined the software data with information on organizational form in a single
country, let alone internationally as we do here.
The prior literature, which has focused on hardware, has typically used information on
�rms aggregate ICT capital stock covering PCs, servers and infrastructure. But since these
simultaneously reduce information and communication costs we do not expect a clear result.
Our approach consists instead in considering the presence of speci�c technologies within the
organization, namely: networks, to proxy for communication costs; Enterprise Resource Plan-
ning (ERP ), to capture the reduction in information access costs for non-production decisions;
and CAD=CAM to capture the reduction in information access costs for production decisions.
This is depicted in relation to the model in Figure 4.
[Figure 4 about here]
HH contains information on the presence of all of these software types in the plant.
� HH distinguishes up to 17 distinct types of ERPs: the market leader is SAP, but Or-
acle, IBM and many others all o¤er products in this space. HH tries to record only
ERP systems in operation (rather then those pending the go-live decision) which Aral,
Brynjolfsson and Wu (2009) highlight as important.
� HH de�nes under �workstation applications� the presence of CAD=CAM�s, software
tools that assist production workers, engineers and machinists.
� HH measures the presence of Leased Lines or Frame Relays (NETWORK), which aretechnologies used by businesses to connect o¢ ces or production sites20. We have, in
some years, direct information on Local Area Networks (LAN) and Wide Area Networks
(WAN) and �nd these to be both highly correlated with our NETWORK variable. In
the robustness tests we show the similarity of results when using this as an alternative
proxy for networks.
20A leased line is a symmetric telecommunications line connecting two locations. It is sometimes known as a�Private Circuit�or �Data Line�. Unlike traditional PSTN lines, a leased line does not have a telephone number,because each side of the line is permanently connected to the other. Leased lines can be used for telephone,data or Internet services. Frame relay is a data transmission technique used to send digital information (dataand voice) cheaply quickly, and is often used in local and wide area networks. These systems are predominantlyused to manage internal communication systems. They are not speci�cally about production or non-productiondecisions, but a¤ects communication through out the �rm.
20

The presence of any of these technologies at the plant level is codi�ed using binary variables,
and plant level employment weights are used to generate �rm level indicators21. In terms of
other technologies we condition on computers per worker, but note its theoretical ambiguity.
4.2.1 Does ERPmainly lower information costs rather than communication costs?
We have argued in Section 2 that ERP reduces information costs much more than communi-
cation costs, but this may be contentious. To investigate this issue in more detail, we collected
data in a survey of IT managers on ERP usage in 431 �rms with 100 to 5000 employees (details
in Appendix B). Brie�y, we asked managers speci�cally what was the impact of ERP in their
companies with regards to information and communication. Following the theory, we asked
them whether ERP was �used to endow top management with more and better information�
and respondents could answer on a Likert scale of 1 = �strongly disagree� to 5 = �strongly
agree�. About three quarters of respondents said that ERP was �likely�or \very likely� to
increase information �ows (see Q1 in Figure 5 ). We also asked whether �ERP is used for
faster communication of information and directives from top management to other employees�
(again from 1 = strongly disagree to 5 = strongly agree). Only about a third of respondents
answered that ERP was �likely�or \very likely�to increase this form of communication (see
Panel Q2 in Figure 5 ). Using the cardinal scale, the mean of the information acquisition
answer was 3.8, whereas the mean of the communication answer was 2.8 with the di¤erence
signi�cant at the 1% level. A similar pattern is evident when respondents where asked about
information acquisition vs. communication for middle managers (see Panels Q3 and Q4 in
Figure 5). Appendix B has some further analysis, but this empirical evidence corroborates our
discussions with technology experts that ERP is primarily related to information acquisition
rather than communication.
[Figure 5 about here]
4.3 Other Data
In addition to the organization variable, the CEP survey also provides a wide variety of other
variables such as human capital, demographics and management practices. Also, since the
CEP survey used accounting databases as our sampling frames from BVD (Amadeus in Europe
and ICARUS in the US), we have the usual accounting information for most �rms, such as
employment, sales, industry, location, etc.
21The resulting variables have mass points at zero or one.We present robustness tests using just the discreteversions of these technology indicators.
21

Table 2 contains some descriptive statistics of the data we use. In the largest sample we
have 949 plants with median employment of 252 employees (153 at the median).
5 Empirical Results
5.1 Econometric Model
We wish to estimate the following generic equation:
Oijk = �aijk + �hijk + x0ijk + uijk (4)
where the dependent variable is Oijk which denotes the organizational form of �rm i in industry
j in country k. Our theory o¤ers predictions over four types of organizational outcomes for
which we have data: the autonomy of the worker (O = AW), the autonomy of the plant
manager (O = AP), the span of control of the plant manager (O = SP) and the span of control
of the CHQ (O = SC). As in the theory, a denotes information access costs and h denotes
communication (helping) costs. The xijk denote other control variables and uijk is a stochastic
error term - we will discuss these in more detail later.
As discussed in the data section, we have direct measures of workers�autonomy, managers�
autonomy and managers�span of control from our survey. The management autonomy ques-
tions investigate the extent of �non-production� autonomy the plant manager has from the
central head quarters (e.g. how much investment could be made without central head quarters
approval). The worker autonomy questions relate to decisions the worker could have control
over compared to the plant manager (e.g. setting the pace of work).
The information costs and communication costs facing the �rm are not directly observ-
able, but we substitute in the relevant indicator from HH (NETWORK lowers h; ERP and
CAD=CAM lower a). To be more explicit the three regressions we will estimate are:
Autonomy of the plant managers
APijk = �APERPijk + �
APNETWORKijk + x0ijk
AP + uAPijk (5)
Autonomy of the worker
AWijk = �AW (CAD=CAM)ijk + �
AWijk NETWORKijk + x
0ijk
AW + uAWijk (6)
Span of control of the plant manager
ln(SPijk) = �SP (CAD=CAM)ijk + �
SPijkNETWORKijk + x
0ijk
SP + uSPijk (7)
22

Recall that Table 1 contains the main theoretical predictions of the model that we have
sketched together with the technologies we are using. Falls in information costs are associated
with greater plant manager autonomy and workers� autonomy, and larger spans of control.
By contrast, falls in communication costs are associated with decreases in autonomy and
ambiguous e¤ects on spans.
We have a rich set of controls to draw on (xijk), although we are careful about conditioning
on factors that are also directly in�uenced by technology. Consequently we consider speci�-
cations with very basic controls as well as those with a more extensive vector of covariates.
Since there is measurement error in the organizational variables we generally condition on
�noise controls�that include interviewer �xed e¤ects and interviewee controls (e.g. tenure of
manager) and interview controls (e.g. time of day). Other controls include a full set of three
digit industry and country dummies, plant age, skills (share of college educated workers), �rm
and plant size and multinational status. We also perform robustness checks with many other
variables suggested in the literature which may potentially confound our key results.
5.2 Basic Results
Tables 3 through 5 present the main results, each table has a di¤erent dependent variable
and corresponds to equations (5) to (7). Table 3 contains the empirical results for plant
managers�autonomy. All columns control for size (through employment of the �rm and the
plant), multinational status (foreign multinational or domestic multinational with the base as
a purely domestic �rm), whether the CEO is located on the same site as the plant manager22,
�noise� controls as discussed in the data section and a full set of country and three digit
industry dummies. Column (1) uses the presence of Enterprise Resource Planning (ERP ) as a
measure of information acquisition over non-production decisions. As the theory predicts, ERP
is associated with more autonomy of plant managers (relative to the central head quarters)
as the plant manager is allowed greater �exibility in making decisions over investment, hiring,
marketing and product introduction23. In our model this is because ERP enables him to
access information more easily and solve more problems without referring them upwards. In
terms of the other covariates we �nd that larger and more complex enterprises (as indicated
by size and multinational status) are more likely to decentralize decision-making to the plant
22All results are robust to dropping size, multinational and ceo on site controls (results available upon re-quests). Note that �rms where the CEO was the same individual as the plant manager are dropped.23We investigate the endogeneity of the technology variables in depth in Table 6. One inital check on whether
the OLS results are upwards biased is to implement a propensity score matching technique. We found thatmatching strengthened the results. For example in the speci�cation of column (2) of Table 6, the AverageTreatment e¤ect on the Treated was 0.299 with a standard error of 0.101. This used nearest neighbors matchingwith three neighbors.
23

manager. Column (2) includes �rm level skills, as measured by the proportion of employees
with college degrees. The variable takes a positive and signi�cant coe¢ cient, indicating that
more skilled workplaces tend to be more decentralized (consistent with Caroli and Van Reenen,
2001). This column also includes the computers intensity of plant which enters with a negative
and insigni�cant sign. The ambiguity of the IT hardware variable should not be surprising as
greater computer intensity simultaneously lowers information costs and communication costs
which, according to our theoretical model, have opposite e¤ects on autonomy.
The third column of Table 3 includes an indicator for the presence of networks, which
indicates lower communication costs. As the theory predicts, there is a negative coe¢ cient
on the network variable (signi�cant at the 5% level) which may re�ect the fact that lower
communication costs imply that central head quarters make more decisions than the plant
manager as it is now easier to pass on solutions. This result is robust to including skills
and computer intensity in column (4). Columns (5) and (6) includes both information and
communications technologies at the same time. Since these are positively correlated, the results
are a little stronger24. Table 3 is consistent with the theoretical model sketched earlier: falling
information costs are associated with decentralization, whereas falling communication costs
are associated with centralization.
The next two tables analyze the relationship between information and communication
technologies with workers�autonomy and plant manager span of control (this follows exactly
the order outlined in Table 2). Table 4 is a probit model of workers� autonomy where our
indicator of information acquisition over production decisions is CAD=CAM . In columns
(1) and (2), the coe¢ cient on CAD=CAM is positive and signi�cant, indicating that such
technologies are associated with worker empowerment. In columns (3) and (4), by contrast, the
presence of networks has a negative coe¢ cient which is consistent with the theoretical notion
that greater communication leads to centralization. Although the coe¢ cient on NETWORK
is correctly signed, it is insigni�cant even when both technologies are included simultaneously
(in the �nal two columns).
Table 5 examines the plant manager�s span of control as measured by the number of em-
ployees who directly report to him. CAD=CAM is associated with signi�cantly greater plant
manager span, consistent with the idea that production technologies that help worker infor-
mation access enable them to do more tasks which makes it possible for the plant manager to
oversee more production workers (greater span). The coe¢ cient on NETWORK is positive
24The results are robust to clustering at a higher level, such as by industry country cell. For example, in the�nal column the coe¢ cients(standard errors) are 0.116(0.050) and 0.110(0.053).
24

and insigni�cant (the theory does not have an unambiguous prediction for this coe¢ cient).
Comparing the empirical results with our expectations in Table 1, we obtain a reason-
ably close match. All the coe¢ cients are in the same direction as the theoretical predictions
(when they are unambiguous) and all are signi�cant at the 5% level (with the exception of
NETWORK in the worker autonomy equation). The idea that information technologies are
associated with increased autonomy and span of control, whereas communications technologies
are associated with decreased autonomy appears to have some empirical content. By contrast,
the automation story would predict information technologies should be associated with cen-
tralization away from lower level employees and the coordination theories would predict that
communication technologies should be associated with decentralization (see sub-section 3.3.).
Thus, we interpret our evidence on ICT and �rm organization as providing some support for
the cognitive view of hierarchies in section 2.
5.3 Magnitudes
Although the estimates are statistically signi�cant and broadly consistent with our theory, are
they of economic signi�cance? One way of examining this question is to simulate an increase in
the di¤usion of our ICT indicators. Given the debate over whether the increasing productivity
gap between Europe and the US in the decade since 1995 was related to ICT (e.g. Bloom,
Sadun and Van Reenen, 2007), we simulate increasing the ICT di¤usion measures by 60% (the
di¤erence in the average level of the ICT capital stock per hour worked between the EU and
the US during 2000-2004)25.
An increase in the penetration rate of ERP of 60% over the sample average of 36% is
22 percentage points. Using the �nal column of Table 3, this is associated with a 0.025 of
a standard deviation increase in plant manager autonomy. This is equivalent in e¤ect to an
increase in the proportion of college graduates by 26% (using the coe¢ cient on education),
which is broadly the increase in education achieved by the US between 1990 and 2000 of about
a quarter26. So we regard this as a substantial e¤ect. Similar calculations show that increasing
the penetration of NETWORK by 60% (21 percentage points at the mean) is associated with
a decrease in plant manger�s autonomy by 0.023 standard deviations, equivalent to reducing
the college share by 24%. This increase in NETWORK is associated with an increase in
plant manager�s span of 1.1% (equivalent to a 19% increase in the college share) and with
25This is based on the EU KLEMS data. See Timmer, Yppa and Van Ark (2003) Table 5 for a similar �gurefor 2001 and a description of the data.26 In 1990 25.7% of American workers had college degrees or equivalent and this rose to 31.8% by 2004, an
increase of 6.1 percentage points or 23.7% (Machin and Van Reenen, 2008).
25

a reduction in worker autonomy of -0.005 standard deviations (equivalent to a 10.3% fall in
the college share)27. So the �e¤ect�of falling communication costs (NETWORK ) appears
somewhat greater for plant manager autonomy than for worker autonomy, with span of control
in the middle. Finally, consider a 60% increase in CAD=CAM . This is associated with 0.2%
increase in plant manager�s span (equivalent to a 3.7% increase in the college share) and a
0.1% increase in worker autonomy (equivalent to a 1.6% increase in the college share). This is
lower because the mean of CAD=CAM is lower than the other technologies.
This implies that these technical changes appear very important for some aspects of organi-
zation (benchmarked against equivalent increases in skills), especially ERP on plant manager�s
autonomy and NETWORK on all three organizational dimensions.
5.4 Endogeneity and Robustness
5.4.1 Endogeneity
Tables 3 through 5 present conditional correlations that seemed to be broadly consistent with
the theory. The theoretical model suggests that the endogenous outcomes should covary in
systematic ways in equilibrium which is what we examine in the data. We are of course con-
cerned about endogeneity bias as there may be some unobservable that is correlated with the
organizational outcomes and our measures of information and communication costs (especially
as these are all measured at the �rm level). We take some reassurance in the fact that although
these ICT indicators are positively correlated in the data28, their predicted e¤ects on the same
organizational variable can take opposite signs. For example, in the plant manager autonomy
equation the coe¢ cient on information acquisition technologies (proxied by ERP ) is oppo-
site in sign to communication technologies (NETWORK) both theoretically and empirically.
For endogeneity to generate these results, the hypothetical unobservable positively correlated
with decentralization would have to mimic this pattern of having a negative covariance with
NETWORK and a positive covariance with ERP . This is always a theoretical possibility,
but it is not obvious what would generate this bias.
In this sub-section we consider instrumental variable strategies for ERP andNETWORK29.
SAP is the market leader in ERP and was founded by �ve IBM engineers who formed their
start-up in Walldorf, a suburb of the German city of Heidelberg in 1972 (Hagiu et al, 2007).
SAP�s Headquarters remains in Walldorf. Studies of di¤usion suggest that geography plays an
27These calculations use the coe¢ cients in the �nal columns in Tables 4 and 5.28For example, the pairwise correlation between the ERP and the NETWORK variables is 0.168, signi�cant
at the 1% level.29We do not have an obvious instrumental variable for CAD=CAM , so we can only re-estimate Table 3 using
this alternative identi�cation strategy.
26

important role because when there is uncertainty and tacit knowledge, being geographically
close to the innovator plays a role in the adoption of the new technology. Studies of the dif-
fusion of ERP (e.g. Armbruster et al, 2005) suggest that �rms closer to SAP�s headquarters
were more likely to be early adopters. Since our �rms are medium sized enterprises who could
also learn from these earlier adopters (ERP is more common among very large enterprises), we
use the closeness to Walldorf as an exogenous factor that shifts the probability of adopting an
ERP . We focus on Continental Europe as the US and UK are separated by sea from Germany,
and drop subsidiaries of multinational �rms as it is harder to pinpoint the appropriate distance
measure for such global �rms.
We regress the presence of ERP in the plant on the ln(distance in kilometers) to Walldorf
in Column (1) of Table 6. Consistent with our priors, a �rm twice as far as another from
Walldorf is over 20% less likely to adopt an ERP system. When entered instead of ERP
in the plant manager autonomy equation (the �reduced form�of column (2)), the coe¢ cient
on distance is again negative and signi�cant. Column (3) presents the instrumental variable
results, showing that ERP has a large and positive causal e¤ect on decentralization30.
In the sample of Table 6 there are 45% of �rms with ERP , of whom 30% use SAP and
70% use a variety of other ERP o¤ered by vendors like Oracle, Sage and Microsoft. Since
our instrumental variable should be most powerful for SAP we repeated the speci�cations of
columns (1)-(3) replacing ERP with a dummy for the presence of SAP�s ERP only. The
results are much stronger: the �rst stage coe¢ cient (standard error) was -0.211(0.062) and
the second stage coe¢ cient (standard error) was 1.948(0.675). In fact, the instrument has
no power at all for predicting non-SAP ERP systems. Given the distance to Walldorf only
predicts the adoption of SAP ERP and not other makes of ERP this suggests it re�ects some
SAP e¤ect rather than some other unobservable favorable to ERP adoption.
We consider an alternative approach to identifying the e¤ects of networks. The cost of
electronically communicating over networks di¤ers substantially between countries because of
di¤erential degrees of the roll-out of high speed bandwidth and the pricing of telecommuni-
cations. Although there have been moves to liberalize the telecommunication sector in most
countries, this has happened at very di¤erent speeds and in some countries the incumbent state
run (or formerly state run) monopolists retain considerable pricing power (e.g. Nicoletti and
Scarpetta, 2003; Azmat et al, 2008; OECD, 2005, 2007). We discuss these more in Appendix
C.30We experimented with including all the multinational subsidiaries in the regression (473 �rms). As expected
the �rst stage was weaker with a coe¢ cient (standard error) on distance of -0.098(0.053). Nevertheless, thesecond stage remained weakly signi�cant with a coe¢ cient (standard error) on ln(distance) of 1.745(0.885).
27

We exploit these di¤erential costs using OECD (2007) series on the prices of leased lines
used for networks (call this price pck), which represent the cost of an annual subscription to a
leased line contract at 2006 PPP US$. An obvious empirical problem is that these measured
telecommunication price indices only vary across countries31 and not within countries, so they
are collinear with the country dummies. Industries will be di¤erentially a¤ected by these
costs, however, depending on the degree to which they are reliant on networks for exogenous
technological reasons. We proxy this reliance by using the intensity of network use in the
industry pooling the data across all countries (NETWORKj).32 The instrument is de�ned
as pck �NETWORKj where we include a full set of industry and country dummies, so we areessentially using pck � NETWORKj as a direct proxy for communication costs, h, with theprediction that for the network-intensive industries we would expect to see more managerial
autonomy in countries where communication prices are high (like Poland) than where they are
low (like Sweden).
The results for this experiment are presented in columns (4)-(6) of Table 6. High telecom-
munications costs signi�cantly reduce the probability of having a network. When this is entered
in the reduced form in column (5), the variable enters with the expected positive sign: less
networks imply more decentralization33. In column (6), the second stage coe¢ cient is large,
negative and signi�cant as predicted by the theory34.
The �nal four columns of Table 6 use both instruments together. The �rst stages are
presented in columns (7) and (8). The reduced form in column (9) shows the expected signs
for both instruments: distance from SAP�s birthplace reduces decentralization, whereas com-
munication costs increase decentralization. Using these variables as instruments in the �nal
column shows the theoretically expected results we saw from the OLS tables: ERP causes
more decentralization and NETWORK less decentralization35. Note that the magnitude of
the e¤ects is much larger than in the simple OLS speci�cations. This could be due to correct-
31This is only partially true as there is some within country variation. For example, the roll-out of broadbandproceeds at a di¤erent rate across areas (see Stephenson, 2006).32This identi�cation strategy parallels Rajan and Zingales (1998) We also considered speci�cations where we
used network intensive industries de�ned on US data only and dropped the US from the sample we estimatedon. This generated similar results.33We also ran these regressions on the larger sample that includes the US and UK and multinationals (982
�rms) with similar results. For example, in an equivalent speci�cation of the reduced for column (5) thecoe¢ cient (standard error) on the instrument was 4.643(2.112) in this larger sample.34A concern is that the country-level network price variable simply proxies some other variable so we also
included country-level schooling and GDP per person interactions with industry network use. These were bothinsigini�cant with coe¢ cients (standard errors) of -3.805(12.060) and -9.307(7.927) respectively.35The results are robust to including various other regional controls. For example, we included regional
ln(GDP per head) and population density in the �nal column of Table 6. The coe¢ cient (standard error) onERP and NETWORK were 2.029 (0.869) and -3.011(1.483) respectively.
28

ing attenuation bias and reverse causality - for example, plants which are for some exogenous
reason more decentralized may �nd it di¢ cult to coordinate on introducing an ERP system
which will require some consolidation of databases. Furthermore, the OLS estimates are also
slightly larger on this sub-sample of domestic �rms36. Whatever the exact reasons for the lower
OLS estimates compared to the IV coe¢ cients, taking Table 6 as a whole suggests that the
e¤ects we identify are causal impacts of technology on organizational form, rather than simply
re�ecting an endogeneity problem.
5.4.2 Robustness
We have examined a large variety of robustness tests and some of these are presented in Table
7. Each panel presents a di¤erent dependent variable with di¤erent tests in each column (Panel
A for plant manager autonomy, Panel B for worker autonomy and Panel C for plant manager
span of control ). Column (1) simply repeats the baseline speci�cations from the �nal column
in Tables 3 through 5.
In Bloom, Sadun and Van Reenen (2009) we found that product market competition and
cultural factors such as trust and non-hierarchical religions were associated with greater plant
manager autonomy. We control for these in column (2) by including a full set of regional
dummies and the industry-level Lerner Index of competition. None of the main results change,
with the exception ofNETWORK in the worker autonomy equation. The sign is still negative,
which is consistent with the theory (falls in communication cost lower autonomy) but it is now
larger in absolute magnitude and signi�cant at the 10% level, whereas it was insigni�cant
in the baseline regression. Column (3) includes a variety of additional �rm level controls:
the capital-labor ratio, sales per employee, total employment in the group where the �rm
belongs (i.e. consolidated worldwide employment for multinationals), �rm age and a listing
dummy. The results are robust to these additional controls (which were individually and jointly
insigni�cant). Column (4) uses an alternative indicator of networks based on the presence of
LAN (Local Area Networks) or WAN (Wide Area Networks)37. The LAN/WAN indicator
is highly correlated with NETWORK and the results are very similar to the baseline. The
only di¤erence is that, again, NETWORK in the worker autonomy equation which is now
signi�cant (at the 5% level) with a theory consistent negative sign. Note that our ICT variables
from HH are averaged over all the plants in the �rm using plant employment as weights.
36The OLS equivalent of column (10) has a coe¢ cient of 0.151 on ERP and -0.220 on NETWORK. Theequivalent coe¢ cients from column (6) of Table 3 are 0.116 and -0.110 respectively.37We prefer our indicator of NETWORK as LAN was included only in earlier years of the Harte-Hanks data
and WAN only in later years.
29

Although these are usually either one or zero, in-between values are also possible. We consider
a discrete alternative where all the �rms with non-zero values of ICT are coded as unity and
present these results in column (5). Again, nothing much changes, nor does including the
Bloom and Van Reenen (2007) measure of management quality in column (6). Column (7)
considers alternative ways of constructing the dependent variable. For the plant manager
autonomy equation we use the principal component of the four questions and for the worker
autonomy question we de�ne it based only on the pace of work38. The results again seem robust
to these alternatives. Column (8) drops the size controls as they are potentially endogenous
and column (9) conditions on the sub-sample with at least three �rms per industry. Neither
experiment has much e¤ect on the results.
5.5 Extensions
Finally, we investigate a further set of extensions and tests of the theory.
5.5.1 �Cross�E¤ects of Technologies
We start by considering some of the �cross�e¤ects of technologies by saturating the empirical
models with all three types of technologies. Table A3 in the Appendix presents the full set
of predictions from the theory analogously to Table 1. We present the most general speci�-
cations for each of the three main organizational variables in Appendix Table A4. The �rst
thing to note is that none of the earlier conclusions change with respect to the earlier tests:
NETWORK are associated with less autonomy, ERP is associated with more autonomy for
managers and CAD=CAM is associated with more autonomy for workers and a larger span
of control. In terms of the additional tests, the �rst row of Table A4 includes CAD=CAM
in the plant managers�autonomy equation. This is insigni�cant, in line with the theoretical
prediction of a zero e¤ect. The last row includes ERP in the workers�autonomy equation,
which is negative (as theory predicts), but insigni�cant. The last row also includes ERP in
the span of control regression, which takes a positive coe¢ cient. This is the only place we
obtain a sign which is contrary to the theory as it should be negative. We do not regard this
as undermining our general set-up, however, as the coe¢ cient is insigni�cant. The robustness
of the earlier results to these �cross e¤ects� is reassuring, but the insigni�cance of the extra
terms does imply that it is di¢ cult to pick up some of the more subtle cross e¤ects of ICTs on
�rm organization.
38The results are also robust to constructing the plant manager autonomy variable focusing solely on questionscoded between 1 and 5, i.e. excluding the question on how much capital investment a plant manager couldundertake without prior authorization from CHQ.
30

5.5.2 Corporate Head Quarters�Span of Control
Table A3 showed that the theory also generates predictions for the span of control of the CHQ.
Although we had a direct measure of the plant managers�span (number of direct reports) we
do not have such a direct measure for the CHQ span. One proxy measure for this, however, is
the number of plants in the �rm, with more plants indicating a larger CHQ span. Because this
variable is likely measured with error we simply consider a dummy for a multiplant �rm as a
measure of the CHQ span and regress this on information acquisition technology for the Plant
Manager (ERP ) and NETWORK in Appendix Table A5. The clear theoretical prediction is
that ERP should be associated with a wider CHQ span because plant managers are able to
make decisions more easily so CHQ �nds it easier to manage a larger number of them. This
is supported by Table A5: ERP has a signi�cant and positive association with CHQ span of
control in column (1) where we condition on the standard controls and column (3) where we
also condition on NETWORK39. The coe¢ cient on NETWORK is positive and signi�cant
(it has a theoretically ambiguous sign).
5.5.3 An alternative mechanism: Incentives
At the end of the theory section we discussed alternative mechanisms, such as agency and
incentives, through which ICT could a¤ect organizational structure. We argued that the
cognitive approach we take here is �rst order, although they may still be important. One
simple way to investigate this is to explicitly condition on incentive pay in the regressions.
From the survey we know the proportion of managerial pay that was in bonus (direct incentive
pay) and the increase in pay upon promotion (a career concerns mechanism).
Columns (1) through (3) of Table A6 include a variable indicating the proportion of the
plant manager�s pay that was bonus (rather than �at salary)40. Columns (4) through (6)
includes the proportionate increase in pay when promoted for a typical plant manager. It is
clear that the signs and signi�cance of the technology variables are hardly a¤ected by this
additional variable. For example, in column (1) the incentive pay variable is positively and
signi�cantly associated with greater autonomy of the plant manager. This seems sensible -
there is little point in having performance related pay if the manager has no discretion over
relevant decisions. Nevertheless, the coe¢ cient on ERP has fallen only to 0.115 (from 0.116 in
Table 3) and the coe¢ cient on NETWORK to -0.110 (unchanged from Table 3). The other
incentive pay proxies are insigni�cant and do not change the qualitative results. Obviously this
39 If we also include CAD=CAM the ERP coe¢ cient remains positive and signi�cant. The theory predicts azero e¤ect of CAD=CAM which indeed has an insigni�cant coe¢ cient (-0.389 with a standard error of 0.432).40See Lemieux, MacLeod and Parent (2007) for how performance pay has grown in importance over time.
31

is a crude test as there are other dimensions of incentive pay we have not captured (e.g. for
production workers) and some incentive e¤ects may operate independently of any remuneration
scheme. But the robustness of our results to explicit controls for incentives suggest that there
is an important role for the cognitive theory we emphasis when looking at the impact of ICT.
6 Conclusions
The empirical and theoretical literature that examines the economic e¤ects of information and
communication technologies (ICT) generally aggregates together the information technology
(IT) and communication technology (CT) into a single homogeneous mass. We argue that
this is inappropriate because the impact of IT and CT on the organization of �rms, and
ultimately income inequality, will be quite di¤erent depending on the type of technology. Falls
in communication costs will tend to reduce employee autonomy, as decisions will be passed up
to the centre of the �rm. Falls in information acquisition costs will have the opposite e¤ect,
facilitating more e¤ective employee decision-making.
We show these e¤ects formally in a �cognitive�model of �rm organization which considers
two types of decisions within �rms. First, we consider non-production decisions (investment,
hiring, new products and pricing). These decisions can either be taken by the CEO at central
head quarters or by the plant manager in the local business unit. The key piece of information
technology that has a¤ected these decisions is Enterprise Resource Planning. ERP provides
a range of data on metrics like production, waste, energy use, sales, inventories and human
resources. Modern ERP systems increase dramatically the availability of information to man-
agers, which should (according to our theory) be associated with decentralization of decision
making.
Second, we consider factory �oor decisions, on the allocation and pace of production tasks.
These production decisions can either be taken by factory �oor employees or by their superiors
in the plant hierarchy, like the plant managers. Here, a key technological change has taken the
adoption of Computer Assisted Design and Computer Assisted Manufacturing (CAD=CAM).
A worker with access to those technologies can solve design and production problems better,
and thus needs less access to his superiors in making decisions. This should lead to the
decentralization of non-production decisions.
Of course both production and non-production decisions will also be impacted by reducing
communication costs. The key technological innovation in within-�rm communications is the
growth of networks. The spread of networks should therefore be associated with centralization
of both types of decisions within the �rm, as decision making is more easily passed up the �rm
32

to higher level managers.
We con�rm these predictions on a new dataset that combines plant-level measures of organi-
zation and ICT hardware and software adoption across the US and Europe. The organizational
questions were collected as part our large international management survey, and were explicitly
targeted at the theories we investigate.
In terms of identi�cation, we mainly focus on simple conditional correlations between the
di¤erent ICT measures and the multiple dimensions of the organization of the �rm, guided
by our theoretical predictions. But we also show that treating technology as endogenous
strengthen the results. Our instrumental variables are distance from the birthplace of the
market leading ERP system (SAP) and the di¤erential regulation of the telecommunication
industry across countries (which generates exogenous di¤erences in the e¤ective prices of net-
works).
There are several directions we are currently pursuing in this line of research. Firstly,
we are examining in more detail the reasons for di¤erential adoptions of technologies across
�rms and countries as the instruments suggest important factors that could explain the di¤u-
sion of communication and information technologies. This is of interest in itself, but is also
important in order to get more closely at the causal e¤ects of changes in ICT on �rm organi-
zation. Secondly, we are developing the theory to consider interactions between di¤erent type
of production and non-production technologies at other layers of the hierarchy. Finally, we are
examining the e¤ect of di¤erential type of IT adoption on other outcomes such as productivity
and wage inequality at the level of the industry and economy.
References
[1] Acemoglu Daron, Philippe Aghion, Claire Lelarge, John Van Reenen, and Fabrizio Zili-botti (2006) �Technology, Information and the Decentralization of the Firm�QuarterlyJournal of Economics, 122 (4), 1759�1799
[2] Aghion, Philippe, and Tirole, Jean (1997), �Formal and Real Authority in Organizations,�Journal of Political Economy, 105, 1-29.
[3] Alonso, Ricardo, Dessein, Wouter and Matouschek, Niko �When Does Coordination Re-quire Centralization�(2008) American Economic Review, 98(1), 145-179.
[4] Aral, Sinan, Brynjolfsson, Erik and Wu, Lynn (2009),�Testing three-way complementari-ties: performance pay, monitoring and information technology�, ICIS proceedings.
[5] Armbruster, Heidi, Kinkel, Ste¤an, Lay, Gunter and Maloca, Someka (2005) �Techno-organizational innovation in the European manufacturing industry�European Manufac-turing Survey Bulletin, 1, 1-16
33

[6] Aubert, Patrick, Caroli, Eve, and Roger, Muriel (2006), �New Technologies, WorkplaceOrganization and the Structure of the Workforce: Firm-Level Evidence,�Economic Jour-nal, 116, 73-93.
[7] Autor, David, Lavy, Frank and Murnane, Richard (2003) �The Skill Content of Re-cent Technological Change: An Empirical Exploration�Quarterly Journal of Economics,118(4), 1279-1334
[8] Azmat, Ghazala, Manning, Alan, and Van Reenen, John (2008), �Privatization, EntryRegulation and the Decline of Labour�s Share of GDP: A Cross-Country Analysis of theNetwork Industries�, Centre for Economic Performance Discussion Paper No. 806
[9] Baker, George, Gibbons, Robert, and Murphy, Kevin (1999), �Informal Authority inOrganizations,�Journal of Law, Economics, and Organization, 15, 56-73.
[10] Baker, George, and Hubbard, Thomas (2003), �Make Versus Buy In Trucking: AssetOwnership, Job Design and Information�, American Economic Review, 93, 551-72.
[11] Baker, George, and Hubbard, Thomas (2004), �Contractibility and Asset Ownership: OnBoard Computers and Governance in US Trucking,�Quarterly Journal of Economics, 119,1443-79.
[12] Baron, David, and Besanko, David (1992), �Information, Control, and OrganizationalStructure�, Journal of Economics and Management Strategy, 1, 237-275.
[13] Bartel, Ann, Ichniowski, Casey and Kathryn Shaw (2007), �How Does Information Tech-nology Really A¤ect Productivity? Plant-Level Comparisons of Product Innovation,Process Improvement and Worker Skills�, Quarterly Journal of Economics, 122, No. 4,1721-1758
[14] Becker, Sascha and Ludger Woessmann (2009) �Was Weber wrong? A human capitaltheory of Protestant Economic History�Quarterly Journal of Economics, 124(2) 531-595
[15] Black, Sandra, and Lynch, Lisa (2001), �How to Compete: The Impact of Workplace Prac-tices and Information Technology on Productivity,�Review of Economics and Statistics,83, 434-445.
[16] Blanchard, Olivier (2004) �The Economic Future of Europe�, Journal of Economic Per-spectives, 18, 3-26.
[17] Bloom, Nick, Draca, Mirko and Van Reenen, John (2010) �Trade induced technical change:The impact of Chinese imports on technology and jobs�LSE/Stanford mimeo
[18] Bloom, Nick, Sadun, Ra¤aella and Van Reenen, John (2007), �Americans do I.T. Better:American multinationals and the productivity miracle� NBER Working Paper 13085,forthcoming American Economic Review
[19] Bloom, Nick, Sadun, Ra¤aella and Van Reenen, John (2009), �Measuring and ExplainingOrganization across �rms and countries� Centre for Economic Performance DiscussionPaper No. 927
[20] Bloom, Nick, Garicano, Luis, Sadun, Ra¤aella and Van Reenen, John (2009) �The Distincte¤ects of Information Technology and Communication Technology on �rm organization�NBER Working Paper 14975
[21] Bolton, Patrick, and Dewatripont, Mathias (1994), �The Firm as a Communication Net-work,�Quarterly Journal of Economics, 109, 809-839.
34

[22] Bresnahan, Timothy, Brynjolfsson, Erik, and Hitt, Lorin (2002), �Information Technol-ogy, Workplace Organization and the Demand for Skilled Labor: Firm-level Evidence,�Quarterly Journal of Economics, 117, 339-376.
[23] Calvo, Guillermo, Wellisz, Stanislaw (1978), �Supervision, Loss of Control, and the Opti-mum Size of the Firm�Journal of Political Economy, 86, 943-952
[24] Caroli, Eve, and Van Reenen, John, (2001), �Skill Biased Organizational Change,�Quar-terly Journal of Economics, 116, 1448-1492.
[25] Colombo, Massimo, and Delmastro, Marco (2004), �Delegation of Authority in businessorganizations: An empirical test,�Journal of Industrial Economics, 52, 53-80.
[26] Cremer, Jacques, Garicano, Luis and Prat, Andrea (2007), �Language and the Theory ofthe Firm�Quarterly Journal of Economics, 122(1): 373-407
[27] Davenport, Thomas H. , Harris, Jeanne G., Catrell, Susan (2002), �The Return of Enter-prise Solutions: The Director�s Cut.�Accenture Institure for High Performance BusinessResearch Report, October 2002.
[28] Dessein, Wouter (2002), �Authority and Communication in Organizations,� Review ofEconomic Studies, 69, 811-838.
[29] Draca, Mirko, Sadun Ra¤aella and Van Reenen, John (2007), �Productivity and ICTs: aReview of the Evidence�, in Robin Mansell, Chrisanthi Avgerou, Danny Quah and RogerSilverstone (eds.) The Oxford Handbook of Information and Communication Technologies,Oxford University Press.
[30] Foster, Andrew and Mark Rosenzweig (2010) �Microeconomics of Technology Adoption�Annual Review of Economics, 2, 395-424
[31] Garicano, Luis (2000), �Hierarchies and the Organization of Knowledge in Production,�Journal of Political Economy, 108, 874-904.
[32] Garicano, Luis and Rossi-Hansberg, Estaban (2006), �Organization and Inequality in aKnowledge Economy�Quarterly Journal of Economics, 121(4), 1383-435.
[33] Gri¢ th, Rachel, Simon Lee and Rachel Gri¢ th (2007) �Is distance dying at last? FallingHome bias in �xed e¤ects models of patent citations�NBER Discussion Paper No. 13338
[34] Guadalupe, Maria and Wulf, Julie (2008) �The Flattening Firm and Product MarketCompetition: The E¤ect of Trade Liberalization�, Harvard Business School Strategy UnitWorking Paper No 09-067
[35] Hagiu, Andrei, Yin, Pai-Ling, Beyersdorfer, Daniela and Dessain, Vincent (2007) �SAP:Industry Transformation�Harvard Business School Case study 9-707-435
[36] Hart, Oliver, and Moore, John (2005), �On the Design of Hierarchies: Coordination versusSpecialization,�Journal of Political Economy, 113, 675-702.
[37] Harris,Jeanne G. and Davenport, Thomas H (2006),�New Growth from Enterprise Sys-tems: Achieving High Performance through Distinctive Capabilities�, Accenture Institutefor High Performance Business Report.
[38] Holmes, Thomas (2010) �The Di¤usion of Wal-Mart and the economics of density�Min-nesota mimeo and forthcoming, Econometrica
35

[39] Hunter, Larry, Bernhardt, Annette, Hughes, Katherine, and Skuratowicz, Eva (2001)�It�s not just the ATMs: Technology, �rm strategies, jobs and earnings in retail banking�,Industrial and Labor Relations Review, 54(2). 402-424
[40] Ja¤e, Adam, Manuel Trajtenberg and Rebecca Henderson (1993), �Geographic local-ization of knowledge spillovers as evidenced by patent citations�, Quarterly Journal ofEconomics 108 (3), 577-598
[41] Kretschmer, Tobias and Mahr, Ferdinand (2009) �Complementaries between technologies:Survey Evidence�, University of Munich mimeo
[42] Manski, Charles (2004), �Measuring expectations�, Econometrica, LXXII (5), 1329-1376.
[43] Lemieux, Thomas, MacCleod, Bentley and Parent, Daniel (2007) �Performance Pay andWage Inequality�NBER Working Paper 13128, forthcoming Quarterly Journal of Eco-nomics
[44] Machin, Stephen and Van Reenen, John (2008) �Changes in Wage Inequality� in Wein-berg, Bruce and Taber, Christopher (eds) New Palgrave Dictionary of Economics, London:Palgrave
[45] Melumad, Nahum, Mookherjee, Dilip, and Reichelstein, Stefan (1995), �Hierarchical De-centralization of Incentive Contracts,�Rand Journal of Economics, 26, 654-672.
[46] Milgrom, Paul, and Roberts, John (1990), �The Economics of Modern Manufacturing:Technology, Strategy and Organization,�American Economic Review, 80, 511-528.
[47] Prendergast, Canice (2002) �The Tenuous Trade-o¤between Risk and Incentives�Journalof Political Economy, 110 (5), 1071-1102
[48] Radner, Roy (1993), �The Organization of Decentralized Information Processing,�Econo-metrica, 61, 1109-1146.
[49] Rajan, Raghuram G and Zingales, Luigi (1998) �Financial Dependence and Growth�American Economic Review, 88(3), 559-86
[50] Rajan, Raghuram, and Wulf, Julie (2006), �The Flattening Firm: Evidence from PanelData on the Changing Nature of Corporate Hierarchies,�Review of Economics and Sta-tistics, 88 (4), 759-773
[51] Shepard, Jim and Eric Klein (2006), Enterprise Resource Planning Spending Report, 2006-2007. AMR Research.
[52] Skinner, Jonathan and Doug Staiger (2005) �Technological Adoption from hybrid corn toBeta Blockers�, NBER Working Paper 11251
[53] Stephenson, Betsy (2006) �The Impact of the Internet on worker �ows�, Wharton BusinessSchool mimeo
[54] Telecommunication Handbook, (2007), OECD: Paris
[55] World Development Indicators (2006) World Bank: Washington DC.
36

Delegated Tasks Centralized Tasks
0 1z0
],0[ 0zz∈]1,( 0zz∈
Notes: Performed by lower level agentsPassed on to the higher level
Figure 1: Delegation of tasks in the Basic Model
Manager (expert)
Figure 2: Management span and autonomy
Workers (agents)
Span of control:number of
workers reporting to manager
Worker autonomy: lowif managers take most decisions (Zo close to zero); high if workers take most decisions (Z0 is close to one)
Z0
0
1
Delegated Tasks
CentralizedTasks
37

Delegated Tasks Centralized Tasks
0 1zp
Notes: This generalizes Figure 1 where we allow for non-production decisions and production decisions. Non-production decisions below xm are performed by plant managers, the rest by central head quarters. Production decisions below z0 are performed by production workers, the rest by plant managers
0 1xmNon-ProductionDecisions
ProductionDecisions
Delegated Tasks Centralized Tasks
Figure 3: Delegation of tasks in the extended model
Figure 4: Enterprise Resource Planning (ERP) use
Notes: Answers range from 1=“strongly disagree” to 5=“strongly agree”. Each bar represents the % of respondents in the relevant bin from 431 firms. See Appendix B for details.
Q3: “Our ERP System is used to endow middle management with more & better information”
Q4: “Our ERP System is used to faster communicate information and directives from middle management to employees”
Q2: “Our ERP System is used to faster communicate information and directives from top management to employees”
Q1: “Our ERP System is used to endow top management with more & better information”
38

CHQ
Plant Manager 1
Workers
Figure 5: Information and communication
Plant Manager 2
Plant Manager 3
WorkersWorkers
Communication costs: hCost of
transmitting information
between CEO and PM, and between PM and workers, measured by presence of
networks
Manager’s information costs: am & ap
Cost of managers acquiring information, measured using the
presence of ERP
Worker’s information
costs: apCost of workers
acquiring information, measured
using presence of CAD/CAM
39

TABLE 1 – SUMMARY OF MAIN THEORETICAL PREDICTIONS THAT WE EMPIRICALLY TEST
(1) (2) (3)
Plant Manager
Autonomy Worker Autonomy Plant Manager Span
of Control (Table 3) (Table 4) (Table 5) Reduction in Communication costs (h)
Technology Indicator NETWORK (h) NETWORK (h) NETWORK (h)
Theoretical Prediction - - ?
Empirical Finding - - +
Reduction in Information acquisition costs (a)
Technology Indicator ERP (am) CAD/CAM (ap) CAD/CAM (ap)
Theoretical Prediction + + +
Empirical Finding + + + Notes: This table presents the theoretical predictions and the empirical findings. Column (1) refers to plant manager autonomy; Column (2) refers to workers’ autonomy; and Column (3) refers to span of control (for plant manager and CEO). NETWORK denotes the presence of a network (leased line/frame relay); ERP denotes the presence of Enterprise Resource Planning and CAD/CAM denotes the presence of Computer Assisted Design/Computer Assisted Manufacturing. A “+” denotes an increase, a “-’’ a decrease a “0” denotes no effect and “?’’ denotes an ambiguous sign. All empirical findings except for reduction in communication costs in Column (2) and (3) are statistically significant at the 5% level.
40

TABLE 2 - SUMMARY STATISTICS
Variable Mean Median Standard Deviation Firms
Employment (Firm) 960.142 350 3259.742 943 Employment (Plant) 252.664 155 286.087 911 Plant Manager Autonomy 0.252 0 0.982 948 Workers' Autonomy 0.076 0 0.265 935 Ln(Plant Manager SPAN) 1.892 2 0.521 874 CEO Span (Multi-plant dummy) 0.641 1 0.480 948 Computers per Employee 0.483 0 0.395 937 ERP 0.363 0 0.473 948 CADCAM 0.024 0 0.152 687 NETWORK 0.355 0 0.472 948 LAN/WAN 0.427 0 0.492 948 Foreign Multinational 0.350 0 0.477 948 Domestic Multinational 0.287 0 0.453 948 %College 16.007 10 17.169 867 Bonus as a % of salary 0.112 0 0.151 862 % Increase salary on promotion 0.215 0 0.189 610 Leased Line Price (PPP 2006 USD) 4984.281 5260 1439.319 948
Notes: These are descriptive statistics from the sample in Table 3 (except for CAD/CAM which is Table 4).
41

TABLE 3 - PLANT MANAGER AUTONOMY (1) (2) (3) (4) (5) (6) Dependent Variable Plant Manager Autonomy ERP 0.097* 0.104* 0.114** 0.116** (0.053) (0.054) (0.053) (0.054)
NETWORK -0.107** -0.098* -0.123** -0.110** (0.053) (0.052) (0.053) (0.053)
Ln(Percentage College) 0.100*** 0.097*** 0.098*** (0.032) (0.032) (0.032)
ln(Computers/Employee) -0.041 -0.020 -0.031 (0.031) (0.031) (0.031)
ln(Firm Employment) 0.070* 0.063 0.073* 0.068* 0.073* 0.067* (0.040) (0.040) (0.040) (0.040) (0.040) (0.040)
Plant Employment 0.151*** 0.148*** 0.151*** 0.151*** 0.149*** 0.147*** (0.044) (0.045) (0.044) (0.045) (0.044) (0.045)
Foreign Multinational 0.177** 0.178** 0.202** 0.196** 0.193** 0.190** (0.080) (0.080) (0.079) (0.079) (0.080) (0.080)
Domestic Multinational 0.195** 0.184** 0.208** 0.193** 0.203** 0.190** (0.082) (0.083) (0.082) (0.083) (0.082) (0.083) Number of Observations 3,434 3,434 3.434 3,434 3,434 3,434
Number of Firms 948 948 948 948 948 948 Notes: * = significant at the 10% level, **= significant at the 5% level, ***=significant at the 1% level. The dependent variable is the z-score of plant manager autonomy (mean=0 and standard deviation=1) across four questions relating to plant manager’s control over hiring, investment, product introduction and marketing (see text). All columns are estimated by OLS with standard errors in parentheses (robust and clustered by firm). The sample includes firms based in France, Germany, Italy, Portugal, Poland, Sweden, the UK and the US (country dummies included). All columns include a full set of three digit industry dummies and “Noise controls” (analyst fixed effects, plant manager seniority and tenure in company, the day of the week the interview was conducted, interview duration and reliability). “ERP” denotes Enterprise Resource Planning and “NETWORK” denotes the firm has an internal network (leased lines or frame relays). All columns exclude firms where the plant manager is the CEO and include a dummy equal to unity if the CEO is on site.
42
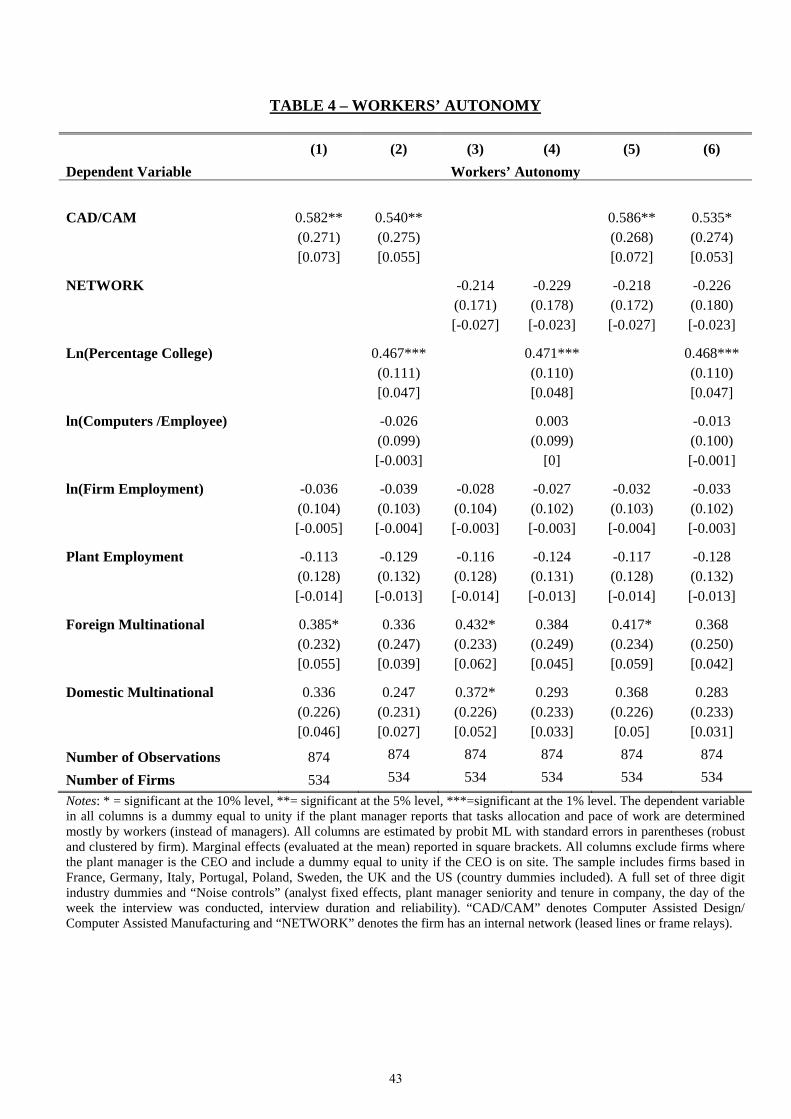
TABLE 4 – WORKERS’ AUTONOMY
(1) (2) (3) (4) (5) (6) Dependent Variable Workers’ Autonomy CAD/CAM 0.582** 0.540** 0.586** 0.535*
(0.271) (0.275) (0.268) (0.274)
[0.073] [0.055] [0.072] [0.053]
NETWORK -0.214 -0.229 -0.218 -0.226 (0.171) (0.178) (0.172) (0.180)
[-0.027] [-0.023] [-0.027] [-0.023]
Ln(Percentage College) 0.467*** 0.471*** 0.468*** (0.111) (0.110) (0.110)
[0.047] [0.048] [0.047]
ln(Computers /Employee) -0.026 0.003 -0.013 (0.099) (0.099) (0.100)
[-0.003] [0] [-0.001]
ln(Firm Employment) -0.036 -0.039 -0.028 -0.027 -0.032 -0.033 (0.104) (0.103) (0.104) (0.102) (0.103) (0.102)
[-0.005] [-0.004] [-0.003] [-0.003] [-0.004] [-0.003]
Plant Employment -0.113 -0.129 -0.116 -0.124 -0.117 -0.128 (0.128) (0.132) (0.128) (0.131) (0.128) (0.132)
[-0.014] [-0.013] [-0.014] [-0.013] [-0.014] [-0.013]
Foreign Multinational 0.385* 0.336 0.432* 0.384 0.417* 0.368 (0.232) (0.247) (0.233) (0.249) (0.234) (0.250)
[0.055] [0.039] [0.062] [0.045] [0.059] [0.042]
Domestic Multinational 0.336 0.247 0.372* 0.293 0.368 0.283 (0.226) (0.231) (0.226) (0.233) (0.226) (0.233)
[0.046] [0.027] [0.052] [0.033] [0.05] [0.031]
Number of Observations 874 874 874 874 874 874
Number of Firms 534 534 534 534 534 534Notes: * = significant at the 10% level, **= significant at the 5% level, ***=significant at the 1% level. The dependent variable in all columns is a dummy equal to unity if the plant manager reports that tasks allocation and pace of work are determined mostly by workers (instead of managers). All columns are estimated by probit ML with standard errors in parentheses (robust and clustered by firm). Marginal effects (evaluated at the mean) reported in square brackets. All columns exclude firms where the plant manager is the CEO and include a dummy equal to unity if the CEO is on site. The sample includes firms based in France, Germany, Italy, Portugal, Poland, Sweden, the UK and the US (country dummies included). A full set of three digit industry dummies and “Noise controls” (analyst fixed effects, plant manager seniority and tenure in company, the day of the week the interview was conducted, interview duration and reliability). “CAD/CAM” denotes Computer Assisted Design/ Computer Assisted Manufacturing and “NETWORK” denotes the firm has an internal network (leased lines or frame relays).
43

TABLE 5 - PLANT MANAGER SPAN OF CONTROL
(1) (2) (3) (4) (5) (6) Dependent Variable Plant Manager Span of Control CAD/CAM 0.167** 0.153** 0.168** 0.155** (0.072) (0.076) (0.072) (0.076)
NETWORK 0.054 0.051 0.054 0.053 (0.043) (0.043) (0.043) (0.043)
Ln(Percentage College) 0.059** 0.061*** 0.059** (0.023) (0.023) (0.023)
ln(Computers /Employee) 0.010 0.008 0.006 (0.024) (0.024) (0.024)
ln(Firm Employment) 0.041 0.041 0.042 0.041 0.038 0.038 (0.027) (0.026) (0.027) (0.026) (0.027) (0.026)
Plant Employment 0.024 0.032 0.028 0.035 0.025 0.031 (0.031) (0.032) (0.032) (0.032) (0.032) (0.032)
Foreign Multinational 0.059 0.037 0.054 0.032 0.052 0.031 (0.058) (0.056) (0.058) (0.056) (0.058) (0.056)
Domestic Multinational 0.129** 0.105* 0.124** 0.100* 0.125** 0.102* (0.060) (0.057) (0.060) (0.057) (0.059) (0.057) Number of Observations 1,415 1,415 1,415 1,415 1,415 1,415
Number of Firms 859 859 859 859 859 859 Notes: * = significant at the 10% level, **= significant at the 5% level, ***=significant at the 1% level. The dependent variable in all columns is the log of the number of employees reporting directly to the plant manager. All columns are estimated by OLS with standard errors in parentheses (robust and clustered by firm). All columns exclude firms where the plant manager is the CEO and include a dummy equal to unity if the CEO is on site. The sample includes firms based in France, Germany, Italy, Portugal, Poland, Sweden, the UK and the US (country dummies included). All columns include a full set of three digit industry dummies and “Noise controls” (analyst fixed effects, plant manager seniority and tenure in company, the day of the week the interview was conducted, interview duration and reliability). “CAD/CAM” denotes Computer Assisted Design or Manufacturing software and “NETWORK” denotes the firm has an internal network (leased lines or frame relays).
44

TABLE 6 – PLANT MANAGER AUTONOMY, INSTRUMENTAL VARIABLE ESTIMATES
(1) (2) (3) (4) (5) (6) (7) (8) (9) (10)
Dependent Variable
ERP
Plant Manager
Autonomy
Plant Manager
AutonomyNETWORK
Plant Manager
Autonomy
Plant Manager
Autonomy
ERP
NET-
WORK
Plant Manager
Autonomy
Plant Manager
Autonomy
Regression 1st Stage
Reduced Form 2nd Stage 1st Stage Reduced
Form 2nd
Stage 1st
Stage
1st Stage Reduced
Form 2nd Stage
ERP 1.892** 1.569** (0.934) (0.692) NETWORK -1.720** -2.120** (0.815) (1.081) Ln(Distance -0.217** -0.410** -0.217** 0.034 -0.411** to Walldorf) (0.081) (0.180)
(0.081) (0.066) (0.179)
Ln(NETWORK Price) *(Industry NETWORK -3.196** 5.495**
-0.798 -3.198** 5.528**
Intensity) (1.214) (2.351) (1.775) (1.226) (2.510) Number of observations 493 493 493 493 493 493 493 493 493 493 Number of firms 161 161 161 161 161 161 161 161 161 161
Notes: * = significant at the 10% level, **= significant at the 5% level, ***=significant at the 1% level. The dependent variable is the z-score of plant manager autonomy. Standard errors are robust and clustered at the regional level in all columns (54 regions). All columns exclude firms where the plant manager is the CEO and include a dummy equal to unity if the CEO is on site. The sample includes firms based in France, Germany, Italy, Portugal, Poland and Sweden (country dummies included). All multinational subsidiaries are dropped. All columns include noise controls, firm controls and industry dummies as in previous tables. The instrument for ERP is the distance (in km) from Walldorf, Heidelberg (the head quarters and founding place of SAP). The instrument for Networks is the cost of communications interacted with industry-level network intensity. “Industry NETWORK INTENSITY” represents the fraction of workers with access to an internal network (leased lines or frame relays) in the three-digit industry across all countries. “NETWORK Price” is the cost of an annual subscription to a leased line contract at 2006 PPP USD (taken from the OECD Telecommunication Handbook, 2007). Regressions weighted by the plant's share of firm employment.
45

TABLE 7 - ROBUSTNESS CHECKS (1) (2) (3) (4) (5) (6) (7) (8) (9) Baseline Regional
dummies and Lerner index
Additional firm level controls
Alternative NETWORK (LAN/WAN)
Alternative construction of ICT variables
Include Management
quality
Alternative dependent variable
Drop size controls
Condition on industries with at least 3 firms
Panel A: Plant Manager AutonomyERP 0.116** 0.096* 0.112** 0.114** 0.118** 0.119** 0.133** 0.125** 0.113** (0.054) (0.052) (0.054) (0.053) (0.053) (0.054) (0.059) (0.054) (0.056) NETWORK -0.110** -0.127** -0.098* -0.134** -0.125** -0.112** -0.099* -0.115** -0.134** (0.053) (0.052) (0.053) (0.063) (0.051) (0.053) (0.056) (0.054) (0.055) Observations 3,434 3,434 3,434 3,434 3,434 3,434 3,434 3,434 3,149 Firms 948 948 948 948 948 948 948 948 870
Panel B: Workers' Autonomy CAD/CAM 0.535* 0.650** 0.566** 0.641** 0.458 0.492* 0.863** 0.534* 0.441* (0.274) (0.284) (0.285) (0.268) (0.280) (0.275) (0.342) (0.277) (0.263) [0.053] [0.049] [0.054] [0.061] [0.065] [0.049] [0.242] [0.054] [0.037] NETWORK -0.226 -0.402* -0.236 -0.659*** -0.230 -0.263 -0.090 -0.227 -0.215 (0.180) (0.211) (0.190) (0.249) (0.174) (0.184) (0.217) (0.181) (0.184) [-0.023] [-0.03] [-0.022] [-0.063] [-0.021] [-0.026] [-0.017] [-0.023] [-0.018] Observations 874 874 874 874 874 874 874 874 837 Firms 534 534 534 534 534 534 534 534 516
Panel C: Plant Manager Span of Control CAD/CAM 0.155** 0.208*** 0.157** 0.153** 0.156** 0.156** 0.167** 0.152* (0.075) (0.075) (0.075) (0.075) (0.074) (0.074) (0.074) (0.079) NETWORK 0.053 0.045 0.030 0.069 0.048 0.035 0.052 0.025 (0.041) (0.042) (0.041) (0.058) (0.040) (0.041) (0.042) (0.042) Observations 1,415 1,415 1,415 1,415 1,415 1,415 1,415 1,251 Firms 859 859 859 859 859 859 859 781
Notes: * = significant at the 10%, ** = 5%, ***= 1%. Panel A and C estimated by OLS. Panel B is estimated by probit with standard errors in parentheses and marginal effects (evaluated at the mean) in square brackets. Standard errors are clustered by firm in all columns. sample includes firms based in France, Germany, Italy, Portugal, Poland, Sweden, the UK and the US (country dummies included). All columns exclude firms where the plant manager is the CEO and include a dummy equal to unity if the CEO is on site. All columns include noise controls, firm controls and industry dummies as in previous tables. “ERP” = Enterprise Resource Planning, “NETWORK” = firm has an internal network (leased lines or frame relays) and “CAD/CAM” = Computer Assisted Design or Manufacturing. In column (2) regional (NUTS2) dummies and the inverse of the Lerner index are included as additional controls. In column (3) the ln(capital/employment ratio), ln(sales/employment ratio), ln(average wages), ln(global ultimate owner employment), ln(firm age) and a publicly listed dummy are included as additional controls. In column (4) the network variable denotes the presence of LAN/WAN systems. In column (5) we construct the ICT variables as equal to unity if there is a positive value in any plant. In column (6) the average management score (computed across the 18 management questions in Bloom and Van Reenen, 2007) is included as additional control. In column (7) the dependent variable is the principal factor component of the four different Plant Manager Autonomy questions (Panel A) and a dummy equal to unity if the pace of work question takes values above three (Panel B). In column (8) we drop firm and plant size from the regressions. Column (9) conditions on having at least three firms per three digit industry.
46
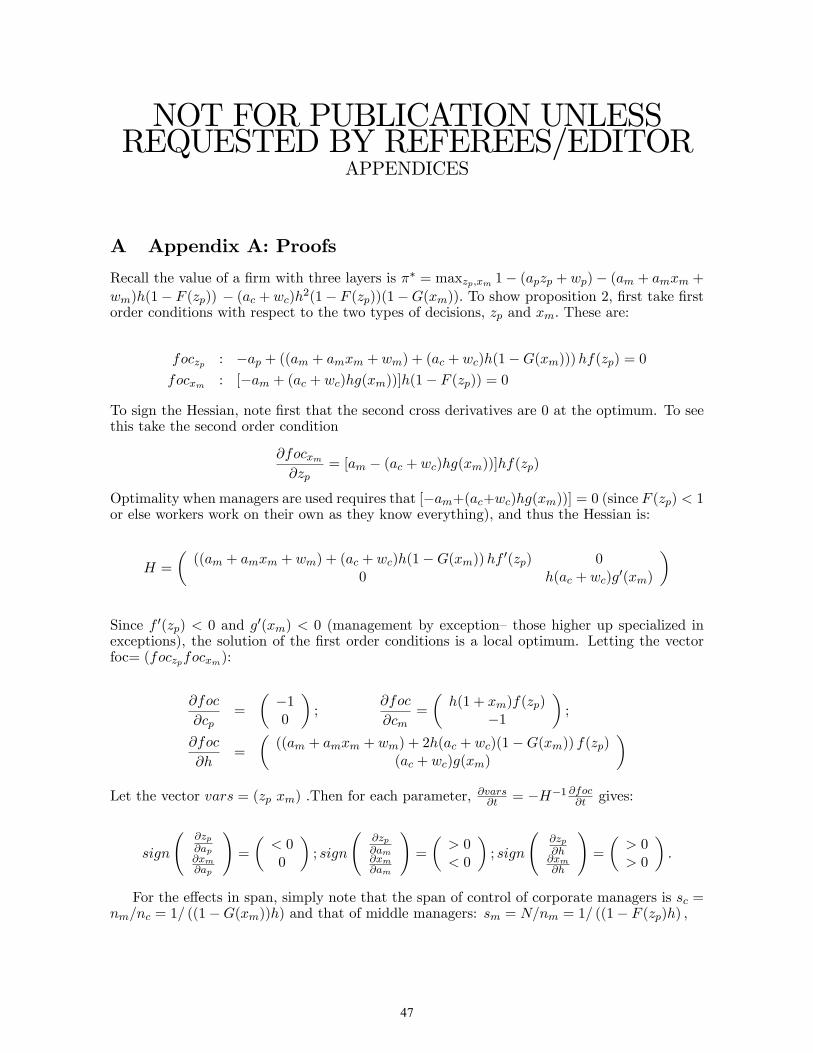
NOT FOR PUBLICATION UNLESSREQUESTED BY REFEREES/EDITOR
APPENDICES
A Appendix A: Proofs
Recall the value of a �rm with three layers is �� = maxzp;xm 1� (apzp + wp)� (am + amxm +wm)h(1� F (zp)) � (ac + wc)h2(1� F (zp))(1�G(xm)): To show proposition 2, �rst take �rstorder conditions with respect to the two types of decisions, zp and xm: These are:
foczp : �ap + ((am + amxm + wm) + (ac + wc)h(1�G(xm)))hf(zp) = 0focxm : [�am + (ac + wc)hg(xm))]h(1� F (zp)) = 0
To sign the Hessian, note �rst that the second cross derivatives are 0 at the optimum. To seethis take the second order condition
@focxm@zp
= [am � (ac + wc)hg(xm))]hf(zp)
Optimality when managers are used requires that [�am+(ac+wc)hg(xm))] = 0 (since F (zp) < 1or else workers work on their own as they know everything), and thus the Hessian is:
H =
�((am + amxm + wm) + (ac + wc)h(1�G(xm))hf 0(zp) 0
0 h(ac + wc)g0(xm)
�
Since f 0(zp) < 0 and g0(xm) < 0 (management by exception�those higher up specialized inexceptions), the solution of the �rst order conditions is a local optimum. Letting the vectorfoc= (foczpfocxm):
@foc
@cp=
��10
�;
@foc
@cm=
�h(1 + xm)f(zp)
�1
�;
@foc
@h=
�((am + amxm + wm) + 2h(ac + wc)(1�G(xm)) f(zp)
(ac + wc)g(xm)
�Let the vector vars = (zp xm) .Then for each parameter, @vars@t = �H�1 @foc
@t gives:
sign
@zp@ap@xm@ap
!=
�< 00
�; sign
@zp@am@xm@am
!=
�> 0< 0
�; sign
@zp@h@xm@h
!=
�> 0> 0
�:
For the e¤ects in span, simply note that the span of control of corporate managers is sc =nm=nc = 1= ((1�G(xm))h) and that of middle managers: sm = N=nm = 1= ((1� F (zp)h) ;
47

sign
@sm@ap@sc@ap
!=
�< 00
�; sign
@sm@am@sc@am
!=
�> 0< 0
�; sign
�@sm@h@sc@h
�=
�7 07 0
�:
To get the table in the paper, note that the predictions are with respect to a fall in thesecosts and thus all of the signs must be reversed to obtain the prediction.
Finally, note also that if we let am be also the acquisition cost of CEOs, so that ERP a¤ectsboth CEOs and plant managers equally nothing changes (as the proposition states), so thatac = am. The �rst foc becomes foczp : �ap+((am + amxm + wm) + (am + wc)h(1�G(xm))hf(zp),focxm changes to: �am + (am + wc)hg(xm)); and
@foc
@am=
�((1 + xm) + h(1�G(xm))hf(zp) > 0�1 + hg(xm) = �wchg(xm)=am < 0
�
so that sign
@zp@am@xm@am
!=
�> 0< 0
�is still true.
B Appendix B: Survey of IT Managers on the Impact of ERP
In the Summer and Fall of 2008 Kretschmer and Mahr (2009) conducted a survey of IT man-agers in medium-sized (100 to 5,000 employees) German and Polish �rms that were randomlychosen from the population of manufacturing �rms. The aims of the survey were wider thanjust ERP and collected information on management and other factors. At our request somequestions on the use of ERPwere inserted. Answers to the questions where on a Likert Scalefrom 1 = strongly disagree to 5 = strongly agree. The key questions for our purposes were thefollowing:
Q21 �Our ERP system is used to endow top management with more and better infor-mation�
Q24 �Our ERP system is used to endow middle managers with more and better infor-mation�
Q23 �Our ERP system is used to faster communicate information and directives fromtop management to employees�
Q26 �Our ERP system is used to faster communicate information and directives frommiddle management to employees�
Figure 5 shows the distribution of answers to these questions. It is clear from this �gurethat most respondents were likely (a �4�) or very likely (a �5�) to agree with statements Q21and Q24 suggesting ERP was related to information acquisition. By contrast, as many peopledisagreed as agreed with the statements in Q23 and Q26 that ERP lowers communicationcosts. The mean of the information question is 3.8 for Q24 and 4.03 for Q21 whereas for thecommunication question it is 2.76 for Q23 and 2.71 for Q26.
Table A1 shows regression versions of these descriptive statistics. Likert scales betweenrespondents can be biased because each respondent implicitly has a di¤erent scaling whenthey answer such questions (Manski, 2004). We can deal with this by only comparing �withinrespondent�, i.e. looking at the relative responses for the same individual across questions.We construct several such variables, but the key one is �DIF1�the absolute di¤erence between�Our ERP system is used to endow middle managers with more and better information�(Q24) and �Our ERP system is used to faster communicate information and directives fromtop management to employees� (Q23). This is an index from -4 to 4 indicating the degreeto which ERP reduces information costs relative to communication costs. A positive value
48

of this index indicates that managers are more likely to view ERP as improving informationcosts rather than reducing communication costs.
Column (1) of Table A1 shows that the mean value of this index is just above one andthat this is a signi�cant di¤erence. This is consistent with our assumption that ERP is usedmore as an information acquisition tool than a communication tool. We condition on someconfounding in�uences - country dummies, industry dummies and size in column (2) whichshows the di¤erence is robust. One might be concerned that the communication question relatesto top managers, so we also used �DIF2�which keeps the information question the same (Q21)but deducts �Our ERP system is used to faster communicate information and directives frommiddle management to employees� (Q26). The results of using this as a dependent variableare in column (3) which are almost identical to column (2). Finally we checked whether ERPis better at endowing top management with more information than middle management byconstructing �DIF3�the absolute di¤erence between �Our ERP system is used to endow middlemanagers with more and better information�(Q24) and �Our ERP system is used to endowtop management with more and better information� (Q21). This di¤erence is positive butcompletely insigni�cant. In terms of our theory this means that ERP shifts am downwards toa similar extent as ac which is again, what we assumed for our interpretation of the empiricalresults41: See Kretschmer and Mahr (2009) for full details on the underlying survey.
C Appendix C: Data Appendix
C.1 CEP Management and Innovation Survey Dataset
C.1.1 The Survey Sampling Frame
We use a sub-set of the CEP Management and Organization survey in this paper (see Bloom,Sadun and Van Reenen, 2008, for full details of larger sample) where we have ICT data (seebelow). Our sampling frame was based on the Bureau van Dijk (BVD) Amadeus datasetfor Europe (France, Germany, Italy, Poland, Portugal, Sweden and the U.K.) and Icarus forthe US. These databases all provide su¢ cient information on companies to conduct a strati�edtelephone survey (company name, address and a size indicator). These databases also typicallyhave some accounting information, such employment, sales of capital assets. Apart from size,we did not insist on having accounting information to form the sampling population, however.
Amadeus is constructed from a range of sources, primarily the National registries of compa-nies (such as Companies House in the UK). Icarus is constructed from the Dun & Bradstreetdatabase, which is a private database of over 5 million US trading locations built up fromcredit records, business telephone directories and direct research. In every country the sam-pling frame was all �rms with a manufacturing primary industry code with between 100 and5,000 employees on average over the most recent three years of data (typically 2002 to 2004)42.
Interviewers were each given a randomly selected list of �rms from the sampling frame.This should therefore be representative of medium sized manufacturing �rms. The size of thesampling frame appears broadly proportional to the absolute size of each country�s manufac-turing base, the US, has the most �rms and Sweden and Portugal the least43. In addition torandomly surveying from the sampling frame described above we also tried to resurvey the�rms we interviewed in the 2004 survey wave used in Bloom and Van Reenen (2007). Thiswas a sample of 732 �rms from France, Germany, the UK and the US, with a manufacturing
41There are di¤erences in the comparative statistcs if ERP or another technology reduced cc but not cm:42 In the US only the most recent year of employment is provided. In Portugal the population of �rms with
100 to 5000 employees was only 242, so we supplemented this with the 72 �rms with 75 to 100 employees. Wechecked the results by conditioning on common size bands (above 150 in all countries).43The size of the manufacturing sector can be obtained from http://laborsta.ilo.org/, a database maintained
by ILO.
49

primary industry code and 50 to 10,000 employees (on average between 2000 and 2003). Thissample was drawn from the Amadeus dataset for Europe and the Compustat dataset for theU.S. Only companies with accounting data were selected44. As a robustness test we also dropthe �rms that were resurveyed from 2004.
C.1.2 Sample Representativeness
Comparing the aggregate number of employees for di¤erent size bands from our samplingframe with the �gures for the corresponding manufacturing populations in each of the countries(obtained from national census data), we �nd that in all countries but two the sampling framebroadly matches up with the population of medium sized manufacturing �rms. This suggestsour sampling frame covers the population of all �rms. In Germany and Portugal the coverageis less complete as the frame appears to cover around a third of manufacturing employees. Toaddress this problem we always include country �xed-e¤ects to try to control for any di¤erencesacross countries. Second, we control for size and industry. This should help to condition outsome of the factors that lead to under/over sampling of �rms. Finally, we made sure the resultswere robust to dropping Germany and Portugal.
45% of the �rms we contacted took part in the survey: a high success rate given thevoluntary nature of participation. Of the remaining �rms 17% refused to be surveyed, whilethe remaining 38% were in the process of being scheduled when the survey ended. The decisionsto reject the interview is uncorrelated with revenues per worker, listing status of the �rm or�rm age. Large �rms and multinationals were more likely to respond although the magnitudeof this e¤ect is small (e.g. multinationals were about 7% more likely to agree to the interviewand �rms about 4 percentage points more likely for a doubling in size). European �rms wereslightly more likely to respond than US �rms.
C.2 Harte Hanks Data
The ICT data used is constructed using the Ci Technology Database (CiDB) produced bythe international marketing and information company Harte Hanks (HH). Harte-Hanks is aNYSE listed multinational that collects IT data primarily for the purpose of selling on tolarge producers and suppliers of IT products (e.g. IBM, Dell etc). Their data is collected forover 160,000 plants across 20 European countries, and another 250,000 across the US. The USbranch has the longest history with the company beginning its data collection activities in themid 1980s.
Harte Hanks surveys plants (referred to as �sites�in the CiTB database) on a rolling basiswith an average of 11 months between surveys. This means that at any given time, the dataprovides a �snapshot� of the stock of a �rm�s IT. The CiTDB contains detailed hardware,equipment and software information at the plant level. Areas covered by the survey includePCs, many types of software, servers, storage and IT sta¤ (including development sta¤ such asprogrammers). The fact that HH sells this data on to major �rms like IBM and Cisco, who usethis to target their sales e¤orts, exerts a strong market discipline on the data quality. If therewere major discrepancies in the collected data this would rapidly be picked up by HH�s clientswhen they placed sales calls using the survey data, and would obviously be a severe problemfor HH future sales45. Because of this HH run extensive internal random quality checks on itsown data, enabling them to ensure high levels of data accuracy.
44So, for the UK and France this sampling frame was very similar to the 2006 sampling frame. For Germanyit is more heavily skewed towards publicly quoted �rms since smaller privately held �rms do not report balancesheet information. For the US it comprised only publicly quoted �rms. As a result when we present results wealways include controls for �rm size.45HH also refunds data-purchases for any samples with error levels above 5%.
50

Another valuable feature of the CiDB is its consistency of collection across countries. Thedata for Europe is collected via a central call centre in Dublin and this ensures that all vari-ables are de�ned on an identical basis across countries. This provides some advantages overalternative strategies such as (for example) harmonizing government statistical register datacollected by independent national agencies.
HH samples all �rms with over 100 employees in each country. Thus, we do lose smaller�rms, but since we focus on manufacturing the majority of employees are in these larger �rms.It is also worth noting this survey frame is based on �rm employment - rather than plantemployment - so the data contains plants with less than 100 employees in �rms with multipleplants. Furthermore, HH only drops plants from the survey if they die or repeatedly refuseto answer over several years, so that the sampling frame covers all �rms that have had at 100employees in any year since the survey began. In terms of survey response rate HH reportsthat for the large European countries (UK, France, Germany, Italy, and Spain) they had aresponse rate of 37.2% in 2004 for �rms with 100 or more employees. Bloom, Draca and VanReenen (2010) provide further information on the HH dataset.
C.3 Firm level accounting data
Our �rm accounting data on sales, employment, capital, pro�ts, shareholder equity, long-termdebt, market values (for quoted �rms) and wages (where available) came from Amadeus datasetfor Europe (France, Germany, Italy, Poland, Portugal, Sweden and the U.K.) and on Icarusfor the US
C.4 Leased Line Data
The data on cross national prices is given by OECD (2007). Although European prices havebeen falling over the past decade due to liberalizations and pressures from the regulators (e.g.European Commission DG-Competition), there remains considerable concern about di¤erentialdegrees of competition and regulation generating cross-national price disparities. �Local leasedline prices remain of concern where there is insu¢ cient competition. For users in these areas thismeans that incumbents can continue to charge prices that are not disciplined by competition.For new entrants it means that incumbents may price local leased circuits in an anti-competitivemanner�(OECD Communication Outlook, 2005).
�Leased lines are provided by traditional telecom operators. New market entrants havetheir own networks but need to link their customers� premises to it. This link is called a�leased line part circuit� and is usually provided by the incumbent. The availability at thewholesale level of these links at reasonable prices is a necessary condition for a competitiveleased lines retail market and for pro-competitive downstream �knock-on�e¤ects� (EuropeanCommission Report, 2002)
A major turning point in the pricing of leased lines took place in 1998 when a signi�cantnumber of European countries fully liberalized their telecommunication markets. The impactof increasing liberalization is evident in the OECD�s Index of leased line prices. At the distancesof 50 and 200 kilometers the leased lines (2Mbit/s) index fell from 77 in 1997 to 31 by 2004.This process happened at a much faster rate in some countries than others (see OECD, 2005).
51

TABLE A1 - ERP SURVEY: THE IMPACT OF ERP IS MORE ON INFORMATION COSTS THAN ON COMMUNICATION COSTS
(1) (2) (3) (4) Dependent Variable DIF1 DIF1 DIF2 DIF3 Constant 1.074*** 1.068** 1.042** 0.102 (0.060) (0.512) (0.496) (0.383) Firms 431 431 431 431 Country controls No Yes Yes YesIndustry controls No Yes Yes YesEmployment controls No Yes Yes Yes Notes: Countries are Germany and Poland (Kretschmer and Mahr, 2009). Estimation by OLS. Robust standard errors below coefficients. Industry controls are three digit employment. Questions are on a 1 to 7 Lickert Scale from strongly disagree (1) to strongly agree (5). Q21 “Our ERP system is used to endow top management with more and better information” Q24 “Our ERP system is used to endow (middle) managers with more and better information” Q23 “Our ERP system is used to faster communicate information and directives from top management to employees” Q26 “Our ERP system is used to faster communicate information and directives from (middle) management to employees” Definitions of dependent variable: DIF1 = Q24 – Q23 DIF2 = Q24 – Q26 DIF3 = Q24 - Q21 So DIF1, for example is the absolute difference between “ERP endows middle management with better information” less “ERP is used to faster communicate information and directives from top management to employees”. This is an index from -4 to 4 indicating the degree to which ERP reduces information costs relative to communication costs. A positive value of this index indicates that managers are more likely to view ERP as improving information costs rather than reducing communication costs.
52

TABLE A2: DETAILS OF THE DECENTRALIZATION SURVEY QUESTIONS
For Questions D1, D3 and D4 any score can be given, but the scoring guide is only provided for scores of 1, 3 and 5.Question D1: “To hire a FULL-TIME PERMANENT SHOPFLOOR worker what agreement would your plant need from CHQ (Central Head Quarters)?” Probe until you can accurately score the question – for example if they say “It is my decision, but I need sign-off from corporate HQ.” ask “How often would sign-off be given?”
Score 1 Score 3 Score 5 Scoring grid: No authority – even for replacement hires Requires sign-off from CHQ based on the
business case. Typically agreed (i.e. about 80% or 90% of the time).
Complete authority – it is my decision entirely
Question D2: “What is the largest CAPITAL INVESTMENT your plant could make without prior authorization from CHQ?” Notes: (a) Ignore form-filling (b) Please cross check any zero response by asking “What about buying a new computer – would that be possible?”, and then probe…. (c) Challenge any very large numbers (e.g. >$¼m in US) by asking “To confirm your plant could spend $X on a new piece of equipment without prior clearance from CHQ?” (d) Use the national currency and do not omit zeros (i.e. for a US firm twenty thousand dollars would be 20000). Question D3: “Where are decisions taken on new product introductions – at the plant, at the CHQ or both”? Probe until you can accurately score the question – for example if they say “It is complex, we both play a role “ask “Could you talk me through the process for a recent product innovation?”
Score 1 Score 3 Score 5 Scoring grid: All new product introduction decisions are
taken at the CHQ
New product introductions are jointly determined by the plant and CHQ
All new product introduction decisions taken at the plant level
Question D4: “How much of sales and marketing is carried out at the plant level (rather than at the CHQ)”? Probe until you can accurately score the question. Also take an average score for sales and marketing if they are taken at different levels.
Score 1 Score 3 Score 5 Scoring grid: None – sales and marketing is all run by
CHQ Sales and marketing decisions are split between the plant and CHQ
The plant runs all sales and marketing
Question D5: “Is the CHQ on the site being interviewed”? Question D6: “How much do managers decide how tasks are allocated across workers in their teams” Interviewers are read out the following five options, with our scoring for these note above:
Score 1 Score 2 Score 3 Score 4 Score 5 All managers Mostly managers About equal Mostly workers All workers
Question D7: “Who decides the pace of work on the shopfloor” Interviewers are read out the following five options, with “customer demand” an additional not read-out option
Score 1 Score 2 Score 3 Score 4 Score 5 All managers Mostly managers About equal Mostly workers All workers
Question D8: “How many people directly report to the PLANT MANAGER (i.e. the number of people the PLANT MANAGER manages directly in the hierarchy below him)? Note: cross-check answers of X above 20 by asking “So you directly manage on a daily basis X people?”
Notes: The electronic survey, training materials and survey video footage are available on http://cep.lse.ac.uk/management/default.asp
53

TABLE A3 – EXTENDED THEORY PREDICTIONS
(1) (2) (3) (4)
Plant Manager Autonomy (xm)
Worker Autonomy (zp)
Plant Manager Span of Control
(sm) CEO Span of
Control (sc)
Reduction in communication costs (h) Technology Indicator NETWORK (h) NETWORK (h) NETWORK (h) NETWORK (h)
Theoretical Prediction - - ? ?
Reduction in information acquisition costs for non-production decisions (am)
Technology Indicator ERP (am) ERP (am) ERP (am) ERP (am)
Theoretical Prediction + - - +
Reduction in information acquisition costs for production decisions (ap)
Technology Indicator CAD/CAM (ap) CAD/CAM (ap) CAD/CAM (ap) CAD/CAM (ap)
Theoretical Prediction 0 + + 0
Notes: ERP denotes Enterprise Resource Planning, CAD/CAM denotes Computer Assisted Design/Computer Assisted Manufacturing and NETWORK denotes the presence of a network (leased line/frame relay). A “+” denotes an increase, a “-’’ a decrease a “0” denotes no effect and “?’’ denotes an ambiguous sign.
54

TABLE A4 – CROSS EFFECTS OF TECHNOLOGIES
(1) (2) (3)
Dependent Variable Plant Manager Autonomy
Workers' Autonomy
Ln(PM Span)
NETWORK -0.111** -0.228 0.020 (0.053) (0.180) (0.054) [-0.023] CAD/CAM 0.091 0.532* 0.156** (0.223) (0.275) (0.076) [0.053]
ERP 0.116** -0.290 0.053 (0.054) (0.177) (0.043) [-0.029] Number of Observations 3,434 874 1,415 Number of Firms 948 534 859 Notes: * = significant at the 10% level, **= significant at the 5% level, ***=significant at the 1% level. Rows correspond to separate regressions based on final most general specifications in Tables 3 - 5. All equations estimated by OLS except Worker autonomy equation which is estimated by probit ML with marginal effects (evaluated at the mean) in square brackets. Standard errors are robust and clustered by firm. The sample includes firms based in France, Germany, Italy, Portugal, Poland, Sweden, the UK and the US (country dummies included). ERP” denotes Enterprise Resource Planning, “NETWORK” denotes the firm has an internal network (leased lines or frame relays) and “CAD/CAM” denotes Computer Assisted Design or Manufacturing software.
55

TABLE A5 – CEO SPAN OF CONTROL
(1) (2) (3) Dependent Variable CEO Span of Control ERP 0.235*** 0.217** (0.086) (0.087) [0.082] [0.075]
NETWORK 0.256*** 0.239*** (0.090) (0.091) [0.089] [0.083]
Ln(Percentage College) 0.103* 0.107* 0.108** (0.055) (0.055) (0.055) [0.036] [0.037] [0.037]
ln(COMPUTERS/Employee) -0.125** -0.130** -0.148** (0.057) (0.058) (0.058) [-0.044] [-0.045] [-0.051]
ln(Firm Employment) 0.288*** 0.276*** 0.278*** (0.073) (0.073) (0.073) [0.100] [0.096] [0.097]
Plant Employment -0.500*** -0.492*** -0.500*** (0.101) (0.101) (0.101) [-0.174] [-0.171] [-0.174] Number of Observations 3,861 3,861 3,861
Number of Firms 1,059 1,059 1,059 Notes: * = significant at the 10% level, **= significant at the 5% level, ***=significant at the 1% level. The dependent variable in all columns is a dummy equal to one if the firm reports more than one production plant. All columns are estimated by probit ML with standard errors in parentheses (robust and clustered by firm). Marginal effects (evaluated at the mean) reported in square brackets. The sample includes firms based in France, Germany, Italy, Portugal, Poland, Sweden, the UK and the US (country dummies included). All columns contain the same controls in Table 3-5 “ERP” denotes Enterprise Resource Planning and “NETWORK” denotes the firm has an internal network system (leased lines or frame relays). The time period covered by the ICT variables is 2001-2006 (year dummies included).
56

TABLE A6 - CONTROLLING FOR CONTINGENT PAY
(1) (2) (3) (4) (5) (6)
Dependent Variable
Plant Manager
Autonomy
Workers' Autonomy
Ln(Plant Manager
Span)
Plant Manager
Autonomy
Workers' Autonomy
Ln(Plant Manager
Span)
ERP 0.115** 0.114** (0.054) (0.054) CAD/CAM 0.555** 0.158** 0.556** 0.156** (0.265) (0.076) (0.274) (0.075) [0.056] [0.053] NETWORK -0.110** -0.221 0.053 -0.109** -0.227 0.048 (0.053) (0.179) (0.043) (0.053) (0.181) (0.042) [-0.022] [-0.021] Bonus as a % of Total Salary 0.478** -0.260 0.086 For typical manager (0.235) (0.727) (0.141) [-0.026] % Salary Increase on Promotion -0.025 0.479 0.168 For a typical manager (0.220) (0.597) (0.131) [0.045] Number of Observations 3,434 874 1,415 3,434 874 1,415 Number of Firms 948 534 859 948 534 859 Notes: * = significant at the 10% level, **= significant at the 5% level, ***=significant at the 1% level. All columns estimated by OLS except columns 2 and 5 which are estimated by probit ML with standard errors in parentheses and marginal effects (evaluated at the mean) in square brackets. Standard errors are robust and clustered by firm in all columns. The sample includes firms based in France, Germany, Italy, Portugal, Poland, Sweden, the UK and the US (country dummies included). All columns include the same controls as Table 3 through 5. “ERP” denotes Enterprise Resource Planning, “NETWORK” denotes the firm has an internal network (leased lines or frame relays) and “CAD/CAM” denotes Computer Assisted Design or Manufacturing software.
57