Embed Size (px)
Citation preview
0270.6474/85/O% l-3047502.00/0 Copyrrght 0 Society for Neuroscience Prrnted rn U.S.A.
The Journal of Neuroscience Vol. 5, No. 11, Pp. 3047-3060
November 1985
The Distribution, Relationships to Other Organelles, and Calcium-sequestering Ability of Smooth Endoplasmic Reticulum in Frog Olfactory Axons’
PAUL Ft. BURTON2 AND LEIGH A. LAVERI
Depaflment of Physiology and Cell Biology and the Center for Biomedical Research, University of Kansas, Lawrence, Kansas 66044
Abstract
Ultrastructural studies of single and serial sections of bull- frog olfactory axons showed that smooth endoplasmic retic- ulum (SER) tubules, which usually appear as single profiles in cross-sections of axons, are continuous over considerable distances, but that discontinuities do exist. Computer-as- sisted three-dimensional reconstruction of portions of axons indicated that the SER tubules show considerable variation in the volume of the cisternal space along the tubule, which often follows a tortuous path. Some branching and anasto- mosing appears to occur, and electron-dense material was present in the cisternal space of some tubules. SER tubules are often bridged to neurofilaments and less often to micro- tubules. The usual two to three microtubules in the axoplasm form a domain which is characterized by a clear area, or zone of exclusion, around the microtubules. Ultrastructural cytochemistry was used to demonstrate that SER tubules actively sequester Ca. The electron-dense product (calcium oxalate) was uniformly and specifically associated with the SER of axons at both proximal (closest to the perikarya in the olfactory epithelium) and distal (closest to the olfactory lobe of the brain) ends of the olfactory nerve. It is concluded that the primary function of SER tubules in these axons is to serve in the regulation of Ca in the axoplasm, probably to facilitate fast axoplasmic transport, and that a secondary function may be the translocation of material in the cisternal space. The observations are discussed as they may relate to the “microstream” hypothesis of axoplasmic transport, and it is argued that fast transport occurs through the zone of exclusion associated with the microtubule domain(s) of axons.
The predominant formed elements of typical vertebrate axons include microtubules, neurofilaments, mitochondria, smooth endo- plasmic reticulum (SER), and, in many instances, various vesicular and vacuolar elements. These components are often seen to be interconnected with one another by a matrix of delicate filaments. Axoplasmic transport of components, from molecules to mitochon- dria, occurs at several rates and in both directions through this mileu. In addition to the axoplasmic matrix space defined by the
Recerved February 11, 1985; Revised April 15, 1985;
Accepted Aprrl 16, 1985
’ This work was supported by Public Health Service Grant GM 24992 and a grant from the University Biomedical Scrence Support Grant Subcommittee. We wash to thank our colleagues, Drs. William Dentler and Daryl Hartter for crrtrcally readrng the manuscript and offering helpful suggestions.
’ To whom correspondence should be sent.
limiting axolemma, two other closed membrane compartments are
always present. One compartment is that which occurs within mitochondria, which is actually a double compartment, and the other is the cisternal space of the SER.
Ducros (1974) examined semi-serial sections of SER in large axons of Octopus nerve and attempted to reconstruct its three- dimensional (3-D) nature. The SER was described as a peripheral tubular network continuous with a more central system of “irregularly anastomosing tubules with varicosities.” It was suggested that the SER might play a role in translocation of metabolites. Earlier, Lieber- man (1971) had described an intimate spatial relationship between SER and microtubules in frog neurons and had theorized that neuronal SER might function as does sarcoplasmic reticulum in sequestering Ca. The high voltage electron microscope was used to examine axons in thick sections of nerves secondarily fixed in the presence of potassium ferrocyanide (after diaminobenzidine incu- bation) to better visualize membrane elements, including axonal SER (Tsukita and Ishikawa, 1976); in this study, the SER was determined to be a continuous network of narrow, longitudinally oriented tubules that anastomosed with each other.
Droz et al. (1975) studied the spatial arrangement of SER in axons of rat spinal and chick ciliary ganglia and concluded that the SER formed a continuous system extending the length of the axon. Furthermore, ultrastructural radioautography provided evidence that labeled proteins might be rapidly translocated in association with SER, even though the location of silver grains made it impossible to determine whether labeled proteins were located within the cisternae or on the surface of the reticulum. Other workers examined the ultrastructure of axons on either side of locally chilled sites along- nerves, with chilling sufficient to block axoplasmic transport. Mem- branous elements accumulated in axons on the proximal side of the chilled sites, and these “vesicotubular” membranes were considered to be SER, or derived from SER (Tsukita and Ishikawa, 1979, 1980).
Using a cytochemical method to localize Ca, with calcium oxalate as an electron-dense product, along with x-ray microanalysis, Hen- kart et al. (1978) provided the first convincing evidence that the SER of axons could sequester Ca. Since then, the pumping and seques- tering of Ca by SER has been confirmed in many kinds of axons (e.g., Duce and Keen, 1978; McGraw et al., 1980; Chan et al., 1984) in perikarya and dendritic spines (Henkart, 1980; Fifkova et al., 1983) and in invertebrate and vertebrate photoreceptors (Walz, 1979, 1982a, b, c; Ungar et al., 1984). The accumulation of Ca by axonal SER is an energy-dependent process, one of several prop- erties shared by SER and the sarcoplasmic reticulum of muscle cells (Walz, 1983).
In terms of translocation of material in association with axonal SER, three obvious possibilities come to mind: (1) material could become linked to the SER membrane and be transported along with membrane flow (conveyer belt hypothesis; see Hammerschlag and
3047
3048 Burton and Laveri Vol. 5, No. 11, Nov. 1985
Stone, 1982); (2) material could gain access to the cisternum, perhaps even in the perikaryon, as a consequence of translation of proteins, and then be translocated through the cisternal space (conduit hypothesis; see Teichberg and Holtzman, 1973; Alonso and Assenmacher, 1979); and, (3) material sequestered in the cisternum could be trapped as cargo in vesicles pinching off the SER, be transported through the axoplasm for a given distance (perhaps along the surface of microtubules), and then fuse with a main SER tubule, returning the material to the cisternal space (shuttle hypothesis; see Tsukita and Ishikawa, 1976).
The literature reflects some uncertainty about whether axonal SER extends from the perikaryon to the axon terminal, and it is obvious that difficulties have arisen in distinguishing SER membranes from other membranous elements in the axoplasm, particularly in large axons. Also, possible associations between SER and other axo- plasmic constituents have not been studied in any detail, and if the SER does serve as a conduit, why is there so little evidence of material in its cisternae? For example, if shuttle vesicles are contin- uously pinching off the main SER tubules for rapid translocation, then emptying their contents back into the cisternal space by membrane fusion, should there not be structural evidence for such activity? Furthermore, since one function of axonal SER is to se- quester Ca, it would be desirable to determine whether there are regional differences in this property along the axon,
Frog olfactory axons are small and structurally uncomplicated; in many respects they are ideal model systems for ultrastructural studies of axons. Cross-sections of these axons show that they contain one, or a few, SER profiles, and that, except for mitochondria, no other membranous elements are normally present in the axo- plasm. In addition to an SER tubule and an occasional mitochondrion, the only other prominent formed elements are a few microtubules (usually two or three) and a variable but small number of neurofila- ments. The structural simplicity of the olfactory axon led us to study its SER in considerable detail, and these studies provide evidence that: (1) the SER is continuous over great distances in the axon, but portions of some axons show no SER profiles at all; (2) the tubule of SER usually follows a tortuous path, often with great variations in its cisternal volume; (3) there is no structural evidence of lateral vesiculation or vesicle fusion and, in fact, vesicles are not usually encountered in these axons; (4) dense material is sometimes seen in the cisternal space; (5) the SER is often bridged to neurofilaments or microtubules, but it seems to be more often associated with the former; and (6) SER of frog olfactory axons sequesters Ca by an ATP-dependent process, and the sequestration of Ca appears uniform along the SER at points proximal and distal to the perikaryon.
Materials and Methods
Adult bullfrogs (Rana catesbeiana) were obtained locally or from com- mercial sources, kept in an amphibian facility at 20°C. and fed regularly. Isolation of olfactory nerve pieces Into proximal and distal pieces, with reference to the perikarya in the olfactory epithelium, has been described and rllustrated elsewhere (Burton, 1984). A number of fixatrves were used, including 2.5% glutaraldehyde buffered with 0.1 M cacodylate at pH 7.2 to 7.4. Most of the material used in this study, however, was fixed in 2% glutaraldehyde in 0.1 M PIPES buffer (pH 6.9) containing 10 mM EGTA, 2 mM MgCI*, and 0.5 mM guanosine 5’.tnphosphate. Fixation was usually for 1 hr at room temperature with continuous agitatron. Thereafter material was secondarily fixed in 1% osmium tetroxide buffered with 0.1 M cacodylate (pH 7.2 to 7.4) processed with or wrthout staining In 2% aqueous uranyl acetate for 30 to 60 min, dehydrated in acetone, and embedded in Araldite 502 resrn.
Silver to gray sectrons were obtained with a diamond knrfe, picked up on 400 mesh grids, and typically stained with methanolic-ethanolic uranyl acetate and lead citrate (10 min and 5 min, respectively; see Kim et al., 1979). Sections were examined in a Philips 300 transmission electron microscope. Serial sections were obtained using a simple micromanipulator as a “third hand,” following the methods described in detail by Rieder (1981). Ribbons of 10 to 20 wrinkle-free sections of uniform appearance were picked up on Formvar- and carbon-coated grids with 0.4 x 2 mm slots, then stained with aqueous uranyl acetate and lead citrate in a conventional manner.
Serial cross-sections of axons were used to obtain computer-assisted 3- D reconstructions of axoplasmic constituents, including SER; the serial sectrons were estimated to be 70 nm thick. Serial mrcrographs of groups of axons were obtained at magnrficatrons of x 54,000, and subgroups of axons were selected and enlarged five times to provide a final print magnification of x 270,000. Cross-sectional profiles of axoplasmic components were then sequentially digitized and the tracings stored in the memory of an IBM personal computer with 256K RAM interfaced with a TallGrass 12.5 Mb Winchester hard disk. Using an image reconstruction program written for the University of Kansas, profiles of axoplasmic elements could be displayed on a monitor in different colors in a stacked configuration (i.e., in register). Furthermore, the stacked images could be rotated in space to provide various perspective views, with any or all of the structures digitized displayed on the screen. When a particular perspective view was found to be inform- ative, the composite image was plotted, or reconstructed, in color using an Hewlett Packard 7470A plotter. For stereoscopic viewing In true 3-D, two views of a given composite reconstruction were plotted rotated (tilted) by 5” with respect to each other. The stereoscopic pairs are mounted such that they can be viewed using an Abrams CF-8 stereoscopic viewer or by rndividuals experienced in crosstng the eyes to provide fusion of the two sets of images. Further details on the 3-D reconstructions will be provided in the text as appropriate, and the methods and computer program used are described in detail elsewhere (Burton, 1985).
The cytochemical methods of Walz (1979, 1982a) were used to localize Ca sequestered by SER, with the methods modified from those originally described by Heumann and Zebe (1967). Essentially, the approach involved brief incubation of fresh nerve pieces in a lysis medium containing saponin (500 pg/ml), which selectively permeabilizes cholesterol-rich plasma mem- branes but not endomembranes such as SER within the incubation time used. Material was then incubated in a loading medium containing ATP and potassium oxalate (at a calculated 0.85 PM Ca), and membrane compart ments competent to actively sequester Ca at this concentration accumulated the ion. Under these conditions, the level of Ca in the compartment rises to the cntrcal concentration required to complex with oxalate, forming electron- dense calcium oxalate which remains at or near the site of its formation. Thereafter, nerve pieces were fixed and prepared for electron microscopy.
Pieces of the proximal (to the perikarya) and distal (closest to the olfactory lobe of the brain) olfactory nerve were incubated in lysis medium for 15 min at room temperature and then transferred to loading medium and incubated at room temperature (or at 0 to 4°C with no apparent difference) for 60 min. Thereafter, samples were fixed in 2.5% glutaraldehyde in 0.1 M cacodylate buffer (pH 7.2 to 7.3) containing 40 mM potassium oxalate; fixation was at 0 to 4°C for 60 min. Material was rinsed in buffer containing 40 mM potassium oxalate and fixed for 60 min at room temperature in 1% osmium tetroxide buffered with 0.1 M cacodylate, also containing potassium oxalate. Nerve pieces were then dehydrated in an acetone series and embedded in Araldite 502 resin. Sections were examined unstained and were obtarned using 10% ethanol in the knrfe trough to which was added 40 mM potassium oxalate. Upon picking up ribbons on 400 mesh uncoated grids, the grids were allowed to dry and then were gently rinsed with distilled water to remove any excess oxalate from the surface of the sections. For control material, nerve pieces were permeabilrzed and incubated without ATP, in the presence of 1 mg/ml of apyrase to inhibit ATP actrvrty, or in the absence of potassium oxalate.
Results
Typical olfactory axons of the frog are shown in cross-section in Figure 1. Their diameter usually falls in the 0.1. to 0.3~Frn range and their most prominent feature is their small size; the most prominent organelles in the axoplasm are microtubules (usually two or three in number), one or more profiles of SER (usually one is seen), a variable number of neurofilaments, and an occasional mitochondrial profile. Often the neurofilaments occur in a discrete group, as in the two axons in Figure 1, and lateral bridges between their roughly circular profiles are often evident, as between two pairs of neurofilaments in the lower axon. The microtubules also often appear to occupy a defined area of the axoplasm. The third obvious profile in most cross-sections is that of SER, which is highly variable in its shape and size, the latter quality reflecting the luminal (cisternal) volume of the compartment. The irregularly shaped SER profiles appear to be more often associated with neurofilaments than with microtubules.
In favorable axonal cross-sections, the filamentous nature of the axoplasmic matrix is evident, as shown in the lower axon in Figure
The Journal of Neuroscience Smooth Endoplasmic Reticulum of Frog Olfactory Axons 3049
contour of the axolemma. At the left end the SER is associated with a neurofilament, which has the characteristic “pipe cleaner” appear- ance with many lateral filaments extending from its surface. At the lower left in Figure 2 the neurofilament is linked (Fig. 2, arrow) to another tubule of SER seen in tangential section.
Figures 3 to 5 all show portions of single axons in longitudinal section. Wispy filaments can be seen extending from the surface of the SER in Figure 3 (arrows), and at the top, some of these filaments link the SER to the axolemma. At the top of Figure 4, two neurofila- ments are seen to be interconnected by bridges, and the lower neurofilament is also clearly linked to the SER. The blind end of an SER tubule is shown at the right in Figure 5 (arrow), and the great variation in the dimensions of the cisternal space (Fig. 5, x) is well illustrated. A neurofilament is closely associated with the upper surface of the SER profile.
It is not uncommon to see material in the cisternae of SER, as shown in Figures 6 to 11. Sometimes the material appears as a small, compact mass centrally located in the cisternum (Figs. 6 and 7). In other cases the cisternal material is more amorphous (Figs. 8 to 11). Filamentous elements are seen to be associated with the surface of SER profiles in Figures 6 and 7 (arrows), and Figure 11 (open arrowheads to the right); two profiles of SER are seen in Figure 11 (arrows), only one of which shows cisternal material. Infrequently, SER will contain large, dense masses of material, as shown in Figure 15, where serial sections of an axon were obtained. In this axon, the SER was observed to branch and anastomose, as will be discussed later, but one of the profiles in the series contains a mass of electron-dense material which appears to be roughly spherical. Even though some material is seen in SER profiles in Figure 15, f and g, the primary mass is seen in Figure 15, j to m, where it appears to have a large dense core limited by what may be one or more trilaminar membranes (Fig. 15, k and I).
To obtain additional information on the 3-D path of SER through Figure 1. Frog olfactory axons seen In cross-sectlon. In the lower axon, the axoplasm, up to 20 serial sections were obtained of many axons.
two proftles of smooth endoplasmlc reticulum (ser) can be seen A mlto- chondnal (m/t) profile IS apparent, along with three microtubules (mt) and
Figure 12 shows such a series, in which the SER (open arrowhead)
six neurofllaments (nf). Wispy axoplasmic matrix (mat) filaments are mainly is seen to follow a fairly straight path through the series and remains
associated with the SER, mitochondnal, and neurofllament profiles; filaments in a given axoplasmic area, although the shape and dimensions of
extend from the lower surface of the mitochondnon (arrow) to connect it to the SER profiles vary somewhat from section to section. In this
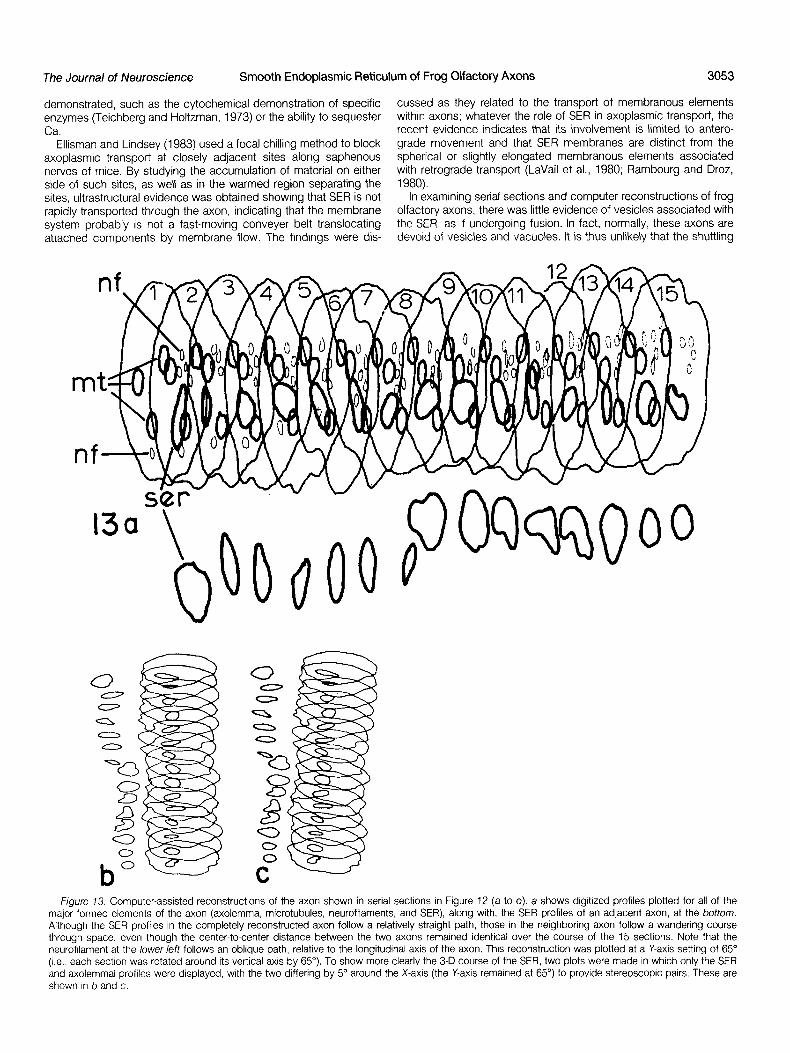
the inner surface of the axolemma (axol). Note the close association between series, there is an obvious association between the SER and neu- the SER profile at the lower leti and the SIX neurofllaments; two pairs of the rofilaments. To further visualize the SER in this axon in three dimen- neurofllamentsare bridged together. In the axon at the top, the neurofilaments sions, axoplasmic components were digitized and then subjected occur as a group enmeshed in a vague matrix network, with the SER profile to computer-assisted reconstruction (Fig. 13). Figure 13a shows the nearby Magnification x 264,000; bar = 0.05 pm. complete reconstruction of the axon for 15 sections (representing
approximately 1 pm of axon length), along with the profiles of SER
1. In this axon, the matrix is most evident in its association with SER, from an adjacent axon which were also digitized. The profiles are turned on edge vertically, or rotated 65” (i.e., each slice or profile is
neurofilaments, and the mitochondrion, where filaments can be seen turned 65” around its Y-axis), and displayed in a series with the (Fig. I, arrow) connecting the outer mitochondrial membrane to the distance separating the profiles (sections) selected as appropriate. inner surface of the axolemma (Fig. 1, axol). Often an irregular Note that the SER of the adjacent (lower) axon follows a more meshwork of matrix filaments is associated with an SER-neurofila- wandering path than the one at the top. In the complete reconstruc- ment complex. In contrast, as shown in Figure 1, a filamentous tion at the top, however, it is difficult to follow the profiles of SER matrix is often absent around microtubule profiles, and it appears because of overlapping profiles of other structures. To better delin- that the microtubules and the empty-appearing area around them eate the 3-D paths of the SER in the two axons, only the SER and comprise another axoplasmic domain. axolemma were selected for display, and in this instance stereo-
Studies of longitudinal profiles show that the SER extends unin- scopic pairs were plotted (again the profiles were rotated 65” around terrupted for considerable distances within olfactory axons. In the the Y-axes, but the two plots differed by a 5” rotation in the X-axis). axon at the fop of Figure 2, a tubule of SER can be seen extending This allows the viewer to visualize the separated profiles in true 3-D across the micrograph; at the left (Fig. 2, arrow), the SER tubule is space (Fig. 13, b and c). Clearly, the SER in the upper axon follows linked to one of the two microtubules in the axon, and along its a relatively straight path whereas that of the lower axon is more lower surface it is bridged to the axolemma by matrix material. In wandering. this same axon, the matrix-free channels along the microtubules can Serial sections of three olfactory axons are shown in Figure 14. A be clearly seen, even though at several points the upper microtubule number of observations can be made based on this series. In the is bridged to the axolemma (Fig. 2, top arrow), and a bridge or two axon at the top, the SER profiles (open arrowheads) follow a relatively can also be seen between the microtubules themselves. Studies of straight path through the axoplasm, even though the shapes of the microtubules in longitudinal views of axons indicate that they are profiles are somewhat variable from section to section. Again it is relatively straight structures. In the axon at the bottom of Figure 2, obvious that the SER IS more closely associated with neurofilaments the SER shows an apparent blind end at the left and a region where than with microtubules, and that an electron-lucent area can be the cisternal space (Fig. 2, cist) is greatly expanded and follows the delineated around the microtubule profiles. By following the three
Burton and Laveri Vol. 5, No. 11, Nov. 1985
Figures 2 to 5. Longrtudrnal views of olfactory axons, A portron of an axon IS shown at the top in Figure 2 in whrch an SER tubule and two mrcrotubules (mt) can be seen. A clear zone, or zone of exclusion, is clearly seen around the microtubules. Occasional bridges are seen between the microtubules themselves or between the mrcrotubules and the axolemma (top arrow) or the SER tubule (lower arrow). The SER tubule extends across the mrcrograph and Its Irregular or wavy profile can be clearly seen. The lower aspect of the SER tubule IS bridged to the inner surface of the axolemma (axol) by numerous matrix filaments. At the bottom of Figure 2 a portion of another axon IS seen. Two SER tubules are present, one at the upper right which apparently terminates to the left, and another tubule whrch IS sectioned tangentially and appears as a dense region under the number 2 at the lower left. The upper SER profile shows a dilated region where the area of the cisternum (cist) IS greatly increased. A neurofilament (nr) can be seen at the left which IS extensively bridged to the SER (lower left arrow). Figure 3 shows part of an SER profile with numerous lateral filaments (arrows) extending from Its surface; a mrcrotubule (mt) IS shown at the bottom. The upper matrix filaments appear to bridge the SER to the axolemma at the top. Figure 4 shows a portron of an axon with two interconnected neurofrlaments (nr); the lower neurofrlament IS bridged at two points to the SER tubule. In Figure 5, a single neurofrlament (nf) IS seen at the top of the axon In assocration with a tubule of SER which terminates blindly at the right (arrow). Note that the neurofrlament appears to be connected to the axolemma at the top by numerous matrix filaments and that the cisternal space (x) of the SER IS clearly seen. Two mrcrotubules (mt) are evident, and the upper microtubule may be brrdged to the SER tubule. Magnrfications: Figure 2, x 352,000; Frgures 3 and 5, x 276,000; Figure 4, x 324,000. Bars = 0.05 pm.
neurofilaments to the left of the SER from section to section, it can be seen that the middle neurofilament changes its position in space.
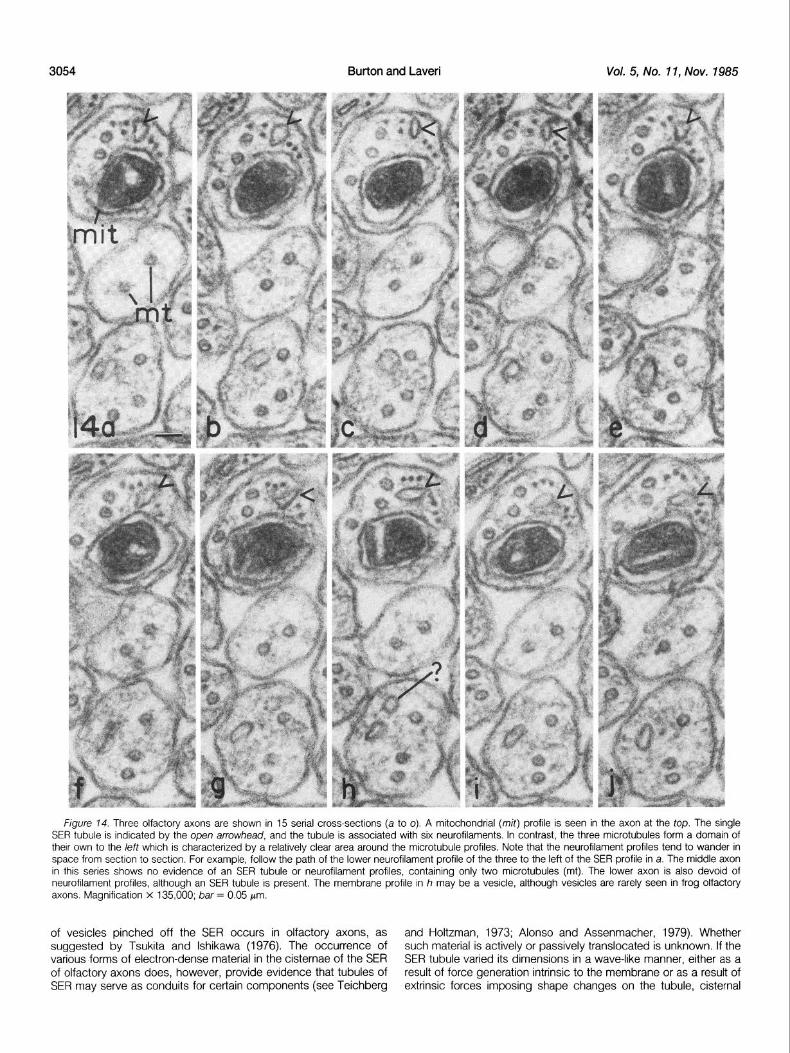
Generally, neurofilaments follow a more wandering path through space than do the microtubules, which tend to be relatively straight (Fig. 13~1). Not all axon cross-sections show profiles of SER; in the
middle axon in Figure 14 (a to o), there is no evidence of SER profiles in the sections, nor do neurofilaments appear to be present. This indicates that both organelles may be discontinuous along the length of axons. Although SER and microtubules are seen in the
bottom axon of this series, there is no evidence of neurofilaments. In examining many series of 10 to 20 serial sections of olfactory
axons, neurofilaments are often seen to be absent from given axons, or sometimes are discontinuous, whereas only a few axons are seen
to be devoid of SER profiles in the series. Rarely are axons ever found to be devoid of mrcrotubule profiles.
Although a single profile of SER is typically seen in an axon, it is
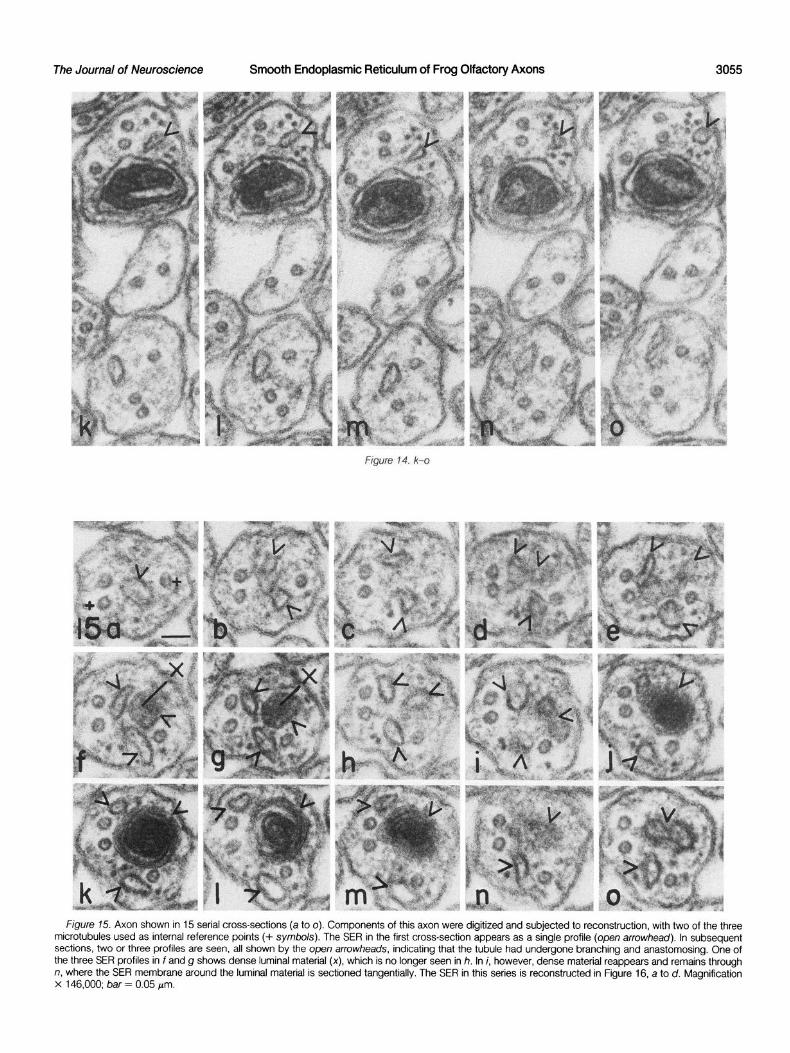
not uncommon to see an axon with two or more profiles (Figs. 1, 2, and 11). Serial sectioning and computer-assisted reconstruction of such axons indicate that SER tubules may branch and anastomose,
often in a complex manner, as shown In Figure 15. In the first section of this series, a single profile of SER is seen (Fig. I!%, open arrowhead). In the next section (Fig. 15b, open arrowheads), two
The Journal of Neuroscience Smooth Endopiasmic Reticulum of Frog Olfactory Axons 3051
profiles are seen to be connected by a tangentially sectioned membrane. Thereafter, two distinct profiles appear, followed by three profiles in Figure 15, d to i. In Figure 15, f and g, one of the three profiles shows dense material in the SER cisternurn (X in Fig. 15, f and g). Further along, the three profiles are replaced by only two in Figure 15j, and then the third SER profile reappears with a large dense mass in its cisternal space (Fig. 15, k to m), which disappears in Figure 15n, along with one of the SER profiles. Finally, in the 15th and last section in this series, only two profiles of SER are seen, one having a dumbbell-shaped outline (top profile in Fig. 150). Obviously, the SER in this stretch of axon is in the form of a tubular network of sorts, and only by studying serial sections can one begin to appreciate the 3-D nature of the network.
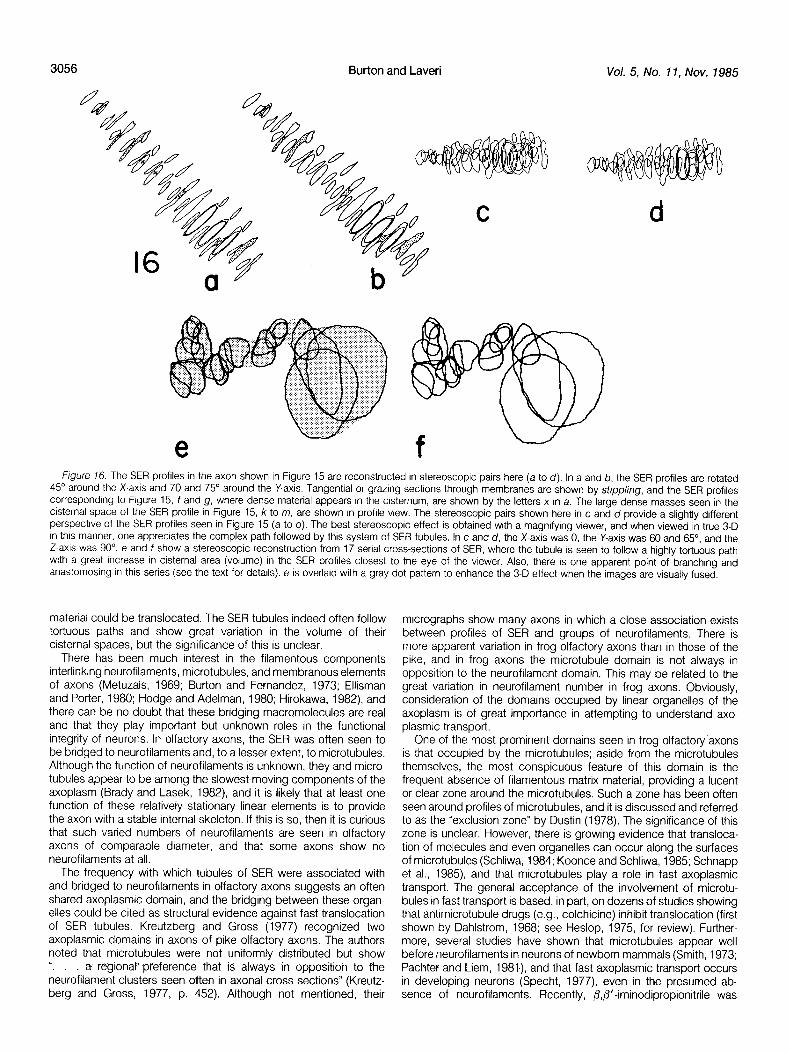
In order to better visualize the distribution in space of the SER profiles in the series shown in Figure 15, the profiles were digitized and subjected to computer-assisted reconstruction. Stereoscopic pairs of the profiles were plotted, and these are shown in Figure 16, a and b, and Figure 16, c and d; the stippled regions of the profiles in Figure 16, a and b, represent tangential sections through SER membranes. The two small x symbols in sections 6 and 7 (counting from leti to right) in Figure 16a represent the cisternal spaces where dense material was seen in Figure 15, f and g, and the large and dense cisternal masses seen in this series are outlined in recon- structed profiles representing sections 11, 12, and 13. The recon- structions in Figure 16, a and b, were both plotted with an X-axis
rotation of 45’, and the Y-axes were rotated at 70 and 75’ to provide the 5” difference required for a stereoscopic effect. Figure 16, c and d, show these same digrtized profiles in a different perspective; again, stereoscoprc images were plotted, but in thus case the X-axis was 0, the Z-axis rotatron was 90” in both cases, and the Y-axes differed by 5” In their rotation (60 and 65”). Obviously, stereoscoprc views of reconstructed SER profrles are valuable in providing a better understanding of the 3-D arrangement of the SER seen in Figure 15. Figure 16, e and f, provides a stereoscopic view of SER profiles in a set of 17 serial sections, where the SER follows a particularly wandering path through space and also varies greatly in the dimen- sions of Its crsternal space from one section to the next. In section 4 in this series (beginning with that section farthest from the viewer), there are two profiles, indicating branching of the SER, but by section 5 the two tubular branches have apparently fused, since only a single profile is seen in the series from this point in space toward the viewer. Note that the SER cisternurn is greatly expanded as profiles 14 to 17 appear in space closer to the viewer. The stereoscopic pairs were generated by rotating around the Y-axis at 25“ (Fig. 16e) and 20” (Fig. 16f).
It was determined In preliminary studies that SER tubules of olfactory axons were posrtively stained when secondarily fixed in osmium tetroxide ferricyanide, a method used by others to identify SER in a variety of cell types, including sarcoplasmic reticulum (Forbes et al., 1977; Schnepf et al., 1982; Walz, 1982a). Since the
Figures 6 to 17. Cross-sections of axons showing dense material in the cisternal spaces of SER. Figure 6 shows a small mass of material in the cisternum; filaments are seen extending from the surface of the SER. Figure 7 also shows a small, compact mass (arrow) in the cisternum of an SER tubule. Figure 8 shows a somewhat larger mass (arrow) in an SER lumen, but the mass is rather amorphous. Figure 9 shows an SER tubule in which the cisternum is filled with dense material; filaments can be seen (arrows) extending from the surface of the tubule. The SER tubule in Figure 10 shows a mass of material (arrow) in its cisternal space; note the close association between neurofilaments and the SER tubule. Figure 11 shows two profiles of SER (arrows), with the larger SER tubule containing loosely distributed amorphous material. Matrix filaments are associated with the surface of the larger tubule (open arrowheads at the right). Magnifications: Figures 6, 7, and 11, X 237,000; Figure 8, X 276,000; Figure 9, X 243,000; Figure 10, X 265,000. Figure 10 was provided by Dr. Daryl Hartter. Bars = 0.05 pm.
3052 Burton and Laveri Vol. 5, No. 11, Nov. 1985
F/gure 72. Axon shown In 15 serral cross-sectrons (a to 0). The SER profrle IS shown by the open arrowheads; note that the profrle IS closely associated wrth a cluster of four neurofrlaments. In drgitrzrng this series for computer-assisted reconstruction, the two microtubules shown by the + symbol were used as the two internal reference points, since rnrtral rnspectron of the serves indicated that their relative posrtrons in space remarned the same throughout (i.e., they appeared straight). Note the changes in shape of the SER profile from mrcrograph to mrcrograph The reconstruction of thus stretch of axon IS shown in Frgure 13a and represents a total estimated length of slightly over 1 pm. Magnifrcatron x 146,000, bar = 0.05 pm.
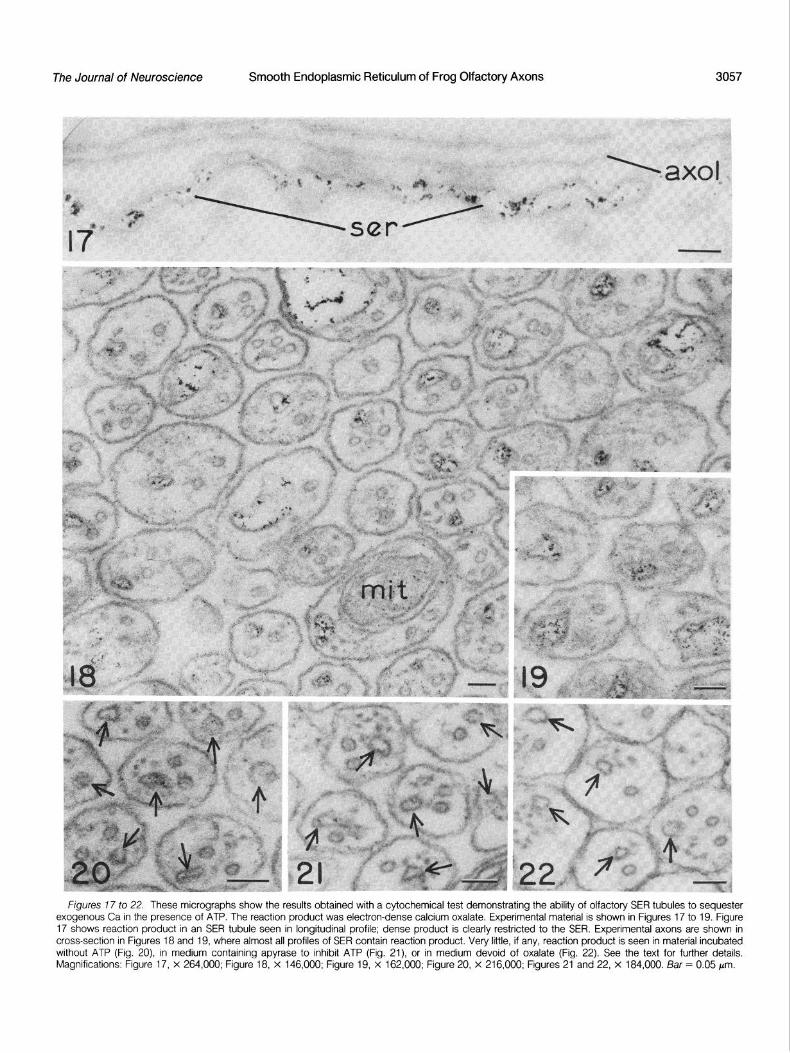
Ca-sequestering ability of sarcoplasmic reticulum is well known, and since Walz (1979, 1982a) amply demonstrated the ability of SER in insect photoreceptor cells to sequester Ca, his methods were employed in attempting to demonstrate the active pumping of Ca by SER of frog olfactory axons. As shown in Figures 17 to 22, the results were positive. Pieces of olfactory nerve were briefly incubated in medium containing saponin to permeabilize axons and then were incubated in the presence of ATP, oxalate, and micromolar levels of Ca; material thereafter fixed, sectioned, and examined with the electron microscope showed the electron-dense calcium oxalate specifically associated with SER profiles.
A longitudinal profile of SER from an axon in an experimental nerve piece is shown in Figure 17, where the reaction product (calcium oxalate) is seen to be rather uniformly distributed in the cisternal space. If samples were incubated in medium devoid of ATP (5 mm), little if any product was seen to be associated with SER profiles (Fig. 20). Likewise, very little product was seen if nerve pieces were permeabilized and then incubated in medium containing apyrase, to inhibit ATP, or in medium devoid of oxalate (Figs. 21 and 22). In cross-sections of experimental axons, the delicate but very obvious reaction product was usually specifically associated with SER profiles (Figs. 18 and 19) where it appeared either within the cisternal space or along the SER membrane. Mitochondria rarely showed evidence of calcium oxalate, indicating that at the low concentration of Ca used the organelles sequestered little if any of the ion. The specificity of the reaction product was often striking in unstained cross-sections of axons, where electron-dense material was associated with almost all of the SER profiles (Figs. 18 and 19). With the cytochemical methods used, no differences were noted
between the distribution of reaction product in proximal or distal portions of axons in the olfactory nerve, with reference to their perikarya in the olfactory eprthelium of the frog.
Discussion
Even though it IS possible that in some neurons the SER forms a continuous unrnterrupted network from the perikaryon to its axonal termrnals, this is clearly not the case in frog olfactory neurons. In olfactory axons the SER is continuous over great distances, but it IS
nonetheless a discontinuous system, as shown by studying and reconstructrng serial sections in 3-D space. The longitudinal conti- nuity of SER was earlier questioned on the basis of studies of pike olfactory axons, where It was reported that SER profiles could not be found in 14% of the axon cross-sections examined (Kreutzberg and Gross, 1977). Unless serial sections were studied, however, it might be easy to overlook SER profiles in such small axons in a given section when the membrane was cut tangentially, especially at relatively low magnifications.
The possibilrty that SER serves as a vector or is a conduit for fast axoplasmic transport is an interesting hypothesis that has not been confirmed in recent studies. The association of rapidly transported protein with SER profiles, as reported by Droz et al. (1975) is difficult to explain. The rapid accumulation of “vesiculotubular” elements in axons on the proximal side of a cold block, as reported by Tsukita and lshrkawa (1979, 1980) is not sufficient to implicate SER as a rapidly transported membrane compartment. Considering that most axons contain, in addition to SER membranes, various kinds of vesicles and vacuoles, it would be difficult to identify SER mem- branes with certainty unless a characteristic property could be
The Journal of Neuroscience Smooth Endoplasmic Reticulum of Frog Olfactory Axons 3053
demonstrated, such as the cytochemical demonstration of specific enzymes (Teichberg and Holtzman, 1973) or the ability to sequester Ca.
Ellisman and Lindsey (1983) used a focal chilling method to block axoplasmic transport at closely adjacent sites along saphenous nerves of mice. By studying the accumulation of material on either side of such sites, as well as in the warmed region separating the sites, ultrastructural evidence was obtained showing that SER is not rapidly transported through the axon, indicating that the membrane system probably is not a fast-moving conveyer belt translocating attached components by membrane flow. The findings were dis-
cussed as they related to the transport of membranous elements within axons; whatever the role of SER in axoplasmic transport, the recent evidence indicates that its involvement is limited to antero- grade movement and that SER membranes are distinct from the spherical or slightly elongated membranous elements associated with retrograde transport (LaVail et al., 1980; Rambourg and Droz, 1980).
In examining serial sections and computer reconstructions of frog olfactory axons, there was little evidence of vesicles associated with the SER, as if undergoing fusion. In fact, normally, these axons are devoid of vesicles and vacuoles. It is thus unlikely that the shuttling
Figure 73. Computer-assisted reconstructions of the axon shown in serial sections in Figure 12 (a to 0). a shows digltlzed profiles plotted for all of the major formed elements of the axon (axolemma, microtubules, neurofilaments, and SER), along with, the SER profiles of an adlacent axon, at the bottom. Although the SER profiles In the completely reconstructed axon follow a relatively straight path, those in the neighboring axon follow a wandering course through space, even though the center-to-center distance between the two axons remained identical over the course of the 15 sections. Note that the neurofilament at the lower left follows an oblique path, relative to the longitudinal axis of the axon. This reconstruction was plotted at a Y-axis setting of 65” (I.e., each sectjon was rotated around its vertical axis by 65”). To show more clearly the 3-D course of the SER, two plots were made in which only the SER and axolemmal profiles were displayed, with the two differing by 5” around the X-axis (the Y-axis remained at 65”) to provide stereoscopic pairs. These are shown in b and c.
Burton and Laveri Vol. 5, No. 11, Nov. 1985
r
Figure 74. Three olfactory axons are shown in 15 serial cross-sections (a to 0). A mitochondrial (mit) profile is seen in the axon at the top. The single SER tubule is indicated by the open arrowhead, and the tubule is associated with six neurofilaments. In contrast, the three microtubules form a domain of their own to the left which is characterized by a relatively clear area around the microtubule profiles. Note that the neurofilament profiles tend to wander in space from section to section. For example, follow the path of the lower neurofilament profile of the three to the left of the SER profile in a. The middle axon in this series shows no evidence of an SER tubule or neurofilament profiles, containing only two microtubules (mt). The lower axon is also devoid of neurofilament profiles, although an SER tubule is present. The membrane profile in h may be a vesicle, although vesicles are rarely seen in frog olfactory axons. Magnification x 135,000; bar = 0.05 Wm.
of vesicles pinched off the SER occurs in olfactory axons, as and Holtzman, 1973; Alonso and Assenmacher, 1979). Whether suggested by Tsukita and lshikawa (1976). The occurrence of such material is actively or passively translocated is unknown. If the various -forms of electron-dense material in the cisternae of the SER SER tubule varied its dimensions in a wave-like manner, either as a of olfactory axons does, however, provide evidence that tubules of result of force generation intrinsic to the membrane or as a result of SER may serve as conduits for certain components (see Teichberg extrinsic forces imposing shape changes on the tubule, cisternal
The Journal of Neuroscience Smooth Endoplasmic Reticulum of Frog Olfactory Axons
FIgwe 14. k-o
Figure 75. Axon shown in 15 serial cross-sections (a to 0). Components of this axon were digitized and subjected to reconstruction, with two of the three microtubules used as internal reference points (+ symbols). The SER in the first cross-section appears as a single profile (open arrowhead). In subsequent sections, two or three profiles are seen, all shown by the open arrowheads, indicating that,the tubule had undergone branching and anastomosing. One of the three SER profiles in f and g shows dense luminal material (x), which is no longer seen in h. In i, however, dense material reappears and remains through n, where the SER membrane around the luminal material is sectioned tangentially. The SER in this series is reconstructed in Figure 16, a to d. Magnification x 146,000; bar = 0.05 pm.
3056 Burton and Laveri Vol. 5, No. 11, Nov. 1985
d
e Figure 76. The SER profiles in the axon shown In Figure 15 are reconstructed in stereoscopic pairs here (a to d). In a and b. the SER profiles are rotated
45” around the X-axis and 70 and 75” around the Y-axis. Tangential or grazing sections through membranes are shown by stippling, and the SER profiles corresponding to Figure 15, f and g, where dense material appears in the cisternum, are shown by the letters x in a. The large dense masses seen in the cisternal space of the SER profrle in Figure 15, k to m, are shown In profile view. The stereoscopic pairs shown here in c and d provide a slightly different perspective of the SER profiles seen in Figure 15 (a to 0). The best stereoscopic effect is obtained wrth a magnifying viewer, and when viewed in true 3-D in thus manner, one appreciates the complex path followed by this system of SER tubules. In c and d, the X-axis was 0, the Y-axis was 60 and 65”, and the Z-axis was 90”. e and f show a stereoscopic reconstruction from 17 serial cross-sections of SER, where the tubule IS seen to follow a highly tortuous path with a great increase in cisternal area (volume) In the SER profiles closest to the eye of the viewer. Also, there IS one apparent point of branching and anastomosing in this series (see the text for details). e is overlaid with a gray dot pattern to enhance the 3-D effect when the images are visually fused.
material could be translocated. The SER tubules indeed often follow tortuous paths and show great variation in the volume of their
cisternal spaces, but the significance of this is unclear. There has been much interest in the filamentous components
interlinking neurofilaments, microtubules, and membranous elements
of axons (Metuzals, 1969; Burton and Fernandez, 1973; Ellisman and Porter, 1980; Hodge and Adelman, 1980; Hirokawa, 1982) and there can be no doubt that these bridging macromolecules are real
and that they play important but unknown roles in the functional integrity of neurons. In olfactory axons, the SER was often seen to be bridged to neurofilaments and, to a lesser extent, to microtubules.
Although the function of neurofilaments is unknown, they and micro- tubules appear to be among the slowest-moving components of the axoplasm (Brady and Lasek, 1982) and it is likely that at least one function of these relatively stationary linear elements is to provide
the axon with a stable internal skeleton. If this is so, then it is curious that such varied numbers of neurofilaments are seen in olfactory axons of comparable diameter, and that some axons show no neurofilaments at all.
The frequency with which tubules of SER were associated with and bridged to neurofilaments in olfactory axons suggests an often shared axoplasmic domain, and the bridging between these organ-
elles could be cited as structural evidence against fast translocation of SER tubules. Kreutzberg and Gross (1977) recognized two axoplasmic domains in axons of pike olfactory axons. The authors noted that microtubules were not uniformly distributed but show I‘
a regional- preference that is always in opposition to the neurofilament clusters seen often in axonal cross sections” (Kreutz-
berg and Gross, 1977, p. 452). Although not mentioned, their
micrographs show many axons in which a close association exists between profiles of SER and groups of neurofilaments. There is
more apparent variation in frog olfactory axons than in those of the pike, and in frog axons the microtubule domain is not always in opposition to the neurofilament domain. This may be related to the
great variation in neurofilament number in frog axons. Obviously, consideration of the domains occupied by linear organelles of the axoplasm is of great importance in attempting to understand axo-
plasmic transport. One of the most prominent domains seen in frog olfactory axons
is that occupied by the microtubules; aside from the microtubules themselves, the most conspicuous feature of this domain is the frequent absence of filamentous matrix material, providing a lucent
or clear zone around the microtubules. Such a zone has been often seen around profiles of microtubules, and it is discussed and referred to as the “exclusion zone” by Dustin (1978). The significance of this zone is unclear. However, there is growing evidence that transloca-
tion of molecules and even organelles can occur along the surfaces of microtubules (Schliwa, 1984; Koonce and Schliwa, 1985; Schnapp et al., 1985) and that microtubules play a role in fast axoplasmic
transport. The general acceptance of the involvement of microtu- bules in fast transport is based, in part, on dozens of studies showing that antimicrotubule drugs (e.g., colchicine) inhibit translocation (first shown by Dahlstrom, 1968; see Heslop, 1975, for review). Further-
more, several studies have shown that microtubules appear well before neurofilaments in neurons of newborn mammals (Smith, 1973; Pachter and Liem, 1981,) and that fast axoplasmic transport occurs in developing neurons (Specht, 1977) even in the presumed ab-
sence of neurofilaments. Recently, @,P’-iminodipropionitrile was
The Journal of Neuroscience Smooth Endoplasmic Reticulum of Frog Olfactory Axons 3057
Figures 7 7 to 22. These micrographs show the results obtained with a cytochemical test demonstrating the ability of olfactory SER tubules to sequester exogenous Ca in the presence of ATP. The reaction product was electron-dense calcium oxalate. Experimental material is shown in Figures 17 to 19. Figure 17 shows reaction product in an SER tubule seen in longitudinal profile; dense product is clearly restricted to the SER. Experimental axons are shown in cross-section in Figures 18 and 19, where almost all profiles of SER contain reaction product. Very little, if any, reaction product is seen in material incubated without ATP (Fig. 20) in medium containing apyrase to inhibit ATP (Fig. 21) or in medium devoid of oxalate (Fig. 22). See the text for further details. Magnifications: Figure 17, x 264,000; Figure 18, x 146,000; Figure 19, x 162,000; Figure 20, x 216,000; Figures 21 and 22, x 184,000. Bar = 0.05 pm.
3058 Burton and Laveri Vol. 5, No. 11, Nov. 1985
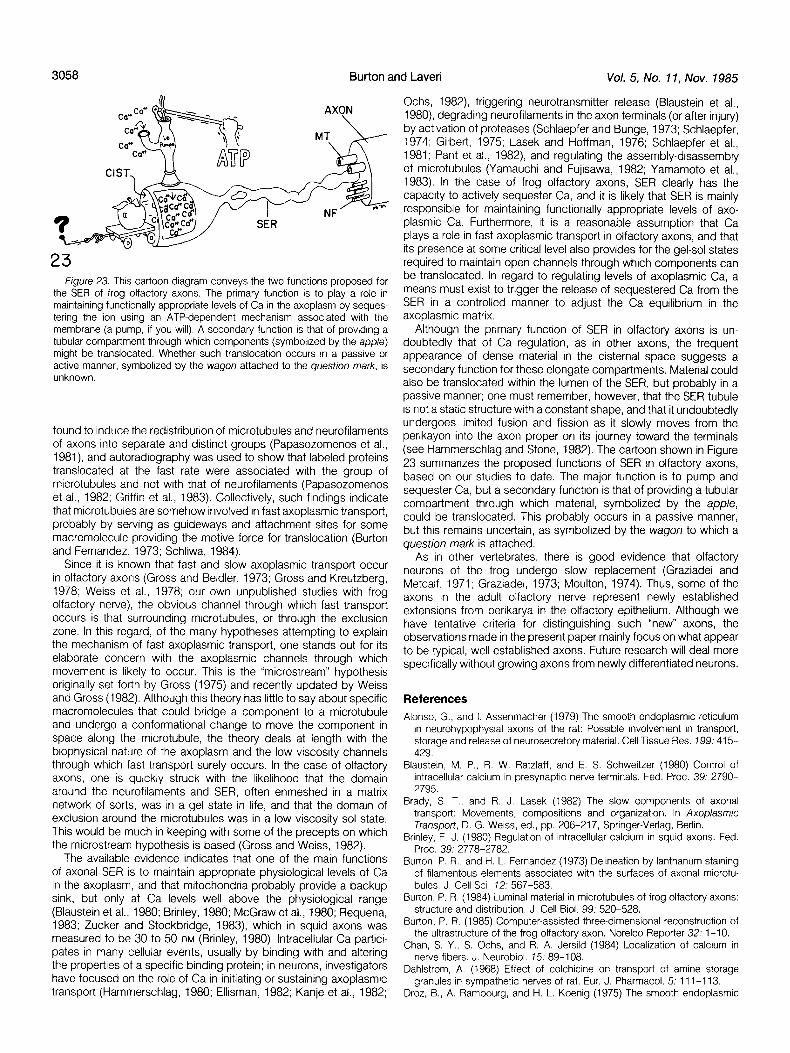
23 Figure 23. This cartoon diagram conveys the two functrons proposed for
the SER of frog olfactory axons. The prrmary function is to play a role In marntatning functionally appropriate levels of Ca in the axoplasm by seques- tering the ion using an ATP-dependent mechanism associated with the membrane (a pump, if you will). A secondary function is that of providing a tubular compartment through which components (symbolized by the apple) might be translocated. Whether such translocation occurs In a passive or active manner, symbolrzed by the wagon attached to the question mark, is unknown.
found to induce the redistribution of microtubules and neurofilaments of axons into separate and distinct groups (Papasozomenos et al., 1981) and autoradiography was used to show that labeled proteins translocated at the fast rate were associated with the group of microtubules and not with that of neurofilaments (Papasozomenos et al., 1982; Griffin et al., 1983). Collectively, such frndings indicate that microtubules are somehow involved in fast axoplasmic transport, probably by serving as guideways and attachment sites for some macromolecule providing the motive force for translocation (Burton and Fernandez, 1973; Schliwa, 1984).
Since it is known that fast and slow axoplasmic transport occur in olfactory axons (Gross and Beidler, 1973; Gross and Kreutzberg, 1978; Weiss et al., 1978; our own unpublished studies with frog olfactory nerve), the obvious channel through which fast transport occurs is that surrounding mrcrotubules, or through the exclusion zone. In this regard, of the many hypotheses attempting to explain the mechanism of fast axoplasmic transport, one stands out for its elaborate concern with the axoplasmic channels through which movement is likely to occur. This is the “microstream” hypothesis originally set forth by Gross (1975) and recently updated by Weiss and Gross (1982). Although this theory has little to say about specific macromolecules that could bridge a component to a microtubule and undergo a conformational change to move the component in space along the microtubule, the theory deals at length with the biophysical nature of the axoplasm and the low viscosity channels through which fast transport surely occurs. In the case of olfactory axons, one is quickly struck with the likelihood that the domain around the neurofilaments and SER, often enmeshed in a matrix network of sorts, was in a gel state in life, and that the domain of exclusion around the microtubules was in a low viscosity sol state. This would be much in keeping with some of the precepts on which the microstream hypothesis is based (Gross and Weiss, 1982).
The available evidence indicates that one of the main functions of axonal SER is to maintain appropriate physiological levels of Ca in the axoplasm, and that mitochondria probably provide a backup sink, but only at Ca levels well above the physiological range (Blaustein et al., 1980; Brinley, 1980; McGraw et al., 1980; Requena, 1983; Zucker and Stockbridge, 1983) which in squid axons was measured to be 30 to 50 nM (Brinley, 1980). Intracellular Ca partici- pates in many cellular events, usually by binding with and altering the properties of a specific binding protein; in neurons, investigators have focused on the role of Ca in initiating or sustaining axoplasmic transport (Hammerschlag, 1980; Ellisman, 1982; Kanje et al., 1982;
Ochs, 1982) triggering neurotransmitter release (Blaustein et al., 1980) degrading neurofilaments in the axon terminals (or after injury) by activation of proteases (Schlaepfer and Bunge, 1973; Schlaepfer, 1974; Gilbert, 1975; Lasek and Hoffman, 1976; Schlaepfer et al., 1981; Pant et al., 1982) and regulating the assembly-disassembly of microtubules (Yamauchi and Fujisawa, 1982; Yamamoto et al., 1983). In the case of frog olfactory axons, SER clearly has the capacity to actively sequester Ca, and it is likely that SER is mainly responsible for maintaining functionally appropriate levels of axo- plasmic Ca. Furthermore, it is a reasonable assumption that Ca plays a role in fast axoplasmic transport in olfactory axons, and that its presence at some critical level also provides for the gel-sol states required to maintain open channels through which components can be translocated. In regard to regulating levels of axoplasmic Ca, a means must exist to trigger the release of sequestered Ca from the SER in a controlled manner to adjust the Ca equilibrium in the axoplasmic matrix.
Although the primary function of SER in olfactory axons is un- doubtedly that of Ca regulation, as in other axons, the frequent appearance of dense material in the cisternal space suggests a secondary function for these elongate compartments. Material could also be translocated within the lumen of the SER, but probably in a passive manner; one must remember, however, that the SER tubule is not a static structure with a constant shape, and that it undoubtedly undergoes limited fusion and fission as it slowly moves from the perikayon into the axon proper on its journey toward the terminals (see Hammerschlag and Stone, 1982). The cartoon shown in Figure 23 summarizes the proposed functions of SER in olfactory axons, based on our studies to date. The major function is to pump and sequester Ca, but a secondary function is that of providing a tubular compartment through which material, symbolized by the apple, could be translocated. This probably occurs in a passive manner, but this remains uncertain, as symbolized by the wagon to which a
question mark is attached. As in other vertebrates, there is good evidence that olfactory
neurons of the frog undergo slow replacement (Graziadei and Metcalf, 1971; Graziadei, 1973; Moulton, 1974). Thus, some of the
axons in the adult olfactory nerve represent newly established extensions from perikarya in the olfactory epithelium. Although we have tentative criteria for distinguishing such “new” axons, the observations made in the present paper mainly focus on what appear
to be typical, well established axons. Future research will deal more specifically without growing axons from newly differentiated neurons.
References
Alonso, G., and I. Assenmacher (1979) The smooth endoplasmic reticulum in neurohypophysial axons of the rat: Possible rnvolvement in transport, storage and release of neurosecretory material. Cell Tissue Res. 799: 41.5- 429.
Blaustern, M. P., R. W. Ratzlaff, and E. S. Schweitzer (1980) Control of intracellular calcium In presynaptrc nerve terminals. Fed. Proc. 39: 2790- 2795.
Brady, S. T., and R. J. Lasek (1982) The slow components of axonal transport: Movements, compositions and organizatton. In Axoplasmic Transport, D. G. Weiss, ed., pp. 206-217, Springer-Verlag, Berlin.
Brinley, F. J. (1980) Regulation of rntracellular calcium in squid axons. Fed. Proc. 39: 2778-2782.
Burton, P. R., and H. L. Fernandez (1973) Delineation by lanthanum staining of filamentous elements associated with the surfaces of axonal microtu- bules. J. Cell Sci. 72: 567-583.
Burton, P. R. (1984) Luminal material in microtubules of frog olfactory axons: structure and distribution. J. Cell Biol. 99: 520-528.
Burton, P. R. (1985) Computer-assrsted three-drmensronal reconstruction of the ultrastructure of the frog olfactory axon. Norelco Reporter 32: l-l 0.
Chan, S. Y., S. Ochs, and R. A. Jersild (1984) Localization of calcium in nerve fibers. J. Neurobiol. 75: 89-108.
Dahlstrom, A. (1968) Effect of colchicine on transport of amine storage granules in sympathetic nerves of rat. Eur. J. Pharmacol. 5: 11 l-l 13.
Droz, B., A. Rambourg, and H. L. Koenig (1975) The smooth endoplasmic
The Journal of Neuroscience Smooth Endoplasmic Reticulum of Frog Olfactory Axons 3059
reticulum: Structure and role in the renewal of axonal membrane and J. Rosenbaum, eds., pp. 1021-1049, Cold Spring Harbor Laboratory, New synaptic vesrcles by fast axonal transport. Brain Res. 93: 1-l 3. York.
Duce, I. R., and P. Keen (1978) Can neuronal smooth endoplasmrc reticulum LaVail, J. H., S. Rapisardi, and I. K. Sugino (1980) Evrdence against the function as a calcium reservoir? Neuroscience 3: 837-848. smooth endoplasmrc reticulum as a continuous channel for the retrograde
Ducros. C. (1974) Ultrastructural studv of the orqanizatron of axonal agranular axonal transport of horseradish peroxidase. Brarn Res. 191: 3-20. reticulum‘rn Octopus nerve. J. Neurocytol. 37513-523.
Dustin, P. (1978) Microtubules, pp. 33-34, Springer-Verlag. Berlin. Ellisman, M. H. (1982) A hypothesis for rapid axoplasmic transport based
upon focal Interactions between axonal membrane systems and the microtrabecular crossbridges of the axoplasmic matrix. In Axoplasmic Transport, D. G. Weiss, ed., pp. 390-396, Springer-Verlag, Berlin.
Ellisman, M. H., and J. D. Lindsey (1983) The axoplasmic reticulum within myelinated axons is not transported rapidly. J. Neurocytol. 72: 393-411.
Ellisman, M. H., and K. R. Porter (1980) Microtrabecular structure of the axoplasmic matrix: Visualization of cross-linking structures and their distri- bution. J. Cell Blot 87: 464-479.
Ftfkova, E., J. A. Markham, and R. J. Delay (1983) Calcium in the spine
Lieberman, A. R. (1971) Microtubule-associated smooth endoplasmic retic- ulum in the frog’s brarn. Z. Zellforsch. 7 76: 564-577.
McGraw, C. F., A. V. Somlyo, and M. P. Blaustein (1980) Probing for calcium at presynaptic nerve terminals. Fed. Proc. 39: 2796-2801.
Metuzals, J. (1969) Configuration of a filamentous network of the axoplasm of the squad (Loligo pea/ii L.) giant nerve fiber. J. Cell Biol. 43: 480-505.
Moulton, D. G. (1974) Dynamics of cell populations in the olfactory epithelium. Ann. N. Y. Acad. SCI. 237: 52-61.
Ochs, S. (1982) Calcium and the mechanrsm of axoplasmic transport. Fed. Proc. 4 1: 2301-2306.
Pachter, J. S., and R. K. H. Liem (1981) Differential appearance of neuro- filament triplet polypeptides in developing rat optic nerve. J. Cell Biol. 97:
apparatus of dendritic sprnes in the dentate molecular layer. Brain Res. 86a. 266: 163-l 68. Pant, H. C., P. E. Gallant, R. Gould, and H. Gainer (1982) Distribution of
Forbes, M. S., B. A. Plantholt, and N. Sperelakis (1977) Cytochemical staining calcium-activated protease activity and endogenous substrates in the procedure selective for sarcotubular systems of muscle: Modifications and squid nervous system. J. Neurosci. 2: 1578-1587. applicatrons. J. Ultrastruct. Res. 60: 306-327. Papasozomenos, S., L. Autilio-Gambetti, and P. Gambetti (1981) Reorgani-
Gilbert, D. S. (1975) Axoplasm chemical composition in Myxicola and solu- ration of axoplasmic organelles following /3,@‘-iminodipropionitrile admin- brlrty properties of its structural proteins. J. Physiol. (Lond.) 253: 303-319. rstratron. J. Cell Blot 91: 866-871.
Graziadei, P. P. C. (1973) Cell dynamics in the olfactory mucosa. Tissue Cell Papasozomenos, S., M. Yoon, R. Crane, L. Autrlro-Gambetti, and P. Gambetti 5: 113-131. (1982) Redtstribution of proteins of fast axonal transport following admin-
Graziadei, P. P. C., and J. F. Metcalf (1971) Autoradiographrc and ultrastruc- tstration of P,P’-imrnodipropionitrile: A quantitative autoradiographic study. tural observations on the froa’s olfactory mucosa. Z. Zellforsch. 7 76: 305- J. Cell Biol. 9.5: 672-675. 318.
Griffin, J. W., K. E. Fahnestock, D. L. Price, and P. N. Hoffman (1983) Microtubule-neurofilament segregation produced by fi,fl’iminodipropronr- trrle: Evidence for the association of fast axonal transport with mrcrotubules. J. Neurosci. 3: 557-566.
Gross, G. W. (1975) The microstream concept of axoplasmic and dendritic transport. Adv. Neurol. 72: 283-296.
Gross, G. W., and L. M. Beidler (1973) Fast axonal transport in the c-fibers of the garfish olfactory nerve. J. Neurobiol. 4: 413-428.
Gross, G. W.. and G. W. Kreutzberq (1978) Rapid axoplasmic transport in
Rambourg, A., and B. Droz (1980) Smooth endoplasmic reticulum and axonal transport. J. Neurochem. 35: 16-25.
Requena, J. (1983) Calcium transport and regulation in nerve fibers. Annu. Rev. Biophys. Bioeng. 72: 237-257.
Rieder, C. L. (1981) Thick and thin serial sectioning for the three-dimensional reconstruction of biological ultrastructure. Methods Cell Biol. 22: 215-249.
Schlaepfer, W. W. (1974) Calcium-induced degeneration of axoplasm in isolated segment of rat peripheral nerve. Brain Res. 69: 203-215.
Schlaepfer, W. W., and R. P. Bunge (1973) Effects of calcium ion concentra- tion on the degeneration of amputated axons in tissue culture. J. Cell Biol.
the olfactory nerve of the pike. I. Basic transport parameters for proteins 59: 456-470. and amino acids. Brain Res. 739: 65-76. Schlaepfer, W. W., U. J. P. Zimmerman, and S. Micko (1981) Neurofilament
Gross, G. W., and D. G. Weiss (1982) Theoretical considerations on rapid transport in low viscosity axonal regions. In Axoplasmic Transport, D. G. Weiss, ed., pp. 330-341, Springer-Verlag, Berlin.
Hammerschlag, R. (1980) The role of calcium in the initiation of fast axonal transport. Fed. Proc. 39: 2809-2814.
Hammerschlag, R., and G. C. Stone (1982) Fast axonal transport as endo- membrane flow. In Axoplasmic Transport, D. G. Weiss, ed., pp. 407-413, Springer-Verlag, Berlin.
Henkart, M. (1980) Identification and function of intraceliular calcium stores in axons and cell bodies of neurons. Fed. Proc. 39: 2783-2789.
Henkart, M. P., T. S. Reese, and F. J. Brinley (1978) Endoplasmic reticulum sequesters calcium in the squid giant axon. Science 202: 1300-l 303.
Heslop, J. P. (1975) Axonal flow and fast transport in nerves. Adv. Comp. Physiol. Biochem. 6: 75-163.
Heumann, H. G., and E. Zebe (1967) Uber Feinbau und Funktionswerse der Fasern aus dem Hautmuskelschlauch des Regenwurms, Lumbricus ter- restris. Z. Zellforsch. 78: 131-l 50.
Hirokawa, N. (1982) Cross-linker system between neurofilaments, microtu- bules. and membranous orqanelles in frog axons revealed by the quick- freeze, deep-etching method. J. Cell Biol. 94: 129-142. . tiol. 57: 88-108.
proteolysis in rat peripheral nerve. Homologous with calcium-activated proteolysis of other tissues. Cell Calcium 2: 235-250.
Schliwa, M. (1984) Mechanisms of intracellular organelle transport In Cell and Muscle Motility, J. W. Shay, ed., Vol. 5, pp. l-82, Plenum Press, New York.
Schnapp, B. J., R. D. Vale, M. P. Sheetz, and T. S. Reese (1985) Single mrcrotubules from squid axoplasm support bidirectional movement of organelles. Cell 40: 455-462.
Schnepf, E., K. Hausmann, and W. Herth (1982) The osmium tetroxtde- potassium ferrocyanrde (OsFeCN) stainrng technique for electron micros- copy: A crrtrcal evaluation using ciliates, algae, mosses, and higher plants. Histochemrstry 76: 261-271.
Smith, D. E. (1973) The location of neurofilaments and microtubules during the postnatal development of Clarke’s nucleus in the kitten. Brain Res. 55: 41-53.
Specht, S. C. (1977) Axonal transport In the optic system of neonatal and adult hamsters. Exp. Neurol. 56: 252-264.
Terchberg, S., and E. Holtzman (1973) Axonal agranular reticulum and synaptic vesicles in cultured embryonic chick sympathetic neurons. J. Cell
Hodge, A. J., and W. J. Adelman (1980) The neuroplasmic network in Loligo Tsukrta, S., and H. lshrkawa (1976) Three-dtmensronal distribution of smooth and Hermissenda neurons. J. Ultrastruct. Res. 70: 220-241. endoplasmrc reticulum in myelinated axons. J. Electron Microsc. 25: 141-
Kanje, M., A. Edstrom, and P. Ekstrom (1982) The role of Ca*’ in rapid 149. axonal transport. In Axoplasmic Transport, D. G. Weiss, ed., pp. 394-300, Tsukita, S., and H. lshrkawa (1979) Morphological evidence for the involve- Springer-Verlag, Berlin. ment of the smooth endoplasmic reticulum in axonal transport. Brain Res.
Kim, H., L. I. Binder, and J. L. Rosenbaum (1979) The periodic association 174: 315-318. of MAP2 with brain microtubules in vitro. J. Cell Biol. 80: 266-276. Tsukita, S., and H. lshrkawa (1980) The movement of membranous organelles
Koonce, M. P., and M. Schliwa (1985) Bidirectional organelle transport can in axons. Electron microscopic identifrcatron of anterogradely and retro- occur in cell processes that contain single microtubules. J. Cell Biol. 700: gradely transported organelles. J. Cell Biol. 84: 513-530. 322-326. Ungar, F., I. Piscopo, J. Letizia, and E. Holtzman (1984) Uptake of calcium
Kreutzberg, G. W., and G. W. Gross (1977) General morphology and axonal by the endoplasmic reticulum of the frog photoreceptor. J. Cell Biol. 98: ultrastructure of the olfactory nerve of the pike, Esox lucius. Cell Tissue 1645-l 655. Res. 181: 443-457. Walz, B. (1979) Subcellular calcium localization and ATP-dependent Ca”-
Lasek, R. J., and P. N. Hoffman (1976) The neuronal cytoskeleton, axonal transport and axonal growth. In Cell Motility, R. Goldman, T. Pollard, and
uptake ‘by smooth endoplasmic reticulum in an invertebrate photoreceptor cell. An ultrastructural, cytochemical and X-ray microanalytical study. Eur.
3060 Burton and Laveri Vol. 5, No. 11, Nov. 1985
J. Cell Biol. 20: 83-91. Walz, B. (1982a) Calcium-sequestering smooth endoplasmic reticulum In
retinula cells of the blowfly. J. Ultrastruct. Res. 81: 240-248. Walz, B. (198213) Ca%equesterinq smooth endoplasmic reticulum in an
Invertebrate photoreceptor. I. ln&acellular topography as revealed by OsFeCN stainina and in situ Ca accumulation. J. Cell Biol. 93: 839-848.
Walz, B. (1982c) Ca’+-sequestering smooth endoplasmic retrculum in an Invertebrate photoreceptor. II. Its propertres as revealed by microphoto- metric measurements, J. Cell Biol. 93: 849-859.
Walz, B. (1983) Assocration between cytoskeletal microtubules and Ca’+- sequestering smooth ER In Semper cells of fly ommatidia. Eur. J. Cell BIoI. 32: 92-98.
Yamamoto, H., K. Fukunaga, E. Tanaka, and E. Miyamoto (1983) Ca’+- and calmodulin-dependent phosphorylation of microtubule-associated protein 2 and tau factor, and inhibition of mrcrotubule assembly. J. Neurochem. 41: 1119-1125.
Yamauchr, T., and H. Fujisawa (1982) Phosphorylatlon of microtubule-asso- ciated protein 2 by calmodulin-dependent protein kinase (kinase II) which occurs only in the brain tissues. Biochem. Biophys. Res. Commun. 709: 975-981.
Weiss, D. G., V. Krygier-Brevard, G. W. Gross, and G. W. Kreutzberg (1978) Zucker, R. S , and N. Stockbridge (1983) Presynaptic calcium diffusron and Rapid axoplasmic transport in the olfactory nerve of the pike: Il. Analysis the time courses of transmrtter release and synaptrc facilitation at the squid of transported proteins by SDS gel electrophoresis. Brain Res. 739: 77-87. giant synapse. J. Neuroscr. 3: 1263-l 269.
Weiss, D. G., and G. W. Gross (1982) The microstream hypothesis of axoplasmic transport: Characteristics, predictrons and compatibility with data. In Axoplasmic Transport, D. G. Weiss, ed., pp. 362-383, Springer- Verlag, Berlin.