Embed Size (px)
Citation preview

This article was downloaded by: [Van Pelt and Opie Library]On: 16 October 2014, At: 02:38Publisher: RoutledgeInforma Ltd Registered in England and Wales Registered Number: 1072954 Registeredoffice: Mortimer House, 37-41 Mortimer Street, London W1T 3JH, UK
South European Society and PoliticsPublication details, including instructions for authors andsubscription information:http://www.tandfonline.com/loi/fses20
The Distributional Impact of Austerityand the Recession in Southern EuropeManos Matsaganis & Chrysa LeventiPublished online: 02 Sep 2014.
To cite this article: Manos Matsaganis & Chrysa Leventi (2014) The Distributional Impact ofAusterity and the Recession in Southern Europe, South European Society and Politics, 19:3, 393-412,DOI: 10.1080/13608746.2014.947700
To link to this article: http://dx.doi.org/10.1080/13608746.2014.947700
PLEASE SCROLL DOWN FOR ARTICLE
Taylor & Francis makes every effort to ensure the accuracy of all the information (the“Content”) contained in the publications on our platform. However, Taylor & Francis,our agents, and our licensors make no representations or warranties whatsoever as tothe accuracy, completeness, or suitability for any purpose of the Content. Any opinionsand views expressed in this publication are the opinions and views of the authors,and are not the views of or endorsed by Taylor & Francis. The accuracy of the Contentshould not be relied upon and should be independently verified with primary sourcesof information. Taylor and Francis shall not be liable for any losses, actions, claims,proceedings, demands, costs, expenses, damages, and other liabilities whatsoeveror howsoever caused arising directly or indirectly in connection with, in relation to orarising out of the use of the Content.
This article may be used for research, teaching, and private study purposes. Anysubstantial or systematic reproduction, redistribution, reselling, loan, sub-licensing,systematic supply, or distribution in any form to anyone is expressly forbidden. Terms &Conditions of access and use can be found at http://www.tandfonline.com/page/terms-and-conditions

The Distributional Impact of Austerityand the Recession in Southern EuropeManos Matsaganis and Chrysa Leventi
Southern European welfare states are under stress. On the one hand, the recession hasbeen causing unemployment to rise and incomes to fall. On the other hand, austerity hasaffected the capacity of welfare states to protect those affected. This paper assesses the
distributional implications of the crisis in Greece, Spain, Italy and Portugal from 2009 to2013. Using a microsimulation model, we disentangle the first-order effects of tax–benefit
policies from the broader effects of the crisis, and estimate how its burden has been sharedacross income groups. We conclude by discussing the methodological pitfalls and policy
implications of our research.
Keywords: Austerity; Recession; Microsimulation; Poverty; Inequality; Southern Europe;
Economic Crisis; Italy; Greece; Spain; Portugal
In recent years the world economy has been in turmoil. The global financial crisis of2007–09 was followed by the sovereign debt crisis of 2011–13, interrupted by a
modest recovery. Several authors have labelled this the ‘Great Recession’ (Jenkins et al.2013), as it is affecting large areas of the globe, and because its duration and depth
exceed those of previous downturns. In Europe, the combined gross domestic product(GDP) of the 27 European Union (EU) member states contracted by 4.5 per cent in
2009 relative to the year before. It subsequently recovered somewhat, but once againregistered negative growth in 2012 and stagnated in 2013. Overall, by 2013 the
European economy had shrunk by 1.2 per cent relative to its 2008 level.The recession was an archetypal asymmetric shock, as some countries were affected
much more than others. In Greece the size of the economy declined by over 23 per cent
in 2007–13. In Portugal and Spain, the size of the contraction from peak (2008) totrough (2013) was around seven per cent, in Italy almost nine per cent (in 2007–13).
Unemployment in the EU rose by 3.6 percentage points (ppts) in 2007–13 (Eurostat2014). Again, things were much worse in those countries worst hit by the crisis, and
especially in Greece and Spain, where the unemployment rate went up by as many as19 and 18 ppts, respectively (in 2007–13).
q 2014 Taylor & Francis
South European Society and Politics, 2014
Vol. 19, No. 3, 393–412, http://dx.doi.org/10.1080/13608746.2014.947700
Dow
nloa
ded
by [
Van
Pel
t and
Opi
e L
ibra
ry]
at 0
2:38
16
Oct
ober
201
4

Spending on social protection in the EU (as percentage of GDP) peaked in 2009,levelled out in 2010 and decreased in 2011 (Eurostat 2014). Based on national accounts
data, Bontout and Lokajickova (2013) found that the downward trend in socialexpenditure accelerated in 2012. The fall in social spending since 2011 can be partly
attributed to the recovery and subsequent employment growth, as experienced insome parts of the EU. However, reductions in social expenditure were also significant
in countries that were still deep in recession, such as Greece and Portugal. This is insharp contrast to the notion that, in a crisis, social benefits can act as ‘social stabilisers’
(Dolls, Fuest & Peichl 2012; Salgado et al. 2014).As a matter of fact, cuts in social protection were often a component of austerity
policies. In response to the crisis, bailout deals were offered to Ireland, Greece, Cyprus,
Latvia, Hungary, Portugal and Romania. These were made conditional uponsatisfactory progress on a detailed set of fiscal cuts and policy reforms. The pressure
resulting from external constraints was also unmistakeable in Spain and Italy, eventhough softer forms of conditionality prevailed there.
The aim of this paper is to provide an early assessment of the distributionalimplications of the Great Recession in 2009–13 in four southern European countries
severely affected by it: Greece, Spain, Italy and Portugal. Using a microsimulationmodel, we attempt to quantify the impact of tax–benefit policies (such as fiscalconsolidationmeasures) and of some of themost important developments in the wider
economy (namely changes in individuals’ labourmarket status andmarket incomes) onincome distribution. Moreover, we estimate how the burden of the crisis (taken from
now on to signify the combined effect of tax–benefit policies and broader economicdevelopments) has been shared across income groups, and how the differential impact
of the crisis may have altered the composition of the population in poverty.The paper is structured as follows. We first provide a review of the literature on the
interactions of fiscal consolidation with inequality and growth, including key findingsof microsimulation studies. We continue by explaining the methodology of our work.
We then present our estimates of the distributional effects of the Great Recession inGreece, Spain, Italy and Portugal. We conclude by summarising the most importantfindings, and by reflecting on the policy implications of this research.
Literature Review
Interactions of Austerity with Growth
There can be little doubt that fiscal consolidation interacts with growth. On the onehand, austerity policies cause aggregate demand to fall and therefore lead firms
catering for the domestic market to reduce output, cut salaries and lay off personnel.On the other hand, the recession will weaken the deficit-reducing potential of austerity
policies and may lead to calls for the adoption of harsher measures.This raises the question of how austerity contributes to the intensity of the
recession. This is at the heart of the controversy on ‘fiscal multipliers’, i.e. the output
394 M. Matsaganis and C. Leventi
Dow
nloa
ded
by [
Van
Pel
t and
Opi
e L
ibra
ry]
at 0
2:38
16
Oct
ober
201
4

loss associated with fiscal consolidation. The issue gained increasing importance in thewake of the current crisis and initiated a heated debate. On the whole, international
organisations such as the International Monetary Fund (IMF) (2012) and theOrganisation for Economic Cooperation and Development (OECD) (2014) now
accept that they have underestimated the size of fiscal multipliers and haveoverestimated growth prospects. In contrast, the European Commission (EC) has
suggested that forecast errors may be due to the negative response of investors towardsheavily indebted countries rather than an underestimation of the fiscal multiplier
(EC 2012), while the European Central Bank (ECB) has argued that the medium- andlong-term effects of fiscal consolidation more than compensate for any short-termoutput losses (ECB 2012).
In general, the relationship between changes in government expenditure and growthis non-linear (Barro 1990). The actual effect will depend on a variety of factors. To start
with, fiscal multipliers tend to be larger when the economy is in recession than when itis in expansion (Auerbach & Gorodnichenko 2012; Corsetti, Meier & Muller 2012;
Eyraud & Weber 2013). Also, output losses will be greater when efforts to improvefiscal balances take place simultaneously across several countries (Goujard 2013).
On the other hand, the policy mix of fiscal consolidation packages may also matter,although the evidence here is mixed. Some authors (Romer & Romer 2010; Alesina &Ardagna 2012; Alesina, Favero & Giavazzi 2012) have argued that declines in public
spending may lead to stronger economic growth than is the case with tax increases,while others (Jorda & Taylor 2013; Ball et al. 2013) have found that the medium-term
relationship of spending cuts with GDP growth is negative. Finally, the size of themultiplier will also depend on the characteristics of the economy under consideration.
As argued by Alcidi and Gros (2012), output losses following fiscal consolidation willbe inversely related to the savings rate, the average tax rate and the degree of trade
openness.
Interactions of Austerity with Inequality
While fiscal consolidation policies are widely held to cause poverty and inequality to
rise, establishing their distributional effects is less straightforward than appears at firstsight. Empirical evidence has shown that austerity does not necessarily have to beregressive. A study of fiscal consolidation in 18 countries in 1970–2010 by Agnello and
Sousa (2012) found that fiscal adjustment programmes that took care to minimiseadverse distributional effects had a higher probability of being successful. However, an
analysis of 173 episodes of fiscal consolidation in 17 countries over the past 30 years byBall, Leigh and Loungani (2011) showed that, on balance, adjustment costs were not
shared equally, with lower-income groups experiencing heavier losses, and wagesdeclining more than profits.
The size and make-up of fiscal consolidation may be crucial in determining thedistributional impact of the adjustment. Agnello and Sousa (2012), mentioned above,
found that the decline in income inequality following episodes of fiscal consolidation
South European Society and Politics 395
Dow
nloa
ded
by [
Van
Pel
t and
Opi
e L
ibra
ry]
at 0
2:38
16
Oct
ober
201
4

tended to take place where the policy mix relied more heavily on tax increases than onspending cuts. Woo et al. (2013) came to the same conclusion after analysing
consolidation programmes in 17 countries in 1978–2009. Ahren, Arnold and Moeser(2011) found that progressive taxation and generous unemployment benefits can
smooth the distributional impact of a financial crisis and fiscal consolidation.In other words, an insidious trade-off could be at work. Progressive policies (such as
raising personal income taxes) may reduce inequality at the cost of damaging long-term growth, while regressive policies (such as raising indirect taxes) may have the
opposite effect (OECD 2013). In view of this, the static effects of austerity policies maybe at odds with their dynamic effects.
Estimating Distributional Effects via Microsimulation
Microsimulation has been extensively used as a tool for assessing the distributional
impact of the recent economic downturn and examining the effects of variousausterity measures on income distribution.
In a single-country setting – Ireland – Callan, Nolan and Walsh (2011) assessed theimpact of public sector pay cuts in 2009–10. These were found to be progressive
against a counterfactual scenario of a four per cent cut in both public and privatesector pay. Nolan, Callan and Maıtre (2013) expanded that analysis to include the
overall distributional impact of tax and welfare changes over the period 2009–11,and again found the result to be highly progressive. In Italy, Brandolini, D’Amuri and
Faiella (2013) replicated employment dynamics in 2007–10 and estimated theresulting variations in income flows. In the light of their findings they argued that theimpact of the recent recession on inequality and poverty in the country has been fairly
limited, despite the considerable fall in average income. In Greece, Leventi andMatsaganis (2013) estimated how the burden of the crisis was shared across the
population in 2009–12. Their findings suggest that the rise in inequality began a yearafter the onset of the crisis, and gathered speed as the recession deepened. In Cyprus,
Koutsampelas and Polycarpou (2013) assessed the distributional effects of theausterity measures introduced in 2011–12. Their analysis showed that most of the
first-order effects of adjustment fell upon households located in the middle and upperpart of the income distribution. In the UK, the effects of recent tax–benefit reformswere analysed by Browne and Levell (2010), Brewer, Browne and Joyce (2011) and
Joyce and Sibieta (2013). Their findings suggest that those with the lowest incomeswere the biggest losers from these policy changes.
In a comparative setting, Avram et al. (2013) simulated the distributional effects offiscal consolidation measures up to 2012 in nine EU countries. The study showed that
the burden of austerity was shared in very different ways in the countries considered.Finally, Bargain et al. (2013) examined the distributional impact of the economic crisis
in France, Germany, the UK and Ireland in the period 2008–10 and the contributionof tax–benefit policy changes. They found that in all countries but Germany policy
reactions contributed to stabilising or even reducing inequality and relative poverty.
396 M. Matsaganis and C. Leventi
Dow
nloa
ded
by [
Van
Pel
t and
Opi
e L
ibra
ry]
at 0
2:38
16
Oct
ober
201
4

Methodology
Departures from Previous Research
In assessing the distributional impact of tax–benefit policies, most of the time the
choice of the underlying (market) income distribution may not matter much.However, at times of major changes, the assessment of the progressivity or otherwise of
policies may differ significantly according to whether these are assessed on thedistribution of market incomes at the beginning or at the end of the period under
consideration. In Avram et al. (2013) the distributional effects of policy changes from2009 to 2012 were evaluated on the assumption that 2009 policies were implementedon the 2012 market income distribution. In this paper we model the distributional
effects of policies in the period 2009–13 on a year-by-year basis, rather thancumulatively. Policy changes between two consecutive years, say t – 1 and t, are
assessed on the income distribution of year t – 1.Also, as the literature reviewed above suggests, tax–benefit policies clearly affect
market incomes. Ignoring these dynamic (indirect) policy effects leaves out animportant part of the picture. Our approach departs frommost of the studies reviewed
above, where broader economic developments are explicitly excluded from the scopeof the analysis. Rather than abstracting from them, this research attempts to locatefirst-order policy effects within the broader distributional effects of the crisis, by taking
into account two important aspects of the latter: changes in market incomes andlabour market transitions. By doing so, it also differs from Brandolini, D’Amuri and
Faiella (2013), who assume wages, self-employment earnings and pensionentitlements to have remained unchanged during the period under examination.
Model and Data
We rely on the European tax–benefit model EUROMOD. The model uses survey data
on gross incomes, labour market status and other characteristics of individuals andhouseholds, which it then applies to the tax–benefit rules in place in order to simulatedirect taxes, social insurance contributions and entitlements to cash benefits. The
components of the tax–benefit system that cannot be simulated (for example, thosedepending on prior contributions) are read off the data. The underlying micro data for
all countries are drawn from the 2010 European Union Statistics on Income and LivingConditions (EU-SILC), reporting incomes earned in 2009. EUROMOD has been
validated at both micro and macro level and has been tested in several applications.For a comprehensive overview, see Sutherland and Figari (2013).
The most important advantages of microsimulation in general, and EUROMOD inparticular, are twofold: timeliness and attribution. Due to the complexity of incomesurveys, relevant income data only become available after considerable (i.e. 2–3 years’)
delay. In themeantime, EUROMODcanbridge the gap, by providing an early evaluationof changes in the income distribution of EU countries up to 2013. It can be used to
disentangle the effects of each policy or othermacroeconomic developments, taking into
South European Society and Politics 397
Dow
nloa
ded
by [
Van
Pel
t and
Opi
e L
ibra
ry]
at 0
2:38
16
Oct
ober
201
4

account the complex ways in which taxes interact with benefits and with each other.A direct analysis of actual data, when these become available, cannot do this as well.
Accounting for Labour Market Developments
A standard practice in static microsimulation models is to assume that the labour
market characteristics of the population remain unchanged. Although this is aplausible assumption in a stable macro-economic environment, it may bias the results
in periods of economic turbulence. Given the magnitude of changes in the countriesunder examination, disregarding such a development would have been inappropriatefor the purposes of this research. Linking economy-wide changes to micro-level
analysis is not a new idea. Elaborate simulation methodologies and techniques havebeen developed by the World Bank and have been used in several applications
(see Bourguignon, Bussolo & Da Silva 2008).In this paper changes in labour market status were taken into account following the
approach adopted by Leventi et al. (2013). This approach can be briefly summarised asfollows. Observations are selected on the basis of conditional probabilities of being
employed. A logit model is used to estimate probabilities for working age individuals intheEUROMODinput data.Themodel is estimated separately for individualswith higherand lower levels of education.Theweighted total numberof observations that are selected
to go through transitions based on their probabilities corresponds to the relative netchange in employment levels by age group, gender and education as shown in the Labour
Force Survey (LFS) statistics. Changes from short-term to long-term unemployment arealso modelled based on a similar selection procedure as the one described above.
Labour market characteristics and sources of income are adjusted for thoseobservations that are subject to transitions. In particular, employment/self-
employment income is set to zero for individuals who become unemployed. Forindividuals moving from unemployment into employment, earnings are set equal to
the mean among those already employed within the same stratum.It should be noted that initial (i.e. 2009) employment rates do not align perfectly
between EU-SILC and the LFS. Differences are mainly due to discrepancies in the
structure of the underlying working age populations and the different way labourmarket status is measured. Hence, the aim of this adjustment is not to match the
EUROMOD and LFS employment patterns in absolute terms but to account forrelative changes in employment levels. Moreover, although focusing on net changes in
employment rates allows EUROMOD to capture the employment dynamics shown byLFS, it does not fully capture compositional changes in the population of employed
and unemployed which may have taken place within the period of analysis.Finally, whereas changes in the labour market were carefully taken into account, no
similar adjustments were made to account for demographic changes or changes in
characteristics of the population such as education level or household structure.Arguably, these adjustments are less critical within the time frame studied, as major
shifts are unlikely to happen in such a short period.
398 M. Matsaganis and C. Leventi
Dow
nloa
ded
by [
Van
Pel
t and
Opi
e L
ibra
ry]
at 0
2:38
16
Oct
ober
201
4

Updating Market Incomes and Simulating Policies
The non-availability, at the time of writing, of ‘real’ data for the time period inquestion implied that a synthetic income distribution had to be created for these years.As is standard practice in microsimulation, this involved two additional steps:
updating incomes from the EU-SILC income reference period (2009) to the latestpolicy year (2013) and simulating tax–benefit policies.
Updating incomes is performed using factors based on the available administrativeor survey statistics. Specific updating factors are derived for each income source,
reflecting the change in their average amount between the income data referenceperiod and the target year. Accurately capturing the evolution of employment income
is of utmost importance for studying changes in the disposable income of households.In order to account for differential growth rates in employment income, updating
factors are disaggregated by economic sector and by private and public sector incountries where such information is available.
Since EU-SILC provides no information on consumption, changes in indirect
taxation are beyond the scope of this analysis. Changes in the provision of benefits inkind (such as health care, education, child care, etc.) are also not considered in this
study. Simulations are carried out on the basis of the tax–benefit rules in place on 30June of each policy year. In order to enhance the credibility of estimates, an effort has
been made to address issues such as tax evasion (e.g. in Greece and Italy) and benefitnon-take-up (e.g. in Greece). However, such adjustments are not possible to
implement in all countries due to data limitations.The full list of factors used for the uprating of original incomes and non-simulated
benefits as well as detailed description of the way in which tax–benefit policies are
simulated can be found in the EUROMOD Country Reports (EUROMOD 2014).
Modelling the Distributional Effects of Austerity and the Crisis
Drawing on the decomposition approach developed by Bargain and Callan (2010),
we can approximate the first-order distributional effects of policies by simulating ahypothetical counterfactual scenario, capturing the effect of changes in policies on
the income distribution as observed before these policies are actually implemented(i.e. typically at the time policy changes are announced and/or legislated). Since thisis the only distribution known to policymakers when they take decisions on policy
changes, we believe that estimating this hypothetical scenario is of interest andrelevance.
More formally, household disposable income in our counterfactual scenario isconstructed on the basis of:
(i) individuals’ labour market status in year t – 1;
(ii) market incomes (other than public sector pay) in year t – 1;(iii) tax and benefit polices in year t.
South European Society and Politics 399
Dow
nloa
ded
by [
Van
Pel
t and
Opi
e L
ibra
ry]
at 0
2:38
16
Oct
ober
201
4

This is compared with the situation where all variables are set as in year t – 1. Note thatin this counterfactual scenario we do not allow monetary parameters of taxes and
benefits to grow from one year to another (by using for example consumer price index[CPI] or growth in average market incomes), since indexation during the period
considered was rather ad hoc in the four countries.The broader distributional effects of the crisis between years t and t – 1 (capturing
together the effects of changes in policies, market incomes and employment status) aremodelled by comparing the distribution of household disposable income in year t with
that in year t – 1.It is important to note that changes in employment incomes may on occasion be
directly attributable to government policies, as in the case of changes in minimum
wage legislation. However, we have not been able to disentangle these effects from thebroader distributional impact of the crisis.
Results
Poverty
We assess poverty effects using two different indicators. The first is the relative povertyrate, measured in terms of the proportion of the population with disposable income
below 60 per cent of median. By construction, the relative poverty line goes up asmedian incomes improve, and down as median incomes fall. Needless to say, the
significant fall in median incomes has been the defining characteristic of the GreatRecession: in 2009–13 that estimated fall was massive in Greece (–36 per cent in realterms), but was also substantial in Portugal (–14 per cent), Spain (–11 per cent) and
to a lesser extent Italy (–6 per cent).To approximate the resulting sense of impoverishment, our second indicator fixes
(‘anchors’) the poverty line at 60 per cent of the median of the 2009 incomedistribution, in real terms. By doing so, it reports the proportion of population who
were unable to purchase in 2010–13 the goods and services that were just affordable tothose with poverty line incomes in 2009.
The evolution of relative and anchored poverty rates in 2009–13 is shown inFigures 1 and 2 and, in greater detail, in Table 1.Estimated relative poverty levels for the entire population moved up steadily in
Greece, being 3.3 ppts higher in 2013 than in 2009. Relative poverty rates in the otherthree countries went up as well as down, the size of change being generally small.
As might have been expected, changes in anchored poverty were more remarkable.In Greece, the proportion of population with incomes in 2013 below the 2009 poverty
line (in real terms) was over 45 per cent, i.e. a dramatic increase by more than 25 ppts.The magnitude of change was smaller in Portugal (þ6.3 ppts), Spain (þ4.5 ppts) and
Italy (þ3.0 ppts).Changes in sex- and age-specific relative poverty rates reveal interesting patterns.
On the whole, they were less unfavourable for women than for men. In terms of age,
400 M. Matsaganis and C. Leventi
Dow
nloa
ded
by [
Van
Pel
t and
Opi
e L
ibra
ry]
at 0
2:38
16
Oct
ober
201
4

the most remarkable finding is that relative poverty rates for the elderly (aged over 65)decreased very considerably in Greece, Spain and Portugal (by around five ppts or
more), as well as in Italy (even though by less). On the other hand, relative poverty foryoung people (aged 18–29) went up in all four south European countries (especially
in Greece and Spain). Poverty rates also went up for the 0–17 and the 30–64 agegroups in Greece. This is because older people on low incomes, though not fully
14%
16%
18%
20%
22%
24%
2009 2010 2011 2012 2013
Greece Spain Italy Portugal
Figure 1 Relative Poverty (2009–13)Source: EUROMOD version G1.0.Note: Proportion of population below the relative poverty threshold, set at 60 per cent ofmedian equivalised disposable income.
15%
20%
25%
30%
35%
40%
45%
50%
2009 2010 2011 2012 2013
Greece Spain Italy Portugal
Figure 2 Anchored Poverty (2009–13)Source: EUROMOD version G1.0.Note: Proportion of population below a fixed poverty threshold, set at 60 per cent of the2009 median equivalised disposable income, adjusted for inflation. Adjustment based onthe harmonised index of consumer prices (accessed on 19 December 2013); values for 2013based on the European Commission Spring 2013 forecast (http://ec.europa.eu/economy_finance/eu/forecasts/2013_spring/statistical_en.pdf).
South European Society and Politics 401
Dow
nloa
ded
by [
Van
Pel
t and
Opi
e L
ibra
ry]
at 0
2:38
16
Oct
ober
201
4

protected, suffered lower income losses (e.g. cuts in pensions) than other groups
(e.g. the unemployed). Note, however, that funding cuts and other changes in healthcare (not considered here) may have raised the costs of services and others barriers toaccess for those depending on them, among whom the elderly feature prominently.
The age groups experiencing the greatest increases in anchored poverty were theyoung (aged 18–29) in Greece, Spain and (by a smaller margin) Italy, and children
(aged 0–17) in Portugal. Nevertheless, the elderly also suffered considerable increasesin anchored poverty, except in Spain, where the relevant rate actually fell.
Inequality
We use two inequality indicators to determine whether the Great Recession has madethe distribution of incomes more unequal. The first is the Gini coefficient, taking
values ranging from 0 (total equality) to 1 (total inequality). The second inequalityindicator is the income quintile share ratio S80/S20 (measuring the income share of
the richest 20 per cent relative to that of the poorest 20 per cent). Note that the formeris more sensitive to changes in the middle of the distribution, whereas the latter is
more sensitive to changes at the two ends of the distribution.As seen in Table 2, in 2009–13 the value of the Gini index increased very steeply in
Greece (from 0.321 to 0.364, i.e. by 13 per cent). Elsewhere changes were not as large.Gini also went up a bit in Spain (in 2013), declined steadily in Portugal (in 2009–13)
and hardly moved in Italy. In all three countries, differences, whether annual orcumulative, were rather small. The pattern was remarkably similar with respect to the
Table 1 Changes in Relative and Anchored Poverty by Sex and Age (2013 vs. 2009)
Greece Spain Italy Portugal
Relative Anchored Relative Anchored Relative Anchored Relative Anchored
All 3.3*** 25.8*** 20.2 4.5*** 20.2 3.0*** 21.5*** 6.3***Men 4.4*** 26.5*** 0.2 4.7*** 0.1 3.0*** 21.2** 6.1***Women 2.3** 25.2*** 20.5 4.3*** 20.4* 3.0*** 21.9*** 6.5***0–17 3.2*** 25.9*** 0.6 5.6*** 20.2 3.5*** 21.2 7.2***18–29 7.2*** 32.4*** 3.0*** 8.9*** 1.0* 3.7*** 1.0 6.8***30–44 6.3*** 25.9*** 0.1 4.2*** 0.2 2.9*** 20.7 5.9***45–64 5.4*** 25.9*** 0.4 5.0*** 20.2 2.1*** 21.5** 5.8***65 þ 26.3*** 20.4*** 24.9*** 21.1*** 21.4*** 3.5*** 25.1*** 6.4***
Source: EUROMOD version G1.0, Distributive Analysis Stata Package (DASP) Version 2.3.Note: Changes in relative and anchored poverty rates (2013 vs. 2009) in percentage points. Relativepoverty rate defined as proportion of population below the relative poverty threshold, set at60 per cent of median equivalised disposable income, using the OECD modified equivalence scale.Anchored poverty rate defined as proportion of population below a fixed poverty threshold, set at60 per cent of the 2009 median equivalised disposable income, adjusted for inflation.Estimated changes marked as statistically significant at 90 per cent (*), 95 per cent (**) or 99 per
cent confidence level (***). Information on the sample design of EU-SILC 2010 derived followingGoedeme (2010).
402 M. Matsaganis and C. Leventi
Dow
nloa
ded
by [
Van
Pel
t and
Opi
e L
ibra
ry]
at 0
2:38
16
Oct
ober
201
4

S80/S20 index. The income quintile share ratio went up very considerably in Greece
(from 5.3 to 7.8, i.e. by 47 per cent). Changes in other countries were limited.
Income Changes by Decile: Re-ranking Effects
Over time, a considerable amount of re-ranking takes place, as a result of which thecomposition of income deciles changes. In Greece an estimated 65 per cent of the
population moved income decile between 2009 and 2013; in Portugal and Spain thatproportion was around 35 per cent, whereas in Italy only 18 per cent of the population
were found in a different decile in 2013 relative to 2009.In terms of composition, in 2013 relative to 2009, the poorest 20 per cent of the
Greek population contained more unemployed workers (29 per cent vs. ten per cent),
fewer elderly people (ten per cent vs. 18 per cent), and more city dwellers (40 per centvs. 35 per cent). The bottom quintile also numbered more unemployed workers in
Portugal (19 per cent vs. 13 per cent) and in Spain (16 per cent vs. eight per cent), andto a lesser extent in Italy (eight per cent vs. five per cent). Other changes were marginal.
The effects of re-ranking in real disposable household income are shown in Figure 3.These can be seen clearly taking the example of Greece, the country where income
losses have beenmost dramatic. When deciles are fixed in 2009 (i.e. not allowing for re-ranking), we find that by 2013 those in the poorest ten per cent of the population in2009 had lost a smaller-than-average proportion of their income (34 per cent vs. 36 per
cent in real terms). On the other hand, if deciles are recalculated each year (i.e. allowingfor re-ranking), we find that the income of those in the poorest ten per cent of the
population in 2013 had fallen by as much as 69 per cent relative to the income of theircounterparts in 2009 (i.e. those who occupied the lowest income decile in that year).
As seen in Figure 3, a similar pattern prevailed in Spain and Italy. In both countries,those in the bottom decile in 2009 had by 2013 lost a smaller proportion of their
income than had those in the top decile in 2009. Nevertheless, allowing for re-ranking,the poorest ten per cent of the population in 2013 found themselves much poorer than
the poorest ten per cent in 2009. True, the richest ten per cent of the population inthese countries were also less rich in 2013 than the richest ten per cent were in 2009.
Table 2 Inequality Indices (2009–13)
Greece Spain Italy Portugal
Gini S80/S20 Gini S80/S20 Gini S80/S20 Gini S80/S20
2009 0.321 5.27 0.314 5.79 0.308 5.07 0.322 4.952010 0.328 5.57 0.314 5.75 0.312 5.25 0.320 4.902011 0.336 5.97 0.316 5.83 0.313 5.27 0.318 4.962012 0.354 7.02 0.314 5.80 0.313 5.25 0.311 4.702013 0.364 7.77 0.318 5.94 0.311 5.20 0.310 4.75
Source: EUROMOD version G1.0.
South European Society and Politics 403
Dow
nloa
ded
by [
Van
Pel
t and
Opi
e L
ibra
ry]
at 0
2:38
16
Oct
ober
201
4

However, the decline of the poorest decile was greater than it was for the richest decile.The pattern was slightly different in Portugal, where income changes allowing for re-
ranking were similar for the top and bottom deciles. Even there, the relative gain wasgreater when deciles were fixed in 2009 than when they were recalculated each year.
Disentangling the First-Order Effects of Austerity Policies
Have adverse distributional changes taken place because of the austerity policies
introduced by governments? Or, as sometimes is argued, in spite of these policies? Inother words, have fiscal consolidation packages been designed to minimise the impact
of the recession on the weakest groups in society? Again, the political importance ofthis question is obvious. Can it be answered?
As a matter of fact, it can – provided we keep in mind that, as discussed previously,we only estimate first-order effects. In Figures 4 and 5 we attempt to estimate the yearly
changes in anchored poverty and inequality caused by policies alone vs. overall effects(i.e. that also include the effects of changes in individuals’ labour market status and
market incomes). Crucially, we warn against interpreting the difference between these
Figure 3 Changes in Disposable Income by Decile (2009–13): Re-ranking EffectsSource: EUROMOD version G1.0.Note: Household disposable income is equivalised according to the OECD modifiedequivalence scale and measured in real terms (i.e. adjusted for inflation). The charts aredrawn to different scales, but the interval between gridlines is the same on each chart.
404 M. Matsaganis and C. Leventi
Dow
nloa
ded
by [
Van
Pel
t and
Opi
e L
ibra
ry]
at 0
2:38
16
Oct
ober
201
4
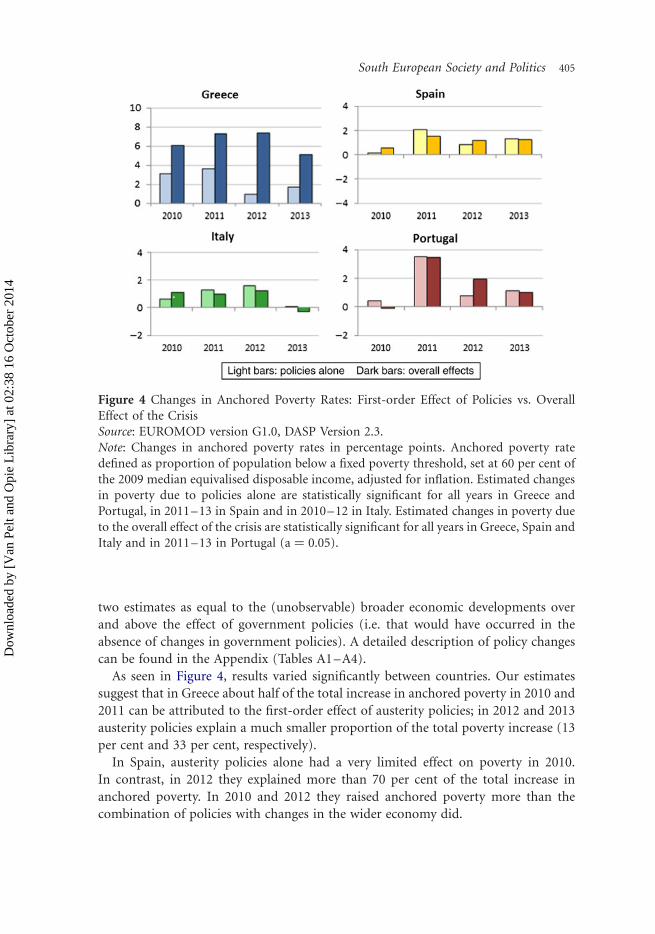
two estimates as equal to the (unobservable) broader economic developments overand above the effect of government policies (i.e. that would have occurred in the
absence of changes in government policies). A detailed description of policy changescan be found in the Appendix (Tables A1–A4).
As seen in Figure 4, results varied significantly between countries. Our estimatessuggest that in Greece about half of the total increase in anchored poverty in 2010 and
2011 can be attributed to the first-order effect of austerity policies; in 2012 and 2013austerity policies explain a much smaller proportion of the total poverty increase (13
per cent and 33 per cent, respectively).In Spain, austerity policies alone had a very limited effect on poverty in 2010.
In contrast, in 2012 they explained more than 70 per cent of the total increase in
anchored poverty. In 2010 and 2012 they raised anchored poverty more than thecombination of policies with changes in the wider economy did.
Figure 4 Changes in Anchored Poverty Rates: First-order Effect of Policies vs. OverallEffect of the CrisisSource: EUROMOD version G1.0, DASP Version 2.3.Note: Changes in anchored poverty rates in percentage points. Anchored poverty ratedefined as proportion of population below a fixed poverty threshold, set at 60 per cent ofthe 2009 median equivalised disposable income, adjusted for inflation. Estimated changesin poverty due to policies alone are statistically significant for all years in Greece andPortugal, in 2011–13 in Spain and in 2010–12 in Italy. Estimated changes in poverty dueto the overall effect of the crisis are statistically significant for all years in Greece, Spain andItaly and in 2011–13 in Portugal (a ¼ 0.05).
South European Society and Politics 405
Dow
nloa
ded
by [
Van
Pel
t and
Opi
e L
ibra
ry]
at 0
2:38
16
Oct
ober
201
4

The latter was also the case in Italy (all years except 2010) and Portugal (all yearsexcept 2012). In these countries the combined effect of policies with broader economic
developments was often negative (i.e. poverty-reducing).Inequality effects, presented in Figure 5, were subtly different. In Greece and Spain
the first-order effects of the policies pursued seem to have mostly compressed theincome distribution, while the combined effect of policies with broader economicdevelopments appears to have made it consistently more unequal, that pattern being
stronger in Greece than in Spain. The picture was similar in Italy and Portugal,where changes in inequality were generally not as great, with the inequality-reducing
(first-order) effect of policies being occasionally rather strong (as in Portugal in 2012).
Identifying the Effect of Individual Policies on Inequality
That some austerity policies per semay have actually reduced inequality seems at oddswith established views about what is going on in the countries most affected by the
Figure 5 Changes in theGini Index: First-order Effect of Policies vs.Overall Effect of theCrisisSource: EUROMOD version G1.0, DASP Version 2.3.Note: Percentage year-on-year changes in the Gini index. Estimated changes in inequality dueto policies alone are statistically significant for all years in Spain, in 2010–12 in Greece, in2011–13 in Italy and in 2010 and 2012–13 inPortugal. Estimated changes in inequality due tothe overall effect of the crisis are statistically significant for all years in Greece and Portugal,in 2011–13 in Spain and in 2010–11 and 2013 in Italy (a ¼ 0.05).
406 M. Matsaganis and C. Leventi
Dow
nloa
ded
by [
Van
Pel
t and
Opi
e L
ibra
ry]
at 0
2:38
16
Oct
ober
201
4

crisis. In fact, our finding seems to be the combined effect of two opposing tendencies:some policies distributed the burden of austerity fairly and/or affected groups located
towards the top of the income distribution, while other policies cut incomes across theboard and/or affected low-income households more.
Tax–benefit policies are grouped under four headings: public sector pay; taxes andsocial insurance contributions (SICs); pensions and related policies; and other social
benefits. Note that, although this grouping was necessary in order to render theanalysis manageable, bundling some policies under the same heading will inevitably
offset some of them against each other, obfuscating policy options and theirdistributional effects.
We then formally assess the first-order impact of each policy bundle on inequality
by calculating the percentage change between the value of the Gini index if the policybundle in question had remained as in year t – 1 relative to its actual value after the
implementation of the policy in year t. Positive (negative) values indicate that ceterisparibus the policy in question rendered the income distribution less (more) equal.
We use the term ‘progressive’ (or ‘regressive’) interchangeably with ‘inequality-reducing’ (or, respectively, ‘inequality-enhancing’). The results are shown in Table 3.
It can be seen clearly that the impact of many policy changes, though no doubtsignificant for the groups affected, was actually quite negligible in terms of thedistribution of incomes as a whole. The partial exceptions were as follows.
Table 3 Inequality Effects of Policy Changes
Change in the Gini index (%)
2010 2011 2012 2013
Greecepublic sector pay 20.57 20.10 20.31 20.52taxes / SIC 20.84 20.13 0.07 0.98pensions and related policies 20.30 20.06 20.41 0.90other social benefits 0.35 -0.16 0.25 21.47
Spainpublic sector pay 20.12 20.12 20.23 n.a.taxes / SICs 20.47 0.04 21.11 20.02pensions and related policies 20.06 20.04 20.04 20.02other social benefits 20.30 20.01 20.23 0.07
Italypublic sector pay 0.06 0.00 0.02 0.01taxes / SICs 0.01 20.52 20.42 0.00pensions and related policies 0.00 0.00 20.01 0.00other social benefits 20.04 20.06 20.06 20.20
Portugalpublic sector pay n.a. 20.53 21.04 0.96taxes / SICs 20.39 21.93 20.60 23.67pensions and related policies 20.16 20.01 21.15 0.69other social benefits 20.18 1.97 20.13 1.15
Source: EUROMOD version G1.0.Note: Percentage changes in the Gini index. ‘n.a.’ indicates no policy changes between the two years.
South European Society and Politics 407
Dow
nloa
ded
by [
Van
Pel
t and
Opi
e L
ibra
ry]
at 0
2:38
16
Oct
ober
201
4

Cuts in public sector pay seem to have been progressive, especially in Greece (inparticular in 2010 and 2013). This was also the case in Portugal (in 2011–12), where
the reversal of pay cuts in 2013 seems to have had a regressive effect. This effect mostlystems from the fact that, as a combination of steady employment and assortative
mating, civil servants tend to be located at the upper end of the income distribution.The first-order effect of changes in direct taxes and SICs seemed mostly to have
rendered the income distribution less unequal (ceteris paribus). This was especially so inPortugal in 2011, but also in Greece (2010), Spain (2010 and 2012) and Italy (2011).
In contrast, the 2013 tax and SIC changes inGreece appeared to have the opposite effect.Pension cuts and related policies (such as the special levies) appear to have had a
more mixed distributional impact. Some of these changes were progressive, as in
Portugal (in 2012) and to a lesser extent in Greece (in 2010 and 2012). This effectmostly resulted from the design of these measures, which partly or fully protected
those on low incomes. On the other hand, the across-the-board pension cuts inGreece, and the restoration of the 13th and 14th pension payments in Portugal, both in
2013, appear to have had significantly regressive effects.Examples of changes in social benefits having a progressive distributional effect were
few and far between. We may mention here the (late) introduction of a means-testedchild benefit scheme in Greece (in 2013). By contrast, reductions in the generosity ofminimum income in Portugal (in 2011 and 2013) obviously had a regressive impact.
Conclusions
We set out to estimate the distributional impact of the Great Recession in foursouthern European countries. Our results can be summarised as follows.
To start with, Greece clearly stands out from the other three countries consideredhere. As a result of the current crisis, poverty and inequality there have risen to
alarming levels. In some of the other countries, for instance in Portugal and Spain,where median incomes declined considerably, anchored poverty (by reference to a
poverty line fixed to its 2009 level in real terms) also went up, though by much lessthan in Greece. Our findings with respect to relative poverty and inequality were less
straightforward, improvements alternating with deteriorations and little overallchange (again, except in Greece).On the whole, the Great Recession seems to have changed the composition of the
population in poverty. Those at the bottom of the income distribution are youngerthan before the crisis, and more likely to be unemployed (or on low pay) than
pensioners. As a result of that, income changes are less pronounced when deciles arefixed as in the base year (in this case, 2009) than when they are recalculated each year.
Indeed, allowing for re-ranking makes it more evident that those at the bottom of theincome distribution today are considerably poorer than those occupying the same
position before the outbreak of the current crisis.We have also attempted to clarify the various interactions between government
policies, growth and income distribution. Specifically, tax–benefit policies act both
408 M. Matsaganis and C. Leventi
Dow
nloa
ded
by [
Van
Pel
t and
Opi
e L
ibra
ry]
at 0
2:38
16
Oct
ober
201
4

directly (through their effect on the distribution of incomes) and indirectly (throughtheir effects on aggregate demand, and hence on firms and workers, i.e. on jobs and
wages). As a result of these interactions, the full effects of tax–benefit policies cannotbe reduced to the first-order effects estimated here.
Having said that, isolating the effects on poverty and inequality of tax–benefitpolicies per se from the overall impact of the crisis is of some interest, as it may help
identify policies that minimise adverse distributional effects while reducing budgetdeficits. In fact, some of the policies considered here seem to have had a more
progressive first-order effect than others. This may be because special care was taken tomake a particular policy ‘fair’ by design. Alternatively, it may stem from the fact thatthose adversely affected tended to be located towards the top of the income distribution.
While the impact of policies on inequality can be described as moderate (or evenequality-reducing), this is far from saying that fiscal adjustment programmes have
been a success in overall distributional terms. Our estimates suggest that in most of thecountries examined here poverty increased, and the policies implemented accounted
for a major part of that increase. In some cases policies alone raised anchored povertymore than the combined effect of policies and changes in the wider economy did.
A certain amount of caution is called for in interpreting our results. The main issues,to do either with our approach or with our assumptions, are briefly discussed below.
Accounting for tax evasion and non-take-up of social benefits is limited to some of
the countries considered here. Clearly, a more uniform treatment of these wouldenhance the comparability and credibility of our findings. The same holds for the
treatment of indirect taxation, ignored here. Given the relative weight of indirect taxesin many tax systems, estimating their distributional impact would greatly enhance the
accuracy of our results.On another note, while austerity policies may adversely affect what was once called
the ‘social wage’, benefits in kind are ignored here. This issue has been addressed in thecontext of EUROMOD (Paulus, Sutherland & Tsakloglou 2010; Verbist & Matsaganis
2014). However, we still know too little about the actual effect of funding cuts on thequality and quantity of social services. Collecting the relevant information, andrelating inputs to outputs, would require a substantial amount of further research –
but the gains from that could be substantial.Although significant progress has been made towards accounting for macro-
economic aspects of the crisis, much remains to do to capture the impact of therecession more fully. Examples include modelling wage dynamics across sectors and
occupations, capturing additional labour market transitions (such as from full-time topart-time employment) and adjusting for demographic changes, especially in
countries where the crisis has led to significant migration flows.While we are fully aware that these weaknesses affect the accuracy of our results, we
are confident that our research offers a good approximation of the first-order
distributional impact of austerity policies and the wider impact of the crisis in the fourcountries considered here. Given the topicality of the questions addressed, and the
public interest in the answers, we believe that work based on microsimulation is a
South European Society and Politics 409
Dow
nloa
ded
by [
Van
Pel
t and
Opi
e L
ibra
ry]
at 0
2:38
16
Oct
ober
201
4

good alternative to waiting until future waves of official statistics are released.Furthermore, if the research question involves identifying the effect of different
changes taking place at the same time, distinguishing between progressive andregressive items within the same policy package (as is the case here), there is no
alternative to microsimulation.In our paper we have attempted to link the literature on the effects of fiscal
consolidation on growth, including the analysis of fiscal multipliers, with that on itseffects on inequality and poverty. We have noted that the static effects of fiscal
consolidation policies may be at odds with their dynamic effects. Clearly, however, westill know too little to quantify the size and direction of the dynamic (second-order)effects of austerity on inequality via growth. More research into that interaction would
enable us to identify policies that promote both growth and equality, even while theroom for fiscal policy remains limited.
Acknowledgements
We would like to thank Andrea Brandolini, Francesco Figari, Tim Goedeme, Isabelle Maquet, AlariPaulus and Holly Sutherland for insightful discussions of earlier versions of the paper. We are alsograteful for valuable comments to Bea Cantillon, Ana Guillen, Rodolfo Gutierrez, John Hills, GillesMourre,Maria Petmesidou, Karel Van den Bosch and other participants at conferences in Amsterdam(June 2013), Brussels (November 2013), Washington (March 2014) and Antwerp (April 2014), whereprevious versions were presented. Our research is financially supported by the European UnionSeventh Framework Programme (FP7/2012–2016) under grant agreement n8 290613 (ImPRovEproject). The views expressed in this paper are those of the authors. The usual disclaimer applies.
References
Agnello, L. & Sousa, R. M. (2012) ‘Fiscal adjustments and income inequality: a first assessment’,Applied Economics Letters, vol. 19, no. 16, pp. 1627–1632.
Ahren, R., Arnold, J. & Moeser, C. (2011) ‘The sharing of macroeconomic risk: who loses (and gains)frommacroeconomic shocks?’ OECD Economics Department Working Paper No. 877, OECDPublishing.
Alcidi, C. & Gros, D. (2012) ‘Why is the Greek economy collapsing? A simple tale of high multipliersand low exports’, CEPS Commentary, Centre for European Policy Studies, Brussels.
Alesina, A. & Ardagna, S. (2012) ‘The design of fiscal adjustments’, NBER Working Paper 18423.Alesina, A., Favero, C. & Giavazzi, F. (2012) ‘The output effects of fiscal consolidations’, NBER
Working Paper 18336.Auerbach, A. J. & Gorodnichenko, Y. (2012) ‘Measuring the output responses to fiscal policy’,
American Economic Journal: Economic Policy, vol. 4, no. 2, pp. 1–27.Avram, S., Figari, F., Leventi, C., Levy, H., Navicke, E., Matsaganis, M., Militaru, E., Paulus, A.,
Rastringina, O. & Sutherland, H. (2013) ‘The distributional effects of austerity measures:a comparison of nine EU countries’, EUROMODWorking Paper EM2/13, ISER, University ofEssex.
Ball, L., Furceri, D., Leigh, D. & Loungani, P. (2013) ‘The distributional effects of fiscal austerity’, IMFWorking Paper 13/151.
Ball, L., Leigh, D. & Loungani, P. (2011) ‘Painful medicine’, Finance and Development, vol. 48, no. 3,pp. 20–23.
410 M. Matsaganis and C. Leventi
Dow
nloa
ded
by [
Van
Pel
t and
Opi
e L
ibra
ry]
at 0
2:38
16
Oct
ober
201
4

Bargain, O. & Callan, T. (2010) ‘Analysing the effects of tax–benefit reforms on income distribution:
a decomposition approach’, The Journal of Economic Inequality, vol. 8, no. 1, pp. 1–21.
Bargain, O., Callan, T., Doorley, K. & Keane, C. (2013) ‘Changes in income distributions and the role
of tax–benefit policy during the great recession: An international perspective’, IZA Discussion
Paper 7737.
Barro, R. J. (1990) ‘Government spending in a simple model of endogeneous growth’, Journal of
Political Economy, vol. 98, no. 5, pp. S103–S126.
Bontout, O. & Lokajickova, T. (2013) ‘Social protection budgets in the crisis in the EU’, European
Commission DG EMPLWorking Paper 1/2013, Publications Office of the European Union,
Luxembourg.
Bourguignon, F., Bussolo, M. & Da Silva, L. P. (2008) ‘The impact of macro-economic policies on
poverty and income distribution Macro-Micro Evaluation Techniques and Tools’, The World
Bank and Palgrave-Macmillan, New York.
Brandolini, A., D’Amuri, F. & Faiella, I. (2013) ‘Country case study – Italy’, in The Great Recession
and the Distribution of Household Income, eds S. P. Jenkins, A. Brandolini, J. Micklewright &
B. Nolan, Oxford University Press, Oxford.
Brewer, M., Browne, J. & Joyce, R. (2011) ‘Child and working-age poverty from 2010 to 2020’, IFS
Commentary C121, Institute for Fiscal Studies, London.
Browne, J. & Levell, P. (2010) ‘The distributional effect of tax and benefit reforms to be introduced
between June 2010 and April 2014: a revised assessment’, IFS Briefing Note 108, Institute for
Fiscal Studies, London.
Callan, T., Nolan, B. & Walsh, J. (2011) ‘The economic crisis, public sector pay, and the income
distribution’, in Who Loses in the Downturn? Economic Crisis, Employment and Income
Distribution, eds H. Immervoll, A. Peichl & K. Tatsiramos, vol. 32, Research in Labour
Economics, Emerald Group Publishing Limited, Bingley, pp. 207–225.
Corsetti, G. J., Meier, A. & Muller, G. (2012) ‘What determines government spending multipliers?’,
Economic Policy, vol. 27, no. 72, pp. 521–565.
Dolls, M., Fuest, C. & Peichl, A. (2012) ‘Automatic stabilizers and economic crisis: US vs. Europe’,
Journal of Public Economics, vol. 96, no. 3–4, pp. 279–294.
EC. (2012) ‘European Economic Forecast Autumn 2012’, European Economy 8/2012, European
Commission, Publications Office of the European Union, Luxembourg.
ECB. (2012) ‘Monthly Bulletin December 2012’, European Central Bank, Frankfurt am Main.
EUROMOD. (2014) ‘Country Reports’, available online at: https://www.iser.essex.ac.uk/euromod/
resources-for-euromod-users/country-reports
Eurostat. Online statistics database (last accessed: March 2014), Eurostat, Luxemburg (2014).
Eyraud, L. & Weber, A. (2013) ‘The challenge of debt reduction during fiscal consolidation’, IMF
Working Paper 13/67.
Goedeme, T. (2010) ‘The standard error of estimates based on EU-SILC. An exploration through the
Europe 2020 poverty indicators’, Working Paper 10/09, Herman Deleeck Centre for Social
Policy, University of Antwerp.
Goujard, A. (2013) ‘Cross-country spillovers from fiscal consolidation’, OECD Economics
Department Working Paper No. 1099, OECD Publishing.
IMF. (2012) ‘World Economic Outlook: coping with high debt and sluggish growth’, Washington.
Jenkins, S. P., Brandolini, A., Micklewright, J. & Nolan, B. (2013) The Great Recession and the
Distribution of Household Income, Oxford University Press, Oxford.
Jorda, O. & Taylor, A. M. (2013) ‘The time for austerity: estimating the average treatment effect of
fiscal policy’, Paper presented at the NBER Summer Institute.
Joyce, R. & Sibieta, L. (2013) ‘Country case study – UK’, in The Great Recession and the Distribution
of Household Income, eds S. P. Jenkins, A. Brandolini, J. Micklewright & B. Nolan, Oxford
University Press, Oxford.
South European Society and Politics 411
Dow
nloa
ded
by [
Van
Pel
t and
Opi
e L
ibra
ry]
at 0
2:38
16
Oct
ober
201
4

Koutsampelas, C. & Policarpou, A. (2013) ‘Austerity and the income distribution: the case of Cyprus’,EUROMOD Working Paper EM4/13, ISER, University of Essex.
Leventi, C. & Matsaganis, M. (2013) ‘Distributional implications of the crisis in Greece in 2009-2012’, EUROMOD Working Paper EM14/13, ISER, University of Essex.
Leventi, C., Navicke, J., Rastrigina, O., Sutherland, H., Ozdemir, E. & Ward, T. (2013) ‘Nowcasting:estimating developments in the risk of poverty and income distribution in 2012 and 2013’,Research Note 1/2013, Social Situation Monitor, European Commission.
Nolan, B., Callan, T. & Maıtre, B. (2013) ‘Country case study – Ireland’, in The Great Recession andthe Distribution of Household Income, eds S. P. Jenkins, A. Jenkins, J. Micklewright & B. Nolan,Oxford University Press, Oxford.
OECD. (2013) ‘How much scope for growth and equity-friendly fiscal consolidation?’, OECDEconomics Department Policy Notes No. 20, July 2013.
OECD. (2014) ‘OECD forecasts during and after the financial crisis: a post mortem’, OECDEconomics Department Policy Notes No. 23, February 2014.
Paulus, A., Sutherland, H. & Tsakloglou, P. (2010) ‘The distributional impact of in-kind publicbenefits in European countries’, Journal of Policy Analysis and Management, vol. 29, no. 2,pp. 243–266.
Romer, C. D. & Romer, D. H. (2010) ‘The macroeconomic effects of tax changes: estimates based on anew measure of fiscal shocks’, American Economic Review, vol. 100, no. 3, pp. 763–801.
Salgado, M. F., Figari, F., Sutherland, H. & Tumino, A. (2014) ‘Welfare compensation forunemployment in the Great Recession’, Review of Income and Wealth, vol. 60, no. S1,pp. S177–S204.
Sutherland, H. & Figari, F. (2013) ‘EUROMOD: the European Union tax–benefit microsimulationmodel’, International Journal of Microsimulation, vol. 6, no. 1, pp. 4–26.
Verbist, G. & Matsaganis, M. (2014) ‘The redistributive capacity of services in the EU’, in ReconcilingWork and Poverty Reduction: How Successful are European Welfare States? eds B. Cantillon &F. Vandenbroucke, Oxford University Press, Oxford.
Woo, J., Bova, E., Kinda, T. & Zhang, Y. S. (2013) ‘Distributional consequences of fiscal consolidationand the role of fiscal policy: what do the data say?’ IMF Working Paper 13/195, Washington.
Manos Matsaganis is an Associate Professor of European Social and EmploymentPolicies at the Department of International and European Economics, Athens
University of Economics and Business. He has published widely on the social impact ofthe economic crisis and the political economy of the welfare state in Greece and
beyond. He is the coordinator of the Policy Analysis Research Unit (www.paru.gr).
Chrysa Leventi is a Senior Research Officer at the Institute for Social and EconomicResearch (ISER), University of Essex, and PhD candidate at the Department of
International and European Economic Studies, Athens University of Economics andBusiness. Her research interests lie in the fields of tax–benefit microsimulationmodelling for policy analysis, pension policy and reforms, and tax evasion.
Appendix
An Online Appendix is available for this article which can be accessed via the online version of thisjournal available at: http://dx.doi.org/ 10.1080/13608746.2014.947700
412 M. Matsaganis and C. Leventi
Dow
nloa
ded
by [
Van
Pel
t and
Opi
e L
ibra
ry]
at 0
2:38
16
Oct
ober
201
4