Embed Size (px)
Citation preview
Community Cohesion Project Team and LPIG Draft 3 October 2006
The Diversity of Leicester: A Demographic Profile
October 2006 Prepared by the Leicester City Council and the Leicester Partnership
Foreword This booklet paints a picture of the people of Leicester. It tells how many people live in the city, their age and ethnicity, the faiths they follow and the languages they speak. It also reveals where and how they live, and many of the important issues facing the different groups of people who choose to live here. The purpose of this booklet is to provide a ready source of information in an easily accessible format for managers and other officers of local agencies responsible for designing and delivering services to the people of Leicester. This story of Leicester is based on both hard statistical data and soft local intelligence. Inevitably statistics become dated and trends change and, while important for revealing broad pictures, they can also fail to highlight interesting and important local information. The story provides a snapshot in time. It describes both the now, and what is expected in the future: how Leicester compares with other cities both in the East Midlands region and elsewhere, and to averages for England. Only the most significant information has been included and inevitably much has been left out. Wherever possible, the location of more extensive information has been included for those who would like to know more. Of special importance is the detailed statistical evidence on Leicester brought together in the Leicester Shire Online Research Atlas, known as LSORA (www.lsora.org). This booklet has been prepared by the Community Cohesion Project Team and the Leicester Partnership Information Group - both sub-groups of the Leicester Partnership. It is hoped that through this booklet the rich diversity of the people who live in Leicester may be more readily understood. Roger Blackmore Leader, Leicester City Council Bernard Greaves Chair, Leicester Partnership
Contents Population Information: Age, Ethnicity, Faiths, Languages and New Arrivals 1 Age 1 Ethnicity 1 Ethnicity and Population Projections 3 Faiths in Leicester 3 Languages in Leicester 5 New Arrivals
6
Socio-Economic Information: Poverty, Health, Employment, & Education 7 Poverty and Deprivation 9 Employment and Ethnicity 10 Skills 11 Educational Attainment 12 Health 14 Housing
14
Community Cohesion 15 Sense of Belonging 15 Sites of Cross-Cultural Mixing 15 Participation
Data Sources 16Tables, Charts, Maps and Diagrams
Chart 1 Population Pyramid of Leicester (against UK average) 1 Chart 2 Leicester Population by age and ethnicity 2 Chart 3 Percentage of Primary School Pupils where first language is
known or believed to be other than English (Jan 2005) 6
Chart 4 Free School Meals, January 2006 10 Chart 5 Employment rates by ethnic Groups 11 Chart 6 GCSE Results – 5 or more A*-C Ethnic Groups 2005 13 Chart 7 GCSE Results – 5 or more A*-C Ethnicity & Gender 2005 13 Chart 8 Percent of People Describing their General Health as ’Good’ 15 Table 1 Ethnic composition of Leicester 2 Table 2 Average age of ethnic groups in Leicester 2 Table 3 Patterns of segregation in Leicester and other English cities 8 Table 4 Asian presence in deprived areas, 2001 9 Table 5 Employment rates amongst ethnic groups, England 2002/03 11 Table 6 % of working population in Leicester with no qualifications 12 Table 7 Literacy and Numeracy Levels in Leicester 12 Table 8 Satisfaction with Leicester as a place to live 16 Table 9 Sense of Belonging in Leicester 16 Table 10 Sites of Cross-Cultural Interaction 16 Map 1 Distribution of Hindu communities in Leicester 4 Map 2 Distribution of Muslim communities in Leicester 4 Map 3 Neighbourhoods by socio-economic characteristics 7 Map 4 Top 5% Deprived Areas Nationally in Leicester 10 Map 5 Distribution of GCSE scores in Leicester, 2001/02 14 Diagram 1 Faith communities in Leicester 5 Diagram 2 Additional languages other than English spoken in Leicester 5
1
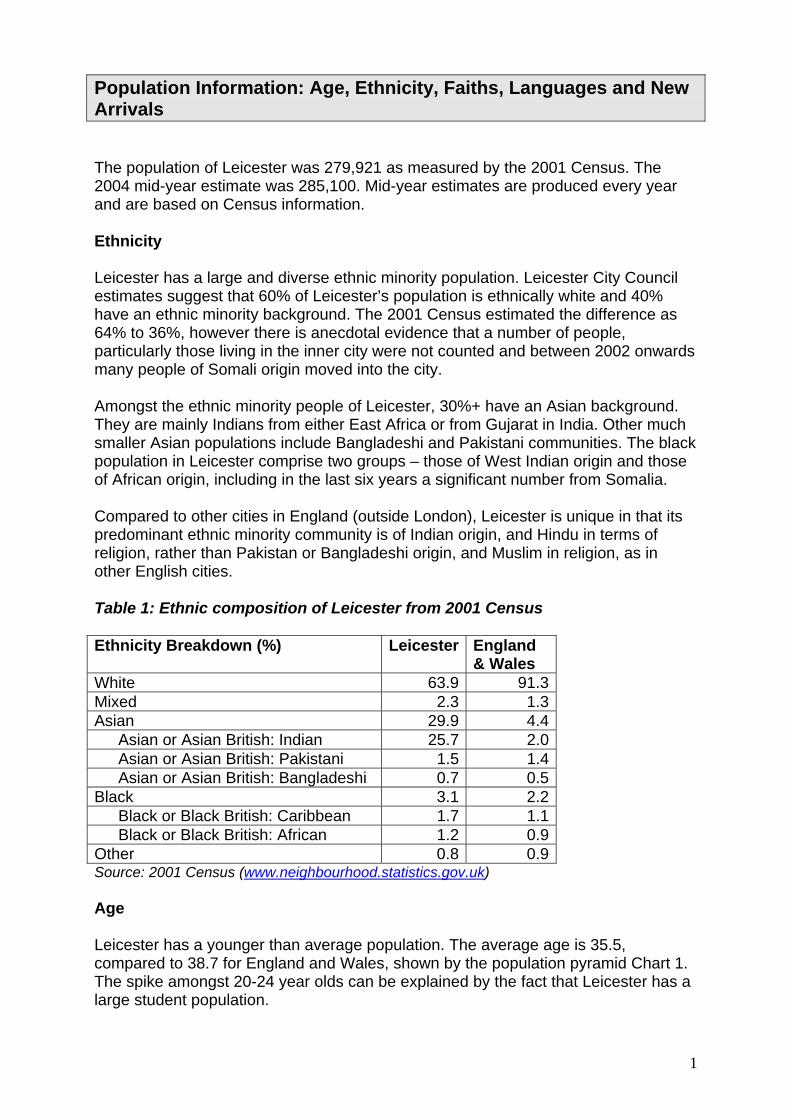
Population Information: Age, Ethnicity, Faiths, Languages and New Arrivals The population of Leicester was 279,921 as measured by the 2001 Census. The 2004 mid-year estimate was 285,100. Mid-year estimates are produced every year and are based on Census information. Ethnicity Leicester has a large and diverse ethnic minority population. Leicester City Council estimates suggest that 60% of Leicester’s population is ethnically white and 40% have an ethnic minority background. The 2001 Census estimated the difference as 64% to 36%, however there is anecdotal evidence that a number of people, particularly those living in the inner city were not counted and between 2002 onwards many people of Somali origin moved into the city. Amongst the ethnic minority people of Leicester, 30%+ have an Asian background. They are mainly Indians from either East Africa or from Gujarat in India. Other much smaller Asian populations include Bangladeshi and Pakistani communities. The black population in Leicester comprise two groups – those of West Indian origin and those of African origin, including in the last six years a significant number from Somalia. Compared to other cities in England (outside London), Leicester is unique in that its predominant ethnic minority community is of Indian origin, and Hindu in terms of religion, rather than Pakistan or Bangladeshi origin, and Muslim in religion, as in other English cities. Table 1: Ethnic composition of Leicester from 2001 Census Ethnicity Breakdown (%) Leicester England
& Wales White 63.9 91.3Mixed 2.3 1.3Asian 29.9 4.4
Asian or Asian British: Indian 25.7 2.0Asian or Asian British: Pakistani 1.5 1.4Asian or Asian British: Bangladeshi 0.7 0.5
Black 3.1 2.2Black or Black British: Caribbean 1.7 1.1Black or Black British: African 1.2 0.9
Other 0.8 0.9Source: 2001 Census (www.neighbourhood.statistics.gov.uk) Age Leicester has a younger than average population. The average age is 35.5, compared to 38.7 for England and Wales, shown by the population pyramid Chart 1. The spike amongst 20-24 year olds can be explained by the fact that Leicester has a large student population.
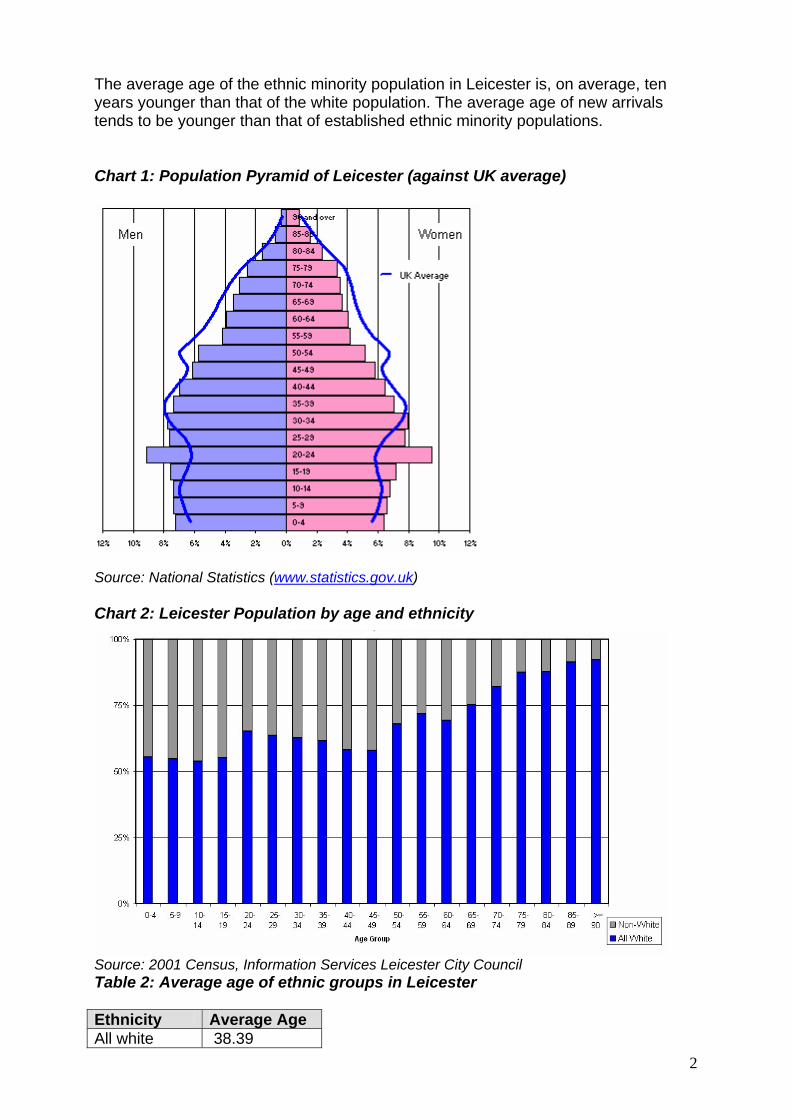
The average age of the ethnic minority population in Leicester is, on average, ten years younger than that of the white population. The average age of new arrivals tends to be younger than that of established ethnic minority populations.
2
ource: National Statistics (www.statistics.gov.uk
Chart 1: Population Pyramid of Leicester (against UK average)
S )
hart 2: Leicester Population by age and ethnicity C
Source: 2001 Census, Information Services Leicester City Council Table 2: Average age of ethnic groups in Leicester Ethnicity Average Age All white 38.39
3
ite All non wh 30.36 Black 28.1 Indian 31.82Pakistani 25.99 Bangladeshi 24.12 Source: 2001 Cen w.neighbourhood.statistics.gov.uksus (ww )
thnicity and Population Projections
here was a 7% increase in ethnic minority residents between the 1991 Census and
aiths in Leicester
he largest faith communities in Leicester are the Christian communities at 44.7% of
ccording to xxx xxx Leicester has one of the highest rates of attendance at faith
eicester has 243 places of worship including 42 mosques, 16 Hindu temples, 6 Sikh
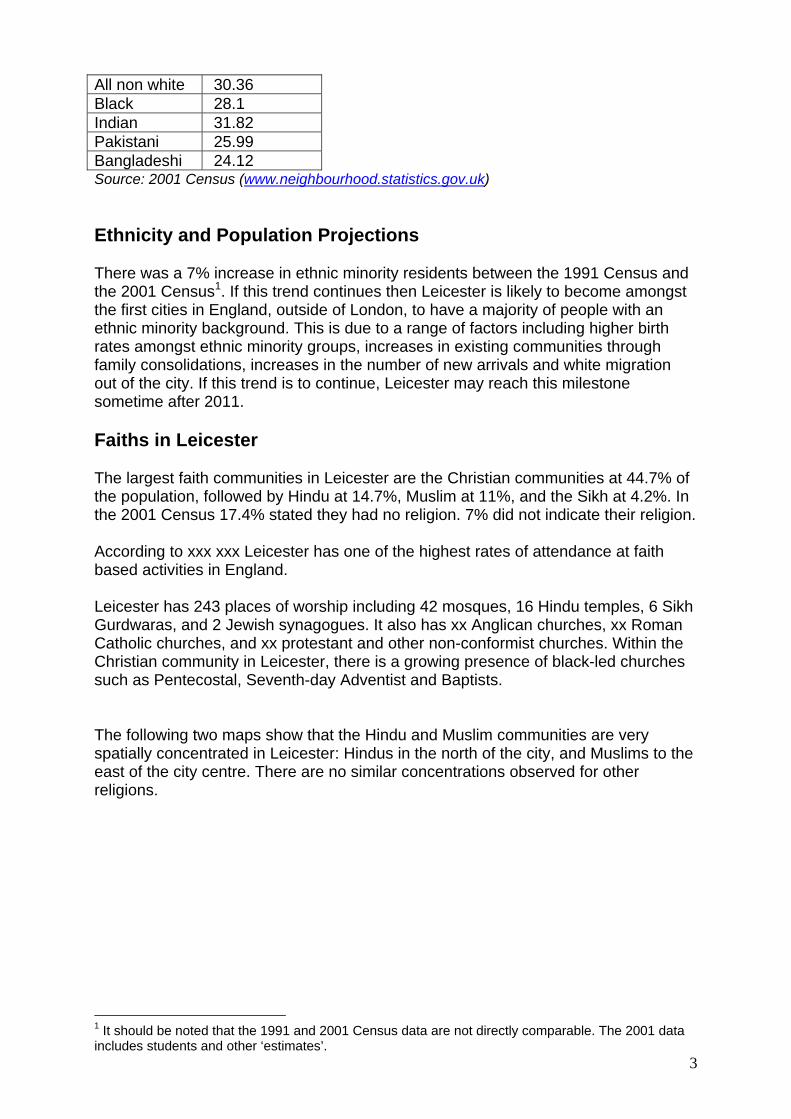
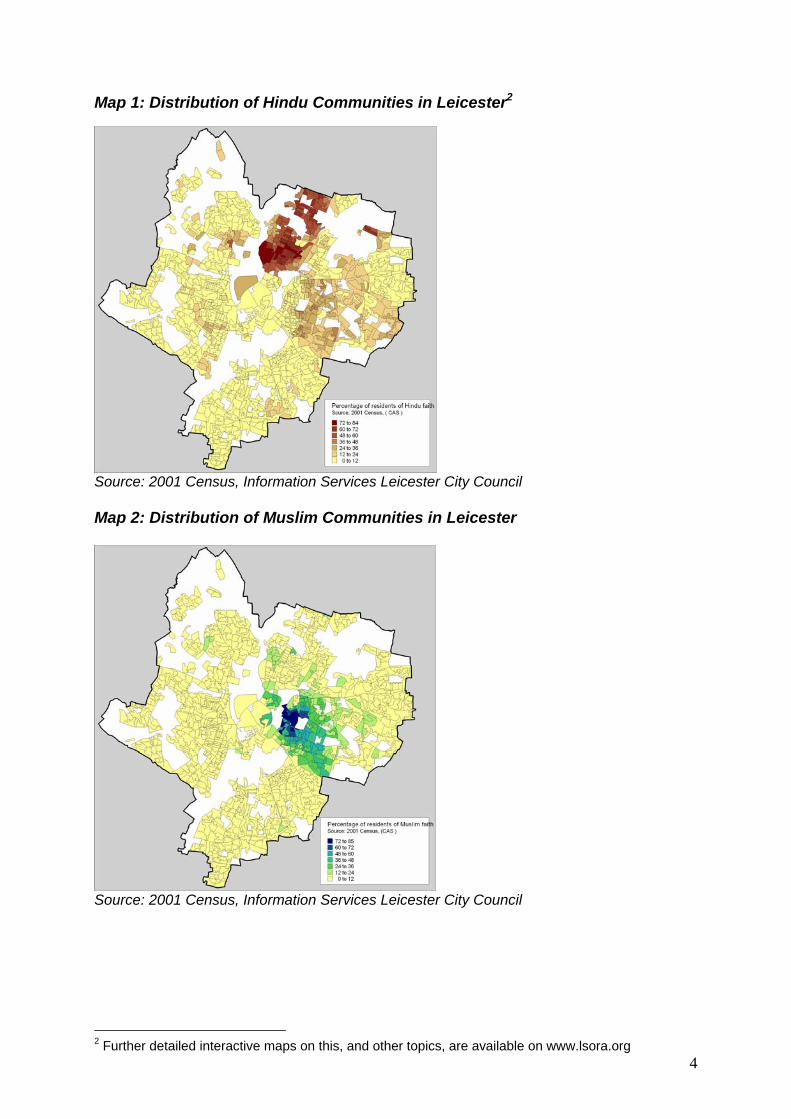
he following two maps show that the Hindu and Muslim communities are very o the
E Tthe 2001 Census1. If this trend continues then Leicester is likely to become amongst the first cities in England, outside of London, to have a majority of people with an ethnic minority background. This is due to a range of factors including higher birthrates amongst ethnic minority groups, increases in existing communities through family consolidations, increases in the number of new arrivals and white migrationout of the city. If this trend is to continue, Leicester may reach this milestone sometime after 2011. F Tthe population, followed by Hindu at 14.7%, Muslim at 11%, and the Sikh at 4.2%. In the 2001 Census 17.4% stated they had no religion. 7% did not indicate their religion. Abased activities in England. LGurdwaras, and 2 Jewish synagogues. It also has xx Anglican churches, xx Roman Catholic churches, and xx protestant and other non-conformist churches. Within the Christian community in Leicester, there is a growing presence of black-led churches such as Pentecostal, Seventh-day Adventist and Baptists. Tspatially concentrated in Leicester: Hindus in the north of the city, and Muslims teast of the city centre. There are no similar concentrations observed for other religions.
1 It should be noted that the 1991 and 2001 Census data are not directly comparable. The 2001 data includes students and other ‘estimates’.
Map 1: Distribution of Hindu Communities in Leicester2
Source: 2001 Census, Information Services Leicester City Council
4
ource: 2001 Census, Information Services Leicester City Council
Map 2: Distribution of Muslim Communities in Leicester
S
2 Further detailed interactive maps on this, and other topics, are available on www.lsora.org
5
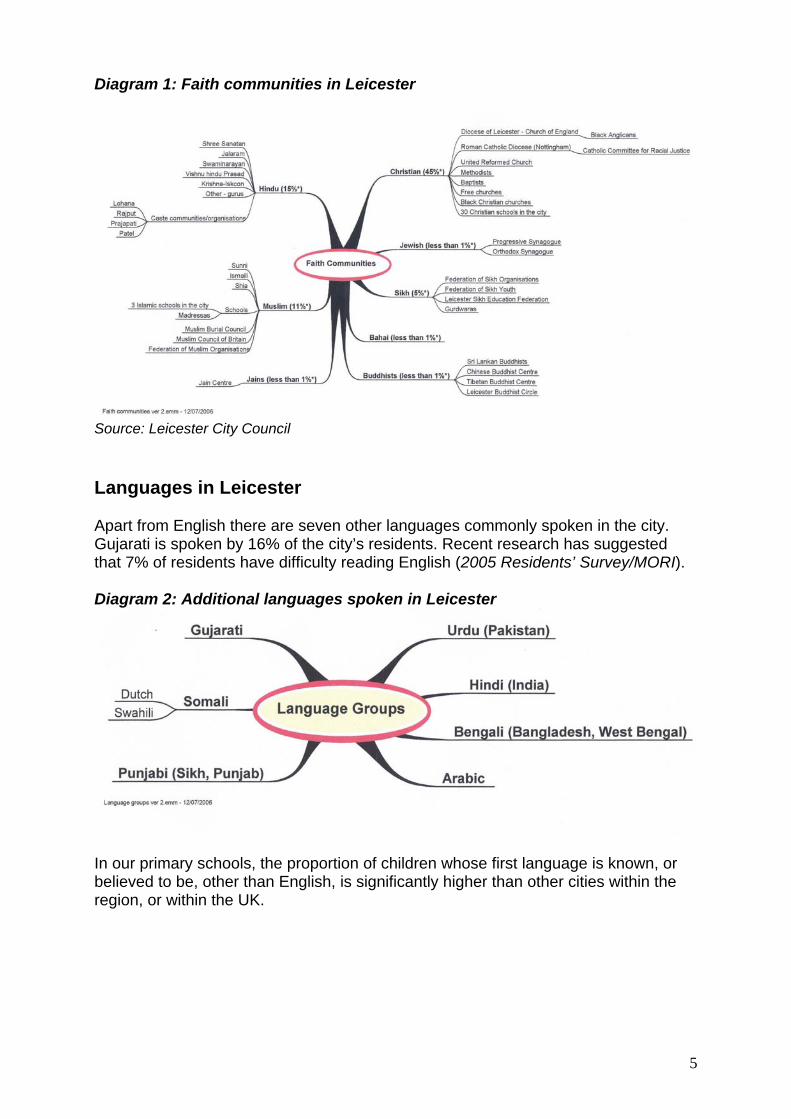
iagram 1: Faith communities in Leicester D
Source: Leicester City Council
anguages in Leicester
part from English there are seven other languages commonly spoken in the city.
).
iagram 2: Additional languages spoken in Leicester
our primary schools, the proportion of children whose first language is known, or
L AGujarati is spoken by 16% of the city’s residents. Recent research has suggested that 7% of residents have difficulty reading English (2005 Residents’ Survey/MORI D
Inbelieved to be, other than English, is significantly higher than other cities within the region, or within the UK.
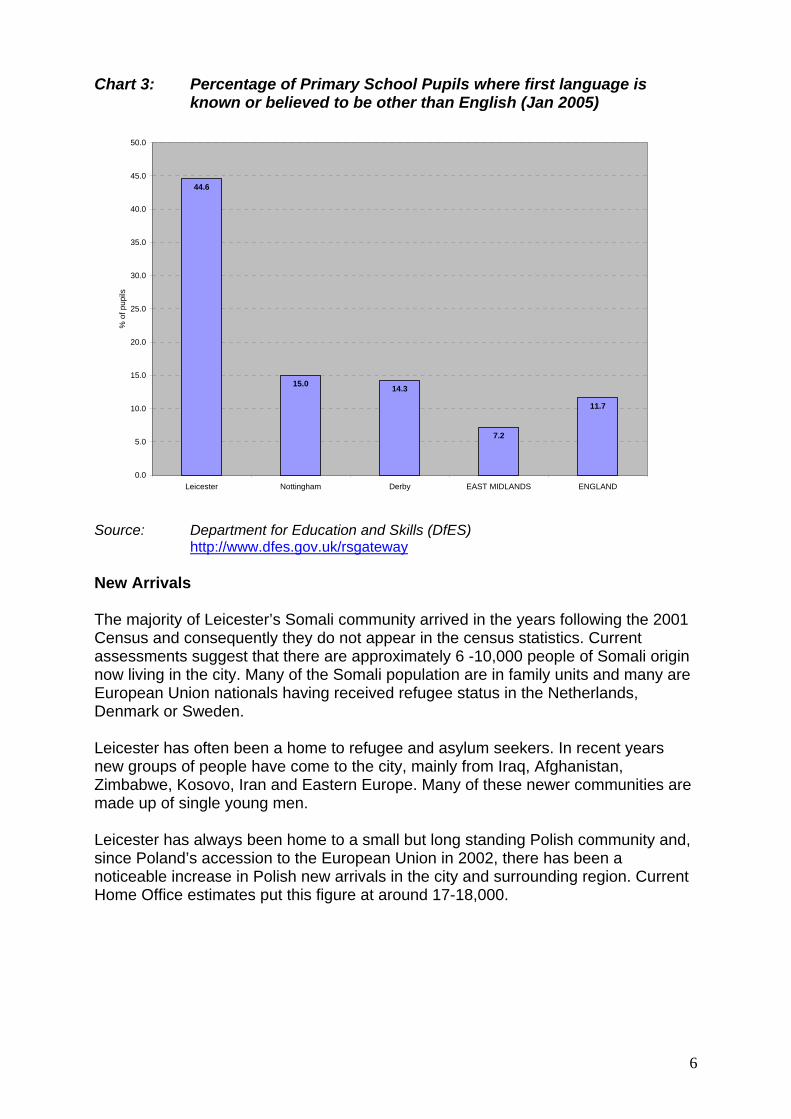
Chart 3: Percentage of Primary School Pupils where first language is known or believed to be other than English (Jan 2005)
44.6
15.0 14.3
7.2
11.7
0.0
5.0
10.0
15.0
20.0
25.0
30.0
35.0
40.0
45.0
50.0
Leicester Nottingham Derby EAST MIDLANDS ENGLAND
% o
f pup
ils
Source: Department for Education and Skills (DfES) http://www.dfes.gov.uk/rsgateway New Arrivals The majority of Leicester’s Somali community arrived in the years following the 2001 Census and consequently they do not appear in the census statistics. Current assessments suggest that there are approximately 6 -10,000 people of Somali origin now living in the city. Many of the Somali population are in family units and many are European Union nationals having received refugee status in the Netherlands, Denmark or Sweden. Leicester has often been a home to refugee and asylum seekers. In recent years new groups of people have come to the city, mainly from Iraq, Afghanistan, Zimbabwe, Kosovo, Iran and Eastern Europe. Many of these newer communities are made up of single young men. Leicester has always been home to a small but long standing Polish community and, since Poland’s accession to the European Union in 2002, there has been a noticeable increase in Polish new arrivals in the city and surrounding region. Current Home Office estimates put this figure at around 17-18,000.
6
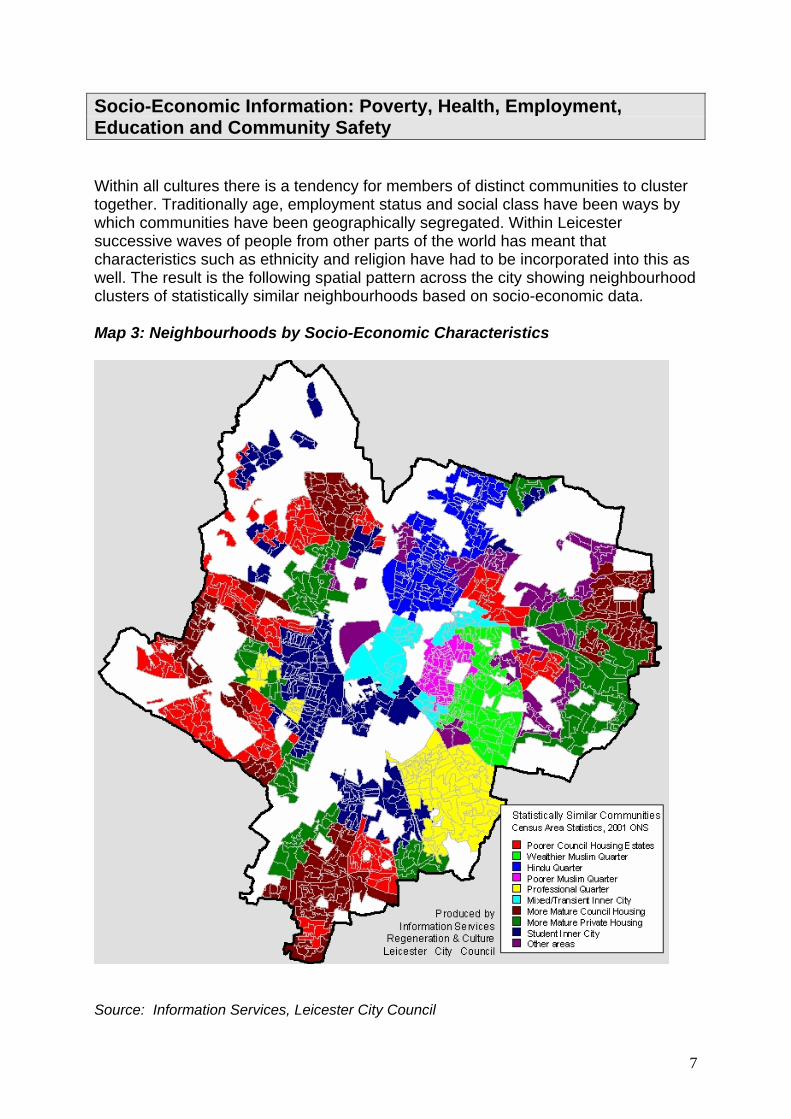
Socio-Economic Information: Poverty, Health, Employment, Education and Community Safety Within all cultures there is a tendency for members of distinct communities to cluster together. Traditionally age, employment status and social class have been ways by which communities have been geographically segregated. Within Leicester successive waves of people from other parts of the world has meant that characteristics such as ethnicity and religion have had to be incorporated into this as well. The result is the following spatial pattern across the city showing neighbourhood clusters of statistically similar neighbourhoods based on socio-economic data. Map 3: Neighbourhoods by Socio-Economic Characteristics
ource: Information Services, Leicester City Council
S
7
8
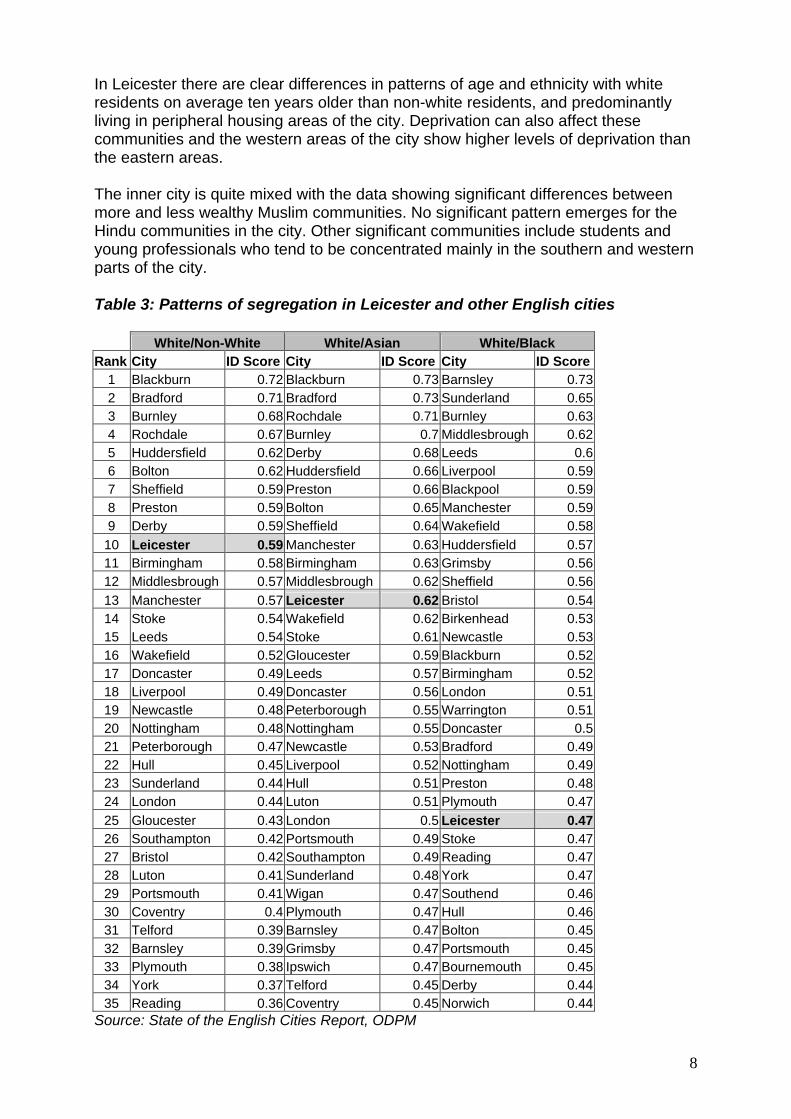
In Leicester there are clear differences in patterns of age and ethnicity with white residents on average ten years older than non-white residents, and predominantly living in peripheral housing areas of the city. Deprivation can also affect these communities and the western areas of the city show higher levels of deprivation than the eastern areas. The inner city is quite mixed with the data showing significant differences between more and less wealthy Muslim communities. No significant pattern emerges for the Hindu communities in the city. Other significant communities include students and young professionals who tend to be concentrated mainly in the southern and western parts of the city. Table 3: Patterns of segregation in Leicester and other English cities White/Non-White White/Asian White/Black Rank City ID Score City ID Score City ID Score
1 Blackburn 0.72 Blackburn 0.73 Barnsley 0.73 2 Bradford 0.71 Bradford 0.73 Sunderland 0.65 3 Burnley 0.68 Rochdale 0.71 Burnley 0.63 4 Rochdale 0.67 Burnley 0.7 Middlesbrough 0.62 5 Huddersfield 0.62 Derby 0.68 Leeds 0.6 6 Bolton 0.62 Huddersfield 0.66 Liverpool 0.59 7 Sheffield 0.59 Preston 0.66 Blackpool 0.59 8 Preston 0.59 Bolton 0.65 Manchester 0.59 9 Derby 0.59 Sheffield 0.64 Wakefield 0.58
10 Leicester 0.59 Manchester 0.63 Huddersfield 0.57 11 Birmingham 0.58 Birmingham 0.63 Grimsby 0.56 12 Middlesbrough 0.57 Middlesbrough 0.62 Sheffield 0.56 13 Manchester 0.57 Leicester 0.62 Bristol 0.54 14 Stoke 0.54 Wakefield 0.62 Birkenhead 0.53 15 Leeds 0.54 Stoke 0.61 Newcastle 0.53 16 Wakefield 0.52 Gloucester 0.59 Blackburn 0.52 17 Doncaster 0.49 Leeds 0.57 Birmingham 0.52 18 Liverpool 0.49 Doncaster 0.56 London 0.51 19 Newcastle 0.48 Peterborough 0.55 Warrington 0.51 20 Nottingham 0.48 Nottingham 0.55 Doncaster 0.5 21 Peterborough 0.47 Newcastle 0.53 Bradford 0.49 22 Hull 0.45 Liverpool 0.52 Nottingham 0.49 23 Sunderland 0.44 Hull 0.51 Preston 0.48 24 London 0.44 Luton 0.51 Plymouth 0.47 25 Gloucester 0.43 London 0.5 Leicester 0.47 26 Southampton 0.42 Portsmouth 0.49 Stoke 0.47 27 Bristol 0.42 Southampton 0.49 Reading 0.47 28 Luton 0.41 Sunderland 0.48 York 0.47 29 Portsmouth 0.41 Wigan 0.47 Southend 0.46 30 Coventry 0.4 Plymouth 0.47 Hull 0.46 31 Telford 0.39 Barnsley 0.47 Bolton 0.45 32 Barnsley 0.39 Grimsby 0.47 Portsmouth 0.45 33 Plymouth 0.38 Ipswich 0.47 Bournemouth 0.45 34 York 0.37 Telford 0.45 Derby 0.44 35 Reading 0.36 Coventry 0.45 Norwich 0.44
Source: State of the English Cities Report, ODPM
9
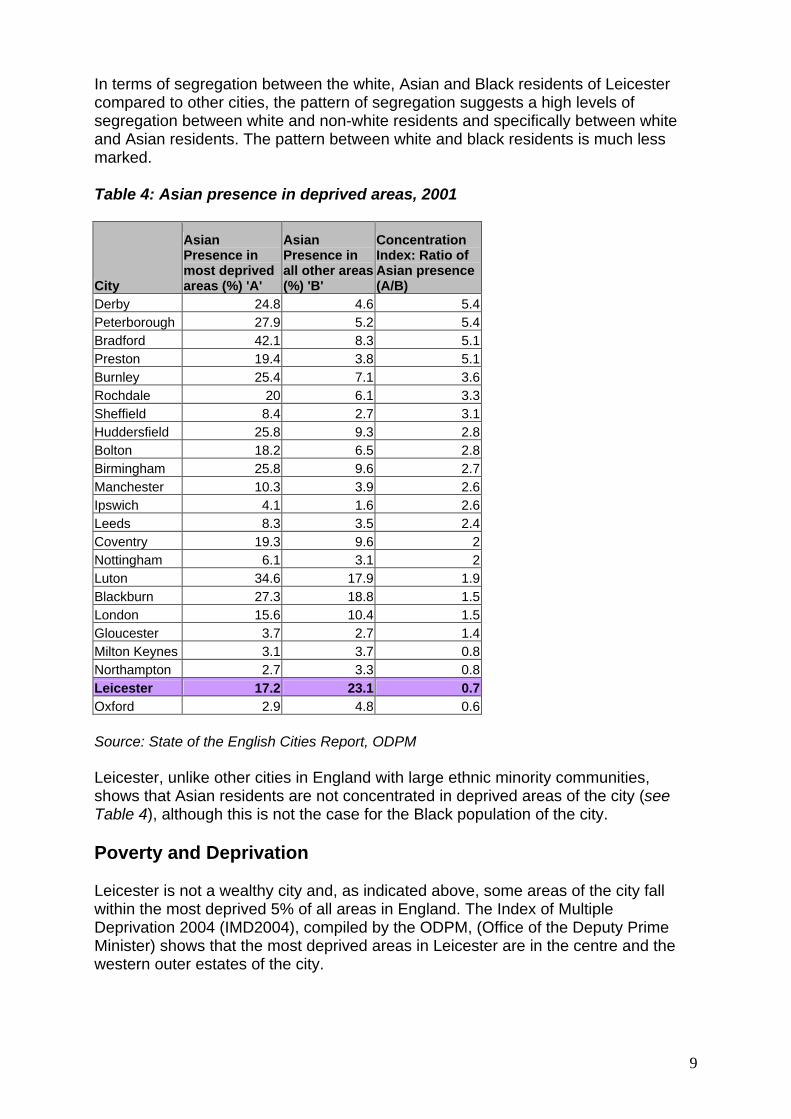
In terms of segregation between the white, Asian and Black residents of Leicester compared to other cities, the pattern of segregation suggests a high levels of segregation between white and non-white residents and specifically between white and Asian residents. The pattern between white and black residents is much less marked. Table 4: Asian presence in deprived areas, 2001
City
Asian Presence in most deprived areas (%) 'A'
Asian Presence in all other areas (%) 'B'
Concentration Index: Ratio of Asian presence (A/B)
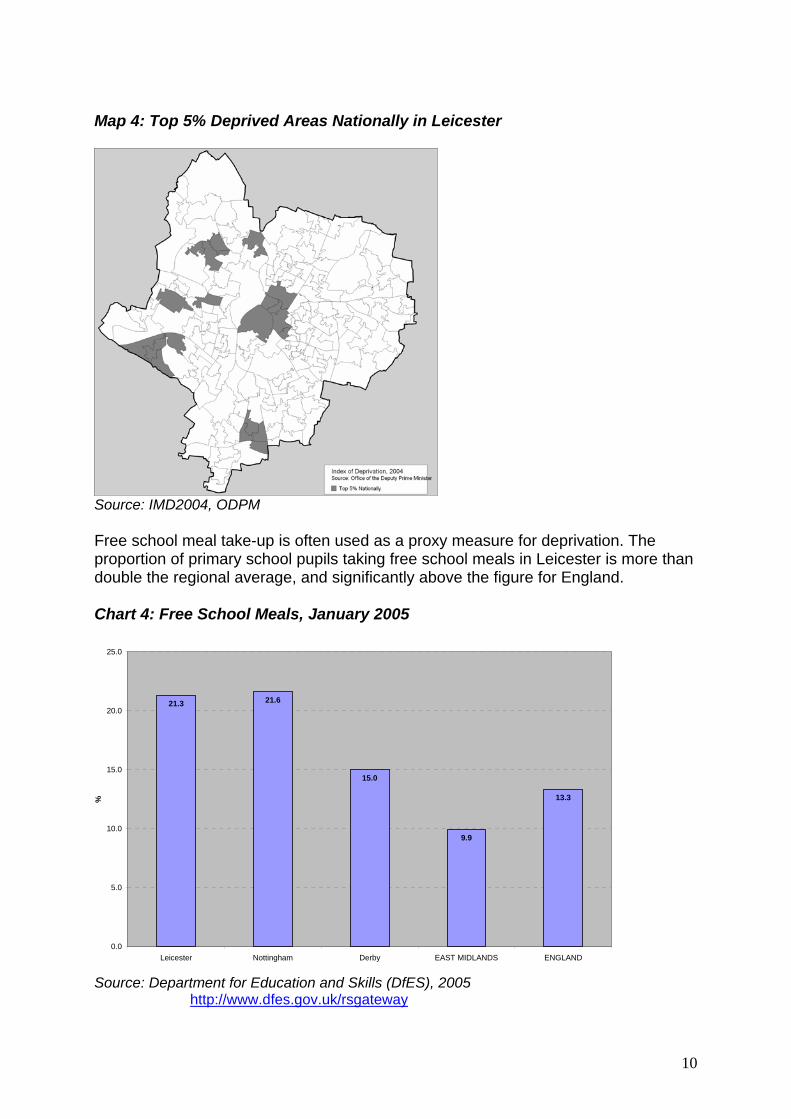
Derby 24.8 4.6 5.4Peterborough 27.9 5.2 5.4Bradford 42.1 8.3 5.1Preston 19.4 3.8 5.1Burnley 25.4 7.1 3.6Rochdale 20 6.1 3.3Sheffield 8.4 2.7 3.1Huddersfield 25.8 9.3 2.8Bolton 18.2 6.5 2.8Birmingham 25.8 9.6 2.7Manchester 10.3 3.9 2.6Ipswich 4.1 1.6 2.6Leeds 8.3 3.5 2.4Coventry 19.3 9.6 2Nottingham 6.1 3.1 2Luton 34.6 17.9 1.9Blackburn 27.3 18.8 1.5London 15.6 10.4 1.5Gloucester 3.7 2.7 1.4Milton Keynes 3.1 3.7 0.8Northampton 2.7 3.3 0.8Leicester 17.2 23.1 0.7Oxford 2.9 4.8 0.6 Source: State of the English Cities Report, ODPM Leicester, unlike other cities in England with large ethnic minority communities, shows that Asian residents are not concentrated in deprived areas of the city (see Table 4), although this is not the case for the Black population of the city. Poverty and Deprivation Leicester is not a wealthy city and, as indicated above, some areas of the city fall within the most deprived 5% of all areas in England. The Index of Multiple Deprivation 2004 (IMD2004), compiled by the ODPM, (Office of the Deputy Prime Minister) shows that the most deprived areas in Leicester are in the centre and the western outer estates of the city.
10
ource: IMD2004, ODPM
ree school meal take-up is often used as a proxy measure for deprivation. The han
hart 4: Free School Meals, January 2005
Map 4: Top 5% Deprived Areas Nationally in Leicester
S Fproportion of primary school pupils taking free school meals in Leicester is more tdouble the regional average, and significantly above the figure for England. C
21.3 21.6
15.0
9.9
13.3
0.0
5.0
10.0
15.0
20.0
25.0
Leicester Nottingham Derby EAST MIDLANDS ENGLAND
%
Source: Department for Education and Skills (DfES), 2005 http://www.dfes.gov.uk/rsgateway
11
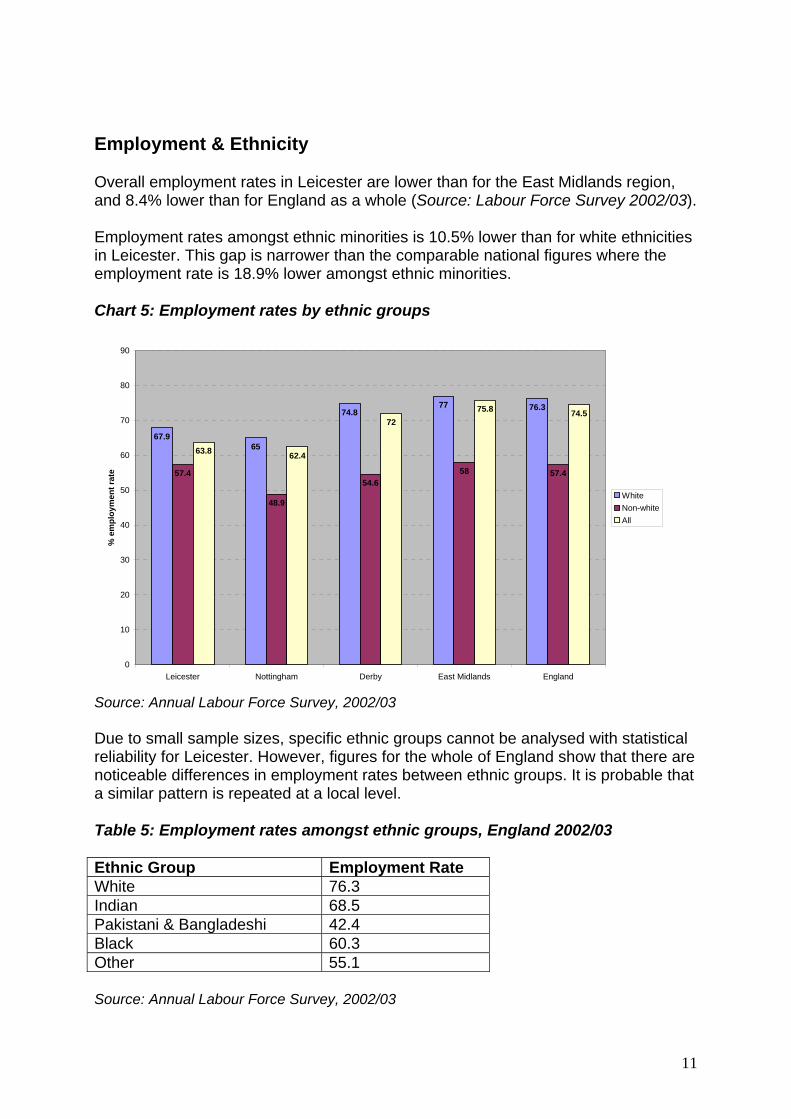
mployment & Ethnicity
verall employment rates in Leicester are lower than for the East Midlands region, ).
mployment rates amongst ethnic minorities is 10.5% lower than for white ethnicities
hart 5: Employment rates by ethnic groups
ue to small sample sizes, specific ethnic groups cannot be analysed with statistical
able 5: Employment rates amongst ethnic groups, England 2002/03
thnic Group Employment Rate
E Oand 8.4% lower than for England as a whole (Source: Labour Force Survey 2002/03 Ein Leicester. This gap is narrower than the comparable national figures where the employment rate is 18.9% lower amongst ethnic minorities. C
67.965
74.877 76.3
57.4
48.9
54.658 57.4
63.8 62.4
7275.8 74.5
0
10
20
30
40
50
60
70
80
90
Leicester Nottingham Derby East Midlands England
% e
mpl
oym
ent r
ate
WhiteNon-whiteAll
Source: Annual Labour Force Survey, 2002/03 Dreliability for Leicester. However, figures for the whole of England show that there arenoticeable differences in employment rates between ethnic groups. It is probable that a similar pattern is repeated at a local level. T EWhite 76.3 Indian 68.5 Pakistani & Bangladeshi 42.4 Black 60.3 Other 55.1 Source: Annual Labour Force Survey, 2002/03
12
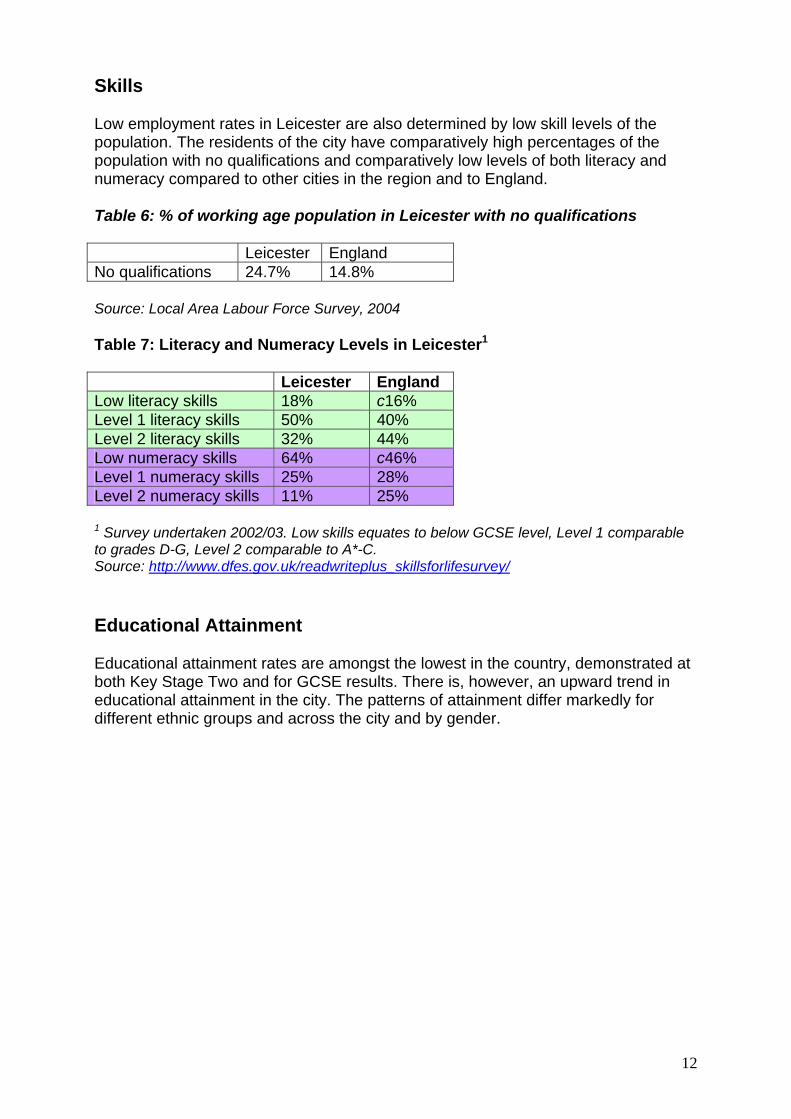
kills
ow employment rates in Leicester are also determined by low skill levels of the
able 6: % of working age population in Leicester with no qualifications
Leicester England
S Lpopulation. The residents of the city have comparatively high percentages of the population with no qualifications and comparatively low levels of both literacy andnumeracy compared to other cities in the region and to England. T No qualifications 24.7% 14.8% Source: Local Area Labour Force Survey, 2004
able 7: Literacy and Numeracy Levels in Leicester1
Leicester England
T Low literacy skills 18% c16% Level 1 literacy skills 50% 40% Level 2 literacy skills 32% 44% Low numeracy skills 64% c46% Level 1 numeracy skills 25% 28% Level 2 numeracy skills 11% 25% 1 Survey undertaken 2002/03. Low skills equates to below GCSE level, Level 1 comparable
_skillsforlifesurvey/to grades D-G, Level 2 comparable to A*-C. Source: http://www.dfes.gov.uk/readwriteplus Educational Attainment
ducational attainment rates are amongst the lowest in the country, demonstrated at Eboth Key Stage Two and for GCSE results. There is, however, an upward trend in educational attainment in the city. The patterns of attainment differ markedly for different ethnic groups and across the city and by gender.
13
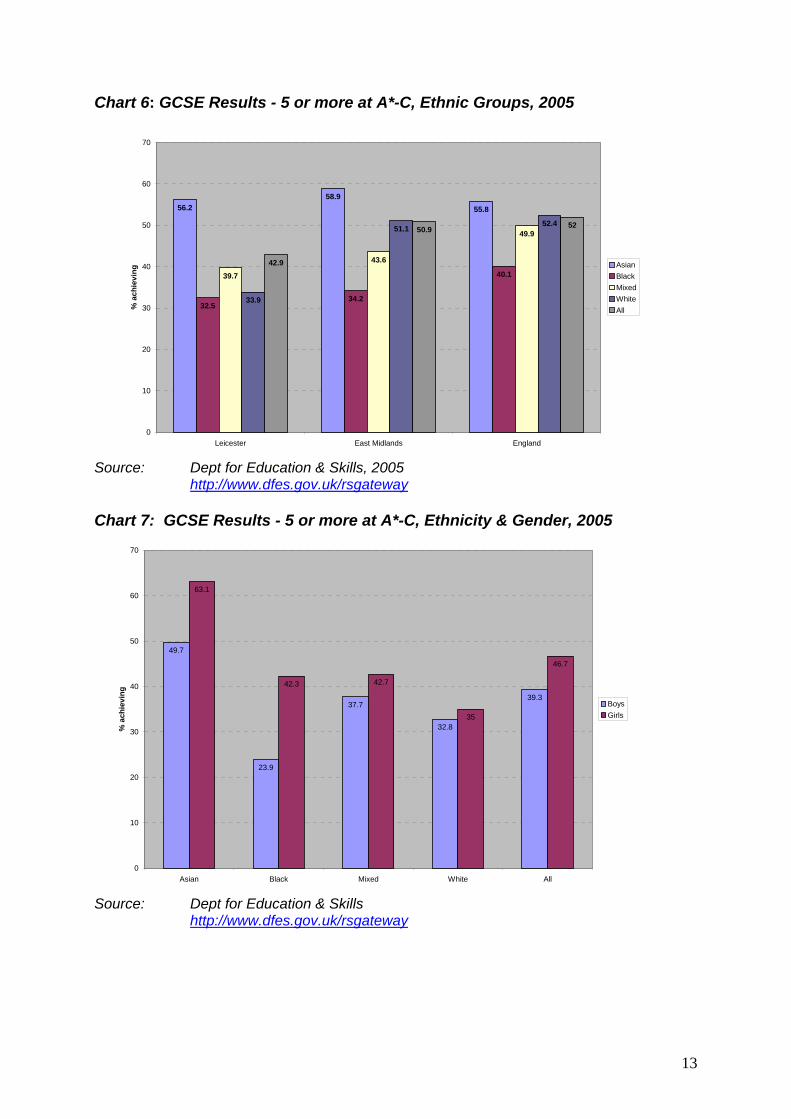
hart 6: GCSE Results - 5 or more at A*-C, Ethnic Groups, 2005 C
Source: Dept for Education & Skills, 2005 http://www.dfes.gov.uk/rsgateway Chart 7: GCSE Results - 5 or more at A*-C, Ethnicity & Gender, 2005
tewaySource: Dept for Education & Skills http://www.dfes.gov.uk/rsga
49.7
23.9
37.7
32.8
39.3
63.1
42.3 42.7
35
46.7
0
10
20
30
40
50
60
Asian Black Mixed White All
% a
chie
ving
70
BoysGirls
56.258.9
55.8
32.534.2
40.139.7
43.6
49.9
33.9
51.152.4
42.9
50.9 52
0
10
20
30
40
50
60
70
Leicester East Midlands England
% a
chie
ving
AsianBlackMixedWhiteAll
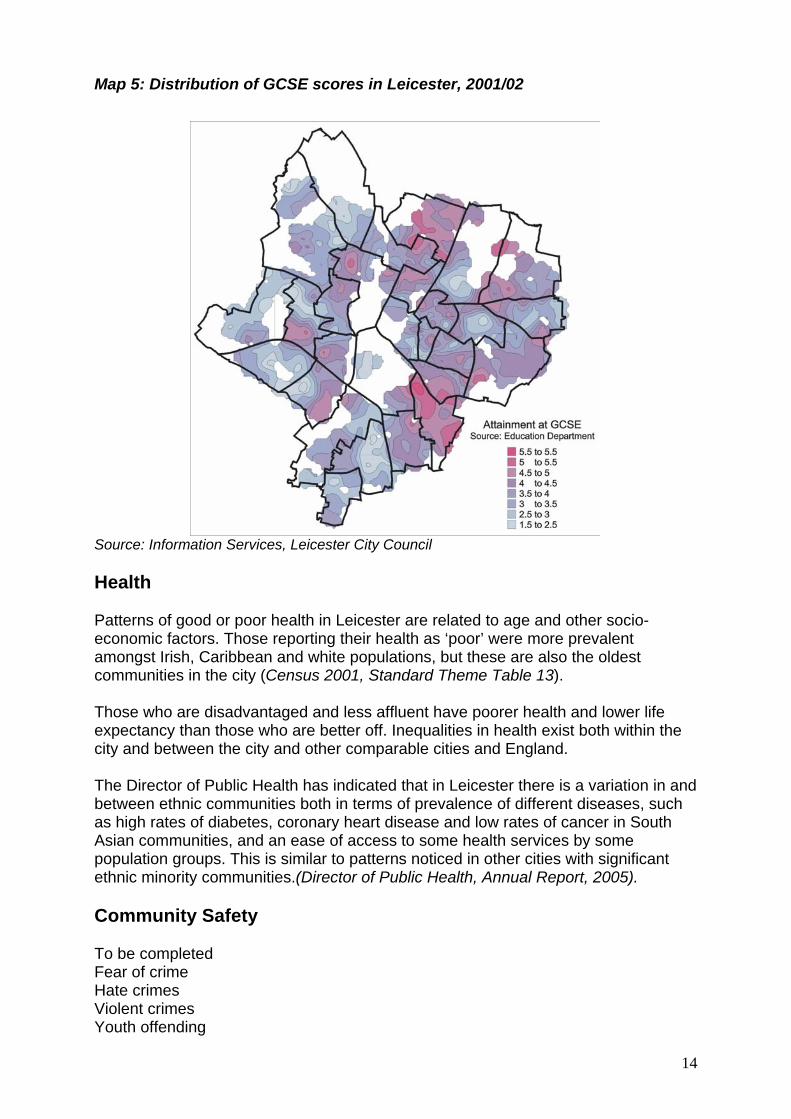
Map 5: Distribution of GCSE scores in Leicester, 2001/02
Source: Information Services, Leicester City Council Health Patterns of good or poor health in Leicester are related to age and other socio-economic factors. Those reporting their health as ‘poor’ were more prevalent amongst Irish, Caribbean and white populations, but these are also the oldest communities in the city (Census 2001, Standard Theme Table 13). Those who are disadvantaged and less affluent have poorer health and lower life expectancy than those who are better off. Inequalities in health exist both within the city and between the city and other comparable cities and England. The Director of Public Health has indicated that in Leicester there is a variation in and between ethnic communities both in terms of prevalence of different diseases, such as high rates of diabetes, coronary heart disease and low rates of cancer in South Asian communities, and an ease of access to some health services by some population groups. This is similar to patterns noticed in other cities with significant ethnic minority communities.(Director of Public Health, Annual Report, 2005). Community Safety To be completed Fear of crime Hate crimes Violent crimes Youth offending
14
15
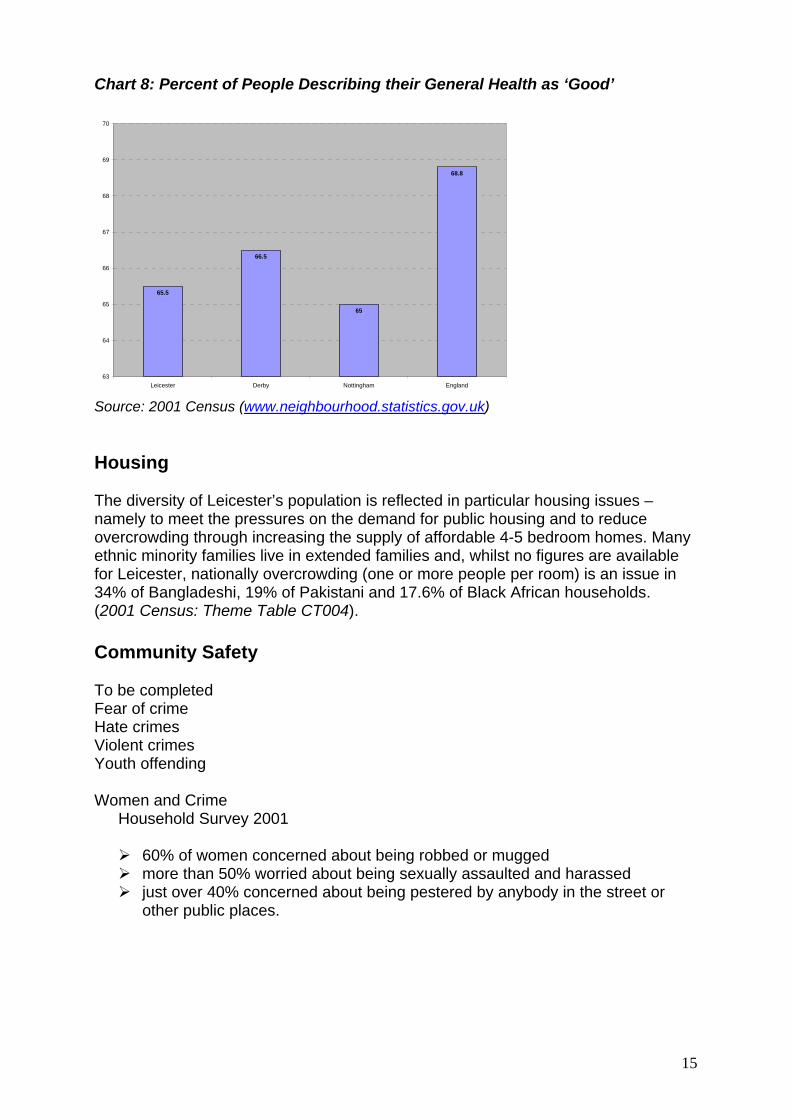
ource: 2001 Census (www.neighbourhood.statistics.gov.uk
Chart 8: Percent of People Describing their General Health as ‘Good’
65.5
66.5
65
68.8
63
64
65
66
67
68
69
70
Leicester Derby Nottingham England
S )
ousing
he diversity of Leicester’s population is reflected in particular housing issues –
any
ommunity Safety
o be completed
s
omen and Crime y 2001
60% of women concerned about being robbed or mugged
harassed t or
H Tnamely to meet the pressures on the demand for public housing and to reduce overcrowding through increasing the supply of affordable 4-5 bedroom homes. Methnic minority families live in extended families and, whilst no figures are available for Leicester, nationally overcrowding (one or more people per room) is an issue in 34% of Bangladeshi, 19% of Pakistani and 17.6% of Black African households. (2001 Census: Theme Table CT004). C TFear of crime Hate crimes Violent crimeYouth offending W
Household Surve
more than 50% worried about being sexually assaulted and just over 40% concerned about being pestered by anybody in the stree
other public places.
16
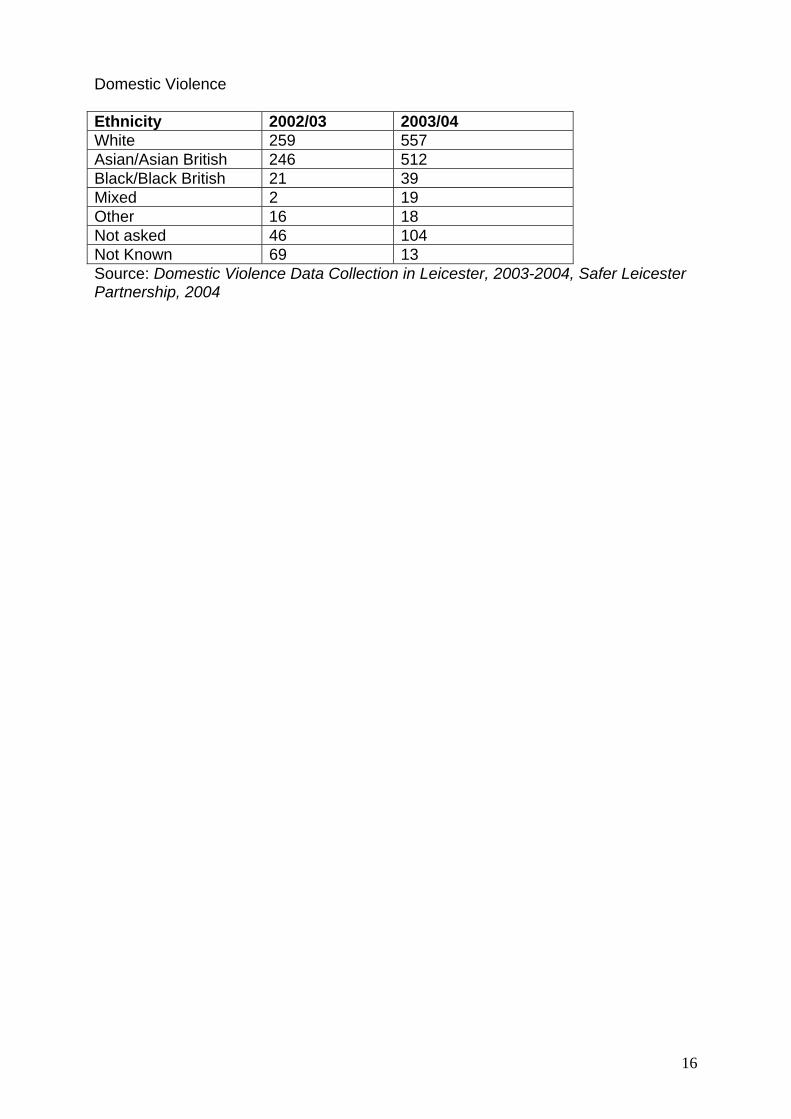
omestic Violence
thnicity 2002/03 2003/04
D EWhite 259 557 Asian/Asian British 246 512 Black/Black British 21 39 Mixed 2 19 Other 16 18 Not asked 46 104Not Known 69 13 Source: Domestic Violen ata Collection eicester, 2003-2004, Safer Leicester ce D in LPartnership, 2004
17
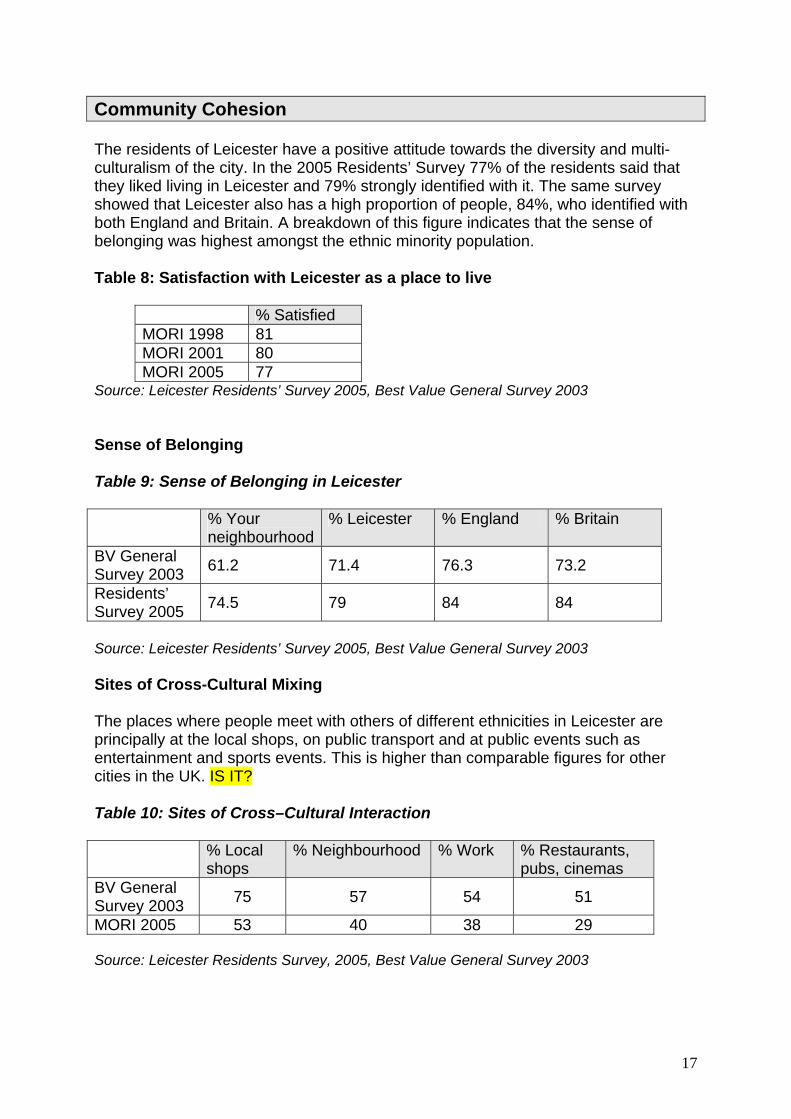
Community Cohesion The residents of Leicester have a positive attitude towards the diversity and multi-culturalism of the city. In the 2005 Residents’ Survey 77% of the residents said that they liked living in Leicester and 79% strongly identified with it. The same survey showed that Leicester also has a high proportion of people, 84%, who identified with both England and Britain. A breakdown of this figure indicates that the sense of belonging was highest amongst the ethnic minority population. Table 8: Satisfaction with Leicester as a place to live
% Satisfied MORI 1998 81 MORI 2001 80 MORI 2005 77
Source: Leicester Residents’ Survey 2005, Best Value General Survey 2003 Sense of Belonging Table 9: Sense of Belonging in Leicester % Your
neighbourhood % Leicester % England % Britain
BV General Survey 2003 61.2 71.4 76.3 73.2
Residents’ Survey 2005 74.5 79 84 84
Source: Leicester Residents’ Survey 2005, Best Value General Survey 2003 Sites of Cross-Cultural Mixing The places where people meet with others of different ethnicities in Leicester are principally at the local shops, on public transport and at public events such as entertainment and sports events. This is higher than comparable figures for other cities in the UK. IS IT? Table 10: Sites of Cross–Cultural Interaction % Local
shops % Neighbourhood % Work % Restaurants,
pubs, cinemas BV General Survey 2003 75 57 54 51
MORI 2005 53 40 38 29 Source: Leicester Residents Survey, 2005, Best Value General Survey 2003
18
Participation Participation levels across the city vary significantly. In both national and local elections the greater the diversity the higher the levels of participation. In the 2003 City Council elections, the four electoral districts with the highest turnout were Latimer 51%, Evington 48%, Spinney Hills 48% and Belgrave 44% and the four with the lowest turnout are Beaumont Leys 22%, Castle 24%, Westcotes 24% and New Parks 24% (Electoral Services, Leicester City Council). The average electoral turnout in Leicester for the 2005 general election was 59%, and for the 2003 local elections 35%. Across England the comparative figures were 61% and 35%. The composition of the 2003-2007 Leicester City Council has xxx members with an ethnic minority background, xxx % of the total members. The first member elected with a minority background was in 1974. Since then the number of members elected with an ethnic minority background has continued to rise until 2002 when there was a slight fall. Data Sources The Leicester Shire Online Research Atlas is a project sponsored by the Leicester Partnership to bring together in one web-based site all the major statistical data on Leicester. The statistical data is accessible for very small areas in table and colour map formats. Access to LSORA can be found at www.lsora.org Information Services, Department of Regeneration and Culture, Leicester City Council also has a wide range of statistical information on Leicester. Key websites include http://www.leicester.gov.uk/about-leicester/city-statistics for general demographic information and http://www.leicester.gov.uk/about-leicester/city-statistics/ward-profiles---2001-census for ward profiles. Other sources of statistical information include the 2001 Census data from the Office of National Statistics http://www.statistics.gov.uk/census2001, and the Neighbourhood Statistics site which provides a wider range of statistical data for local areas http://www.neighbourhood.statistics.gov.uk. Other Data Sources The Home Office’s Research Development and Statistics website, which includes statistics on crime, policing, justice, immigration and drugs http://www.homeoffice.gov.uk/rds/ ODPM website. Contains wide range of information on regeneration, sustainable communities, housing, social exclusion etc http://www.odpm.gov.uk/index.asp?id=1141801 Department for Education and Skills: http://www.dfes.gov.uk/rsgateway/ Department of Health statistics site:

19
http://www.dh.gov.uk/PublicationsAndStatistics/Statistics/fs/en CityStreAtZ: http://citystreatz.leicester.gov.uk Social Atlas: http://www.leicester.gov.uk/about-leicester/social-atlas Public Health information: www.phleicester.org.uk This document has been prepared by Trish Roberts-Thomson and Kurt Coulter, Chief Executive’s Office, Leicester City Council. July 2006