Embed Size (px)
Citation preview
Journal of International Money and Finance21 (2002) 295–350
www.elsevier.com/locate/econbase
The dynamics of emerging market equity flows
G. Bekaerta,d, C.R. Harveyb,d,∗, R.L. Lumsdainec,d
a Columbia University, New York, 10027 USAb Duke University, Durham, NC 27708, USA
c Deutsche Bank, London, EC2N 2DB UKd National Bureau of Economic Research, Cambridge, MA 02138, USA
Abstract
We study the interrelationship between capital flows, returns, dividend yields and worldinterest rates in 20 emerging markets. We estimate a vector autoregression with these variablesto measure the degree to which lower interest rates contribute to increased capital flows andshocks in flows affect the cost of capital among other dynamic relations. We precede the VARanalysis by a detailed examination of endogenous break points in capital flows and the othervariables. These structural breaks are traced to the liberalization of emerging equity markets.Our evidence of structural breaks calls into question past research which estimates VAR mod-els over the full sample. After a liberalization, we find that equity flows increase by 1.4% ofmarket capitalization. We also show that shocks in equity flows initially increase returns whichis consistent with a price pressure hypothesis. While the effect is diminished over time, therealso appears to be a permanent impact. This is consistent with our finding that our proxy forthe cost of capital, the dividend yield, decreases. Finally, our analysis of the transition dyna-mics from pre-liberalization to post-liberalization suggests that when capital leaves, it leavesfaster than it came in. These results may help us understand the dynamics of the recent crisesin Latin America and East Asia. 2002 Published by Elsevier Science Ltd.
JEL classification: F3; F4; G1; E4
∗ Corresponding author. Tel.:+1-919-660-7768; fax:+1-919-660-8030.E-mail address: [email protected] (C.R. Harvey).
0261-5606/02/$ - see front matter 2002 Published by Elsevier Science Ltd.PII: S0261 -5606(02 )00001-3
Journal of International Money and FinancePublished in:
COLUMBIA BUSINESS SCHOOL 1
296 G. Bekaert et al. / Journal of International Money and Finance 21 (2002) 295–350
1. Introduction
With a number of recent crises in emerging markets, the role of foreign capitalin developing countries is under intense scrutiny once again. One country, Malaysia,imposed capital controls on October 1, 1998, in an effort to thwart the perceiveddestabilizing actions of foreign speculators. After a decade of capital market liberaliz-ations and increased portfolio flows into developing countries, this process may nowbe stalled or even reversed. The goal of this paper is to explore the dynamics, causesand consequences of capital flows in 20 emerging markets over the last 20 years.Importantly, we explicitly investigate the role of the recent financial liberalizationprocess in these dynamics.
Our work is related to two literatures. First, there is a growing body of researchthat studies the joint dynamics of capital flows and equity returns [see for example,Warther, 1995; Choe et al., 1999, Froot et al., 2001; Clark and Berko, 1997; Edelenand Warner, 1999; Stulz, 1999]. The first hypothesis of interest is whether foreigninvestors are “return chasers”, in the terms of Bohn and Tesar (1996), that is, areflows caused by changes in expected returns? A related hypothesis is that inter-national investors are momentum investors, leading to a positive relation betweenpast returns and flows. The second set of hypotheses focuses on the effect of flowson returns. Both Froot et al. (focusing on 28 emerging markets) and Clark and Berko(focusing on Mexico) find that increases in capital flows raise stock market prices,but the studies disagree on whether the effect is temporary or permanent. If theincrease in prices is temporary, it may be just a reflection of “price pressure”, whichhas also been documented for mutual fund flows and stock indices [Warther, 1995;Shleifer, 1986]. If the price increase is permanent, it may reflect a long-lastingdecrease in the cost of equity capital associated with the risk sharing benefits ofcapital market openings in emerging markets.
Our work is also related to a second literature on capital market liberalizationsand the integration process in emerging markets [see Bartolini and Drazen, 1997;Bekaert and Harvey, 1995, 2000a,b; Henry, 2000a,b; Kim and Singal, 2000]. Duringthe sample period, many emerging markets removed capital controls, which oftenwent hand in hand with other reforms in the domestic financial system, trade lib-eralization, macro-economic stabilization programs (especially in Latin-America)and large scale privatizations [see Bekaert and Harvey, 2000b for detailed time lineson important structural changes in emerging countries]. These structural changescomplicate any empirical analysis of emerging markets during this period, since theycould cause permanent or at least long-lasting changes in the data-generating pro-cesses. In Bekaert et al. (2002), we use the structural break methodology of Bai,Lumsdaine, and Stock (hereafter BLS) (1998) to “date” when market integrationoccurred and document structural changes in a number of financial and economictime-series.1
1 Kawakatsu and Morey (1999) also use endogenous break point techniques to date stock marketopenings and examine stock market efficiency before and after the opening.
COLUMBIA BUSINESS SCHOOL 2
297G. Bekaert et al. / Journal of International Money and Finance 21 (2002) 295–350
The main tool of analysis in this paper is a vector-autoregressive (VAR) frame-work as in Froot et al. (2001), but with a number of differences. First, we add twovariables to the bivariate set-up of returns and equity flows in Froot et al.: the worldinterest rate and local dividend yields. The low level of US interest rates has oftenbeen cited as one of the major reasons for increased capital flows to emerging mar-kets in 1993 [see World Bank, 1997; as well as Calvo et al. (1993, 1994) and Fernan-dez-Arias, 1996] and our framework will allow us to trace out the effects of anunexpected reduction in world interest rates on capital flows to emerging markets.We are ultimately interested in the effects of structural reforms in emerging marketson local returns and particularly, on the local cost of capital. The inclusion of theworld interest rate helps in that endeavor in that it removes the effect of exogenousglobal determinants of capital flows. We add dividend yields to the VAR as our costof capital measure, since they capture potential permanent price effects induced byincreased foreign capital after liberalizations better than average returns [see Bekaertand Harvey, 2000a] and they also serve as an indicator of expected returns allowingdifferentiation of the ‘return chasing’ and ‘momentum investing’ hypotheses.
Second, we precede our VAR analysis with a detailed endogenous break pointanalysis of our three main time series (net equity flows as a proportion of localmarket capitalization, log returns and the log dividend yield) using the novel tech-niques in BLS (1998) and Bai and Perron (1998a,b). This analysis helps pin downa relevant time-period over which to conduct the VAR analysis but is also interestingin its own right. For example, we study the transition dynamics of some of ourvariables around the break points. Such analysis is particularly important given thatrecent events in South-East Asia indicate that the integration process may now behalted and reversed. Studying capital flow dynamics and their impact on the localmarket may therefore yield predictions for the likely effects of the recent re-impo-sition of capital controls in some countries. Also, if capital market liberalizationsinduce one-time portfolio rebalancing on the part of global investors, one may expectnet flows to increase substantially after a liberalization and then to decrease again[see Bachetta and van Wincoop (2000) for a formal model generating such dynam-ics]. The Bai-Perron statistics look for multiple breaks in a time series and mayuncover such dynamics. We also test this prediction directly.
Third, although equity flows are our main focus, we also investigate how theyrelate to bond flows. For example, increased equity flows may substitute fordecreased bond flows or both may increase simultaneously as a result of a generalfinancial liberalization package.
We find that equity capital flows increase after liberalization but level out threeyears after their liberalization. This provides evidence that foreign investors rebalancetheir portfolios towards the newly available emerging market assets. Our analysis ofthe transition dynamics suggests that the movement of equity capital is much fasterwhen it leaves than when it enters. In general, we find sharply different results ifour models are estimated over the entire sample—which ignores a fundamental non-stationarity in the data—versus a post-break (liberalization) sample. One of our mainfindings is that unexpected equity flows are indeed associated with strong short-livedincreases in returns. However, we also find that they lead to permanent reductions
COLUMBIA BUSINESS SCHOOL 3
298 G. Bekaert et al. / Journal of International Money and Finance 21 (2002) 295–350
in dividend yields. As we explain later, the dividend yield change may reflect achange in the cost of capital. Hence, the reduction in the dividend yield suggeststhat additional flows reduce the cost of capital and that the actual return effect isnot a pure price pressure effect.
The paper is organized as follows. The second section presents the vector autore-gressive empirical model that we use to interpret the relation between expectedreturns, dividend yields and capital flows. The third section explores the methodsthat we use to establish structural breaks in the time-series of interest. The fourthsection describes the data. The results are presented in the fifth and sixth sections.The final section offers some concluding remarks.
2. The econometric framework
2.1. Variables and main hypotheses
Since there is currently no well-accepted model of transition dynamics around aliberalization, we conduct our empirical analysis in the context of vector autore-gressions (VARs). For part of our analysis, these VARs are reduced-form represen-tations of an unspecified structural model, but some of the empirical hypotheses wewant to test require a structural interpretation of the VARs. In our primary empiricalsystem, we generalize the set-up of Froot et al. (2001), who run a bivariate VARon the ratio of net capital flows to market capitalization and market returns. Theirmain identifying structural restriction is that the shock to flows may affect returnsbut not vice versa. In addition, past returns only affect current returns through theireffects on flows. Two interesting questions can be investigated in this framework:
1. What is the effect of an unexpected shock to capital flows on current returns andwhat are its dynamics (that is, does it die out or is it permanent)? The dynamiceffects of the shock serve to distinguish the price pressure hypothesis from thepermanent change in the cost of capital hypothesis.
2. Do past returns affect current capital flows? In particular, Bohn and Tesar (1996)argue that capital flows are motivated by capital “chasing” high expected returns,rather than portfolio rebalancing motives. One issue here is that high past returnsneed not signal high future returns, unless momentum is an important determinantof expected return (see Bohn and Tesar (1997). In our framework, we will beable to distinguish the expected return-updating hypothesis from the momentumhypothesis.
In contrast to previous work, our primary VAR will contain four variables. LetYt � [it,nft,dyt,rt]�, whereit is the world interest rate,nft is the net equity capital flowdivided by market capitalization,dyt is the log-dividend yield andrt is the loggedequity return.
The presence of the world interest rate allows a more subtle testing of the hypoth-eses in (1). It has often been argued that the emerging markets received a lot of US
COLUMBIA BUSINESS SCHOOL 4
299G. Bekaert et al. / Journal of International Money and Finance 21 (2002) 295–350
capital in 1993 because investors were chasing higher yielding assets with interestrates in the US reaching historical lows. It should be mentioned that there may begood reasons for an inverse link between US interest rates and capital flows to emerg-ing markets. For example, the low US interest rates may have increased the Amer-icans’ wealth and therefore increased their risk tolerance, leading them to rebalancetowards riskier emerging market securities. Whatever the reason, our framework willallow a direct test of the magnitude and dynamics of a decrease in the world interestrate on capital flows to emerging markets.
With the world interest rate in the system, we can now divide the effect of highercapital flows on returns into two components. Capital flow increases induced bylower world interest rates may, for example, be less likely to lead to permanent priceincreases than capital flow increases that are not caused by world factors, but alsomay reflect portfolio rebalancing after a capital market liberalization.
The addition of the log-dividend yield is motivated by the work of Bekaert andHarvey (2000a). They argue that the extreme volatility in emerging market returnsimplies that changes in the cost of capital can be better assessed by investigatingchanges in dividend yields. In any rational pricing model, dividend yields will bedecreasing in the growth rate of dividends (cash flows) and increasing in the discountrate. Because of their low variability, dividend yields will capture permanent priceeffects induced by cost of capital changes more accurately than average returns.Bekaert and Harvey document that liberalizations tend to lead to small drops individend yields. One problem is that a lower dividend yield may also reflect animprovement in growth opportunities. Nevertheless, our set-up will allow us to testthe effect of a change in the world interest rate, and/or capital flows on the dividendyield in emerging markets and contrast that with the effect on returns. In addition,given that the dividend yield is a good proxy for expected returns, which is alsoborne out in the predictability tests for emerging markets by Harvey (1995), itsinclusion allows for a proper test of the Bohn-Tesar hypotheses mentioned above.
To perform tests of the main hypotheses, we use impulse response analysis basedon a structural interpretation of the VAR. Consider, without loss of generality, afirst-order VAR, suppressing the constant:
Yt � AYt�1 � et, (1)
with all eigenvalues ofA having moduli less than one so that the VAR is stationary.We compute impulse responses,IR(i,j,k) � ∂e�iYt�k /∂e∗t,j, wheree∗t,j are the “struc-
tural” shocks andei is an indicator variable selecting theith variable, e.g.e1 =[1,0,0,0]. We look at one standard deviation shocks. The structural shocks,e∗
t,j, aredetermined by the ordering in the VAR, that is,et � P�e∗t , whereP is an upper-triangular matrix ande∗t are uncorrelated structural shocks, such that� �E[et e�t] � P�P.
The ordering of the variables is as defined above, with the world interest ratecoming first. Hence, the world interest residual is implicitly assumed not to be affec-ted by the other shocks in the system. As in Froot et al. (2001), we order flowsbefore returns, but we insert the dividend yield in the middle. Dividend yields andreturns are contemporaneously negatively correlated, but a shock to the dividend
COLUMBIA BUSINESS SCHOOL 5
300 G. Bekaert et al. / Journal of International Money and Finance 21 (2002) 295–350
yield may reflect a near-permanent price change due to the liberalization process ora change in expected returns, and it is therefore natural to order dividend yieldsbefore returns. We are interested in:
1. the effects of the world interest rate, it, on the ratio of net capital flows to marketcapitalization, returns and dividend yields,
2. the impact of flows on returns and dividend yields to test the price pressure versuspermanent impact hypotheses, and
3. the effect of past returns and dividend yields on flows to test ‘return chasing’ and‘momentum investing’.
For this last response, our setup removes the contemporaneous correlation betweenreturns or dividend yields and flows, ascribed potentially to price pressure effects,because flows are ordered before these two variables. For example, a shock to thedividend yield not contemporaneously correlated with capital flows may reflect achange in growth opportunities or a change in expected returns which may affectfuture foreign capital inflows.
We also report impulse responses of shocks to the world interest rate, currentcapital flows, returns, and dividend yields on two cumulative variables: the averagelong-run return and the change in US holdings.
First, we definert�k,k � 1k�k�1
i � 0 rt�1�i as the per period cumulative long-horizon
return. Next, consider the definition of net capital flows to capitalization:
nft �ft
mcapt
,
where ft is the net capital flow andmcapt is the equity market capitalization. Thecumulative capital flow to market capitalization is:
cft,t+k � �k
i � 1
nf t+i
�ft+1
mcapt+1
� % �ft+k
mcapt+k
�1
mcapt+k�ft+1 ×
mcapt+k
mcapt+1
� % � ft+k�.
So,cft,t+k accumulates the flows occurring betweent andt+k and allows each flowto change value as a result of the market return.
Now consider the definition of the cumulative holdings in the local market:
COLUMBIA BUSINESS SCHOOL 6
301G. Bekaert et al. / Journal of International Money and Finance 21 (2002) 295–350
ht � ��t
i�0
fimcapt
mcapi� 1
mcapt
� �t
i�0
fimcapi
� �t
i�0
nfi.
So holdings accumulate the flows from the beginning of time (notice the counterbegins ati = 0) allowing for the market return and express them as a proportion ofcurrent market capitalization. From this analysis, it is immediate that
cft,t+k � ht+k�ht,
is the change in holdings. Whereas impulse responses on the VAR variables die outin any stationary VAR, these cumulative effects represent the permanent effect onreturns and capital flows when we letk go to infinity.
2.2. VAR dynamics
Before we test the main hypotheses, we document the information in the VARsregarding the dynamic relations between our four variables using two different stat-istics.
First, we investigate dynamic regression coefficients between the various variables,for example, what is the correlation between world interest rates today and capitalflows or returns in the future? Formally, we investigate:
bi,j,k �Cov [e�iYt+k, e�jYt]
Var[e�jYt], (2)
whereei are indicator vectors, e.g.e1 = [1,0,0,0].Given that the VAR is stationary, Var[Yt] = C(0) can be computed as
Vec[C(0)] � [I�A�A]�1vec(�), (3)
where � � E[et e�t] and I is the identity matrix. The VAR fully summarizes theshort-run and long-run dynamics ofYt ; e.g.
E[YtYt�k] � C(k) � AkC(0). (4)
With this information, projection coefficients at all horizons can be computed.With the long-run variables introduced above, changes in holdings and long-run
returns, we can investigate the relation between these variables on the one hand andworld interest rates and capital flows on the other hand. For example, we compute:
COLUMBIA BUSINESS SCHOOL 7
302 G. Bekaert et al. / Journal of International Money and Finance 21 (2002) 295–350
gk �Cov [rt+k,k, nft]
Var[nft]
�
1ke�4[I � A � % � Ak�1]C(0)e�2
e�2C(0)e2,
(5)
wheree2 (e4) are indicator variables selecting flows (returns). Also, [I+A+%+Ak�1]= [I�Ak][I�A]�1. We can also letk go to infinity here. Analogously, we can investi-gate the long-run beta of changes in holdings with respect to current interest rates,returns and dividend yields.
Second, whereas the regression coefficients provide useful summary information,they are univariate relations that may hide intricate dynamic patterns. For example,there may be a positive relation between current capital flows and future returns, butpart of this correlation may come indirectly through the effect of world interest rateson capital flows. It would be interesting to see whether there is still a relation betweencapital flows and future returns, controlling for the world interest rate effect. Simi-larly, are capital flows mostly predictable by external variables like world interestrates, or by internal variables (returns and dividend yields) that may proxy forexpected returns for example? This question has been addressed before [see Calvoet al., 1993, 1994; and Fernandez-Arias, 1996], but in the context of our VAR it isparticularly simple to implement. We conduct a series of Granger-causality tests,testing whether world interest rates Granger-cause the other variables, and whetherreturns and dividend yields Granger-cause capital flows or vice versa. If liberalizationis a gradual process and is pre-announced, dividend yields may decrease and returnstemporarily increase before flows pick up. In this case, returns and dividend yieldsmay Granger-cause flows. Hence, it may be hard to distinguish this effect frommomentum investing (positive feedback trading), since this would also imply thatpositive returns predict higher flows.
2.3. The dynamics of capital flows and breaks
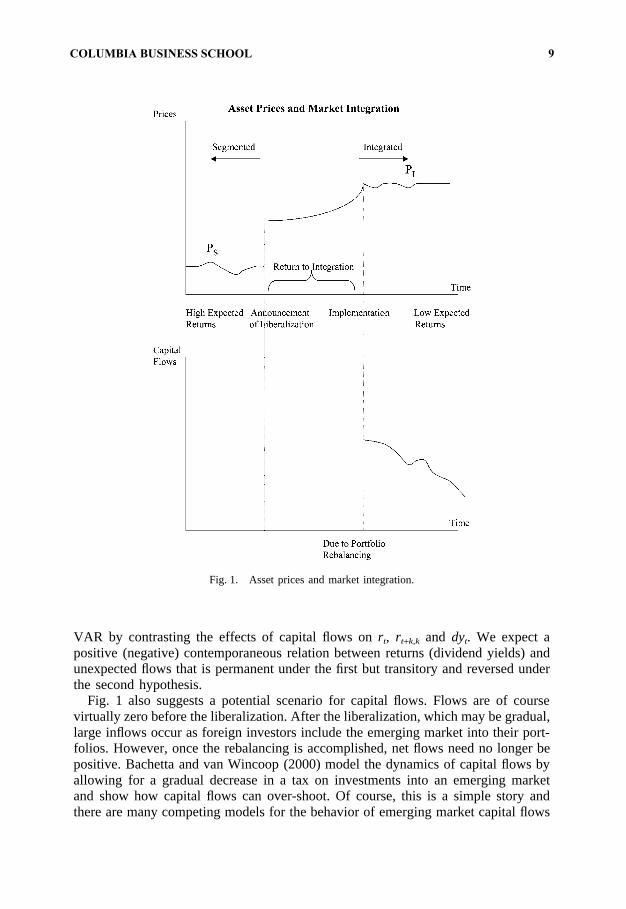
It does not make much sense to conduct this analysis over the full sample of data,given that many of the markets that we study may have undergone an integrationprocess somewhere in the middle of the sample. If the market truly went from seg-mented to integrated, the dynamics of all the variables in our VAR except the worldinterest rate would be affected. Consider Fig. 1 which sketches what a standardmodel of risk sharing [see the description in Bekaert et al., 2002] would predict,namely “a permanent change in prices leading to a new regime of lower expectedreturns”. Interestingly, this process is associated with short-term increases in returns(the return to integration) and long-run decreases in expected returns, plus a perma-nent decrease in dividend yields. This pattern would more generally result from“investor base broadening”, the spreading of risks among more investors (see Stulz,1999, for a summary of the scarce evidence to date on this). If flows drive pricestemporarily away from fundamentals, the price effect ought to be temporary (“theprice pressure hypothesis”). This behavior can be examined in the context of our
COLUMBIA BUSINESS SCHOOL 8
303G. Bekaert et al. / Journal of International Money and Finance 21 (2002) 295–350
Fig. 1. Asset prices and market integration.
VAR by contrasting the effects of capital flows onrt, rt+k,k and dyt. We expect apositive (negative) contemporaneous relation between returns (dividend yields) andunexpected flows that is permanent under the first but transitory and reversed underthe second hypothesis.
Fig. 1 also suggests a potential scenario for capital flows. Flows are of coursevirtually zero before the liberalization. After the liberalization, which may be gradual,large inflows occur as foreign investors include the emerging market into their port-folios. However, once the rebalancing is accomplished, net flows need no longer bepositive. Bachetta and van Wincoop (2000) model the dynamics of capital flows byallowing for a gradual decrease in a tax on investments into an emerging marketand show how capital flows can over-shoot. Of course, this is a simple story andthere are many competing models for the behavior of emerging market capital flows
COLUMBIA BUSINESS SCHOOL 9
304 G. Bekaert et al. / Journal of International Money and Finance 21 (2002) 295–350
including models that predict a foreign lending boom followed by the inevitablecrash! [see, for example, Calvo and Mendoza, 1998.]
To deal with this problem, we apply the most recent methodology on break dateinference. We first apply the methodology developed in BLS to all of our univariateseries, and also use it to determine a break date for the joint system. This breakpoint analysis then determines the post-break period to which we will apply ourVAR analysis described above. The break point analysis also reveals a period oftransitions and the transition dynamics are of interest in their own right.
A disadvantage of the BLS methodology is that it only allows for one break. Thereare a number of reasons why there may be more than one break especially in thenet flows series. As indicated above, flows may be temporarily high to effect aportfolio rebalancing after capital market integration. There may be a second breakat the end of this process. Recently, we have seen a reversal of capital flows witha number of well-publicized crises in Mexico 1994–1995, and in South-East Asiain 1997–98. Even much before this, the debt crisis may have caused some LatinAmerican markets to become effectively segmented from the rest of the world,although capital flows before then were small. Therefore we also apply the techniquesof Bai and Perron (1998a,b) which allow for multiple breaks, but only apply tounivariate series. Additional details are presented in the econometrics section.
We also investigate the dynamics of capital flows around a potential liberalizationbreak using a very simple regression procedure. If the capital flow story of Fig. 1is accurate, mean equity flows should be higher after the break than before, butdecrease again after portfolio re-balancing is completed. In other words, letD1t bea dummy that comes on after the break andD2t the dummy that comes on threeyears after the break, then in the regression
nft � a � bD1t � cD2t � et, (6)
we would findb to be positive, andc to be negative. We choose three years becauseof the time it takes from announcement to effective implementation of a marketliberalization. Bekaert and Harvey (2000a) provide evidence that liberalizations areoften gradual.
Finally, to examine the transition dynamics, we compute a statistic we call the“transition half-life statistic” (THL). The THL statistic is measured as follows. Con-sider the point in time at which the break occurs and imagine the current realizationof the variable is at the unconditional meanbefore the break. Now consider fore-castingk periods in the future using the new dynamics. If the VAR is stationary,eventually the forecasts will reach the new unconditional mean. How fast they willget there depends on the persistence of the system and how far away the post-breakmean is from the starting point (pre-break mean). Our THL statistic records the timeit takes (in months) to reach half the distance between old and new mean. We canalso reverse the computation. That is, we compute the THL statistic starting fromthe new mean going to the old mean using the pre-break dynamics. Comparing thetwo statistics is informative about the different dynamics before and after the break.We will compute this statistic for capital flows and dividend yields. For capital flows,a bold interpretation of the pre-break THL statistic is that it reveals something about
COLUMBIA BUSINESS SCHOOL 10
305G. Bekaert et al. / Journal of International Money and Finance 21 (2002) 295–350
how capital flows will react when the integration process is reversed, as is recentlyhappening in a few countries. We do not compute the THL statistic for returns,because we conjecture that the measurement of mean returns is too noisy to makethe computation valuable.
3. Data
Our data consists of capital flows, interest rates, dividend yields, and returns. Oursource of monthly data on capital flows is the US Treasury International Capital(TIC) reporting system.2 For the 20 emerging markets we study, we are able tocalculate the net US flows for stocks and bonds for 17 countries. The Treasury doesnot track data on Jordan, Nigeria, and Zimbabwe. We use the International FinanceCorporation’s Emerging Markets Database as a source of the US dollar returns andthe dividend yields. The world interest rate is constructed as a GDP weighted averageof the short-term government Treasury bills in the G-7 countries.3 The interest rateand GDP data are from Datastream.
With so many countries and relatively small sample periods, a country by countryanalysis may both lack power and prevent us from presenting the results in an intelli-gible way. Therefore we present most of our results using country groupings. Weuse three different types of groupings. The first set is aimed primarily at noisereduction. We aggregate results over all countries with three weighting schemes:equally weighted, value weighted (using the market capitalization of the equity mar-ket from the IFC) and volatility weighted. The volatility weighting constructs weightsusing the inverse of the sum of squared residuals of all the regressions in the VARfor a particular country relative to the inverse sum of the squared residuals overall countries. Hence, the “noisiest” VARs are down-weighted. Before applying thisprocedure, we re-scaled the residuals, so that at a global, all-country level, capitalflows accounted for 40% of the total variance, returns and dividend yields each 25%,and interest rates, 10%. If the coefficients (like impulse responses) are independentacross countries, this aggregation would lead to a reduction of the typical country-specific standard error by a factor of over four, since there are 17 countries in oursample. Hence, even if the country-specific standard errors are double the size ofthe coefficients, we would obtain significance.
The second grouping is geographical. We contrast the results for six Latin Amer-ican countries (Argentina, Brazil, Chile, Colombia, Mexico and Venezuela) and sixAsian countries (Indonesia, Korea, Malaysia, the Philippines, Taiwan and Thailand).Although these results may be sensitive to country-specific outliers, the contrastsbetween the development models of Latin-America and South-East Asia and therecent crises in both areas make this grouping meaningful.
2 See Tesar and Werner (1994, 1995) for a description and analysis of these data.3 See the data appendix for additional details on the construction of the dividend yields and the world
interest rate.
COLUMBIA BUSINESS SCHOOL 11
306 G. Bekaert et al. / Journal of International Money and Finance 21 (2002) 295–350
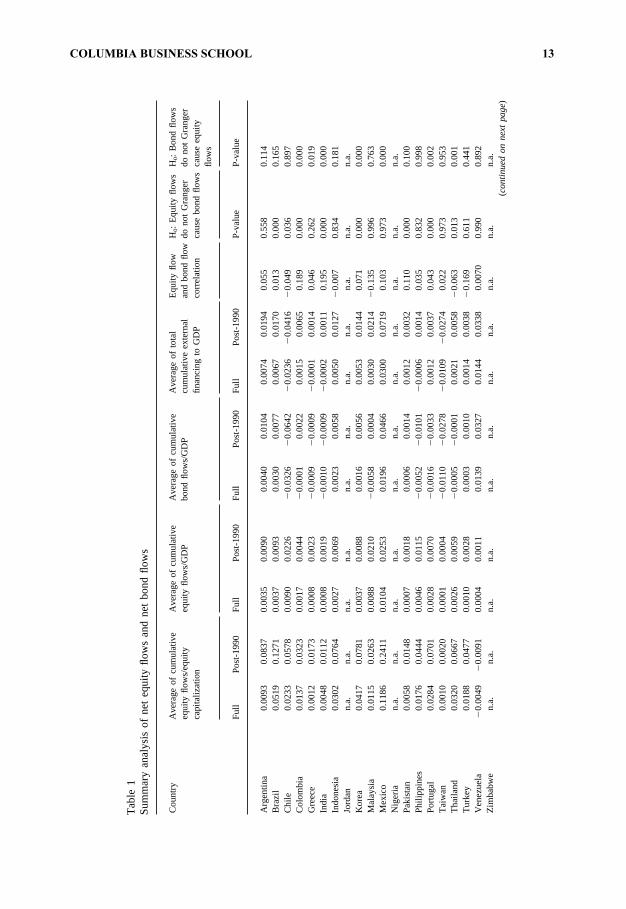
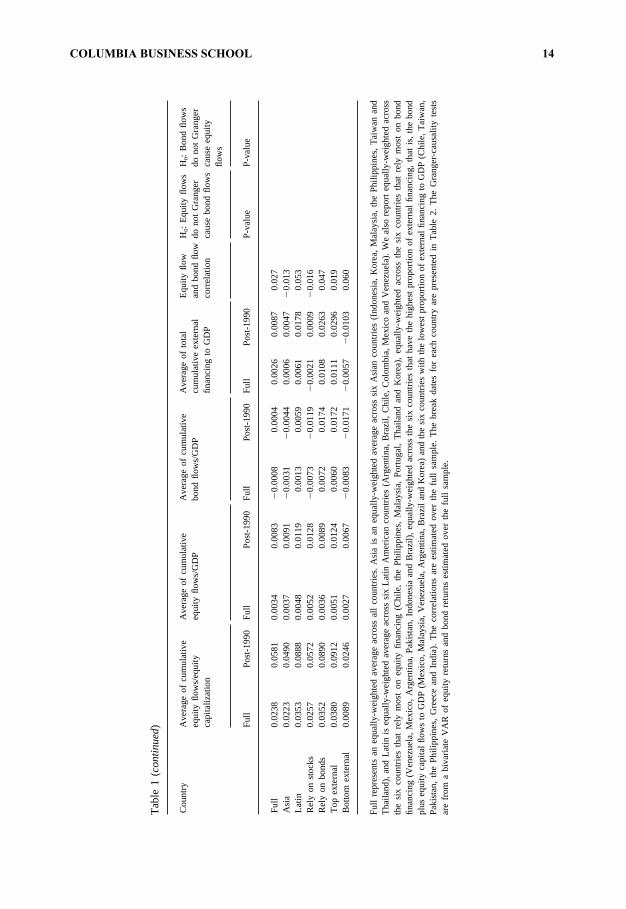
Our last groupings focus on the characteristics of capital flows. Table 1 summar-izes some of the characteristics we use in the selection process. First, we investigatethe magnitude of equity and bond flows. We calculate the return-adjusted cumulativeequity flows divided by market capitalization. This is a measure of US ownershipin the country. We present average ownership over the full sample as well as the1990s. The largest average ownership is found for Mexico (since 1990) followed byBrazil and Argentina. The country with the largest average ownership in Asia isThailand in the 1990s. To allow comparison with bond flows, where return adjust-ments and market capitalizations are not available, we also calculate the cumulativeequity flows to GDP without return adjustments. In this analysis, Mexico, Chile andMalaysia have the largest cumulative U.S. equity flows to GDP. Bond flows to GDPare presented in the next column. The highest averages of the cumulative bond flowsto GDP are found in Mexico, Venezuela and Argentina. Clearly, cumulative net bondflows are much smaller than equity flows. By adding cumulative equity and bondflows, we obtain a measure of total external financing through portfolio capital. Wealso report sample averages and averages in the 1990s. There are two countries withnet negative external financing, Chile and Taiwan, both, not surprisingly, countrieswith stringent capital controls. Mexico, Venezuela and Malaysia have the highestexternal financing to GDP. Generally, both equity and bond flows are larger in thenineties than for the full sample, and total external financing is larger in the ninetiesfor 15 out of 17 countries.
We now consider different groups of countries based on this information for the1990s sample. First, we rank the countries according to the importance of externalfinance. In addition to the three countries previously mentioned (Mexico, Venezuelaand Malaysia), we add Argentina, Brazil and Korea to the top group. The bottomsix countries are, in addition to Chile and Taiwan, India, Greece, the Philippines andPakistan, all with less than 0.35% of GDP in external financing through US bondand equity flows.
Finally, we want to select countries that primarily rely on equity capital and coun-tries that primarily rely on fixed income. This is not trivial to do, since for somecountries the absolute flows may be very small and, in particular, for bonds, theymay be negative. Our approach was to rank countries based on the difference betweenthe average cumulative post-1989 equity and bond flows to GDP. The bottom sixcountries are deemed bond-reliant, the top six equity reliant. We exclude countrieswhen they do not place in the top 10 ranked according to cumulative bond flows orcumulative equity flows to GDP, respectively. The countries relying primarily onequity are Chile, the Philippines, Malaysia, Portugal, Thailand and Korea. Weexcluded Taiwan because of its insignificant absolute equity flows. Although Mexico,Brazil and Argentina are top countries in terms of equity flows to GDP, they appearin the fixed income group because of their substantial positive fixed income flows.The other three countries are Venezuela, Pakistan, and Indonesia. Because of therelative non-importance of bond flows in general, it is possible that countries groupedin the “rely on bonds” category receive more equity than bond capital.
At the bottom of the table, we present country groupings. We find that LatinAmerican countries tend to have high US equity ownership. Asian countries have
COLUMBIA BUSINESS SCHOOL 12
307G. Bekaert et al. / Journal of International Money and Finance 21 (2002) 295–350
Tab
le1
Sum
mar
yan
alys
isof
net
equi
tyflo
ws
and
net
bond
flow
s
Cou
ntry
Ave
rage
ofcu
mul
ativ
eA
vera
geof
cum
ulat
ive
Ave
rage
ofcu
mul
ativ
eA
vera
geof
tota
lE
quity
flow
H0:
Equ
ityflo
ws
H 0:
Bon
dflo
ws
equi
tyflo
ws/
equi
tyeq
uity
flow
s/G
DP
bond
flow
s/G
DP
cum
ulat
ive
exte
rnal
and
bond
flow
dono
tG
rang
erdo
not
Gra
nger
capi
taliz
atio
nfin
anci
ngto
GD
Pco
rrel
atio
nca
use
bond
flow
sca
use
equi
tyflo
ws
Ful
lP
ost-
1990
Ful
lP
ost-
1990
Ful
lP
ost-
1990
Ful
lP
ost-
1990
P-v
alue
P-v
alue
Arg
entin
a0.
0093
0.08
370.
0035
0.00
900.
0040
0.01
040.
0074
0.01
940.
055
0.55
80.
114
Bra
zil
0.05
190.
1271
0.00
370.
0093
0.00
300.
0077
0.00
670.
0170
0.01
30.
000
0.16
5C
hile
0.02
330.
0578
0.00
900.
0226
�0.
0326
�0.
0642
�0.
0236
�0.
0416
�0.
049
0.03
60.
897
Col
ombi
a0.
0137
0.03
230.
0017
0.00
44�
0.00
010.
0022
0.00
150.
0065
0.18
90.
000
0.00
0G
reec
e0.
0012
0.01
730.
0008
0.00
23�
0.00
09�
0.00
09�
0.00
010.
0014
0.04
60.
262
0.01
9In
dia
0.00
480.
0112
0.00
080.
0019
�0.
0010
�0.
0009
�0.
0002
0.00
110.
195
0.00
00.
000
Indo
nesi
a0.
0302
0.07
640.
0027
0.00
690.
0023
0.00
580.
0050
0.01
27�0.
007
0.83
40.
181
Jord
ann.
a.n.
a.n.
a.n.
a.n.
a.n.
a.n.
a.n.
a.n.
a.n.
a.n.
a.K
orea
0.04
170.
0781
0.00
370.
0088
0.00
160.
0056
0.00
530.
0144
0.07
10.
000
0.00
0M
alay
sia
0.01
150.
0263
0.00
880.
0210
�0.
0058
0.00
040.
0030
0.02
14�
0.13
50.
996
0.76
3M
exic
o0.
1186
0.24
110.
0104
0.02
530.
0196
0.04
660.
0300
0.07
190.
103
0.97
30.
000
Nig
eria
n.a.
n.a.
n.a.
n.a.
n.a.
n.a.
n.a.
n.a.
n.a.
n.a.
n.a.
Pak
ista
n0.
0058
0.01
480.
0007
0.00
180.
0006
0.00
140.
0012
0.00
320.
110
0.00
00.
100
Phi
lippi
nes
0.01
760.
0444
0.00
460.
0115
�0.
0052
�0.
0101
�0.
0006
0.00
140.
035
0.83
20.
998
Por
tuga
l0.
0284
0.07
010.
0028
0.00
70�
0.00
16�
0.00
330.
0012
0.00
370.
043
0.00
00.
002
Tai
wan
0.00
100.
0020
0.00
010.
0004
�0.
0110
�0.
0278
�0.
0109
�0.
0274
0.02
20.
973
0.95
3T
haila
nd0.
0320
0.06
670.
0026
0.00
59�
0.00
05�
0.00
010.
0021
0.00
58�
0.06
30.
013
0.00
1T
urke
y0.
0188
0.04
770.
0010
0.00
280.
0003
0.00
100.
0014
0.00
38�0.
169
0.61
10.
441
Ven
ezue
la�
0.00
49�
0.00
910.
0004
0.00
110.
0139
0.03
270.
0144
0.03
380.
0070
0.99
00.
892
Zim
babw
en.
a.n.
a.n.
a.n.
a.n.
a.n.
a.n.
a.n.
a.n.
a.n.
a.n.
a.(c
onti
nued
onne
xtpa
ge)
COLUMBIA BUSINESS SCHOOL 13
308 G. Bekaert et al. / Journal of International Money and Finance 21 (2002) 295–350
Tab
le1
(cont
inue
d)
Cou
ntry
Ave
rage
ofcu
mul
ativ
eA
vera
geof
cum
ulat
ive
Ave
rage
ofcu
mul
ativ
eA
vera
geof
tota
lE
quity
flow
H0:
Equ
ityflo
ws
H 0:
Bon
dflo
ws
equi
tyflo
ws/
equi
tyeq
uity
flow
s/G
DP
bond
flow
s/G
DP
cum
ulat
ive
exte
rnal
and
bond
flow
dono
tG
rang
erdo
not
Gra
nger
capi
taliz
atio
nfin
anci
ngto
GD
Pco
rrel
atio
nca
use
bond
flow
sca
use
equi
tyflo
ws
Ful
lP
ost-
1990
Ful
lP
ost-
1990
Ful
lP
ost-
1990
Ful
lP
ost-
1990
P-v
alue
P-v
alue
Ful
l0.
0238
0.05
810.
0034
0.00
83�
0.00
080.
0004
0.00
260.
0087
0.02
7A
sia
0.02
230.
0490
0.00
370.
0091
�0.
0031
�0.
0044
0.00
060.
0047
�0.
013
Latin
0.03
530.
0888
0.00
480.
0119
0.00
130.
0059
0.00
610.
0178
0.05
3R
ely
onst
ocks
0.02
570.
0572
0.00
520.
0128
�0.
0073
�0.
0119
�0.
0021
0.00
09�
0.01
6R
ely
onbo
nds
0.03
520.
0890
0.00
360.
0089
0.00
720.
0174
0.01
080.
0263
0.04
7T
opex
tern
al0.
0380
0.09
120.
0051
0.01
240.
0060
0.01
720.
0111
0.02
960.
019
Bot
tom
exte
rnal
0.00
890.
0246
0.00
270.
0067
�0.
0083
�0.
0171
�0.
0057
�0.
0103
0.06
0
Ful
lre
pres
ents
aneq
ually
-wei
ghte
dav
erag
eac
ross
all
coun
trie
s.A
sia
isan
equa
lly-w
eigh
ted
aver
age
acro
sssi
xA
sian
coun
trie
s(I
ndon
esia
,K
ore
a,M
alay
sia,
the
Phi
lippi
nes,
Tai
wan
and
Tha
iland
),an
dLa
tinis
equa
lly-w
eigh
ted
aver
age
acro
sssi
xLa
tinA
mer
ican
coun
trie
s(A
rgen
tina,
Bra
zil,
Chi
le,
Col
ombi
a,M
exic
oan
dV
enez
uela
).W
eal
sore
port
equa
lly-w
eigh
ted
acro
ssth
esi
xco
untr
ies
that
rely
mos
ton
equi
tyfin
anci
ng(C
hile
,th
eP
hilip
pine
s,M
alay
sia,
Por
tuga
l,T
haila
ndan
dK
orea
),eq
ually
-wei
ghte
dac
ross
the
six
coun
trie
sth
atre
lym
ost
onbo
ndfin
anci
ng(V
enez
uela
,M
exic
o,A
rgen
tina,
Pak
ista
n,In
done
sia
and
Bra
zil),
equa
lly-w
eigh
ted
acro
ssth
esi
xco
untr
ies
that
have
the
high
est
prop
ort
ion
ofex
tern
alfin
anci
ng,
that
is,
the
bond
plus
equi
tyca
pita
lflow
sto
GD
P(M
exic
o,M
alay
sia,
Ven
ezue
la,
Arg
entin
a,B
razi
land
Kor
ea)
and
the
six
coun
trie
sw
ithth
elo
wes
tpr
opor
tion
ofex
tern
alfin
anci
ngto
GD
P(C
hile
,T
aiw
an,
Pak
ista
n,th
eP
hilip
pine
s,G
reec
ean
dIn
dia)
.T
heco
rrel
atio
nsar
ees
timat
edov
erth
efu
llsa
mpl
e.T
hebr
eak
date
sfo
rea
chco
untr
yar
epr
esen
ted
inT
able
2.T
heG
rang
er-c
ausa
lity
test
sar
efr
oma
biva
riate
VA
Rof
equi
tyre
turn
san
dbo
ndre
turn
ses
timat
edov
erth
efu
llsa
mpl
e.
COLUMBIA BUSINESS SCHOOL 14
309G. Bekaert et al. / Journal of International Money and Finance 21 (2002) 295–350
had sharply negative bond outflows in the 1990s perhaps due in part to the Asiancrisis. Latin American countries tend to rely more on equity financing than Asiancountries. The countries grouped in the “relying on bonds” category are generallycountries that heavily rely on external portfolio capital, including equity capital. Asa proportion of market capitalization, these countries have higher U.S. holdings thanthe “stock reliant” countries.
Table 1 presents some additional information on the relation between bond andstock flows. Given that our analysis focuses on equity flows, it is important to knowwhether bond flows are substitutes for equity flows. We present the correlation ofthe net capital flows which is, in general, small. The highest correlation is found forIndia and Colombia. The largest negative correlations are found for Turkey andMalaysia. In the majority of the countries, the correlation is positive, and of the fivenegative correlations, three are in South-East Asian countries.
We also present Granger-causality tests based on a bivariate system of stock flowsto market capitalization and bond flows to GDP. We can reject the hypothesis at the5% level that equity flows do not Granger-cause bond flows in Brazil, Chile, Colom-bia, India, Korea, Pakistan, Portugal and Thailand. We can reject the hypothesis atthe 5% level that bond flows do not Granger-cause equity flows in Colombia, Greece,Indonesia, Korea, Mexico, Portugal and Thailand. Hence, there are five countries forwhich there are significant predictive relations in both directions, potentially suggest-ing the effect of a third variable on general capital flows or persistence in capitalflows after a capital market liberalization. There is no support for a consistent patternwhere bonds always lead equity (or vice versa) or where bonds and equity areclear substitutes.
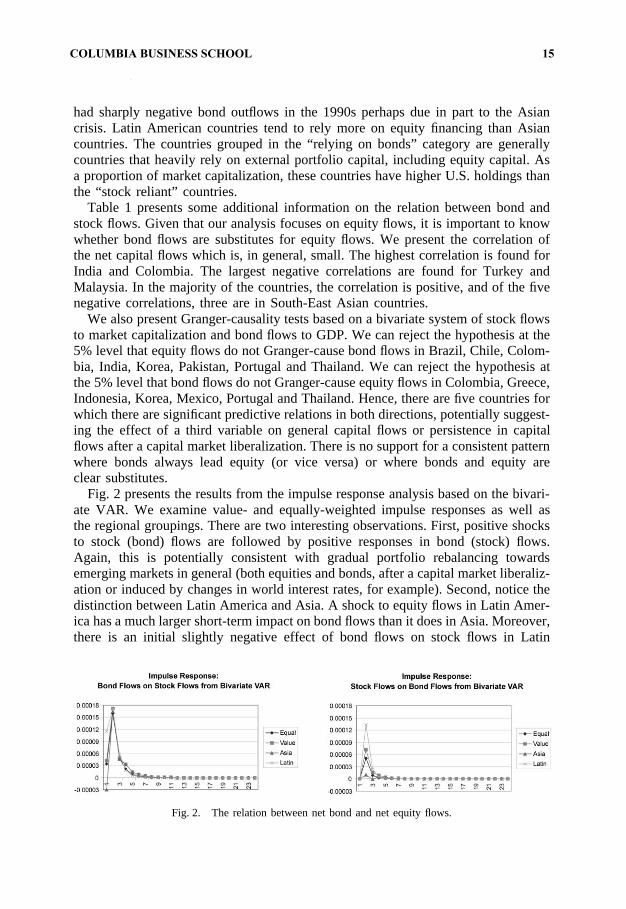
Fig. 2 presents the results from the impulse response analysis based on the bivari-ate VAR. We examine value- and equally-weighted impulse responses as well asthe regional groupings. There are two interesting observations. First, positive shocksto stock (bond) flows are followed by positive responses in bond (stock) flows.Again, this is potentially consistent with gradual portfolio rebalancing towardsemerging markets in general (both equities and bonds, after a capital market liberaliz-ation or induced by changes in world interest rates, for example). Second, notice thedistinction between Latin America and Asia. A shock to equity flows in Latin Amer-ica has a much larger short-term impact on bond flows than it does in Asia. Moreover,there is an initial slightly negative effect of bond flows on stock flows in Latin
Fig. 2. The relation between net bond and net equity flows.
COLUMBIA BUSINESS SCHOOL 15
310 G. Bekaert et al. / Journal of International Money and Finance 21 (2002) 295–350
America whereas the effect in Asia is positive. From the second period onwards,the effects are positive and very similar in magnitude across the two regions. Fromboth graphs, it is clear that the effects die out within six months. We also conducteda break point analysis of bond and equity flows. In the countries that experiencedsignificant breaks in equities and bond capital flows, the break in bonds precededthe break in equities in four countries (Argentina, Korea, Malaysia and Thailand).The break in equities preceded the break in bonds in five countries (Brazil, Colombia,Greece, India and the Philippines). With the exception of one country, the Philip-pines, the equity and bond breaks are clustered closely in time for all of thesecountries.4
Taken together, our results suggest that bond and equity flows are not substitutesbut both increased in the nineties with the liberalization process.
4. Breaks and initial pre and post-break analysis
4.1. Break analysis
To select an appropriate break date for use in subsequent analysis, we rely onseveral pieces of information. First, we use the results of the univariate break analysisfor three series: returns, dividend yields and net equity flows. We compute themedian break date, the 90% confidence interval for the date in months as well as astatistic that provides a test of the null hypothesis that no break occurred. Detailedresults on all break tests are reported in Appendix Tables 1–3.
Second, we conduct a multivariate analysis of breaks using the BLS framework.We investigate three specifications. The first is a trivariate system with equity capitalflows, dividend yields and returns. The second specification is a quadravariate systemthat includes an equation for the world interest rate. However, the coefficients in theworld interest rate equation are not allowed to break in the estimation but the depen-dence of the other variables in the system on the world interest rate may break. Thethird specification adds the bond capital flows to the system of equations to see ifthe breaks we find are affected by this addition. For 13 of the 17 countries, themultivariate breaks fall within the range of the univariate breaks for either bond orequity flows. For four countries, (Greece, Mexico, Portugal and Taiwan), the breakdates correspond to the break dates in dividend yields or returns, but the confidenceintervals for the breaks are always tighter in the multivariate estimation consistentwith what the theory would predict. Finally, the break dates from the three multivari-ate systems are very close to each other.
Third, we conduct the Bai-Perron tests that allow for multiple breaks. In a numberof countries more than one break occurs. For example, in the dividend yield esti-mation for Mexico there are three significant breaks: January 1983, July 1986 andMarch 1991. The first date closely follows the onset of the Latin American debt
4 See Appendix Table 1.
COLUMBIA BUSINESS SCHOOL 16
311G. Bekaert et al. / Journal of International Money and Finance 21 (2002) 295–350
crisis. The second date closely follows the abolition of the official exchange rateand coincides with major debt restructuring. The final date closely follows the privat-ization of Telmex and the beginning of the NAFTA negotiations. For the flows esti-mation, we find little evidence in favor of multiple breaks, although this may be dueto low power. Argentina shows two breaks in equity flows, with the second onebeing detected in the BLS tests. There are three breaks for equity flows in Korea,partially reflecting the gradual lifting of foreign ownership. Finally, there are twobreak dates for bond flows in Taiwan, one preceding and one following the liberaliz-ation plan of January 1991. Hence, there appears to be a pattern in the multiplebreak analysis that is linked to important events tied to either deliberalization orliberalization of capital markets.
Finally, we link the statistical breaks to the economic events detailed in Bekaertand Harvey (2000b). The end-result is presented in Table 2, where we also brieflyindicate the motivation for each break date. All the dates we choose are dates foundby one of the break analyses we conducted, but the final choice uses exogenousinformation on regulatory reforms to make sure we use a relevant break date. Werely heavily on the break dates that arise from the quadravariate system as well asthe Bai-Perron breaks for dividend yields and equity flows. For example, the Bai-Perron break for equity capital flows in Thailand is August 1988. This closely corre-sponds to the opening of the market to foreigners by the creation of the Alien Boardfor trading in late 1987. The quadravariate and quintravariate date for Taiwan isApril 1988. This closely corresponds to the lifting of exchange controls. Pakistan isparticularly interesting. Most consider the official liberalization to be February 1991.The Bai-Perron break in dividend yields is earlier, in December 1990. However,an examination of the chronology shows that the liberalization was announced inNovember 1990.5
4.2. The impact of breaks on unconditional means
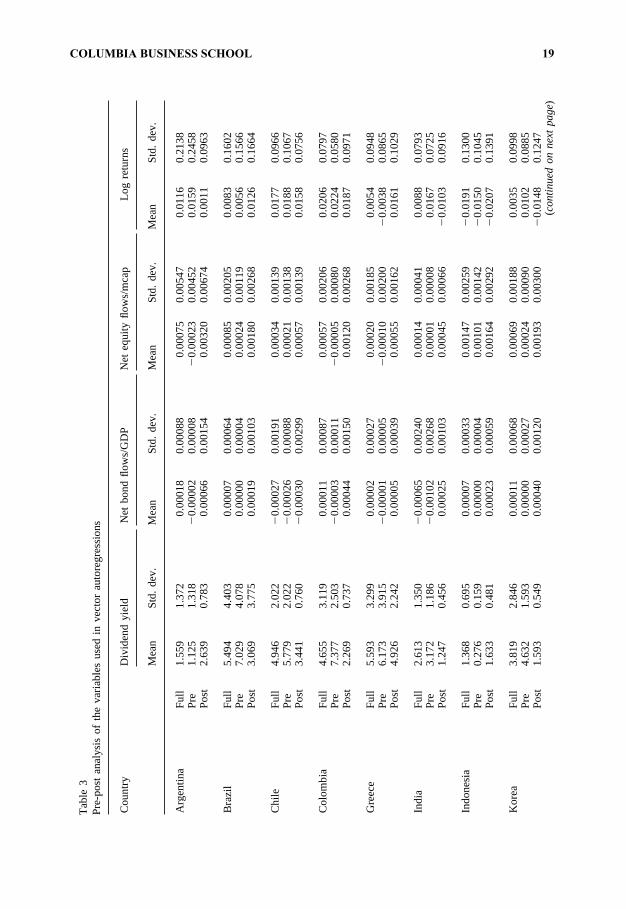
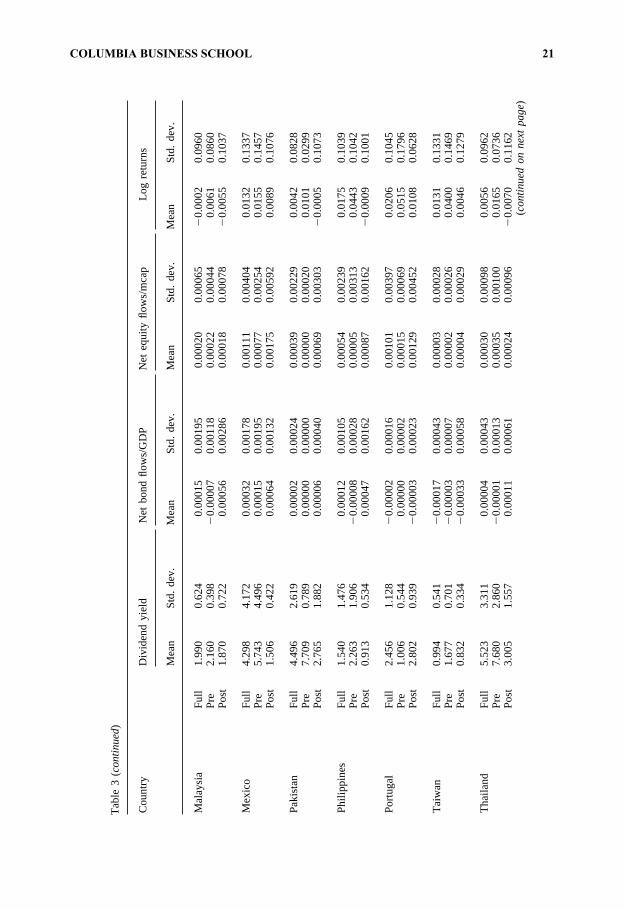
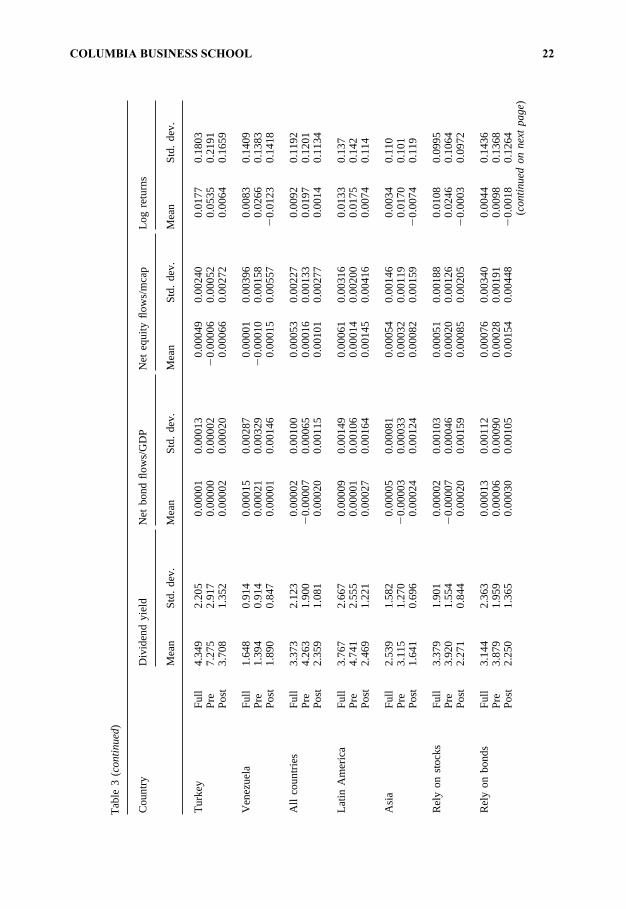
Table 3 presents an analysis of both the means and standard deviations of the fourcountry-specific variables that we study in the VARs: dividend yields, log returns,net bond flows to GDP and net equity flows to equity market capitalization. Individ-ual country results and results for our country groupings are presented for the fullsample, as well as the pre- and post-break periods using the dates in Table 2.
There are a number of interesting differences between the pre-break and post-break periods. The dividend yields are sharply lower on average (2.5 in post-breakand 4.7 in pre-break). The yields decrease in 13 of 17 countries. This is consistentwith the idea that expected returns decrease after a liberalization. Although returnsare much noisier than dividend yields, we also observe that the average return
5 We also closely examined the results of estimations with a smaller trimming factor, which suggestedbreaks near the end of the sample that are associated with the Asian crisis. Since these dates are verymuch near the end of our sample, we did not exclude post-break observations.
COLUMBIA BUSINESS SCHOOL 17

312 G. Bekaert et al. / Journal of International Money and Finance 21 (2002) 295–350T
able
2S
elec
tion
ofbr
eak
date
s
Cou
ntry
Dat
eS
erie
sR
easo
n
Arg
entin
aM
ay92
dy-B
PA
lso
dy-U
.C
lose
toE
q.flo
ws-
BP
(Dec
92).
Fol
low
sin
trod
uctio
nof
Arg
entin
eF
und
(Oct
91)
whi
chis
the
first
time
US
inve
stor
sco
uld
acce
ssth
ism
arke
tin
mod
ern
times
.
Bra
zil
Mar
90Q
uad
Clo
seto
dy-U
(Nov
90)
and
Eq.
Flo
ws-
U(J
an90
).O
ffici
alis
May
91.
Exa
ctly
coin
cide
sw
ithin
trod
uctio
nof
Col
lor
Pla
n(M
ar90
).
Chi
leN
ov90
dy-B
PA
bout
one
year
from
Offi
cial
(Jan
92).
Qua
did
entifi
esth
ede
btcr
isis
.S
hort
lyfo
llow
sin
trod
uctio
nof
refo
rmpa
ckag
e(A
pr90
),m
ajor
AD
R(J
uly
90)
and
rene
wal
ofA
ndea
nP
act
(Nov
90).
Col
ombi
aO
ct91
dy-B
P1
Clo
seto
Offi
cial
(Feb
91).
Eq.
Flo
ws-
Ufo
llow
s(J
uly
93).
Exa
ctm
onth
that
Pes
ode
regu
late
d(O
ct91
).In
addi
tion,
exac
tm
onth
that
fore
ign
coun
try
fund
sar
eal
low
edto
have
upto
10%
ofow
ners
hip
and
fore
ign
firm
sar
epe
rmitt
edto
rem
it10
0%of
profi
ts.
Gre
ece
Jul
88Q
uad
Als
ody
-BP
date
.O
ffici
al(D
ec87
).C
lose
lyco
inci
des
with
date
offir
stA
DR
(Aug
88).
Indi
aA
pr92
Qua
dB
etw
een
dy-U
(Jan
92)
and
Eq.
Flo
ws-
U(M
ay93
).O
ffici
alis
Nov
92.
Clo
sely
follo
ws
esta
blis
hmen
tof
Sec
uriti
esE
xcha
nge
Boa
rd(J
an92
).In
addi
tion,
the
first
AD
Ris
Feb
92.
Indo
nesi
aM
ay92
dy-B
PO
ffici
alS
ep89
.E
quity
and
bond
flow
sbr
eak
muc
hla
ter.
Firs
tA
DR
laun
ched
Feb
92.
For
eign
Boa
rdfo
rtr
adin
gby
fore
igne
rses
tabl
ishe
din
July
92.
Jord
anA
pr92
dy-B
PO
ffici
alis
Dec
95.
Clo
sely
prec
edes
the
liftin
gof
cont
rols
onou
tbou
ndan
din
boun
ddi
rect
inve
stm
ents
;al
low
ance
ofpr
ivat
eho
ldin
gof
fore
ign
exch
ange
and
othe
rfin
anci
alas
sets
,an
dpr
ovis
ion
ofm
arke
tac
cess
tofo
reig
nfin
anci
alin
stitu
tions
in19
93.
Kor
eaO
ct92
Eq.
Flo
ws-
BP
3C
lose
tody
-BP
(Feb
91).
Offi
cial
isJa
n92
.F
orei
gns
can
own
upto
10%
ofst
ocks
inse
lect
edin
dust
ries
(Jan
92).
Mor
ein
dust
ries
incl
uded
inM
ay92
.
Mal
aysi
aF
eb91
dy-B
PE
xact
lyco
inci
des
with
the
Priv
atiz
atio
nM
aste
rP
lan
(Feb
91).
Pre
cede
sth
eO
utlin
eP
ersp
ectiv
eP
lan
inJu
n91
whi
chen
cour
aged
fore
ign
inve
stm
ent
and
priv
atis
atio
n.O
ffici
alda
teis
earli
erD
ec88
.(c
onti
nued
onne
xtpa
ge)
COLUMBIA BUSINESS SCHOOL 17

313G. Bekaert et al. / Journal of International Money and Finance 21 (2002) 295–350T
able
2(co
ntin
ued)
Cou
ntry
Dat
eS
erie
sR
easo
n
Mex
ico
Mar
91dy
-BP
3Le
ssth
ana
year
from
Eq.
Flo
ws-
U(J
ul90
).C
lose
lyfo
llow
sT
elm
expr
ivat
izat
ion
inD
ec90
and
the
initi
atio
nof
NA
FT
Ata
lks
inF
eb90
and
bond
flow
sin
Mar
90.
Offi
cial
isea
rly,
May
89.
Nig
eria
Jun
95dy
-UO
ffici
alis
Aug
95bu
tea
rlier
in19
95th
eB
udge
tca
lled
for
the
open
ing
ofm
arke
tsto
fore
ign
port
folio
inve
stor
s.H
ence
,th
em
arke
tm
ight
have
antic
ipat
edth
eof
ficia
lin
trod
uctio
nof
the
Nig
eria
nIn
vest
men
tD
ecre
ein
Aug
95.
Pak
ista
nD
ec90
dy-B
P1
Ver
ycl
ose
toO
ffici
alin
Feb
91.
Inde
ed,
the
anno
unce
men
tof
the
liber
aliz
atio
nsth
atw
ere
impl
emen
ted
inF
eb91
was
mad
ein
Nov
90.
Phi
lippi
nes
Jul
90E
q.F
low
s-U
Clo
seto
dy-U
(Oct
91).
Offi
cial
isJu
n91
.F
ollo
ws
maj
orba
nkre
stru
ctur
ing
agre
emen
tin
Feb
90.
Firs
tA
DR
isM
ar91
.
Por
tuga
lF
eb89
Qua
dC
lose
tody
-U.
Offi
cial
isJu
ly86
.P
ortu
gal
Fun
dla
unch
edin
Aug
87.
Pre
cede
spr
ivat
izat
ion
law
inM
ar90
.
Tai
wan
Apr
88Q
uad
Als
ody
-Uda
te.
Exc
hang
eco
ntro
lslif
ted
inJu
l87
.O
ffici
alis
late
r,in
Jan
91.
Tha
iland
Aug
88E
q.F
low
s-B
PO
ffici
alS
ep87
whe
nA
lien
Boa
rdin
trod
uced
.dy
-Uis
Jan
90w
hich
seem
sla
te
Tur
key
Oct
89dy
-BP
Jul
89co
mm
uniq
uest
atin
gth
atm
arke
tsw
illbe
open
tofo
reig
ners
.O
ffici
alin
Aug
89.
Tur
kish
Inve
stm
ent
Fun
din
Dec
89.
Eq.
Flo
w-B
Pis
late
r,in
Dec
91an
dB
ond
Flo
w-B
Pis
Jun
92.
Ven
ezue
laM
ar92
dy-U
Offi
cial
Jun
90bu
tfir
stA
DR
isla
ter,
inA
ug91
.M
ajor
priv
atiz
atio
nsin
Sep
91an
dN
ov91
.A
llot
her
estim
atio
nsst
rong
lyin
fluen
ced
by19
97-9
8.
Zim
babw
eJu
n93
dy-U
Offi
cial
issa
me
date
whe
nne
win
vest
men
tgu
idel
ines
took
effe
ct.
How
ever
,br
eak
isno
tsi
gnifi
cant
.
The
datin
gin
volv
esa
num
ber
ofdi
ffere
ntes
timat
ion
stra
tegi
es:
(i)a
join
tes
timat
ion
ofqu
adra
varia
te(Q
uad)
syst
emw
ithw
orld
inte
rest
rate
s,ne
teq
uity
flow
s(E
q.F
low
s),
divi
dend
yiel
ds(d
y),
and
retu
rns,
(ii)
univ
aria
te(U
)es
timat
ion
allo
win
gfo
ra
sing
lebr
eak,
and
(iii)
Bai
-Per
ron
(BP
)te
sts
whi
ch
allo
wfo
rup
toth
ree
brea
ks(B
P1,
BP
2,B
P3)
and
are
also
univ
aria
te.
The
offic
ial
liber
aliz
atio
nda
tes
(Offi
cial
)ar
efr
omB
ekae
rtan
dH
arve
y(2
000a
).W
eal
soco
nsul
ted
with
the
chro
nolo
gyof
impo
rtan
tfin
anci
al,
econ
omic
and
polit
ical
even
tsde
velo
ped
inB
ekae
rtan
dH
arve
y(2
000b
)w
hich
isav
aila
ble
at
http
://w
ww
.duk
e.ed
u/~
char
vey.
COLUMBIA BUSINESS SCHOOL 18
314 G. Bekaert et al. / Journal of International Money and Finance 21 (2002) 295–350T
able
3P
re-p
ost
anal
ysis
ofth
eva
riabl
esus
edin
vect
orau
tore
gres
sion
s
Cou
ntry
Div
iden
dyi
eld
Net
bond
flow
s/G
DP
Net
equi
tyflo
ws/
mca
pLo
gre
turn
s
Mea
nS
td.
dev.
Mea
nS
td.
dev.
Mea
nS
td.
dev.
Mea
nS
td.
dev.
Arg
entin
aF
ull
1.55
91.
372
0.00
018
0.00
088
0.00
075
0.00
547
0.01
160.
2138
Pre
1.12
51.
318
�0.
0000
20.
0000
8�
0.00
023
0.00
452
0.01
590.
2458
Pos
t2.
639
0.78
30.
0006
60.
0015
40.
0032
00.
0067
40.
0011
0.09
63
Bra
zil
Ful
l5.
494
4.40
30.
0000
70.
0006
40.
0008
50.
0020
50.
0083
0.16
02P
re7.
029
4.07
80.
0000
00.
0000
40.
0002
40.
0011
90.
0056
0.15
66P
ost
3.06
93.
775
0.00
019
0.00
103
0.00
180
0.00
268
0.01
260.
1664
Chi
leF
ull
4.94
62.
022
�0.
0002
70.
0019
10.
0003
40.
0013
90.
0177
0.09
66P
re5.
779
2.02
2�
0.00
026
0.00
088
0.00
021
0.00
138
0.01
880.
1067
Pos
t3.
441
0.76
0�
0.00
030
0.00
299
0.00
057
0.00
139
0.01
580.
0756
Col
ombi
aF
ull
4.65
53.
119
0.00
011
0.00
087
0.00
057
0.00
206
0.02
060.
0797
Pre
7.37
72.
503
�0.
0000
30.
0001
1�
0.00
005
0.00
080
0.02
240.
0580
Pos
t2.
269
0.73
70.
0004
40.
0015
00.
0012
00.
0026
80.
0187
0.09
71
Gre
ece
Ful
l5.
593
3.29
90.
0000
20.
0002
70.
0002
00.
0018
50.
0054
0.09
48P
re6.
173
3.91
5�
0.00
001
0.00
005
�0.
0001
00.
0020
0�
0.00
380.
0865
Pos
t4.
926
2.24
20.
0000
50.
0003
90.
0005
50.
0016
20.
0161
0.10
29
Indi
aF
ull
2.61
31.
350
�0.
0006
50.
0024
00.
0001
40.
0004
10.
0088
0.07
93P
re3.
172
1.18
6�
0.00
102
0.00
268
0.00
001
0.00
008
0.01
670.
0725
Pos
t1.
247
0.45
60.
0002
50.
0010
30.
0004
50.
0006
6�
0.01
030.
0916
Indo
nesi
aF
ull
1.36
80.
695
0.00
007
0.00
033
0.00
147
0.00
259
�0.
0191
0.13
00P
re0.
276
0.15
90.
0000
00.
0000
40.
0010
10.
0014
2�
0.01
500.
1045
Pos
t1.
633
0.48
10.
0002
30.
0005
90.
0016
40.
0029
2�
0.02
070.
1391
Kor
eaF
ull
3.81
92.
846
0.00
011
0.00
068
0.00
069
0.00
188
0.00
350.
0998
Pre
4.63
21.
593
0.00
000
0.00
027
0.00
024
0.00
090
0.01
020.
0885
Pos
t1.
593
0.54
90.
0004
00.
0012
00.
0019
30.
0030
0�
0.01
480.
1247
(con
tinu
edon
next
page
)
COLUMBIA BUSINESS SCHOOL 19
315G. Bekaert et al. / Journal of International Money and Finance 21 (2002) 295–350
Tab
le3
(cont
inue
d)
Cou
ntry
Div
iden
dyi
eld
Net
bond
flow
s/G
DP
Net
equi
tyflo
ws/
mca
pLo
gre
turn
s
Mea
nS
td.
dev.
Mea
nS
td.
dev.
Mea
nS
td.
dev.
Mea
nS
td.
dev.
Mal
aysi
aF
ull
1.99
00.
624
0.00
015
0.00
195
0.00
020
0.00
065
�0.
0002
0.09
60P
re2.
160
0.39
8�
0.00
007
0.00
118
0.00
022
0.00
044
0.00
610.
0860
Pos
t1.
870
0.72
20.
0005
60.
0028
60.
0001
80.
0007
8�
0.00
550.
1037
Mex
ico
Ful
l4.
298
4.17
20.
0003
20.
0017
80.
0011
10.
0040
40.
0132
0.13
37P
re5.
743
4.49
60.
0001
50.
0019
50.
0007
70.
0025
40.
0155
0.14
57P
ost
1.50
60.
422
0.00
064
0.00
132
0.00
175
0.00
592
0.00
890.
1076
Pak
ista
nF
ull
4.49
62.
619
0.00
002
0.00
024
0.00
039
0.00
229
0.00
420.
0828
Pre
7.70
90.
789
0.00
000
0.00
000
0.00
000
0.00
020
0.01
010.
0299
Pos
t2.
765
1.88
20.
0000
60.
0004
00.
0006
90.
0030
3�
0.00
050.
1073
Phi
lippi
nes
Ful
l1.
540
1.47
60.
0001
20.
0010
50.
0005
40.
0023
90.
0175
0.10
39P
re2.
263
1.90
6�
0.00
008
0.00
028
0.00
005
0.00
313
0.04
430.
1042
Pos
t0.
913
0.53
40.
0004
70.
0016
20.
0008
70.
0016
2�
0.00
090.
1001
Por
tuga
lF
ull
2.45
61.
128
�0.
0000
20.
0001
60.
0010
10.
0039
70.
0206
0.10
45P
re1.
006
0.54
40.
0000
00.
0000
20.
0001
50.
0006
90.
0515
0.17
96P
ost
2.80
20.
939
�0.
0000
30.
0002
30.
0012
90.
0045
20.
0108
0.06
28
Tai
wan
Ful
l0.
994
0.54
1�
0.00
017
0.00
043
0.00
003
0.00
028
0.01
310.
1331
Pre
1.67
70.
701
�0.
0000
30.
0000
70.
0000
20.
0002
60.
0400
0.14
69P
ost
0.83
20.
334
�0.
0003
30.
0005
80.
0000
40.
0002
90.
0046
0.12
79
Tha
iland
Ful
l5.
523
3.31
10.
0000
40.
0004
30.
0003
00.
0009
80.
0056
0.09
62P
re7.
680
2.86
0�
0.00
001
0.00
013
0.00
035
0.00
100
0.01
650.
0736
Pos
t3.
005
1.55
70.
0001
10.
0006
10.
0002
40.
0009
6�
0.00
700.
1162
(con
tinu
edon
next
page
)
COLUMBIA BUSINESS SCHOOL 21
316 G. Bekaert et al. / Journal of International Money and Finance 21 (2002) 295–350
Tab
le3
(cont
inue
d)
Cou
ntry
Div
iden
dyi
eld
Net
bond
flow
s/G
DP
Net
equi
tyflo
ws/
mca
pLo
gre
turn
s
Mea
nS
td.
dev.
Mea
nS
td.
dev.
Mea
nS
td.
dev.
Mea
nS
td.
dev.
Tur
key
Ful
l4.
349
2.20
50.
0000
10.
0001
30.
0004
90.
0024
00.
0177
0.18
03P
re7.
275
2.91
70.
0000
00.
0000
2�
0.00
006
0.00
052
0.05
350.
2191
Pos
t3.
708
1.35
20.
0000
20.
0002
00.
0006
60.
0027
20.
0064
0.16
59
Ven
ezue
laF
ull
1.64
80.
914
0.00
015
0.00
287
0.00
001
0.00
396
0.00
830.
1409
Pre
1.39
40.
914
0.00
021
0.00
329
�0.
0001
00.
0015
80.
0266
0.13
83P
ost
1.89
00.
847
0.00
001
0.00
146
0.00
015
0.00
557
�0.
0123
0.14
18
All
coun
trie
sF
ull
3.37
32.
123
0.00
002
0.00
100
0.00
053
0.00
227
0.00
920.
1192
Pre
4.26
31.
900
�0.
0000
70.
0006
50.
0001
60.
0013
30.
0197
0.12
01P
ost
2.35
91.
081
0.00
020
0.00
115
0.00
101
0.00
277
0.00
140.
1134
Latin
Am
eric
aF
ull
3.76
72.
667
0.00
009
0.00
149
0.00
061
0.00
316
0.01
330.
137
Pre
4.74
12.
555
0.00
001
0.00
106
0.00
014
0.00
200
0.01
750.
142
Pos
t2.
469
1.22
10.
0002
70.
0016
40.
0014
50.
0041
60.
0074
0.11
4
Asi
aF
ull
2.53
91.
582
0.00
005
0.00
081
0.00
054
0.00
146
0.00
340.
110
Pre
3.11
51.
270
�0.
0000
30.
0003
30.
0003
20.
0011
90.
0170
0.10
1P
ost
1.64
10.
696
0.00
024
0.00
124
0.00
082
0.00
159
�0.
0074
0.11
9
Rel
yon
stoc
ksF
ull
3.37
91.
901
0.00
002
0.00
103
0.00
051
0.00
188
0.01
080.
0995
Pre
3.92
01.
554
�0.
0000
70.
0004
60.
0002
00.
0012
60.
0246
0.10
64P
ost
2.27
10.
844
0.00
020
0.00
159
0.00
085
0.00
205
�0.
0003
0.09
72
Rel
yon
bond
sF
ull
3.14
42.
363
0.00
013
0.00
112
0.00
076
0.00
340
0.00
440.
1436
Pre
3.87
91.
959
0.00
006
0.00
090
0.00
028
0.00
191
0.00
980.
1368
Pos
t2.
250
1.36
50.
0003
00.
0010
50.
0015
40.
0044
8�
0.00
180.
1264
(con
tinu
edon
next
page
)
COLUMBIA BUSINESS SCHOOL 22
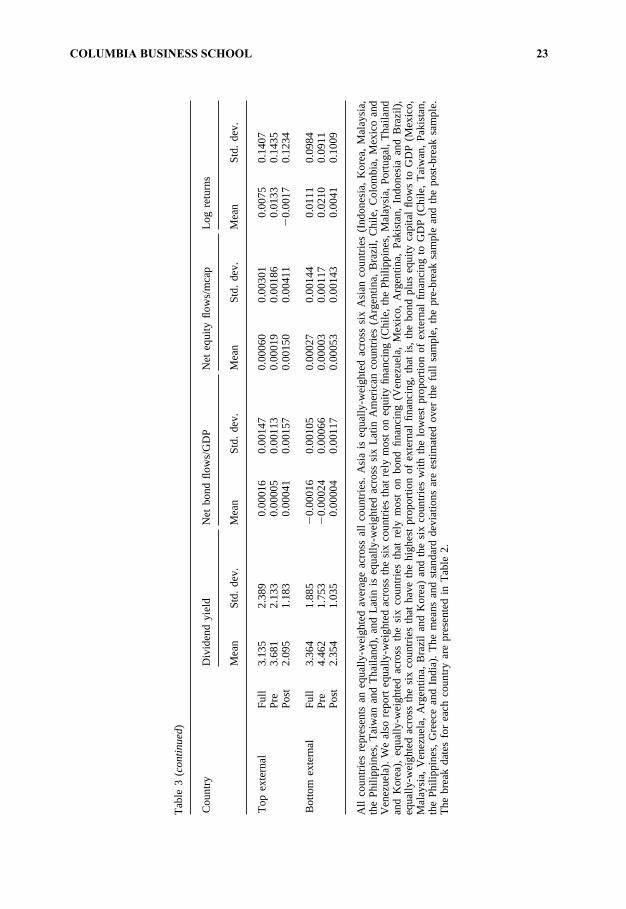
317G. Bekaert et al. / Journal of International Money and Finance 21 (2002) 295–350
Tab
le3
(cont
inue
d)
Cou
ntry
Div
iden
dyi
eld
Net
bond
flow
s/G
DP
Net
equi
tyflo
ws/
mca
pLo
gre
turn
s
Mea
nS
td.
dev.
Mea
nS
td.
dev.
Mea
nS
td.
dev.
Mea
nS
td.
dev.
Top
exte
rnal
Ful
l3.
135
2.38
90.
0001
60.
0014
70.
0006
00.
0030
10.
0075
0.14
07P
re3.
681
2.13
30.
0000
50.
0011
30.
0001
90.
0018
60.
0133
0.14
35P
ost
2.09
51.
183
0.00
041
0.00
157
0.00
150
0.00
411
�0.
0017
0.12
34
Bot
tom
exte
rnal
Ful
l3.
364
1.88
5�
0.00
016
0.00
105
0.00
027
0.00
144
0.01
110.
0984
Pre
4.46
21.
753
�0.
0002
40.
0006
60.
0000
30.
0011
70.
0210
0.09
11P
ost
2.35
41.
035
0.00
004
0.00
117
0.00
053
0.00
143
0.00
410.
1009
All
coun
trie
sre
pres
ents
aneq
ually
-wei
ghte
dav
erag
eac
ross
all
coun
trie
s.A
sia
iseq
ually
-wei
ghte
dac
ross
six
Asi
anco
untr
ies
(Ind
ones
ia,
Kor
ea,
Mal
aysi
a,th
eP
hilip
pine
s,T
aiw
anan
dT
haila
nd),
and
Latin
iseq
ually
-wei
ghte
dac
ross
six
Latin
Am
eric
anco
untr
ies
(Arg
entin
a,B
razi
l,C
hile
,C
olom
bia,
Mex
ico
and
Ven
ezue
la).
We
also
repo
rteq
ually
-wei
ghte
dac
ross
the
six
coun
trie
sth
atre
lym
ost
oneq
uity
finan
cing
(Chi
le,
the
Phi
lippi
nes,
Mal
aysi
a,P
ortu
gal
,T
haila
ndan
dK
orea
),eq
ually
-wei
ghte
dac
ross
the
six
coun
trie
sth
atre
lym
ost
onbo
ndfin
anci
ng(V
enez
uela
,M
exic
o,A
rgen
tina,
Pak
ista
n,In
done
sia
and
Bra
zil),
equa
lly-w
eigh
ted
acro
ssth
esi
xco
untr
ies
that
have
the
high
est
prop
ortio
nof
exte
rnal
finan
cing
,th
atis
,th
ebo
ndpl
useq
uity
capi
tal
flow
sto
GD
P(M
exi
co,
Mal
aysi
a,V
enez
uela
,A
rgen
tina,
Bra
zil
and
Kor
ea)
and
the
six
coun
trie
sw
ithth
elo
wes
tpr
opor
tion
ofex
tern
alfin
anci
ngto
GD
P(C
hile
,T
aiw
an,
Pak
ista
n,th
eP
hilip
pine
s,G
reec
ean
dIn
dia)
.T
hem
eans
and
stan
dard
devi
atio
nsar
ees
timat
edov
erth
efu
llsa
mpl
e,th
epr
e-br
eak
sam
ple
and
the
post
-bre
aksa
mpl
e.T
hebr
eak
date
sfo
rea
chco
untr
yar
epr
esen
ted
inT
able
2.
COLUMBIA BUSINESS SCHOOL 23
318 G. Bekaert et al. / Journal of International Money and Finance 21 (2002) 295–350
decreases after the breaks. Note that return volatility actually declines from 41.6%to 39.3% on an annualized basis.
The capital flows also exhibit differences. The equity capital flows to capitalizationratio increases five-fold after the break. Increases occur in 15 of 17 countries. Simi-larly, the bond flows to GDP ratio increases from a negative number in the pre-break period to a positive number in the post-break period. Increases occur in 13 of17 countries. It is also interesting to note that while the volatility of equity returnsand dividend yields decreases after our breaks, the volatility of both the equity andbond capital flows increases. Indeed, the volatility of the bond and equity flow ratiosdoubles from pre to post-break.
4.3. Mean dynamics of capital flows
We estimated the regression specified in eq. (6) for each individual country andpooled across all countries for the various country groups introduced in Section 3.The pooled regression allows for fixed effects, and corrects for temporal heterosked-asticity. The results are in Table 4. We report the regressions both for equity flowsand bond flows. The equity results are consistent with the liberalization inducing alarge portfolio rebalancing that induces large capital flows just after the break, butless after the transition period (which we fixed at three years). On an annualizedbasis, equity flows increase by 1.4% of local market capitalization, but then drop by0.55% after three years. Bond flows continue to increase throughout.
One might expect this phenomenon to be artificially driven by the Asian crisis.During late 1997 and 1998, large amounts of foreign capital left Asia and this wasnot driven by a liberalization-induced portfolio rebalancing. However, the overallphenomenon we find does not occur for Asia, where equity flows on average continueto increase three years after the liberalization. The positive/negative pattern howeveris very strong in Latin-America. Not surprisingly the result also strongly appears forthe 6 countries relying most on foreign capital, whereas it does not show for theleast foreign portfolio capital reliant countries. The fact that the result shows up forthe countries that rely more heavily on bonds and not for those that rely most heavilyon stocks is probably due to the geographical composition of these groups, withLatin-American countries dominating the former, but not the latter.
4.4. Transition dynamics
The results of our THL statistic using the quadravariate VAR are summarized inFig. 3 for capital flows and dividend yields. We can interpret these results as indica-tive of how flows and dividends react when the markets become integrated and howthey might react when the integration process is reversed. The pre-mean/new dynam-ics plot illustrates that for almost half the countries, capital comes in very fast, sothat adjustment happens very quickly, usually within one month. This may provideindirect evidence of portfolio rebalancing. But there are also some notable excep-tions. In Chile, Colombia, Greece, India, Korea, the Philippines, Portugal, Thailand,and Venezuela the transition lasts at least five months. More striking is that in 15
COLUMBIA BUSINESS SCHOOL 24
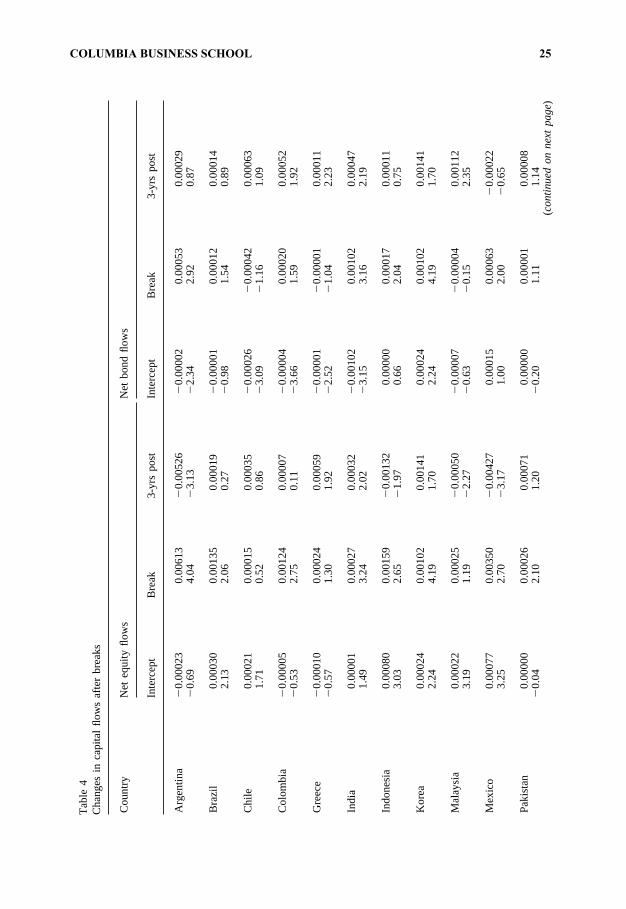
319G. Bekaert et al. / Journal of International Money and Finance 21 (2002) 295–350T
able
4C
hang
esin
capi
tal
flow
saf
ter
brea
ks
Cou
ntry
Net
equi
tyflo
ws
Net
bond
flow
s
Inte
rcep
tB
reak
3-yr
spo
stIn
terc
ept
Bre
ak3-
yrs
post
Arg
entin
a�
0.00
023
0.00
613
�0.
0052
6�
0.00
002
0.00
053
0.00
029
�0.
694.
04�
3.13
�2.
342.
920.
87
Bra
zil
0.00
030
0.00
135
0.00
019
�0.
0000
10.
0001
20.
0001
42.
132.
060.
27�
0.98
1.54
0.89
Chi
le0.
0002
10.
0001
50.
0003
5�
0.00
026
�0.
0004
20.
0006
31.
710.
520.
86�
3.09
�1.
161.
09
Col
ombi
a�
0.00
005
0.00
124
0.00
007
�0.
0000
40.
0002
00.
0005
2�
0.53
2.75
0.11
�3.
661.
591.
92
Gre
ece
�0.
0001
00.
0002
40.
0005
9�
0.00
001
�0.
0000
10.
0001
1�
0.57
1.30
1.92
�2.
52�
1.04
2.23
Indi
a0.
0000
10.
0002
70.
0003
2�
0.00
102
0.00
102
0.00
047
1.49
3.24
2.02
�3.
153.
162.
19
Indo
nesi
a0.
0008
00.
0015
9�
0.00
132
0.00
000
0.00
017
0.00
011
3.03
2.65
�1.
970.
662.
040.
75
Kor
ea0.
0002
40.
0010
20.
0014
10.
0002
40.
0010
20.
0014
12.
244.
191.
702.
244.
191.
70
Mal
aysi
a0.
0002
20.
0002
5�
0.00
050
�0.
0000
7�
0.00
004
0.00
112
3.19
1.19
�2.
27�
0.63
�0.
152.
35
Mex
ico
0.00
077
0.00
350
�0.
0042
70.
0001
50.
0006
3�
0.00
022
3.25
2.70
�3.
171.
002.
00�
0.65
Pak
ista
n0.
0000
00.
0002
60.
0007
10.
0000
00.
0000
10.
0000
8�
0.04
2.10
1.20
�0.
201.
111.
14(c
onti
nued
onne
xtpa
ge)
COLUMBIA BUSINESS SCHOOL 25
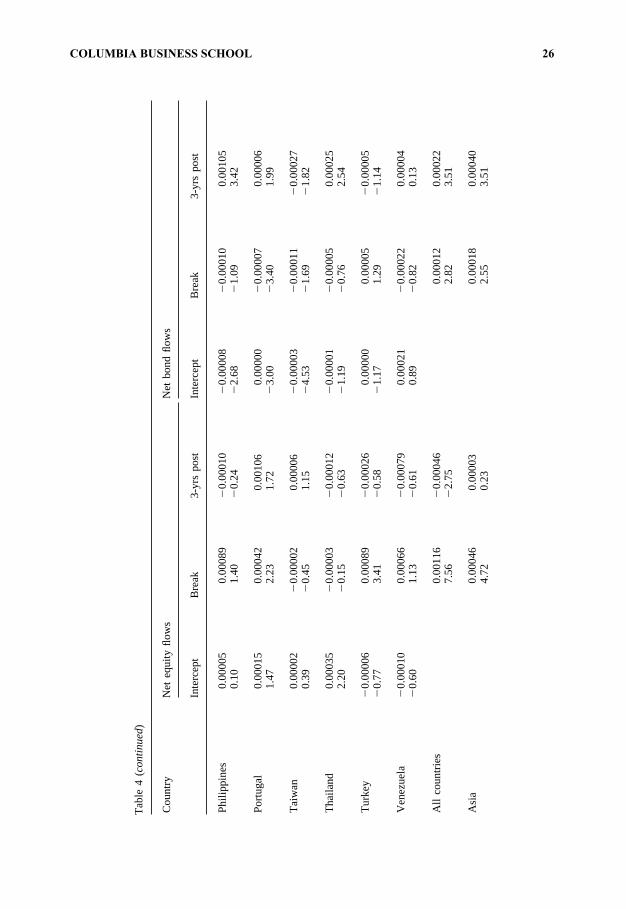
320 G. Bekaert et al. / Journal of International Money and Finance 21 (2002) 295–350
Tab
le4
(cont
inue
d)
Cou
ntry
Net
equi
tyflo
ws
Net
bond
flow
s
Inte
rcep
tB
reak
3-yr
spo
stIn
terc
ept
Bre
ak3-
yrs
post
Phi
lippi
nes
0.00
005
0.00
089
�0.
0001
0�
0.00
008
�0.
0001
00.
0010
50.
101.
40�
0.24
�2.
68�
1.09
3.42
Por
tuga
l0.
0001
50.
0004
20.
0010
60.
0000
0�
0.00
007
0.00
006
1.47
2.23
1.72
�3.
00�
3.40
1.99
Tai
wan
0.00
002
�0.
0000
20.
0000
6�
0.00
003
�0.
0001
1�
0.00
027
0.39
�0.
451.
15�
4.53
�1.
69�
1.82
Tha
iland
0.00
035
�0.
0000
3�
0.00
012
�0.
0000
1�
0.00
005
0.00
025
2.20
�0.
15�
0.63
�1.
19�
0.76
2.54
Tur
key
�0.
0000
60.
0008
9�
0.00
026
0.00
000
0.00
005
�0.
0000
5�
0.77
3.41
�0.
58�
1.17
1.29
�1.
14
Ven
ezue
la�
0.00
010
0.00
066
�0.
0007
90.
0002
1�
0.00
022
0.00
004
�0.
601.
13�
0.61
0.89
�0.
820.
13
All
coun
trie
s0.
0011
6�
0.00
046
0.00
012
0.00
022
7.56
�2.
752.
823.
51
Asi
a0.
0004
60.
0000
30.
0001
80.
0004
04.
720.
232.
553.
51
COLUMBIA BUSINESS SCHOOL 26
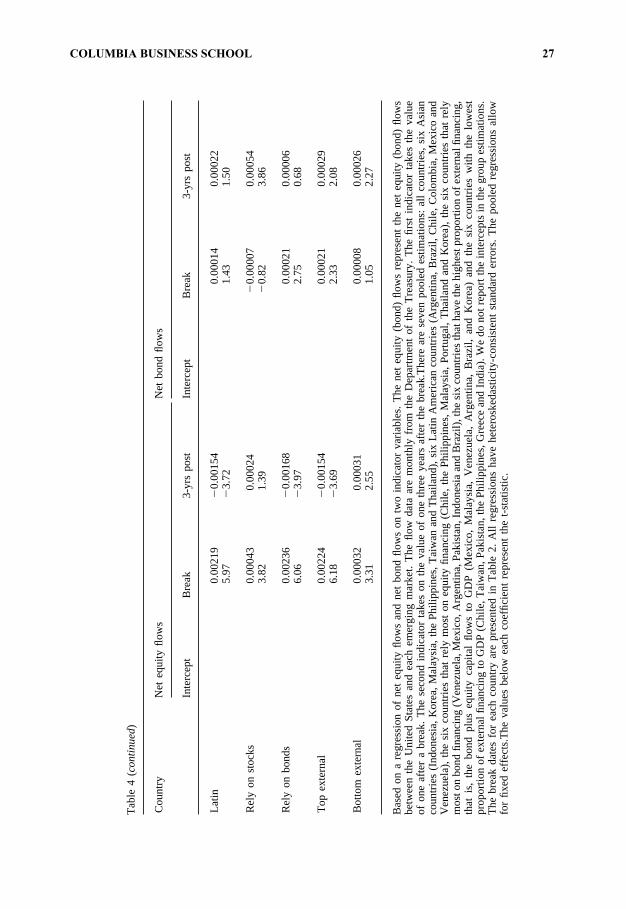
321G. Bekaert et al. / Journal of International Money and Finance 21 (2002) 295–350
Tab
le4
(cont
inue
d)
Cou
ntry
Net
equi
tyflo
ws
Net
bond
flow
s
Inte
rcep
tB
reak
3-yr
spo
stIn
terc
ept
Bre
ak3-
yrs
post
Latin
0.00
219
�0.
0015
40.
0001
40.
0002
25.
97�
3.72
1.43
1.50
Rel
yon
stoc
ks0.
0004
30.
0002
4�
0.00
007
0.00
054
3.82
1.39
�0.
823.
86
Rel
yon
bond
s0.
0023
6�
0.00
168
0.00
021
0.00
006
6.06
�3.
972.
750.
68
Top
exte
rnal
0.00
224
�0.
0015
40.
0002
10.
0002
96.
18�
3.69
2.33
2.08
Bot
tom
exte
rnal
0.00
032
0.00
031
0.00
008
0.00
026
3.31
2.55
1.05
2.27
Bas
edon
are
gres
sion
ofne
teq
uity
flow
san
dne
tbo
ndflo
ws
ontw
oin
dica
tor
varia
bles
.T
hene
teq
uity
(bon
d)flo
ws
repr
esen
tth
ene
teq
uity
(bon
d)flo
ws
betw
een
the
Uni
ted
Sta
tes
and
each
emer
ging
mar
ket.
The
flow
data
are
mon
thly
from
the
Dep
artm
ent
ofth
eT
reas
ury.
The
first
indi
cato
rta
kes
the
valu
eof
one
afte
ra
brea
k.T
hese
cond
indi
cato
rta
kes
onth
eva
lue
ofon
eth
ree
year
saf
ter
the
brea
k.T
here
are
seve
npo
oled
estim
atio
ns:
all
coun
trie
s,si
xA
sian
coun
trie
s(I
ndon
esia
,K
orea
,M
alay
sia,
the
Phi
lippi
nes,
Tai
wan
and
Tha
iland
),si
xLa
tinA
mer
ican
coun
trie
s(A
rgen
tina,
Bra
zil,
Chi
le,
Col
ombi
a,M
exic
oan
dV
enez
uela
),th
esi
xco
untr
ies
that
rely
mos
ton
equi
tyfin
anci
ng(C
hile
,th
eP
hilip
pine
s,M
alay
sia,
Por
tuga
l,T
haila
ndan
dK
orea
),th
esi
xco
untr
ies
that
rely
mos
ton
bond
finan
cing
(Ven
ezue
la,M
exic
o,A
rgen
tina,
Pak
ista
n,In
done
sia
and
Bra
zil),
the
six
coun
trie
sth
atha
veth
ehi
ghes
tpro
port
ion
ofex
tern
alfi
nanc
ing,
that
is,
the
bond
plus
equi
tyca
pita
lflo
ws
toG
DP
(Mex
ico,
Mal
aysi
a,V
enez
uela
,A
rgen
tina,
Bra
zil,
and
Kor
ea)
and
the
six
coun
trie
sw
ithth
elo
wes
tpr
opor
tion
ofex
tern
alfin
anci
ngto
GD
P(C
hile
,T
aiw
an,P
akis
tan,
the
Phi
lippi
nes,
Gre
ece
and
Indi
a).W
edo
not
repo
rtth
ein
terc
epts
inth
egr
oup
esti
mat
ions
.T
hebr
eak
date
sfo
rea
chco
untr
yar
epr
esen
ted
inT
able
2.A
llre
gres
sion
sha
vehe
tero
sked
astic
ity-c
onsi
sten
tst
anda
rder
rors
.T
hepo
oled
regr
essi
ons
allo
wfo
rfix
edef
fect
s.T
heva
lues
belo
wea
chco
effic
ient
repr
esen
tth
et-
stat
istic
.
COLUMBIA BUSINESS SCHOOL 27
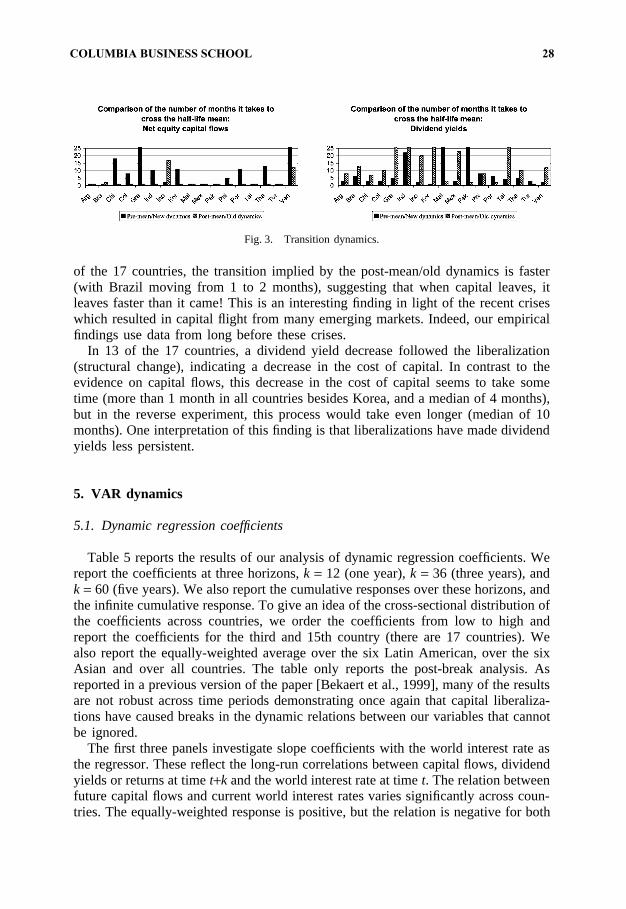
322 G. Bekaert et al. / Journal of International Money and Finance 21 (2002) 295–350
Fig. 3. Transition dynamics.
of the 17 countries, the transition implied by the post-mean/old dynamics is faster(with Brazil moving from 1 to 2 months), suggesting that when capital leaves, itleaves faster than it came! This is an interesting finding in light of the recent criseswhich resulted in capital flight from many emerging markets. Indeed, our empiricalfindings use data from long before these crises.
In 13 of the 17 countries, a dividend yield decrease followed the liberalization(structural change), indicating a decrease in the cost of capital. In contrast to theevidence on capital flows, this decrease in the cost of capital seems to take sometime (more than 1 month in all countries besides Korea, and a median of 4 months),but in the reverse experiment, this process would take even longer (median of 10months). One interpretation of this finding is that liberalizations have made dividendyields less persistent.
5. VAR dynamics
5.1. Dynamic regression coefficients
Table 5 reports the results of our analysis of dynamic regression coefficients. Wereport the coefficients at three horizons,k = 12 (one year),k = 36 (three years), andk = 60 (five years). We also report the cumulative responses over these horizons, andthe infinite cumulative response. To give an idea of the cross-sectional distribution ofthe coefficients across countries, we order the coefficients from low to high andreport the coefficients for the third and 15th country (there are 17 countries). Wealso report the equally-weighted average over the six Latin American, over the sixAsian and over all countries. The table only reports the post-break analysis. Asreported in a previous version of the paper [Bekaert et al., 1999], many of the resultsare not robust across time periods demonstrating once again that capital liberaliza-tions have caused breaks in the dynamic relations between our variables that cannotbe ignored.
The first three panels investigate slope coefficients with the world interest rate asthe regressor. These reflect the long-run correlations between capital flows, dividendyields or returns at timet+k and the world interest rate at timet. The relation betweenfuture capital flows and current world interest rates varies significantly across coun-tries. The equally-weighted response is positive, but the relation is negative for both
COLUMBIA BUSINESS SCHOOL 28
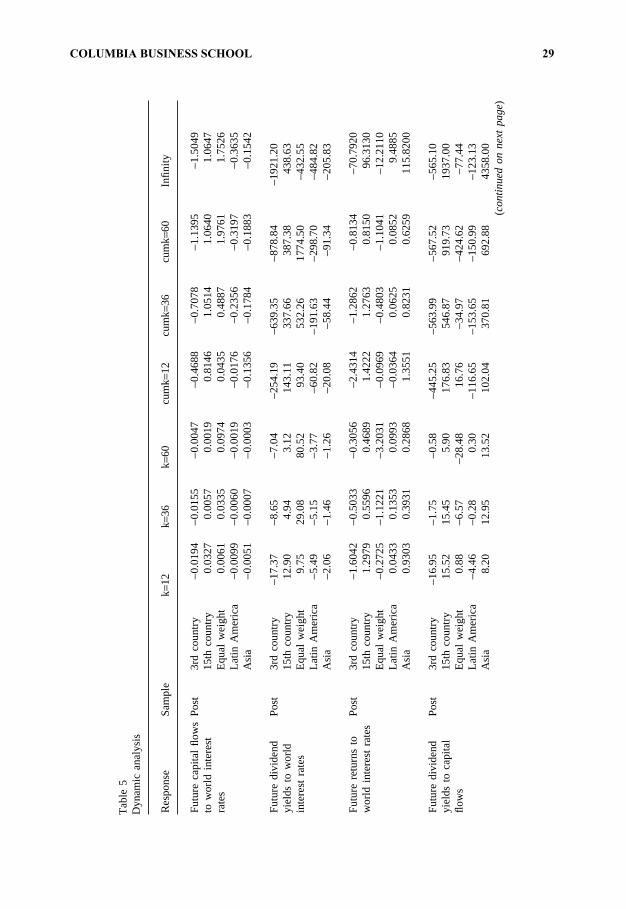
323G. Bekaert et al. / Journal of International Money and Finance 21 (2002) 295–350
Tab
le5
Dyn
amic
anal
ysis
Res
pons
eS
ampl
ek=12
k=36
k=60
cum
k=12
cum
k=36
cum
k=60
Infin
ity
Fut
ure
capi
tal
flow
sP
ost
3rd
coun
try
−0.0
194
−0.0
155
−0.0
047
−0.4
688
−0.7
078
−1.1
395
−1.5
049
tow
orld
inte
rest
15th
coun
try
0.03
270.
0057
0.00
190.
8146
1.05
141.
0640
1.06
47ra
tes
Equ
alw
eigh
t0.
0061
0.03
350.
0974
0.04
350.
4887
1.97
611.
7526
Latin
Am
eric
a−0
.009
9−0
.006
0−0
.001
9−0
.017
6−0
.235
6−0
.319
7−0
.363
5A
sia
−0.0
051
−0.0
007
−0.0
003
−0.1
356
−0.1
784
−0.1
883
−0.1
542
Fut
ure
divi
dend
Pos
t3r
dco
untr
y−1
7.37
−8.6
5−7
.04
−254
.19
−639
.35
−878
.84
−192
1.20
yiel
dsto
wor
ld15
thco
untr
y12
.90
4.94
3.12
143.
1133
7.66
387.
3843
8.63
inte
rest
rate
sE
qual
wei
ght
9.75
29.0
880
.52
93.4
053
2.26
1774
.50
−432
.55
Latin
Am
eric
a−5
.49
−5.1
5−3
.77
−60.
82−1
91.6
3−2
98.7
0−4
84.8
2A
sia
−2.0
6−1
.46
−1.2
6−2
0.08
−58.
44−9
1.34
−205
.83
Fut
ure
retu
rns
toP
ost
3rd
coun
try
−1.6
042
−0.5
033
−0.3
056
−2.4
314
−1.2
862
−0.8
134
−70.
7920
wor
ldin
tere
stra
tes
15th
coun
try
1.29
790.
5596
0.46
891.
4222
1.27
630.
8150
96.3
130
Equ
alw
eigh
t−0
.272
5−1
.122
1−3
.203
1−0
.096
9−0
.480
3−1
.104
1−1
2.21
10La
tinA
mer
ica
0.04
330.
1353
0.09
93−0
.036
40.
0625
0.08
529.
4885
Asi
a0.
9303
0.39
310.
2868
1.35
510.
8231
0.62
5911
5.82
00
Fut
ure
divi
dend
Pos
t3r
dco
untr
y−1
6.95
−1.7
5−0
.58
−445
.25
−563
.99
−567
.52
−565
.10
yiel
dsto
capi
tal
15th
coun
try
15.5
215
.45
5.90
176.
8354
6.87
919.
7319
37.0
0flo
ws
Equ
alw
eigh
t0.
88−6
.57
−28.
4816
.76
−34.
97−4
24.6
2−7
7.44
Latin
Am
eric
a−4
.46
−0.2
80.
30−1
16.6
5−1
53.6
5−1
50.9
9−1
23.1
3A
sia
8.20
12.9
513
.52
102.
0437
0.81
692.
8843
58.0
0(c
onti
nued
onne
xtpa
ge)
COLUMBIA BUSINESS SCHOOL 29
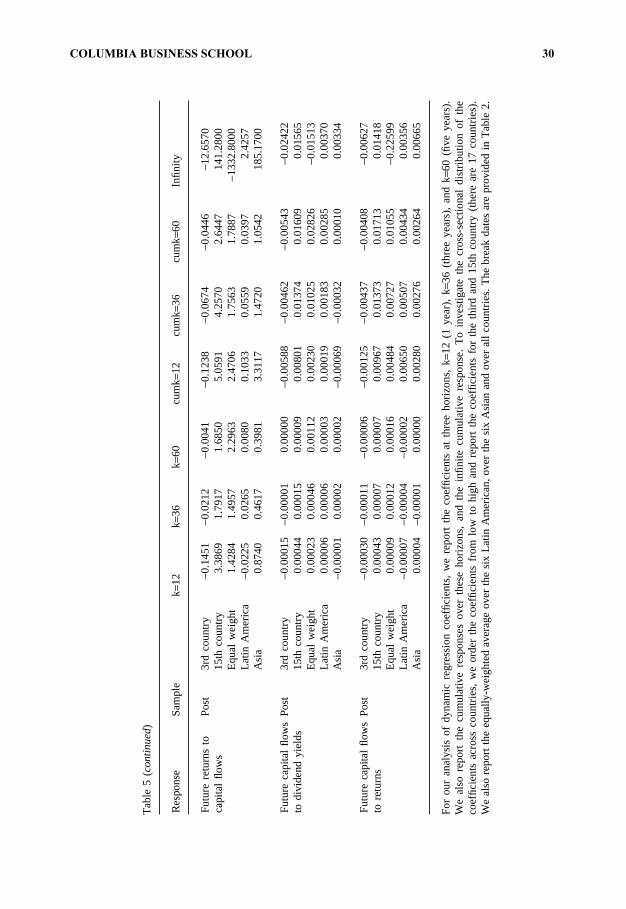
324 G. Bekaert et al. / Journal of International Money and Finance 21 (2002) 295–350
Tab
le5
(cont
inue
d)
Res
pons
eS
ampl
ek=12
k=36
k=60
cum
k=12
cum
k=36
cum
k=60
Infin
ity
Fut
ure
retu
rns
toP
ost
3rd
coun
try
−0.1
451
−0.0
212
−0.0
041
−0.1
238
−0.0
674
−0.0
446
−12.
6570
capi
tal
flow
s15
thco
untr
y3.
3869
1.79
171.
6850
5.05
914.
2570
2.64
4714
1.28
00E
qual
wei
ght
1.42
841.
4957
2.29
632.
4706
1.75
631.
7887
−133
2.80
00La
tinA
mer
ica
−0.0
225
0.02
650.
0080
0.10
330.
0559
0.03
972.
4257
Asi
a0.
8740
0.46
170.
3981
3.31
171.
4720
1.05
4218
5.17
00
Fut
ure
capi
tal
flow
sP
ost
3rd
coun
try
−0.0
0015
−0.0
0001
0.00
000
−0.0
0588
−0.0
0462
−0.0
0543
−0.0
2422
todi
vide
ndyi
elds
15th
coun
try
0.00
044
0.00
015
0.00
009
0.00
801
0.01
374
0.01
609
0.01
565
Equ
alw
eigh
t0.
0002
30.
0004
60.
0011
20.
0023
00.
0102
50.
0282
6−0
.015
13La
tinA
mer
ica
0.00
006
0.00
006
0.00
003
0.00
019
0.00
183
0.00
285
0.00
370
Asi
a−0
.000
010.
0000
20.
0000
2−0
.000
69−0
.000
320.
0001
00.
0033
4
Fut
ure
capi
tal
flow
sP
ost
3rd
coun
try
−0.0
0030
−0.0
0011
−0.0
0006
−0.0
0125
−0.0
0437
−0.0
0408
−0.0
0627
tore
turn
s15
thco
untr
y0.
0004
30.
0000
70.
0000
70.
0096
70.
0137
30.
0171
30.
0141
8E
qual
wei
ght
0.00
009
0.00
012
0.00
016
0.00
484
0.00
727
0.01
055
−0.2
2599
Latin
Am
eric
a−0
.000
07−0
.000
04−0
.000
020.
0065
00.
0050
70.
0043
40.
0035
6A
sia
0.00
004
−0.0
0001
0.00
000
0.00
280
0.00
276
0.00
264
0.00
665
For
our
anal
ysis
ofdy
nam
icre
gres
sion
coef
ficie
nts,
we
repo
rtth
eco
effic
ient
sat
thre
eho
rizon
s,k
=12
(1ye
ar),
k=36
(thr
eeye
ars)
,an
dk=6
0(fi
veye
ars)
.W
eal
sore
port
the
cum
ulat
ive
resp
onse
sov
erth
ese
horiz
ons,
and
the
infin
itecu
mul
ativ
ere
spon
se.
To
inve
stig
ate
the
cros
s-se
ctio
nal
dist
ribut
ion
ofth
eco
effic
ient
sac
ross
coun
trie
s,w
eor
der
the
coef
ficie
nts
from
low
tohi
ghan
dre
port
the
coef
ficie
nts
for
the
third
and
15th
coun
try
(the
rear
e17
coun
tri
es).
We
also
repo
rtth
eeq
ually
-wei
ghte
dav
erag
eov
erth
esi
xLa
tinA
mer
ican
,ov
erth
esi
xA
sian
and
over
allc
ount
ries.
The
brea
kda
tes
are
prov
ided
inT
abl
e2.
COLUMBIA BUSINESS SCHOOL 30
325G. Bekaert et al. / Journal of International Money and Finance 21 (2002) 295–350
the Latin American and Asian countries. For example, a 1% decrease in the worldinterest rate is associated with a cumulative 36-month increase of US holdings ofthe local equity market equal to 0.24% in Latin America and 0.18% in South-EastAsia in the post-break period.
The relation between the world interest rate and future dividend yields equally-weighted across the countries is at first positive but the cumulative infinite responseis negative. The responses in Latin America and Asia are always negative, indicatingthat lower interest rates are associated with future increases in dividend yields. Thisis surprising under the “push” hypothesis where lower interest rates drive developedmarket capital into emerging markets and drive up prices there, hence lowering divi-dend yields. Of course, we report long-run effects, and the “push” effect may bevery short-lived. The effects we document die out very slowly, which is largely dueto the large persistence of the dividend yield in most countries. Note that the coef-ficients seem large primarily because of the log-transformation of dividend yields.To get an approximate regression coefficient for the level of the dividend yield, oneshould multiply the reported coefficients by the average dividend yield level (0.035).
For the implicit regression of future returns on the world interest rate, we dividethe cumulative effects byk, to obtain a per period return effect (except, of course,for k = �). Not surprisingly, given the noisiness in returns, the coefficients showalso a wide range across countries. Nevertheless, they are consistently positive forboth Latin America and Asia. Hence, decreases in world interest rates are associatedwith long-run decreases in returns, not increases as we might expect. The samecaveats we mentioned above apply. In addition, we should add that a true test ofthe “push” hypothesis should focus on the effects of an unexpected shock to worldinterest rates, especially since world interest rates are quite predictable. Such ananalysis follows later when we consider impulse responses.
The following panels consider the long-run relation between capital flows andfuture dividend yields and returns. The relation between capital flows and futuredividend yields also shows a lot of cross-sectional dispersion, with positive coef-ficients for Asia and negative ones for Latin America. Hence, the slope coefficientsdo not clearly reveal a permanent cost of capital effect from increased capital flows.The correlations between capital flows and returns are largely positive; higher flowsare correlated with higher future returns but the coefficients are quite small.
The next panel considers an implicit regression of future capital flows on currentlog-dividend yields. The cumulative responses can now be interpreted as the changein total holdings over this period. The coefficients are generally small for the samereason previous coefficients involving dividend yields were large — the log-trans-formation. For an average dividend yield level of 0.035, one should multiply thecoefficients by 28.6. If higher dividend yields proxy for higher expected returns, andthe return chasing hypothesis is true, one would expect a positive contemporaneousrelation, which may persist because of positive autocorrelation in dividend yieldsand flows. This is indeed the case for both Latin-America and Asia at the five-yearhorizon, but the effects are very small. It remains true when the country-by-countryresults are averaged at the five-year horizon but not when the infinite cumulativeresponse is computed.
COLUMBIA BUSINESS SCHOOL 31
326 G. Bekaert et al. / Journal of International Money and Finance 21 (2002) 295–350
The last panel investigates the correlation between current returns and future capi-tal flows. At the horizons that we consider, we would not expect to see much of aneffect, even if foreigners are momentum traders. Indeed, we find very small effects,that are positive when cumulated for Asia and Latin-America, but negative whenaveraged over all countries.
In general, the slope coefficients do not lead to strong conclusions about univariatecorrelation patterns between the various variables. This motivates investigating morecomplex patterns, either partial regression coefficients as in the Granger-causalityanalysis that follows, or impulse responses which control for the predictability ofcausal factors.
5.2. Granger-causality tests
Granger-causality tests are reported in Table 6. The first three columns investigatethe predictive power of a much discussed external factor (a “push” factor), the worldinterest rate, on equity flows, dividend yields and returns. The statistical results areweak. This is not surprising before the break if markets were truly segmented pre-venting free capital flows. The only significant result is that in Korea we can rejectthat the world interest rate fails to Granger-cause returns. But even in the POSTperiod, significant results are rare. Except for single cases of near or below 5%rejections of the no Granger-causality hypotheses in Korea, the Philippines, and Tur-key, the only country where the world interest rate played a significant role predictingcapital flows, dividend yields and returns simultaneously is Brazil.
These results may indicate that the world interest rate is not an important predictorof capital flows and returns and that the previous literature (e.g. Froot et al., 2001)justifiably ignored it, but it may also reflect the short sample periods we have avail-able. When looking at impulse responses in the next sub-section, our various countrygroupings may yet reveal the interest rate to be an important external determinantof capital flows.
The price pressure hypothesis would suggest that increased capital flows tempor-arily induce high returns which are reversed afterwards in which case we wouldexpect capital flows to Granger-cause returns. In the portfolio rebalancing story, onthe other hand, even before the full liberalization is implemented, anticipation shouldhave already led to permanent price increases, making it less obvious that we willsee significant results in the post period. As Fig. 1 indicates, returns show the mostinteresting dynamics during the transition period. If there is an effect on the dividendyield, the effect may represent a more permanent change in the cost of capital. Thestatistical evidence on Granger-causality is not overwhelming. We reject the hypoth-esis of no predictability of returns by capital flows at the 5% level for only sixcountries: Brazil (pre-break), Greece (pre-break), Korea (post-break), Malaysia (fullperiod), Pakistan (post-break), and Thailand (pre-break).
In three of the six countries where capital flows predict returns, they also predictdividend yields significantly. In three other countries (Indonesia, the Philippines andVenezuela), we also record a significant relation between capital flows and divi-dend yields.
COLUMBIA BUSINESS SCHOOL 32
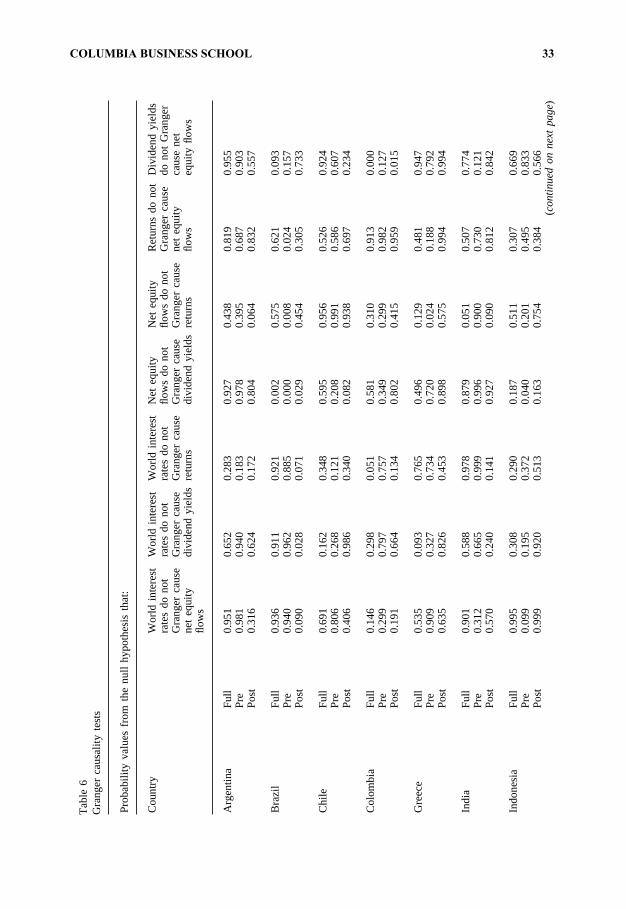
327G. Bekaert et al. / Journal of International Money and Finance 21 (2002) 295–350T
able
6G
rang
erca
usal
ityte
sts
Pro
babi
lity
valu
esfr
omth
enu
llhy
poth
esis
that
:
Cou
ntry
Wor
ldin
tere
stW
orld
inte
rest
Wor
ldin
tere
stN
eteq
uity
Net
equi
tyR
etur
nsdo
not
Div
iden
dyi
elds
rate
sdo
not
rate
sdo
not
rate
sdo
not
flow
sdo
not
flow
sdo
not
Gra
nger
caus
edo
not
Gra
nger
Gra
nger
caus
eG
rang
erca
use
Gra
nger
caus
eG
rang
erca
use
Gra
nger
caus
ene
teq
uity
caus
ene
tne
teq
uity
divi
dend
yiel
dsre
turn
sdi
vide
ndyi
elds
retu
rns
flow
seq
uity
flow
sflo
ws
Arg
entin
aF
ull
0.95
10.
652
0.28
30.
927
0.43
80.
819
0.95
5P
re0.
981
0.94
00.
183
0.97
80.
395
0.68
70.
903
Pos
t0.
316
0.62
40.
172
0.80
40.
064
0.83
20.
557
Bra
zil
Ful
l0.
936
0.91
10.
921
0.00
20.
575
0.62
10.
093
Pre
0.94
00.
962
0.88
50.
000
0.00
80.
024
0.15
7P
ost
0.09
00.
028
0.07
10.
029
0.45
40.
305
0.73
3
Chi
leF
ull
0.69
10.
162
0.34
80.
595
0.95
60.
526
0.92
4P
re0.
806
0.26
80.
121
0.20
80.
991
0.58
60.
607
Pos
t0.
406
0.98
60.
340
0.08
20.
938
0.69
70.
234
Col
ombi
aF
ull
0.14
60.
298
0.05
10.
581
0.31
00.
913
0.00
0P
re0.
299
0.79
70.
757
0.34
90.
299
0.98
20.
127
Pos
t0.
191
0.66
40.
134
0.80
20.
415
0.95
90.
015
Gre
ece
Ful
l0.
535
0.09
30.
765
0.49
60.
129
0.48
10.
947
Pre
0.90
90.
327
0.73
40.
720
0.02
40.
188
0.79
2P
ost
0.63
50.
826
0.45
30.
898
0.57
50.
994
0.99
4
Indi
aF
ull
0.90
10.
588
0.97
80.
879
0.05
10.
507
0.77
4P
re0.
312
0.66
50.
999
0.99
60.
900
0.73
00.
121
Pos
t0.
570
0.24
00.
141
0.92
70.
090
0.81
20.
842
Indo
nesi
aF
ull
0.99
50.
308
0.29
00.
187
0.51
10.
307
0.66
9P
re0.
099
0.19
50.
372
0.04
00.
201
0.49
50.
833
Pos
t0.
999
0.92
00.
513
0.16
30.
754
0.38
40.
566
(con
tinu
edon
next
page
)
COLUMBIA BUSINESS SCHOOL 33
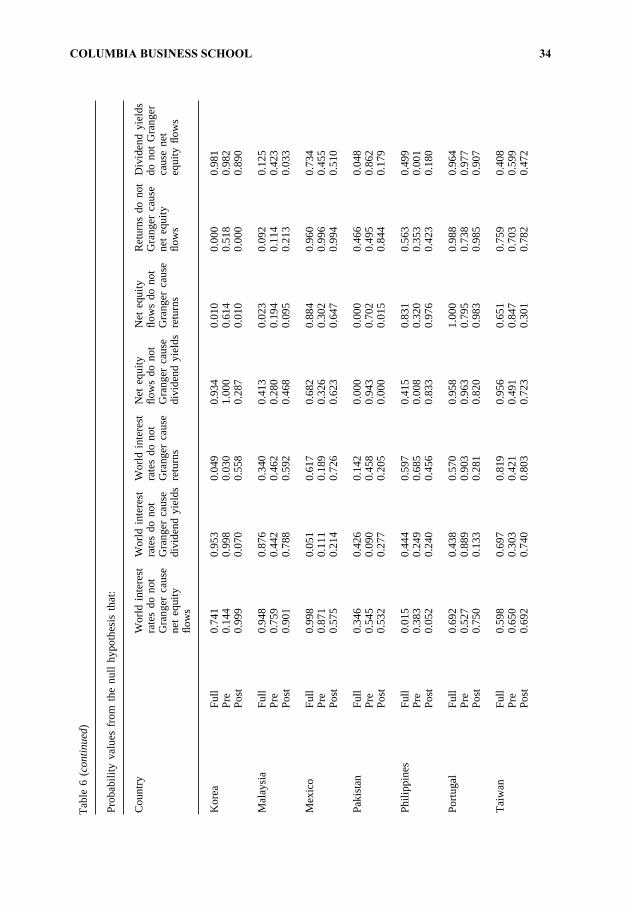
328 G. Bekaert et al. / Journal of International Money and Finance 21 (2002) 295–350T
able
6(co
ntin
ued)
Pro
babi
lity
valu
esfr
omth
enu
llhy
poth
esis
that
:
Cou
ntry
Wor
ldin
tere
stW
orld
inte
rest
Wor
ldin
tere
stN
eteq
uity
Net
equi
tyR
etur
nsdo
not
Div
iden
dyi
elds
rate
sdo
not
rate
sdo
not
rate
sdo
not
flow
sdo
not
flow
sdo
not
Gra
nger
caus
edo
not
Gra
nger
Gra
nger
caus
eG
rang
erca
use
Gra
nger
caus
eG
rang
erca
use
Gra
nger
caus
ene
teq
uity
caus
ene
tne
teq
uity
divi
dend
yiel
dsre
turn
sdi
vide
ndyi
elds
retu
rns
flow
seq
uity
flow
sflo
ws
Kor
eaF
ull
0.74
10.
953
0.04
90.
934
0.01
00.
000
0.98
1P
re0.
144
0.99
80.
030
1.00
00.
614
0.51
80.
982
Pos
t0.
999
0.07
00.
558
0.28
70.
010
0.00
00.
890
Mal
aysi
aF
ull
0.94
80.
876
0.34
00.
413
0.02
30.
092
0.12
5P
re0.
759
0.44
20.
462
0.28
00.
194
0.11
40.
423
Pos
t0.
901
0.78
80.
592
0.46
80.
095
0.21
30.
033
Mex
ico
Ful
l0.
998
0.05
10.
617
0.68
20.
884
0.96
00.
734
Pre
0.87
10.
111
0.18
90.
326
0.30
20.
996
0.45
5P
ost
0.57
50.
214
0.72
60.
623
0.64
70.
994
0.51
0
Pak
ista
nF
ull
0.34
60.
426
0.14
20.
000
0.00
00.
466
0.04
8P
re0.
545
0.09
00.
458
0.94
30.
702
0.49
50.
862
Pos
t0.
532
0.27
70.
205
0.00
00.
015
0.84
40.
179
Phi
lippi
nes
Ful
l0.
015
0.44
40.
597
0.41
50.
831
0.56
30.
499
Pre
0.38
30.
249
0.68
50.
008
0.32
00.
353
0.00
1P
ost
0.05
20.
240
0.45
60.
833
0.97
60.
423
0.18
0
Por
tuga
lF
ull
0.69
20.
438
0.57
00.
958
1.00
00.
988
0.96
4P
re0.
527
0.88
90.
903
0.96
30.
795
0.73
80.
977
Pos
t0.
750
0.13
30.
281
0.82
00.
983
0.98
50.
907
Tai
wan
Ful
l0.
598
0.69
70.
819
0.95
60.
651
0.75
90.
408
Pre
0.65
00.
303
0.42
10.
491
0.84
70.
703
0.59
9P
ost
0.69
20.
740
0.80
30.
723
0.30
10.
782
0.47
2
COLUMBIA BUSINESS SCHOOL 34
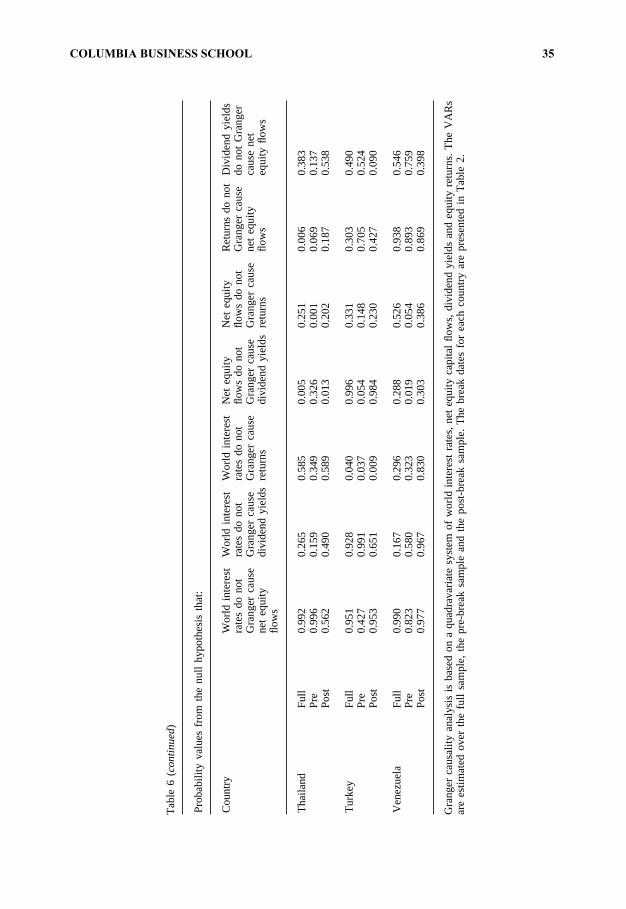
329G. Bekaert et al. / Journal of International Money and Finance 21 (2002) 295–350
Tab
le6
(cont
inue
d)
Pro
babi
lity
valu
esfr
omth
enu
llhy
poth
esis
that
:
Cou
ntry
Wor
ldin
tere
stW
orld
inte
rest
Wor
ldin
tere
stN
eteq
uity
Net
equi
tyR
etur
nsdo
not
Div
iden
dyi
elds
rate
sdo
not
rate
sdo
not
rate
sdo
not
flow
sdo
not
flow
sdo
not
Gra
nger
caus
edo
not
Gra
nger
Gra
nger
caus
eG
rang
erca
use
Gra
nger
caus
eG
rang
erca
use
Gra
nger
caus
ene
teq
uity
caus
ene
tne
teq
uity
divi
dend
yiel
dsre
turn
sdi
vide
ndyi
elds
retu
rns
flow
seq
uity
flow
sflo
ws
Tha
iland
Ful
l0.
992
0.26
50.
585
0.00
50.
251
0.00
60.
383
Pre
0.99
60.
159
0.34
90.
326
0.00
10.
069
0.13
7P
ost
0.56
20.
490
0.58
90.
013
0.20
20.
187
0.53
8
Tur
key
Ful
l0.
951
0.92
80.
040
0.99
60.
331
0.30
30.
490
Pre
0.42
70.
991
0.03
70.
054
0.14
80.
705
0.52
4P
ost
0.95
30.
651
0.00
90.
984
0.23
00.
427
0.09
0
Ven
ezue
laF
ull
0.99
00.
167
0.29
60.
288
0.52
60.
938
0.54
6P
re0.
823
0.58
00.
323
0.01
90.
054
0.89
30.
759
Pos
t0.
977
0.96
70.
830
0.30
30.
386
0.86
90.
398
Gra
nger
caus
ality
anal
ysis
isba
sed
ona
quad
rava
riate
syst
emof
wor
ldin
tere
stra
tes,
net
equi
tyca
pita
lflow
s,di
vide
ndyi
elds
and
equi
tyre
turn
s.T
heV
AR
sar
ees
timat
edov
erth
efu
llsa
mpl
e,th
epr
e-br
eak
sam
ple
and
the
post
-bre
aksa
mpl
e.T
hebr
eak
date
sfo
rea
chco
untr
yar
epr
esen
ted
inT
able
2.
COLUMBIA BUSINESS SCHOOL 35
330 G. Bekaert et al. / Journal of International Money and Finance 21 (2002) 295–350
Do endogenous factors play a large role in determining capital flows? If that isthe case, returns and/or dividend yields ought to have predictive power for capitalflows. Interestingly, there is little predictive power of dividend yields (only Colom-bia, Malaysia, Pakistan, and the Philippines), and returns predict capital flows onlyin Brazil (pre-break), Korea and Thailand.
The lack of significant predictive relations between our variables, revealed bycountry-specific Granger-causality tests, stresses again the need to focus on cross-sectionally averaged results. To analyze some of the predictive relations further, wereport three partial regression coefficients in Table 7. The first is the coefficient inthe flow equation on past flows. Froot et al. (2001) note that the predictive powerof flows for future returns may in fact be due to both a strong contemporaneousrelation between flows and returns (see next section) and the persistence in flows.Our estimates suggest a monthly persistence coefficient of around 0.135, which ismuch higher than the monthly persistence implied by Froot et al.’s daily model.
The second coefficient is the coefficient on returns in the flows equation. Positivecoefficients suggest feedback trading or may be the result of returns anticipatingpositive news about future market reforms that will bring in foreign capital. Whereasthe country by country results showed little significance (and are not reported), thecoefficients are predominantly positive as they are in Froot et al. (2001). One countryfor which a gradual liberalization story would have much appeal, Korea, records anegative coefficient.
Finally, we report the flow coefficient in the return equation. As in Froot et al.(2001), we find predominantly positive and large coefficients. A 1% increase inforeign holdings leads on average to a 4.74% increase in returns next month (seeTable 7). Froot et al. argue that this is not inconsistent with the price pressure hypoth-esis (which would require a positive contemporaneous effect and negative long-runeffect) given that flows are persistent. The response could also reflect a return tointegration, as we discussed before, although one would expect much of the increasein foreign holdings to be anticipated and, hence, not induce large ex post pricechanges. In the impulse response analysis in the next section, we look at the dynamiceffects of unexpected shocks, including the contemporaneous relations between vari-ables.
6. Tests of the main hypotheses
The impulse response analysis of the quadravariate VAR is presented in Figs. 4–6. For each country, we estimate the VAR on three samples: full sample, pre-breakand post-break. We then aggregate the impulse responses across various countrygroups using equal weights. To help interpret the evidence, in light of the hypothesesformulated in Section 2, we provide two additional tables. Table 8 presents an analy-sis of impulse responses on changes in equity holdings and long-run returns, whereasTable 9 reports some important contemporaneous betas. When rescaled, these betasconstitute the impulse responses at time 0 and they also appear in Figs. 4–6. Bothtables focus exclusively on the post-break period.
COLUMBIA BUSINESS SCHOOL 36
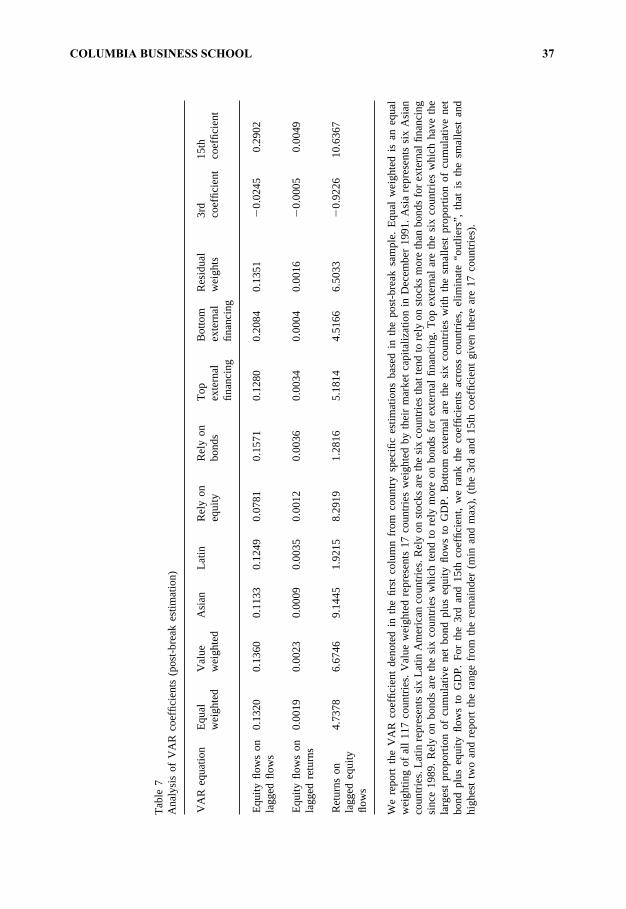
331G. Bekaert et al. / Journal of International Money and Finance 21 (2002) 295–350
Tab
le7
Ana
lysi
sof
VA
Rco
effic
ient
s(p
ost-
brea
kes
timat
ion)
VA
Req
uatio
nE
qual
Val
ueA
sian
Latin
Rel
yon
Rel
yon
Top
Bot
tom
Res
idua
l3r
d15
thw
eigh
ted
wei
ghte
deq
uity
bond
sex
tern
alex
tern
alw
eigh
tsco
effic
ient
coef
ficie
ntfin
anci
ngfin
anci
ng
Equ
ityflo
ws
on0.
1320
0.13
600.
1133
0.12
490.
0781
0.15
710.
1280
0.20
840.
1351
�0.
0245
0.29
02la
gged
flow
s
Equ
ityflo
ws
on0.
0019
0.00
230.
0009
0.00
350.
0012
0.00
360.
0034
0.00
040.
0016
�0.
0005
0.00
49la
gged
retu
rns
Ret
urns
on4.
7378
6.67
469.
1445
1.92
158.
2919
1.28
165.
1814
4.51
666.
5033
�0.
9226
10.6
367
lagg
edeq
uity
flow
s
We
repo
rtth
eV
AR
coef
ficie
ntde
note
din
the
first
colu
mn
from
coun
try
spec
ific
estim
atio
nsba
sed
inth
epo
st-b
reak
sam
ple.
Equ
alw
eigh
ted
isan
equa
lw
eigh
ting
ofal
l117
coun
trie
s.V
alue
wei
ghte
dre
pres
ents
17co
untr
ies
wei
ghte
dby
thei
rm
arke
tca
pita
lizat
ion
inD
ecem
ber
1991
.A
sia
repr
esen
tssi
xA
sian
coun
trie
s.La
tinre
pres
ents
six
Latin
Am
eric
anco
untr
ies.
Rel
yon
stoc
ksar
eth
esi
xco
untr
ies
that
tend
tore
lyon
stoc
ksm
ore
than
bond
sfo
rex
tern
alfin
anci
ngsi
nce
1989
.R
ely
onbo
nds
are
the
six
coun
trie
sw
hich
tend
tore
lym
ore
onbo
nds
for
exte
rnal
finan
cing
.T
opex
tern
alar
eth
esi
xco
untr
ies
whi
chha
veth
ela
rges
tpr
opor
tion
ofcu
mul
ativ
ene
tbo
ndpl
useq
uity
flow
sto
GD
P.
Bot
tom
exte
rnal
are
the
six
coun
trie
sw
ithth
esm
alle
stpr
opor
tion
ofcu
mul
ativ
ene
tbo
ndpl
useq
uity
flow
sto
GD
P.
For
the
3rd
and
15th
coef
ficie
nt,
we
rank
the
coef
ficie
nts
acro
ssco
untr
ies,
elim
inat
e“o
utlie
rs”,
that
isth
esm
alle
stan
dhi
ghes
ttw
oan
dre
port
the
rang
efr
omth
ere
mai
nder
(min
and
max
),(t
he3r
dan
d15
thco
effic
ient
give
nth
ere
are
17co
untr
ies)
.
COLUMBIA BUSINESS SCHOOL 37
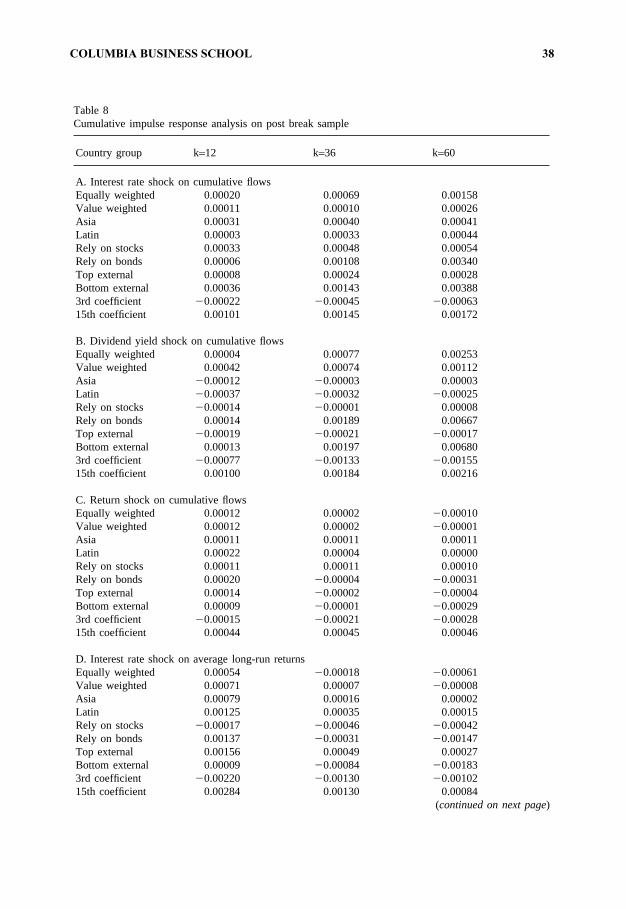
332 G. Bekaert et al. / Journal of International Money and Finance 21 (2002) 295–350
Table 8Cumulative impulse response analysis on post break sample
Country group k=12 k=36 k=60
A. Interest rate shock on cumulative flowsEqually weighted 0.00020 0.00069 0.00158Value weighted 0.00011 0.00010 0.00026Asia 0.00031 0.00040 0.00041Latin 0.00003 0.00033 0.00044Rely on stocks 0.00033 0.00048 0.00054Rely on bonds 0.00006 0.00108 0.00340Top external 0.00008 0.00024 0.00028Bottom external 0.00036 0.00143 0.003883rd coefficient �0.00022 �0.00045 �0.0006315th coefficient 0.00101 0.00145 0.00172
B. Dividend yield shock on cumulative flowsEqually weighted 0.00004 0.00077 0.00253Value weighted 0.00042 0.00074 0.00112Asia �0.00012 �0.00003 0.00003Latin �0.00037 �0.00032 �0.00025Rely on stocks �0.00014 �0.00001 0.00008Rely on bonds 0.00014 0.00189 0.00667Top external �0.00019 �0.00021 �0.00017Bottom external 0.00013 0.00197 0.006803rd coefficient �0.00077 �0.00133 �0.0015515th coefficient 0.00100 0.00184 0.00216
C. Return shock on cumulative flowsEqually weighted 0.00012 0.00002 �0.00010Value weighted 0.00012 0.00002 �0.00001Asia 0.00011 0.00011 0.00011Latin 0.00022 0.00004 0.00000Rely on stocks 0.00011 0.00011 0.00010Rely on bonds 0.00020 �0.00004 �0.00031Top external 0.00014 �0.00002 �0.00004Bottom external 0.00009 �0.00001 �0.000293rd coefficient �0.00015 �0.00021 �0.0002815th coefficient 0.00044 0.00045 0.00046
D. Interest rate shock on average long-run returnsEqually weighted 0.00054 �0.00018 �0.00061Value weighted 0.00071 0.00007 �0.00008Asia 0.00079 0.00016 0.00002Latin 0.00125 0.00035 0.00015Rely on stocks �0.00017 �0.00046 �0.00042Rely on bonds 0.00137 �0.00031 �0.00147Top external 0.00156 0.00049 0.00027Bottom external 0.00009 �0.00084 �0.001833rd coefficient �0.00220 �0.00130 �0.0010215th coefficient 0.00284 0.00130 0.00084
(continued on next page)
COLUMBIA BUSINESS SCHOOL 38
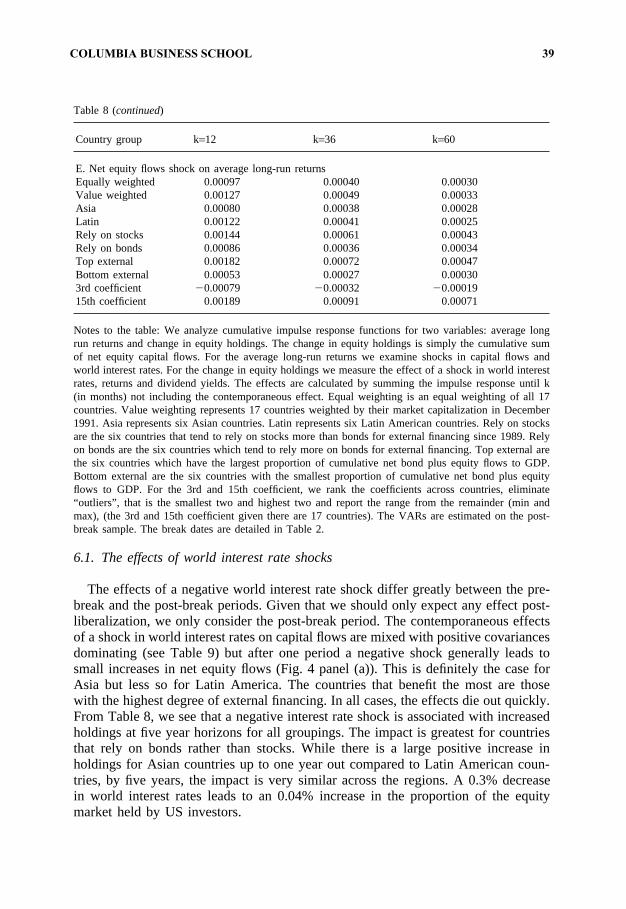
333G. Bekaert et al. / Journal of International Money and Finance 21 (2002) 295–350
Table 8 (continued)
Country group k=12 k=36 k=60
E. Net equity flows shock on average long-run returnsEqually weighted 0.00097 0.00040 0.00030Value weighted 0.00127 0.00049 0.00033Asia 0.00080 0.00038 0.00028Latin 0.00122 0.00041 0.00025Rely on stocks 0.00144 0.00061 0.00043Rely on bonds 0.00086 0.00036 0.00034Top external 0.00182 0.00072 0.00047Bottom external 0.00053 0.00027 0.000303rd coefficient �0.00079 �0.00032 �0.0001915th coefficient 0.00189 0.00091 0.00071
Notes to the table: We analyze cumulative impulse response functions for two variables: average longrun returns and change in equity holdings. The change in equity holdings is simply the cumulative sumof net equity capital flows. For the average long-run returns we examine shocks in capital flows andworld interest rates. For the change in equity holdings we measure the effect of a shock in world interestrates, returns and dividend yields. The effects are calculated by summing the impulse response until k(in months) not including the contemporaneous effect. Equal weighting is an equal weighting of all 17countries. Value weighting represents 17 countries weighted by their market capitalization in December1991. Asia represents six Asian countries. Latin represents six Latin American countries. Rely on stocksare the six countries that tend to rely on stocks more than bonds for external financing since 1989. Relyon bonds are the six countries which tend to rely more on bonds for external financing. Top external arethe six countries which have the largest proportion of cumulative net bond plus equity flows to GDP.Bottom external are the six countries with the smallest proportion of cumulative net bond plus equityflows to GDP. For the 3rd and 15th coefficient, we rank the coefficients across countries, eliminate“outliers”, that is the smallest two and highest two and report the range from the remainder (min andmax), (the 3rd and 15th coefficient given there are 17 countries). The VARs are estimated on the post-break sample. The break dates are detailed in Table 2.
6.1. The effects of world interest rate shocks
The effects of a negative world interest rate shock differ greatly between the pre-break and the post-break periods. Given that we should only expect any effect post-liberalization, we only consider the post-break period. The contemporaneous effectsof a shock in world interest rates on capital flows are mixed with positive covariancesdominating (see Table 9) but after one period a negative shock generally leads tosmall increases in net equity flows (Fig. 4 panel (a)). This is definitely the case forAsia but less so for Latin America. The countries that benefit the most are thosewith the highest degree of external financing. In all cases, the effects die out quickly.From Table 8, we see that a negative interest rate shock is associated with increasedholdings at five year horizons for all groupings. The impact is greatest for countriesthat rely on bonds rather than stocks. While there is a large positive increase inholdings for Asian countries up to one year out compared to Latin American coun-tries, by five years, the impact is very similar across the regions. A 0.3% decreasein world interest rates leads to an 0.04% increase in the proportion of the equitymarket held by US investors.
COLUMBIA BUSINESS SCHOOL 39
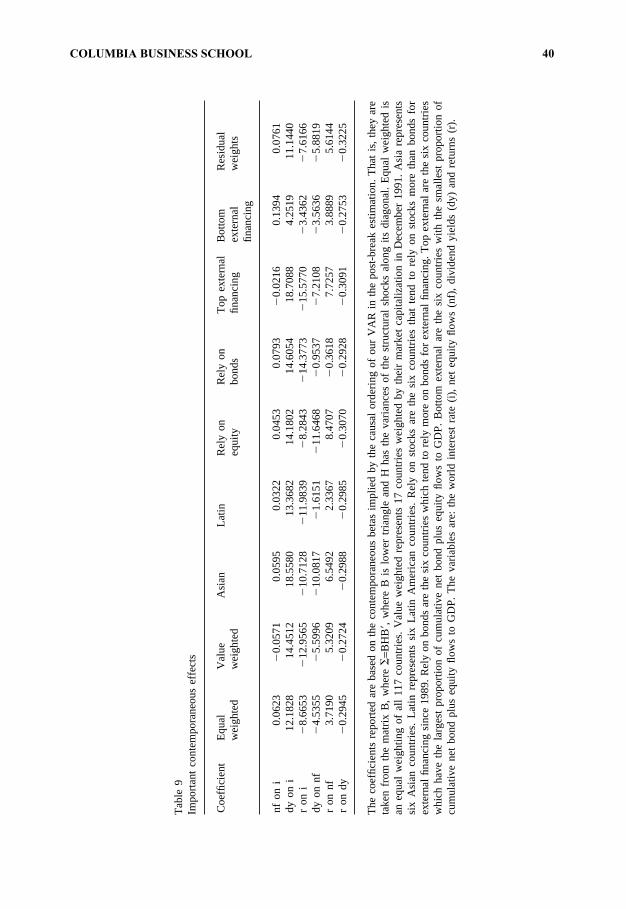
334 G. Bekaert et al. / Journal of International Money and Finance 21 (2002) 295–350
Tab
le9
Impo
rtan
tco
ntem
pora
neou
sef
fect
s
Coe
ffici
ent
Equ
alV
alue
Asi
anLa
tinR
ely
onR
ely
onT
opex
tern
alB
otto
mR
esid
ual
wei
ghte
dw
eigh
ted
equi
tybo
nds
finan
cing
exte
rnal
wei
ghts
finan
cing
nfon
i0.
0623
�0.
0571
0.05
950.
0322
0.04
530.
0793
�0.
0216
0.13
940.
0761
dyon
i12
.182
814
.451
218
.558
013
.368
214
.180
214
.605
418
.708
84.
2519
11.1
440
ron
i�
8.66
53�
12.9
565
�10
.712
8�
11.9
839
�8.
2843
�14
.377
3�
15.5
770
�3.
4362
�7.
6166
dyon
nf�
4.53
55�
5.59
96�
10.0
817
�1.
6151
�11
.646
8�
0.95
37�
7.21
08�
3.56
36�
5.88
19r
onnf
3.71
905.
3209
6.54
922.
3367
8.47
07�
0.36
187.
7257
3.88
895.
6144
ron
dy�
0.29
45�
0.27
24�
0.29
88�
0.29
85�
0.30
70�
0.29
28�
0.30
91�
0.27
53�
0.32
25
The
coef
ficie
nts
repo
rted
are
base
don
the
cont
empo
rane
ous
beta
sim
plie
dby
the
caus
alor
derin
gof
our
VA
Rin
the
post
-bre
akes
timat
ion.
Tha
tis
,th
eya
reta
ken
from
the
mat
rixB
,w
here�
=BH
B�,
whe
reB
islo
wer
tria
ngle
and
Hha
sth
eva
rianc
esof
the
stru
ctur
alsh
ocks
alon
gits
diag
onal
.E
qual
wei
ghte
dis
aneq
ual
wei
ghtin
gof
all1
17co
untr
ies.
Val
uew
eigh
ted
repr
esen
ts17
coun
trie
sw
eigh
ted
byth
eir
mar
ket
capi
taliz
atio
nin
Dec
embe
r19
91.
Asi
are
pre
sent
ssi
xA
sian
coun
trie
s.La
tinre
pres
ents
six
Latin
Am
eric
anco
untr
ies.
Rel
yon
stoc
ksar
eth
esi
xco
untr
ies
that
tend
tore
lyon
stoc
ksm
ore
than
bond
sfo
rex
tern
alfin
anci
ngsi
nce
1989
.R
ely
onbo
nds
are
the
six
coun
trie
sw
hich
tend
tore
lym
ore
onbo
nds
for
exte
rnal
finan
cing
.T
opex
tern
alar
eth
esi
xco
untr
ies
whi
chha
veth
ela
rges
tpr
opor
tion
ofcu
mul
ativ
ene
tbo
ndpl
useq
uity
flow
sto
GD
P.
Bot
tom
exte
rnal
are
the
six
coun
trie
sw
ithth
esm
alle
stpr
opor
tion
ofcu
mul
ativ
ene
tbo
ndpl
useq
uity
flow
sto
GD
P.
The
varia
bles
are:
the
wor
ldin
tere
stra
te(i)
,ne
teq
uity
flow
s(n
f),
divi
dend
yiel
ds(d
y)an
dre
turn
s(r
).
COLUMBIA BUSINESS SCHOOL 40
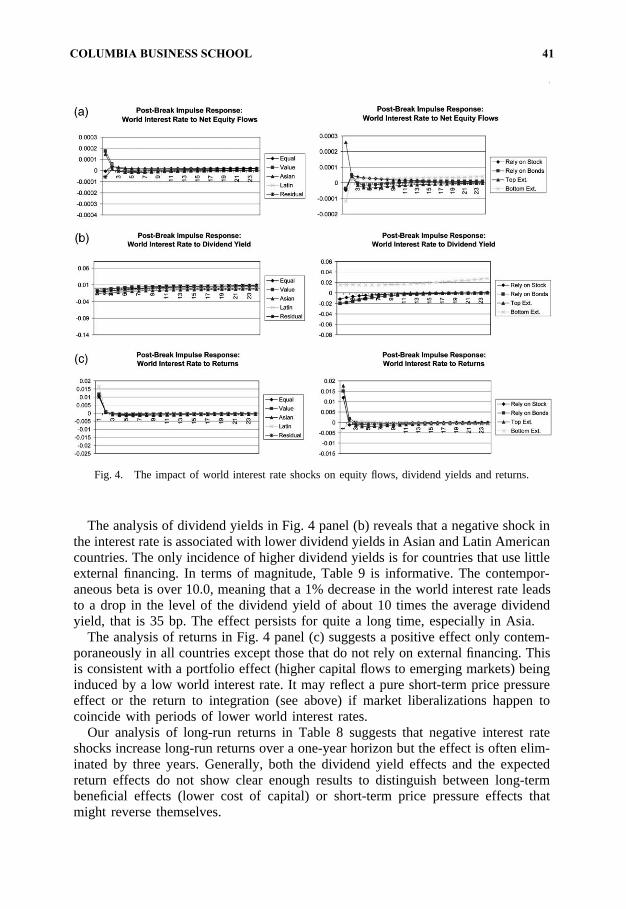
335G. Bekaert et al. / Journal of International Money and Finance 21 (2002) 295–350
Fig. 4. The impact of world interest rate shocks on equity flows, dividend yields and returns.
The analysis of dividend yields in Fig. 4 panel (b) reveals that a negative shock inthe interest rate is associated with lower dividend yields in Asian and Latin Americancountries. The only incidence of higher dividend yields is for countries that use littleexternal financing. In terms of magnitude, Table 9 is informative. The contempor-aneous beta is over 10.0, meaning that a 1% decrease in the world interest rate leadsto a drop in the level of the dividend yield of about 10 times the average dividendyield, that is 35 bp. The effect persists for quite a long time, especially in Asia.
The analysis of returns in Fig. 4 panel (c) suggests a positive effect only contem-poraneously in all countries except those that do not rely on external financing. Thisis consistent with a portfolio effect (higher capital flows to emerging markets) beinginduced by a low world interest rate. It may reflect a pure short-term price pressureeffect or the return to integration (see above) if market liberalizations happen tocoincide with periods of lower world interest rates.
Our analysis of long-run returns in Table 8 suggests that negative interest rateshocks increase long-run returns over a one-year horizon but the effect is often elim-inated by three years. Generally, both the dividend yield effects and the expectedreturn effects do not show clear enough results to distinguish between long-termbeneficial effects (lower cost of capital) or short-term price pressure effects thatmight reverse themselves.
COLUMBIA BUSINESS SCHOOL 41
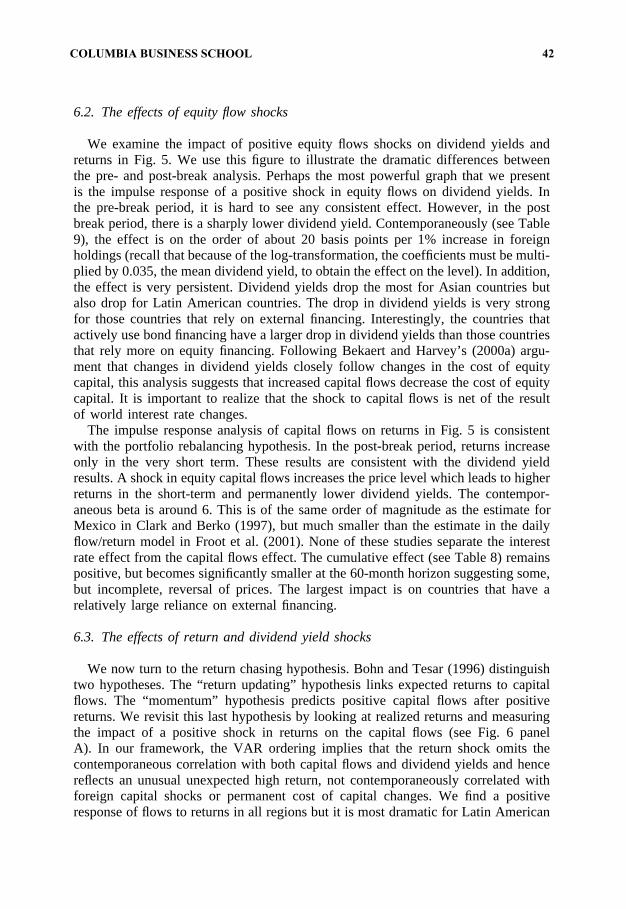
336 G. Bekaert et al. / Journal of International Money and Finance 21 (2002) 295–350
6.2. The effects of equity flow shocks
We examine the impact of positive equity flows shocks on dividend yields andreturns in Fig. 5. We use this figure to illustrate the dramatic differences betweenthe pre- and post-break analysis. Perhaps the most powerful graph that we presentis the impulse response of a positive shock in equity flows on dividend yields. Inthe pre-break period, it is hard to see any consistent effect. However, in the postbreak period, there is a sharply lower dividend yield. Contemporaneously (see Table9), the effect is on the order of about 20 basis points per 1% increase in foreignholdings (recall that because of the log-transformation, the coefficients must be multi-plied by 0.035, the mean dividend yield, to obtain the effect on the level). In addition,the effect is very persistent. Dividend yields drop the most for Asian countries butalso drop for Latin American countries. The drop in dividend yields is very strongfor those countries that rely on external financing. Interestingly, the countries thatactively use bond financing have a larger drop in dividend yields than those countriesthat rely more on equity financing. Following Bekaert and Harvey’s (2000a) argu-ment that changes in dividend yields closely follow changes in the cost of equitycapital, this analysis suggests that increased capital flows decrease the cost of equitycapital. It is important to realize that the shock to capital flows is net of the resultof world interest rate changes.
The impulse response analysis of capital flows on returns in Fig. 5 is consistentwith the portfolio rebalancing hypothesis. In the post-break period, returns increaseonly in the very short term. These results are consistent with the dividend yieldresults. A shock in equity capital flows increases the price level which leads to higherreturns in the short-term and permanently lower dividend yields. The contempor-aneous beta is around 6. This is of the same order of magnitude as the estimate forMexico in Clark and Berko (1997), but much smaller than the estimate in the dailyflow/return model in Froot et al. (2001). None of these studies separate the interestrate effect from the capital flows effect. The cumulative effect (see Table 8) remainspositive, but becomes significantly smaller at the 60-month horizon suggesting some,but incomplete, reversal of prices. The largest impact is on countries that have arelatively large reliance on external financing.
6.3. The effects of return and dividend yield shocks
We now turn to the return chasing hypothesis. Bohn and Tesar (1996) distinguishtwo hypotheses. The “return updating” hypothesis links expected returns to capitalflows. The “momentum” hypothesis predicts positive capital flows after positivereturns. We revisit this last hypothesis by looking at realized returns and measuringthe impact of a positive shock in returns on the capital flows (see Fig. 6 panelA). In our framework, the VAR ordering implies that the return shock omits thecontemporaneous correlation with both capital flows and dividend yields and hencereflects an unusual unexpected high return, not contemporaneously correlated withforeign capital shocks or permanent cost of capital changes. We find a positiveresponse of flows to returns in all regions but it is most dramatic for Latin American
COLUMBIA BUSINESS SCHOOL 42
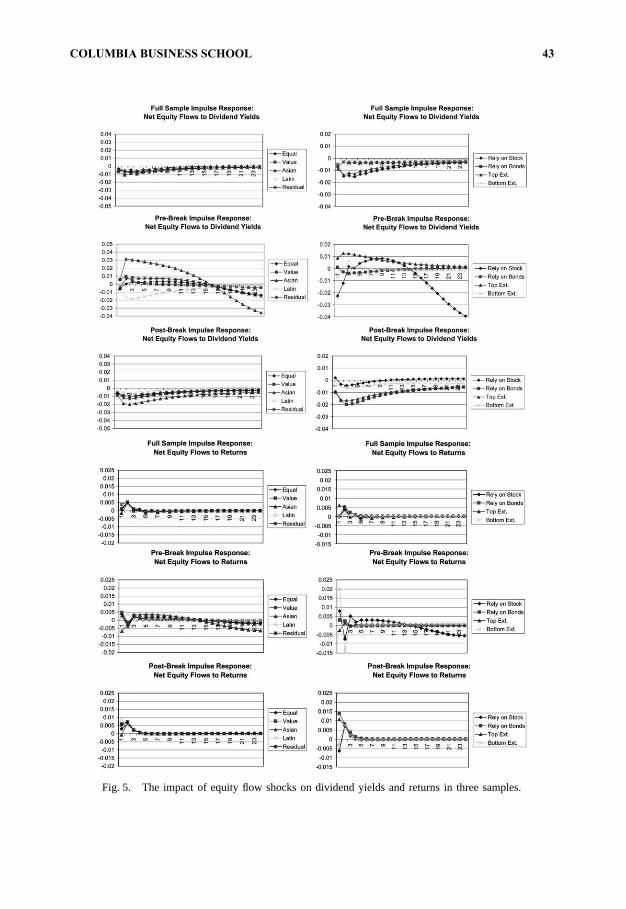
337G. Bekaert et al. / Journal of International Money and Finance 21 (2002) 295–350
Fig. 5. The impact of equity flow shocks on dividend yields and returns in three samples.
COLUMBIA BUSINESS SCHOOL 43
338 G. Bekaert et al. / Journal of International Money and Finance 21 (2002) 295–350
Fig. 6. The impact of returns and dividend yield shocks on equity flows.
countries. We find little or no impact on capital flows for those countries that havesmall external financing. The impulse response analysis supports the hypothesis thatcapital flows are, in part, momentum driven. That this is an entirely short-run effectis confirmed by the cumulative responses reported in Table 8, Panel C. The positivereturn shocks lead to higher holdings in the short-term but not in the long term.
Fig. 6 Panel (b) reports the effects of dividend yields on capital flows, where thedividend yield shock is net of a contemporaneous capital flow effect. A positiveshock in the dividend yield is associated with higher flows after a few periods for thevolatility-weighted, equally-weighted and the value-weighted set of countries after aninitial negative response. For the Latin American and the Asian set, the impulseresponses basically become zero. The former results may be consistent with theshort-run momentum results and a longer term “expected return”-chasing effect. Inthe very short term, a higher dividend yield may simply reflect a negative unexpectedreturn, which leads to reduced short-term capital flows. However, higher dividendyields may be associated with higher expected returns in the future. Positive effectson capital flows are only visible after two periods and then only for a subset of ourgroupings. The countries not relying on external finance display a consistently posi-tive effect. Table 8, Panel B cumulates these effects to measure the total change inholdings. The cumulative effects, for example, show that the positive long-run effectson capital flows in South-East Asia suffice to overturn the initial negative effect. ForLatin American and stock reliant countries, the cumulative effect is slightly negative.
COLUMBIA BUSINESS SCHOOL 44
339G. Bekaert et al. / Journal of International Money and Finance 21 (2002) 295–350
7. Conclusions
The goal of this paper is to develop a better understanding of the relation betweencapital flows and asset prices. We apply the latest structural break econometrics toidentify liberalizations in 20 emerging markets and then examine a VAR in pre- andpost-break periods on four variables: the world interest rate, net equity capital flows,ex post returns and a proxy for expected returns, the dividend yield.
Our results can be grouped into two main categories. Our first set of findingsconcern the break dynamics. We find that after a liberalization equity capital flowsincrease by 1.4% of market capitalization on an annual basis. However, three yearspost-liberalization, the equity flows are reduced. This is consistent with a modelwhereby investors rebalance their portfolios towards emerging markets. Also, com-paring the pre with post-break dynamics, we document that in almost all the countrieswe examine, when capital leaves it leaves much faster than it came. These intriguingresults may shed light on the recent crises in Latin America and Asia and the roleof capital flight.
Our second set of results revisits a number of important hypotheses in a structuralVAR framework. The fundamental nonstationarity in the data — structural breaksinduced by liberalizations — ignored by previous research, is not without conse-quences. We illuminate significant differences between the pre-break analysis andthe post-break analysis.
Our analysis yields three main findings. First, the “push effect” from world interestrates to capital flows appears consistently when we cumulate impulse responseswhereas contemporaneously interest rates and capital flows show no consistent corre-lation pattern. A 0.3% decrease in interest rates eventually increases foreign holdingsby about 0.04% of market capitalization, a small effect. Interest rate decreases dogenerate strong but very short-lived increases in returns.
Second, unexpected shocks to equity flows have a strongly positive contempor-aneous effect on returns, in line with the findings of Clark and Berko (1997) andFroot et al. (2001). The effect immediately dies out but there is only incompletereversal suggesting some of the effect is permanent. This is consistent with ourfinding that positive shocks in net equity capital flows lead to lower dividendyields — our proxy for expected returns. Following Bekaert and Harvey’s (2000a)argument that dividend yield changes reveal information about the cost of equitycapital, the equity capital flow shocks lead to a lower cost of capital in many coun-tries. We find that this relation is dramatically strengthened if we estimate our VARson the post-break sample. Although part of the initial effect may be due to “pricepressure”, our results suggest part of the response is near permanent and beneficial.
Third, we revisit the Bohn and Tesar (1996) argument that capital flows can bedriven by expected ‘return chasing’ and by momentum investing. We find evidencethat positive returns shocks are followed by increased short-term equity capital flows,indicating a momentum effect. Using the dividend yield as a proxy for long-runexpected returns, we find only weak evidence for the expected return chasing hypoth-esis.
There are, of course, many caveats to our analysis. Ideally, we need an economic
COLUMBIA BUSINESS SCHOOL 45
340 G. Bekaert et al. / Journal of International Money and Finance 21 (2002) 295–350
theory that captures the evolution from segmented to integrated financial markets.In the absence of such a theory, we rely on vector autoregressions to characterizethe behavior of important financial aggregates. In addition, the break methodologyimplicitly assumes that every break is permanent and hence theoretically ignores thatthe next break may be rationally anticipated by market participants. If this is thecase, a regime switching model, such as the one presented in Bekaert and Harvey(1995) may be a superior modeling approach. Although we have not studied thisissue in detail, we believe that structural break tests can probably be used to detectpersistent changes in regime and so are less incompatible with a regime-switchingmodel than theory may lead one to believe.
Acknowledgements
We appreciate the comments of Josh Coval, Luc Laeven, Michael Pagano, MarkSeasholes, Linda Tesar, Frank Warnock, Jeff Wurgler, as well as the participants atthe 1998 Conference on Globalization, Capital Markets Crises and Economic Reformat Duke University, the 2000 Western Finance Association meetings in Sun Valley,the University of Virginia and Erasmus University. A preliminary version of thispaper circulated under the title, “Structural breaks in emerging market capital flows”.We owe significant thanks to our RA, Chris Lundblad for his help. Lumsdaineacknowledges the support of the National Fellows Program at the Hoover Institution,Stanford University. Bekaert gratefully acknowledges financial support from an NSFgrant. The opinions expressed are the authors’ and do not represent those of DeutscheBank or its affiliates.
Technical appendix
BLS (Testing for a single break with multiple time-series that break at the sametime)
The techniques in Bai et al. (1998) (BLS) enable us to investigate structural breaksin the relationship between capital flows, returns, and dividends and to constructconfidence intervals around an estimated break date. For this part of the analysis,we assume that the data are generated by a stationary vector autoregression and thereis at most one structural break. One of the key results in BLS is that the precisionwith which a potential break date is estimated (as given by the width of the associatedconfidence interval) is a function not of the number of observations but of the numberof series in a multivariate framework that experience the same break date. In addition,they show that including series that have no break in the VAR, such as the worldinterest rate in our application, while reducing the power of the tests to detect acommon break, will not increase the width of the confidence intervals. In an earlierpaper (Bekaert et al., 2002, hereafter BHL), we provide empirical examples of howthese techniques can be used to draw inference.
COLUMBIA BUSINESS SCHOOL 46
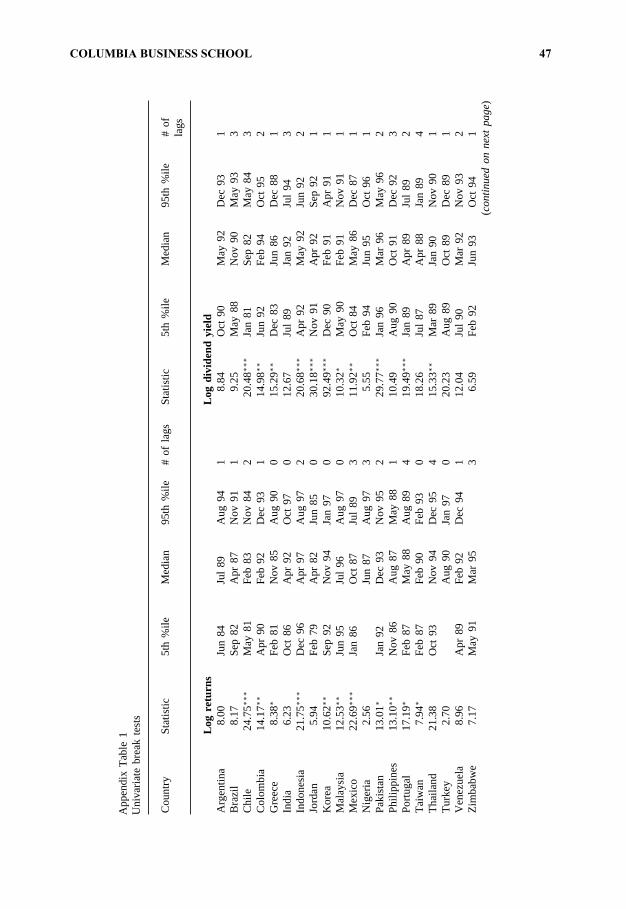
341G. Bekaert et al. / Journal of International Money and Finance 21 (2002) 295–350
App
endi
xT
able
1U
niva
riate
brea
kte
sts
Cou
ntry
Sta
tistic
5th
%ile
Med
ian
95th
%ile
#of
lags
Sta
tistic
5th
%ile
Med
ian
95th
%ile
#of
lags
Log
retu
rns
Log
divi
dend
yiel
dA
rgen
tina
8.00
Jun
84Ju
l89
Aug
941
8.84
Oct
90M
ay92
Dec
931
Bra
zil
8.17
Sep
82A
pr87
Nov
911
9.25
May
88N
ov90
May
933
Chi
le24
.75∗∗
∗M
ay81
Feb
83N
ov84
220
.48∗∗
∗Ja
n81
Sep
82M
ay84
3C
olom
bia
14.1
7∗∗A
pr90
Feb
92D
ec93
114
.98∗∗
Jun
92F
eb94
Oct
952
Gre
ece
8.38∗
Feb
81N
ov85
Aug
900
15.2
9∗∗D
ec83
Jun
86D
ec88
1In
dia
6.23
Oct
86A
pr92
Oct
970
12.6
7Ju
l89
Jan
92Ju
l94
3In
done
sia
21.7
5∗∗∗
Dec
96A
pr97
Aug
972
20.6
8∗∗∗
Apr
92M
ay92
Jun
922
Jord
an5.
94F
eb79
Apr
82Ju
n85
030
.18
∗∗∗
Nov
91A
pr92
Sep
921
Kor
ea10
.62∗∗
Sep
92N
ov94
Jan
970
92.4
9∗∗
∗D
ec90
Feb
91A
pr91
1M
alay
sia
12.5
3∗∗Ju
n95
Jul
96A
ug97
010
.32∗
May
90F
eb91
Nov
911
Mex
ico
22.6
9∗∗∗
Jan
86O
ct87
Jul
893
11.9
2∗∗
Oct
84M
ay86
Dec
871
Nig
eria
2.56
Jun
87A
ug97
35.
55F
eb94
Jun
95O
ct96
1P
akis
tan
13.0
1∗Ja
n92
Dec
93N
ov95
229
.77
∗∗∗
Jan
96M
ar96
May
962
Phi
lippi
nes
13.1
0∗∗N
ov86
Aug
87M
ay88
110
.49
Aug
90O
ct91
Dec
923
Por
tuga
l17
.19∗
Feb
87M
ay88
Aug
894
19.4
9∗∗∗
Jan
89A
pr89
Jul
892
Tai
wan
7.94
∗F
eb87
Feb
90F
eb93
018
.26
Jul
87A
pr88
Jan
894
Tha
iland
21.3
8O
ct93
Nov
94D
ec95
415
.33
∗∗M
ar89
Jan
90N
ov90
1T
urke
y2.
70A
ug90
Jan
970
20.2
3A
ug89
Oct
89D
ec89
1V
enez
uela
8.96
Apr
89F
eb92
Dec
941
12.0
4Ju
l90
Mar
92N
ov93
2Z
imba
bwe
7.17
May
91M
ar95
36.
59F
eb92
Jun
93O
ct94
1(c
onti
nued
onne
xtpa
ge)
COLUMBIA BUSINESS SCHOOL 47
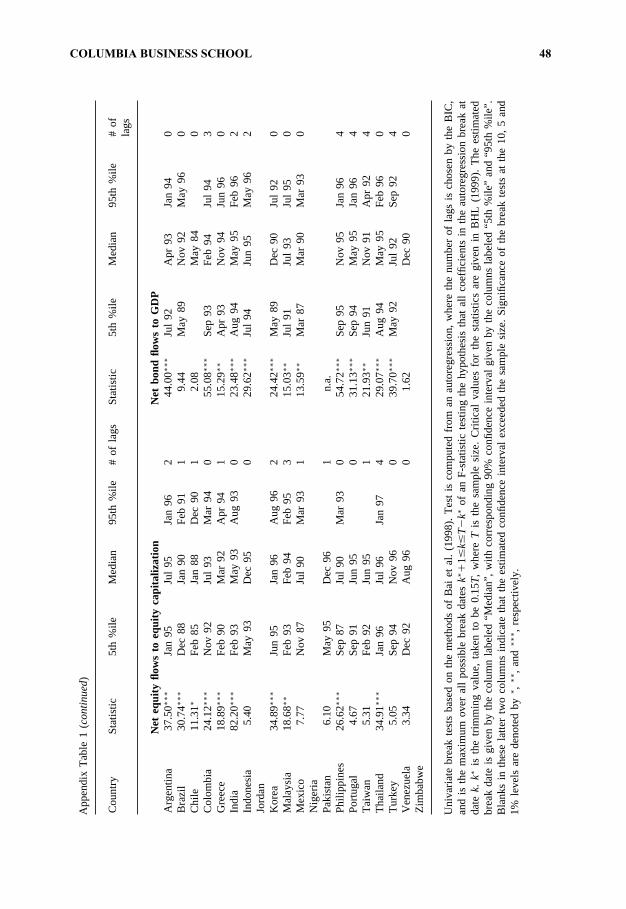
342 G. Bekaert et al. / Journal of International Money and Finance 21 (2002) 295–350A
ppen
dix
Tab
le1
(cont
inue
d)
Cou
ntry
Sta
tistic
5th
%ile
Med
ian
95th
%ile
#of
lags
Sta
tistic
5th
%ile
Med
ian
95th
%ile
#of
lags
Net
equi
tyflo
ws
toeq
uity
capi
taliz
atio
nN
etbo
ndflo
ws
toG
DP
Arg
entin
a37
.50∗∗
∗Ja
n95
Jul
95Ja
n96
244
.00
∗∗∗
Jul
92A
pr93
Jan
940
Bra
zil
30.7
4∗∗∗
Dec
88Ja
n90
Feb
911
9.44
May
89N
ov92
May
960
Chi
le11
.31∗
Feb
85Ja
n88
Dec
901
2.08
May
840
Col
ombi
a24
.12∗∗
∗N
ov92
Jul
93M
ar94
055
.08∗∗
∗S
ep93
Feb
94Ju
l94
3G
reec
e18
.89∗∗
∗F
eb90
Mar
92A
pr94
115
.29∗∗
Apr
93N
ov94
Jun
960
Indi
a82
.20∗∗
∗F
eb93
May
93A
ug93
023
.48∗∗
∗A
ug94
May
95F
eb96
2In
done
sia
5.40
May
93D
ec95
029
.62
∗∗∗
Jul
94Ju
n95
May
962
Jord
anK
orea
34.8
9∗∗∗
Jun
95Ja
n96
Aug
962
24.4
2∗∗
∗M
ay89
Dec
90Ju
l92
0M
alay
sia
18.6
8∗∗F
eb93
Feb
94F
eb95
315
.03
∗∗Ju
l91
Jul
93Ju
l95
0M
exic
o7.
77N
ov87
Jul
90M
ar93
113
.59
∗∗M
ar87
Mar
90M
ar93
0N
iger
iaP
akis
tan
6.10
May
95D
ec96
1n.
a.P
hilip
pine
s26
.62∗∗
∗S
ep87
Jul
90M
ar93
054
.72
∗∗∗
Sep
95N
ov95
Jan
964
Por
tuga
l4.
67S
ep91
Jun
950
31.1
3∗∗
∗S
ep94
May
95Ja
n96
4T
aiw
an5.
31F
eb92
Jun
951
21.9
3∗∗
Jun
91N
ov91
Apr
924
Tha
iland
34.9
1∗∗∗
Jan
96Ju
l96
Jan
974
29.0
7∗∗
∗A
ug94
May
95F
eb96
0T
urke
y5.
05S
ep94
Nov
960
39.7
0∗∗
∗M
ay92
Jul
92S
ep92
4V
enez
uela
3.34
Dec
92A
ug96
01.
62D
ec90
0Z
imba
bwe
Uni
varia
tebr
eak
test
sba
sed
onth
em
etho
dsof
Bai
etal
.(1
998)
.T
est
isco
mpu
ted
from
anau
tore
gres
sion
,w
here
the
num
ber
ofla
gsis
chos
enby
the
BIC
,an
dis
the
max
imum
over
all
poss
ible
brea
kda
tes
k∗ �1�
k�T
�k∗
ofan
F-s
tatis
ticte
stin
gth
ehy
poth
esis
that
all
coef
ficie
nts
inth
eau
tore
gres
sion
brea
kat
date
k.k∗
isth
etr
imm
ing
valu
e,ta
ken
tobe
0.15T,
whe
reT
isth
esa
mpl
esi
ze.
Crit
ical
valu
esfo
rth
est
atis
tics
are
give
nin
BH
L(1
999)
.T
hees
timat
edbr
eak
date
isgi
ven
byth
eco
lum
nla
bele
d“M
edia
n”,
with
corr
espo
ndin
g90
%co
nfide
nce
inte
rval
give
nby
the
colu
mns
labe
led
“5th
%ile
”an
d“9
5th
%ile
”.B
lank
sin
thes
ela
tter
two
colu
mns
indi
cate
that
the
estim
ated
confi
denc
ein
terv
alex
ceed
edth
esa
mpl
esi
ze.
Sig
nific
ance
ofth
ebr
eak
test
sat
the
10,
5an
d1%
leve
lsar
ede
note
dby∗ ,
∗∗,
and
∗∗∗ ,
resp
ectiv
ely.
COLUMBIA BUSINESS SCHOOL 48
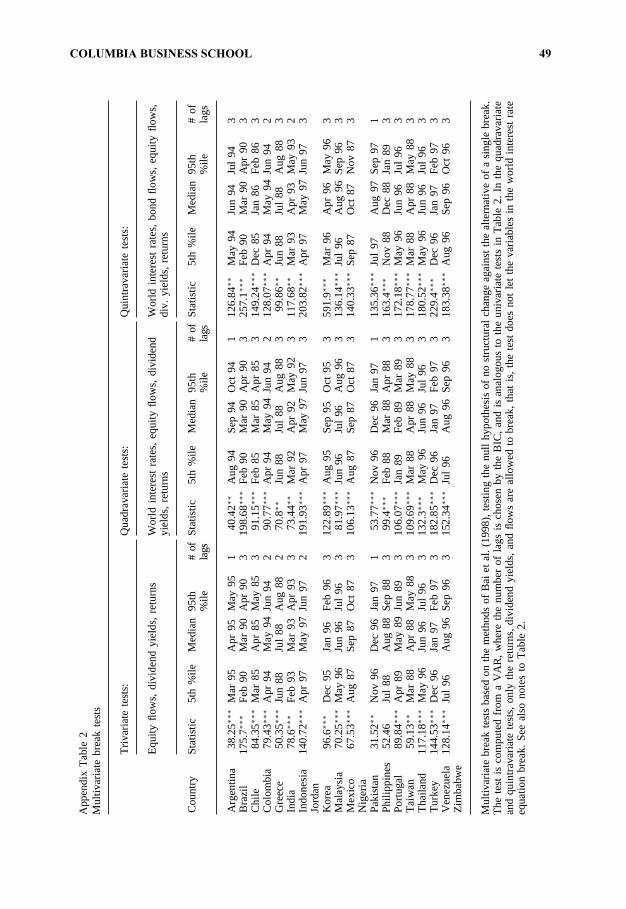
343G. Bekaert et al. / Journal of International Money and Finance 21 (2002) 295–350A
ppen
dix
Tab
le2
Mul
tivar
iate
brea
kte
sts
Triv
aria
tete
sts:
Qua
drav
aria
tete
sts:
Qui
ntra
varia
tete
sts:
Equ
ityflo
ws,
divi
dend
yiel
ds,
retu
rns
Wor
ldin
tere
stra
tes,
equi
tyflo
ws,
divi
dend
Wor
ldin
tere
stra
tes,
bond
flow
s,eq
uity
flow
s,yi
elds
,re
turn
sdi
v.yi
elds
,re
turn
s
Cou
ntry
Sta
tistic
5th
%ile
Med
ian
95th
#of
Sta
tistic
5th
%ile
Med
ian
95th
#of
Sta
tistic
5th
%ile
Med
ian
95th
#of
%ile
lags
%ile
lags
%ile
lags
Arg
entin
a38
.25∗∗
∗M
ar95
Apr
95M
ay95
140
.42∗∗
Aug
94S
ep94
Oct
941
126.
84∗∗M
ay94
Jun
94Ju
l94
3B
razi
l17
5.7∗∗
∗F
eb90
Mar
90A
pr90
319
8.68∗∗
∗F
eb90
Mar
90A
pr90
325
7.1∗∗
∗F
eb90
Mar
90A
pr90
3C
hile
84.3
5∗∗∗
Mar
85A
pr85
May
853
91.1
5∗∗∗
Feb
85M
ar85
Apr
853
149.
24∗∗∗
Dec
85Ja
n86
Feb
863
Col
ombi
a79
.43∗∗
∗A
pr94
May
94Ju
n94
290
.77∗∗
∗A
pr94
May
94Ju
n94
212
8.07∗∗
∗A
pr94
May
94Ju
n94
2G
reec
e50
.35∗∗
∗Ju
n88
Jul
88A
ug88
270
.8∗∗Ju
n88
Jul
88A
ug88
399
.86∗∗
Jun
88Ju
l88
Aug
883
Indi
a78
.6∗∗∗
Feb
93M
ar93
Apr
933
73.4
4∗∗M
ar92
Apr
92M
ay92
311
7.68∗∗
Mar
93A
pr93
May
932
Indo
nesi
a14
0.72∗∗
∗A
pr97
May
97Ju
n97
219
1.93∗∗
∗A
pr97
May
97Ju
n97
320
3.82∗∗
∗A
pr97
May
97Ju
n97
3Jo
rdan
Kor
ea96
.6∗∗∗
Dec
95Ja
n96
Feb
963
122.
89∗∗∗
Aug
95S
ep95
Oct
953
591.
9∗∗
∗M
ar96
Apr
96M
ay96
3M
alay
sia
70.2
5∗∗∗
May
96Ju
n96
Jul
963
81.9
7∗∗∗
Jun
96Ju
l96
Aug
963
136.
14∗∗∗
Jul
96A
ug96
Sep
963
Mex
ico
67.5
3∗∗∗
Aug
87S
ep87
Oct
873
106.
13∗∗∗
Aug
87S
ep87
Oct
873
140.
33∗∗∗
Sep
87O
ct87
Nov
873
Nig
eria
Pak
ista
n31
.52∗∗
Nov
96D
ec96
Jan
971
53.7
7∗∗
∗N
ov96
Dec
96Ja
n97
113
5.36∗∗
∗Ju
l97
Aug
97S
ep97
1P
hilip
pine
s52
.46
Jul
88A
ug88
Sep
883
99.4
∗∗∗
Feb
88M
ar88
Apr
883
163.
4∗∗∗
Nov
88D
ec88
Jan
893
Por
tuga
l89
.84∗∗
∗A
pr89
May
89Ju
n89
310
6.07∗∗
∗Ja
n89
Feb
89M
ar89
317
2.18∗∗
∗M
ay96
Jun
96Ju
l96
3T
aiw
an59
.13∗∗
Mar
88A
pr88
May
883
109.
69∗∗∗
Mar
88A
pr88
May
883
178.
77∗∗∗
Mar
88A
pr88
May
883
Tha
iland
117.
18∗∗∗
May
96Ju
n96
Jul
963
132.
3∗∗∗
May
96Ju
n96
Jul
963
180.
52∗∗∗
May
96Ju
n96
Jul
963
Tur
key
144.
53∗∗
∗D
ec96
Jan
97F
eb97
318
2.85∗∗
∗D
ec96
Jan
97F
eb97
322
9.4
∗∗∗
Dec
96Ja
n97
Feb
973
Ven
ezue
la12
8.14∗∗
∗Ju
l96
Aug
96S
ep96
315
2.34∗∗
∗Ju
l96
Aug
96S
ep96
318
3.38∗∗
∗A
ug96
Sep
96O
ct96
3Z
imba
bwe
Mul
tivar
iate
brea
kte
sts
base
don
the
met
hods
ofB
aiet
al.
(199
8),
test
ing
the
null
hypo
thes
isof
nost
ruct
ural
chan
geag
ains
tth
eal
tern
ativ
eof
asi
ngl
ebr
eak.
The
test
isco
mpu
ted
from
aV
AR
,w
here
the
num
ber
ofla
gsis
chos
enby
the
BIC
,an
dis
anal
ogou
sto
the
univ
aria
tete
sts
inT
able
2.In
the
quad
rava
riate
and
quin
trav
aria
tete
sts,
only
the
retu
rns,
divi
dend
yiel
ds,
and
flow
sar
eal
low
edto
brea
k,th
atis
,th
ete
stdo
esno
tle
tth
eva
riabl
esin
the
wor
ldin
ter
est
rate
equa
tion
brea
k.S
eeal
sono
tes
toT
able
2.
COLUMBIA BUSINESS SCHOOL 49
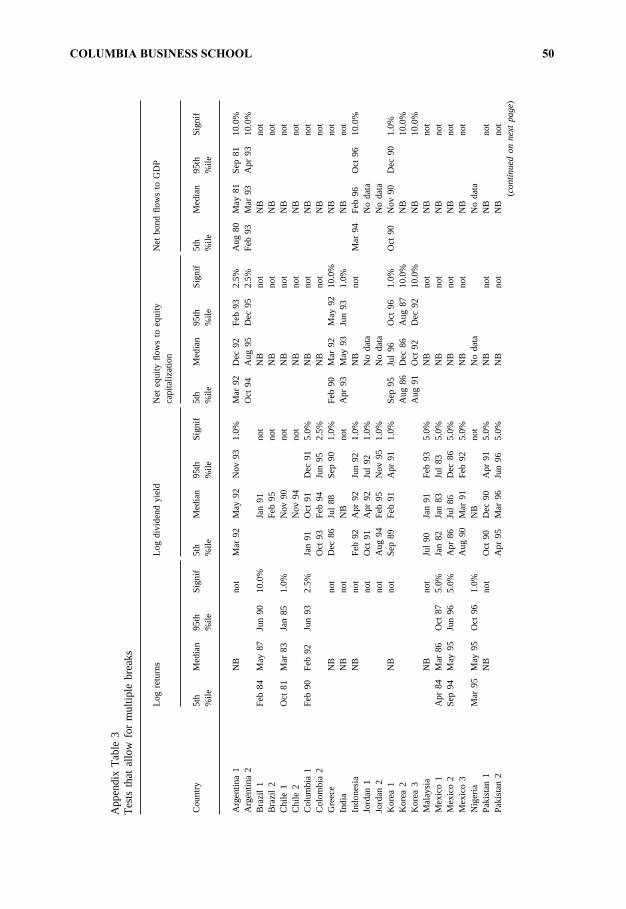
344 G. Bekaert et al. / Journal of International Money and Finance 21 (2002) 295–350
App
endi
xT
able
3T
ests
that
allo
wfo
rm
ultip
lebr
eaks
Log
retu
rns
Log
divi
dend
yiel
dN
eteq
uity
flow
sto
equi
tyN
etbo
ndflo
ws
toG
DP
capi
taliz
atio
n
Cou
ntry
5th
Med
ian
95th
Sig
nif
5th
Med
ian
95th
Sig
nif
5th
Med
ian
95th
Sig
nif
5th
Med
ian
95th
Sig
nif
%ile
%ile
%ile
%ile
%ile
%ile
%ile
%ile
Arg
entin
a1
NB
not
Mar
92M
ay92
Nov
931.
0%M
ar92
Dec
92F
eb93
2.5%
Aug
80M
ay81
Sep
8110
.0%
Arg
entin
a2
Oct
94A
ug95
Dec
952.
5%F
eb93
Mar
93A
pr93
10.0
%B
razi
l1
Feb
84M
ay87
Jun
9010
.0%
Jan
91no
tN
Bno
tN
Bno
tB
razi
l2
Feb
95no
tN
Bno
tN
Bno
tC
hile
1O
ct81
Mar
83Ja
n85
1.0%
Nov
90no
tN
Bno
tN
Bno
tC
hile
2N
ov94
not
NB
not
NB
not
Col
umbi
a1
Feb
90F
eb92
Jun
932.
5%Ja
n91
Oct
91D
ec91
5.0%
NB
not
NB
not
Col
ombi
a2
Oct
93F
eb94
Jun
952.
5%N
Bno
tN
Bno
tG
reec
eN
Bno
tD
ec86
Jul
88S
ep90
1.0%
Feb
90M
ar92
May
9210
.0%
NB
not
Indi
aN
Bno
tN
Bno
tA
pr93
May
93Ju
n93
1.0%
NB
not
Indo
nesi
aN
Bno
tF
eb92
Apr
92Ju
n92
1.0%
NB
not
Mar
94F
eb96
Oct
9610
.0%
Jord
an1
not
Oct
91A
pr92
Jul
921.
0%N
oda
taN
oda
taJo
rdan
2no
tA
ug94
Feb
95N
ov95
1.0%
No
data
No
data
Kor
ea1
NB
not
Sep
89F
eb91
Apr
911.
0%S
ep95
Jul
96O
ct96
1.0%
Oct
90N
ov90
Dec
901.
0%K
orea
2A
ug86
Dec
86A
ug87
10.0
%N
B10
.0%
Kor
ea3
Aug
91O
ct92
Dec
9210
.0%
NB
10.0
%M
alay
sia
NB
not
Jul
90Ja
n91
Feb
935.
0%N
Bno
tN
Bno
tM
exic
o1
Apr
84M
ar86
Oct
875.
0%Ja
n82
Jan
83Ju
l83
5.0%
NB
not
NB
not
Mex
ico
2S
ep94
May
95Ju
n96
5.0%
Apr
86Ju
l86
Dec
865.
0%N
Bno
tN
Bno
tM
exic
o3
Aug
90M
ar91
Feb
925.
0%N
Bno
tN
Bno
tN
iger
iaM
ar95
May
95O
ct96
1.0%
NB
not
No
data
No
data
Pak
ista
n1
NB
not
Oct
90D
ec90
Apr
915.
0%N
Bno
tN
Bno
tP
akis
tan
2A
pr95
Mar
96Ju
n96
5.0%
NB
not
NB
not
(con
tinu
edon
next
page
)
COLUMBIA BUSINESS SCHOOL 50
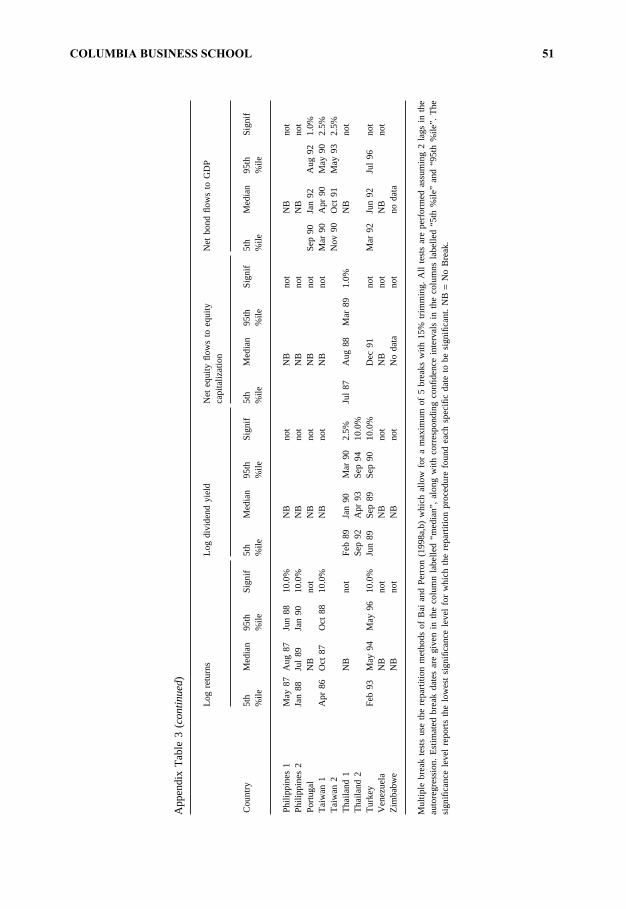
345G. Bekaert et al. / Journal of International Money and Finance 21 (2002) 295–350
App
endi
xT
able
3(co
ntin
ued)
Log
retu
rns
Log
divi
dend
yiel
dN
eteq
uity
flow
sto
equi
tyN
etbo
ndflo
ws
toG
DP
capi
taliz
atio
n
Cou
ntry
5th
Med
ian
95th
Sig
nif
5th
Med
ian
95th
Sig
nif
5th
Med
ian
95th
Sig
nif
5th
Med
ian
95th
Sig
nif
%ile
%ile
%ile
%ile
%ile
%ile
%ile
%ile
Phi
lippi
nes
1M
ay87
Aug
87Ju
n88
10.0
%N
Bno
tN
Bno
tN
Bno
tP
hilip
pine
s2
Jan
88Ju
l89
Jan
9010
.0%
NB
not
NB
not
NB
not
Por
tuga
lN
Bno
tN
Bno
tN
Bno
tS
ep90
Jan
92A
ug92
1.0%
Tai
wan
1A
pr86
Oct
87O
ct88
10.0
%N
Bno
tN
Bno
tM
ar90
Apr
90M
ay90
2.5%
Tai
wan
2N
ov90
Oct
91M
ay93
2.5%
Tha
iland
1N
Bno
tF
eb89
Jan
90M
ar90
2.5%
Jul
87A
ug88
Mar
891.
0%N
Bno
tT
haila
nd2
Sep
92A
pr93
Sep
9410
.0%
Tur
key
Feb
93M
ay94
May
9610
.0%
Jun
89S
ep89
Sep
9010
.0%
Dec
91no
tM
ar92
Jun
92Ju
l96
not
Ven
ezue
laN
Bno
tN
Bno
tN
Bno
tN
Bno
tZ
imba
bwe
NB
not
NB
not
No
data
not
noda
ta
Mul
tiple
brea
kte
sts
use
the
repa
rtiti
onm
etho
dsof
Bai
and
Per
ron
(199
8a,b
)w
hich
allo
wfo
ra
max
imum
of5
brea
ksw
ith15
%tr
imm
ing.
All
test
sar
epe
rfo
rmed
assu
min
g2
lags
inth
eau
tore
gres
sion
.E
stim
ated
brea
kda
tes
are
give
nin
the
colu
mn
labe
lled
“med
ian”
,al
ong
with
corr
espo
ndin
gco
nfide
nce
inte
rval
sin
the
colu
mns
labe
lle
d“5
th%
ile”
and
“95t
h%
ile”.
The
sign
ifica
nce
leve
lre
port
sth
elo
wes
tsi
gnifi
canc
ele
vel
for
whi
chth
ere
part
ition
proc
edur
efo
und
each
spec
ific
date
tobe
sign
ifica
nt.
NB
=N
oB
reak
.
COLUMBIA BUSINESS SCHOOL 51
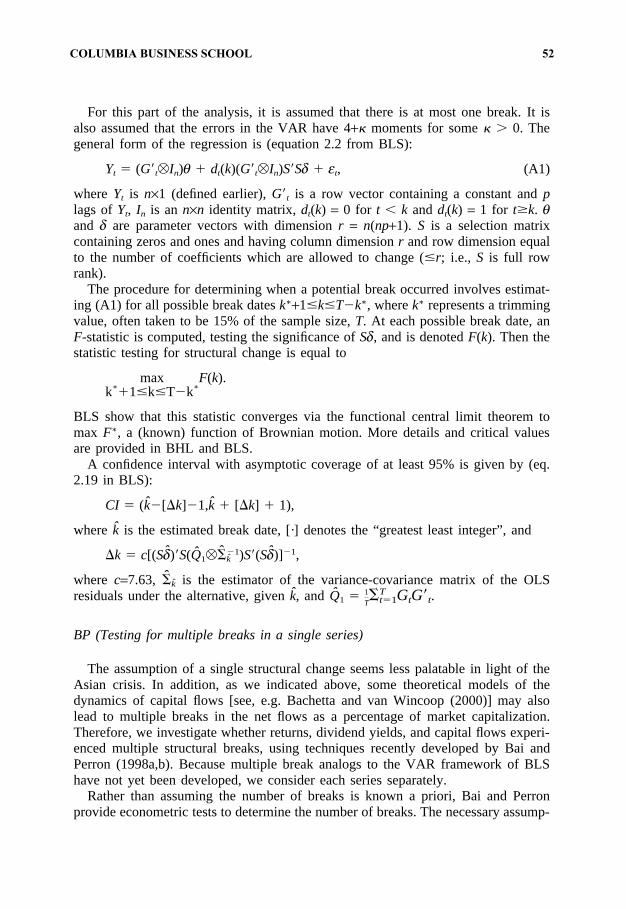
346 G. Bekaert et al. / Journal of International Money and Finance 21 (2002) 295–350
For this part of the analysis, it is assumed that there is at most one break. It isalso assumed that the errors in the VAR have 4+� moments for some� 0. Thegeneral form of the regression is (equation 2.2 from BLS):
Yt � (G�t�In)q � dt(k)(G�t�In)S�Sd � et, (A1)
where Yt is n×1 (defined earlier),G�t is a row vector containing a constant andplags ofYt, In is ann×n identity matrix,dt(k) = 0 for t k anddt(k) = 1 for t�k. qand d are parameter vectors with dimensionr = n(np+1). S is a selection matrixcontaining zeros and ones and having column dimensionr and row dimension equalto the number of coefficients which are allowed to change (�r; i.e., S is full rowrank).
The procedure for determining when a potential break occurred involves estimat-ing (A1) for all possible break datesk∗+1�k�T�k∗, wherek∗ represents a trimmingvalue, often taken to be 15% of the sample size,T. At each possible break date, anF-statistic is computed, testing the significance ofSd, and is denotedF(k). Then thestatistic testing for structural change is equal to
maxk∗
�1�k�T�k∗F(k).
BLS show that this statistic converges via the functional central limit theorem tomax F∗, a (known) function of Brownian motion. More details and critical valuesare provided in BHL and BLS.
A confidence interval with asymptotic coverage of at least 95% is given by (eq.2.19 in BLS):
CI � (k̂�[�k]�1,k̂ � [�k] � 1),
where k̂ is the estimated break date, [·] denotes the “greatest least integer”, and
�k � c[(Sd̂)�S(Q̂1��̂�1k̂ )S�(Sd̂)]�1,
where c=7.63, �̂k̂ is the estimator of the variance-covariance matrix of the OLSresiduals under the alternative, givenk̂, and Q̂1 � 1
T�T
t�1GtG�t.
BP (Testing for multiple breaks in a single series)
The assumption of a single structural change seems less palatable in light of theAsian crisis. In addition, as we indicated above, some theoretical models of thedynamics of capital flows [see, e.g. Bachetta and van Wincoop (2000)] may alsolead to multiple breaks in the net flows as a percentage of market capitalization.Therefore, we investigate whether returns, dividend yields, and capital flows experi-enced multiple structural breaks, using techniques recently developed by Bai andPerron (1998a,b). Because multiple break analogs to the VAR framework of BLShave not yet been developed, we consider each series separately.
Rather than assuming the number of breaks is known a priori, Bai and Perronprovide econometric tests to determine the number of breaks. The necessary assump-
COLUMBIA BUSINESS SCHOOL 52
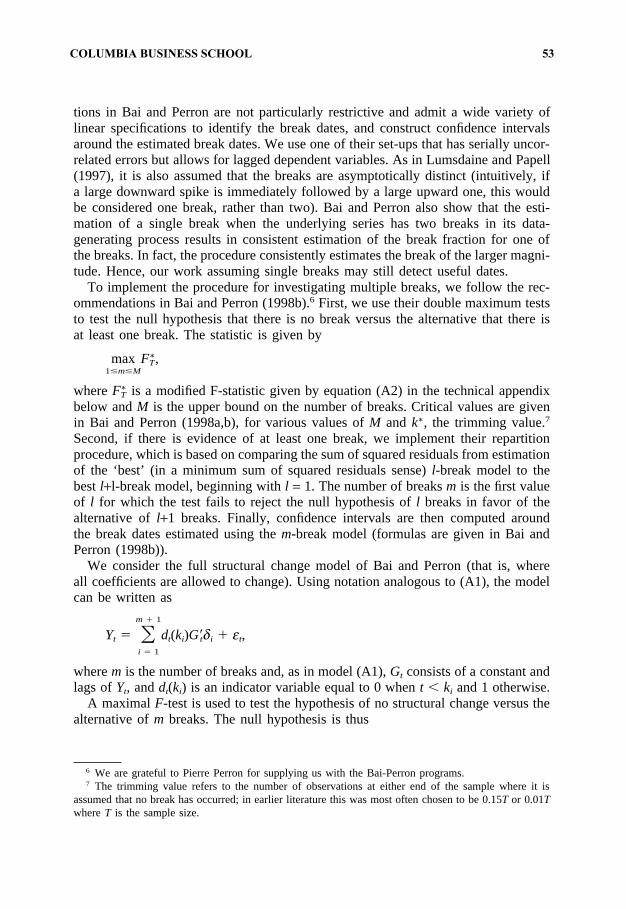
347G. Bekaert et al. / Journal of International Money and Finance 21 (2002) 295–350
tions in Bai and Perron are not particularly restrictive and admit a wide variety oflinear specifications to identify the break dates, and construct confidence intervalsaround the estimated break dates. We use one of their set-ups that has serially uncor-related errors but allows for lagged dependent variables. As in Lumsdaine and Papell(1997), it is also assumed that the breaks are asymptotically distinct (intuitively, ifa large downward spike is immediately followed by a large upward one, this wouldbe considered one break, rather than two). Bai and Perron also show that the esti-mation of a single break when the underlying series has two breaks in its data-generating process results in consistent estimation of the break fraction for one ofthe breaks. In fact, the procedure consistently estimates the break of the larger magni-tude. Hence, our work assuming single breaks may still detect useful dates.
To implement the procedure for investigating multiple breaks, we follow the rec-ommendations in Bai and Perron (1998b).6 First, we use their double maximum teststo test the null hypothesis that there is no break versus the alternative that there isat least one break. The statistic is given by
max1�m�M
F∗T,
whereF∗T is a modified F-statistic given by equation (A2) in the technical appendix
below andM is the upper bound on the number of breaks. Critical values are givenin Bai and Perron (1998a,b), for various values ofM and k∗, the trimming value.7
Second, if there is evidence of at least one break, we implement their repartitionprocedure, which is based on comparing the sum of squared residuals from estimationof the ‘best’ (in a minimum sum of squared residuals sense)l-break model to thebestl+l-break model, beginning withl = 1. The number of breaksm is the first valueof l for which the test fails to reject the null hypothesis ofl breaks in favor of thealternative ofl+1 breaks. Finally, confidence intervals are then computed aroundthe break dates estimated using them-break model (formulas are given in Bai andPerron (1998b)).
We consider the full structural change model of Bai and Perron (that is, whereall coefficients are allowed to change). Using notation analogous to (A1), the modelcan be written as
Yt � �m � 1
i � 1
dt(ki)G�tdi � et,
wherem is the number of breaks and, as in model (A1),Gt consists of a constant andlags ofYt, anddt(ki) is an indicator variable equal to 0 whent ki and 1 otherwise.
A maximal F-test is used to test the hypothesis of no structural change versus thealternative ofm breaks. The null hypothesis is thus
6 We are grateful to Pierre Perron for supplying us with the Bai-Perron programs.7 The trimming value refers to the number of observations at either end of the sample where it is
assumed that no break has occurred; in earlier literature this was most often chosen to be 0.15T or 0.01TwhereT is the sample size.
COLUMBIA BUSINESS SCHOOL 53
348 G. Bekaert et al. / Journal of International Money and Finance 21 (2002) 295–350
H0: d1 � % � dm+1
and can be expressed asRd = 0 where
R � �1 �1 0 % 0 0 0
0 1 �1 % 0 0 0
� � � � � � �
0 0 0 % 1 �1 0
0 0 0 % 0 1 �1�.
Then theF-statistic is (this corresponds to equation (12) in Bai and Perron (1998a))
sup(l
1,%,l
m)��
F∗T(l1,%,lm;r) �
1T�T�(m � 1)r
mr �d̂�R�(RV̂(d̂)R�)�1Rd̂, (A2)
whered̂ is an estimate ofd, andd � (d�1,%,d�m � 1)�, V̂ is the estimate of its covari-ance matrix,li is the fraction of the sample at which breaki occurs,� is the spaceof all possible m-partitions andr is the number of columns inG.
One drawback of this approach is that the choice of how many lags to includemust now be determined exogenously, rather than by using an information criterion.However, the BP procedures do allow for robust (heteroskedasticity and autocorre-lation consistent) covariance estimation and for different variances of the errors ineach of the break periods, something the BLS test theory permits but is not allowedin current implementation. There is a cost associated with this flexibility, however;in general the BP tests appear to have less power to detect breaks than the BLStests. Thus it is important to consider both sets of results together when identifyingpossible break dates.8
Data appendix
Dividend yields
There are a few instances of zeros in the 12-month moving sum of dividends thatthe IFC reports. We investigated these zeros by looking at each individual firm’sdividends. There seems to be an issue of when the IFC recorded dividends. Forexample, in Korea, there are dividends paid in January 1988 and no dividends appearin the individual company files until March 1989. After that, there is no dividend
8 When we restrict the BP test to at most use one break, the number of lags of the BLS tests, and donot allow for robust covariance estimation or different variances, we replicate the break dates, confidenceintervals, and significance levels of the BLS tests, except for Indonesia and Portugal, two countries withvery short samples, where the break dates differ slightly.
COLUMBIA BUSINESS SCHOOL 54
349G. Bekaert et al. / Journal of International Money and Finance 21 (2002) 295–350
paid by an individual company until April 1990. It is not surprising that we findzero entries in January and February 1989 and in March 1990. In order to avoidzero entries which appear to be a result of the timing of the recording of dividends,rather than a canceling of dividends, we carried forward some past dividends toreplace these holes in the data.
For Korea, we calculate the dividend on the index in December 1988 and use thatvalue as the numerator for the dividend yield calculation for January and February1989. The values (in percent) for these two months are 0.5511 and 0.5273, respect-ively. In February 1990, we calculate the dividend on the index and use that valuein the numerator for March 1990. The value is 1.0919.
For Indonesia, we calculate the value of the dividend in June 1991. That value isused in the numerator for July 1991 through February 1992. The dividend yieldsare: 0.1200, 0.1380, 0.1745, 0.1936, 0.1799, 0.1718, 0.1496 and 0.1311.
For Taiwan, we calculate the value of the dividend in February 1990 and use thatin the numerator for March 1990 through April 1991. The dividend yields for thisperiod are: 0.2250, 0.2600, 0.3340, 0.4545, 0.4186, 0.6355, 0.8307, 0.6825, 0.5314,0.5037, 0.5831, 0.4703, 0.4677 and 0.4048.
World interest rates
The nominal interest rate for the G-7 countries is calculated by aggregating indi-vidual countries’ short-term interest rates weighted by using countries’ previous quar-ter’s share in G-7 GDP. The following interest rates are employed: Canada 90-dayTreasury bill (IFS 60C), France 90-day bill (IFS 60C), Germany 90-day bill (IFS60C), Italy 180-day bill (IFS 60B), Japan commercial paper from 1975–1976 (IFS60B) and the Gensaki rate from 1977–1997 (IFS GBD3M), United Kingdom 90-daybill (IFS 60C), and the United States 90-day bill (IFS 60C).
References
Bachetta, P., van Wincoop, E., 2000. Capital flows to emerging markets Liberalization, overshooting andvolatility. In: Edwards, S. (Ed.), Capital Inflows and the Emerging Economies. University of ChicagoPress and NBER, Cambridge, MA, pp. 61–98.
Bai, J., Perron, P., 1998a. Computation and analysis of multiple structural change models, Unpublishedworking paper, Boston University, Boston, MA.
Bai, J., Perron, P., 1998b. Estimating and testing linear models with multiple structural changes. Econo-metrica 66, 47–78.
Bai, J., Lumsdaine, R.L., Stock, J.H., 1998. Testing for and dating breaks in stationary and nonstationarymultivariate time series. Review of Economic Studies 65 (3), 395–432.
Bartolini, L., Drazen, A., 1997. Capital account liberalization as a signal. American Economic Review87, 138–154.
Bekaert, G., Harvey, C.R., 1995. Time-varying world market integration. Journal of Finance 50, 403–444.Bekaert, G., Harvey, C.R., 2000a. Foreign speculators and emerging equity markets. Journal of Finance
55, 565–613.Bekaert, G., Harvey, C.R., 2000b. Capital flows and the behavior of emerging market equity returns. In:
Edwards, S. (Ed.), Capital Inflows and the Emerging Economies. University of Chicago Press andNBER, Cambridge, MA, pp. 159–194.
COLUMBIA BUSINESS SCHOOL 55
350 G. Bekaert et al. / Journal of International Money and Finance 21 (2002) 295–350
Bekaert, G., Harvey, C.R., Lumsdaine, R.L., 1999. The dynamics of emerging market equity flows,Unpublished working paper 7219, National Bureau of Economic Research, Cambridge MA.
Bekaert, G., Harvey, C.R., Lumsdaine, R.L., 2002. Dating the integration of world capital markets. Journalof Financial Economics, forthcoming.
Bohn, H., Tesar, L.L., 1996. US equity investment in foreign markets: Portfolio rebalancing or returnchasing? American Economic Review 86 (2), 77–81.
Bohn, H., Tesar, L.L., 1997. The US international investment portfolio and mean-variance optimization,Unpublished working paper, University of California at Santa Barbara, Santa Barbara, CA.
Calvo, G.A., Leiderman, L., Reinhart, C.M., 1993. Capital inflows and real exchange rate appreciationin Latin America: The role of external factors. IMF Staff Papers, Washington, DC.
Calvo, G.A., Leiderman, L., Reinhart, C.M., 1994. The capital inflows problem: Concepts and issues.Contemporary Economic Policy 12 (July), 54–66.
Calvo, G.A., Mendoza, E., 1998. Contagion, globalization and volatility of capital flows. In: Edwards, S.(Ed.), Capital Inflows and the Emerging Economies. University of Chicago Press and NBER, Chicago,IL, pp. 15–42.
Choe, H., Kho, B.-C., Stulz, R., 1999. Do foreign investors destabilize stock markets? The Korean experi-ence in 1997. Journal of Financial Economics 54, 227–264.
Clark, J., Berko, E., 1997. Foreign investment fluctuations and emerging market stock returns: The caseof Mexico, Staff report 24, Federal Reserve Bank of New York, New York, NY.
Edelen, R. M., Warner, J. B., 1999. Why are mutual fund flow and market returns related? Evidencefrom high-frequency data. Unpublished working paper, University of Rochester, Rochester, NY.
Fernandez-Arias, E., 1996. The new wave of private capital flows: Push or pull? Journal of DevelopmentEconomics 48, 389–418.
Froot, K.A., O’Connell, P.G.J., Seasholes, M.S., 2001. The portfolio flows of international investors.Journal of Financial Economics 59, 151–194.
Harvey, C.R., 1995. Predictable risk and returns in emerging markets. Review of Financial Studies 8,773–816.
Henry, P.B., 2000a. Equity prices, stock market liberalization, and investment. Journal of Financial Eco-nomics 58, 301–334.
Henry, P.B., 2000b. Stock market liberalization, economic reform, and emerging market equity prices.Journal of Finance 55, 529–564.
Kawakatsu, H., Morey, M. R., 1999. An empirical examination of financial liberalization and the efficiencyof emerging stock market prices. Journal of Financial Research, 385-411.
Kim, E.H., Singal, V., 2000. Opening up of stock markets: Lessons from emerging economies. Journalof Business 73, 25–66.
Lumsdaine, R.L., Papell, D.H., 1997. Multiple trend breaks and the unit root hypothesis. Review ofEconomics and Statistics 79 (2), 212–218.
Shleifer, A., 1986. Do demand curves for stocks slope down? Journal of Finance 41, 579–590.Stulz, R. M., 1999. International portfolio flows and security markets. In Feldstein, M., (Ed.), International
Capital Flows, National Bureau of Economic Research, forthcoming.Tesar, L., Werner, I., 1994. International equity transactions and U.S. portfolio choice. In: Frankel, J. (Ed.),
The Internationalization of Equity Markets. University of Chicago Press, Chicago, IL, pp. 185–215.Tesar, L., Werner, I., 1995. U.S. equity investment in emerging stock markets. World Bank Economic
Review 9 (1), 109–130.Warther, V.A., 1995. Aggregate mutual fund flows and security returns. Journal of Financial Economics
39, 209–235.World Bank, 1997. Private capital flows to developing countries: the road to financial integration. Oxford
University Press.
COLUMBIA BUSINESS SCHOOL 56