Embed Size (px)
Citation preview
have concentrated on either the race or class factors of these three themes, or debated about the relative signifi cance of one over the other (Trudeau, 2006). There are few models built to simulate dynamically the interplay of neighbourhood racial and economic con-ditions in forming segregation.
This paper argues that the racial and eco-nomic sorting processes in the formation of neighbourhood segregation are inter-dependent and dynamically related. On one hand, socioeconomic and demographic status and change in a neighbourhood affect
The Dynamics of Residential Segregation in Buffalo: An Agent-based SimulationLi Yin
[Paper first received, February 2008; in final form, November 2008]
Abstract
Race and class factors have been studied as underlying causes of segregation for many years. Individual choices on race and economic constraints of living in one area versus another play an important role in residential segregation. An attempt has not yet been made to simulate the interplay of neighbourhood racial and economic composition in forming segregation using empirical micro-level data. Using City of Buffalo data, this study explores how individuals’ housing location choices with respect to racial composition and housing sale prices in their neighbourhoods can give rise to aggregate patterns of residential segregation and how segregation at one point in time was contributing to increased segregation at later stages. The results show that observed patterns of segregation in the city could plausibly arise from the interaction of racial and economic factors. This study also demonstrates the application of such models on exploring the possible effects of proposed integration efforts.
Introduction
Studies that examine the causes of Black–White segregation mainly focus on three themes: segregation resulting from racial discrimination, from own-race preference and from economic differences (Darden, 1987; Trudeau, 2006; Clark, 2002; Massey and Denton, 1993). These explanatory themes suggest that individual choices on race and economic constraints of living in one area versus another play an important role in resi-dential segregation. Many studies, however,
0042-0980 Print/1360-063X Online © 2009 Urban Studies Journal Limited
DOI: 10.1177/0042098009346326
Li Yin is in the Department of Urban and Regional Planning, the State University of New York at Buffalo, 3435 Main Street, 116 Hayes Hall, Buffalo, New York, 14214, USA. E-mail: [email protected].
46(13) 2749–2770, December 2009
at SUNY AT BUFFALO on November 16, 2009 http://usj.sagepub.comDownloaded from
2750 LI YIN
an individual’s decision on whether to live there; on the other hand, behaviours of resi-dents in a neighbourhood with respect to their decisions of moving out or staying and maintaining houses are infl uential to other house owners (Galster, 1987) and therefore have an impact on the aggregate level of racial composition and income in the neigh-bourhood. Residential segregation should be researched as a dynamic and interactive process of individual household decision-making related to both racial and economic factors (Farley et al., 1997). This paper aims to simulate the segregation process using an agent-based approach.
The idea of cellular automata (CA) and agent-based modelling (ABM) can be dated back to the late 1940s (von Neumann, 1966). ABM was used to simulate the actions and interactions of autonomous individuals in a system in an attempt to regenerate, predict and understand macro-level phenomena (Epstein and Axtell, 1996; Parker et al., 2003). Schelling (1971, 1978), Zhang (2003) and Laurie and Jaggi (2003) used ABM to look at racial segregation as a dynamic process in which individual choices about race pro-duced segregation. Most ABMs, however, are abstract and are not tested using empirical data (Janssen and Ostrom, 2006). The rapid advancement of information technologies and increasingly available data in recent years have allowed an increasing number of researchers to make an effort to go beyond a proof of concept (Benenson et al., 2002; Yin and Muller, 2007). Attempts have not yet been made to put a Schelling-type model on feet using empirical micro-level racial and economic data.
This paper builds on Schelling (1971), Zhang (2003), Yin and Muller (2007) and Benenson et al. (2002) to develop an agent-based model using empirical micro-level data collected and processed for the City of Buffalo to explore: how individuals’ hous-ing location choices with respect to racial
composition and housing prices in their neighbourhoods can give rise to aggregate patterns of residential segregation; and, how residents’ behaviours infl uence each other’s decision-making as well as how segregation at one point in time was contributing to in-creased segregation at a later stage. Simulations built in this paper can help us to understand the evolution of residential segregation and the role of racial and economic concerns in decision-making.
This study also aims to demonstrate the application of such an agent-based model on capturing the spatial and temporal dimension of segregation to explore the possible effects of proposed integration efforts. Residential integration efforts have been criticised for not being able to centre on the process of integration and for failing to address the top–down decision-making process (Spriggs, 1998; Massey and Denton, 1993). This paper demonstrates how an agent-based model can help the community to understand the segregation process, seek the community’s input into the design of their community and study the possible effects from different scenarios.
Residential Segregation and Agent-based Models
A substantial amount of segregation research has relied heavily on non-spatial indexes such as the segregation dissimilarity index, the isolation index, and the neighbourhood sorting index (Massey and Denton, 1988; Waitzman and Smith, 1998; Jargowsky, 1997) to measure and assess aspects of residential segregation. In recent years, several spatial indexes have been developed (Wong, 1993, 2004). These are aggregate macro-level stat-istics averaging segregation experienced by the vast majority of minority group mem-bers at the individual level. These indexes are not suffi cient to refl ect the dynamics of segregation and how the level of segregation
at SUNY AT BUFFALO on November 16, 2009 http://usj.sagepub.comDownloaded from
RESIDENTIAL SEGREGATION IN BUFFALO 2751
in a neighbourhood felt by individuals may infl uence location decisions and contribute to a higher level of segregation.
The value and condition of a dwelling, the characteristics of the neighbourhood where the dwelling is located and the behaviour of individuals in that neighbourhood are dynamically interrelated. A home buyer pur-chases both the dwelling and the quality of the neighbourhood where that house is located (Tiebout, 1956; Jud and Watts, 1981). Neighbourhoods offering high-quality pub-lic services and amenities are attractive to housing consumers, while rundown neigh-bourhoods with a deteriorating housing stock or with imminent negative changes is less attractive to home buyers (Tiebout, 1956). Housing values therefore are determined not only by the condition of the dwelling itself, but also by the neighbourhood (Quigley, 1985). A dwelling’s value, on the other hand, infl uences the quality of its neighbourhood. These combinations of factors infl uence a household’s buying and selling decision.
Housing location decisions and housing values are also related to the racial and ethnic composition within a neighbourhood (Kiel and Zabel, 2002; Richardson et al., 1974). People’s preference for a particular neigh-bourhood racial composition and their atti-tude towards racial integration have been the subject of segregation research for many years (Clark, 2002; Cutler et al., 1999; Emerson et al., 2001; Ihlanfeldt and Scafi di, 2002). Racial discrimination and own-race preferences of households have been argued by many studies as determinants of segre-gation (Darden and Kamel, 2000; Clark, 1989, 2002). Some households prefer to live amongst members of their own race (Charles, 2000, Clark, 1989, 1992; Farley and Frey, 1993). The patterns of residential segrega-tion documented in US census for the year 2000 show that race and ethnicity remain important neighbourhood sorting factors and that Blacks remain severely segregated
in major metropolitan areas (Charles, 2003; Eaddy et al., 2003), reflecting micro-level housing decisions by racial and ethnic min-orities as well as by Whites (Emerson et al., 2001). Schelling (1971) showed how a critical mass of African Americans residing in a neigh-bourhood would cause Whites to move out. The individual household level of decision-making about location affected the dwelling and neighbourhood conditions, and further sorted and segregated neighbourhoods while affecting housing prices. The extent of segregation refl ected in most minority-concentrated communities is rarely based solely on racial preferences.
Segregation perpetuates numerous socio-economic inequalities for people living in the communities such as differentiated levels of access to education, health care and employ-ment (Taeuber and Taeuber, 1965; Jargowsky, 1997; Wilson, 1987) and it influences the quality of the neighbourhoods (Wilson, 1987). Neighbourhoods with high quality tend to be associated with close proximity to Whites and poor quality neighbourhoods tend to be associated with Blacks (Charles, 2000; Wilson, 1987; Massey and Denton, 1993). Neighbourhoods with poor quality become unpopular with people who care less about racial composition because location decisions are also affected by neighbourhood characteristics that represent many of the tangible and intangible values sought by residents. These include housing and school qualities (Charles, 2003). Housing values are depreciated in highly segregated minority-dominated neighbourhoods in many cities. Goodman (1977) found that racial variables at the census-block level are negatively related to housing sale prices in New Haven, CT.
Housing decisions are made under the infl uence of housing conditions and neigh-bourhood settings and racial composition, as well as past public policies. To study resi-dential segregation, it is important to use a method and datasets that are able to capture
at SUNY AT BUFFALO on November 16, 2009 http://usj.sagepub.comDownloaded from
2752 LI YIN
the interdependent racial and economic sorting processes in forming segregated neigh-bourhoods. The agent-based approach can be used to model the micro-level dynamics processes, such as the residential and social mobility underlying observed neighbour-hood change.
The agent-based model is an individual-based computation model (Epstein and Axtell, 1996). It uses dynamically interacting rule-based agents to simulate the emergence of macro-level patterns from micro-level behaviours in parallel with the real phenom-ena. Agents are objects situated in space and time. They can be programmed to reside on a lattice representing a city or a neigh-bourhood, like a household, and to assess situations or environments as well as make residential location decisions according to rules encoded in algorithmic form in com-puter programmes. ABM enables the in-corporation of heterogeneous agents that follow different rules (Janssen and Ostrom, 2006). The repetitive applying of rules on agents that rely on the power of computers allows an exploration of dynamics that pure mathematical methods are inadequate in their ability to reach.
Another advantage of an agent-based model is that, even if the rules and assumptions used to model a social system are simple, the output of the agent-based model can be surprising, unpredictable and complex because of the myriad interactions of the many agents in the system (Epstein and Axtell, 1996). This enables better modelling of the real urban system and also allows us to attain greater insight about its fundamental causal mechanisms.
Agent-based models have been found to be a powerful simulation modelling tech-nique in more and more research areas, such as business and economic policy analysis (Freeman, 1998). Its application on residential segregation, however, has had a long history. Back in the 1970s, Schelling (1971, 1978)
demonstrated how local interactions between fairly racially tolerant household agents could give rise to the emergence of aggregate socio-spatial patterns of segregation using a simple early version of an agent-based model. The recent rapid development in computational power has brought another wave of agent-based residential segregation models (Laurie and Jaggi, 2003; Fossett and Waren, 2005). However, like Schelling’s work, these models were based on a highly stylised city form and were rarely used to explain neighbourhood changes in real population. Moreover, little work has been done to simulate the interplay of racial and economic factors in forming residential segregation using empirical data. This study builds an interactive and dynamic model using the agent-based approach with empirical data of neighbourhood changes to understand how racial and economic factors jointly contribute to the formation and con-tinuation of segregated neighbourhoods in the City of Buffalo, New York.
Policy Implications
Studies have found that the availability of home loans for minority applicants in African American neighbourhoods is one of the reasons that make it diffi cult to break the mutual reinforcing cycle of poverty, segrega-tion and deteriorating housing. Decreasing segregation by economic status is among the goals of racial integration efforts. The agent-based residential segregation model built in this study suggests opportunities for policy applications that link policy design and implementation to simulate the effects of alternative residential integration policies. Such agent-based models enable segregation researchers to have an opportunity to learn a broader range of possible emergent effects of racial integration policies. In this paper, we present an example of using an agent-based model to create an integrated neighbourhood within the study area.
at SUNY AT BUFFALO on November 16, 2009 http://usj.sagepub.comDownloaded from
RESIDENTIAL SEGREGATION IN BUFFALO 2753
Residential Segregation in Buffalo
The Buffalo metropolitan area, New York, was ranked the nation’s 12th most segregated between Blacks and Whites in 1980, 10th in 1990 and 8th in 2000 (US Census Bureau, 1980, 1990, 2000), demonstrating persistent patterns of residential segregation from 1980 to 2000. Over the past half-century, the city has experienced a drastic population loss and economic decline. In the same period, the poverty rate increased from 15.2 per cent to 26.7 per cent (City of Buffalo, 2004). Median household income was less than $25 000 in 2000. A major cause of urban poverty in the US is argued to be racial residential segrega-tion (Massey and Denton, 1993). While the 1990 and 2000 censuses show that residential segregation declined to some extent from its extremely high levels nation-wide, data for Buffalo reveal the persistent and striking high level of Black–White residential segregation in both the city and the metropolitan area (US Census Bureau, 1990, 2000).
Main Street or NY Route 5 cuts across City of Buffalo from downtown in the south-west to north-east. In 2000, over 85 per cent of the city’s Black population lived on the east side of Main Street. Many census blocks east of Main Street have over 90 per cent Blacks. Meanwhile, many census blocks have more than 90 per cent Whites on the west side. Currently, 76 per cent of population west of Main Street is White . The upper west side has a cluster of some of the most expensive and biggest houses in the region. On the east side of the street, many houses have been abandoned (US Census Bureau, 2000).
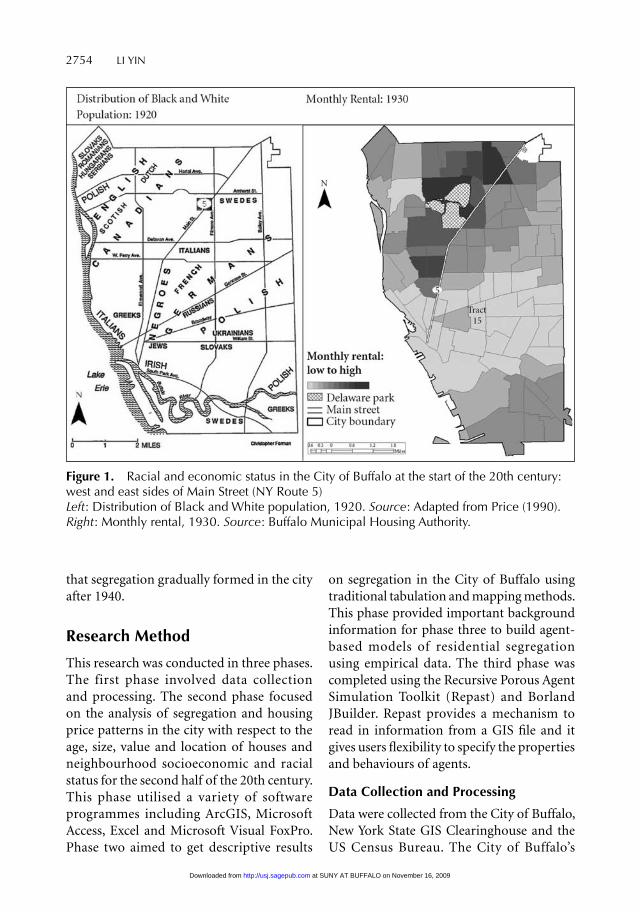
The distribution of Blacks and Whites was different at the start of the 20th century (Figure 1). Blacks shared their residential environment with Whites such as Germans, Italians and Irish on the east side of Main Street. The Black community in Buffalo at that time was small and the neighbourhoods
were integrated (Taylor, 1991, 1996; Gerber, 1989). The monthly rental rates in some census tracts east of Main Street were among the highest in the city in 1930 (Figure 1).
The explosion of the Black population came between 1940 and 1970, growing by 433 per cent (Taylor, 1996). Meanwhile, 80 000 White Buffalonians, about 20 per cent of the 1950 population, took advantage of federal subsidies and moved to suburbs between 1950 and 1960. By 2000, Whites had decreased to 51.8 per cent of the total city population and Blacks had increased to 37.2 per cent. Most Blacks worked as low-wage unskilled or semi-skilled labourers (Taylor, 1991). Blacks are at a material disadvantage with their an-nual earnings signifi cantly less than those of Whites (Trudeau, 2006). Blacks also suf-fer from a high unemployment rate (Butler et al., 1990). Eighteen per cent of Blacks in Erie County, 30 per cent in some minority-dominated neighbourhoods, were unemployed compared with 5.6 per cent for Whites. More than half of Black households had incomes below $15 000 in the county (Taylor, 1996).
The low wages and high unemployment rates determined the type of housing and neighbourhood available for most Blacks (Taylor, 1991). In 1940, a census tract near downtown and on the lower east side of Main Street had an unemployment rate of 52 per cent (tract 15 in Figure 1). It was also the area with some of the worst housing and neigh-bourhood conditions in the city. This census tract changed from a predominantly German area to one of the tracts with the heaviest con-centration of Blacks (Butler et al., 1990). The deterioration of housing units in some census tracts created unfavourable neighbourhood conditions, which may have driven away ra-cially tolerant households and decreased the housing values. Monthly rentals in most of the census tracts on the east side of Main Street were lower in 1940 than they had been in 1930 (Taylor, 1991). Taylor (1991) suggested
at SUNY AT BUFFALO on November 16, 2009 http://usj.sagepub.comDownloaded from
2754 LI YIN
that segregation gradually formed in the city after 1940.
Research Method
This research was conducted in three phases. The first phase involved data collection and processing. The second phase focused on the analysis of segregation and housing price patterns in the city with respect to the age, size, value and location of houses and neighbourhood socioeconomic and racial status for the second half of the 20th century. This phase utilised a variety of software programmes including ArcGIS, Microsoft Access, Excel and Microsoft Visual FoxPro. Phase two aimed to get descriptive results
on segregation in the City of Buffalo using traditional tabulation and mapping methods. This phase provided important background information for phase three to build agent-based models of residential segregation using empirical data. The third phase was completed using the Recursive Porous Agent Simulation Toolkit (Repast) and Borland JBuilder. Repast provides a mechanism to read in information from a GIS fi le and it gives users fl exibility to specify the properties and behaviours of agents.
Data Collection and Processing
Data were collected from the City of Buffalo, New York State GIS Clearinghouse and the US Census Bureau. The City of Buffalo’s
Figure 1. Racial and economic status in the City of Buffalo at the start of the 20th century: west and east sides of Main Street (NY Route 5) Left : Distribution of Black and White population, 1920. Source : Adapted from Price (1990). Right : Monthly rental, 1930. Source : Buffalo Municipal Housing Authority.
at SUNY AT BUFFALO on November 16, 2009 http://usj.sagepub.comDownloaded from
RESIDENTIAL SEGREGATION IN BUFFALO 2755
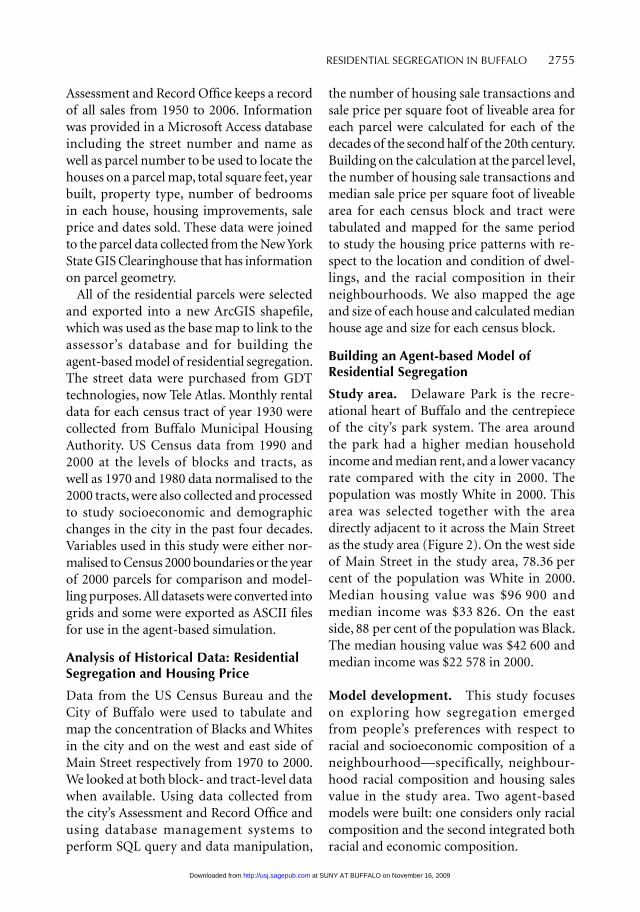
Assessment and Record Offi ce keeps a record of all sales from 1950 to 2006. Information was provided in a Microsoft Access database including the street number and name as well as parcel number to be used to locate the houses on a parcel map, total square feet, year built, property type, number of bedrooms in each house, housing improvements, sale price and dates sold. These data were joined to the parcel data collected from the New York State GIS Clearinghouse that has information on parcel geometry.
All of the residential parcels were selected and exported into a new ArcGIS shapefi le, which was used as the base map to link to the assessor’s database and for building the agent-based model of residential segregation. The street data were purchased from GDT technologies, now Tele Atlas. Monthly rental data for each census tract of year 1930 were collected from Buffalo Municipal Housing Authority. US Census data from 1990 and 2000 at the levels of blocks and tracts, as well as 1970 and 1980 data normalised to the 2000 tracts, were also collected and processed to study socioeconomic and demographic changes in the city in the past four decades. Variables used in this study were either nor-malised to Census 2000 boundaries or the year of 2000 parcels for comparison and model-ling purposes. All datasets were converted into grids and some were exported as ASCII fi les for use in the agent-based simulation.
Analysis of Historical Data: Residential Segregation and Housing Price
Data from the US Census Bureau and the City of Buffalo were used to tabulate and map the concentration of Blacks and Whites in the city and on the west and east side of Main Street respectively from 1970 to 2000. We looked at both block- and tract-level data when available. Using data collected from the city’s Assessment and Record Offi ce and using database management systems to perform SQL query and data manipulation,
the number of housing sale transactions and sale price per square foot of liveable area for each parcel were calculated for each of the decades of the second half of the 20th century. Building on the calculation at the parcel level, the number of housing sale transactions and median sale price per square foot of liveable area for each census block and tract were tabulated and mapped for the same period to study the housing price patterns with re-spect to the location and condition of dwel-lings, and the racial composition in their neighbourhoods. We also mapped the age and size of each house and calculated median house age and size for each census block.
Building an Agent-based Model of Residential Segregation
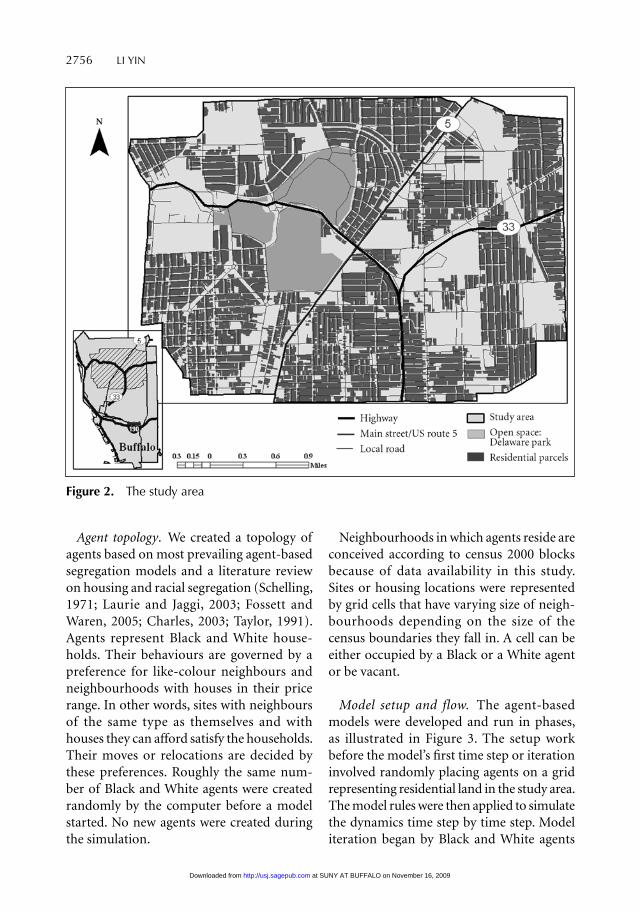
Study area. Delaware Park is the recre-ational heart of Buffalo and the centrepiece of the city’s park system. The area around the park had a higher median household income and median rent, and a lower vacancy rate compared with the city in 2000. The population was mostly White in 2000. This area was selected together with the area directly adjacent to it across the Main Street as the study area (Figure 2). On the west side of Main Street in the study area, 78.36 per cent of the population was White in 2000. Median housing value was $96 900 and median income was $33 826. On the east side, 88 per cent of the population was Black. The median housing value was $42 600 and median income was $22 578 in 2000.
Model development. This study focuses on exploring how segregation emerged from people’s preferences with respect to racial and socioeconomic composition of a neighbourhood—specifically, neighbour-hood racial composition and housing sales value in the study area. Two agent-based models were built: one considers only racial composition and the second integrated both racial and economic composition.
at SUNY AT BUFFALO on November 16, 2009 http://usj.sagepub.comDownloaded from
2756 LI YIN
Agent topology. We created a topology of agents based on most prevailing agent-based segregation models and a literature review on housing and racial segregation (Schelling, 1971; Laurie and Jaggi, 2003; Fossett and Waren, 2005; Charles, 2003; Taylor, 1991). Agents represent Black and White house-holds. Their behaviours are governed by a preference for like-colour neighbours and neighbourhoods with houses in their price range. In other words, sites with neighbours of the same type as themselves and with houses they can afford satisfy the households. Their moves or relocations are decided by these preferences. Roughly the same num-ber of Black and White agents were created randomly by the computer before a model started. No new agents were created during the simulation.
Neighbourhoods in which agents reside are conceived according to census 2000 blocks because of data availability in this study. Sites or housing locations were represented by grid cells that have varying size of neigh-bourhoods depending on the size of the census boundaries they fall in. A cell can be either occupied by a Black or a White agent or be vacant.
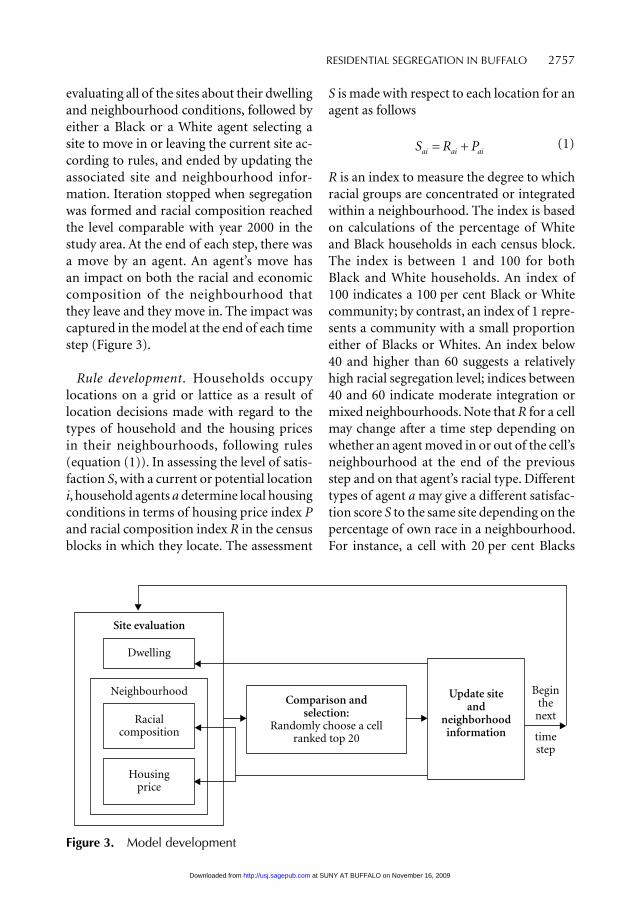
Model setup and flow. The agent-based models were developed and run in phases, as illustrated in Figure 3. The setup work before the model’s fi rst time step or iteration involved randomly placing agents on a grid representing residential land in the study area. The model rules were then applied to simulate the dynamics time step by time step. Model iteration began by Black and White agents
Figure 2. The study area
at SUNY AT BUFFALO on November 16, 2009 http://usj.sagepub.comDownloaded from
RESIDENTIAL SEGREGATION IN BUFFALO 2757
evaluating all of the sites about their dwelling and neighbourhood conditions, followed by either a Black or a White agent selecting a site to move in or leaving the current site ac-cording to rules, and ended by updating the associated site and neighbourhood infor-mation. Iteration stopped when segregation was formed and racial composition reached the level comparable with year 2000 in the study area. At the end of each step, there was a move by an agent. An agent’s move has an impact on both the racial and economic composition of the neighbourhood that they leave and they move in. The impact was captured in the model at the end of each time step (Figure 3).
Rule development. Households occupy locations on a grid or lattice as a result of location decisions made with regard to the types of household and the housing prices in their neighbourhoods, following rules (equation (1)). In assessing the level of satis-faction S, with a current or potential location i, household agents a determine local housing conditions in terms of housing price index P and racial composition index R in the census blocks in which they locate. The assessment
S is made with respect to each location for an agent as follows
S R Pai ai ai= + (1)
R is an index to measure the degree to which racial groups are concentrated or integrated within a neighbourhood. The index is based on calculations of the percentage of White and Black households in each census block. The index is between 1 and 100 for both Black and White households. An index of 100 indicates a 100 per cent Black or White community; by contrast, an index of 1 repre-sents a community with a small proportion either of Blacks or Whites. An index below 40 and higher than 60 suggests a relatively high racial segregation level; indices between 40 and 60 indicate moderate integration or mixed neighbourhoods. Note that R for a cell may change after a time step depending on whether an agent moved in or out of the cell’s neighbourhood at the end of the previous step and on that agent’s racial type. Different types of agent a may give a different satisfac-tion score S to the same site depending on the percentage of own race in a neighbourhood. For instance, a cell with 20 per cent Blacks
Figure 3. Model development
at SUNY AT BUFFALO on November 16, 2009 http://usj.sagepub.comDownloaded from
2758 LI YIN
and 80 per cent Whites will get an R index of 20 for a Black agent, but an index of 80 for a White agent.
The housing price index P for each loca-tion i is a function of housing characteristics, like a hedonic price model (Rosen, 1974). A hedonic housing price model often contains locational attributes L, structural attributes ST and neighbourhood attributes N, which can be expressed in equation (2). These three types of housing characteristics were used to represent the type of housing available in a neighbourhood
P L ST Ni i i i= + + (2)
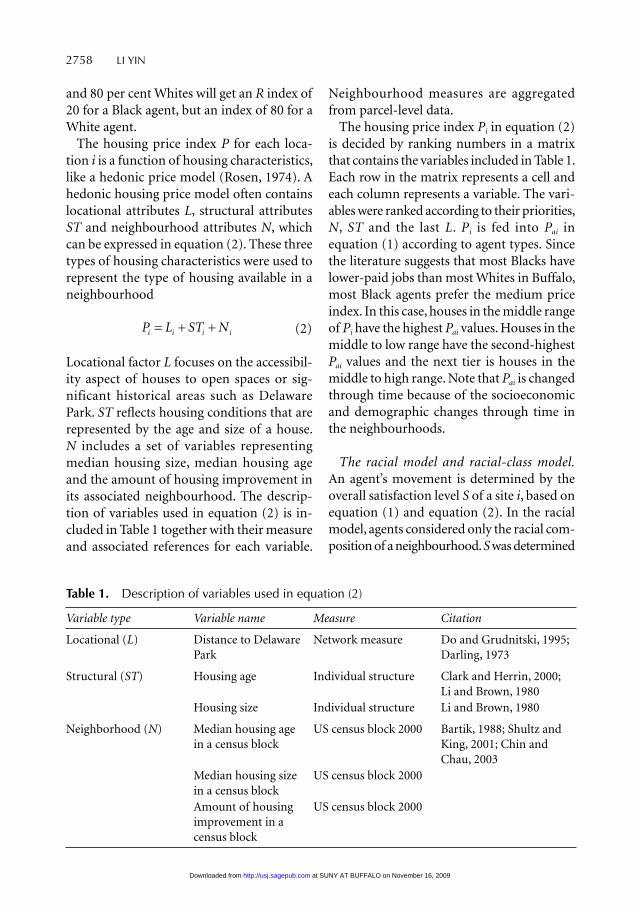
Locational factor L focuses on the accessibil-ity aspect of houses to open spaces or sig-nificant historical areas such as Delaware Park. ST refl ects housing conditions that are represented by the age and size of a house. N includes a set of variables representing median housing size, median housing age and the amount of housing improvement in its associated neighbourhood. The descrip-tion of variables used in equation (2) is in-cluded in Table 1 together with their measure and associated references for each variable.
Neighbourhood measures are aggregated from parcel-level data.
The housing price index Pi in equation (2) is decided by ranking numbers in a matrix that contains the variables included in Table 1. Each row in the matrix represents a cell and each column represents a variable. The vari-ables were ranked according to their priorities, N, ST and the last L. Pi is fed into Pai in equation (1) according to agent types. Since the literature suggests that most Blacks have lower-paid jobs than most Whites in Buffalo, most Black agents prefer the medium price index. In this case, houses in the middle range of Pi have the highest Pai values. Houses in the middle to low range have the second-highest Pai values and the next tier is houses in the middle to high range. Note that Pai is changed through time because of the socioeconomic and demographic changes through time in the neighbourhoods.
The racial model and racial-class model. An agent’s movement is determined by the overall satisfaction level S of a site i, based on equation (1) and equation (2). In the racial model, agents considered only the racial com-position of a neighbourhood. S was determined
Table 1. Description of variables used in equation (2)
Variable type Variable name Measure Citation
Locational (L) Distance to Delaware Park
Network measure Do and Grudnitski, 1995; Darling, 1973
Structural (ST) Housing age Individual structure Clark and Herrin, 2000; Li and Brown, 1980
Housing size Individual structure Li and Brown, 1980
Neighborhood (N) Median housing age in a census block
US census block 2000 Bartik, 1988; Shultz and King, 2001; Chin and Chau, 2003
Median housing size in a census block
US census block 2000
Amount of housing improvement in a census block
US census block 2000
at SUNY AT BUFFALO on November 16, 2009 http://usj.sagepub.comDownloaded from
RESIDENTIAL SEGREGATION IN BUFFALO 2759
solely by R in equation (1); equation (2) was not used. In the racial-class model, S was determined by both factors in equation (1).
Several GIS fi les were read into Repast as model inputs from ArcGIS exported ASCII fi les, such as one layer representing the neigh-bourhood structure, the census blocks of year 2000, one layer representing all residential land in the study area, and layers represent-ing housing build year as well as size. This information was stored in Repast for agents to retrieve when measuring satisfaction levels for residential location decision-making.
There is also information that is endogen-ous and updated at the end of every time step or tick during the simulation such as the number of Black households or White house-holds in a neighbourhood. The updated information infl uenced the ranking of a cell in the matrixes and was incorporated in the decision-making of agents in the next iteration on whether to move and where to move.
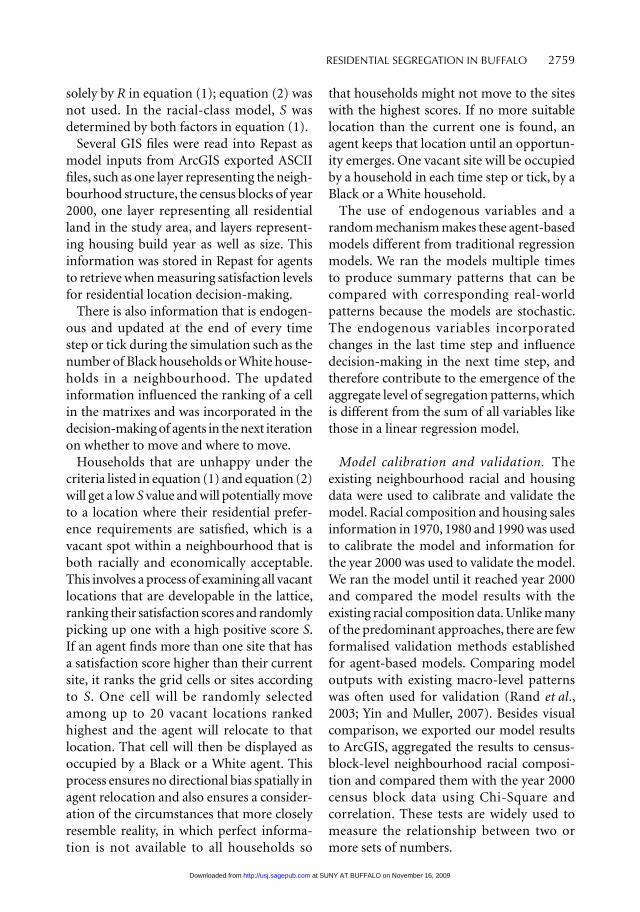
Households that are unhappy under the criteria listed in equation (1) and equation (2) will get a low S value and will potentially move to a location where their residential prefer-ence requirements are satisfi ed, which is a vacant spot within a neighbourhood that is both racially and economically acceptable. This involves a process of examining all vacant locations that are developable in the lattice, ranking their satisfaction scores and randomly picking up one with a high positive score S. If an agent fi nds more than one site that has a satisfaction score higher than their current site, it ranks the grid cells or sites according to S. One cell will be randomly selected among up to 20 vacant locations ranked highest and the agent will relocate to that location. That cell will then be displayed as occupied by a Black or a White agent. This process ensures no directional bias spatially in agent relocation and also ensures a consider-ation of the circumstances that more closely resemble reality, in which perfect informa-tion is not available to all households so
that households might not move to the sites with the highest scores. If no more suitable location than the current one is found, an agent keeps that location until an opportun-ity emerges. One vacant site will be occupied by a household in each time step or tick, by a Black or a White household.
The use of endogenous variables and a random mechanism makes these agent-based models different from traditional regression models. We ran the models multiple times to produce summary patterns that can be compared with corresponding real-world patterns because the models are stochastic. The endogenous variables incorporated changes in the last time step and infl uence decision-making in the next time step, and therefore contribute to the emergence of the aggregate level of segregation patterns, which is different from the sum of all variables like those in a linear regression model.
Model calibration and validation. The existing neighbourhood racial and housing data were used to calibrate and validate the model. Racial composition and housing sales information in 1970, 1980 and 1990 was used to calibrate the model and information for the year 2000 was used to validate the model. We ran the model until it reached year 2000 and compared the model results with the existing racial composition data. Unlike many of the predominant approaches, there are few formalised validation methods established for agent-based models. Comparing model outputs with existing macro-level patterns was often used for validation (Rand et al., 2003; Yin and Muller, 2007). Besides visual comparison, we exported our model results to ArcGIS, aggregated the results to census-block-level neighbourhood racial composi-tion and compared them with the year 2000 census block data using Chi-Square and correlation. These tests are widely used to measure the relationship between two or more sets of numbers.
at SUNY AT BUFFALO on November 16, 2009 http://usj.sagepub.comDownloaded from
2760 LI YIN
Policy implications. We assumed that there is a programme to help upkeep properties in the minority concentrated communities so that the variable—the amount of housing improvement in a cell’s neighbourhood—is changed and that in turn changes neighbour-hood attribute Ni and price index Pi of the cell according to equation (2). Because Ni has the highest priority when ranking variables for Pi, this cell’s Pi value moves up the ladder; for instance, from low range to middle range. Moreover, we assume that there are pro-grammes that help households to get home loans. This may change the preference for housing price. For example, households that prefer middle range Pi in equation (2) now can afford houses in middle to high range Pi that changes Pai and Sai in equation (1). We also assume that people are less racially sensitive; in other words, a wider range of Rai has a higher value contributing to Sai in equation (1). For example, racial indices between 45 and 65 now represent moderate integration or mixed neighbourhoods. The simulation is run based on these changes to see whether there might be changes of neigh-bourhood racial composition over time.
Result and Discussion
Results of the Descriptive Analysis: Residential Segregation and Housing Price in the Late 20th Century
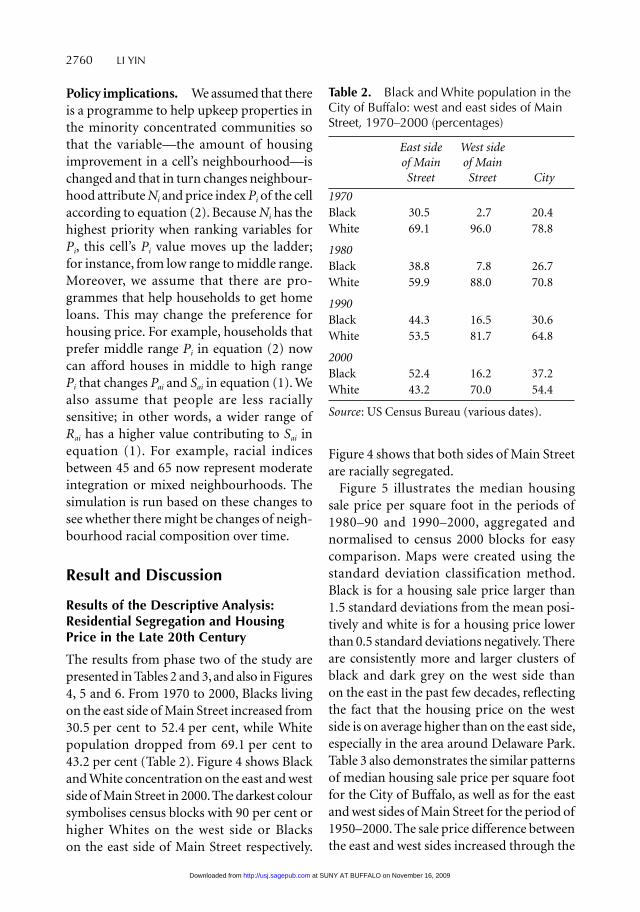
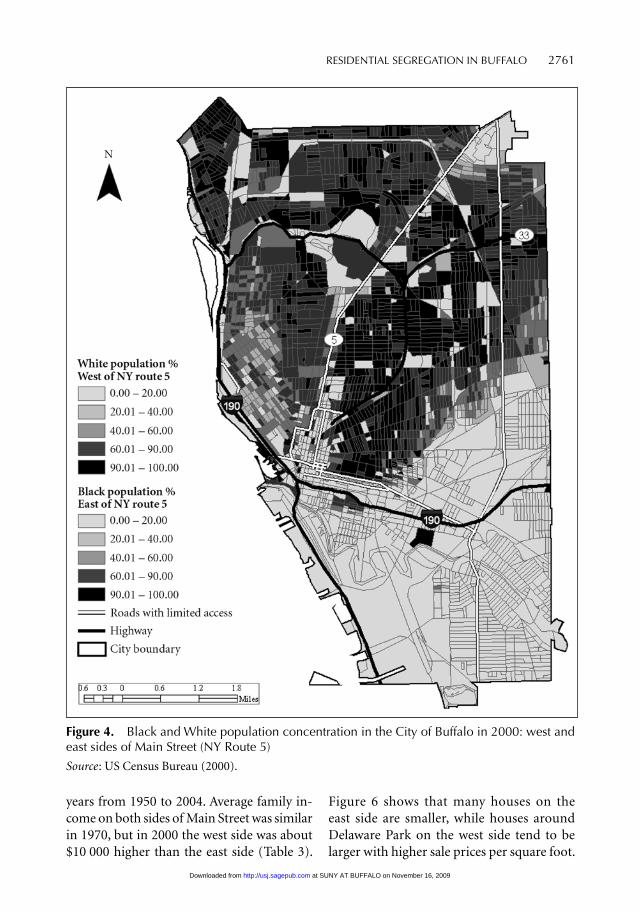
The results from phase two of the study are presented in Tables 2 and 3, and also in Figures 4, 5 and 6. From 1970 to 2000, Blacks living on the east side of Main Street increased from 30.5 per cent to 52.4 per cent, while White population dropped from 69.1 per cent to 43.2 per cent (Table 2). Figure 4 shows Black and White concentration on the east and west side of Main Street in 2000. The darkest colour symbolises census blocks with 90 per cent or higher Whites on the west side or Blacks on the east side of Main Street respectively.
Figure 4 shows that both sides of Main Street are racially segregated.
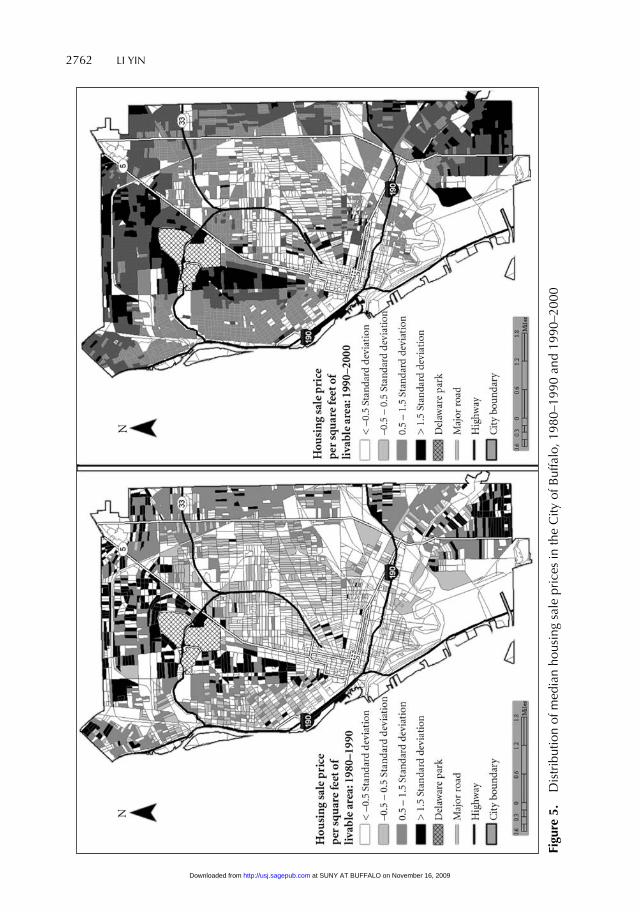
Figure 5 illustrates the median housing sale price per square foot in the periods of 1980–90 and 1990–2000, aggregated and normalised to census 2000 blocks for easy comparison. Maps were created using the standard deviation classification method. Black is for a housing sale price larger than 1.5 standard deviations from the mean posi-tively and white is for a housing price lower than 0.5 standard deviations negatively. There are consistently more and larger clusters of black and dark grey on the west side than on the east in the past few decades, refl ecting the fact that the housing price on the west side is on average higher than on the east side, especially in the area around Delaware Park. Table 3 also demonstrates the similar patterns of median housing sale price per square foot for the City of Buffalo, as well as for the east and west sides of Main Street for the period of 1950–2000. The sale price difference between the east and west sides increased through the
Table 2. Black and White population in the City of Buffalo: west and east sides of Main Street, 1970–2000 (percentages)
East side of Main Street
West side of Main Street City
1970Black 30.5 2.7 20.4White 69.1 96.0 78.8
1980Black 38.8 7.8 26.7White 59.9 88.0 70.8
1990Black 44.3 16.5 30.6White 53.5 81.7 64.8
2000Black 52.4 16.2 37.2White 43.2 70.0 54.4
Source : US Census Bureau (various dates).
at SUNY AT BUFFALO on November 16, 2009 http://usj.sagepub.comDownloaded from
RESIDENTIAL SEGREGATION IN BUFFALO 2761
years from 1950 to 2004. Average family in-come on both sides of Main Street was similar in 1970, but in 2000 the west side was about $10 000 higher than the east side (Table 3).
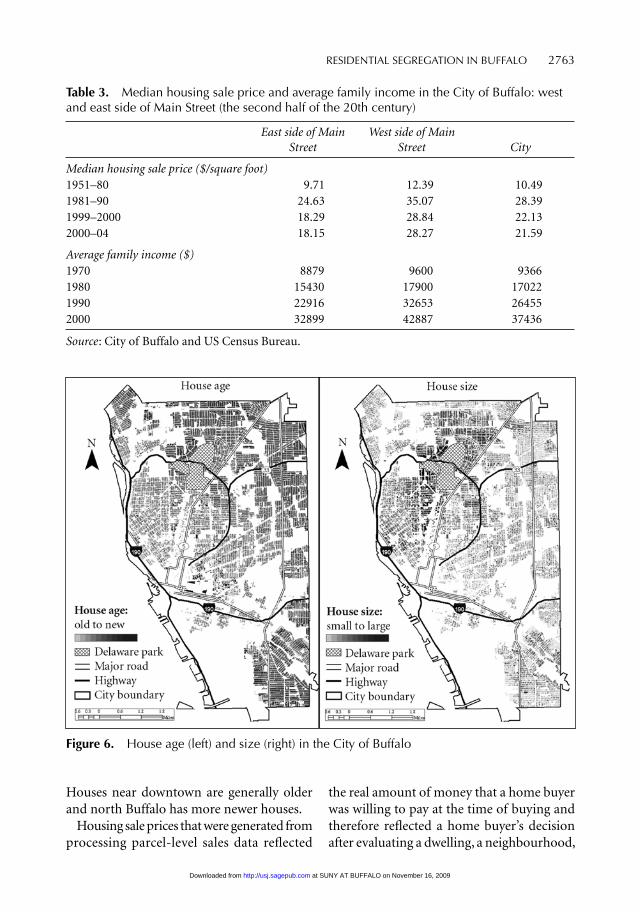
Figure 6 shows that many houses on the east side are smaller, while houses around Delaware Park on the west side tend to be larger with higher sale prices per square foot.
Figure 4. Black and White population concentration in the City of Buffalo in 2000: west and east sides of Main Street (NY Route 5)
Source : US Census Bureau (2000).
at SUNY AT BUFFALO on November 16, 2009 http://usj.sagepub.comDownloaded from
2762 LI YIN
Figu
re 5
. D
istr
ibut
ion
of m
edia
n ho
usin
g sa
le p
rice
s in
the
City
of B
uffa
lo, 1
980–
1990
and
199
0–20
00
at SUNY AT BUFFALO on November 16, 2009 http://usj.sagepub.comDownloaded from
RESIDENTIAL SEGREGATION IN BUFFALO 2763
Houses near downtown are generally older and north Buffalo has more newer houses.
Housing sale prices that were generated from processing parcel-level sales data refl ected
the real amount of money that a home buyer was willing to pay at the time of buying and therefore refl ected a home buyer’s decision after evaluating a dwelling, a neighbourhood,
Table 3. Median housing sale price and average family income in the City of Buffalo: west and east side of Main Street (the second half of the 20th century)
East side of Main Street
West side of Main Street City
Median housing sale price ($/square foot)1951–80 9.71 12.39 10.491981–90 24.63 35.07 28.391999–2000 18.29 28.84 22.132000–04 18.15 28.27 21.59
Average family income ($)1970 8879 9600 93661980 15430 17900 170221990 22916 32653 264552000 32899 42887 37436
Source : City of Buffalo and US Census Bureau.
Figure 6. House age (left) and size (right) in the City of Buffalo
at SUNY AT BUFFALO on November 16, 2009 http://usj.sagepub.comDownloaded from
2764 LI YIN
the economic constraints and any other fac-tors. In 2000, the median housing sale price per square foot on the east side of Main Street was $18.29 while it was $28.84 on the west side. The gulfs of race and class divide the city into two parts along Main Street. Table 3 and Figure 5 show that the east side has a consistently lower housing sale price and average family income. They also show that low housing sale price per square foot and low family income concentrate in roughly the same areas as minority segregated com-munities, as illustrated in Figure 4.
The empirical results from phase two of this study display the general and descript-ive patterns of residential segregation and the distribution of housing prices in the late 20th century in Buffalo. The results show that neighbourhood economic and racial com-position are interrelated in the city. The use of a traditional descriptive method in this phase, however, did not allow modelling and examining the interplay of the racial and economic concerns, and how residential segregation was formed from the interplay. The results, nevertheless, helped in building up a more dynamic model to simulate inter-dependent racial and economic sorting pro-cesses in the next phase.
Results from the Agent-based Models
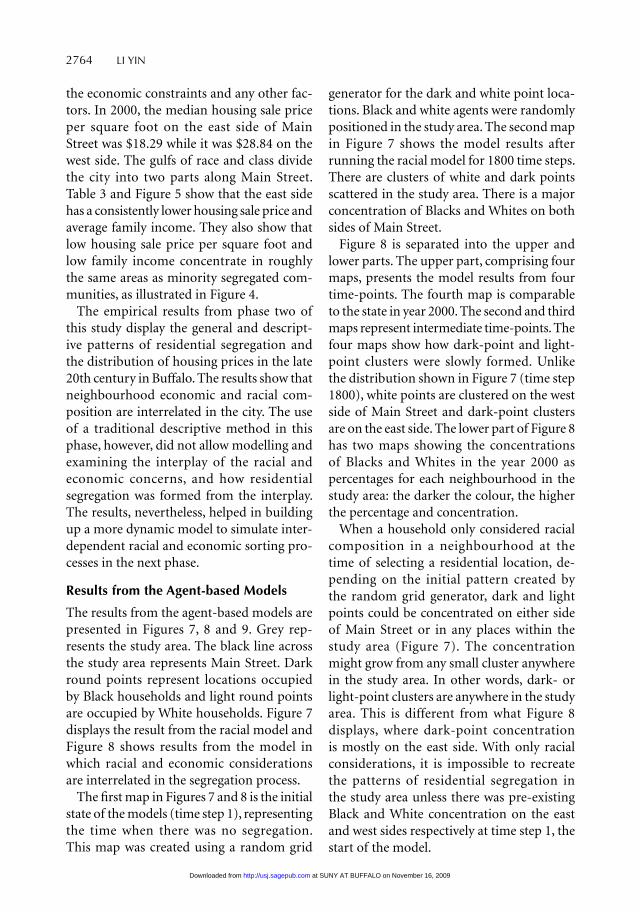
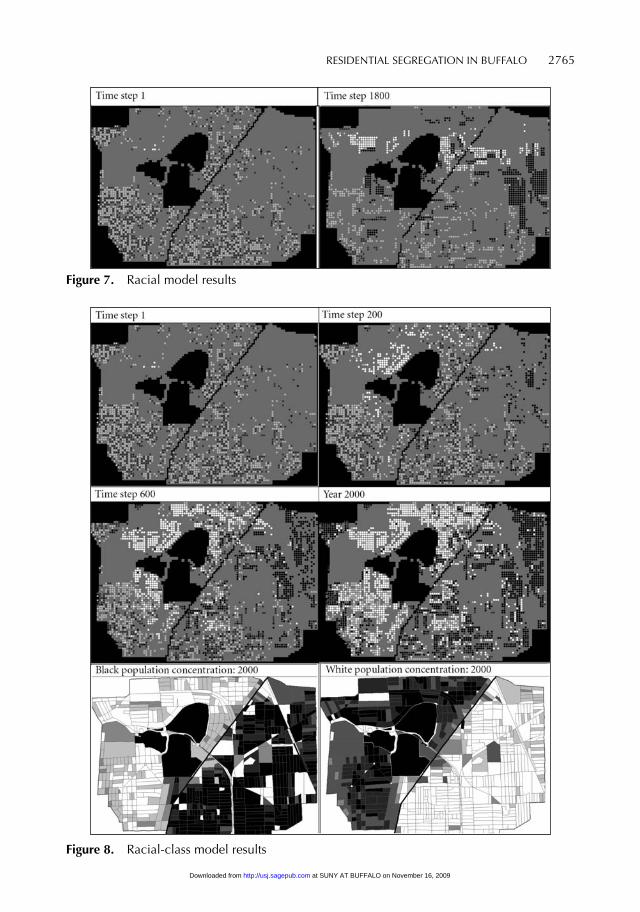
The results from the agent-based models are presented in Figures 7, 8 and 9. Grey rep-resents the study area. The black line across the study area represents Main Street. Dark round points represent locations occupied by Black households and light round points are occupied by White households. Figure 7 displays the result from the racial model and Figure 8 shows results from the model in which racial and economic considerations are interrelated in the segregation process.
The fi rst map in Figures 7 and 8 is the initial state of the models (time step 1), representing the time when there was no segregation. This map was created using a random grid
generator for the dark and white point loca-tions. Black and white agents were randomly positioned in the study area. The second map in Figure 7 shows the model results after running the racial model for 1800 time steps. There are clusters of white and dark points scattered in the study area. There is a major concentration of Blacks and Whites on both sides of Main Street.
Figure 8 is separated into the upper and lower parts. The upper part, comprising four maps, presents the model results from four time-points. The fourth map is comparable to the state in year 2000. The second and third maps represent intermediate time-points. The four maps show how dark-point and light-point clusters were slowly formed. Unlike the distribution shown in Figure 7 (time step 1800), white points are clustered on the west side of Main Street and dark-point clusters are on the east side. The lower part of Figure 8 has two maps showing the concentrations of Blacks and Whites in the year 2000 as percentages for each neighbourhood in the study area: the darker the colour, the higher the percentage and concentration.
When a household only considered racial composition in a neighbourhood at the time of selecting a residential location, de-pending on the initial pattern created by the random grid generator, dark and light points could be concentrated on either side of Main Street or in any places within the study area (Figure 7). The concentration might grow from any small cluster anywhere in the study area. In other words, dark- or light-point clusters are anywhere in the study area. This is different from what Figure 8 displays, where dark-point concentration is mostly on the east side. With only racial considerations, it is impossible to recreate the patterns of residential segregation in the study area unless there was pre-existing Black and White concentration on the east and west sides respectively at time step 1, the start of the model.
at SUNY AT BUFFALO on November 16, 2009 http://usj.sagepub.comDownloaded from
RESIDENTIAL SEGREGATION IN BUFFALO 2765
Figure 7. Racial model results
Figure 8. Racial-class model results
at SUNY AT BUFFALO on November 16, 2009 http://usj.sagepub.comDownloaded from
2766 LI YIN
When households’ location decisions were coded not based only on racial composition, our model the results shown in Figure 8. Households’ searching process included the evaluation of a dwelling and its neighbour-hood condition, in addition to any signifi cant darkor light-point clusters representing neighbourhood racial composition. The eco-nomic considerations broke the balance of the dark and light points even distribution, and created new seeds for future concentration. Many houses on the east side of Main Street are small, old and lacking in housing improve-ments. As time passed by, the housing stock there was becoming less and less favourable, in addition to possible neighbourhood racial considerations. Thus we see many light points disappearing from the east side because those White households chose to move out.
In the meanwhile, many houses built around Delaware Park were large and were being maintained. The amenities in the neigh-bourhood and housing upkeep made the houses and the neighbourhood more fav-ourable; and therefore they have a higher housing sale price compared with the east side. The higher housing price attracted higher-income households, typically White households, to the west side, encouraged property maintenance and kept the higher housing price that lower-income households
could not afford. This is reflected by the higher and higher percentage of light points on the west side. These created a circle for the dark-point clusters on the east side.
Figure 8 displays the results from a model that considered how the intertwined racial preference and economic concerns affected residential location and reinforced the segre-gation. The result resembles the existing con-ditions presented in the lower part of Figure 8. The Pearson Chi-Square value in Table 4 also indicates that our model prediction of neigh-bourhood racial composition aggregated to the census-block level is not unrelated to the existing census-block racial composition. All three measures in Table 4 suggest that our model and existing neighbourhood racial composition have similar patterns.
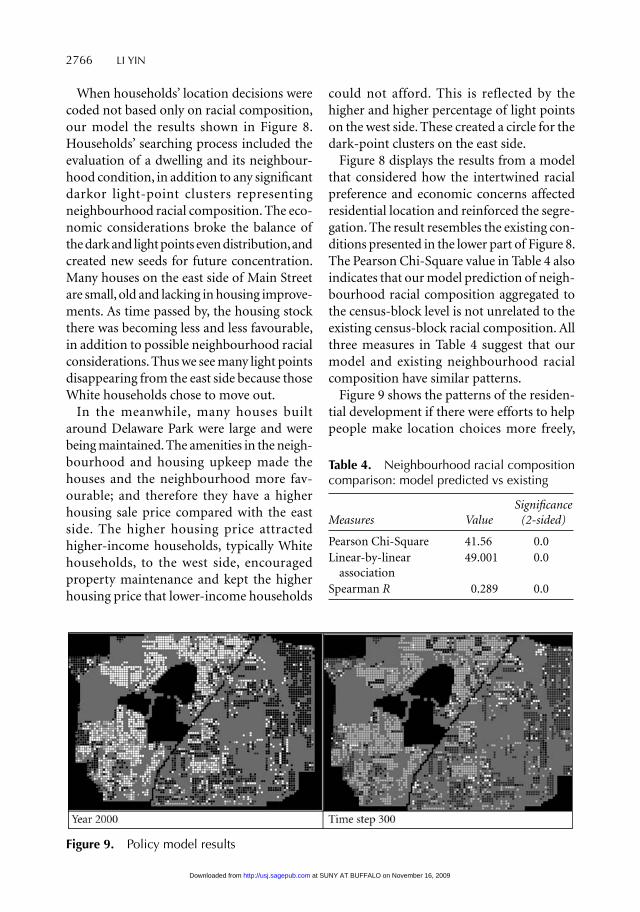
Figure 9 shows the patterns of the residen-tial development if there were efforts to help people make location choices more freely,
Table 4. Neighbourhood racial composition comparison: model predicted vs existing
Measures Value Signifi cance
(2-sided)
Pearson Chi-Square 41.56 0.0Linear-by-linear
association49.001 0.0
Spearman R 0.289 0.0
Figure 9. Policy model results
at SUNY AT BUFFALO on November 16, 2009 http://usj.sagepub.comDownloaded from
RESIDENTIAL SEGREGATION IN BUFFALO 2767
free of economic constraints. The ‘Year 2000’ map is the initial state and also the end state from the segregation model as presented in Figure 8. the ‘Time Step 300’ map shows how the study area looks after years of inte-gration efforts. The policy model suggests that building integrated communities out of segregated ones is not an easy job. It will take both economic resources and time. After a certain length of time—one or two decades if the current development pace continues in the city—segregation had been lessened to some extent. This is, however, under the condition that households are not extreme in terms of their attitude to neighbourhood racial composition. The result suggests that, if people are not extremely racially sensi-tive, it is possible, with the help of economic resources, to rebuild a neighbourhood out of segregation.
Conclusion
This paper builds on Schelling (1971) to study the racial segregation dynamics that emerge from interrelated racial and economic factors using the agent-based approach. We have explored patterns of residential segregation and the evolution of residential segregation as a result of individual choices made based on the neighbourhood racial and economic composition in the City of Buffalo. In addition to the racial considerations that have been widely used in many segregation models, we added dwellings and neighbourhood char-acteristics and economic considerations as indicated by housing prices. Our models show that racial considerations alone are not adequate to model the dynamics of resi-dential segregation. By adding economic factors, this research has been able to re-create the segregation pattern observed in the real world, in the City of Buffalo. These two factors are interrelated and mutually reinforced to contribute to the continuation
of segregation. This research shows that the agent-based approach allows researchers to explore the interdependent and interactive effects of racial composition as well as hous-ing conditions in a neighbourhood experi-encing residential segregation to gain an understanding of the driving-forces behind the segregation.
A simple policy model also suggests that it is possible to build an integrated commun-ity out of a segregated one if people are not extremely racially sensitive and with some eco-nomic resources to help make their location decisions. People in Buffalo have witnessed deteriorating housing in many communities in the city and a shortage of affordable housing opportunities for households in the suburban neighbourhoods that worsens the segregation problem. The agent-based segregation model can help to set a stage for a public dialogue about the collective impact of residential location choices on residential segregation in the city. Simulations devel-oped in this research support the incorpor-ation of our behavioural understanding of residential segregation into segregation models for policy-makers. These simulations are not only mechanically simple to under-stand because of the use of behaviour rules for households, but also easy to include and to evaluate the government policies, restric-tions, incentives and disincentives that might be used to affect household decision-making and the aggregate level of residential segre-gation. It might be used as a tool to infl uence how policy-makers guide residential devel-opment patterns. The City of Buffalo needs to develop programmes to empower families to make a truly free and informed choice about where they live, to deal with problems of deteriorating housing in highly segre-gated neighbourhoods and to create more opportunities for families in the racially and income mixed neighbourhoods. Developing mixed-income neighbourhoods in the city
at SUNY AT BUFFALO on November 16, 2009 http://usj.sagepub.comDownloaded from
2768 LI YIN
and in the suburbs can help create a more positive socioeconomic and racially balanced residential environment.
Future Research and Limitations
Future research can apply such agent-based models to other areas with not only Black–White segregation but also segregation between other racial or ethnic populations. The use of the agent-based approach allows modelling more than two ethnic groups or sub-groups by adding more types of agent with different characteristics. Moreover, a different set of variables or an increased num-ber of variables that may better capture the driving-forces behind segregation in other areas can be used or added. Models built in this paper included only a limited number of variables to refl ect economic factors. More sophisticated variables such as income, policy and institutional variables can be used. For ex-ample, a church that people go to every week and do not want to move away from may be included as an institutional variable. Future research can also formulate models that help us to understand the relative importance of racial and economic factors in forming racial segregation.
There are, however, some limitations for developing such agent-based models. The availability of micro-level data on racial and economic composition for some cities may hinder the application of such models. Data accuracy and resolution are usually critical for constructing such models. Model validation is another challenge for ABM to test the model results scientifi cally.
Acknowledgements
The author would like to thank the anonymous reviewers and the Editor for their constructive comments, together with colleagues at the Department of Urban and Regional Planning, the State University of New York at Buffalo, especially G. William Page, Ernest Sternberg and
Henry Louis Taylor for their support. The author’s appreciation also goes to graduate student Hao Huang for assistance with data collection and data processing.
References
Auigley, J. M. (1985) Consumer choice of dwelling, neighborhood and public services, Regional Science and Urban Economics, 15, pp. 41–63.
Bartik, T. J. (1988) Measuring the benefi ts of amenity improvements in hedonic price models, Land Economics, 64(2), pp. 172–183.
Benenson, I., Omer, I. and Hatna, E. (2002) Entity-based modeling of urban residential dynamics: the case of Yaffo, Tel Aviv, Environment and Planning B, 29, pp. 491–512.
Butler, A., Taylor, H. L. Jr and Ryu, D. (1990) Work and black neighborhood life in Buffalo, 1930–1980, in: H. L. Taylor, Jr (Ed.) African Americans and the Rise of Buffalo’s Post-industrial City, 1940 to Present, Vol. 2, 129-156. Buffalo, NY: Buffalo Urban League Inc.
Charles, C. Z. (2000) Neighborhood racial-composition preferences: evidence from a multiethnic metropolis, Social Problems, 47(3), pp. 379–407.
Charles, C. Z. (2003) The dynamics of racial resi-dential segregation, Annual Review of Sociology, 29, pp. 167–207.
Chin, T. L. and Chau, K. W. (2003) A critical re-view of literature on the hedonic price model, International Journal for Housing Science and Its Applications, 27(2), pp. 145–165.
City of Buffalo (2004) The Queen City in the 21st century: Buffalo’s comprehensive plan. Offi ce of Strategic Planning.
Clark, D. E. and Herrin, W. E. (2000) The impact of public school attributes on home sale prices in California, Growth and Change, 31(3), pp. 385–407.
Clark, W. (1989) Revealed preferences and neighborhood transitions in a multiethnic setting, Urban Geography, 10, pp. 434–448.
Clark, W. (1992) Residential preferences and residential choices in a multiethnic context, Demography, 29, pp. 451–466.
Clark, W. (2002) Ethnic preferences and ethnic perceptions in multi-ethnic settings, Urban Geography, 23(3), pp. 237–256.
at SUNY AT BUFFALO on November 16, 2009 http://usj.sagepub.comDownloaded from
RESIDENTIAL SEGREGATION IN BUFFALO 2769
Cutler, D. M., Glaeser, E. L. and Vigdor, J. L. (1999) The rise and decline of the American ghetto, Journal of Political Economy, 107, pp. 455–506.
Darden, J. (1987) Choosing neighbors and neighborhoods: the role of race in housing preference, in: G. Tobin (Ed.) Divided Neigh-borhoods: Changing Patterns of Racial Segre-gation, pp. 15–42. Newbury Park, CA: Sage Publications.
Darden, J. and Kamel, S. (2000) Black resi-dential segregation in the city and suburbs of Detroit: does socio-economic status matter?, Journal of Urban Affairs, 22, pp. 1–14.
Darling, A. H. (1973) Measuring the benefi ts of urban water parks, Land Economics, 49, pp. 22–34.
Do, A. Q. and Grudnitski, G. (1995) Golf courses and residential house prices: an empirical examination, Journal of Real Estate Finance and Economics, 10(3), pp. 261–270.
Eaddy, W. R., Sawyer, C. A., Shimizu, K. et al. (2003) Residential segregation, poverty, and racism: obstacles to America’s great society. Lawyers’ Committee for Civil Rights Under Law, Washington, DC.
Emerson, M. O., Yancey, G. and Chai, K. J. (2001) Does race matter in residential segrega-tion? Exploring the preferences of White Americans, American Sociological Review, 66, pp. 922–935.
Epstein, J. M. and Axtell, R. (1996) Growing Artifi cial Societies: Social Science from the Bottom Up. Washington, DC: Brookings Institution Press.
Farley, R. and Frey, W. H. (1993) Latino, Asian, and black segregation in multi-ethnic metro areas: fi ndings from the 1990 census. Research Report No. 93-278, Population Studies Center, University of Michigan.
Farley, R., Fielding, E. and Krysan, M. (1997) The residential preferences of Blacks and Whites: a four-metropolis analysis, Housing Policy Debate, 8, pp. 763–800.
Fossett, M. and Waren, W. (2005) Overlooked im-plications of ethnic preferences for residential segregation in agent-based models, Urban Studies, 42(11), pp. 1893–1917.
Freeman, R. (1998) War of the models: which labour market institutions for the 21st century?, Labour Economics, 5(1), pp. 1–24.
Galster, G. C. (1987) Homeowners and Neigh-borhood Reinvestment. Durham, NC: Duke University Press.
Gerber, D. A. (1989) The Making of an American Pleuralism: Buffalo, New York, 1825–60. Urbana, IL: University of Illinois Press.
Goodman, A. (1977) A comparison of block group and census tract data in a hedonic housing price model, Land Economics, 53, pp. 483–487.
Ihlanfeldt, K. R. and Scafi di, B. (2002) Black self-segregation as a cause of housing segregation: evidence from the multi-city study of urban inequality, Journal of Urban Economics, 1(2), pp. 366–390.
Janssen, M. A. and Ostrom, E. (2006) Empirically based, agent-based models, Ecology and Society, 11(2), article 37 (http://www.ecologyandsociety.org/vol11/iss2/art37/; accessed November 2007).
Jargowsky, P. A. (1997) Poverty and Place: Ghettos, Barrios, and the American City. New York: Russell Sage Foundation.
Jud, G. D. and Watts, J. M. (1981) Schools and housing value, Land Economics, 57(3), pp. 459–470.
Kiel, K. A. and Zabel, J. E. (2002) House price differentials in U.S. cities: household and neighborhood racial effects, Journal of Housing Economics, 5, pp. 143–165.
Laurie, A. J. and Jaggi, N. K. (2003) Role of ‘vision’ in neighbourhood racial segregation: a variant of the Schelling segregation model, Urban Studies, 40(13), pp. 2687–2704.
Li, M. M. and Brown, H. J. (1980) Micro-neighbourhood externalities and hedonic hous-ing prices, Land Economics, 56(2), pp. 125–141.
Massey, D. S. and Denton, N. A. (1988) The dimensions of residential segregation, Social Forces, 67, pp. 281–315.
Massey, D. S. and Denton, N. A. (1993) American Apartheid: Segregation and the Making of the Underclass. Cambridge, MA: Harvard University Press.
Neumann, J. von (1966) Theory of Self-reproduction Automata. Urbana, IL: University of Illinois Press.
Parker, D. C., Manson, S. M., Janssen, M. A. et al. (2003) Multi-agent systems for the simulation of land-use and landcover change: a review, Annals of the Association of American Geographers, 93, pp. 316–340.
at SUNY AT BUFFALO on November 16, 2009 http://usj.sagepub.comDownloaded from
2770 LI YIN
Price, A. D. (1990) Housing Buffalo’s black community, in: H. L. Taylor Jr (Ed.) African Americans and the Rise of Buffalo’s Post-industrial City, 1940 to Present, Vol. 2, pp. 89–111. Buffalo, NY: Buffalo Urban League Inc.
Quigley, J. M. (1985) Consumer choice of dwelling, neighborhood and public services, Regional Science and Urban Economics, 15(1), pp. 41–63.
Rand, W., Brown, D. G., Page, S. E. et al. (2003) Statistical validation of spatial patterns in agent-based models, in: Proceedings of Agent-Based Simulation 2003, Montpellier, France.
Richardson, H. W., Vipond, J. and Furbey, R. A. (1974) Determinants of urban house prices, Urban Studies, 11, pp. 189–199.
Rosen, S. (1974) Hedonic prices and implicit markers: product differentiation in pure com-petition, Journal of Political Economy, 82(1), pp. 34–55.
Schelling, T. C. (1971) Dynamic models of segre-gation, Journal of Mathematical Sociology, 1, pp. 143–186.
Schelling, T. C. (1978) Micromotives and Macro-behavior. New York: W. W. Norton.
Shultz, S. D. and King, D. A. (2001) The use of census data for hedonic price estimates of open-space amenities and land use, The Journal of Real Estate Finance and Economics, 22(2/3), pp. 239–252.
Spriggs, A. (1998) The effects of identity on resi-dential segregation, The Advocate’s Forum, 5(1), pp. 16–17.
Taeuber, L. E. and Taeuber, A. F. (1965) Negroes in Cities: Residential Segregation and Neighbor-hood Change. West Hanover, MA: Atheneum.
Taylor, H. L. Jr (Ed.) (1990) African Americans and the Rise of Buffalo’s Post-industrial City, 1940 to Present. Buffalo, NY: Buffalo Urban League Inc.
Taylor, H. L. Jr (1991) Social transformation theory, African Americans and the rise of Buffalo’s post-industrial city, Buffalo Law Review, 39, pp. 569–609.
Taylor, H. L. Jr (1996) Black in Buffalo: a late century report (http://wings.buffalo.edu/academic/department/apas/html/taylor-buffalo-2-25-96.html; accessed July 2006).
Tiebout, C. (1956) A pure theory of local ex-penditures, Journal of Political Economy, 64, pp. 416–424.
Trudeau, D. (2006) The persistence of segrega-tion in Buffalo, New York: Comer vs. Cisneros and geographies of relocation decisions among low-income black households, Urban Geography, 27, pp. 20–44.
US Census Bureau (1941) Sixteenth census of the United Sates, 1940: population and housing census tracts, Buffalo, New York. Washington, DC.
US Census Bureau (1980) 1980 census of popula-tion and housing. Summary File 1 and 3, North Eastern Division. Washington, DC.
US Census Bureau (1990) 1990 census of popula-tion and housing. Summary File 1 and 3, North Eastern Division. Washington, DC.
US Census Bureau (2000) 2000 census of popula-tion and housing. Summary File 1 and 3, North Eastern Division. Washington, DC.
Waitzman, N. J. and Smith, K. R. (1998) Separate but lethal: the effects of economic segregation on mortality in metropolitan America, Milbank Quarterly, 76, pp. 341–373.
Wilson, W. J. (1987) The Truly Disadvantaged: The Inner City, the Underclass, and Public Policy. Chicago, IL: University of Chicago Press.
Wong, D. (2004) Comparing traditional and spatial segregation measures: a spatial scale per-spective, Urban Geography, 25(1), pp. 66–82.
Wong, D. W. S. (1993) Spatial indices of segregation, Urban Studies, 30, pp. 559–572.
Yin, L. (2005) Assessing exurban residential market: an agent-based model, in: Proceedings of Agent 2005, Chicago, IL.
Yin, L. and Muller, B. (2007) Residential location and the biophysical environment: exurban development agents in a heterogeneous landscape, Environment and Planning B, 34, pp. 279–295.
Zhang, J. (2003) Residential segregation in an all-integrationist world, Journal of Economic Behavior & Organization, 54, pp. 533–550.
at SUNY AT BUFFALO on November 16, 2009 http://usj.sagepub.comDownloaded from