Embed Size (px)
Citation preview
ACCEPTE
D
The effects of biomass syngas composition, moisture, tar loading and operatingconditions on the combustion of a tar-tolerant HCCI engine
(doi:10.1016/j.energy.2015.04.076)
S. Bhaduria, F. Continob, H. Jeanmarta, E. Breuerc
a Universite catholique de Louvain, Institute of Mechanics, Materials and Civil Engineering (iMMC), Louvain-la-Neuve, BelgiumbVrije Universiteit Brussel, Department of Mechanical Engineering, Brussels, Belgium
cBreuer Technical Development, Malmedy, Belgium
Abstract
Syngas, from biomass gasification, needs to be purified of condensible tars before being used as a fuel for sparkignition engines. A novel tar tolerant system is being developed, wherein a Homogeneous Charge CompressionIgnition (HCCI) engine is fueled by impure syngas at intake temperatures above the tar dew point, thus avoiding thecondensation of tars and its consequent problems. This paper introduces the novel concept and studies the sensitivitiesof HCCI combustion to key context relevant issues such as the variations in the combustible composition (H2:CO ratiofrom 30:70 to 55:45 %), moisture (up to 12% by volume) and tars (from 3.5-17 g/Nm3) at intake temperatures around250◦C. The effects of intake temperature (230-270◦C) and pressure (1.0-1.2 bar) are also studied. The experiments arecarried out with artificial syngas on a 435 cc mono-cylinder HCCI engine with a compression ratio of 12 and operatedat 1500 RPM. Indicated efficiencies about 35% and Indicated Mean Effective Pressures about 2.5 bar were achievedat equivalence ratios between 0.3-0.34. In the tested ranges, moisture delayed the combustion while the effect of tarswere insignificant.
Keywords: biomass, gasification, syngas, tars, water vapor, Homogeneous Charge Compression Ignition, HCCI
1. Introduction
Biomass gasification is a versatile process throughwhich a variety of biomass can be converted into agaseous fuel usable in Internal Combustion (IC) en-gines, steam boilers, etc. Combined Heat and Power(CHP) plants utilizing biomass gasification, in combi-nation with IC engines, can deliver high efficiencies ofconversion (up to 85% [1]) from the feedstock to energyand it is in this domain that the present work is relevant.
Raw “producer gas” or “syngas” from biomass gasi-fication is composed of CO, H2, CO2, CH4, N2, watervapor, tars, particulate matter and other trace gases. Oneof the main challenges that hinder the commercial appli-cation of the biomass-gasification-IC engine chain con-cerns the issue of tars. Tars are hydrocarbons heavierthan benzene which condense into liquid or solid forms
Email addresses: [email protected] (S.Bhaduri), [email protected] (F. Contino),[email protected] (H. Jeanmart),[email protected] (E. Breuer)
at ambient conditions. Since, the conventional SparkIgnition (SI) engine requires the intake charge temper-ature to be well below 100◦C for knock free operation,the hot syngas exiting from a gasifier (in the temperaturerange of 500 to 700◦C) needs to be cooled down. Thecooling process, while increasing the energy density ofthe syngas, results in the condensation of certain classesof tars, with their dew points being in the range of 200-250◦C. The condensation of tars lead to the tar relatedproblems of clogging and fouling of critical downstreamcomponents. Thus, in order to avoid/reduce recurringoperational and maintenance problems, the filtration oftar becomes a necessary step in the cooling stage of abiomass gasification based power plant. The domain oftar filtration poses many complex issues such as filter in-efficiencies, durability and maintenance of the purifica-tion systems along with environmental concerns arisingfrom the disposal of the filtered tars or filtration mediadue to the toxic nature of tars [2].
To overcome the tar related problems, much of the re-search and development in the domain of biomass gasi-
Preprint submitted to Elsevier June 19, 2015

ACCEPTE
D
fication can be classified into primary and secondarymeasures [3]. Primary measures focus on the develop-ment of better gasifier designs so as to reduce the pro-duction of tars within the gasifier, whereas, secondarymeasures focus on the destruction or filtration of tarsdownstream of the gasifier. The tar loading of the syn-gas depends on the type of gasifier and can range from100 g/Nm3 to as low as 20 mg/Nm3 [4]. The latter lowtar loading can be attributed to the effectiveness of pri-mary measures such as the development of two-stagedowndraft gasifiers. A review of such measures can befound in [3]. IC engines, on the other hand, pose strin-gent requirements on the syngas quality with tar loading<50 mg/Nm3 [4]. The gap between the primary mea-sures and the engine requirements have to be met bythe secondary measures of tar purification, a review ofwhich can be found in [5].
As an example of the challenges faced by primaryand secondary measures, consider a modern two-stagedowndraft gasifier of about 200 kWthermal capacity, in-stalled at the authors’ laboratory [6]. It is a scaled downversion of a commercial 300 kWelectrical NOTAR® in-dustrial gasifier designed by Xylowatt s.a. of Belgiumin collaboration with the Universite catholique de Lou-vain. It produces a syngas with tar content less than 20mg/Nm3 as a consequence of primary measures whichresult in an improved gasifier design [7]. However, thesyngas quality (tar content) fluctuates during transientoperations, thus necessitating the use of secondary mea-sures to ensure consistent syngas quality.
Given the challenges posed by the issue of tars, theobjective of this paper is to present some studies relatedto an alternative and novel concept being developed atthe authors’ laboratory, which aims to make the IC en-gine section of the biomass-gasification-IC engine chainas “tar tolerant”. If this is achieved, it would bypass orreduce the need of tar filtration altogether. This paper isdivided into three broad sections. The first section pro-vides a brief overview of the novel method which alsoincludes a review of the relevant literature on HCCI en-gines operated on biomass syngas, along with listing thespecific issues related to the concept and those whichare a subject of this paper. The second section discussesthe test-bench design and characteristics, experimentalprocedure and the post processing methodologies usedfor the experiments. In the final section, the experimen-tal results are presented, followed by a concluding sec-tion.
2. HCCI engine fueled by unprocessed syngas - thenovel concept
The problems related to tars can be reduced to prob-lems related to tar condensation. Thus, a system canbe developed where the average temperature of a tarloaded syngas is kept above the tar dew point, till thepoint of combustion. Bergman et al. classified the tarcompounds into six main classes, with the class 5 tarsdominating the tar dew point [8]. The dew point of class5 tars at a concentration of about 1 g/Nm3 was found tobe about 250◦C, and thus the investigations presentedin this paper were carried around this value of intaketemperature. Tars, being hydrocarbons, would eventu-ally be consumed as part of the fuel in the combustionchambers of the engine. A suitable alternative to the SIengine, which can operate with such high intake temper-atures, is the Homogeneous Charge Compression Igni-tion (HCCI) engine.
The HCCI engine combines the features of premixedhomogeneous charge (fuel+air), as in a SI engine, withcombustion driven by auto-ignition, as in a Compres-sion Ignition (CI) engine. Since the pressure and tem-perature of the compressed charge is generally uniformthroughout the combustion chamber volume, the au-toignition occurs at multiple points, thus eliminating theneed of typical flame-front driven stoichiometric com-bustion, found in the SI engine. This ability to oper-ate at lean burn condition allows the HCCI operationto achieve low combustion temperatures which causes asubsequent decrease in Nitrous Oxide (NOx) emissions.The HCCI engine also has the ability to be adapted to awide variety of fuels and operating conditions. For anextensive review, the readers are referred to [9].
Biomass syngas as a fuel for SI engines has beenexplored by a number of authors, as reviewed in [10].However, syngas as a fuel for HCCI engines has beenexplored only recently. A common issue studied in thisdomain concerns the coupling of real-time variations inthe syngas composition to the inherently high sensitiv-ity of HCCI combustion to the fuel chemistry. Thesesyngas variations can be characterized in terms of varia-tions in the volumetric concentration of H2 and CO, rep-resented in the form of H2:CO share of the combustiblepart of the syngas. Variations in the inert componentsof syngas (N2 and CO2) also significantly influence thecombustion through indirect means such as changingthe ratio of specific heat of the charge mixture [11].
Yamasaki et al. found that the H2 component of thesyngas affects the HCCI combustion timing and heat re-lease rates significantly, whereas the CO contributes tothe overall performance due to its late combustion in
2
ACCEPTE
D
the cycle [12]. This was shown more conclusively, andwith greater detail, through the use of CHEMKIN sim-ulations and artificial syngas experiments, in a recentpaper by Yamasaki and Kaneko [11]. Similar studieshave been carried out by Haddith and Sobiesiak with avariation in the H2/CO ratio from 29:71 to 57:43 [13].Bika et al. used combinations of simplified syngas withH2 and CO as the only components [14]. Achilles etal. compared the performance of an HCCI engine be-tween a particular composition of syngas and naturalgas and found that the both gases were comparable inperformance in the ranges investigated [15]. In sum-mary, the following characteristics can be observed re-garding these works:
1. They were limited to Intake Temperatures (Tin)<200◦C and compression ratio (τ) >20.
2. The objectives were to explore the HCCI engine asan alternative to the conventional SI engine, in thecontext of pure and cold syngas.
3. There was no mention of the possibility of hightemperature HCCI operation for addressing the tarissues.
4. Only dry syngas mixtures were studied, which istypical in the case of cooled syngas.
The motivations, within which the studies of this pa-per have been conducted, differ from the aforemen-tioned works due its focus on the high temperatureHCCI combustion of syngas-air mixtures so as to be tartolerant.
2.1. Challenges of the concept
In order to explore the viability of this concept, thefollowing broad issues can be foreseen:
1. Testing the capability of tar tolerance.2. Power de-rating.3. Maturity of the HCCI technology.4. Performance/Sensitivities of HCCI combustion to
syngas characteristics and operating conditions.
Although, in principle, operation at high tempera-tures would avoid tar condensation, this ability couldbe challenged by the fact that operational constraintsmay require the engine body to be operated at muchcooler temperatures, and thus may lead to some chancesof deposition. Additionally, the subsequent destruc-tion of tars through combustion may be hindered bypockets of incomplete combustion, which are a majorcause of CO and HC emissions in a HCCI engine [16].While, measurements of tar deposits would require ex-periments with long hours of operation with tar loaded
syngas (for example see [17]), to assess the destruc-tion of tars, Gas Chromatography/Mass Spectroscopy(GC/MS) measurements at the intake and the exhaustcould be carried out. The high temperatures of combus-tion may also lead to the polymerization of tars into sootparticles, which can add to emission concerns and thusmust be accounted for.
The second issue of power de-rating is primarily be-cause of the low calorific value of syngas and is alsoa matter of concern for SI engine applications usingsyngas[18]. Haggith et al. found that at low equiva-lence ratios, which is the domain of HCCI engines, thecalorific values of syngas-air mixtures are comparableto those of fossil fuel-air mixtures [? ]. However, in thepresent context, the effects of de-rating shall be moresignificant due to the high intake temperatures involvedcombined with the low knock-limited equivalence ra-tios, characteristic of the HCCI engines. The de-ratingissue could be addressed using techniques such as Ex-haust Gas Recirculation [19] or intake boosting [20], forexample.
The third issue concerns the maturity of the HCCItechnology, which as of today is instrument intensivedue to the lack of any direct control on the combustiontiming. The performance and control of HCCI com-bustion is often carried out using the costly and so-phisticated in-cylinder pressure measurement systems,thus adding to the problems. HCCI engines also sufferfrom high sensitivities to operating conditions, combus-tion history, and other parameters, thus requiring carefulmonitoring.
All these issues are not in the scope of this paper or inthe capability of the current experimental setup. How-ever, work is under way to address the power de-ratingissues using EGR, which will be the subject of a futurepaper.
2.2. Objectives of this paper
The objectives of this paper are limited to studyingthe performance and the sensitivities of HCCI combus-tion to a few key parameters, which would form a neces-sary base for the exploration of the research challengesdiscussed in the previous subsection. The factors ex-plored in this paper concern the sensitivity and perfor-mance of the HCCI combustion in response to:
1. Variations in the H2:CO ratio of syngas.2. Syngas moisture content.3. Syngas tar content.4. Operational parameters of intake pressure, pin, and
temperature, Tin.
3
ACCEPTE
D
To bring out the main tendencies between the causesand their consequences, the experimental proceduremust be characterized by repetition, reliability and pre-cise control of the influencing factors. Hence, in thisstudy, idealized syngas compositions with simplifiedadditives (which simulate the moisture and tar impu-rities) have been used in an industrially non-relevantair cooled mono-cylinder engine, which allows for theflexibility of the experiments. Therefore, variations be-tween the results presented here and those that maybe attained in more realistic circumstances must be ex-pected.
The performance of HCCI combustion has been eval-uated in terms of parameters such as the Indicated Ef-ficiency (IE), the Combustion Efficiency (CE), the In-dicated Mean Effective Pressure (IMEP) and the emis-sions of NOx and CO. To explore the combustion behav-ior following parameters were considered: CA50 whichis defined as the Crank Angle Degree (CAD) associatedwith 50% of the fuel heat release, the combustion du-ration which is defined as the difference between theCA90 and the CA10 CAD positions corresponding tothe 90% and the 10% of the fuel heat release in the cy-cle, and the Maximum Pressure Rise Rate (MPRR).
Based on the experimental requirements, an appro-priate test bench and associated experimental procedurehas been developed, as described in the next section.This is followed by a section describing the experimen-tal results of this paper.
3. Experimental setup and methodology
HCCI combustion is sensitive to many parameters,of which the major ones are the compression ratio (τ),pin, Tin and the fuel chemistry. The first subsection dis-cusses the Computational Fluid Dynamics (CFD) stud-ies carried out to determine the optimal engine and testbench characteristics, for experimenting in the currentcontext. This is followed by a description of the testbench hardware, post processing methods used for ana-lyzing the experimental data and uncertainty analysis.
3.1. Determination of main engine parameters
The main engine parameters were determined us-ing CFD simulations based on the Tabulation of Dy-namic Adaptive Chemistry (TDAC) method [21–24].The main constraints considered in this context were theCA50, the MPRR and the maximum cylinder pressure.CFD analysis was used to evaluate these parameters as itoutperforms zero dimensional models by taking into ac-count the temperature inhomogeneities that result from
heat transfers within the combustion chamber and thusleads to better estimates of the heat release rate and theignition timing. Contino et al. have validated the cur-rent CFD model and methodology in various contextsand have shown that it can be used to predict the maxi-mum pressure, the MPRR, as well as the ignition timingto a reasonable accuracy [21–24].
The mesh and simulation settings used in this con-text closely match the studies described in [23, 24].The mesh was axisymmetric and counted around 20,000cells at the Bottom Dead Center (BDC) of a 500 cc en-gine model. The turbulence model used was RNG k-ε.The kinetic mechanism1 used to describe the combus-tion of syngas included 112 chemical species and 587elementary reactions [25]. The simulations were per-formed at 1500 RPM to be relevant to the CHP con-text. A nominal syngas composition, from the two-stagegasifier in operation at the authors’ laboratory, was cho-sen for the computations (see Table 3). A small portion(5%) of exhaust gases, consistent with the air fuel mix-ture, was included in the initial composition to representthe impact of trapped exhaust gases. A completely ho-mogeneous mixture was assumed.
The objective was to observe the impacts of “input”parameters such as the τ, pin, Tin and the syngas to airequivalence ratio, φ, on the specific “output” parame-ters of CA50, MPRR and the IMEP. For good cycle ef-ficiency, CA50 limits were set between -5 to 10 CADaTDC ( after Top Dead Center) [26]. The MPRR, cor-related to the engine knock, was constrained to a max-imum of 10 bar/CAD. The maximum cylinder pressureof 100 bars was another of the constraints, but since theresults never crossed 60 bar, this aspect was not ana-lyzed further.
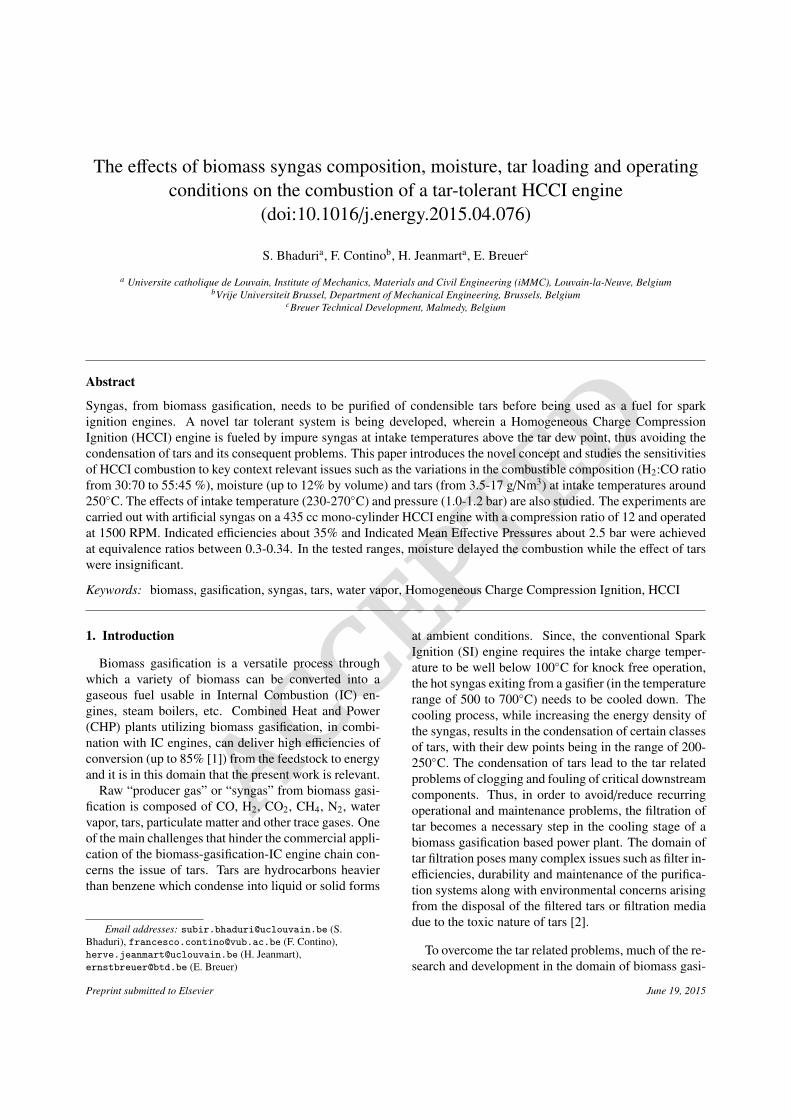
To begin with, the impact of engine geometry wasconsidered. High MPRR and maximum pressures beingcharacteristic of the HCCI engine, a diesel engine con-struction was assumed. The compression ratio, τ, wasgeometrically modified in the range of 10.5 to 13, whilekeeping the Tin at 250◦C and φ at 0.5. As seen in Figure1a the MPRR limit is crossed for τ >13. However, Fig-ure 1b shows that the CA50 crossed the −5 CAD linemuch before at τ=11.7. Since the CA50 constraint isnot rigid, the τ could be slightly higher, but must remainbelow 13 to respect the MPRR constraint.
The low Lower Heating Value (LHV) of syngas (≈5 MJ/kg), the high Tin resulting in the low volumetricefficiency and the low values of φ expected from HCCI
1The kinetic mechanism is available by contacting the authors andcan be downloaded from http://veroniquedias.github.com/
UCLouvain-Mechanism
4
ACCEPTE
D
(a)
1.05 1.23.5
10
13.5MPRR [bar/CAD]
τ=10.6
τ=11.7
τ=12.6
τ=13.0
(b)
1.05 1.2-9.5
-5
3CA50 [CAD ATDC]
τ=10.6
τ=11.7
τ=12.6
τ=13.0
(c)
1.05 1.23.6
4.3IMEP [bar]
Inlet pressure [bar]
τ=10.6
τ=13
Figure 1: CFD studies of a 500 cc HCCI engine with pure and dry syn-gas as fuel while keeping Tin at 250◦C and φ=0.5. The compressionratio τ effects the CA50 dramatically in Figure 1b which correspond-ingly results in increased MPRR as seen in Figure 1a. The IMEPhowever remains comparatively insensitive to the changes in the τ, asseen in Figure 1c. On the other hand pin has a small impact on theCA50 in Figure 1b and a moderate impact on the MPRR in Figure 1a,except above the 10 bar/CAD threshold. The IMEP in Figure 1c iswell correlated to the pin.
operation would result in low IMEP values. Thus, inorder to improve the IMEP, the effects of pin, φ and thesensitivity to the Tin were evaluated.
In Figure 1 the effect of the pin is investigated at eachτ. Around τ=12, all constraints were found to be ful-filled for the whole range of pin (see Figure 1b and Fig-ure 1a) while having a positive impact on the IMEP in
Figure1c. Thus the pin could accordingly act as an effi-cient way to control the work output of the engine. Onthe other hand, an increase in the τ showed a low impacton the IMEP, arising mainly due to the better thermo-dynamic efficiency, while resulting in improper phasing(CA50) and high MPRR.
At φ=0.5, the results were already on the edge of theconstraints and therefore, further increasing the equiv-alence ratio would not be an efficient way to improvethe IMEP without using any other strategy to mitigatethe corresponding rise in the MPRR. In fact, actual ex-periments presented in the following sections show thatthe MPRR limit is reached much before, with the φ ofabout 0.35. The value of Tin=250◦C considered in thisanalysis is based on the assumption of the nominal tardew point expected in general. However the tar dewpoint depends on various factors and can be lower, al-lowing for a lower Tin to be used. Simulating the engineat 230◦C showed better IMEP due to the increase in themass of fuel air mixture similar to an increase in pin.Unlike the case of a higher pin, reduction in the Tin alsodelayed the onset of the combustion which resulted inbetter ignition timing, lower MPRR and higher efficien-cies. The effect of variations in the syngas compositionwas not considered in this part of the study.
Based on this CFD analysis, an engine with τ=12 wasdetermined to be necessary along with a test bench sys-tem capable of delivering a variety of syngas composi-tions at the various pin and Tin discussed above.
3.2. Experimental test bench
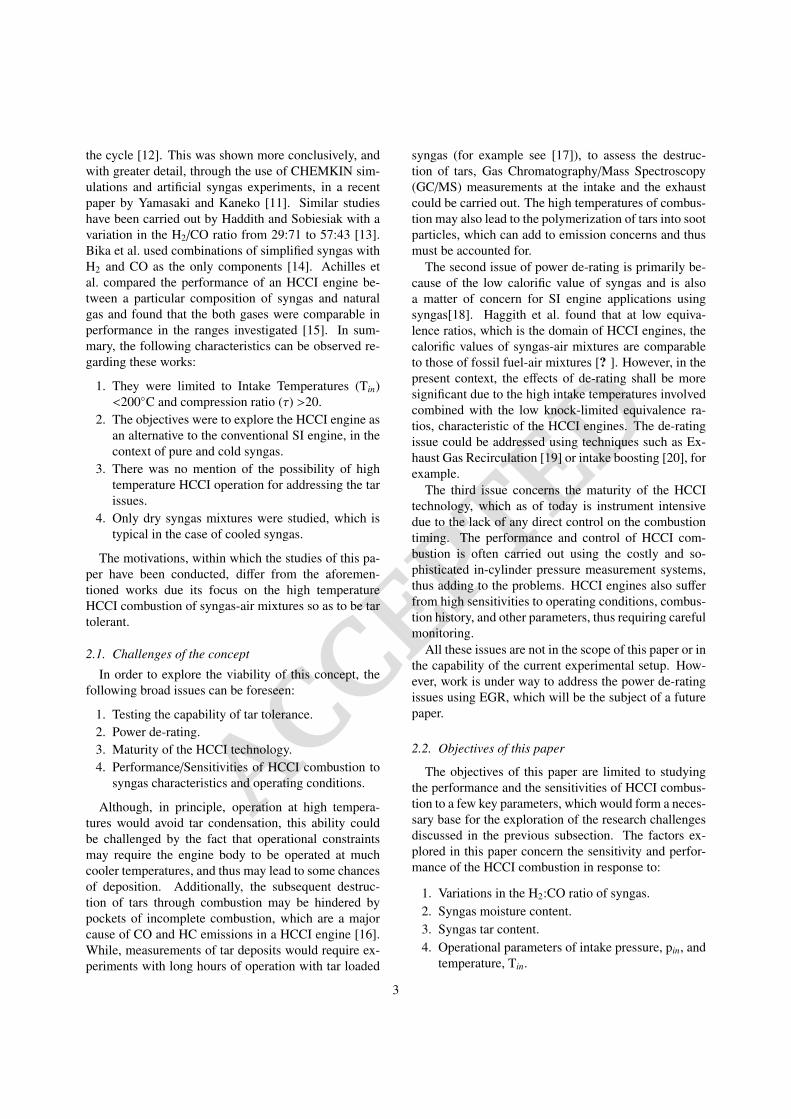
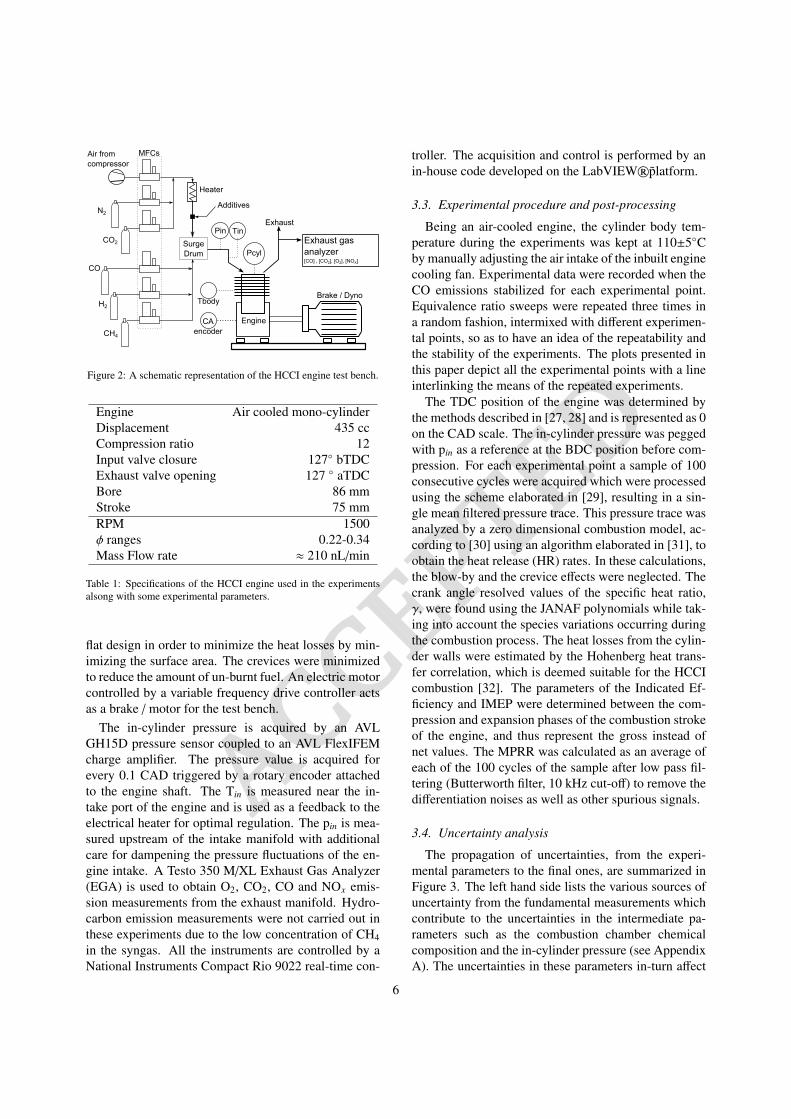
The schematic of the experimental setup is shown inFigure 2. Except for air, which is supplied from a com-pressor, all other gases are supplied from bottles. Theflow of gases, including air, are controlled by Brooksthermal Mass Flow Controllers (MFC). The inert com-ponents of the mixture (air, N2 and CO2) are passedthrough a 2 kW electric heater that can raise the in-take temperatures up to 270◦C. The heated inert gasesare mixed with the combustible gases (CO, H2, andCH4) in an appropriately sized drum which serves thedual purpose of creating a homogeneous mixture as wellas dampening the pressure fluctuations of the mono-cylinder engine intake. Additives such as the tars andthe water can be injected at the additives port before themixing drum.
The specifications of the air cooled mono-cylinderengine and some experimental data are tabulated in Ta-ble 1. The engine was originally a diesel engine with itsτ modified from 19 to the current 12. The piston com-bustion chamber was modified from a bowl shape to a
5
ACCEPTE
D
AirSfromcompressor
N2
CO2
CO
H2
CH4
Engine
BrakeS/SDyno
Heater
Pin Tin
Pcyl
CASencoder
SurgeDrum
ExhaustSgasSanalyzer[CO]SvS[CO2]vS[O2]vS[NOX]
Exhaust
Tbody
MFCs
Additives
Figure 2: A schematic representation of the HCCI engine test bench.
Engine Air cooled mono-cylinderDisplacement 435 ccCompression ratio 12Input valve closure 127◦ bTDCExhaust valve opening 127 ◦ aTDCBore 86 mmStroke 75 mmRPM 1500φ ranges 0.22-0.34Mass Flow rate ≈ 210 nL/min
Table 1: Specifications of the HCCI engine used in the experimentsalsong with some experimental parameters.
flat design in order to minimize the heat losses by min-imizing the surface area. The crevices were minimizedto reduce the amount of un-burnt fuel. An electric motorcontrolled by a variable frequency drive controller actsas a brake / motor for the test bench.
The in-cylinder pressure is acquired by an AVLGH15D pressure sensor coupled to an AVL FlexIFEMcharge amplifier. The pressure value is acquired forevery 0.1 CAD triggered by a rotary encoder attachedto the engine shaft. The Tin is measured near the in-take port of the engine and is used as a feedback to theelectrical heater for optimal regulation. The pin is mea-sured upstream of the intake manifold with additionalcare for dampening the pressure fluctuations of the en-gine intake. A Testo 350 M/XL Exhaust Gas Analyzer(EGA) is used to obtain O2, CO2, CO and NOx emis-sion measurements from the exhaust manifold. Hydro-carbon emission measurements were not carried out inthese experiments due to the low concentration of CH4in the syngas. All the instruments are controlled by aNational Instruments Compact Rio 9022 real-time con-
troller. The acquisition and control is performed by anin-house code developed on the LabVIEW®platform.
3.3. Experimental procedure and post-processing
Being an air-cooled engine, the cylinder body tem-perature during the experiments was kept at 110±5◦Cby manually adjusting the air intake of the inbuilt enginecooling fan. Experimental data were recorded when theCO emissions stabilized for each experimental point.Equivalence ratio sweeps were repeated three times ina random fashion, intermixed with different experimen-tal points, so as to have an idea of the repeatability andthe stability of the experiments. The plots presented inthis paper depict all the experimental points with a lineinterlinking the means of the repeated experiments.
The TDC position of the engine was determined bythe methods described in [27, 28] and is represented as 0on the CAD scale. The in-cylinder pressure was peggedwith pin as a reference at the BDC position before com-pression. For each experimental point a sample of 100consecutive cycles were acquired which were processedusing the scheme elaborated in [29], resulting in a sin-gle mean filtered pressure trace. This pressure trace wasanalyzed by a zero dimensional combustion model, ac-cording to [30] using an algorithm elaborated in [31], toobtain the heat release (HR) rates. In these calculations,the blow-by and the crevice effects were neglected. Thecrank angle resolved values of the specific heat ratio,γ, were found using the JANAF polynomials while tak-ing into account the species variations occurring duringthe combustion process. The heat losses from the cylin-der walls were estimated by the Hohenberg heat trans-fer correlation, which is deemed suitable for the HCCIcombustion [32]. The parameters of the Indicated Ef-ficiency and IMEP were determined between the com-pression and expansion phases of the combustion strokeof the engine, and thus represent the gross instead ofnet values. The MPRR was calculated as an average ofeach of the 100 cycles of the sample after low pass fil-tering (Butterworth filter, 10 kHz cut-off) to remove thedifferentiation noises as well as other spurious signals.
3.4. Uncertainty analysis
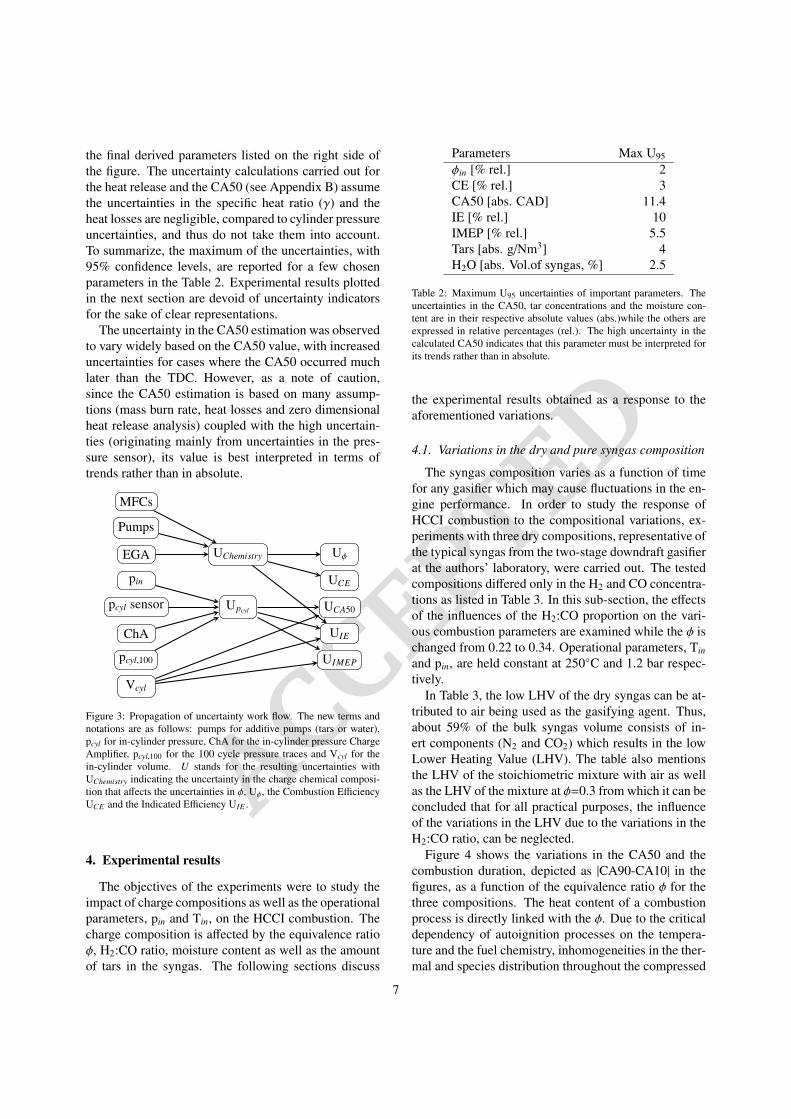
The propagation of uncertainties, from the experi-mental parameters to the final ones, are summarized inFigure 3. The left hand side lists the various sources ofuncertainty from the fundamental measurements whichcontribute to the uncertainties in the intermediate pa-rameters such as the combustion chamber chemicalcomposition and the in-cylinder pressure (see AppendixA). The uncertainties in these parameters in-turn affect
6
ACCEPTE
D
the final derived parameters listed on the right side ofthe figure. The uncertainty calculations carried out forthe heat release and the CA50 (see Appendix B) assumethe uncertainties in the specific heat ratio (γ) and theheat losses are negligible, compared to cylinder pressureuncertainties, and thus do not take them into account.To summarize, the maximum of the uncertainties, with95% confidence levels, are reported for a few chosenparameters in the Table 2. Experimental results plottedin the next section are devoid of uncertainty indicatorsfor the sake of clear representations.
The uncertainty in the CA50 estimation was observedto vary widely based on the CA50 value, with increaseduncertainties for cases where the CA50 occurred muchlater than the TDC. However, as a note of caution,since the CA50 estimation is based on many assump-tions (mass burn rate, heat losses and zero dimensionalheat release analysis) coupled with the high uncertain-ties (originating mainly from uncertainties in the pres-sure sensor), its value is best interpreted in terms oftrends rather than in absolute.
MFCs
Pumps
EGA
pin
pcyl sensor
ChA
pcyl,100
Vcyl
UChemistry
Upcyl
Uφ
UCE
UCA50
UIE
UIMEP
Figure 3: Propagation of uncertainty work flow. The new terms andnotations are as follows: pumps for additive pumps (tars or water),pcyl for in-cylinder pressure, ChA for the in-cylinder pressure ChargeAmplifier, pcyl,100 for the 100 cycle pressure traces and Vcyl for thein-cylinder volume. U stands for the resulting uncertainties withUChemistry indicating the uncertainty in the charge chemical composi-tion that affects the uncertainties in φ, Uφ, the Combustion EfficiencyUCE and the Indicated Efficiency UIE .
4. Experimental results
The objectives of the experiments were to study theimpact of charge compositions as well as the operationalparameters, pin and Tin, on the HCCI combustion. Thecharge composition is affected by the equivalence ratioφ, H2:CO ratio, moisture content as well as the amountof tars in the syngas. The following sections discuss
Parameters Max U95
φin [% rel.] 2CE [% rel.] 3CA50 [abs. CAD] 11.4IE [% rel.] 10IMEP [% rel.] 5.5Tars [abs. g/Nm3] 4H2O [abs. Vol.of syngas, %] 2.5
Table 2: Maximum U95 uncertainties of important parameters. Theuncertainties in the CA50, tar concentrations and the moisture con-tent are in their respective absolute values (abs.)while the others areexpressed in relative percentages (rel.). The high uncertainty in thecalculated CA50 indicates that this parameter must be interpreted forits trends rather than in absolute.
the experimental results obtained as a response to theaforementioned variations.
4.1. Variations in the dry and pure syngas composition
The syngas composition varies as a function of timefor any gasifier which may cause fluctuations in the en-gine performance. In order to study the response ofHCCI combustion to the compositional variations, ex-periments with three dry compositions, representative ofthe typical syngas from the two-stage downdraft gasifierat the authors’ laboratory, were carried out. The testedcompositions differed only in the H2 and CO concentra-tions as listed in Table 3. In this sub-section, the effectsof the influences of the H2:CO proportion on the vari-ous combustion parameters are examined while the φ ischanged from 0.22 to 0.34. Operational parameters, Tin
and pin, are held constant at 250◦C and 1.2 bar respec-tively.
In Table 3, the low LHV of the dry syngas can be at-tributed to air being used as the gasifying agent. Thus,about 59% of the bulk syngas volume consists of in-ert components (N2 and CO2) which results in the lowLower Heating Value (LHV). The table also mentionsthe LHV of the stoichiometric mixture with air as wellas the LHV of the mixture at φ=0.3 from which it can beconcluded that for all practical purposes, the influenceof the variations in the LHV due to the variations in theH2:CO ratio, can be neglected.
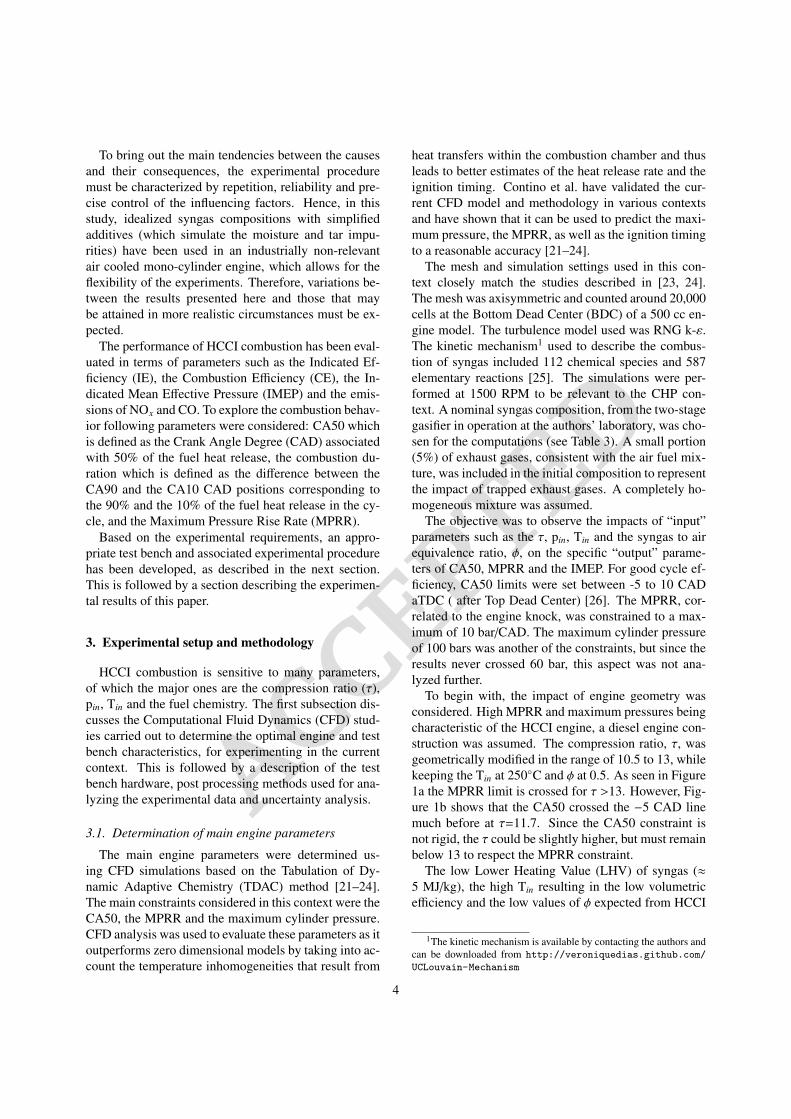
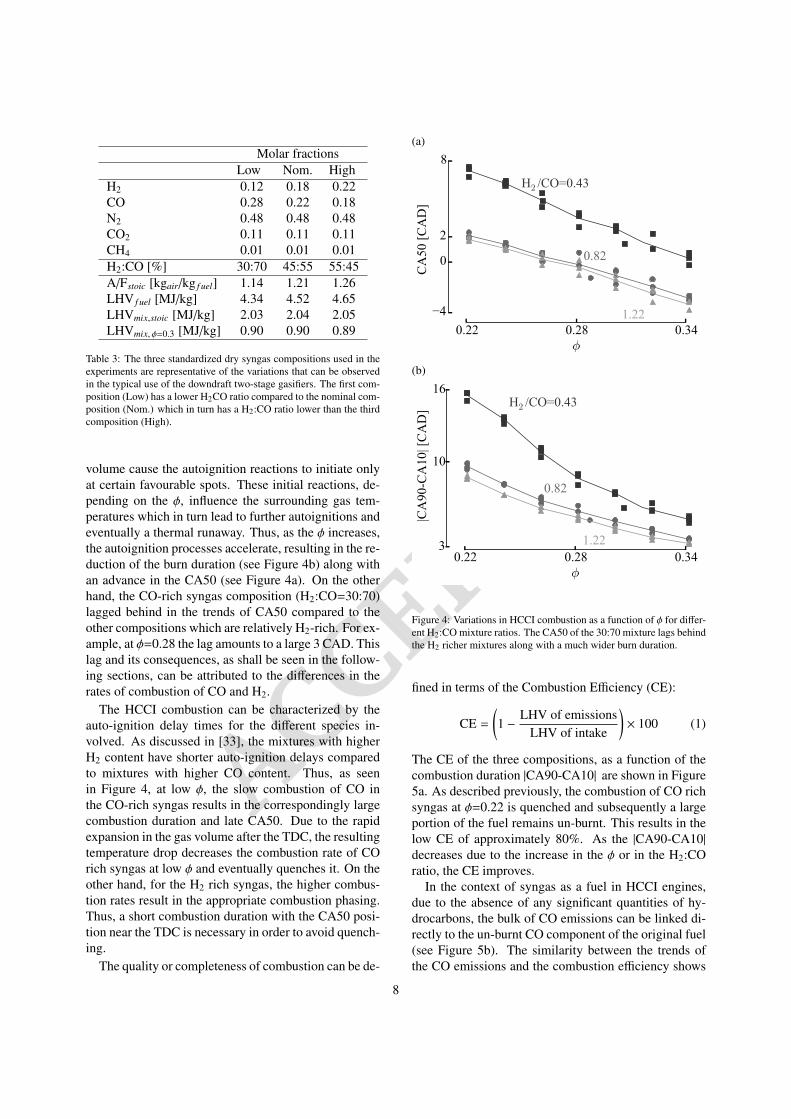
Figure 4 shows the variations in the CA50 and thecombustion duration, depicted as |CA90-CA10| in thefigures, as a function of the equivalence ratio φ for thethree compositions. The heat content of a combustionprocess is directly linked with the φ. Due to the criticaldependency of autoignition processes on the tempera-ture and the fuel chemistry, inhomogeneities in the ther-mal and species distribution throughout the compressed
7
ACCEPTE
D
Molar fractionsLow Nom. High
H2 0.12 0.18 0.22CO 0.28 0.22 0.18N2 0.48 0.48 0.48CO2 0.11 0.11 0.11CH4 0.01 0.01 0.01H2:CO [%] 30:70 45:55 55:45A/Fstoic [kgair/kg f uel] 1.14 1.21 1.26LHV f uel [MJ/kg] 4.34 4.52 4.65LHVmix,stoic [MJ/kg] 2.03 2.04 2.05LHVmix, φ=0.3 [MJ/kg] 0.90 0.90 0.89
Table 3: The three standardized dry syngas compositions used in theexperiments are representative of the variations that can be observedin the typical use of the downdraft two-stage gasifiers. The first com-position (Low) has a lower H2CO ratio compared to the nominal com-position (Nom.) which in turn has a H2:CO ratio lower than the thirdcomposition (High).
volume cause the autoignition reactions to initiate onlyat certain favourable spots. These initial reactions, de-pending on the φ, influence the surrounding gas tem-peratures which in turn lead to further autoignitions andeventually a thermal runaway. Thus, as the φ increases,the autoignition processes accelerate, resulting in the re-duction of the burn duration (see Figure 4b) along withan advance in the CA50 (see Figure 4a). On the otherhand, the CO-rich syngas composition (H2:CO=30:70)lagged behind in the trends of CA50 compared to theother compositions which are relatively H2-rich. For ex-ample, at φ=0.28 the lag amounts to a large 3 CAD. Thislag and its consequences, as shall be seen in the follow-ing sections, can be attributed to the differences in therates of combustion of CO and H2.
The HCCI combustion can be characterized by theauto-ignition delay times for the different species in-volved. As discussed in [33], the mixtures with higherH2 content have shorter auto-ignition delays comparedto mixtures with higher CO content. Thus, as seenin Figure 4, at low φ, the slow combustion of CO inthe CO-rich syngas results in the correspondingly largecombustion duration and late CA50. Due to the rapidexpansion in the gas volume after the TDC, the resultingtemperature drop decreases the combustion rate of COrich syngas at low φ and eventually quenches it. On theother hand, for the H2 rich syngas, the higher combus-tion rates result in the appropriate combustion phasing.Thus, a short combustion duration with the CA50 posi-tion near the TDC is necessary in order to avoid quench-ing.
The quality or completeness of combustion can be de-
(a)
0.22 0.28 0.34φ
4
0
2
8
CA
50 [C
AD
]
H2 /CO=0.43
0.82
1.22
(b)
0.22 0.28 0.34φ
3
10
16
|CA
90-C
A10
| [C
AD
] H2 /CO=0.43
0.82
1.22
Figure 4: Variations in HCCI combustion as a function of φ for differ-ent H2:CO mixture ratios. The CA50 of the 30:70 mixture lags behindthe H2 richer mixtures along with a much wider burn duration.
fined in terms of the Combustion Efficiency (CE):
CE =
(1 −
LHV of emissionsLHV of intake
)× 100 (1)
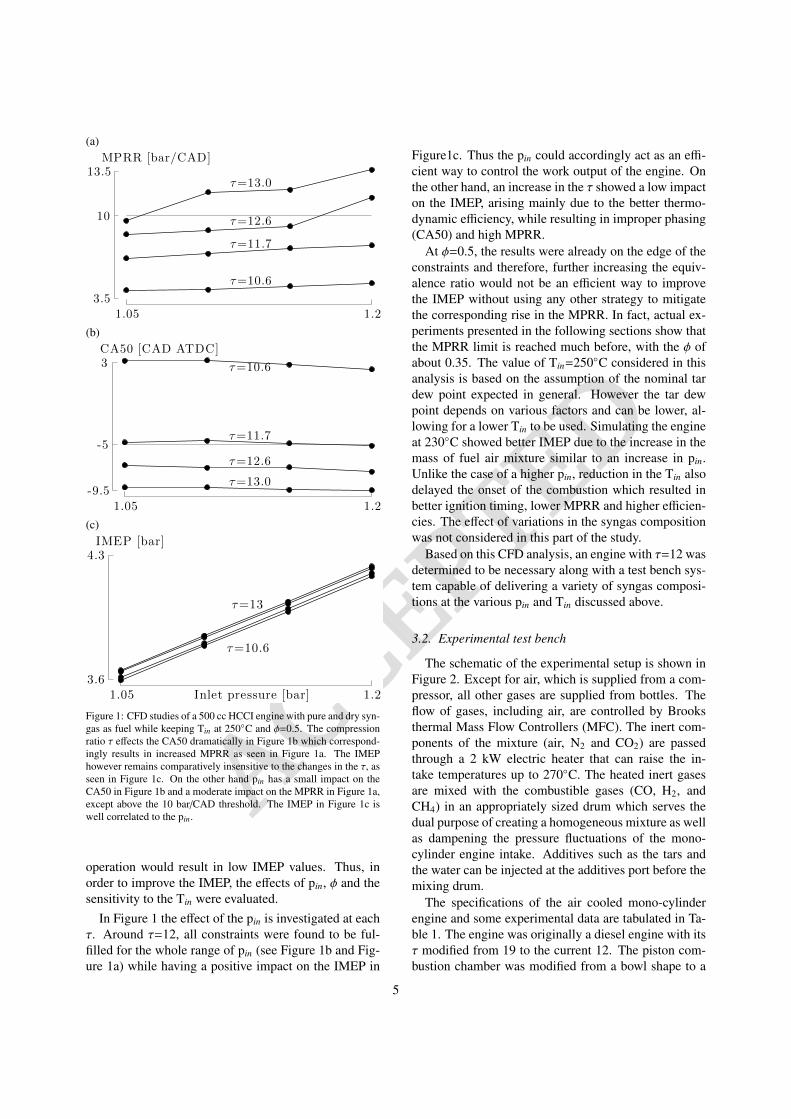
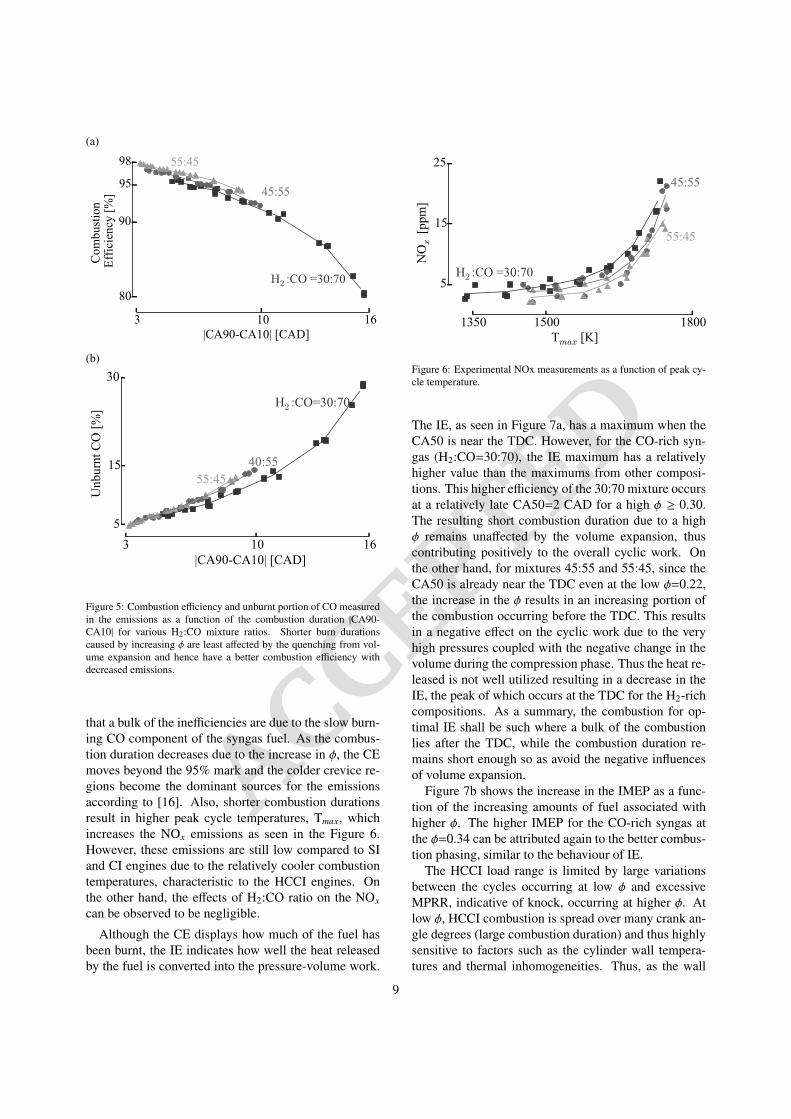
The CE of the three compositions, as a function of thecombustion duration |CA90-CA10| are shown in Figure5a. As described previously, the combustion of CO richsyngas at φ=0.22 is quenched and subsequently a largeportion of the fuel remains un-burnt. This results in thelow CE of approximately 80%. As the |CA90-CA10|decreases due to the increase in the φ or in the H2:COratio, the CE improves.
In the context of syngas as a fuel in HCCI engines,due to the absence of any significant quantities of hy-drocarbons, the bulk of CO emissions can be linked di-rectly to the un-burnt CO component of the original fuel(see Figure 5b). The similarity between the trends ofthe CO emissions and the combustion efficiency shows
8
ACCEPTE
D
(a)
3 10 16|CA90-CA10| [CAD]
80
90
95
98
Com
bust
ion
Eff
icie
ncy
[%]
H2 :CO =30:70
45:55
55:45
(b)
3 10 16|CA90-CA10| [CAD]
5
15
30
Unb
urnt
CO
[%] H2 :CO=30:70
40:5555:45
Figure 5: Combustion efficiency and unburnt portion of CO measuredin the emissions as a function of the combustion duration |CA90-CA10| for various H2:CO mixture ratios. Shorter burn durationscaused by increasing φ are least affected by the quenching from vol-ume expansion and hence have a better combustion efficiency withdecreased emissions.
that a bulk of the inefficiencies are due to the slow burn-ing CO component of the syngas fuel. As the combus-tion duration decreases due to the increase in φ, the CEmoves beyond the 95% mark and the colder crevice re-gions become the dominant sources for the emissionsaccording to [16]. Also, shorter combustion durationsresult in higher peak cycle temperatures, Tmax, whichincreases the NOx emissions as seen in the Figure 6.However, these emissions are still low compared to SIand CI engines due to the relatively cooler combustiontemperatures, characteristic to the HCCI engines. Onthe other hand, the effects of H2:CO ratio on the NOx
can be observed to be negligible.
Although the CE displays how much of the fuel hasbeen burnt, the IE indicates how well the heat releasedby the fuel is converted into the pressure-volume work.
1350 1500 1800Tmax [K]
5
15
25
NOx
[ppm
]
H2 :CO =30:70
45:55
55:45
Figure 6: Experimental NOx measurements as a function of peak cy-cle temperature.
The IE, as seen in Figure 7a, has a maximum when theCA50 is near the TDC. However, for the CO-rich syn-gas (H2:CO=30:70), the IE maximum has a relativelyhigher value than the maximums from other composi-tions. This higher efficiency of the 30:70 mixture occursat a relatively late CA50=2 CAD for a high φ ≥ 0.30.The resulting short combustion duration due to a highφ remains unaffected by the volume expansion, thuscontributing positively to the overall cyclic work. Onthe other hand, for mixtures 45:55 and 55:45, since theCA50 is already near the TDC even at the low φ=0.22,the increase in the φ results in an increasing portion ofthe combustion occurring before the TDC. This resultsin a negative effect on the cyclic work due to the veryhigh pressures coupled with the negative change in thevolume during the compression phase. Thus the heat re-leased is not well utilized resulting in a decrease in theIE, the peak of which occurs at the TDC for the H2-richcompositions. As a summary, the combustion for op-timal IE shall be such where a bulk of the combustionlies after the TDC, while the combustion duration re-mains short enough so as avoid the negative influencesof volume expansion.
Figure 7b shows the increase in the IMEP as a func-tion of the increasing amounts of fuel associated withhigher φ. The higher IMEP for the CO-rich syngas atthe φ=0.34 can be attributed again to the better combus-tion phasing, similar to the behaviour of IE.
The HCCI load range is limited by large variationsbetween the cycles occurring at low φ and excessiveMPRR, indicative of knock, occurring at higher φ. Atlow φ, HCCI combustion is spread over many crank an-gle degrees (large combustion duration) and thus highlysensitive to factors such as the cylinder wall tempera-tures and thermal inhomogeneities. Thus, as the wall
9
ACCEPTE
D
(a)
4 0 2 8CA50 [CAD]
28
30
35
37
Indi
cate
d E
ffic
ienc
y [%
]
H2 :CO =30:70
45:5555:45
(b)
0.22 0.28 0.34φ
1.6
2.0
2.8
IMEP
[bar
]
H2 :CO =30:70
45:55
55:45
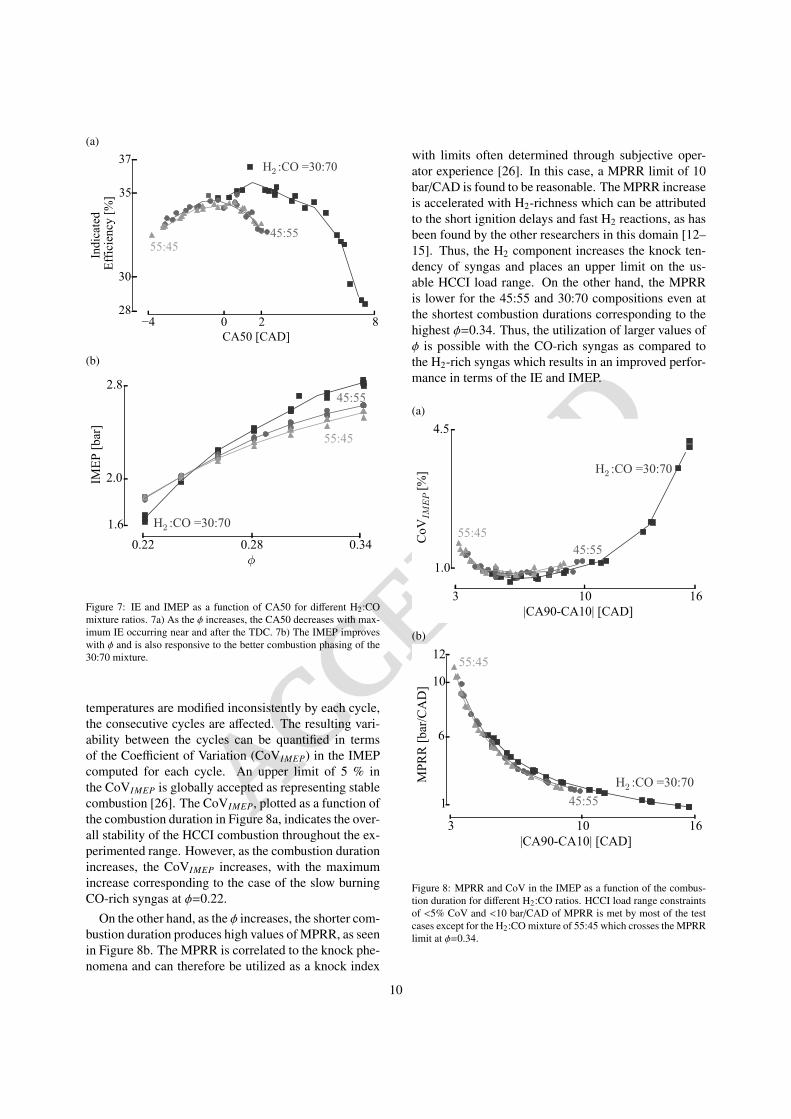
Figure 7: IE and IMEP as a function of CA50 for different H2:COmixture ratios. 7a) As the φ increases, the CA50 decreases with max-imum IE occurring near and after the TDC. 7b) The IMEP improveswith φ and is also responsive to the better combustion phasing of the30:70 mixture.
temperatures are modified inconsistently by each cycle,the consecutive cycles are affected. The resulting vari-ability between the cycles can be quantified in termsof the Coefficient of Variation (CoVIMEP) in the IMEPcomputed for each cycle. An upper limit of 5 % inthe CoVIMEP is globally accepted as representing stablecombustion [26]. The CoVIMEP, plotted as a function ofthe combustion duration in Figure 8a, indicates the over-all stability of the HCCI combustion throughout the ex-perimented range. However, as the combustion durationincreases, the CoVIMEP increases, with the maximumincrease corresponding to the case of the slow burningCO-rich syngas at φ=0.22.
On the other hand, as the φ increases, the shorter com-bustion duration produces high values of MPRR, as seenin Figure 8b. The MPRR is correlated to the knock phe-nomena and can therefore be utilized as a knock index
with limits often determined through subjective oper-ator experience [26]. In this case, a MPRR limit of 10bar/CAD is found to be reasonable. The MPRR increaseis accelerated with H2-richness which can be attributedto the short ignition delays and fast H2 reactions, as hasbeen found by the other researchers in this domain [12–15]. Thus, the H2 component increases the knock ten-dency of syngas and places an upper limit on the us-able HCCI load range. On the other hand, the MPRRis lower for the 45:55 and 30:70 compositions even atthe shortest combustion durations corresponding to thehighest φ=0.34. Thus, the utilization of larger values ofφ is possible with the CO-rich syngas as compared tothe H2-rich syngas which results in an improved perfor-mance in terms of the IE and IMEP.
(a)
3 10 16|CA90-CA10| [CAD]
1.0
4.5C
oVIM
EP [%
] H2 :CO =30:70
45:5555:45
(b)
3 10 16|CA90-CA10| [CAD]
1
6
10
12
MPR
R [b
ar/C
AD
]
H2 :CO =30:7045:55
55:45
Figure 8: MPRR and CoV in the IMEP as a function of the combus-tion duration for different H2:CO ratios. HCCI load range constraintsof <5% CoV and <10 bar/CAD of MPRR is met by most of the testcases except for the H2:CO mixture of 55:45 which crosses the MPRRlimit at φ=0.34.
10
ACCEPTE
D
4.2. Effect of ‘wet’ syngas
Raw syngas from biomass gasifier contains approxi-mately 10% of water by volume. Since the use of syn-gas in conventional IC engines has been concerned withcold, purified and dry compositions, the effects of mois-ture content on the engine performance has not been ex-plored widely. However water as an additive has beenstudied in IC engines operated with conventional fuelsfor its anti-knock effects as well for reducing the NOx
emissions, (for example see [34]). In case of HCCI en-gines operated with conventional fuels, the objective ofwater injection has been to control the ignition timingby manipulating the rates of combustion as discussed in[35].
Since the objective of the current work is to functionwith raw syngas, the pure and dry syngas discussed inthe previous section is moistened with water at varyingproportions to simulate real case scenarios. A peristalticpump has been used for injecting water into the hot gasflow just before the mixing drum so that the water isfully vaporised and is assumed to have become a part ofthe homogeneous fuel-air mixture. For the experiments,the syngas of nominal composition with H2:CO=45:55was chosen and the engine was operated at Tin=250◦Cand pin=1.2 bar. Experiments were carried out at threeφ values of 0.26, 0.30 and 0.34 while the volumetricpercentage of water in the syngas was varied from ap-proximately 4 to 12 %.
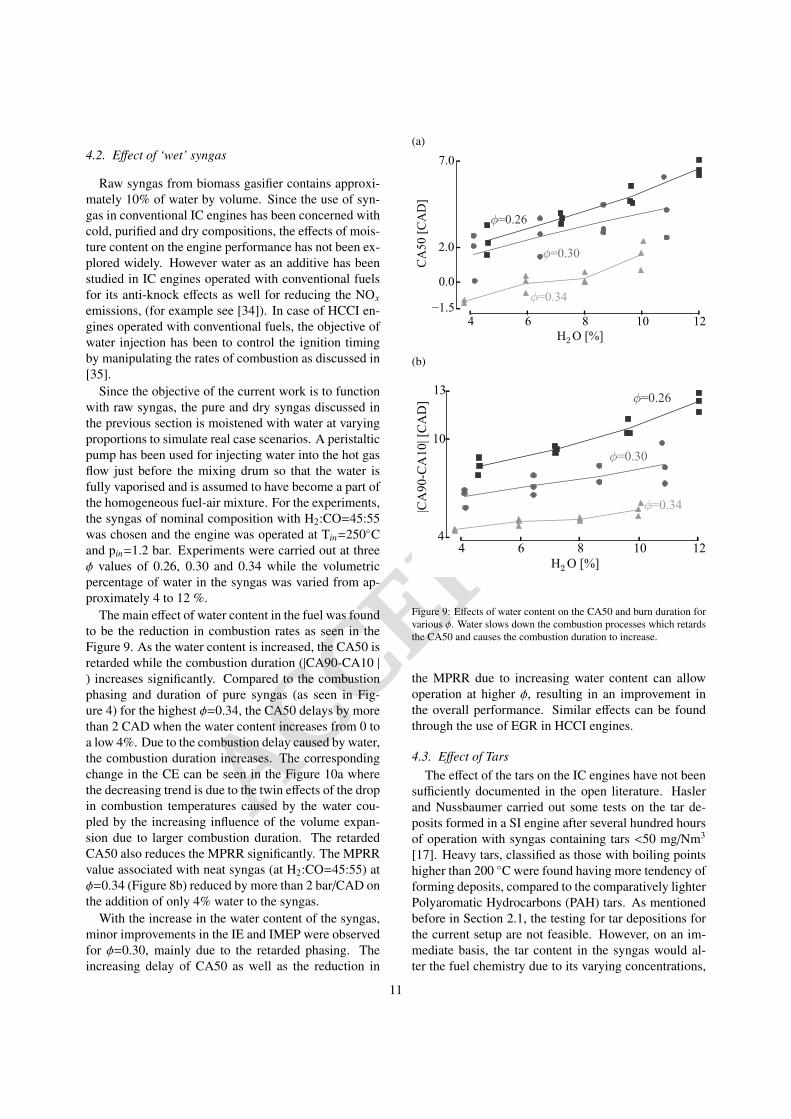
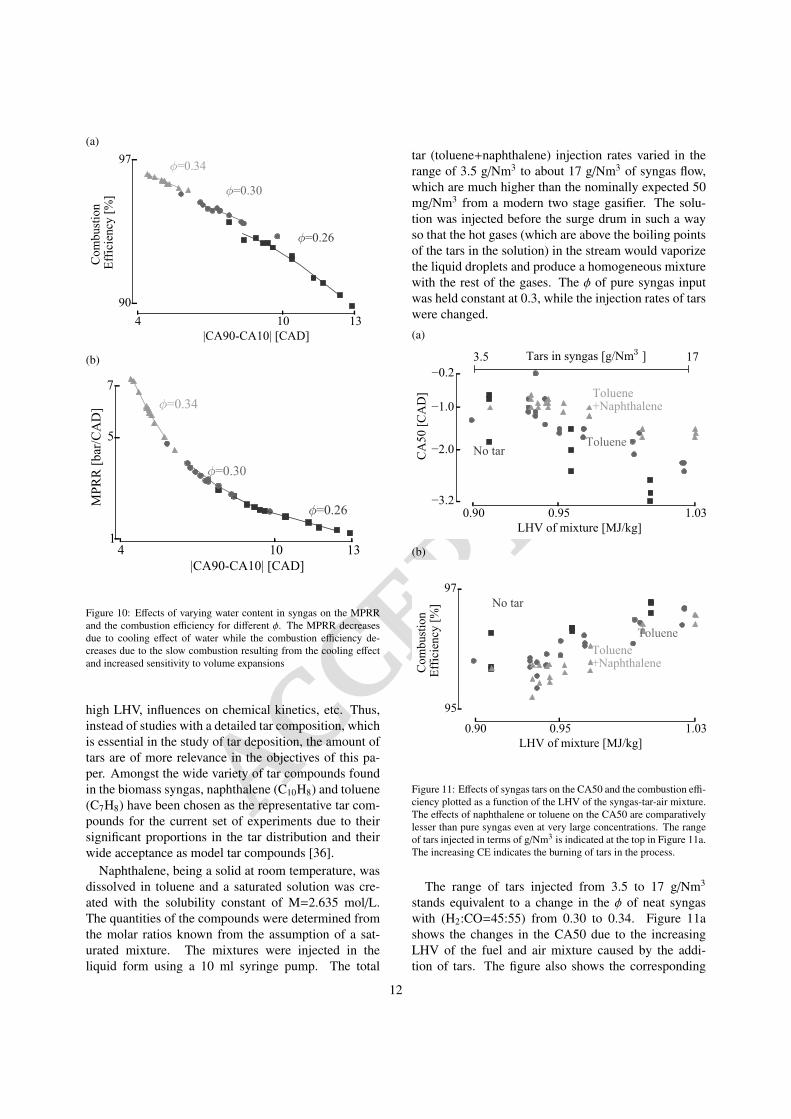
The main effect of water content in the fuel was foundto be the reduction in combustion rates as seen in theFigure 9. As the water content is increased, the CA50 isretarded while the combustion duration (|CA90-CA10 |) increases significantly. Compared to the combustionphasing and duration of pure syngas (as seen in Fig-ure 4) for the highest φ=0.34, the CA50 delays by morethan 2 CAD when the water content increases from 0 toa low 4%. Due to the combustion delay caused by water,the combustion duration increases. The correspondingchange in the CE can be seen in the Figure 10a wherethe decreasing trend is due to the twin effects of the dropin combustion temperatures caused by the water cou-pled by the increasing influence of the volume expan-sion due to larger combustion duration. The retardedCA50 also reduces the MPRR significantly. The MPRRvalue associated with neat syngas (at H2:CO=45:55) atφ=0.34 (Figure 8b) reduced by more than 2 bar/CAD onthe addition of only 4% water to the syngas.
With the increase in the water content of the syngas,minor improvements in the IE and IMEP were observedfor φ=0.30, mainly due to the retarded phasing. Theincreasing delay of CA50 as well as the reduction in
(a)
4 6 8 10 12H2 O [%]
1.5
0.0
2.0
7.0
CA
50 [C
AD
]
φ=0.26
φ=0.30
φ=0.34
(b)
4 6 8 10 12H2 O [%]
4
10
13
|CA
90-C
A10
| [C
AD
] φ=0.26
φ=0.30
φ=0.34
Figure 9: Effects of water content on the CA50 and burn duration forvarious φ. Water slows down the combustion processes which retardsthe CA50 and causes the combustion duration to increase.
the MPRR due to increasing water content can allowoperation at higher φ, resulting in an improvement inthe overall performance. Similar effects can be foundthrough the use of EGR in HCCI engines.
4.3. Effect of TarsThe effect of the tars on the IC engines have not been
sufficiently documented in the open literature. Haslerand Nussbaumer carried out some tests on the tar de-posits formed in a SI engine after several hundred hoursof operation with syngas containing tars <50 mg/Nm3
[17]. Heavy tars, classified as those with boiling pointshigher than 200 ◦C were found having more tendency offorming deposits, compared to the comparatively lighterPolyaromatic Hydrocarbons (PAH) tars. As mentionedbefore in Section 2.1, the testing for tar depositions forthe current setup are not feasible. However, on an im-mediate basis, the tar content in the syngas would al-ter the fuel chemistry due to its varying concentrations,
11
ACCEPTE
D
(a)
4 10 13|CA90-CA10| [CAD]
90
97
Com
bust
ion
Eff
icie
ncy
[%]
φ=0.26
φ=0.30
φ=0.34
(b)
4 10 13|CA90-CA10| [CAD]
1
5
7
MPR
R [b
ar/C
AD
]
φ=0.26
φ=0.30
φ=0.34
Figure 10: Effects of varying water content in syngas on the MPRRand the combustion efficiency for different φ. The MPRR decreasesdue to cooling effect of water while the combustion efficiency de-creases due to the slow combustion resulting from the cooling effectand increased sensitivity to volume expansions
high LHV, influences on chemical kinetics, etc. Thus,instead of studies with a detailed tar composition, whichis essential in the study of tar deposition, the amount oftars are of more relevance in the objectives of this pa-per. Amongst the wide variety of tar compounds foundin the biomass syngas, naphthalene (C10H8) and toluene(C7H8) have been chosen as the representative tar com-pounds for the current set of experiments due to theirsignificant proportions in the tar distribution and theirwide acceptance as model tar compounds [36].
Naphthalene, being a solid at room temperature, wasdissolved in toluene and a saturated solution was cre-ated with the solubility constant of M=2.635 mol/L.The quantities of the compounds were determined fromthe molar ratios known from the assumption of a sat-urated mixture. The mixtures were injected in theliquid form using a 10 ml syringe pump. The total
tar (toluene+naphthalene) injection rates varied in therange of 3.5 g/Nm3 to about 17 g/Nm3 of syngas flow,which are much higher than the nominally expected 50mg/Nm3 from a modern two stage gasifier. The solu-tion was injected before the surge drum in such a wayso that the hot gases (which are above the boiling pointsof the tars in the solution) in the stream would vaporizethe liquid droplets and produce a homogeneous mixturewith the rest of the gases. The φ of pure syngas inputwas held constant at 0.3, while the injection rates of tarswere changed.
(a)
0.90 0.95 1.03LHV of mixture [MJ/kg]
3.2
2.0
1.0
0.2
CA
50 [C
AD
]
3.5 17Tars in syngas [g/Nm3 ]
No tarToluene
Toluene+Naphthalene
(b)
0.90 0.95 1.03LHV of mixture [MJ/kg]
95
97
Com
bust
ion
Eff
icie
ncy
[%] No tar
TolueneToluene+Naphthalene
Figure 11: Effects of syngas tars on the CA50 and the combustion effi-ciency plotted as a function of the LHV of the syngas-tar-air mixture.The effects of naphthalene or toluene on the CA50 are comparativelylesser than pure syngas even at very large concentrations. The rangeof tars injected in terms of g/Nm3 is indicated at the top in Figure 11a.The increasing CE indicates the burning of tars in the process.
The range of tars injected from 3.5 to 17 g/Nm3
stands equivalent to a change in the φ of neat syngaswith (H2:CO=45:55) from 0.30 to 0.34. Figure 11ashows the changes in the CA50 due to the increasingLHV of the fuel and air mixture caused by the addi-tion of tars. The figure also shows the corresponding
12
ACCEPTE
D
increases in the LHV for neat syngas achieved throughincreases in the φ. The combustion phasing seems to bemost sensitive to the pure syngas, followed by the syn-gas containing pure toluene. The mixture of toluene andnaphthalene shows the least effect on the CA50.
The results show that naphthalene, even in largequantities, does not dramatically alter the HCCI com-bustion behaviour. Modern two-stage gasifiers, suchas the one at the authors’ laboratory, produce approx-imately 20 mg/Nm3 of tars instead of the minimum 3.5g/Nm3 used in the experiments. Thus, for all practicalpurposes, the effect of tars on the HCCI combustion canbe neglected. The stability or mild increases in the CE(see Figure 11b), as a function of the increasing amountof LHV contribution due to the tars, can be assumedto be an indicator of the combustion of tars. However,detailed GC/MS measurements of the emissions wouldbe needed to ascertain the proportion of un-burnt tarsand thus comment on the tar destruction capabilities ofsuch a system. In terms of performance, it is interestingto note that the addition of tars increased the LHV ofthe syngas while consequently causing a lesser advancein the combustion phasing, as compared to neat syngas.Thus higher tar content syngas could be beneficial tothis application.
4.4. Effect of variations in pin, Tin
For exploring the sensitivity of HCCI combustion tothe variations in pin and Tin, experiments were carriedout for a fixed fuel composition at the nominal H2:COproportion of 45:55 and at three φ values of 0.26, 0.30and 0.34. While exploring the sensitivity to pin, the Tin
was held constant at 250◦C, whereas, while exploringthe sensitivity to Tin, the pin was held at a constant 1.2bar.
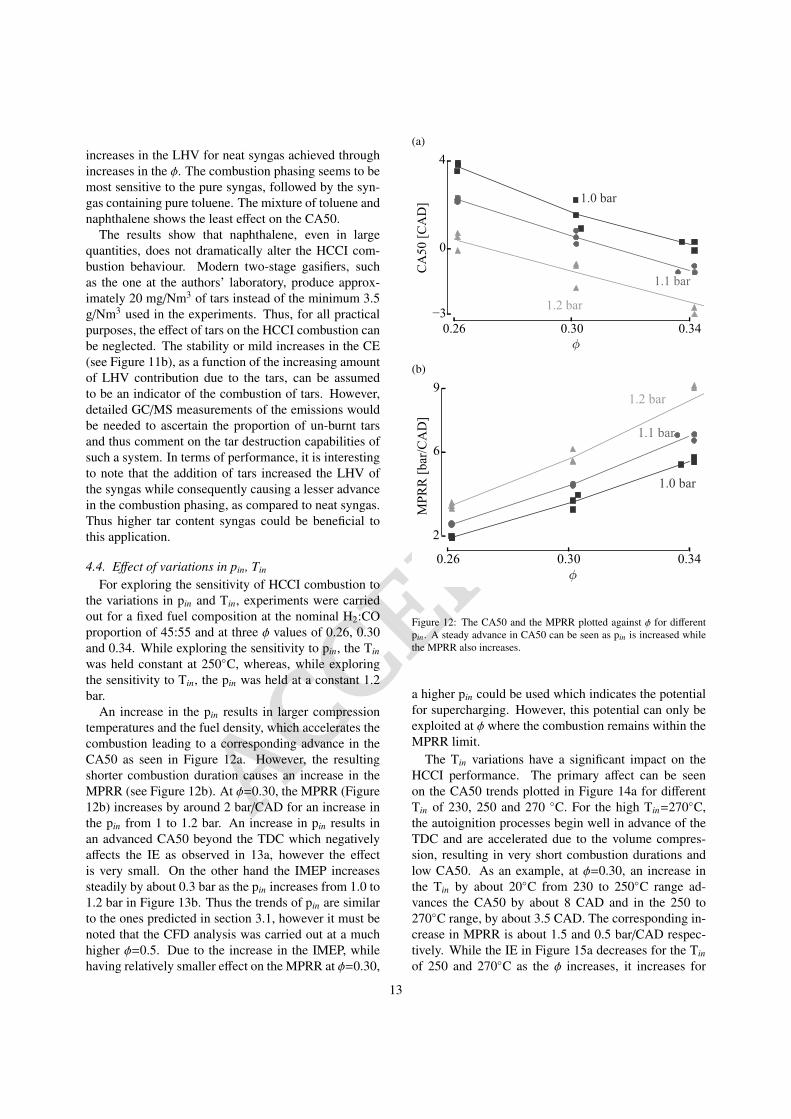
An increase in the pin results in larger compressiontemperatures and the fuel density, which accelerates thecombustion leading to a corresponding advance in theCA50 as seen in Figure 12a. However, the resultingshorter combustion duration causes an increase in theMPRR (see Figure 12b). At φ=0.30, the MPRR (Figure12b) increases by around 2 bar/CAD for an increase inthe pin from 1 to 1.2 bar. An increase in pin results inan advanced CA50 beyond the TDC which negativelyaffects the IE as observed in 13a, however the effectis very small. On the other hand the IMEP increasessteadily by about 0.3 bar as the pin increases from 1.0 to1.2 bar in Figure 13b. Thus the trends of pin are similarto the ones predicted in section 3.1, however it must benoted that the CFD analysis was carried out at a muchhigher φ=0.5. Due to the increase in the IMEP, whilehaving relatively smaller effect on the MPRR at φ=0.30,
(a)
0.26 0.30 0.34φ
3
0
4
CA
50 [C
AD
] 1.0 bar
1.1 bar
1.2 bar
(b)
0.26 0.30 0.34φ
2
6
9
MPR
R [b
ar/C
AD
]
1.0 bar
1.1 bar
1.2 bar
Figure 12: The CA50 and the MPRR plotted against φ for differentpin. A steady advance in CA50 can be seen as pin is increased whilethe MPRR also increases.
a higher pin could be used which indicates the potentialfor supercharging. However, this potential can only beexploited at φ where the combustion remains within theMPRR limit.
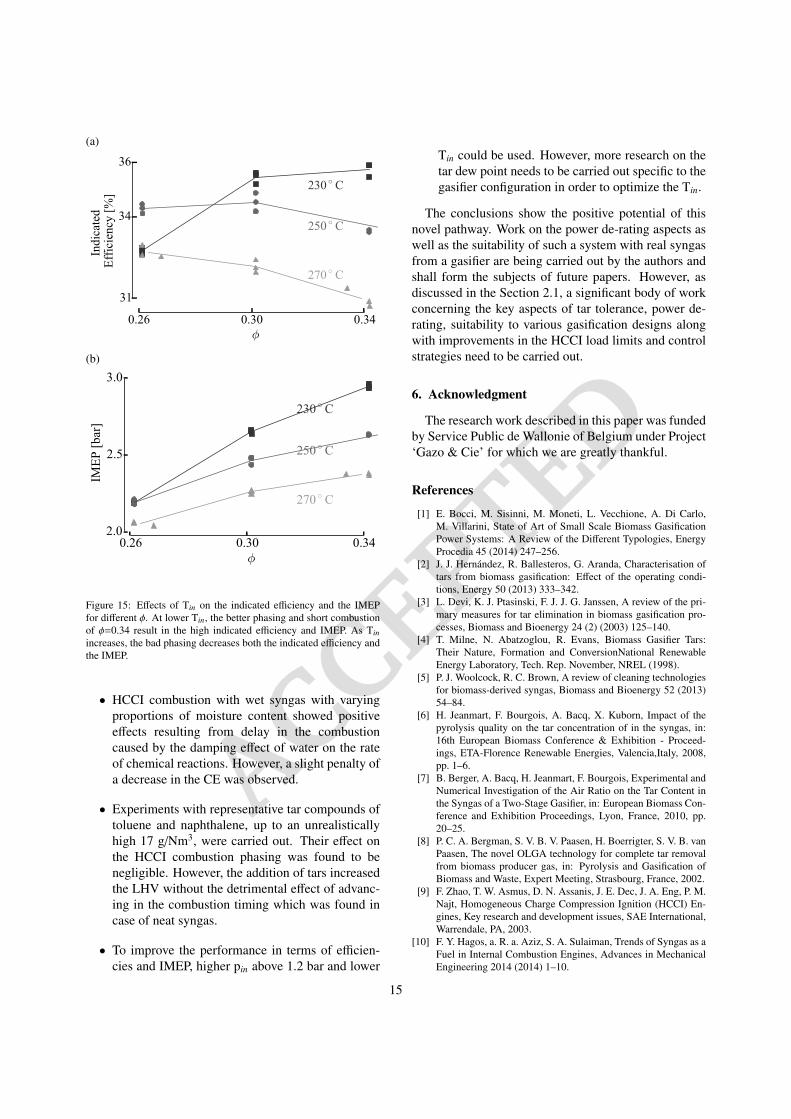
The Tin variations have a significant impact on theHCCI performance. The primary affect can be seenon the CA50 trends plotted in Figure 14a for differentTin of 230, 250 and 270 ◦C. For the high Tin=270◦C,the autoignition processes begin well in advance of theTDC and are accelerated due to the volume compres-sion, resulting in very short combustion durations andlow CA50. As an example, at φ=0.30, an increase inthe Tin by about 20◦C from 230 to 250◦C range ad-vances the CA50 by about 8 CAD and in the 250 to270◦C range, by about 3.5 CAD. The corresponding in-crease in MPRR is about 1.5 and 0.5 bar/CAD respec-tively. While the IE in Figure 15a decreases for the Tin
of 250 and 270◦C as the φ increases, it increases for
13
ACCEPTE
D
(a)
0.26 0.30 0.34φ
33.5
35.0
Indi
cate
d E
ffic
ienc
y [%
]
1.0 bar
1.1 bar
1.2 bar
(b)
0.26 0.30 0.34φ
1.8
2.3
2.7
IMEP
[bar
]
1.0 bar
1.1 bar
1.2 bar
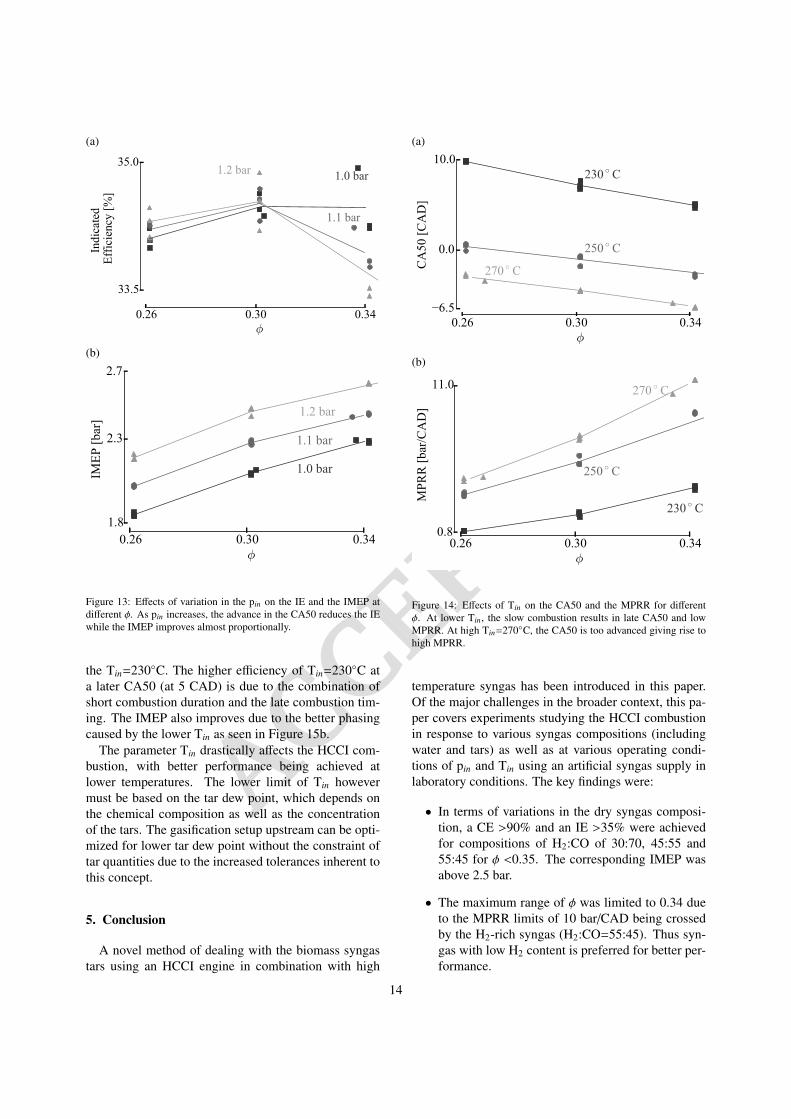
Figure 13: Effects of variation in the pin on the IE and the IMEP atdifferent φ. As pin increases, the advance in the CA50 reduces the IEwhile the IMEP improves almost proportionally.
the Tin=230◦C. The higher efficiency of Tin=230◦C ata later CA50 (at 5 CAD) is due to the combination ofshort combustion duration and the late combustion tim-ing. The IMEP also improves due to the better phasingcaused by the lower Tin as seen in Figure 15b.
The parameter Tin drastically affects the HCCI com-bustion, with better performance being achieved atlower temperatures. The lower limit of Tin howevermust be based on the tar dew point, which depends onthe chemical composition as well as the concentrationof the tars. The gasification setup upstream can be opti-mized for lower tar dew point without the constraint oftar quantities due to the increased tolerances inherent tothis concept.
5. Conclusion
A novel method of dealing with the biomass syngastars using an HCCI engine in combination with high
(a)
0.26 0.30 0.34φ
6.5
0.0
10.0
CA
50 [C
AD
]
230 ◦ C
250 ◦ C
270 ◦ C
(b)
0.26 0.30 0.34φ
0.8
11.0
MPR
R [b
ar/C
AD
]
230 ◦ C
250 ◦ C
270 ◦ C
Figure 14: Effects of Tin on the CA50 and the MPRR for differentφ. At lower Tin, the slow combustion results in late CA50 and lowMPRR. At high Tin=270◦C, the CA50 is too advanced giving rise tohigh MPRR.
temperature syngas has been introduced in this paper.Of the major challenges in the broader context, this pa-per covers experiments studying the HCCI combustionin response to various syngas compositions (includingwater and tars) as well as at various operating condi-tions of pin and Tin using an artificial syngas supply inlaboratory conditions. The key findings were:
• In terms of variations in the dry syngas composi-tion, a CE >90% and an IE >35% were achievedfor compositions of H2:CO of 30:70, 45:55 and55:45 for φ <0.35. The corresponding IMEP wasabove 2.5 bar.
• The maximum range of φ was limited to 0.34 dueto the MPRR limits of 10 bar/CAD being crossedby the H2-rich syngas (H2:CO=55:45). Thus syn-gas with low H2 content is preferred for better per-formance.
14
ACCEPTE
D
(a)
0.26 0.30 0.34φ
31
34
36
Indi
cate
d E
ffic
ienc
y [%
]
230 ◦ C
250 ◦ C
270 ◦ C
(b)
0.26 0.30 0.34φ
2.0
2.5
3.0
IMEP
[bar
]
230 ◦ C
250 ◦ C
270 ◦ C
Figure 15: Effects of Tin on the indicated efficiency and the IMEPfor different φ. At lower Tin, the better phasing and short combustionof φ=0.34 result in the high indicated efficiency and IMEP. As Tinincreases, the bad phasing decreases both the indicated efficiency andthe IMEP.
• HCCI combustion with wet syngas with varyingproportions of moisture content showed positiveeffects resulting from delay in the combustioncaused by the damping effect of water on the rateof chemical reactions. However, a slight penalty ofa decrease in the CE was observed.
• Experiments with representative tar compounds oftoluene and naphthalene, up to an unrealisticallyhigh 17 g/Nm3, were carried out. Their effect onthe HCCI combustion phasing was found to benegligible. However, the addition of tars increasedthe LHV without the detrimental effect of advanc-ing in the combustion timing which was found incase of neat syngas.
• To improve the performance in terms of efficien-cies and IMEP, higher pin above 1.2 bar and lower
Tin could be used. However, more research on thetar dew point needs to be carried out specific to thegasifier configuration in order to optimize the Tin.
The conclusions show the positive potential of thisnovel pathway. Work on the power de-rating aspects aswell as the suitability of such a system with real syngasfrom a gasifier are being carried out by the authors andshall form the subjects of future papers. However, asdiscussed in the Section 2.1, a significant body of workconcerning the key aspects of tar tolerance, power de-rating, suitability to various gasification designs alongwith improvements in the HCCI load limits and controlstrategies need to be carried out.
6. Acknowledgment
The research work described in this paper was fundedby Service Public de Wallonie of Belgium under Project‘Gazo & Cie’ for which we are greatly thankful.
References
[1] E. Bocci, M. Sisinni, M. Moneti, L. Vecchione, A. Di Carlo,M. Villarini, State of Art of Small Scale Biomass GasificationPower Systems: A Review of the Different Typologies, EnergyProcedia 45 (2014) 247–256.
[2] J. J. Hernandez, R. Ballesteros, G. Aranda, Characterisation oftars from biomass gasification: Effect of the operating condi-tions, Energy 50 (2013) 333–342.
[3] L. Devi, K. J. Ptasinski, F. J. J. G. Janssen, A review of the pri-mary measures for tar elimination in biomass gasification pro-cesses, Biomass and Bioenergy 24 (2) (2003) 125–140.
[4] T. Milne, N. Abatzoglou, R. Evans, Biomass Gasifier Tars:Their Nature, Formation and ConversionNational RenewableEnergy Laboratory, Tech. Rep. November, NREL (1998).
[5] P. J. Woolcock, R. C. Brown, A review of cleaning technologiesfor biomass-derived syngas, Biomass and Bioenergy 52 (2013)54–84.
[6] H. Jeanmart, F. Bourgois, A. Bacq, X. Kuborn, Impact of thepyrolysis quality on the tar concentration of in the syngas, in:16th European Biomass Conference & Exhibition - Proceed-ings, ETA-Florence Renewable Energies, Valencia,Italy, 2008,pp. 1–6.
[7] B. Berger, A. Bacq, H. Jeanmart, F. Bourgois, Experimental andNumerical Investigation of the Air Ratio on the Tar Content inthe Syngas of a Two-Stage Gasifier, in: European Biomass Con-ference and Exhibition Proceedings, Lyon, France, 2010, pp.20–25.
[8] P. C. A. Bergman, S. V. B. V. Paasen, H. Boerrigter, S. V. B. vanPaasen, The novel OLGA technology for complete tar removalfrom biomass producer gas, in: Pyrolysis and Gasification ofBiomass and Waste, Expert Meeting, Strasbourg, France, 2002.
[9] F. Zhao, T. W. Asmus, D. N. Assanis, J. E. Dec, J. A. Eng, P. M.Najt, Homogeneous Charge Compression Ignition (HCCI) En-gines, Key research and development issues, SAE International,Warrendale, PA, 2003.
[10] F. Y. Hagos, a. R. a. Aziz, S. A. Sulaiman, Trends of Syngas as aFuel in Internal Combustion Engines, Advances in MechanicalEngineering 2014 (2014) 1–10.
15
ACCEPTE
D
[11] Y. Yamasaki, S. Kaneko, Prediction of Ignition and CombustionDevelopment in an HCCI Engine Fueled by Syngas, SAE Tech-nical Paper 2014-32-0002.
[12] Yudai Yamasaki, Masanobu Kanno, Yasuhiro Taura, ShigehikoKaneko, Study on biomass gas HCCI engine, SAE TechnicalPaper 2009-32-0066.
[13] D. E. Haggith, A. Sobiesiak, Effects of Fuel Composition Varia-tions (H 2 :CO) for Biomass Gas HCCI Combustion, SAE Tech-nical Paper 2012-01-1112.
[14] A. S. Bika, L. Franklin, D. B. Kittelson, Homogeneous chargecompression ignition engine operating on synthesis gas, Interna-tional Journal of Hydrogen Energy 37 (11) (2012) 9402–9411.
[15] M. Achilles, J. Ulfvik, M. Tuner, B. Johansson, J. Ahrenfeldt,U. Henriksen, F. X. Schauer, HCCI Gas Engine: Evaluationof Engine Performance, Efficiency and Emissions - ComparingProducer Gas and Natural Gas, SAE Technical Paper 2011-01-1196.
[16] S. M. Aceves, D. L. Flowers, F. Espinosa-Loza, J. Martinez-Frias, J. E. Dec, M. Sjoberg, R. W. Dibble, R. P. Hessel, SpatialAnalysis of Emissions Sources for HCCI Combustion at LowLoads Using a Multi-Zone Model, SAE Technical Paper 2004-01-1910.
[17] P. Hasler, T. Nussbaumer, Sampling and analysis of particlesand tars from biomass gasifiers, Biomass and Bioenergy 18 (1)(2000) 61–66.
[18] F. V. Tinaut, A. Melgar, A. Horrillo, A. Dıez de la Rosa, Methodfor predicting the performance of an internal combustion enginefuelled by producer gas and other low heating value gases, FuelProcessing Technology 87 (2) (2006) 135–142.
[19] A. Bhave, M. Kraft, F. Mauss, A. Oakley, H. Zhao, Evaluatingthe EGR-AFR Operating Range of a HCCI Engine, SAE Tech-nical Paper 2005-01-0161.
[20] J.-O. Olsson, P. Tunestå l, B. Johansson, Boosting for High LoadHCCI, SAE Technical Paper 2004-01-0940.
[21] F. Contino, H. Jeanmart, T. Lucchini, G. D’Errico, Coupling ofin situ adaptive tabulation and dynamic adaptive chemistry: Aneffective method for solving combustion in engine simulations,Proceedings of the Combustion Institute 33 (2) (2011) 3057–3064.
[22] F. Contino, T. Lucchini, G. D’Errico, C. Duynslaegher, V. Dias,H. Jeanmart, Simulations of Advanced Combustion Modes Us-ing Detailed Chemistry Combined with Tabulation and Mech-anism Reduction Techniques, SAE Int. J. Engines 5 (2) (2012)185–196.
[23] F. Contino, F. Foucher, P. Dagaut, T. Lucchini, G. D’Errico,C. Mounaım-Rousselle, Experimental and numerical analysisof nitric oxide effect on the ignition of iso-octane in a singlecylinder HCCI engine, Combustion and Flame 160 (8) (2013)1476–1483.
[24] F. Contino, J.-B. Masurier, F. Foucher, T. Lucchini, G. D’Errico,P. Dagaut, CFD simulations using the TDAC method to modeliso-octane combustion for a large range of ozone seeding andtemperature conditions in a single cylinder HCCI engine, Fuel137 (2014) 179–184.
[25] V. Dias, C. Duynslaegher, F. Contino, J. Vandooren, H. Jean-mart, Experimental and modeling study of formaldehyde com-bustion in flames, Combustion and Flame 159 (5) (2012) 1814–1820.
[26] G. T. Kalghatgi, R. A. Head, Combustion Limits and Efficiencyin a Homogeneous Charge Compression Ignition Engine, Inter-national Journal of Engine Research 7 (3) (2006) 215–236.
[27] M. Tazerout, O. Le Corre, S. Rousseau, TDC Determinationin IC Engines Based on the Thermodynamic Analysis of theTemperature-Entropy Diagram, SAE Technical Paper 1999-01-1489 108 (4) (1999) 936–945.
[28] P. Tunestå l, TDC Offset Estimation from Motored CylinderPressure Data based on Heat Release Shaping, Oil & Gas Sci-ence and Technology – Revue d’IFP Energies nouvelles 66 (4)(2011) 705–716.
[29] F. Payri, P. Olmeda, C. Guardiola, J. Martın, Adaptive determi-nation of cut-off frequencies for filtering the in-cylinder pressurein diesel engines combustion analysis, Applied Thermal Engi-neering 31 (14-15) (2011) 2869–2876.
[30] J. Heywood, Internal combustion engine fundamentals,McGraw-Hill, 1988.
[31] F. Contino, F. Foucher, C. Mounaım-Rousselle, H. Jeanmart,Experimental Characterization of Ethyl Acetate, Ethyl Propi-onate, and Ethyl Butanoate in a Homogeneous Charge Compres-sion Ignition Engine, Energy & Fuels 25 (3) (2011) 998–1003.
[32] H. S. Soyhan, H. Yasar, H. Walmsley, B. Head, G. T. Kalghatgi,C. Sorusbay, Evaluation of heat transfer correlations for HCCIengine modeling, Applied Thermal Engineering 29 (2-3) (2009)541–549.
[33] J. J. Hernandez, C. Serrano, J. Perez, A. C. Jose, S. N. Cela,C. Real, Prediction of the Autoignition Delay Time of ProducerGas from Biomass Gasification, Energy & Fuels 20 (2) (2006)532–539.
[34] R. Lanzafame, Water Injection Effects In A Single-CylinderCFR Engine, SAE Technical Paper 1999-01-0568.
[35] M. Christensen, B. Johansson, Homogeneous Charge Compres-sion Ignition with Water Injection, SAE Technical Paper 1999-01-0182.
[36] C. Li, K. Suzuki, Tar property, analysis, reforming mechanismand model for biomass gasification—An overview, Renewableand Sustainable Energy Reviews 13 (3) (2009) 594–604.
[37] Bipm.org, Evaluation of measurement data – Guide to the ex-pression of uncertainty in measurement, Tech. Rep. September,BIPM (2008).
[38] G. T. Chin, J. Y. Chen, V. H. Rapp, R. W. Dibble, Developmentand validation of a reduced DME mechanism applicable to var-ious combustion modes in internal combustion engines, Journalof Combustion 2011.
AppendicesA. Uncertainty in in-cylinder pressure
For determining the pressure uncertainty, a very sim-ple model can be considered, where a change in thepressure ∆ptrue inside the cylinder develops a corre-sponding charge on the piezoelectric pressure sensor(PZT) through a sensitivity coefficient S PZT . Thischarge is transferred to the Charge Amplifier (ChA)with a pre-programmed sensitivity coefficient S ChA thatconverts it back into a pressure output ∆pChA. Thus, thepressure signal from the amplifier can be expressed in asimplified form as:
∆pChA = ∆pPZT ·S PZT
S ChA(A.2)
The Charge Amplifier can be assumed to function asan integrator of the sequential pressure changes which
16
ACCEPTE
D
results in the final measured output value. Although theamplitude of the amplifier output matches the amplitudeof pressure change, the relevance of the change to thereal pressure requires a known reference pressure. Thus,a pegging procedure is required which adds a constantreference pressure to the output, resulting in the finalpressure:
p f inal, j =
j∑i=0
∆pChA,i + ppeg = pChA,i + ppeg (A.3)
The true pressure is related to the final pressure asptrue = p f inal + ε f inal where ε stands for potential er-rors. The ε f inal is a result of multiple error sourcessuch as, piezoelectric sensor non-linearity (NL), ther-mal shock (TS), cyclic temperature drift (TD), changesin the transducer sensitivity over the calibrated sensi-tivity S PZT,Cal due to the material temperature changes(TSC), the non-linearity of the charge amplifier and theerror in the pegging procedure (peg). Thus the equationbecomes:
p f inal + ε f inal =(p f inal + εPZT,NL + εPZT,TS + εPZT,T D)
(A.4)
×S PZT,Cal + εS ,PZT,TS C
S ChA+ εChA,NL
+ ppeg + εpeg
The sensitivities of the transducer and the amplifier areset the same, thus S PZT,Cal = S ChA. Assuming the prod-uct of error terms are negligible, the equation can besimplified as:
p f inal + ε f inal ≈p f inal + εPZT,NL + εPZT,TS + εPZT,T D
(A.5)
+ p f inalεS ,PZT,TS C
S ChA+ εChA,NL
+ ppeg + εpeg
Thus, the uncertainty in the pressure data due to instru-ment error sources is:
up, f inal =
√√√√√√√√ u2PZT,NL + u2
PZT,TS + u2PZT,T D+(
p f inal
S ChAuS ,PZT,TS C
)2
+ u2ChA,NL + u2
peg
(A.6)
The uncertainties due to thermal shock can be ne-glected in the current setup where the loads are very low.Also, the drift in the sensitivity due to the thermal effects
have been neglected due to cyclic compensation pro-vided by the charge amplifier. The uncertainty up, f inal
accounts only for the uncertainties originating from thepressure transducer-amplifier combination, and repre-sents the Type B uncertainties [37]. The cyclic pressuresare recorded for 100 consecutive cycles and thus a TypeA uncertainty can be estimated. For k being the cyclenumber varying from 1 to N, the standard uncertainty inthe mean pressure trace, p, of the N cycles sample canbe written as:
up,θ,Type A =
√∑(pθ,k − pθ)2
N(N − 1)(A.7)
Thus, the final combined uncertainty in the in-cylinder pressure trace can be expressed as:
up,θ =
√u2
p,θ,Type A + u2p,Type B (A.8)
B. Uncertainties in the heat release and the CA50
The uncertainty analysis of CA50 is not very com-mon. This procedure develops on the one presented inthe supplementary material of [38] by incorporating thevariations in the specific heat ratio, γ, into the calcula-tions.
This uncertainty analysis of the heat release assumesthat the uncertainties over in-cylinder gas temperaturesand thus the γ on one hand and the convective heatlosses, on the other, are negligible. The rate of heat re-lease, based on the First Law of thermodynamics, as afunction of γ, p and instantaneous cylinder V is writtenas:
dQdθ
=γ
γ − 1p
dVdθ
+1
γ − 1V
dpdθ
(B.9)
In order to avoid noise originating from the numericaldifferentiation of the pressure p, the following simplifi-cation is used:
d(PV)dθ
= PdVdθ
+ VdPdθ
dQdθ
=1
γ − 1d(PV)
dθ+ P
dVdθ
(B.10)
Due to the discrete data, the cumulative heat release, Q,must be evaluated in terms of finite sums, i.e.
∆Qi =1
γi − 1∆(PiVi) + Pi∆Vi (B.11)
Therefore, the Q at a certain point j, between the Start ofCombustion(SOC) and the End of Combustion (EOC)
17
ACCEPTE
D
can be written as:
Q j =
j∑i=S OC
∆Qi (B.12)
Finally, the uncertainty in the cumulative heat releasetakes the form:
uQ j =
√√√ j∑i=S OC
u2∆Qi
(B.13)
Where...
u2∆Qi
= (1
γi − 1u∆(piVi))
2 + (pi · u∆Vi )2 + (∆Vi · upi )
2
u2∆(pV)i
=14
(Vi+1 · upi+1 )2 + (pi+1 · uVi+1 )2
+ (Vi−1 · upi−1 )2 + (pi−1 · uVi−1 )2
The CA50 is associated with the Q50, which is the 50%energy of the complete heat release, expressed as:
Q50 = 0.5 · (Qmax − Qmin) (B.14)
Therefore, the uncertainty in the Q50 is:
uQ50 = 0.5√
u2Qmax
+ u2Qmin
(B.15)
Where the uncertainties in the Qmax and Qmin are read-ily obtained from the uQ of the equation (B.13). Finally,the uncertainty in the CA50 is defined as the differencebetween the crank angle associated with the quantityQ50 (CA50) and that associated with the heat quantityQ50 + uQ50:
uCA50 = CAQ50+uQ50 −CACA50 (B.16)
18