Embed Size (px)
Citation preview

THE ECONOMIC FUTURE OFNUCLEAR POWER
A Study Conducted at The University of Chicago
August 2004
TH
E E
CO
NO
MIC
FU
TU
RE
OF
NU
CL
EA
R P
OW
ER
August 2004

Disclaimer
Neither the United States Government nor any agency thereof, nor The University of Chicago, norany of their employees or officers, makes any warranty, express or implied, or assumes any legalliability or responsibility for the accuracy, completeness, or usefulness of any information, apparatus,product, or process disclosed, or represents that its use would not infringe privately owned rights.The views and opinions of document authors expressed herein do not necessarily state or reflectthose of the United States Government or any agency thereof, Argonne National Laboratory, or theinstitutional opinions of The University of Chicago.

THE ECONOMIC FUTURE OF NUCLEAR POWER
A Study Conducted at The University of Chicago
August 2004

iii
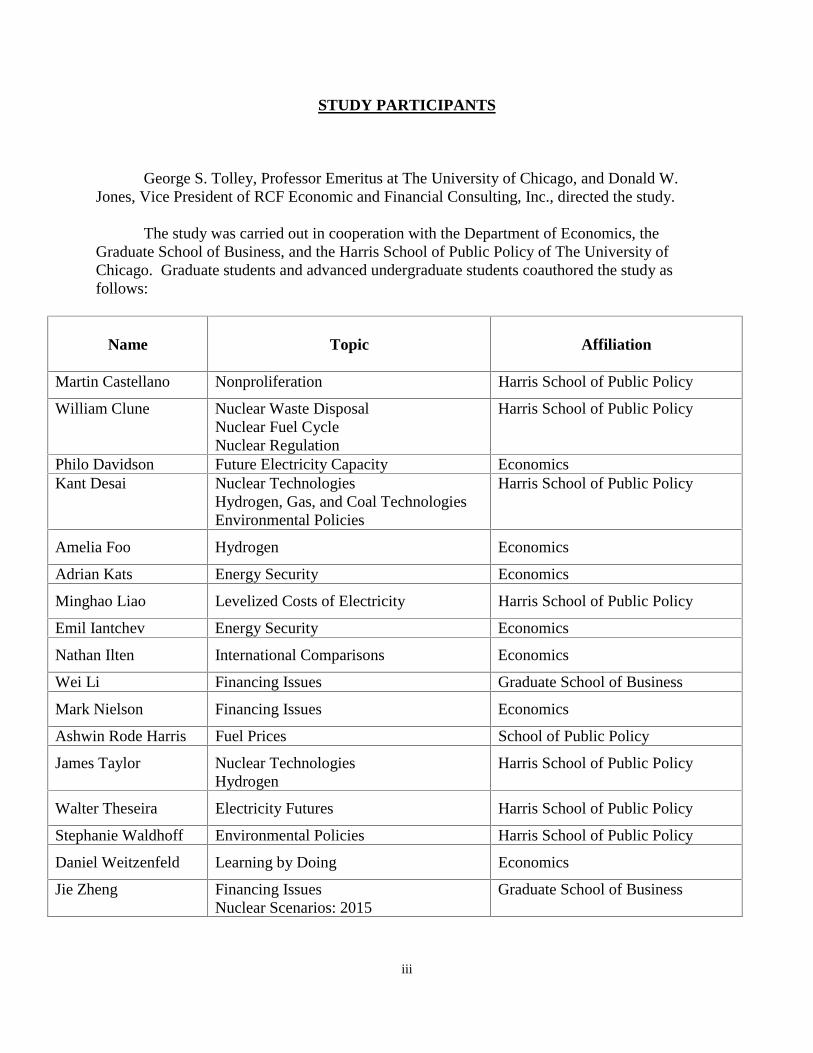
STUDY PARTICIPANTS
George S. Tolley, Professor Emeritus at The University of Chicago, and Donald W.Jones, Vice President of RCF Economic and Financial Consulting, Inc., directed the study.
The study was carried out in cooperation with the Department of Economics, theGraduate School of Business, and the Harris School of Public Policy of The University ofChicago. Graduate students and advanced undergraduate students coauthored the study asfollows:
Name Topic Affiliation
Martin Castellano Nonproliferation Harris School of Public Policy
William Clune Nuclear Waste DisposalNuclear Fuel CycleNuclear Regulation
Harris School of Public Policy
Philo Davidson Future Electricity Capacity EconomicsKant Desai Nuclear Technologies
Hydrogen, Gas, and Coal TechnologiesEnvironmental Policies
Harris School of Public Policy
Amelia Foo Hydrogen Economics
Adrian Kats Energy Security Economics
Minghao Liao Levelized Costs of Electricity Harris School of Public Policy
Emil Iantchev Energy Security Economics
Nathan Ilten International Comparisons Economics
Wei Li Financing Issues Graduate School of Business
Mark Nielson Financing Issues Economics
Ashwin Rode Harris Fuel Prices School of Public Policy
James Taylor Nuclear TechnologiesHydrogen
Harris School of Public Policy
Walter Theseira Electricity Futures Harris School of Public Policy
Stephanie Waldhoff Environmental Policies Harris School of Public Policy
Daniel Weitzenfeld Learning by Doing Economics
Jie Zheng Financing IssuesNuclear Scenarios: 2015
Graduate School of Business

iv

v
TABLE OF CONTENTS
PREFACE.................................................................................................................................. viiDOE NUCLEAR POWER 2010 PROGRAM............................................................................. viiiACKNOWLEDGEMENTS...................................................................................................... ixABSTRACT............................................................................................................................... xEXECUTIVE SUMMARY....................................................................................................... xiSUMMARY............................................................................................................................... S-1
TABLESTable 1: Shares of Total U.S. Electricity Generation, by Type of
Generation, 2003 .................................................................................. S-1Table 2: Summary Worksheet for Busbar Cost Comparisons, $ per MWh,
with Capital Costs in $ per kW, 2003 Prices ....................................... S-2Table 3: Organization for Economic Co-operation and Development (OECD)
Busbar Costs, 75 Percent Capacity Factor, 40-Year Plant Life, $ per MWh, 2003 Prices....................................................................... S-4
Table 4: Conditions Associated with Alternative Learning Rates ..................... S-6Table 5: Parameter Values for No-Policy Nuclear LCOE Calculations ............ S-7Table 6: First-Plant LCOEs for Three Reactor Costs, 5- and 7-Year
Construction Periods, $ per MWh, 2003 Prices ................................... S-8Table 7: Effects of Capacity Factor, Construction Period, and Plant Life
on First-Plant Nuclear LCOE for Three Reactor Costs, $ perMWh, 2003 Prices................................................................................ S-8
Table 8: LCOEs for Pulverized Coal and Gas Turbine Combined CyclePlants, $ per MWh, 2003 Prices........................................................... S-9
Table 9: Cost Characteristics of Fossil-Fired Electricity Generation................. S-10Table 10: Natural Gas Price Projections .............................................................. S-11Table 11: Nuclear LCOEs with Loan Guarantees, $ per MWh, 2003 Prices....... S-13Table 12: Nuclear LCOEs with Accelerated Depreciation Allowances,
$ per MWh, 2003 Prices....................................................................... S-13Table 13: Nuclear LCOEs with Investment Tax Credits, $ per MWh,
2003 Prices ........................................................................................... S-13Table 14: Nuclear LCOEs with Production Tax Credits, $18 per MWh,
8-Year Duration, $ per MWh, 2003 Prices .......................................... S-14Table 15: Effects of Combined $18 per MWh 8-Year Production Tax Credits
and 20 Percent Investment Tax Credits on Nuclear Plants’ LCOEs,$ per MWh, 2003 Prices....................................................................... S-14
Table 16: LCOEs for the Fifth Nuclear Plant, with No Policy Assistance, 7-YearConstruction Time, 10 Percent Interest Rate on Debt, and 15 PercentRate on Equity, $ per MWh, 2003 Prices............................................. S-15
Table 17: LCOEs for the Fifth Nuclear Plant, with No Policy Assistance, 5-YearConstruction Time, 7 Percent Interest Rate on Debt, and 12 PercentRate on Equity, $ per MWh, 2003 Prices............................................. S-15

vi
TABLES(contd.)Table 18: Fossil LCOEs with and without Greenhouse Policies,
$ per MWh, 2003 Prices....................................................................... ..S-16Table A-1: Plant and Market Model Summary ...................................................... ..S-18Table A-2: Summary of New Reactor Designs ...................................................... ..S-20Table A-3: Components of Front-End Nuclear Fuel Costs, $ per kg U,
2003 Prices ........................................................................................... ..S-21Table A-4: Disposal Costs, $ per MWh, 2003 Prices............................................. ..S-21

vii
PREFACE
In 2003, the U.S. Department of Energy (DOE), acting through Argonne NationalLaboratory (ANL), requested a study of the economic factors affecting the future of nuclearpower in the United States. The study was carried out at The University of Chicago.
The present report gives the results of the study. Intended to be a white paper, it is asystematic review of the economics of nuclear power that can serve as a reference for futurestudies. It does not take a position on policy subjects. Rather, it reviews and evaluatesalternative sources of information bearing on the nuclear power industry, and presents scenariosencompassing a reasonable range of future possibilities.
Part I considers factors affecting the competitiveness of nuclear power. Topics include(1) levelized costs, (2) comparisons with international nuclear costs, (3) capital costs, (4) effectsof learning by doing, and (5) financing issues.
Part II analyzes gas-fired and coal-fired technologies as the major baseload competitorsto nuclear generation. Topics include technologies that could reduce the costs of gas- and coal-fired electricity, future fuel price changes, and the potential economic impact of greenhouse gascontrol policies and technology.
Part III analyzes several federal financial policy alternatives designed to make nuclearpower competitive in the next decade and beyond.
The Appendix provides comprehensive background information underpinning the bodyof the study. Previous nuclear energy studies were less comprehensive. The demand for newelectricity generating capacity in the United States is estimated. A major concern is the viabilityof new nuclear plants as a way to meet growing electrical demand during the next decade. Thestudy focuses on baseload electrical capacity. Appendices A1 through A9 address the majorfactors that affect the desirability and the viability of nuclear power. Conclusions include thefollowing:
• Waste disposal issues remain to be settled.• U.S. policy regarding nonproliferation goals will affect future fuel cycle decisions.• Regulatory simplification shows promise of reducing plant construction times.• A transition from oil-based to hydrogen-based transportation could, in the longer run,
increase the demand for nuclear power as a non-polluting way to produce hydrogen.• If gas imports increase, nuclear power could substitute for gas and contribute to energy
security.

viii
DOE NUCLEAR POWER 2010 PROGRAM *
In FY 2003, the U.S. Department of Energy (DOE) initiated a University of Chicagostudy on the economic viability of new nuclear power plants in the United States. This reportdescribes the results of that study. According to DOE’s Fiscal Year 2005 Budget Report,“the information obtained from this study is used to focus the program’s activities on issuesof the greatest impact” (DOE 2004, p. 397).
The Nuclear Power 2010 program is a joint government-industry cost-shared effortinvolved with identifying sites for new nuclear power plants, developing advanced nuclearplant technologies, evaluating the business case for building new nuclear power plants, anddemonstrating untested regulatory processes. These efforts are designed to pave the way foran industry decision by the end of 2005 to order a new nuclear power plant. The regulatorytasks include demonstration of the Early Site Permit (ESP) and combined Construction andOperating License (COL) processes to reduce licensing uncertainties and minimize attendantfinancial risks to the licensee.
The Nuclear Power 2010 program continues to evaluate the economic and businesscase for building new nuclear power plants. This evaluation includes identification of theeconomic conditions under which power generation companies would add new nuclearcapacity. In July 2002, DOE published a draft report, “Business Case for New NuclearPower Plants in the United States,” which provided recommendations for federal governmentassistance. DOE continues to develop and evaluate strategies to mitigate specific financialrisks associated with deployment of new nuclear power plants identified in that report.
Recently, DOE solicited proposals from teams led by power generation companies toinitiate new nuclear plant licensing demonstration projects. Under a cost-sharingarrangement, power companies will conduct studies, analyses, and other activities necessaryto select an advanced reactor technology and prepare a site-specific, technology-specificCOL application. DOE has already received responses from several utility consortia.
DOE has also initiated a technology assessment of nuclear power plant construction,which is being conducted in cooperation with the power generation companies. That studyhas assessed schedules and construction methods for the nuclear power plant designs mostlikely to be built in the near term.
________________________*Source: U.S. Department of Energy (DOE). (2004). “FY 2005 DOE Budget Request,Energy and Water Development Appropriations,” Vol. 3, Nuclear Energy, pp. 395-398.http://www.mbe.doe.gov/budget/05budget/content/es/nuclear.pdf.

ix
ACKNOWLEDGEMENTS
Many persons have made generous and valuable contributions to this study.Deserving special mention are Donald Joyce and Stephen Goldberg of ANL, who gave helpthroughout. In addition, William Magwood, Thomas Miller and Kenneth Chuck Wade ofDOE provided very timely and useful assistance. Other contributors include StephenAumeier, Phillip Finck, Stephen Berry, Prashant Bharadwaj, Gale Boyd, Chaim Braun, KimCawley, Matthew Crozat, Hermann Grunder, Richard Hornbeck, Dale Knutson, JaneMahoney, Ella Revzin, Thomas Rosenbaum, Allen Sanderson, Luc van den Durpel, MarkGrenchik, and Latif Yacout. Their assistance is gratefully acknowledged.
x
ABSTRACT
Developments in the U.S. economy that will affect the nuclear power industry incoming years include the emergence of new nuclear technologies, waste disposal issues,proliferation concerns, the streamlining of nuclear regulation, a possible transition to ahydrogen economy, policies toward national energy security, and environmental policy.These developments will affect both the competitiveness of nuclear power and appropriatenuclear energy policies. A financial model developed in this study projects that, in theabsence of federal financial policies aimed at the nuclear industry, the first new nuclear plantscoming on line will have a levelized cost of electricity (LCOE, i.e., the price required to coveroperating and capital costs) that ranges from $47 to $71 per megawatt-hour (MWh). Thisprice range exceeds projections of $33 to $41 for coal-fired plants and $35 to $45 for gas-firedplants. After engineering costs are paid and construction of the first few nuclear plants hasbeen completed, there is a good prospect that lower nuclear LCOEs can be achieved and thatthese lower costs would allow nuclear energy to be competitive in the marketplace. Federalfinancial policies that could help make early nuclear plants more competitive include loanguarantees, accelerated depreciation, investment tax credits, and production tax credits. In thelong term, the competitiveness of nuclear power could be further enhanced by rising concernsabout greenhouse gas emissions from fossil-fuel power generation.
xi
EXECUTIVE SUMMARY
Context
Developments in the U.S. economy that will affect the nuclear industry in the futureinclude the emergence of new nuclear technologies, decisions about nuclear fuel disposition,proliferation concerns, regulatory reform, a potential transition to a hydrogen economy,national energy security policies, and environmental policies. A successful transition fromoil-based to hydrogen-based transportation could, in the long run, increase the demand fornuclear energy as a nonpolluting way to produce hydrogen.
The U.S. Department of Energy (DOE) currently supports research on designs foradvanced nuclear power plants that can produce hydrogen as well as increase thesustainability and proliferation-resistance of nuclear energy and help lower nuclear energycosts. DOE also supports the certification of new nuclear reactor designs and the early sitepermitting process that will help make the licensing of new nuclear plants more predictable.Such predictability promises to lower financial risk by reducing the time required toconstruct and license new plants.
This study analyzes the economic competitiveness of nuclear, gas-fired, and coal-fired electricity.
Summary of Economic Findings
Economics of Deploying Plants during the Next Decade
• Capital cost is the single most important factor determining the economiccompetitiveness of nuclear energy.
• First-of-a-kind engineering (FOAKE) costs for new nuclear designs couldincrease capital costs by 35 percent, adversely affecting nuclear energy’scompetitiveness.
• The risk premium paid to bond and equity holders for financing new nuclearplants is an influential factor in the economic competitiveness of nuclearenergy. A 3 percent risk premium on bonds and equity is estimated to beappropriate for the first few new plants.
• Without federal financial policy assistance, new nuclear plants coming on linein the next decade are projected to have a levelized cost of electricity (LCOE)of $47 to $71 per megawatt-hour (MWh). This study provides a full range ofLCOEs for first nuclear plants for alternative construction periods, plant lives,capacity factors, and overnight cost estimates. LCOEs for coal- and gas-firedelectricity are estimated to be $33 to $41 per MWh and $35 to $45 per MWh,respectively.

xii
• With assistance in the form of loan guarantees, accelerated depreciation,investment tax credits, and production tax credits, new nuclear plants couldbecome more competitive, with LCOEs reaching $32 to $50 per MWh.
Economics of Deploying the Next Series of Nuclear Plants
• With the benefit of the experience from the first few plants, LCOEs areexpected to fall to the range of $31 to $46 per MWh; no continued financialassistance is required at this level.
Future Greenhouse Gas Policies
• If stringent greenhouse policies are implemented and advances in carboncapture and sequestration prove less effective than hoped, coal-firedelectricity’s LCOE could rise as high as $91 per MWh and gas-firedelectricity’s LCOE could rise as high as $68 per MWh. These LCOEs wouldfully assure the competitiveness of nuclear energy.

S-1
SUMMARY
Background
The focus of this study is baseload electricity as supplied by nuclear, coal-fired, andgas-fired technologies. Baseload power is power that a utility generates continuously, yearround, in anticipation of the minimum customer demand that will occur, regardless of dailyand seasonal fluctuations. Nuclear energy, coal, and gas are the major baseload fuelalternatives. Renewables are not considered since they are used minimally to meet baseloaddemand. While hydroelectric facilities supply baseload generation in some parts of theUnited States, the major opportunities for hydroelectric projects have already been taken.Table 1 presents the shares of generation furnished by various technologies in the UnitedStates. This study synthesizes the current understanding of the factors affecting theeconomic viability of nuclear power and estimates its viability under a range of futurescenarios.
Table 1: Shares of Total U.S. Electricity Generation, by Type of Generation, 2003a
Energy Source Net Generation,Percent
Coal 50.1Nuclear 20.2Natural Gas 17.9Hydroelectric 6.6Petroleum 2.5Non-hydro Renewables 2.3Other Sources 0.4
Total 100aIdentical to Table A1-1.
Part One: Economic Competitiveness of Nuclear Energy
This study first develops a pre-tax levelized cost of electricity (LCOE) model anduses it to calculate LCOEs for nuclear, coal, and gas generation based on values from recentplant models and data developed for use in those models. The LCOE is the price at thebusbar needed to cover operating costs plus annualized capital costs. Table 2 summarizesthese results.

S-2
Table 2: Summary Worksheet for Busbar Cost Comparisons, $ per MWh, with CapitalCosts in $ per kW, 2003 Pricesa
Sandia ModelGenSim
SAIC ModelPower Choice
Scully Capital Report EIA – AEO 2004Technology
r=10% r=15% Debt r = 8%;Disc r =8%
Debt r=10%; Discr = 8%
Debt r=10%;Disc r =10%
r = 8% r =10%
r =10%
Debt r=10%;Eq = 15%;Disc r =10%
Debt r =8%;Eq = 10%;Disc r = 10%
Nuclear(capital cost)
51(1,853)
83(1,853)
Legacy Nuclear(capital cost)
65(2,000)
70(2,000)
77(2,000)
EIA ReferenceCase, NewNuclear(capital cost)
63 to 68
(1,752 to1,928)
EIA AdvancedTechnologyCase, NewNuclear(capital cost)
43 to 53
(1,080 to1,555)
ABWR(capital cost)
53(1,600)
50(1,600)
55(1,600)
AP 1000(capital cost)
49(1,365)
46(1,365)
51(1,365)
36(1,247)
40(1,247)
44(1,455)
Pebble BedModularReactor(PBMR)(capital cost)
40
(1,365)
41
(1,365)
45
(1,365)
Gas TurbineModularHelium Reactor(GT-MHR)(capital cost)
39
(1,126)
39
(1,126)
43
(1,126)
Advanced FastReactor (AFR)(capital cost)
57
(1,126)
57
(1,126)
64
(1,126)
Coal(capital cost)
37(1,094)
48(1,094)
43(1,350)
44(1,350)
49(1,350)
38(1,169)
Gas TurbineCombinedCycle(capital cost)
35
(472)
40
(472)
38
(590)
38
(590)
40
(590)
41
(466)GasCombustionTurbine(capital cost)
56
(571)
68
(571)
Solar-Photovoltaic
202 308
Solar-Thermal 158 235
Wind 55 77
aIdentical to Table 1-1.

S-3
To illuminate the reasons for the ranges of LCOEs estimated in prior studies, this studycalculates LCOEs using the cost and performance assumptions used in three plant modelsidentified in Appendix A2 (Table A2-1) and in the National Energy Modeling System (NEMS),as reported in the Energy Information Administration’s (EIA's) Annual Energy Outlook. TheSandia model, GenSim, does not specify a particular nuclear technology; rather, it adopts EIA’sspecifications from the 2003 Annual Energy Outlook (AEO 2003). At a base capital cost of$1,853 per kW, increasing the discount rate from 10 to 15 percent raises the GenSim busbarnuclear cost from $51 to $83 per megawatt-hour (MWh). GenSim’s estimates for competitors tonuclear are: $37 to $48 per MWh for coal, $35 to $40 per MWh for gas turbine combined cycle,and $56 to $68 per MWh for gas combustion turbines. The SAIC model, Power Choice,considers several nuclear technologies; cost estimates range from $39 per MWh for the GasTurbine Modular Helium Reactor (GT-MHR) to $77 per MWh for existing nuclear technology.Coal-fired costs are on a par with the Pebble Bed Modular Reactor (PBMR) costs, at $43 to $49per MWh. Gas turbine combined cycle costs are in the range of $35 to $48 per MWh. TheScully model compares alternative financing plans for a technology that broadly corresponds tothe AP1000. The busbar cost range is $36 to $44 per MWh. The reference case in EIA's recentAnnual Energy Outlook (AEO 2004) considers future construction of historical designs. Itsassumptions regarding capital costs and interest rates result in a nuclear busbar cost of $63 to $68per MWh, which is higher than most other studies. However, its cost for coal generation is $38per MWh. Its advanced technology case lowers capital costs, partly to reflect learning effects inconstruction, which produces LCOEs of $43 to $53 per MWh.
Worldwide Cost Estimates
This study compares U.S. nuclear busbar costs with those in other countries that useelectricity generated from nuclear energy, coal, and gas. U.S. nuclear busbar costs are estimatedto be somewhat below the middle of the worldwide range for countries not reprocessing spentfuel, i.e., $36 to $65 per MWh. LCOEs of new nuclear plants in the United States comparefavorably to prospective costs for new nuclear plants in France. Table 3 reports the nuclearbusbar costs for various countries; separate estimates are provided for fuel cycles that dispose ofspent fuel directly and those that reprocess spent fuel.

S-4
Table 3: Organization for Economic Co-operation and Development (OECD) BusbarCosts, 75 Percent Capacity Factor, 40-Year Plant Life, $ per MWh, 2003 Pricesa
Discount Rate(To Derive Net Present
Value)8 Percent 10 PercentPlant Type Country
$ per MWhFinland, new SWR 1000 36 42Canada 39 to 45 48 to 53China 44 54United States 45 53Russia 45 55Romania 49 59Korea 49 59India 52 64Turkey 53 64Finland 58 68
Nuclear, Spent Fuel Disposal
Spain 65 78China 39 to 50 47 to 61France 50 60
Nuclear with Reprocessing
Japan 83 97Gas Turbine Combined Cycle OECD average 30 to 66 38 to 65Advanced Gas TurbineCombined Cycle United States 26 27Pulverized Coal Combustion OECD average 36 to 74 43 to 84Coal Circulating Fluidized Bed Canada 56 63Coal Integrated GasificationCombined Cycle (IGCC) OECD average 36 to 66 42 to 74a From Tables 2-5 and 2-6.
Overnight Capital Cost Estimates
Capital costs, the single most important cost component for nuclear power, are analyzedin detail. For the Advanced Boiling Water Reactor (ABWR), already built in Asia, and theAP1000, a smaller scale version of which has been certified by the U.S. Nuclear RegulatoryCommission (NRC), overnight capital costs, or undiscounted capital outlays, account for over athird of LCOE; interest costs on the overnight costs account for another quarter of the LCOE.Overnight cost estimates from different sources have ranged from less than $1,000 per kilowatt(kW) to as much as $2,300 per kw. This study examines the reasons for the differences in theseestimates, with the aim of estimating a narrower plausible range.

S-5
One reason that early plants are more expensive is the impact of first-of-a-kindengineering (FOAKE) costs. Several hundred million dollars may be expended to complete theengineering design specifications for Generation III or III+ reactors. Such costs are incurred forearly nuclear plants built of any type. Although building a reactor of a particular design in onecountry may enable transfer of part of the engineering that will be used in another country, somepartial FOAKE costs may still be incurred for the first construction in any given country.
FOAKE costs are a fixed cost of a particular reactor design. How a vendor allocatesFOAKE costs across all the reactors it sells can affect the overnight cost of early reactorsconsiderably. A vendor may be concerned about its ability to sell multiple reactors and thereforewant to recover all FOAKE costs on its first plant. FOAKE costs could raise the overnight costof the first plant by 35 percent.
This study uses the Advanced Boiling Water Reactor (ABWR), the CANDU ACR-700,the AP1000, and the Framatome SWR 1000 as reasonable candidates for deployment in theUnited States by 2015.
• An overnight cost of $1,200 per kW is assumed for a generic class of mature designs.
• An overnight cost of $1,500 per kW is assumed for a generic class of designs thatrequire payment of FOAKE costs.
• An overnight cost of $1,800 per kW is assumed for a generic class of more advanceddesigns that also require FOAKE costs.
Consideration of the four reactor types contributes to the choice of $1,200, $1,500, and $1,800per kW for overnight costs, a range consistent with estimates identified in EIA’s 2004 advancedtechnology case. (See AEO 2004.)
Learning by Doing
The study finds that reductions in capital costs between a first new nuclear plant andsome nth plant of the same design can be critically important to eventual commercial viability. Inbuilding the early units of a new reactor design, engineers and construction workers learn how tobuild the plants more efficiently with each plant they build. A case can be made that the nuclearindustry will start with very little learning from previous experience when the first new nuclearconstruction occurs in the United States. The paucity of new nuclear construction over the pasttwenty years in the United States, together with the entry of new technologies and a newregulatory system, has eliminated much of the applicable U.S. experience. On the other hand,participation in overseas construction may have given some U.S. engineers experience that istransferable to construction in the United States.
This study uses a range of 3 to 10 percent for future learning rates in the U.S. nuclearconstruction industry, where learning rate is the percent reduction in cost resulting from doublingthe number of plants built. Table 4 summarizes the conditions associated with different learningrates.

S-6
Table 4: Conditions Associated with Alternative Learning Ratesa
LearningRate
(Percent forDoubling
Plants Built)
Pace ofReactorOrders
Number ofReactors Builtat a Single Site
ConstructionMarket
Reactor DesignStandardization
RegulationImpacts
3 Spread apart 1year or more
Capacitysaturated; nomultiple units
Not highlycompetitive;can retainsavings fromlearning
Not highlystandardized
Someconstructiondelays
5 Somewhatmorecontinuousconstruction
Somewhatgreater demandfor newcapacity;multiple unitsstill uncommon
Morecompetitive;most costreductionsfrom learningpassed on tobuyers
Narrower arrayof designs
Delaysuncommon
10 Continuousconstruction
High capacitydemand growth;multiple unitscommon
Highlycompetitive; allcost reductionspassed on
Several designs;sufficient ordersfor each toachievestandardizationlearning effects
Constructiontime reducedand delayslargelyeliminated
aIdentical to Table 4-6.
The Financial Model
This study employs a financial model for businesses that is based on the followingequation:
PRESENT VALUE OF EQUITY INVESTMENT DURING THE CONSTRUCTION PERIOD
= PRESENT VALUE OF NET REVENUE EARNED BY EQUITY OVER THE LIFE OF THE PLANT
where
NET REVENUE = EARNINGS FROM LCOE REVENUE BEFORE INTEREST AND TAXES (EBIT) –INTEREST EXPENSE – TAX EXPENSE + DEPRECIATION – REPAYMENT OF DEBT
Because risk is a major consideration for investors, its treatment in the financial model isan important factor in deriving the required net revenue. The perceived risk of investments innew nuclear facilities contributes to the risk premium on new nuclear construction. Principal

S-7
sources of risk are the possibilities that construction delays will escalate costs and that newplants will exceed original cost estimates for other reasons. This study uses guidelines from thecorporate finance literature, previous nuclear studies, and opinions of investment analysts tospecify likely relationships between project risk and risk premiums for corporate bonds andequity capital. Risks associated with building a new nuclear plant are estimated to raise therequired rate of return on equity to 15 percent, compared to 12 percent for other types offacilities, and debt cost to rise to 10 percent from 7 percent.
Table 5 specifies the parameter values for LCOE calculations under the assumption thatno financial policies benefiting nuclear power are in effect. In using the financial model to studysensitivities, overnight costs of $1,200, $1,500, and $1,800 per kW are used. Table 6summarizes the "no-policy" LCOEs for the three nuclear capital costs, each under 5-year and7-year anticipated construction times. These construction times are expected values perceivedby investors, based on both previous nuclear construction experience and new information. Thisstudy assumes investors will conservatively expect a 7-year construction period for the first fewnew plants. If actual construction times prove to be 5 years, investors will revise theirexpectations downward accordingly for subsequent plants.
Table 5: Parameter Values for No-Policy Nuclear LCOE Calculationsa
Item Parameter ValueOvernight Capital Cost $1,200 per kW $1,500 per kW $1,800 per kWPlant Life 40 yearsConstruction Time 7 yearsPlant Size 1,000 MWCapacity Factor 85 percentHours per Year 8,760 hoursCost of Debt 10 percentCost of Equity 15 percentDebt Term 15 yearsDepreciation Term 15 yearsDepreciation Schedule MACRSb
Debt Finance 50 percentEquity Finance 50 percentTax Rate 38 percentNuclear Fuel Cost $4.35 per MWhNuclear Fixed O&M Cost $60 per kWNuclear Variable O&M Cost $2.10 per MWhNuclear Incremental Capital Expense $210 per kW per yearNuclear Decommissioning Cost $350 millionNuclear Waste Fee $1 per MWh
aIdentical to Table 5-1. bModified Accelerated Cost Recovery System.

S-8
Table 6: First-Plant LCOEs for Three Reactor Costs, 5- and 7-Year Construction Periods,$ per MWh, 2003 Pricesa
ConstructionPeriod
Mature DesignFOAKE Costs Paid,
$1,200 per kWOvernight Cost
New DesignFOAKE Costs Not YetPaid, $1,500 per kW
Overnight Cost
Advanced New DesignFOAKE Costs Not YetPaid, $1,800 per kW
Overnight Cost5 years 47 54 627 years 53 62 71
aIdentical to Table 5-3.
Table 7 presents a full range of LCOEs for first nuclear plants, for alternativeconstruction periods, plant lives, and capacity factors and for each of the three overnight costsspecified in Table 5. The table shows the relative importance of the various characteristics forgeneration cost. Overnight capital cost is clearly most important, but the two-year difference inconstruction period is nearly as important. If investors were convinced of the likelihood of a 5-year construction period, they would estimate the generation cost of the $1,800 per kW plant toequal that of the $1,500 per kW plant built in 7 years; similarly, the $1,500 per kW plantanticipated to be built in 5 years would have a generation cost nearly that of the $1,200 per kWplant anticipated to be built in 7 years. Capacity factor also exerts a significant influence ongeneration cost. However, the effect of longer plant life is relatively minor because thesebenefits occur in the distant future and are discounted.
Table 7: Effects of Capacity Factor, Construction Period, and Plant Life on First-PlantNuclear LCOE for Three Reactor Costs, $ per MWh, 2003 Pricesa
Overnight CostCapacityFactor,Percent $1,200 per kW $1,500 per kW $1,800 per kW
5-year construction periodPlant Life Plant Life Plant Life
40 years 60 years 40 years 60 years 40 years 60 years85 47 47 54 53 62 61
90 44 43 51 50 58 58
95 42 41 49 48 56 55
7-year construction periodPlant Life Plant Life Plant Life
40 years 60 years 40 years 60 years 40 years 60 years85 53 53 62 61 71 70
90 50 49 58 58 67 66
95 47 47 56 55 64 63aIdentical to Table 5-6.

S-9
Table 8 presents LCOEs for coal and gas alternatives. Given the capital cost range, theLCOE of new nuclear plants in the absence of federal financial policies is from $53 to $71 perMWh with a 7-year construction time. The range is from $47 to $62 per MWh with a 5-yearconstruction time. Costs remain above the range of competitiveness with coal and gasgeneration, which have LCOEs ranging from $33 to $45 per MWh. For the $1,500 and $1,800per kW plants, FOAKE costs of roughly $300 per kW are assumed to be paid off with the firstplant, which lowers the LCOE for the second plants by 13 to 15 percent.
Table 8: LCOEs for Pulverized Coal and Gas Turbine Combined Cycle Plants,$ per MWh, 2003 Pricesa
Coal 33 to 41Gas 35 to 45
aFrom Tables 5-4 and 5-5.
Part Two: Outlook for Nuclear Energy’s Competitors
Gas and Coal Technologies
This study examines the near-term prospects for improvements in gas- and coal-firedelectricity generation that would affect their costs relative to nuclear power. Table 9 summarizesthe cost estimates, construction times, and thermal efficiencies of fossil-fired electricitygeneration. Some modest thermal efficiency improvements are foreseen in the near term for gastechnologies, but similar improvements for coal technologies appear to be farther in the future.The most common combustion technology used in coal plants recently built in the United Statesis pulverized coal combustion. Fluidized bed combustion is a cleaner alternative, and thethermal efficiency of most fluidized beds used for power generation is similar to that ofpulverized coal. However, the cost competitiveness of fluidized bed combustion remains aquestion. Integrated coal gasification combined cycle, while attractive from the perspective ofthermal efficiency and emissions, is likely to be too expensive to enter the U.S. market in thenear term. More advanced coal-fired technologies are still in early R&D stages.
Since fuel costs are generally two-thirds of the levelized cost of gas-generated power, a5 percentage point increase in efficiency in gas turbine combined cycle plants could decrease thecost of gas-generated electricity by approximately 8 percent.

S-10
Table 9: Cost Characteristics of Fossil-Fired Electricity Generationa
PulverizedCoal
Combustion
Coal,CirculatingFluidized
Bed
Coal,Integrated
GasificationCombined
Cycle
GasTurbine
CombinedCycle
Capital Cost ($ per kW) 1,189 1,200 1,338 590Fuel Cost ($ per MWh) 11.26 12.04 9.44 23.60Total Operations and MaintenanceCost (O&M) ($ per MWh) 7.73 5.87 5.19 2.60Construction time (years) 4 4 4 3Current Thermal Efficiency (percent) 30 to 35 30 to 35 40 to 45 55 to 60R&D Thermal Efficiency Targets(percent) 45 45 60 65
a Identical to Table 6-6.
Fuel Prices
This study examines forecasts for three fuels: coal, natural gas, and uranium.
Coal and Gas
Coal supplies worldwide are expected to be sufficiently price elastic that even a doublingof demand would not increase price appreciably. Previous forecasts generally agree that coalproduction will increase 35 to 50 percent over the next 25 years. Forecasts for the U.S. coalprice to utilities uniformly predict a decline of about 10 percent.
Forecasts for natural gas prices are mixed (see Table 10). EIA’s forecasts have changedsharply as prices experienced during the base years of 2000 to 2003 have fluctuatedconsiderably. Expressed in 2003 prices, the Lower 48 wellhead price rose from $3.93 per 1000cu. ft. in 2000 to $4.24 in 2001, then fell to $3.02 in 2002. The 2003 price of $5.01 was thehighest in recent years. EIA’s 2003 forecast for 2020, in 2003 prices, was $3.75, but its 2004forecast for the same date is $4.34. The 2002 price of $3.02 was below both 2020 forecasts, butthe 2003 price of $5.01 was well above both. As Table 10 shows, EIA’s 2004 forecast for 2020was for an 11 percent increase over 2000 prices, equivalent to a 40 percent increase over 2002prices but a 13 percent decrease from 2003 prices.

S-11
Table 10: Natural Gas Price Projectionsa
Year 2000b 2005 2010 2015 2020NEMSc, Lower 48 U.S.Wellhead Price, AEO2003 100d 75 86 93 96NEMSc, Lower 48 U.S.Wellhead Price, AEO2004 100d 92 88 109 111
aAbridged version of Table 7-2, Year 2000=100.bYear 2000=100.cNational Energy Modeling System (NEMS).d$3.93 per 1,000 cu. ft.
Sensitivity analyses for gas-fired LCOEs use three alternative time paths for natural gasprices. One is an average of the 2001and 2002 gas price, which results in forecasts for 2010 to2015 of $3.39 per MMBtu, assumed constant over the plant life. Another uses the 2003 gas priceforecast for 2010 to 2015 of $4.30, also assumed constant over the plant life. The third usesEIA’s 2004 forecast of gas prices from 2015 through the end of the plant life, which begins at$4.25 in 2015, peaks at $4.51 in 2021, falls to $4.48 by 2025, and remains at that level for theremainder of the plant life. All prices are in 2003 dollars.
Uranium
The supply elasticity of uranium is estimated by several sources to be between 2.3 and3.3, which should be sufficiently large to keep uranium prices down in the range of $15 perpound over the next several years. Since fuel cost accounts for only about 10 percent of totalnuclear generation cost, variation in uranium prices will have only a limited effect on the overallcost of nuclear generation of electricity.
Environmental Policies
As opposed to technology advances and possible fuel price decreases that could reducecoal- and gas-fired costs, environmental considerations could raise the cost of these sourcesbecause they emit air pollutants. This study assesses potential cost increases from more stringentenvironmental compliance for coal- and gas-generated electricity.
• Despite global climate concerns, carbon remains an important but largelyuncontrolled emission that could be subject to future controls through carbon captureand sequestration.
• Although the technologies of carbon capture, transport, injection, and sequestrationare not yet commercialized, estimates of current and future costs are available.

S-12
Assuming 100 km transportation by pipeline, this study reports the following costsper MWh generated:
o $36 to $65 per MWh for pulverized coal, including an energy penalty of 16 to 34percent
o $17 to $29 per MWh for gas turbine combined cycle, including an energy penaltyof 10 to 16 percent
o $20 to $44 per MWh for integrated gasification combined cycle, including anenergy penalty of 6 to 21 percent
• An alternative measurement of the future costs of carbon control can be obtained byexamining permit markets. In particular, prices generated through permit markettrading can be interpreted as the approximate future cost of reducing presentemissions. This study uses a carbon price range of $50 to $250 per ton to constructupper and lower bounds of the electricity cost impact. For coal-fired electricity, thecost impact is likely to be between $15 and $75 per MWh; for gas-fired electricity,the cost impact is likely to be between $10 and $50 per MWh. These estimates aresubject to significant uncertainty, particularly because of uncertainty about the overallamount of carbon that will be controlled.
Part Three: Nuclear Energy in the Years Ahead
Nuclear Energy Scenarios: 2015
The year 2015 is chosen as a reasonable year for the first new nuclear plants to come online, allowing for time lags required for design certification, site selection and planning,licensing, and construction. This study considers the effects of several possible federal policiestargeting the first plants.
Individual Federal Financial Policies Considered for the First Plants
• According to this study’s financial model, a loan guarantee of 50 percent ofconstruction loan costs would reduce the nuclear LCOE for the lowest-costreactor from $53 to $49 per MWh (see Table 11).
• Accelerated depreciation would reduce the LCOE for the lowest-cost reactor to$47 per MWh (see Table 12).
• An investment tax credit of 20 percent, refundable so as to be applicable as anoffset to a utility’s non-nuclear activities, would reduce the nuclear LCOE to $44per MWh for the lowest-cost reactor (see Table 13).

S-13
• A production tax credit of $18 per MWh for the first 8 years (as proposed in 2004legislation) would reduce the LCOE of the lowest-cost reactor to $38 per MWh,which is within the required competitive range (see Table 14).
This study uses a 7-year construction schedule because the financial community is likelyto assume that duration for the first plants constructed, for financial planning purposes. Ifshorter construction times are proven with early experience, the construction period used forfinancial planning would be reduced accordingly for subsequent plants.
Table 11: Nuclear LCOEs with Loan Guarantees, $ per MWh, 2003 Pricesa
Loan Guarantee PolicyMature Design$1,200 per kW
New Design$1,500 per kW
Advanced NewDesign
$1,800 per kW 0 (no policy) 53 62 7125 percent of loan 50 58 6750 percent of loan 49 57 65
aFrom Table 9-3.
Table 12: Nuclear LCOEs with Accelerated Depreciation Allowances,$ per MWh, 2003 Pricesa
Depreciation PolicyMature Design$1,200 per kW
New Design$1,500 per kW
Advanced NewDesign
$1,800 per kW15 years (no policy) 53 62 717 years 50 58 67Expensing (1 year) 47 54 62
aFrom Table 9-4.
Table 13: Nuclear LCOEs with Investment Tax Credits, $ per MWh, 2003 Pricesa
Tax Credit PolicyMatureDesign
$1,200 per kW
New Design$1,500 per kW
Advanced NewDesign
$1,800 per kW0 percent (no policy) 53 62 7110 percent 47 55 6320 percent 44 51 58
aFrom Table 9-5.

S-14
Table 14: Nuclear LCOEs with Production Tax Credits, $18 per MWh, 8-Year Duration,$ per MWh, 2003 Prices
Tax Credit Policy Mature Design$1,200 per kW
New Design$1,500 per kW
Advanced New Design$1,800 per kW
0 (no policy) 53 62 71
$18 per MWh, 8-yearduration
38 47 56aFrom Table 9-6.
Combination of Federal Financial Policies and Streamlined Licensing
While the most of the individual financial policies considered in this study appear to beinsufficient to enable nuclear power to enter the marketplace competitively, the financial modelindicates that a combination of policies at reasonable levels could do so. As shown in Table 15,an $18 per MWh production tax credit for 8 years together with a 20 percent investment taxcredit could bring the LCOE of the lower-cost reactors ($1,200 and $1,500 per kW) within thecompetitive range with a 7-year anticipated construction time. This policy package would bringthe LCOE of the $1,800 per kW reactor close to the anticipated competitive range with the 7-year construction time and well within it with a 5-year construction period.
Table 15: Effects of Combined $18 per MWh 8-Year Production Tax Credits and20 Percent Investment Tax Credits on Nuclear Plants’ LCOEs, $ per MWh, 2003 Prices
Mature Design$1,200 per kW
New Design$1,500 per kW
Advanced New Design$1,800 per kW
Construction Time Construction Time Construction Time
5 years 7 years 5 years 7 years 5 years 7 yearsNo policies:
47 53 54 62 62 71With combination of policies:
26 31 31 38 37 46 aIdentical to Table 9-7.
Nth Plants and Nuclear Competitiveness
Under aggressive assumptions regarding learning by doing, the LCOE for the fifth plant,when most learning has been achieved, is $44 per MWh for the lowest-cost nuclear reactor,assuming that for the first plant the business community anticipates a construction period of 7years and uses a 3 percent risk premium on debt and equity interest rates (see Table 16).

S-15
Table 16: LCOEs for the Fifth Nuclear Plant, with No Policy Assistance, 7-YearConstruction Time, 10 Percent Interest Rate on Debt, and 15 Percent Rate on Equity
$ per MWh, 2003 Pricesa
Initial Overnight Cost, $ per kWLearning Rate(Percent for Doubling Plants Built) 1,200 and 1,500 1,800
3 50 585 48 5610 44 52
aFrom Table 9-8.
This study goes on to report LCOEs for the fifth plant assuming that, with favorableregulatory experience, the business community comes to expect a 5-year construction period andmore favorable risks, comparable to gas and coal. Under these conditions, the fifth-plant LCOEsfor nuclear reactors reach the required range of competitiveness. The two lower-cost nuclearreactors have LCOEs of about $35 per MWh even under the most pessimistic learning rate (seeTable 17). If the reduced risk encourages a higher ratio of debt to equity in financing, LCOEswould be further reduced: by nearly 3 percent with 60 percent debt instead of 50 percent or by8.5 percent with 70 percent debt instead of 50 percent.
This study found that, even under pessimistic learning assumptions, nuclear power couldbecome self-sufficient in the market after cessation of initial policy assistance if overnight costswere $1,200 or $1,500 per kW and a 5-year construction schedule was maintained. Dependingon where fossil LCOEs emerge within the ranges calculated here, the $1,800 per kW nuclearplant could become self-sufficient as well.
Table 17: LCOEs for the Fifth Nuclear Plant, with No Policy Assistance, 5-YearConstruction Time, 7 Percent Interest Rate on Debt, and 12 Percent Rate on Equity
$ per MWh, 2003 Pricesa
Initial Overnight Cost, $ per kWLearning Rate(Percent for Doubling Plants Built) 1,200 and 1,500 1,800
3 35 405 34 3910 32 36
aFrom Table 9-11.

S-16
Robustness of Conclusions
The results of this study are sensitive to assumptions about overnight costs and plantconstruction times, but are not very sensitive to assumptions about plant life and capacity factors.
Environmental Policies for Fossil Generation
Stringent measures to control greenhouse gases would raise costs for both gas- and coal-firedplants, making nuclear energy easily competitive in the market place, as shown in Table 18.
Table 18: Fossil LCOEs with and without Greenhouse Policies,$ per MWh, 2003 Pricesa
Under Current EnvironmentalPolicies
Under GreenhousePolicy
Coal-Fired 33 to 41 83 to 91Gas-Fired 35 to 45 58 to 68
aIdentical to Table 9-12.
2025 and Beyond
The long gestation periods involved in nuclear energy research and the long lags entailedin gearing up the nuclear industry to construct new power plants make it prudent to look severaldecades ahead when making decisions about nuclear energy policy.
Nuclear Energy Technology. The importance of cost reductions from first-of-a-kind-engineering (FOAKE) costs and learning by doing beyond FOAKE has been documented in thisstudy. If presently available Generation III technologies are deployed for several yearsbeginning in 2015, as contemplated in this study, significant cost reductions from theirreplication could extend to 2025 and beyond. Research and development on Generation III andIV designs is expected to allow commercialization of lower-cost reactors in later years.
Global Warming. The longer the time horizon, the more likely the United States willplace an increased priority on global warming, leading to an urgent need to replace coal- andgas-fired electricity generation. In view of the time it takes to gear up the nuclear industry, theprospect of this need is one of the reasons for national concern with maintaining a nuclear energycapability. If environmental policies greatly restrict carbon emissions in the period after 2025,fossil-fired LCOEs could increase by 50 to 100 percent over current levels. Nuclear powerwould then acquire an unquestioned cost advantage over its gas and coal competitors.
Hydrogen. The widespread introduction of hydrogen-powered vehicles to replacegasoline-powered vehicles would greatly increase the demand for energy to produce hydrogen.Some impacts could occur by 2015, but this study is conservative and does not consider those

S-17
impacts when projecting demand for nuclear energy in the 2015 timeframe. If the expressednational commitment to developing a commercially viable hydrogen vehicle proves successful,nuclear power could become a major producer of this transportation fuel. A full analysis of theimplications of increased demand for hydrogen is beyond the scope of this study.
Despite the many uncertainties in the future beyond 2025, the findings in this studysuggest the likelihood of an increased demand for nuclear energy beyond 2025.
APPENDIX
Background
Purpose and Organization of Study
This study aims to synthesize what is known about the factors affecting the economicviability of nuclear power and to estimate its viability under a range of future scenarios. Thefocus is on generating baseload electricity—nuclear, coal-fired, and gas-fired technologies.Renewables are not considered because they are rarely used to meet baseload demand. Whilehydroelectric facilities supply baseload generation to some parts of the United States, the majoropportunities for hydroelectric projects have already been taken.
Electricity Futures
This study uses two principal types of models to investigate electricity futures:
• Plant models calculate the cost of electricity generation from a specific type of powerplant. Costs are calculated on a levelized basis (LCOE), combining operating and capitalcosts to arrive at a cost per megawatt-hour (MWh), that must be recouped in the price ofelectricity. Costs are calculated at the busbar level in order to focus on electricitygeneration costs and abstract from locally varying distribution costs.
• Market models forecast the demand for electricity and the mix of electricity generatingcapacity that will come online to meet future levels of expected demand. Aggregatedemand and supply functions are estimated and brought together to simulate marketbehavior, often at the regional level.
Table A-1 summarizes the characteristics of the various plant and market models that arereviewed in this study. The table distinguishes the plant types, forecast horizons, treatments ofenvironmental costs, and nuclear power data sources that have been used.

S-18
Table A-1: Plant and Market Model Summarya
Model Identification Plant TypeForecastHorizon
Treatment ofEnvironmental
Costs
Source ofNuclear Power
DataPlant Models
Scully Capital-DOE(Nuclear Energy)
Nuclear(AP1000)
Up to2010 No Vendor, 2002
Electricity GenerationCost Simulation Model(GenSim)/Sandia
Widespectrum ofenergysources
Current year Has capability EnergyInformationAdministration(EIA) and Platt’s(McGraw-Hill)Database, 2003
MIT Study Nuclear, coal,gas
Up to2050 Carbon tax EIA, 2003
Market Models
National EnergyModeling System(NEMS)-EIA
Widespectrum ofenergysources
20 years frompresent
No EIA, 2003
NEMS-Electric PowerResearch Institute (EPRI)
Nuclear, coal,gas
Up to 2050 Carbon tax Vendors, 2002
All Modular Industry GrowthAssessment Modeling System(AMIGA)/ Pew CharitableTrust
Widespectrum ofenergysources
Up to 2035 Yes ArgonneNationalLaboratory,Vendors, 2001
Integrated Planning Model(IPM)/EnvironmentalProtection Agency (EPA)
Nuclear, coal,gas
20 years frompresent
Yes EIA
Hybrid Models
Science ApplicationsInternational Corporation(SAIC) Power Choice Model
Nuclear, coal,gas
80 years frompresent
Carbon tax DOE andVendors, 2001
aIdentical to Table A2-1.
Within each model category, different underlying numerical assumptions cause theprincipal differences in electricity cost projections. The most significant of these are differencesin capital costs and interest rates for nuclear capacity, capital costs for coal generation, and fuelcosts for gas generation. The market models are sufficiently complex that reasons fordifferences in their projections frequently are difficult to pinpoint. Plant models are better suitedfor studying the economic viability of nuclear energy. However, while the plant modelstructures are straightforward, documentation of underlying data is not always sufficient to allowdetailed economic analysis. Four of the plant models, identified in bold font in Table A-1, areused for comparison purposes later in this study: the Scully model, GenSim, NEMS, and SAIC’sPower Choice model.

S-19
Need for New Generating Capacity in the United States
This study analyzes future electricity demand and compares it with existing capacity toestimate a future time range when construction of added capacity must start. Projections by EIAand the North American Electric Reliability Council (NERC) are compared with projectionsbased on historical relationships between electricity demand growth and gross domestic product(GDP) growth. The historical relationships estimated for this study imply electricity demandgrowth rates that are roughly one percentage point higher than EIA’s forecasts and a halfpercentage point above NERC’s forecasts. From a national perspective, even with an annualgrowth rate in electricity demand of 2.7 percent, which is above the EIA and NERC forecasts,new capacity will not be needed before 2011. On a regional basis, new capacity may be requiredas early as 2006. (See Appendix A3, “Need for New Generating Capacity in the United States.”)
Major Issues Affecting the Nuclear Power Industry in the U.S. Economy
Technologies for New Nuclear Facilities
The nuclear reactors currently in use in the United States, denoted as Generation II, weredeployed in the 1970s and 1980s. They include boiling water reactors and pressurized waterreactors. Advanced modular reactor designs are denoted as Generation III. Some have passivesafety features, and all have been developed to be more cost competitive. Generation III designsinclude the ABWR design and the pressurized water reactor, both of which use passive safetysystems; they also include the AP600/AP1000 and the light-water-cooled heavy-water-moderated CANDU ACR-700. The nuclear industry has continued to develop yet moreinnovative Generation III+ designs. Generation III+ designs may have lower generating coststhan Generation III designs, but the U.S. Nuclear Regulatory Commission (NRC) has not yetcertified them, and their cost estimates have greater uncertainty. DOE is developing GenerationIV nuclear energy systems that use even more advanced designs intended to further reduce lifecycle costs.
Table A-2 summarizes the characteristics and NRC certification status of the reactordesigns reviewed in this study.

S-20
Table A-2: Summary of New Reactor Designsa
Design Supplier Size and TypeU.S. Deployment
Prospects and OverseasDeployment
NRC Certification Status
ABWR General Electric 1,350 MW BWR Operating in Japan, underconstruction in Taiwan.
Certified in 1996.
AP1000 Westinghouse 1,090 MW PWR Additional design work tobe done before plant readyfor construction.
Design certificationexpected September 2005.
SWR 1000 Framatome AdvancedNuclear Power (ANP)
1,013 MW BWR Under consideration forconstruction in Finland,designed to meet Europeanrequirements.
Submission of materials forpre-application review tobegin in mid-2004. Pre-application reviewcompletion expected 2005.
CANDUACR-700
Atomic EnergyCompany, Limited(AECL)TechnologiesInc., U.S. subsidiary ofAECL
753 MW HWR Deployed outside Canada inArgentina, Romania, SouthKorea, China, and India.
Pre-application reviewscheduled to be completedby NRC, June 2004.
AP600 Westinghouse 610 MW PWR Additional design work tobe done before plant readyfor construction.
Design is certified, butactual construction will besuperseded by AP1000.
SimplifiedBoiling WaterReactor(ESBWR)
General Electric 1,380 MW BWR Commercialization plan notlikely to supportdeployment by 2010.
Pre-application reviewcompletion expected in early2004. Application for designcertification to be submittedmid-2005.
PBMR British Nuclear Fuels(BNFL)
110 MW Modularpebble bed
No plan beyond completionof South African project.
Pre-application reviewclosed September 2002 withdeparture of Exelon.
GT-MHR General Atomics 288 MWPrismatic graphite
Licensed for construction inRussia.
Design certificationapplication would begin byend of 2005.
InternationalReactorInnovative andSecure (IRIS)Project
Westinghouse 100 to 300 MWPWR
Plans to deploy between2012 and 2015.
Design certification reviewto begin 2006.
EuropeanPressurizedWater Reactor(EPR)
Framatome-ANP 1,545 to 1,750 MWPWR
No decision on U.S.market.
Ordered for deployment inFinland.
System 80+ Westinghouse 1,300 MW PWR Plants built in Korea.Design not planned to bemarketed in United States.
Certified May 1997.
Advanced FastReactor; PowerReactorInnovativeSmall Module(AFR; PRISM)
General Electric,Argonne NationalLaboratory
300 to 600 MW,sodium-cooled
Began certification in the1990s.
No action taken.
aIdentical to Table A4-2.

S-21
Nuclear Fuel Cycle and Nuclear Waste Disposal
This study analyzes the economic costs of nuclear power contributed by the nuclear fuelcycle. It also considers two options for spent fuel disposition: (1) on-site storage followed bycentralized disposal and (2) on-site storage and reprocessing, followed by centralized disposal.Recycle of mixed-oxide fuel was not considered. The front-end costs of nuclear fuel are relevantregardless of which disposition alternative is used. As shown in Table A-3, these costs amountto $3.50 to $5.50 per MWh or 5 to 12 percent of the cost of nuclear power generation. In theUnited States, the direct method of spent fuel disposal has been used to date, withoutreprocessing of spent fuel. The costs of disposal consist of on-site storage costs while awaitingpermanent storage, plus a charge levied to pay for eventual permanent storage or disposal at acentralized site. The back-end costs are about $1.10 per MWh, as shown in Table A-4, which isabout 2 percent of the overall LCOE. Plausible differences in fuel cycle costs are not a majorfactor in the economic competitiveness of nuclear power.
Table A-3: Components of Front-End Nuclear Fuel Costs, $ per kg U, 2003 Pricesa
Process Step DirectOutlays
InterestCost
Total Cost
Ore Purchase 222 to 353 94 to 150 316 to 503Conversion 40 to 94 15 to 35 55 to 129Enrichment (per kg SWU) 606 to 951 197 to 306 804 to 1,259Fabrication 193 to 250 54 to 69 246 to 319 Total 1,420 to 2,209 $ per MWh 3.56 to 5.53
aAbridged version of Table A5-1.
Table A-4: Disposal Costs, $ per MWh, 2003 Pricesa
aIdentical to Table A5-2.
Nuclear Regulation
Federal Regulation 10 CFR Part 52 was adopted in the 1990s. It provides for combinedconstruction and operation permitting and is aimed at streamlining the permitting process. Thecombined Part 52 license is designed to allow investors to resolve many historically importantuncertainties before committing large amounts of money to a nuclear facility. This studyanalyzes the economic advantages that such regulatory streamlining can provide, both directly by
Fuel Cycle Component No ReprocessingTemporary on-site storage 0.09Permanent disposal at Yucca Mountain 1.00Total 1.09

S-22
reducing construction delays, and indirectly by reducing the risk premium necessary tocompensate investors for possible delays or cancellations due to regulatory difficulties. Forexample, as more new nuclear plants are built well beyond 2015, this study finds that maturedesigns already in operation could generate energy that could be competitive with gas-firedelectricity, if the nuclear licensing period could be reduced to five years (see Table 17 above).
Nonproliferation Goals
This study reviews international arrangements aimed at preventing nuclear proliferation.Some countries have chosen direct disposal of spent nuclear fuel, while others have chosenrecycling of spent fuel. In the United States, policy decisions regarding direct disposal versusrecycling must be reviewed when DOE considers a second repository. By statute, DOE mustreport to Congress on or after January 1, 2007, but not later than January 1, 2010, on the need fora second repository. (See Sec. 161(b), P.L. Law 97-425.) The uranium extraction (UREX)process was developed as a variant of plutonium-uranium extraction (PUREX). DOE iscurrently conducting R&D on further recycling technologies, including pyrometallurgicalprocessing. In the future, an innovative fuel cycle that strongly resists nuclear proliferation, suchas pyrometallurgical processing, will be pursued. The President recently announced a policy tocap the deployment of new reprocessing technologies outside a select group of countries.Nevertheless, the future economic viability of nuclear power does not depend on decisions aboutdirect disposal versus reprocessing. As Appendix A6 shows, differences in the cost of nuclearwaste handling between these two alternatives is too small to materially affect the economicviability of nuclear power.
Hydrogen
This study reviews the prospects of hydrogen as a transportation fuel that would reduceU. S. dependence on foreign oil and could have potentially large environmental benefits. Massproduction costs need to be reduced by roughly one-half to two-thirds to achieve widespreadadoption of hydrogen vehicles. The environmental benefits of hydrogen would be tempered tothe extent that fossil fuels, with their attendant carbon emissions, were used to produce thehydrogen. Carbon emissions from oil would then simply be replaced by emissions from fossil-fuel power generation or steam methane reforming. Nuclear energy, on the other hand, wouldprovide a pollution-free input to hydrogen production. A hydrogen economy, accompanied bymore stringent control of carbon emissions, could greatly expand the demand for nuclear power.
Energy Security
This study considers the energy security benefits of nuclear power as a potential source ofhydrogen to replace oil in the transportation sector and more generally as a substitute for gas-generated electricity. Energy security has been analyzed primarily in connection with oil and thepolitical instability of the Middle East. A direct link to electricity is limited by the small amountof electricity produced using oil. However, nuclear energy could help ease oil security concernsif hydrogen is cogenerated for transportation. Currently, the United States imports about 4percent of its natural gas consumption in the form of liquefied natural gas (LNG), but thatpercentage could grow if many new gas-fired electricity generating plants are built and if North

S-23
American gas production expands only sluggishly. As international trade in LNG becomes moreextensive and the United States imports increase, this energy security linkage could becomemore important, if nuclear electricity substitutes directly for gas-generated electricity.
This study considers potential supply and demand shocks from environmental, nationalsecurity, and other risks affecting choices among electricity generation technologies.Maintaining some nuclear capacity now could avoid a costly and lengthy adjustment of gearingup a nuclear industry that might otherwise be in a run-down condition. This study uses adecision-making model to develop a numerical example of a portfolio of fossil and nuclearelectrical generating capacity. In this example, 25 percent of new capacity would be nuclear.Further research is needed to refine this analysis.

S-24