Embed Size (px)
Citation preview

Tourism Satellite Account Calendar Year 2014
The Economic Impact of Tourism in New Jersey

2
Key results
Despite the headlines of casino closures, the New Jersey travel economy grew in in 2014.
■ Tourism demand grew 3.8% in 2014 to reach $42.1 billion
■ Visitation expanded 4.4% with the leisure segment out-performing the overall market
Favorable weather helped to drive strong growth in bed tax receipts for the shore counties in the summer months, approaching 10% above year-ago levels.
Statewide impact growth was less robust, restrained by two factors:
■ The Atlantic City correction – multiple casino closures with associated job losses
■ 2014 year-over-year comparisons with the strong 2013 growth related to Superstorm Sandy’s positive impact on off-season hotel rentals

3
Key results, continued In 2014, the tourism industry directly supported 315,952 jobs in
New Jersey and sustained nearly 508,000 jobs including indirect and induced impacts.
Including all impacts, the industry accounts for 9.9% of total employment or nearly 1-in-10 jobs in New Jersey.
The tourism sector generated $36.4 billion of state GDP in 2014, representing 6.6% of the entire state economy.
Including indirect and induced impacts, tourism in New Jersey generated $10 billion in government revenues last year, including $4.6 billion in state and local tax revenues.
Without the tourism industry, New Jersey households would pay $1,460 more each in order to maintain the current level of state and local government services.

4
Industry indicators
Visitor trips to NJ destinations grew 4.4% to 93.2 million in 2014. (source: DKSA, NTTO)
Hotel room demand fell 0.6%. Excluding Atlantic County, hotel room demand grew 1.2%. (source: STR)
The hotel average daily rate increased by 2.9% in 2014, helping overall hotel room revenue grow 2.4%. (source: STR)
State and municipal bed tax receipts grew 3.6% in 2014. (source: State Treasurers Office)
Casino win declined 4.5%. This is the smallest decline since 2007. (source: Division of Gaming Enforcement)

Economic Impact Analysis The importance of measurements

6
By monitoring tourism’s economic impact, policy makers can make informed decisions regarding the funding and prioritization of tourism development.
It can also carefully monitor its successes and future needs.
In order to do this, tourism must be measured in the same categories as other economic sectors – i.e. tax generation, employment, wages, and gross domestic product.
Why quantify the tourism economy?

7
What is this a challenge?
Most economic sectors such as financial services, insurance, or construction are easily defined within a country’s national accounts statistics.
Tourism is not so easily measured because it is not a single industry. It is a demand-side activity which affects multiple sectors to various degrees.
Tourism spans nearly a dozen sectors including lodging, recreation, retail, real estate, air passenger transport, food & beverage, car rental, taxi services, travel agents…

8
The Tourism Satellite Account
The TSA was conceived by the UN World Tourism Organization and has since been ratified by the UN, Eurostat, and OECD.
The standard has been adopted by over fifty countries around the world and a growing number of US States.
The TSA deals with the challenge of measuring tourism in two important ways:
■ Defines the tourism economy
■ Provides methodology for calculating tourism GDP in a way that is consistent with economic accounts

9
Benefits of a TSA
Enables comparisons of the importance of tourism to other sectors of the economy in terms of GDP, employment, and income
Allows for benchmarking to other destinations
Tracks the economic contribution of tourism over time
Monitors strength by tracking capital investment
Allows for extension analysis for of the full impact of tourism

10
Important definitions
1. Tourism Industry: Measures the value of traveler activity within “tourism characteristic industries”. This concept measures only the direct impact of the travel industry.
2. Tourism Economic Impact: Includes the tourism industry plus government spending and capital investment in support of tourism. This is the basis of the total economic impact analysis, including direct, indirect and induced impacts.

11
Illustrating the concepts
Travel & Tourism Industry
■ The direct effect of visitor spending
■ Focus of Tourism Satellite Account
Travel & Tourism Economic Impact
The flow-through effect of T&T all demand across the economy
■ Expands the focus to measure the overall impact of T&T on all sectors of the economy
ACCOMMODATION

Tourism Sales The business generated by tourism

13
Key traveller spending trends in 2014
By many traditional measures, 2014 was a strong year.
■ Visitor volume numbers grew by more than 4%.
■ Summer hotel bed taxes expanded nearly 10% in shore counties.
■ There were no major weather events shutting down parts of the state for any extended period of time.
Despite this performance, spending growth was not as robust as might be expected.
■ While many displaced residents were staying in hotels in early 2013, this was not the case in 2014. As a result room demand was significantly lower in impacted areas in 2014 for the first four months of the year.
■ Spending was constrained due to the continued decline of casino ‘win’ in NJ.

14
Visitation showing continued growth last year
72.9 75.5 72.666.1
71.079.2
86.4 89.3 93.2
0102030405060708090
100
2006 2007 2008 2009 2010 2011 2012 2013 2014
$
New Jersey Trip Volumemillions
Source: D.K. Shifflet, NTTO
NJ attracted 93.2 million visitors in 2014—a 4.4% gain

15
Domestic visitation… by trip purpose
8.5 7.7 6.0 7.2 7.5 7.8 8.1 8.1
30.2 29.826.3 30.5 33.4 37.0 38.1 40.3
5.2 5.44.5
4.2 4.24.2 4.2 4.2
30.2 28.328.0
27.632.4
35.9 37.5 39.1
0
10
20
30
40
50
60
70
80
90
100
2007 2008 2009 2010 2011 2012 2013 2014
Day Business Day Leisure Overnight Business Overnight Leisure
Source: D.K. Shifflet
New Jersey Domestic Trip Volumeby Year, by trip purpose
New Jersey domestic visitation growth outpaced the nation in 2014.
Leisure visitation led overall market growth in the state with overnight leisure trips growing 4.4%.

16
Tourism sales surpasses prior peak
$37.3
$35.5
$34.3 $34.6
$36.8
$37.9$38.6
$40.0
-6%
-4%
-2%
0%
2%
4%
6%
8%
$31$32$33$34$35$36$37$38$39$40$41
2007 2008 2009 2010 2011 2012 2013 2014Industry Sales % Change
$
Tourism Industry SalesUS$ Billions
Source: Tourism Economics
Direct tourism industry sales within NJ rose 3.7% in 2014.
$40 billion was spent by visitors in New Jersey.
Spending growth has averaged 3.1% annually since 2009, increasing by 16% cumulatively.
Sector 2007 2008 2009 2010 2011 2012 2013 2014 % ChangeLodging $11,907 $11,674 $11,544 $11,542 $11,343 $11,232 $10,914 $11,051 1.3%
Other Transport $4,942 $4,958 $4,395 $4,351 $4,944 $5,295 $5,220 $5,487 5.1%Air $948 $973 $1,059 $1,098 $1,261 $1,261 $1,307 $1,370 4.8%
Food & bev. $8,193 $8,065 $7,654 $7,712 $8,412 $8,892 $9,283 $9,720 4.7%Retail $7,656 $6,074 $5,884 $5,921 $6,561 $6,812 $7,130 $7,452 4.5%
Recreation $3,693 $3,774 $3,753 $3,953 $4,233 $4,392 $4,702 $4,909 4.4%TOTAL $37,339 $35,519 $34,288 $34,577 $36,753 $37,884 $38,556 $39,989 3.7%
% Change -4.9% -3.5% 0.8% 6.3% 3.1% 1.8% 3.7%
Tourism Industry Sales(US$ Million)

17
Tourism industry sales by visitor type
Business $4.2 Day $3.6 Domestic $36.8Leisure $35.8 Overnight $36.3 Overseas $3.0
Canada $0.2Total $40.0 Total $40.0 Total $40.0
Business 10.6% Day 9.1% Domestic 92.1%Leisure 89.4% Overnight 90.9% Overseas 7.5%
Canada 0.4%
Tourism Industry Sales in 2014(US$ Billion)
Purpose Stay Market
SharePurpose Stay Market
Leisure tourism represents 89% of tourism industry sales in NJ.
Overnight visitors to NJ spent $36.3 billion; 91% of the total.
International visitors to NJ spent $3.2 billion in 2014, comprising 8% of all visitor spending.

18
Tourism industry sales by visitor type
10.6% 9.1%
92.1%
89.4% 90.9%
7.5%0.4%
0%
10%
20%
30%
40%
50%
60%
70%
80%
90%
100%
Purpose Stay Market
Perc
enta
ge d
istri
butio
n
Leisure
Day
Overnight
Overseas
Domestic
Business
Canada
Source: Tourism Economics

19
Tourism industry sales by sector
Lodging27.6% Other Transport
13.7%
Air3.4%
Food & bev.24.3%
Retail18.6%
Recreation12.3%
Tourism Industry Sales By Sector
Source: Tourism Economics
Lodging—including casino win, room revenue and second homes—is the largest traveler spending category in NJ, capturing 28% of visitor spending.
Food & beverage spending ranks second, representing 24% of each visitor dollar.
Non-air transportation’s share of the visitor dollar fell below 14% in 2014 as transportation costs stabilized.
20
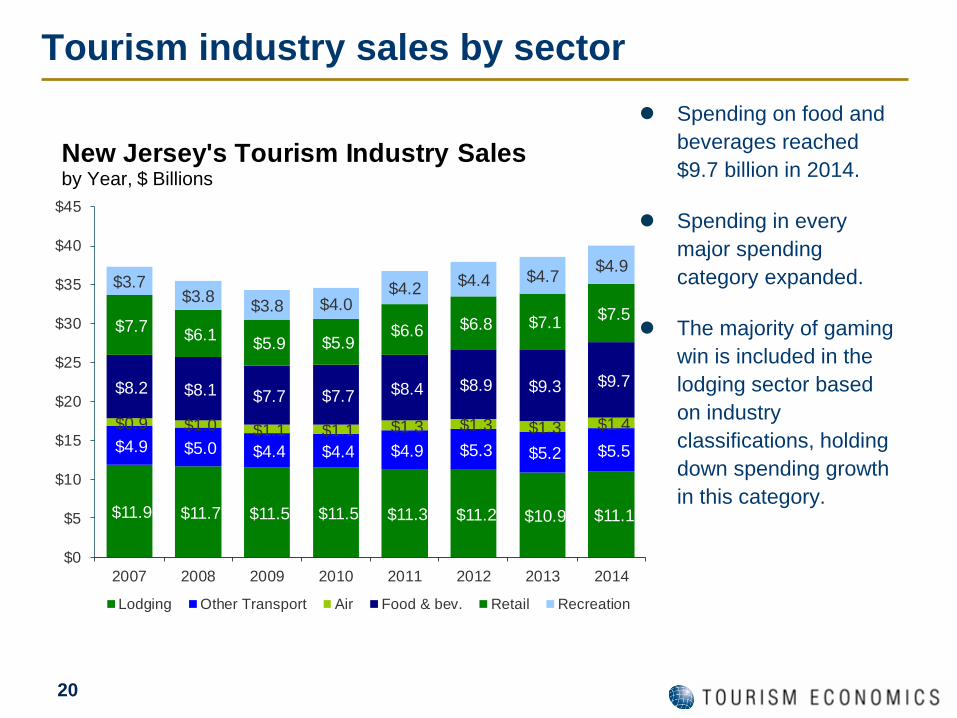
Tourism industry sales by sector
$11.9 $11.7 $11.5 $11.5 $11.3 $11.2 $10.9 $11.1
$4.9 $5.0 $4.4 $4.4 $4.9 $5.3 $5.2 $5.5 $0.9 $1.0 $1.1 $1.1 $1.3 $1.3 $1.3 $1.4
$8.2 $8.1 $7.7 $7.7 $8.4 $8.9 $9.3 $9.7
$7.7 $6.1 $5.9 $5.9 $6.6 $6.8 $7.1 $7.5
$3.7$3.8 $3.8 $4.0
$4.2 $4.4 $4.7 $4.9
$0
$5
$10
$15
$20
$25
$30
$35
$40
$45
2007 2008 2009 2010 2011 2012 2013 2014
Lodging Other Transport Air Food & bev. Retail Recreation
New Jersey's Tourism Industry Salesby Year, $ Billions
Spending on food and beverages reached $9.7 billion in 2014.
Spending in every major spending category expanded.
The majority of gaming win is included in the lodging sector based on industry classifications, holding down spending growth in this category.

21
Tourism industry sales by sector
32.9% 33.7% 33.4% 30.9% 29.6% 28.3% 27.6%
14.0% 12.8% 12.6% 13.5% 14.0% 13.5% 13.7%
2.7% 3.1% 3.2% 3.4% 3.3% 3.4% 3.4%
22.7% 22.3% 22.3% 22.9% 23.5% 24.1% 24.3%
17.1% 17.2% 17.1% 17.9% 18.0% 18.5% 18.6%
10.6% 10.9% 11.4% 11.5% 11.6% 12.2% 12.3%
0%
10%
20%
30%
40%
50%
60%
70%
80%
90%
100%
2008 2009 2010 2011 2012 2013 2014
Lodging Other Transport Air Food & bev. Retail Recreation
New Jersey's Tourism Industry Sales by Year, Share of Total
With the decline in casino revenue in New Jersey, the share of the visitor dollar spent in the lodging industry has gone from over a third down to 27.6%.
With recreational spending out-performing overall spending, its share has grown from 11% in 2009 to 12.3% in 2014.
The share of the visitor dollar spent at F&B businesses has increased two percentage points in just five years.

22
Tourism economy sales The Tourism Satellite Account looks at a broader range of
tourism-related expenditures, tallying $42.1 billion.
Non-visitor private consumption expenditures (PCE) represent tourism consumer durables such as an RV, boat, or furniture for a vacation home.
Government support for tourism includes the budgets for the NJ Division of Travel and Tourism and other budget items in broad support of tourism.
Capital investment (CAPEX) includes construction of hotels and attractions, as well as tourism equipment and infrastructure.
Year Domestic Visitor
International Visitor
Non-Visitor PCE
Gov't Support CAPEX Total
2014 $36,832.4 $3,156.7 $203.5 $130.2 $1,782.4 $42,105.22013 $35,488.4 $3,067.4 $196.2 $125.7 $1,701.3 $40,578.9
% Change 3.8% 2.9% 3.7% 3.6% 4.8% 3.8%
Tourism Satellite Account Spending by Category
(US$ Million)

23
Tourism industry and economy sales
Category Industry EconomyLodging $11,051 $11,051
Food & Beverage $5,487 $5,487Retail $1,370 $1,370
Recreation $9,720 $9,720Air $7,452 $7,452
Other Transport $4,909 $4,909Non-Visitor PCE $0 $203
Investment $0 $1,782Government $0 $130
Total $39,989 $42,105
Tourism Sales, 2014State of New Jersey
The direct impact of tourism is driven by tourism industry sales only. This allows for apples-to-apples comparisons with other industries.
The total economic impact of tourism includes investment in support of tourism, government spending and non-visitor private consumption expenditures (PCE).

24
Tourism economy sales by source
Domestic Visitor87.5%
International Visitor7.6%
Non-Visitor PCE0.5%
Gov't Support0.3%
CAPEX4.2%
Tourism Demand by Source
Domestic visitor markets comprise the majority (87.5%) of tourism sales in New Jersey.
International visitor markets contributed 7.6% of tourism sales last year.
Capital investment in tourism-related construction and machinery & equipment represents 4.2% of tourism economy sales.

Summary of Economic Impacts

26
DIRECT TOURISM SALES Industry Includes: Visitor spending Resident spending Government spending Economy Includes all of the above + Capital investment Government support of tourism
INDIRECT IMPACT Supply chain impacts
INDUCED IMPACT Spending of direct and indirect tourism employees
TOTAL IMPACT Sum of all impacts
- Sales - Jobs - Wages - Taxes
Translating sales into impact Direct tourism sales flow through the NJ economy,
generating GDP, jobs, wages, and taxes.
The indirect impacts measure supply chain (b2b) activity generated by tourism sales.
The induced impacts measure the effects of tourism-generated incomes that are spent within the state.
IMPORT LEAKAGES

27
Tourism impact summary - GDP
$0
$5
$10
$15
$20
$25
$30
$35
$40
Tourism Industry Tourism Economy
Induced
Indirect
Direct
Source: Tourism Economics
Tourism GDP Impact 2014, US$ Billions
Tourism industry GDP directly generated $17.5 billion of New Jersey GDP in 2014.
The tourism economy, including direct, indirect and induced impacts, generated GDP of $36.4 billion. This is 6.6% of the state economy.

28
Tourism impact summary - Jobs
0
100
200
300
400
500
600
Tourism Industry Tourism Economy
Induced
Indirect
Direct
Source: Tourism Economics
Tourism Employment Impact 2014, Thousands
Tourism spending directly supported 315,952 jobs in New Jersey in 2014.
The tourism economy, including direct, indirect and induced impacts, supported 507,903 jobs. This is 9.9% of all jobs in the state.

Direct Tourism Industry What is the direct economic value of tourism-related sectors?

30
Tourism industry impacts
GDP JobsAgriculture, Fishing, Mining - - Construction and Utilities - - Manufacturing - - Wholesale Trade - - Air Transport 614.6 3,950 Other Transport 705.7 9,485 Retail Trade 1,660.9 38,463 Gasoline Stations 302.5 5,151 Communications - - Finance, Insurance and Real Estate 2,230.2 14,192 Business Services 403.0 3,491 Education and Health Care - - Recreation and Entertainment 1,793.3 50,190 Lodging 5,065.4 56,701 Food & Beverage 4,313.6 123,674 Personal Services 373.2 10,657 Government - - TOTAL 17,462.3 315,952
Tourism Impacts
Business Day
Tourism GDP is the value added of those sectors directly interacting with travelers.
The narrow definition of the tourism industry counts only tourism consumption, which excludes capital investment and general government support of tourism. This definition is consistent with economic accounts.
On this basis, tourism industry GDP was $17.5 billion in 2014, accounting for 3.4% of total New Jersey GDP.

31
Why sales and GDP differ
Tourism industry sales in New Jersey equals $40 billion while GDP measures $17.5 billion.
GDP (Gross domestic product) is less than sales because it measures only the locally-produced value of goods and services consumed by visitors.
This includes the local labor, capital depreciation, and the profits of tourism-related companies that are based in New Jersey.
The costs of imported goods (gasoline, food or retail goods) that come from out-of-state are excluded from the GDP calculation.
In addition, business profits from out-of-state companies are also excluded. For example, Wal-Mart profits leave the state.

32
Casino closures impact tourism employment
-4%
-3%
-2%
-1%
0%
1%
2%
3%
300,000
305,000
310,000
315,000
320,000
325,000
2006 2007 2008 2009 2010 2011 2012 2013 2014Tourism Employment Percent Change
$
Tourism EmploymentUnits
Source: Tourism Economics
Tourism employment fell for the first time since 2010.
While most sectors gained jobs, those gains were not enough to make up for the loss of over 7,000 jobs at hotels, related to casino closures.
2006 2007 2008 2009 2010 2011 2012 2013 2014
Tourism Employment 309,355 313,538 318,929 309,499 308,801 312,369 318,560 320,238 315,952Percent Change 1.4% 1.7% -3.0% -0.2% 1.2% 2.0% 0.5% -1.3%
Tourism Employment

33
Ranking tourism employment
Rank Industry 2014
1 Health care and social assistance 605,4802 Retail trade 530,3093 Professional, scientific, and technical services 434,2234 Finance and insurance 342,2335 Accommodation and food services 322,679
6 Tourism 315,9527 Administrative and support services 315,4398 Other services, except public administration 278,9599 Manufacturing 258,12310 Real estate and rental and leasing 258,67711 Wholesale trade 234,93112 Construction 226,29013 Transportation and warehousing 199,23114 Educational services 124,19815 Arts, entertainment, and recreation 114,352
Employment Ranking - Private SectorState of New Jersey
The direct employment contribution of the tourism industry was 315,952 in 2014. This narrow measurement of tourism includes only those jobs directly supported by visitor activity and allows for inter-industry ranking.
Examining the Tourism industry against other private sector industries, tourism is the 6th largest employer in the State of New Jersey.

34
Tourism intensity Tourism is a significant part of several industries – nearly 100% of all employment
in lodging is supported by tourism spending.
100%
6.2%
7.1%
22.1%
29.5%
43.2%
97.4%
0% 20% 40% 60% 80% 100%
Total
Retail
Air Trans.
Food & bev.
Recreation
Lodging
Tourism Employment Intensity by Industry

Total Tourism Economy What is the total economic impact of tourism in New Jersey?

36
Tourism GDP impact
Total tourism demand includes capital investment and general government support of tourism. By this broad definition, tourism activity directly contributed $18.7 billion to GDP in 2014.
In total, including all direct tourism demand, indirect and induced impacts, the tourism sector generated GDP of $36.4 billion. This is 6.6% of the state economy.

37
Tourism GDP impact – total impact
Direct Indirect Induced Total
Agriculture, Fishing, Mining - 25.3 20.2 45.5 Construction and Utilities 855.4 526.6 260.6 1,642.6 Manufacturing 64.1 348.8 308.2 721.1 Wholesale Trade - 293.0 562.4 855.5 Air Transport 662.2 19.7 40.6 722.5 Other Transport 733.0 392.0 179.0 1,304.1 Retail Trade 1,652.7 48.8 787.1 2,488.6 Gasoline Stations 300.8 2.9 37.5 341.2 Communications - 681.7 425.7 1,107.4 Finance, Insurance and Real Estate 2,230.7 2,175.0 3,794.2 8,199.8 Business Services 407.1 2,332.8 895.2 3,635.1 Education and Health Care - 8.6 1,683.8 1,692.4 Recreation and Entertainment 1,863.1 104.4 112.8 2,080.3 Lodging 5,105.9 10.3 10.8 5,127.1 Food & Beverage 4,348.1 190.0 536.0 5,074.1 Personal Services 365.3 222.8 363.2 951.3 Government 111.7 236.3 96.1 444.1 TOTAL 18,700.3 7,618.8 10,113.5 36,432.7 Percent Change 1.2% 1.9% 1.8% 1.5%
Total Tourism GDP (Value Added) Impact(US$ Million)
Business Day

38
Tourism GDP impact – total impact
0
1,000
2,000
3,000
4,000
5,000
6,000
7,000
8,000
9,000
FIRE LOD F&B BS RET REC ED CON TRN COM PS WHL
Induced
Indirect
Direct
Total Tourism GDP Impact$ million All sectors of the
New Jersey economy benefit from tourism activity directly and/or indirectly. Significant indirect and induced benefits
F&B Food & Beverage ED Education and Health CareRET Retail Trade FIRE Finance, Insurance & Real EstateREC Recreation and Entertainment PS Personal ServicesLOD Lodging CON Construction and UtilitiesBS Business Services AIR Air Transport
TRN Other Transport GAS Gasoline Stations
39
Tourism economy employment – total impact
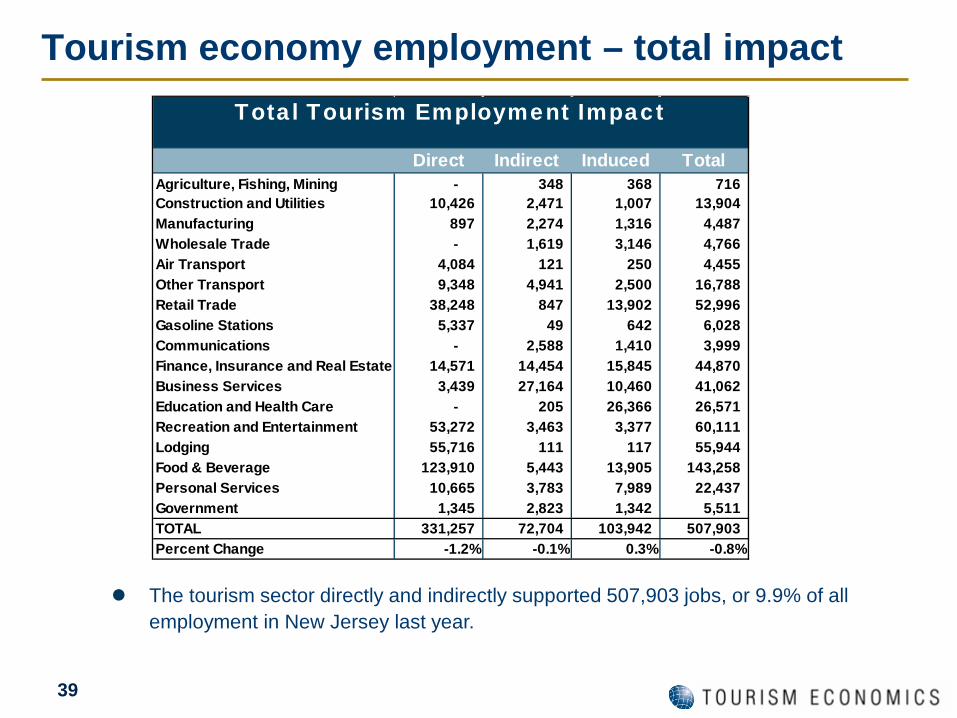
Direct Indirect Induced TotalAgriculture, Fishing, Mining - 348 368 716 Construction and Utilities 10,426 2,471 1,007 13,904 Manufacturing 897 2,274 1,316 4,487 Wholesale Trade - 1,619 3,146 4,766 Air Transport 4,084 121 250 4,455 Other Transport 9,348 4,941 2,500 16,788 Retail Trade 38,248 847 13,902 52,996 Gasoline Stations 5,337 49 642 6,028 Communications - 2,588 1,410 3,999 Finance, Insurance and Real Estate 14,571 14,454 15,845 44,870 Business Services 3,439 27,164 10,460 41,062 Education and Health Care - 205 26,366 26,571 Recreation and Entertainment 53,272 3,463 3,377 60,111 Lodging 55,716 111 117 55,944 Food & Beverage 123,910 5,443 13,905 143,258 Personal Services 10,665 3,783 7,989 22,437 Government 1,345 2,823 1,342 5,511 TOTAL 331,257 72,704 103,942 507,903 Percent Change -1.2% -0.1% 0.3% -0.8%
Total Tourism Employment Impact
The tourism sector directly and indirectly supported 507,903 jobs, or 9.9% of all employment in New Jersey last year.

40
Tourism economy employment – total impact
0
20
40
60
80
100
120
140
160
FIRE LOD F&B BS RET REC ED CON TRN COM PS WHL
Induced
Indirect
Direct
Total Tourism Employment ImpactThousands
Tourism generated the most employment in the restaurant, lodging, and retail sectors.
Secondary benefits are realized across the entire economy through the supply chain and incomes as they are spent.
Significant indirect and induced benefits
F&B Food & Beverage ED Education and Health CareRET Retail Trade FIRE Finance, Insurance & Real EstateREC Recreation and Entertainment PS Personal ServicesLOD Lodging CON Construction and UtilitiesBS Business Services AIR Air Transport
TRN Other Transport GAS Gasoline Stations

41
Tourism economy income – total impact
Direct Indirect Induced Total
Agriculture, Fishing, Mining - 14.1 14.0 28.1 Construction and Utilities 711.0 264.6 122.0 1,097.6 Manufacturing 53.1 176.7 127.2 356.9 Wholesale Trade - 162.3 313.3 475.6 Air Transport 357.3 11.3 23.5 392.1 Other Transport 637.1 324.1 145.7 1,106.8 Retail Trade 1,083.2 35.4 557.3 1,675.9 Gasoline Stations 178.0 1.7 22.8 202.5 Communications - 290.2 156.2 446.4 Finance, Insurance and Real Estate 458.8 708.9 885.8 2,053.5 Business Services 228.0 1,828.2 696.8 2,753.0 Education and Health Care - 8.8 1,609.5 1,618.2 Recreation and Entertainment 1,477.6 94.5 87.8 1,659.9 Lodging 2,708.5 5.3 5.7 2,719.5 Food & Beverage 2,923.3 126.9 365.5 3,415.6 Personal Services 362.9 214.0 357.7 934.6 Government 96.1 243.6 113.3 452.9 TOTAL 11,275 4,510 5,604 21,389 Percent Change 1.8% 2.0% 1.7% 1.8%
Total Tourism Labor Income Impact(US$ Million)
Business Day

42
Tourism economy income – total impact
0.0
0.5
1.0
1.5
2.0
2.5
3.0
3.5
4.0
F&B BS LOD FIRE RET REC ED TRN CON PS WHL GOV
Induced
Indirect
Direct
Total Tourism Labor Income Impact$ billion
The restaurant, lodging, and retail sectors employed the most persons in the tourism sector.
Secondary benefits are realized across the entire economy through the supply chain and incomes as they are spent.
Significant indirect and induced benefits
F&B Food & Beverage ED Education and Health CareRET Retail Trade FIRE Finance, Insurance & Real EstateREC Recreation and Entertainment PS Personal ServicesLOD Lodging CON Construction and UtilitiesBS Business Services AIR Air Transport
TRN Other Transport GAS Gasoline Stations

43
Tourism economy tax generation
As a result of tourism activity, governments received $10 billion in tax and assessment revenues in 2014.
State and local taxes alone tallied $4.6 billion.
Each household in New Jersey would need to be taxed an additional $1,460 per year to replace the tourism taxes received by state and local governments.
Business Day
Tax Type 2011 2012 2013 2014Federal Taxes Subtotal 4,939.7 5,158.3 5,264.2 5,355.8
Corporate 747.1 772.1 789.5 801.5Indirect Business 449.4 464.4 474.9 482.1Personal Income 1,606.4 1,683.0 1,716.5 1,747.5Social Security 2,136.8 2,238.7 2,283.3 2,324.6
State and Local Taxes Subtotal 4,415.8 4,487.1 4,547.8 4,645.9Corporate 185.2 191.4 195.7 198.7Personal Income 413.3 433.0 441.6 449.6Sales 1,302.4 1,342.5 1,366.3 1,417.1Lodging 120.7 128.5 133.2 139.2
Local 40.7 43.3 45.2 47.3State 80.0 85.2 88.0 91.9
Property 2,017.4 2,017.4 2,052.3 2,097.4Excise and Fees 350.2 346.5 330.4 315.0State Unemployment 26.6 27.8 28.4 28.9
TOTAL 9,355.5 9,645.4 9,812.1 10,001.7
Traveler Generated Taxes(US$ Million)

Visitation Forecast

45
Key points
For the first time in several years, no major weather event discouraged visitation to New Jersey.
Visitor volume reached 93.2 million in 2014, a 4.4% increase over 2013.
We expect visitation growth to maintain strength in 2015, for a combination of reasons:
■ Strong U.S. employment growth – averaging more than 300,000 over the past three months
■ Strengthening wage growth in the US in 2015
■ Consumer spending is now driving US economic growth
■ Lower travel costs – mainly from declines in gas prices
A key wildcard: the weather. As we have seen in the past couple of years, an ill-timed hurricane or winter storm that either impacts travel or forces evacuations of certain communities can have a significant impact on visitation.

46
Visitation
66.1271.00
79.1786.35 89.32
93.23 95.83 98.39 100.72 102.98
0
20
40
60
80
100
120
2009 2010 2011 2012 2013 2014 2015 2016 2017 2018
New Jersey VisitsDomestic & International (millions)
Source : Tourism Economics

47
Visitation and spending
-10%
-5%
0%
5%
10%
15%
2008 2009 2010 2011 2012 2013 2014 2015 2016 2017
Visits
Growth in Visits and Spending
Visitor Spending

48
New Jersey visits and spending forecast
Visits SpendingS&L Tax Revenue
(Million) (US$ Million) (US$ Million)2007 75.50 $37,339.2 0.0%2008 72.61 -3.8% $35,518.7 -4.9%2009 66.12 -8.9% $34,288.3 -3.5%2010 71.00 7.4% $34,577.2 0.8%2011 79.17 11.5% $36,752.9 6.3% $4,415.82012 86.35 9.1% $37,883.9 3.1% $4,487.1 1.6%2013 89.32 3.4% $38,555.8 1.8% $4,547.8 1.4%2014 93.23 4.4% $39,989.1 3.7% $4,681.2 2.9%2015 95.83 2.8% $41,259.2 3.2% $4,784.6 2.2%2016 98.39 2.7% $42,881.0 3.9% $4,930.9 3.1%2017 100.72 2.4% $44,520.3 3.8% $5,075.9 2.9%2018 102.98 2.3% $46,311.3 4.0% $5,235.0 3.1%
Pch Chng
NJ Tourism Forecast
Pch Chng
Pch Chng
Year

County Results

50
County growth in tourism sales
-5%
0%
5%
10%
15%
20%G
louc
este
rS
alem
Uni
onC
amde
nB
urlin
gton
Hun
terd
onH
udso
nM
iddl
esex
Ess
exP
assa
icB
erge
nC
ape
May
Mer
cer
Oce
anM
orris
Mon
mou
thS
usse
xS
omer
set
War
ren
Cum
berla
ndA
tlant
ic
Growth in Tourism Industry Sales2014, % change
Source : Tourism Economics

51
County Analysis Counties in the Delaware River and Gateway regions ranked
highest in tourism spending growth with nine out of the top ten counties located in these two regions.
■ These two regions also saw the highest growth in overnight leisure visitors among the state’s tourism regions according to D.K. Shifflet.
Of the shore counties, Cape May’s visitor spending growth ranked highest.
While shore county bed tax collections were strong during the summer months, bed taxes were much lower in the beginning of 2014 compared to strong 2013 performance related to Superstorm Sandy hotel stays.

52
County Analysis
Atlantic County was the only county to register negative tourism spending growth:
■ Revenue from gaming declined 4.5% in 2014.
■ Rooms sold declined nearly 8%.
The news is not all negative. Along with the other shore counties, Atlantic County experienced a strong summer season with bed tax revenues up an average of 8% during the summer months.

53
Tourism spending by county
County 2010 2011 2012 2013 2014 Percent Change
New Jersey $34,577 $36,753 $37,884 $38,556 $39,989 3.7%
Atlantic County $7,696 $7,802 $7,558 $7,318 $7,093 -3.1%
Bergen County $2,231 $2,461 $2,535 $2,628 $2,766 5.2%Burlington County $1,110 $1,217 $1,301 $1,344 $1,447 7.6%Camden County $633 $681 $704 $723 $786 8.8%Cape May County $4,809 $5,167 $5,381 $5,506 $5,794 5.2%Cumberland County $263 $295 $316 $317 $321 1.1%Essex County $2,633 $2,886 $2,953 $3,095 $3,267 5.5%Gloucester County $320 $343 $347 $354 $409 15.5%Hudson County $1,533 $1,613 $1,685 $1,767 $1,881 6.4%Hunterdon County $249 $274 $282 $288 $307 6.7%Mercer County $970 $1,069 $1,113 $1,152 $1,210 5.0%Middlesex County $1,681 $1,855 $1,998 $2,078 $2,200 5.9%Monmouth County $1,889 $1,976 $2,104 $2,208 $2,280 3.3%Morris County $1,607 $1,763 $1,829 $1,961 $2,035 3.7%Ocean County $3,509 $4,014 $4,288 $4,190 $4,353 3.9%Passaic County $425 $471 $483 $496 $523 5.5%Salem County $126 $163 $179 $176 $196 11.3%Somerset County $943 $1,005 $1,046 $1,094 $1,120 2.4%Sussex County $450 $489 $510 $536 $553 3.0%Union County $975 $1,064 $1,118 $1,169 $1,292 10.6%Warren County $136 $145 $155 $155 $157 1.8%
Tourism Direct Sales(Millions of dollars)

54
Tourism spending by county
County Lodging Food & beverage Retail Recreation Transport 2nd homes Total
New Jersey 11,051.1 9,720.0 7,451.9 4,909.1 6,857.0 4,024.0 39,989.1
Atlantic County 3,887.9 1,312.1 1,008.2 375.8 508.8 391.9 7,092.8
Bergen County 454.1 816.9 531.2 397.6 566.3 24.9 2,766.1 Burlington County 191.9 383.7 318.6 179.7 372.7 12.2 1,446.6 Camden County 84.5 210.7 157.7 130.4 203.1 8.8 786.5 Cape May County 2,296.3 1,286.1 1,153.5 668.6 389.6 1,947.5 5,794.1 Cumberland County 39.2 82.1 74.5 35.0 89.7 14.7 320.6 Essex County 328.6 572.2 370.1 267.6 1,728.1 19.0 3,266.6 Gloucester County 41.3 133.9 75.0 56.7 102.0 8.4 408.8 Hudson County 389.7 566.2 393.9 265.6 265.4 18.0 1,880.9 Hunterdon County 34.8 75.9 64.8 50.1 81.7 7.4 307.4 Mercer County 199.4 349.7 259.1 173.2 228.2 14.6 1,209.6 Middlesex County 326.1 637.6 489.6 282.7 464.0 9.9 2,199.9 Monmouth County 447.7 584.7 427.7 514.1 306.2 265.2 2,280.5 Morris County 410.3 544.7 373.7 337.7 368.2 28.3 2,034.5 Ocean County 1,281.5 1,041.1 935.3 600.4 494.6 1,146.2 4,352.8 Passaic County 62.7 182.6 106.2 77.3 94.3 21.1 523.1 Salem County 20.7 40.8 46.1 17.5 70.9 2.4 196.0 Somerset County 207.2 337.1 243.0 189.8 143.2 14.9 1,120.3 Sussex County 123.6 139.4 117.8 81.7 90.1 53.8 552.6 Union County 202.4 385.5 274.6 186.3 243.2 6.2 1,292.0 Warren County 21.0 37.2 31.4 21.3 46.6 8.6 157.5
Tourism Direct Sales(Millions of dollars)
2014

55
Tourism spending by county
County Lodging Food & beverage Retail Recreation Transport 2nd homes Total
New Jersey 10,913.6 9,283.1 7,130.5 4,701.5 6,527.1 3,869.0 38,555.8
Atlantic County 4,038.7 1,323.0 1,043.1 393.6 519.2 384.8 7,317.6
Bergen County 428.0 770.4 517.1 376.2 536.5 25.8 2,628.3 Burlington County 179.0 355.1 292.9 167.2 350.4 8.4 1,344.5 Camden County 76.0 193.2 150.4 119.5 183.7 8.4 722.9 Cape May County 2,249.0 1,212.3 1,043.8 637.7 363.5 1,918.9 5,506.3 Cumberland County 43.0 79.6 74.6 33.9 86.0 18.8 317.1 Essex County 307.6 534.4 342.3 251.8 1,658.8 11.2 3,094.9 Gloucester County 34.0 113.8 71.5 49.3 85.3 5.9 353.9 Hudson County 369.5 528.4 372.9 249.8 246.3 12.7 1,766.9 Hunterdon County 31.8 70.6 61.3 46.7 77.8 5.6 288.2 Mercer County 192.3 327.7 252.4 164.4 215.4 17.0 1,152.2 Middlesex County 315.9 596.1 459.5 268.1 438.6 8.1 2,078.3 Monmouth County 433.2 573.0 416.6 489.7 295.7 235.2 2,208.2 Morris County 393.7 515.6 364.4 321.8 365.5 29.7 1,961.0 Ocean County 1,216.5 1,027.6 893.2 583.2 469.0 1,076.4 4,189.5 Passaic County 59.3 173.4 101.2 73.9 88.1 18.7 496.0 Salem County 17.9 36.6 42.5 17.1 62.0 1.5 176.2 Somerset County 206.6 328.2 231.8 184.8 142.7 15.8 1,094.2 Sussex County 119.4 136.9 117.7 80.2 82.2 50.6 536.3 Union County 179.4 351.3 251.6 172.2 214.0 5.2 1,168.6 Warren County 22.8 35.7 29.6 20.3 46.2 10.3 154.7
Tourism Direct Sales(Millions of dollars)
2013

56
Tourism employment by county
County 2010 2011 2012 2013 2014 Percent Change
New Jersey 310,326 312,369 318,560 320,238 315,952 -1.3%
Atlantic County 62,037 59,890 60,686 58,189 52,112 -14.1%
Bergen County 23,978 24,449 23,921 24,122 23,911 0.0%Burlington County 14,044 14,204 14,686 14,867 15,005 2.2%Camden County 8,060 8,079 8,042 8,103 8,324 3.5%Cape May County 24,408 24,520 25,181 25,457 25,674 2.0%Cumberland County 3,015 3,097 3,202 3,154 3,096 -3.3%Essex County 20,529 20,890 20,996 21,095 21,257 1.2%Gloucester County 4,341 4,389 4,491 4,505 4,755 5.9%Hudson County 16,786 16,822 16,917 17,141 17,641 4.3%Hunterdon County 2,614 2,698 2,750 2,794 2,841 3.3%Mercer County 11,011 11,153 11,265 11,855 12,392 10.0%Middlesex County 19,862 20,204 21,442 21,960 22,117 3.2%Monmouth County 19,578 19,739 20,340 21,113 21,174 4.1%Morris County 19,302 19,988 20,260 21,589 21,707 7.1%Ocean County 24,318 24,991 26,175 25,614 25,335 -3.2%Passaic County 5,229 5,349 5,307 5,370 5,332 0.5%Salem County 1,448 1,523 1,569 1,524 1,551 -1.1%Somerset County 10,770 10,940 11,277 11,490 10,916 -3.2%Sussex County 5,977 6,160 6,265 6,327 6,162 -1.6%Union County 11,427 11,692 12,153 12,327 13,026 7.2%Warren County 1,594 1,591 1,637 1,644 1,625 -0.7%
Direct Tourism Employment

57
Tourism impacts by county
CountyTourism
Employment: Direct Impact
Direct Share of Total
Employment
Tourism Employment: Total Impact
Total Share of Total
EmploymentNew Jersey 315,952 6.2% 507,903 9.9%
Atlantic County 52,112 30.4% 69,936 40.9%
Bergen County 23,911 3.8% 43,306 6.9%Burlington County 15,005 5.5% 23,314 8.6%Camden County 8,324 3.2% 15,516 6.0%Cape May County 25,674 40.5% 36,016 56.9%Cumberland County 3,096 4.2% 5,301 7.3%Essex County 21,257 4.7% 38,523 8.5%Gloucester County 4,755 3.7% 8,152 6.3%Hudson County 17,641 5.4% 29,584 9.1%Hunterdon County 2,841 3.6% 4,913 6.2%Mercer County 12,392 4.6% 22,631 8.4%Middlesex County 22,117 4.3% 38,667 7.6%Monmouth County 21,174 5.8% 32,396 8.9%Morris County 21,707 5.5% 35,573 8.9%Ocean County 25,335 10.5% 36,584 15.2%Passaic County 5,332 2.3% 11,472 5.0%Salem County 1,551 5.5% 2,536 8.9%Somerset County 10,916 4.5% 19,692 8.2%Sussex County 6,162 9.9% 8,093 13.0%Union County 13,026 4.4% 22,752 7.6%Warren County 1,625 3.6% 2,945 6.5%County employment shares are comparisons against total county private employment (BEA)
Tourism Impacts by County

58
Tourism impacts by county
2011 2012 2013 2014 Percent Change
Share of State
New Jersey $4,415.8 $4,487.1 $4,547.8 $4,645.9 2.2% 100.0%Atlantic County $854.5 $830.6 $806.7 $775.9 -3.8% 16.7%Bergen County $345.1 $350.6 $359.6 $373.0 3.7% 8.0%Burlington County $153.6 $160.8 $163.4 $171.5 4.9% 3.7%Camden County $99.6 $100.1 $102.5 $106.6 3.9% 2.3%Cape May County $482.3 $489.8 $507.5 $518.1 2.1% 11.2%Cumberland County $37.0 $38.1 $37.8 $37.5 -0.7% 0.8%Essex County $332.9 $335.1 $344.7 $356.6 3.5% 7.7%Gloucester County $52.9 $52.1 $52.7 $57.3 8.8% 1.2%Hudson County $205.9 $213.0 $221.0 $230.7 4.4% 5.0%Hunterdon County $38.5 $38.6 $39.8 $41.3 3.8% 0.9%Mercer County $143.9 $144.7 $149.0 $154.4 3.6% 3.3%Middlesex County $259.6 $275.8 $282.8 $294.9 4.3% 6.3%Monmouth County $257.0 $269.1 $276.5 $282.3 2.1% 6.1%Morris County $243.6 $249.5 $268.6 $275.8 2.7% 5.9%Ocean County $429.8 $438.6 $420.3 $434.5 3.4% 9.4%Passaic County $81.8 $80.6 $82.2 $84.5 2.8% 1.8%Salem County $18.6 $19.5 $19.3 $20.7 7.3% 0.4%Somerset County $147.0 $152.1 $156.8 $159.3 1.6% 3.4%Sussex County $58.6 $59.1 $63.4 $64.8 2.2% 1.4%Union County $152.0 $157.2 $161.5 $171.2 6.0% 3.7%Warren County $21.7 $22.1 $22.1 $22.1 -0.2% 0.5%
Tourism Tax Impacts by CountyState and Local Tax Receipts (millions)

Methodology and Background

60
• Domestic visitor expenditure estimates are provided by DK Shifflet’s representative survey of US travelers. These are broken out by sectors (lodging, transport at destination, food & beverage, retail, and recreation), by purpose (business and leisure), and by length of stay (day and overnight).
• Tourism Economics then adjusts these levels of spending based on a range of known measures of tourism activity:
• Overseas visitor spending (source: OTTI, TE)
• Canada visitor spending (source: Statistics Canada, TE)
• Bed tax receipts (source: State of NJ, Department of Treasury)
• Spending on air travel which accrues to all airports and locally-based airlines
• Gasoline purchases by visitors (source: TE calculation)
• Smith Travel Research data on hotel revenues
• Construction Value by McGraw-Hill Construction
• Industry data on employment, wages, GDP, and sales (source: BEA, BLS, Census)
• Previous research on the economic impact of NJ tourism
Methods and data sources

61
• An IMPLAN model was compiled for the State of New Jersey. This traces the flow of visitor-related expenditures through the local economy and their effects on employment, wages, and taxes. IMPLAN also quantifies the indirect (supplier) and induced (income) impacts of tourism.
• All results are benchmarked and cross-checked and adjusted based on the following:
• US Bureau of Labor Statistics and Bureau of Economic Analysis (employment and wages by industry)
• US Census (business sales by industry)
• The source of the employment and wage data is the Regional Economic Information System (REIS), Bureau of Economic Analysis, U.S. Department of Commerce. All employment rankings are based on Bureau of Labor Statistics (ES202/QCEW) data.
Methods and data sources

62
Selected recent economic impact clients Cities Baltimore, MD Columbus, OH Kansas City, MO London, United Kingdom New York City Omaha, NE Orlando, FL Philadelphia, PA Pittsburgh, PA Rockford, IL Countries / Provinces Bahamas Bermuda Cayman Islands Dubai Ontario Canada St. Lucia United Kingdom
Associations / Companies Center for Exhibition Industry Research (Economic Impact of Visa Restrictions)
DMAI (Event Impact Calculator for 80 CVBs)
US Travel Association (Impact of travel promotion)
InterContinental Hotels
States California Georgia Maryland New York North Carolina Ohio Pennsylvania Wisconsin

63
About Tourism Economics
Tourism Economics, headquartered in Philadelphia, is an Oxford Economics company dedicated to providing high value, robust, and relevant analyses of the tourism sector that reflects the dynamics of local and global economies. By combining quantitative methods with industry knowledge, Tourism Economics designs custom market strategies, project feasibility analysis, tourism forecasting models, tourism policy analysis, and economic impact studies.
Our staff have worked with over 100 destinations to quantify the economic value of tourism, forecast demand, guide strategy, or evaluate tourism policies.
Oxford Economics is one of the world’s leading providers of economic analysis, forecasts and consulting advice. Founded in 1981 as a joint venture with Oxford University’s business college, Oxford Economics is founded on a reputation for high quality, quantitative analysis and evidence-based advice. For this, it draws on its own staff of 40 highly-experienced professional economists; a dedicated data analysis team; global modeling tools; close links with Oxford University, and a range of partner institutions in Europe, the US and in the United Nations Project Link.
For more information: [email protected].