Embed Size (px)
Citation preview

1
The Expenditure Impacts of London's Higher Education
Institutions: The Role of Diverse Income Sources
December, 2013
Kristinn Hermannssonǂ
Katerina Lisenkova*
Peter G McGregor†
and
J Kim Swales†
ǂSchool of Education, University of Glasgow, St Andrews Building,
11 Eldon Street, Glasgow G3 6NH, United Kingdom.
Email: [email protected]
†Fraser of Allander Institute, Department of Economics, University of
Strathclyde, Sir William Duncan Building, 130 Rottenrow, Glasgow G4 0GE,
United Kingdom. Emails: [email protected], [email protected]
*National Institute of Economic and Social Research (NIESR), 2 Dean Trench
Street, Smith Square, London, SW1P 3HE, United Kingdom.
Email: [email protected]
Acknowledgements:
This paper is an output of the Overall Impact of Higher Education Institutions on Regional Economies
project, funded by the Economic and Social Research Council (ESRC), Scottish Funding Council
(SFC), the Higher Education Funding Council of England (HEFCE), the Higher Education Funding
Council of Wales (HEFCW) and the Department for Employment and Learning Northern Ireland
(DELNI) – RES-171-25-0032. We also acknowledge additional funding from the Centre for Public
Policy for Regions. We are indebted to Ursula Kelly for helpful discussions and advice. The project
was one of nine funded through the Impact of Higher Education Institutions on Regional Economies
Initiative.
2
Abstract
This paper analyses the impact of London-based Higher Education Institutions
(HEIs) on the English economy. When we treat each of the HEIs as separate
sectors in conventional input-output analysis, their expenditure impacts appear
rather homogenous, with the apparent heterogeneity of their overall impacts
being primarily driven by scale. However, a disaggregation of income by source
reveals considerable variation in their dependence upon public funding and
ability to draw in income/funding from external sources. Acknowledging the
possible alternative uses of the public funding and deriving balanced
expenditure multipliers reveals large differences in the net-expenditure impact
with the source of variation being the origin of income. The institutional
multiplier is driven by the ability to attract external funding, which would
typically favour research intensive institutions. However, the impacts of
students' consumption expenditures are also significant. In terms of ranking of
multipliers the overall results are mixed.
Keywords: London, Higher Education Institutions, Input-Output, England,
Impact study, Multipliers, budget constraint.
JEL classifications: R51, R15, H75, I23.

3
1 Introduction
Higher Education Institutions (HEIs) are diverse in terms of their scale and
nature. Some are research intensive with relatively few students, whereas other
are more student driven. Incomes are equally diverse, with institutions drawing
on sources such as the funding council, tuition fees, domestic and foreign
research funding, commercial research contracts and charities. This paper
explores how these characteristics affect the regional expenditure impacts of
individual HEIs.
We apply our analysis to London, which is a particularly rich case. It is the
largest centre of higher education in the UK, with just under 290,000 FTE
students attending 39 diverse institutions. Everything from small art institutions
such as Rose Bruford College or the Courthauld Institute of Art to large
research universities such as UCL. This is in addition to highly specialised
research institutes such as the Institute of Cancer Research. Furthermore it
hosts student-intensive institutions serving the local economy like Thames
Valley University and specialised institutions charging high fees to an
international student body such as the London Business school. This
extraordinary diversity makes it particularly interesting to study the impacts of
all London HEIs within a single unified framework.
In order to address this we construct a unique economic database where we
draw on accounting data to identify each London HEI as a separate sector in an
Input-Output (IO) table, allowing for heterogeneity of income sources. We then
adopt an IO accounting approach and undertake various attribution analyses.
4
We acknowledge the importance of variation in the sources of revenues to
HEIs, reflecting, in particular, the dependence of these HEIs on public funding.
We acknowledge that different types of students drive different expenditure
impacts. Furthermore, we recognise the public funding of HEI students also has
an opportunity cost. Again considerable heterogeneity is revealed across HEIs
when we accommodate this.
There have been numerous studies of the impact of higher education institutions
(HEIs) on their host regional economies that focus solely on their effect on the
local demand for goods and services (see e.g. Drucker & Goldstein 2007,
Florax, 1992, McGregor et al., 2006 and Sigfried et al 2007 for reviews). These
demand-side studies treat a university like any other business which demands
goods and factor services within the region. Similarly, students are treated
analogously to tourists, as a source of consumption spending for the local
economy.
Apart from academic work on the expenditure impacts of HEIs and their
students there are countless studies published by advocacy groups and
individual instituions that aim to demonstrate the HEIs economic impact1.
These have come under criticsm for relaxing methodological rigour in favour of
inflating the perceived economic impact (Sigfried et al, 2007). Hermannsson et
al (2013a) point out that in a UK context the validity of expenditure impact
studies has been doubted based on the notion that binding public budget
1 Typically the most prominent focus is on the HEIs expenditure impacts, but other channels are also considered. For a summary of the arguments most frequently made see Drucker & Goldstein (2007).

5
constraints imply that the impact of HEIs expenditures is negligible. We
acknowledge the potential importance of this constraint but conduct an analysis
that seeks to quantify its importance.We show that, taking account of public
funding acts to moderate estimated expenditure impacts, rather than to
eliminate them altogether.
For many stakeholders expenditure impacts are very important, as is witnessed
by the range of available impact studies. Expenditure impacts are felt without
much lag and for some communities the local university is an important source
of final demand injection. As we shall see, treated simply as businesses, the
London HEIs support a non-negligable share of output in the English economy.
However, it must be stressed that expenditure impacts are only part of a broader
interaction between HEIs, the economy and the wider community. Importantly,
HEIs stimulate the supply side of their host regional economies through
activities such as: improving the skills in the labour force (Blundell et al.,
2005; Bradley and Taylor 1996; Checchi, 2006; Harmon and Walker, 2003;
Psacharopoulos and Patrinos 2004), undertaking knowledge exchange (Acs,
2009; Anselin et al., 1997; Fischer and Varga 2003; Parker and Zilberman
1993; Varga and Schalk 2004) and contributing to innovation (Andersson et al.,
2009; Anselin et al., 2000; Jaffe 1989; Lundvall 2008). Recent evidence
suggests human capital plays a key role in the causal link from HEIs to
innovation (Faggian and McCann, 2009; Faggian et al., 2010). Furthermore, a
persuasive case has been made that a more educated population results in long
term indirect benefits, such as improved public health and lower crime rates
(McMahon, 2004, 2009). Supply side-impacts are potentially large relative to

6
demand-side impacts (Hermannsson et al., forthcoming) and merit a systematic
study. However, that does not mean expenditure impacts are yet fully
understood. This paper seeks to highlight some of those demand-side issues for
London HEIs.
The rest of the paper is structured as follows. In Section 2 we provide a brief
overview of the London higher education system and present key characteristics
of individual London HEIs – including their funding sources and the level of
funding relative to the number of staff and students. In Section 3 we outline the
HEI-disaggregated IO accounting approach, and present the results of applying
it to HEIs’ own expenditures. While total institutional expenditure impacts vary
considerably across HEIs, we show that this largely reflects differences in the
scale of HEIs. Once we control for scale, by focussing on the value of
individual HEI multipliers, the results exhibit a striking degree of homogeneity
given the variety, and often highly specialised nature, of HEIs in London. We
then show the impact of recognising alternative uses of the public funding of
HEIs in Section 4. The resultant balanced expenditure HEI multipliers exhibit
considerable heterogeneity. We discuss the overall impacts of HEIs by
incorporating the effects of student expenditures in Section 5. One key finding
is that a focus on overall expenditure impacts gives a misleading impression of
a homogenous HEI sector in London, which is in fact characterised by
considerable heterogeneity once differences in funding sources are recognised.
We present brief conclusions in Section 6.

7
2. Key characteristics of London HEIs
In the year 2006, which is the period to which our database applies, there were
39 Higher Education Institutions in London. In this study we exclude the Royal
College of Nursing as data on its expenditures are not comparable with those of
other institutions in the Higher Education Statistics Agency (HESA) dataset2. In
column one of Table 1 the remaining 38 institutions are listed alphabetically by
their official names. The second column gives convenient abbreviations of these
names, which are used for the remainder of the paper. Also included in the table
is a selection of the HEIs’ more important characteristics, from the point of
view of this impact study. Before analysing the data, a brief description of how
the dataset was constructed is in order3.
Our starting point is a UK Input-Output table, which we use to derive an Input-
Output table for England. An IO table is a matrix that identifies the sales and
purchases of each production sector in a given economy in a consistent and
complete way. We begin by augmenting this table by disaggregating the
education sector. We first separately identify the non-HEI elements and then
use data on the income and expenditures of London HEIs to create a separate
sector for each institution. The table therefore details the expenditure pattern
and composition of income for each London HEI in a consistent way.
2 This is unfortunate but should not change the overall analysis as the RCN is very small. It has 214 students or 0.07% of the London student population, but is slightly larger in terms of income – receiving approximately 0.19% of the income of the overall sector in London. 3 This follows mutatis mutandis an approach originally developed for application in Scotland based on HESA data. For details see: Hermannsson et al (2010a).

8
HESA (2007) provides details of the incomes of each HEI. In this analysis we
separately identify the public funding4 of London HEIs and explore the impact
of the alternative use of these funds. In particular, public funding of HEIs in
London could be used alternatively to expand general public expenditure in
England. Most HEIs draw a large share of their income from research and
teaching grants from the Higher Education Funding Council England (HEFCE).
This represents over four fifths of what we identify as public sector income.
Other important income sources are: the tuition of fee-paying students; research
grants funded by the private sector or non-profit organisations; public sector
research grants obtained through competitive bidding at the UK-level or
overseas, which are classified as interregional exports in this case; and other
income sources such as payments for residence and catering services and
various services rendered to local production sectors.
4 We treat London as if it were a devolved region and therefore public funding refers to income sources, which are provided by the regional assemblies in N-Ireland, Scotland and Wales. Broadly this means HEFCE grants are treated as public funding, whereas income from the research councils is not subjected to this budget constraint (for details see: Hermannsson et al 2010b).

9
Table 1 Key characteristics of London HEIs
Institutions
Income Employment Students
Formal name
Abbreviated name Total
Percentage from public
funding5
Total income per FTE
employee (£)
Share of wages in
expenditure
Total final demand per FTE
student (£)
Share
(used in the remainder of
this paper) (£
million) non-
English
Birkbeck College Birkbeck 65 54% 67,391 66% 8,692 7% Brunel University Brunel 118 50% 61,804 62% 9,479 20% The Institute of Cancer Research ICR 63 28% 79,869 61% 359,548 40% Central School of Speech and Drama CSoSD 10 62% 113,212 48% 11,771 17% City University City 136 24% 79,482 59% 10,350 28% Conservatoire for Dance and Drama CD&D 12 81% 43,840 58% 11,690 34% Courtauld Institute of Art Courtauld 10 27% 90,595 52% 26,640 39% The University of East London East London 94 56% 76,465 52% 7,358 18% Goldsmiths College Goldsmiths 59 58% 74,121 62% 9,539 22% The University of Greenwich Greenwich 134 52% 83,381 47% 7,946 21% Imperial College of Science, Technology & Medicine Imperial 525 35% 90,091 56% 43,652 41%
Institute of Education IoE 64 47% 86,464 51% 21,320 21% King's College London King's College 404 44% 87,880 61% 23,569 22% Kingston University Kingston 132 55% 79,244 59% 7,207 16% University of the Arts, London University of the Arts 143 55% 70,238 55% 11,449 36% London Business School LBS 87 10% 134,771 46% 54,483 69% London Metropolitan University Metropolitan 151 58% 69,201 66% 7,089 26% London South Bank University South Bank 113 42% 74,897 59% 7,605 17% London School of Economics and Political Science LSE 156 22% 86,407 52% 19,745 67%
London School of Hygiene and Tropical Medicine LSHTM 66 29% 93,084 51% 73,846 57%
Middlesex University Middlesex 131 48% 77,326 55% 6,182 24% Queen Mary and Westfield College Queen Mary 200 45% 72,782 60% 19,006 25% Ravensbourne College of Design and Communication Ravensbourne 11 74% 76,206 51% 9,495 16%
Roehampton University Roehampton 47 65% 49,820 66% 6,180 12% Rose Bruford College Rose Bruford 6 75% 68,879 46% 8,515 22% Royal Academy of Music RAM 15 34% 80,225 55% 21,012 50% Royal College of Art RCA 25 60% 89,455 44% 29,834 45% Royal College of Music RCM 14 38% 92,300 54% 22,097 50% Royal Holloway and Bedford New College Royal Holloway 92 45% 71,640 58% 13,247 31% The Royal Veterinary College RVC 46 51% 81,012 55% 31,445 19% St George's Hospital Medical School St George's 71 50% 85,323 66% 28,278 11% St Mary's College St Mary's 22 72% 58,553 63% 6,688 13% The School of Oriental and African Studies SoOA 47 35% 66,155 62% 12,417 47% The School of Pharmacy SoPh 18 45% 80,997 55% 18,970 23% Thames Valley University Thames Valley 103 54% 53,535 69% 8,459 17% Trinity Laban Trinity Laban 15 50% 59,462 59% 19,339 36% University College London UCL 585 36% 82,782 61% 34,206 32% The University of Westminster Westminster 138 55% 75,935 56% 8,468 22%
Total/average 4,130 43% 78,647 58% 14,259 25%
5 This income share is determined as if London were a devolved region within the UK. Therefore income from the science councils is excluded, as these are funded by the central government and allocate grants on a competitive basis among HEIs in the UK.

10
Adjustments had to me made to reflect the particulars of the institutional
structure. The University of London is a federal institution, with central
functions listed as a separate institution in HESA accounts. The centre’s
incomes and expenditures were distributed among the member colleges pro rata
in line with their income as revealed in HESA data. The Conservatoire of Dance
and Drama is a network institution, which distributes income to partner colleges
(which do not report to HESA). Therefore its expenditures in the HESA
accounts do not reflect the actual expenditure structure of the entire institution.
To correct for this we impose the average wage/expenditure ratio as revealed by
other London HEIs.
Column three shows the total income for the Higher Education sector in London
in 2006 and how this was distributed among the individual institutions. Of the
total income of £4,130 million, nearly 14.2% goes to the largest, UCL, 12.7% to
Imperial and 9.8% to King’s College. The largest institution is over 98 times
the size of the smallest, Rose Bruford. This large variation in the size of
individual institutions suggests that there is likely to be heterogeneity in other
aspects of their operation. The rest of the information in the table is
standardised against the institution’s income, number of staff or student
population.
Column four gives the proportion of the total funding for each London HEI that
comes from the government funding channelled through HEFCE and other
sources. Note that, while HEIs are heavily funded by the government, they are
non-profit organisations and are not formally part of the public sector. On

11
average 43% of London HEIs’ funding comes from this source. However, the
variation around the 43% figure is as important for the present paper. There is a
considerable range: LBS is an outlier, which receives only 10% of its total
funding from public sources, LSE 22% and City 24%. Conservatoire for Dance
and Drama has maximum dependence on public funding among London HEIs,
at 81%, with Rose Bruford, Ravensbourne, and St Mary’s on 75%, 74% and
72% respectively.
Column five presents the income per member of staff. In 2006 the total
employment in London HEIs was 52.5 thousand, so that the income per member
of staff averages at £78.6 thousand. The ranking of London HEIs by
employment is very close to that by income, but there is some variation and this
is reflected in variation in income per staff member across institutions. The
institutions have values that range between the high of £134,771 thousand for
LBS to £49.8 for Roehampton (if we ignore CD&D).
However, variation in the share of wages in total income presented in column
six is more limited. The average figure for the sector as a whole is 58%, with a
range from RCA on 44% to Thames on 69%. It is clear that across all London
institutions wage payments make up a significant and relatively similar share of
total HEI expenditure.
University income per student is given in column seven of Table 1. It is
important to note that this is the total income of the institution divided by the
total number of students, measured in FTEs. For the London HEI sector as a

12
whole, the average was £14.3 thousand. However, even if we omit the Institute
of Cancer Research, which is an outlier, there is a high degree of variation
across institutions from £73.8 thousand for London School of Hygiene and
Tropical Medicine to £6.2 thousand for Roehampton and Middlesex.
Finally, column eight presents figures for the proportion of students that are
non-English. On average 25% of all students in London HEIs come from
outwith England. Again there are large differences across institutions. Birkbeck
is an outlier, taking 93% of its students from England, whilst LBS and LSE take
only 31% and 33% of their students from their home region.
The information given in Table 1 reflects the fact that HEIs actually perform a
range of activities, covering teaching, research and knowledge exchange that
can be funded in a variety of ways. There are systematic differences in the way
in which different London HEIs operate and the weighting of the activities that
they undertake. This is especially the case for the smaller and more specialised
HEIs, but is also apparent amongst the more conventional London universities.
We would expect this variation in activities to affect the expenditure impacts of
individual London HEIs on the English economy. It is this proposition that we
test in the remainder of the paper.
3. HEI expenditure impacts and conventional IO impact analysis
Regional impact analyses are frequently used to capture the total spending
effects of institutions, projects or events. These analyses include multiplier, or

13
“knock-on”, impacts of any expenditure injection, obtained by summing up
subsequent internal feedbacks within the economy. For the the regional
economic impact of HEI expenditure Florax (1992) identified over 40 studies of
and much has been published since. McGregor et al (2006) summarise the
methods and findings of the main UK studies. Most of these studies, especially
earlier ones, are based on Keynesian income-expenditure models (Brownrigg,
1973; Bleaney et al, 1992; Armstrong, 1993; Battu et al., 1998) whilst a smaller
number use straightforward or extended IO modelling (Blake and McDowell,
1967; Harris, 1997; Kelly et al, 2004; Hermannsson et al., 2013ab). We use IO
as an accounting framework that we modify to acknowledge the possible
alternative use of public funding within England.
The direct spending impact of universities is separated into two categories: the
impacts of HEIs’ own expenditures on intermediate inputs (including the wages
of their own staff) and the consumption expenditures of their students. We
begin with a brief account of conventional IO impact analysis (for a review see
e.g.: Armstrong & Taylor 2000, Loveridge 2004, Miller & Blair 2009) and then
apply this analysis to London HEI and their students.
Regional demand-driven models, including IO, distinguish between two types
of expenditures: exogenous and endogenous. Exogenous expenditures are
independent of the level of economic activity within the host economy. In IO
studies exports, government expenditure and investment are typically taken to
be exogenous. On the other hand, endogenous expenditures are driven by the
overall level of economic activity within the host economy. Specifically,

14
demand for intermediate inputs and sometimes household consumption demands
are taken to be endogenous. Input-output tables contain information about sales
and purchases between different sectors and actors within the economy. Based
on the notion that exogenous expenditure determines endogenous activity,
multipliers can be derived. The output multiplier for each sector is the change
in total output for the economy as a whole resulting from a unit change in the
final demand for that sector. This allows a convenient expression for the gross
output qi attributable to the exogenous expenditures (or final demands) fi on the
output of sector i:
(1) 𝒒𝒊 = 𝒎𝒊𝒇𝒊
where mi is the output multiplier for sector i.
Multipliers can be derived for a variety of activity outcomes, including
employment, income, output or GDP. The Type-II multipliers reported in this
paper are those conventionally reported in demand-driven IO impact studies.
Type-II multipliers incorporate not only the increase in demand for intermediate
inputs but also induced household consumption effects, generated by changes in
wage income, as endogenous elements in the multiplier process. For further
details see Miller and Blair (2009, Ch. 6).

15
The IO table provides a useful accounting framework in which each HEI can be
attributed with the total regional economic activity driven by its final demand6.
This impact effect is composed of both the final demand for the HEI’s output
and also the knock-on impacts on other sectors, generated through directly and
indirectly linked intermediate demand and household consumption. One key
strength of IO as an accounting framework is that it is consistent. When such an
attribution exercise is carried out on a sector-by-sector basis, the sum of the
impacts attributable to each sector’s final demands equals the economy-wide
total.
4. Results of the conventional IO analysis applied to HEIs’ own
expenditures
Table 2 and Figure 1 summarise conventional Type II IO-based impact
estimates for London HEIs. These are obtained by applying equation 1 to each
HEI treated as a separate sector in our HEI-disaggregated IO table.7 The first
column shows the income of each HEI in London in 2006, as in Table 1.
Columns two, three and four give the total direct, indirect and induced (Type-
6 Demand-driven models are based on some restrictive assumptions, in particular a passive supply side. Although these can be motivated under condition of excess capacity or long run factor mobility (McGregor et al, 1996) we do not believe that the economy of England (or London) can be accurately characterised by an entirely passive supply side, even over the longer-term. However, we regard the results as simply reflecting an accounting attribution. This is appropriate as we are not considering the impact of changes at the margin but attributing endogenous impacts to exogenous expenditures based on historical economic accounts. 7 For each institution, the direct, indirect and induced effects are calculated using the final demand for their output of the particular institution. This is not the total income of the institution (which will incorporate some sales to local intermediate and household consumption demands).

16
II) impact of HEI spending on total English output, GDP and FTE employment
respectively.
The first point to note is that the expenditures of London HEIs, considered as a
single production sector, have a major impact on: English gross output £10,617
million, 0.87% of the English total; GDP £5,691, 0.53%, and employment,
98,340, 0.55%.

17
Table 2. Conventional Type-II impacts of London HEIs in 2006 (final
demand plus multiplier effects).
Income Output £m GDP £m Employment FTEs (000's)
Birkbeck 65 167 94 1,698 Brunel 118 313 172 3,246 ICR 63 143 78 1,303 CSoSD 10 27 13 336 City 136 300 161 2,719 CD&D 12 36 19 447 Courtauld 10 28 14 244 East London 94 247 127 2,276 Goldsmiths 59 159 88 1,570 Greenwich 134 347 172 3,037 Imperial 525 1,403 742 12,200 IoE 64 165 85 1,462 King's College 404 1,030 561 9,023 Kingston 132 331 178 3,046 University of the Arts 143 385 202 3,878 LBS 87 179 88 1,329 Metropolitan 151 400 225 4,096 South Bank 113 263 142 2,451 LSE 156 412 212 3,650 LSHTM 66 174 89 1,487 Middlesex 131 336 176 3,224 Queen Mary 200 528 286 5,059 Ravensbourne 11 33 17 308 Roehampton 47 120 68 1,381 Rose Bruford 6 17 8 162 RAM 15 37 19 341 RCA 25 65 32 565 RCM 14 33 17 282 Royal Holloway 92 248 133 2,382 RVC 46 129 68 1,166 St George's 71 175 99 1,557 St Mary's 22 58 32 635 SoOA 47 124 68 1,243 SoPh 18 47 24 421 Thames Valley 103 239 137 2,646 Trinity Laban 15 35 19 366 UCL 585 1,528 836 13,727 Westminster 138 359 190 3,378 Total 4,130 10,617 5,691 98,340
% of ENG total output/GDP/employment 0.87% 0.53% 0.55%
The second point is that there is considerable variation in the impacts of individual
HEIs, as simple inspection of Figure 1 makes clear. However, these are clearly strongly
affected by the initial scale of the individual institutions. A natural way of eliminating
scale effects in an IO impact analysis is to focus on the multiplier values associated with

18
a unit change in the final demands for each HEI’s output. These multiplier values (mi in
equation 2) are shown in Figure 2 for each of the 38 HEIs.
Figure 1 Output impact (Type-II) of London HEIs expenditures, £m
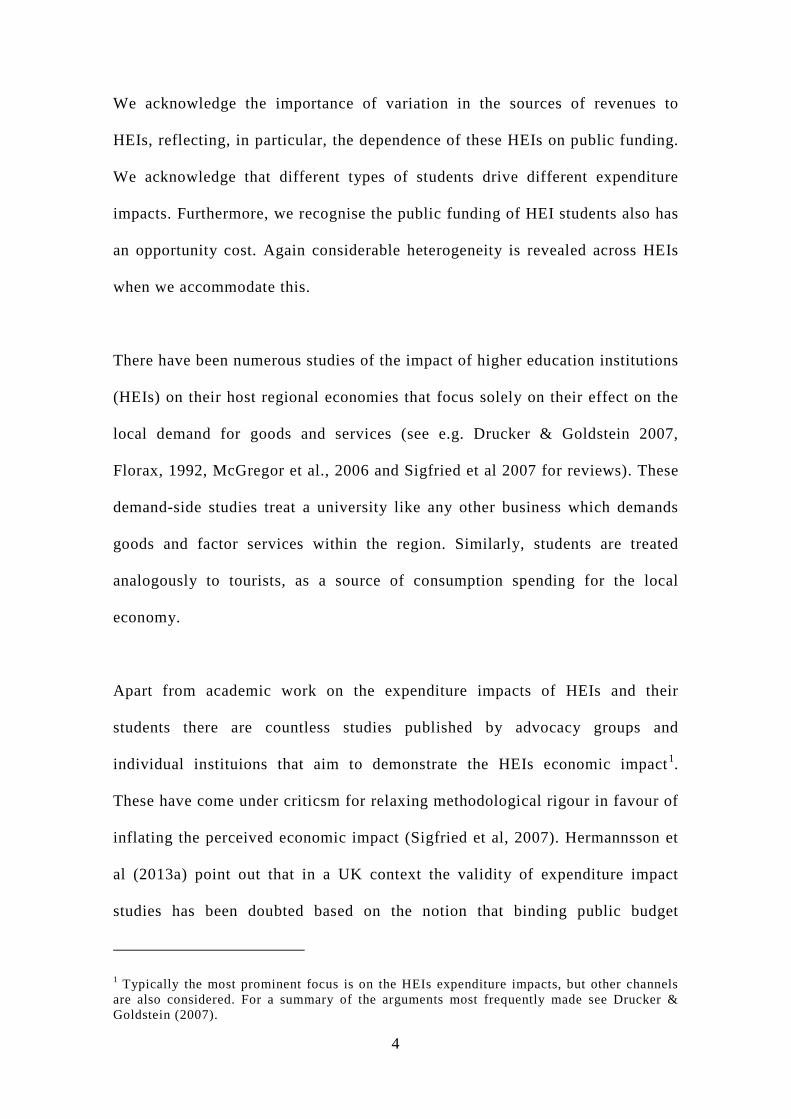
The most striking thing about the multipliers is their comparative uniformity.
The lowest conventional Type II output multiplier is 3.03, associated with
Roehampton and Thames Valley University, which is 97% of the highest, 3.13
for the Royal College of Art. The results appear to suggest that London HEIs
are rather homogeneous in terms of the intensity of the impact of their
expenditures on the English economy. In essence this reflects the similarity of
the cost structure of different London institutions, which was indicated in Table
1 by the similarity of the share of wages in total income across London
institutions.
19
Figure 2 Conventional Type-II output multipliers for London HEIs
4. The alternative uses of public funds
We show in Hermannsson et al (2010b), that allowance for alternative uses of
public funding of London HEIs has an important impact on estimates of the
expenditure effects of the HEI sector as a whole. The issue is that in so far as
the government expenditure on HEIs displaces other public expenditure in
England, this is important for assessing regional impacts. Here we extend this
analysis to individual institutions and show that the effect of public funding
varies significantly among London HEIs.
We divide the direct expenditure on the output of each London HEI into
government funding (bfi) (reflecting the fact that for devolved regions these
come through the operation of the Barnett formula), which comes mostly

20
through HEFCE, and other funding (ofi) which includes all other sources of
funds such as exports to the rest of the UK and the rest of the World. The
conventional attribution to an individual HEI is simply:
(2) 𝑞𝑖 = (𝑏𝑓𝑖 + 𝑜𝑓𝑖)𝑚𝑖
where bfi+ofi = fi. For Type-II output attribution, these are the values reported
in column 2 of Table 2 and plotted in Figure 1.
The adjusted, or “balanced expenditure”, attribution subtracts the publicly
funded element of each HEI’s funds and the associated own-multiplier effects.
This is calculated as bfimp, where mp is the Type-II multiplier for the
aggregated public sector (and so is invariant across HEIs).8 The balanced
expenditure attribution, qiB is therefore given by equation 4.
(3) 𝑞𝑖𝐵 = (𝑏𝑓𝑖 + 𝑜𝑓𝑖)𝑚𝑖 − 𝑏𝑓𝑖𝑚𝑃 = 𝑜𝑓𝑖𝑚𝑖 + 𝑏𝑓𝑖(𝑚𝑖 − 𝑚𝑃)
To summarise, the output impact of an individual HEI net of its government
funding equals the sum of the output impact attributable to other funding
sources ofimi and the impact of switching from general public expenditure to
HEIs, bfi(mi –mp). This latter term is positive if the individual HEI multiplier,
mi, is greater than the aggregate public sector multiplier, mp, and negative if it
8 mP is the weighted sum of the sectoral multiplier values, where the weights are the shares of total public sector expenditure in that sector. Therefore mp = ∑αp
imi where αpi = fp
i/∑ fpi.

21
is not. Dividing equation (3) through by total final demand for the ith HEI,
bfi+ofi, yields a “balanced expenditure” multiplier, mBi, given by:
(4) 𝑚𝑖𝐵 = (1 − 𝛼𝑖)𝑚𝑖 + 𝛼𝑖(𝑚𝑖 − 𝑚𝑃) = 𝑚𝑖 − 𝛼𝑖𝑚𝑃
where αi is the share of government expenditure in HEI i’s total final demand.
The balanced expenditure multiplier shows the impact of a £1 increase in final
demand (with a constant composition) for HEI i. This multiplier value takes
into account the fact that a portion of final demand will be switched from
general public expenditure9. The balanced expenditure multipliers for all
London HEIs are shown in Figure 3, together with their conventional IO
counterparts. All of the balanced expenditure Type-II multipliers are positive
but lower than their corresponding conventional values. All London HEIs
receive significant levels of government funding, and netting out the impact of
this funding inevitably reduces the measured impact of HEIs’ expenditures.
A key feature of the results is that there is considerable variation in the
balanced expenditure multipliers across HEIs in London. The minimum value of
the multiplier is 0.28 for St Mary’s, less than 10% of the value of its
9 The balanced expenditure multiplier is a weighted average of the individual HEI’s multiplier and the switching multiplier (mi – mp). The weights are the proportions of government and other funding in the HEI’s total final demand. The intuition is clear: switching public expenditure to the HEI has no effect on the impact attributed to the HEI’s other funding sources, which continue to exert the expected impact (mi), weighted by the share of other funds (1-αi). The public expenditure that is switched has a multiplier value whose sign and scale is determined by the difference between the HEI’s own multiplier and the aggregate public sector multiplier (mi – mp), and this is weighted by the share of public expenditure in total final demand for this HEI’s output, αi.

22
corresponding Type II multiplier (3.05), and the maximum value is 2.60 for
LBS, 83% of its conventional multiplier (3.12). The mean value of the balanced
expenditure multipliers for London HEIs is 1.21, which is 39% of the mean of
their Type II multipliers (3.07). Recall that, for conventional Type II
multipliers, the smallest value was 97% of the largest among the London HEIs:
for the balanced budget multipliers the comparable figure is 11%. The range of
multiplier values has increased significantly relative to the conventional IO
multipliers.
Figure 3 Balanced expenditure multipliers for London HEIs
It is apparent from equation (4) that the proportion of HEIs’ funding coming
from the public sector is going to have a major impact on an HEI’s balanced
expenditure multiplier. We already know that there is limited variation in HEIs
own expenditure multiplier (mi) and the aggregate public expenditure multiplier

23
(mp) is invariant across HEIs, so the main source of variation is in the size of
the term -αimp which is directly related to the share of government funding in
total final demand for the HEI (αi). On average London HEIs’ balanced
expenditure multipliers are around 48% of their Type II multipliers.
5. The overall impact of HEIs’ and their students’ expenditures
Conventional IO impact analyses of student expenditures typically adopt one of
two quite different approaches. They either treat all HEI students’ expenditures
as additional expenditure within the host region (Harris, 1997) or only consider
the expenditures of students who move into the region to study as additional
(Kelly et al, 2004). Our view is that these alternative perspectives are
effectively approximations to, and special cases of, an IO accounting approach
in which the key distinction is between those expenditures (or parts of
expenditures) that are exogenous and those that are endogenous. Hermannsson
et al (2013ab) implement this approach for Scotland using the survey by
Warhurst et al (2009), combined with the database employed in our preceding
analysis. Here we implement the approach using a survey of the expenditures of
students attending English HEIs by Johnson et al (2009)10. By analogy with the
discussion in Section 4 above, we can distinguish between the government
funding of students and other student funding and engage in a similar
attribution analysis that identifies balanced expenditure multipliers for
students’ expenditures.
10 For details see appendix in Hermannsson et al (2010b).

24
Here we wish to provide an overall analysis of HEI impacts by adding student
expenditure impacts to those of the HEIs’ own expenditures as discussed in
Sections 3 and 4. This implies that for each £1 million of HEI final demand
expenditure we calculate the associated student numbers and the impact on the
local economy that occurs from those students’ exogenous consumption.11 The
exogenous expenditure per student does vary between students of different
types. To accommodate this we use an equation of the following form:
(6) 𝑚𝑖𝑠 = 𝑚𝐶𝑆𝑖
𝑓𝑖∑ 𝛾𝑖,𝑛𝑐𝑛𝑥𝑛𝑛
where mSi is the student consumption multiplier, mC is the standard
consumption multiplier, si is the number of students in HEI i and there are n
student types. γi,n is the proportion of the students in HEI i in type n, cn is the
average consumption from student group n and xn is the proportion of the
income of group n that is exogenous. In the present application we have three
groups: English students, students from the rest of the UK and students from
the rest of the world.
Figure 4 gives the conventional Type II student consumption multiplier value
where the associated output is expressed as a proportion of HEI expenditure.
These are conventional multiplier values in that they do not include any
adjustment for public sector expenditure switching. For each HEI, this figure
has been added to the conventional Type II HEI output multiplier value shown
11 In order to determine exogenous consumption we subtract student consumption financed from wages and intra-family transfers. Also, where appropriate, we adjust for maintenance grants.

25
in Figure 2. Note that the associated student consumption multipliers vary
widely across HEIs, from 1.56 for Middlesex (46.3% of the institutional
expenditure multiplier), to 0.03 for Institute of Cancer Research, clearly an
outlier, reflecting its highly specialist focus and functions.
Figure 4 Aggregate multipliers of London HEIs (MAi) the darker area shows the institutional
component (the standard IO multiplier Mi) while the lighter shaded area shows the student
consumption component (MSi)
Figure 5 shows the total balanced expenditure multiplier values for each
London HEI. That is to say, the student multiplier value is also adjusted to take
into account reduced public expenditure elsewhere in England as a result of
maintenance grants from the government. This multiplier is then added to the
HEI balanced expenditure values given in Figure 3.

26
Figure 5 Aggregate balanced expenditure multipliers of London HEIs (MABi). [The darker area
shows the institutional component (MBi) while the lighter shaded area shows the student
consumption component (MBSi).]
Taking into account public sector expenditure switching implies a downward
adjustment to the student consumption multiplier. However this downward
adjustment is in general small relative to the adjustment to the HEI expenditure
multiplier. This has several implications. First, for some institutions, student
consumption makes up a large share of their total balanced expenditure
multiplier. So for Metropolitan, the student expenditure accounts for 51% of the
total impact, but for London School of Hygiene and Tropical Medicine it
accounts for only 8.4%. Second, the combined impact of HEI and student
expenditure means that for all institutions the multiplier value is greater than

27
unity. Indeed for LSE it is in excess of 3.0 and a further 11 HEIs have a
multiplier in excess of 2.0. Third, the addition of student spending leads to a
marked change in the ordering of HEI’s by their balanced budget multiplier
values. Finally, the multiplier values reflect the wide range of activities
undertaken by different HEIs. For example, Imperial and Metropolitan have
similar balanced expenditure multiplier values but their decomposition into
university and student expenditure effects are quite different.
6. Conclusions
In this paper we explore the expenditure impacts of London HEIs and their
students on the economy of England by applying an IO attribution analysis to a
purpose-built, HEI-disaggregated English IO table. Using a conventional IO
analysis the level of HEIs’ own expenditure impacts on GDP vary considerably
from the £1,528 million contributed by UCL to the £17 million impact of Rose
Bruford. However, when expenditure effects are corrected for scale and
expressed in terms of conventional multipliers, HEI impacts appear
comparatively invariant across HEIs in London.
Given the "policy scepticism" argument that public funds allocated to HEIs
could in principle be diverted to other uses, which would also drive knock-on
impacts, does that imply that HEI expenditure impacts are in effect negligible
or even zero? We investigate this hypothesis by conducting simulations in
which we subtract from the overall HEI impact the effect that its public funding
would have if it was used instead to expand the public sector. The resultant

28
balanced expenditure multipliers are all positive, but are considerably smaller
than conventional IO impacts. The balanced expenditure multipliers also exhibit
considerable heterogeneity, reflecting to a large degree the different extents to
which individual HEIs obtain their funding from the government (via HEFCE).
We adopt a new method of attributing impacts to the expenditure of HEIs’
students, a method which accommodates earlier treatments as special cases.
These impacts vary very substantially across HEIs, reflecting the student
intensity of the institution and the geographical source of the student body.
Incorporation of these effects within aggregate (institutional and student)
conventional IO and balanced expenditure multipliers, tends to reduce slightly
the degree of heterogeneity among HEIs in terms of aggregate expenditure
impacts at least (and has the impact of improving the estimated impacts of the
post 1992 universities).
This makes clear that it is not only the overall level of income that matters for
determining the expenditure impact of London HEIs but also the composition of
the income by source. This is because of the public budget constraint. Broadly
speaking, the less dependent the institution is on grants from the funding
council, the larger the multiplier of its own expenditures. Superficially, this
would suggest that teaching centred institutions focussing on a local catchment
area should have a low multiplier, whereas prestigious research based
institutions able to draw in research funding and large tuition fees should
exhibit a large multiplier. This is partially accurate, as manifested in the results
for the institutional multipliers. However, this ignores the role of students’

29
consumption expenditures, which drive a significant impact on top of the
institution’s own expenditures. The magnitude of this multiplier is driven by
both the student intensity of the institution as well as the composition of the
student body. Accounting for this significantly modifies the overall impact with
the result that a priori it is not possible to generalise that a particular type of
HEI will exhibit a higher overall multiplier than another type.
Overall, our analysis implies a more complex and subtle view of the
expenditure impacts of HEIs than is traditionally associated with impact studies
of the sector. Crude IO estimates of impact suggest a homogeneity that we think
is misleading. It is important to note that our analysis rejects the “policy
scepticism” perspective, at least in its limiting form: HEI expenditure impacts
are important, but their measurement should acknowledge the possible
alternative uses of public expenditure within the host region.
We end on a cautionary note: this study is concerned exclusively with the
expenditure, or demand-side, impacts of HEIs. These are not the only, and are
probably not the most important, impacts that HEIs have on their host
economies. For example, one key contribution that HEIs can make to their host
regions, at least in principle, is their supply of skilled graduates whose (private)
benefits are apparent through graduate wage premia. In our analysis of
expenditure impacts, in-coming students’ expenditures typically have the
biggest impact. However, these might be the very students who are least likely
to stay and stimulate the host region in the longer term, through their enhanced
productivity.

30
References
Acs, Z. J. (2009). Jaffe-Feldman-Varga: the search for knowledge spillovers. In
Varga, A. (ed) Universities, Knowledge Transfer and Regional Development.
Cheltenham: Edward Elgar.
Andersson, R., Quigley, J.M. & Wilhelmsson, M. (2009). Urbanization,
Productivity, and Innovation: Evidence from Investment in Higher Education.
Journal of Urban Economics. Vol. 66, pp. 2-15.
Anselin, L., Varga, A. & Acs, Z. (1997). Local Geographic Spillovers between
University Research and High Technology Innovations. Journal of Urban
Economics. Vol. 42. pp. 422-448.
Anselin, L., Varga, A. & Acs, Z. (2000). Geographic and Sectoral
Characteristics of Academic Knowledge Externalities. Papers in Regional
Science. Vol. 79, No. 4, pp. 435-443.
Armstrong, H.W. (1993), “The Local Income and Employment Impact of
Lancaster University”
Armstrong, H. & Taylor, J. (2000), Regional Economics and Policy, 3rd
edition., Oxford: Blackwell Publishers.

31
Battu, H., Finch, J.H. & Newlands, D. (1998), “Integrating Knowledge Effects
into University Impact Studies: A Case Study of Aberdeen University”,.
Department of Economics, University of Aberdeen.
Blake, C. & McDowell, S. (1967) A Local Input Output Table. Scottish Journal
of Political Economy. Vol. 14, pp. 227-242.
Bleaney, M.F., Binks, M.R., Greenaway, D., Reed, G.V. & Whynes, D.K.
(1992), What Does a University Add to Its Local Economy, Applied Economics,
vol. 24, pp. 305-311.
Blundell, R., Deardren, L. & Sianesi, B. (2005). Measuring the Returns to
Education, in Machin, S. & Vignoles, A. (eds) What’s the Good of Education:
The Economics of Education in the UK. Princeton & Oxford: Princeton
University Press.
Bradley, S. and Taylor, J. (1996). Human Capital Formation and Local
Economic
Performance. Regional Studies, Vol.. 30, No. 1, pp. 1-14.
Brownrigg, M. (1973), “The Economic Impact of a New University”, Scottish
Journal of Political Economy, vol. 10, no. 2, pp. 123-139.
Checchi, D. (2006). The Economics of Education: Human Capital, Family
Background and Inequality. Cambridge: Cambridge University Press.

32
Drucker, J., & Goldstein, H. (2007). Assessing the regional economic
development impacts of universities: a review of current approaches.
International regional science review, Vol. 30, No. 1, pp. 20-46.
Faggian, A., McCann, P. & Sheppard, S. (2010). Higher Education, Graduate
Migration and Regional Dynamism in Great Britain. In Varga, A. (ed.).
Universities, Knowledge Transfer and Regional Development: Geography,
Enterpreneurship and Policy. Cheltenham: Edvard Elgar.
Fischer, M. & Varga, A. (2003). Spatial knowledge spillovers and university
research: Evidence from Austria. Annals of Regional Science. Vol. 31, No. 2,
pp. 303-322.
Florax, R.J.G.M. (1992), The University: A Regional Booster?, Aldershot:
Avebury.
Goldstein, H. A. (2009). What we know and what we don’t know about the
regional economic impacts of universities. In Varga, A. (ed) Universities,
Knowledge Transfer and Regional Development. Cheltenham: Edward Elgar.
Harmon, C. & Walker, I. (2003). The Returns to Education: Microeconomics.
Journal of Economic Surveys, Vol. 17, No. 2, pp. 115-153.

33
Harris, R.I.D. (1997), “The Impact of the University of Portsmouth on the Local
Economy”, Urban Studies, vol. 34, pp. 605-626.
Hermannsson, K., Lisenkova, K., McGregor, P. & Swales, K. (2010a). An HEI-
Disaggregated Input-Output Table for Scotland. Strathclyde Discussion Papers
in Economics, 10-14.
Hermannsson, K., Lisenkova, K., McGregor, P. & Swales, K. (2010b). “Policy
Scepticism” and the Impact of London-based Higher Education Institutions
(HEIs) on the Economy of England: Accounting for Alternative Uses of Public
Expenditure. Strathclyde Discussion Papers in Economics, 10-29
Hermannsson, K., Lisenkova, K., McGregor, P. & Swales, K. (2013a). Policy
Scepticism and the Impact of Scottish Higher Education Institutions (HEIs) on
their Host Region: Accounting for Regional Budget Constraints under
Devolution. Regional Studies, forthcoming. Pre-published online:
http://dx.doi.org/10.1080/00343404.2012.697139
Hermannsson, K., Lisenkova, K., McGregor, P. & Swales, K. (2013b). The
Expenditure Impacts of Individual Higher Education Institutions (HEIs) and
their Students on the Scottish Economy under Devolution: Homogeneity of
Heterogeneity? Environment and Planning A, Vol. 45, No. 3, pp. 710 – 727.

34
Hermannsson, K., Lecca, P., Lisenkova, K., McGregor, P. & Swales, K.
(forthcoming). The Importance of Graduates for the Scottish Economy: A
“Micro-to-Macro” Analysis. Environment and Planning A, forthcoming.
HESA – Higher Education Statistics Agency (2007). Resources of Higher
Education Institutions 2005/06.
Jaffe, A.B. (1989). Real Effects of Academic Research. The American
Economic Review. December 1989. Vol. 79. No. 5.
Johnson, C., Pollard, E., Hunt, W., Munro, M., Hillage, J., Parfrement, J. &
Low, N.A. (2009). Student Income and Expenditure Survey 2007/08: English-
domiciled Students. Report prepared by the Institue for Employment Studies
and the National Centre for Social Research for the Department for Innovation,
Universities & Skills Retrieved from the World Wide Web:
http://www.bis.gov.uk/assets/biscore/corporate/migratedd/publications/d/dius_r
r_09_05.pdf
Kelly, U., McNicoll, I. & McClellan, D. (2004), “The Impact of the University
of Strathclyde on the economy of Scotland and the City of Glasgow”, Project
Report, University of Strathclyde, Glasgow, United Kingdom.
Loveridge, S. (2004). “A Typology and Assessment of Multi-sector Regional
Economic Impact Models”. Regional Studies, Vol. 38, No. 3m pp. 305 - 317

35
Lundvall, B.A. (2008). Higher Education, Innovation and Economic
Development. In Lin, J.Y. & Plescovic, B. (eds.) Higher Education and
Development: Washington: The World Bank.
McGregor, P., Swales, K. & Yin, Y.P. (1996), “A long-run interpretation of
regional input – output analysis”, Journal of Regional Science, vol. 36, pp. 479-
501.
McGregor, P., Swales, K & McLellan, D. (2006), “The Overall Impact of
Higher Education Institutions on Regions: A Critical Review”, in Centre for
Public Policy for the Regions’s “Network on the Overall Impact of HEIs on
Regional Economies: Final Report”, Centre for Public Policy for Regions,
Glasgow.
McMahon, W.W. (2004). The Social and External Benefits of Education. In
Geraint, J. & Johnes. J. (eds.) International Handbook on the Economics of
Education. Cheltenham: Edward Elgar.
McMahon, W.W. (2009). Higher Learning, Greater Good: The Private and
Social Benefits of Higher Edudation. Baltimore: The John Hopkins Press.
Miller, R.E. & Blair, P.D. (2009), “Input-Output Analysis: Foundations and
Extensions, second edition“. Cambridge: Cambridge University Press.

36
Parker, D.D. & Zilberman, D. (1993). University Technology Transfers:
Impacts On Local And U.S. Economies. Contemporary Economic Policy. Vol.
11, No. 2, pp. 87-99.
Psacharopoulos, G. & Patrions, H. A. (2004). Human Capital and Rates of
Return. In Geraint, J. & Johnes. J. (eds.) International Handbook on the
Economics of Education.Cheltenham: Edward Elgar.
Siegfried, J. J., A. R. Sanderson & McHenry, P. (2007). The economic impact
of colleges and universities. Economics of Education Review, Vol. 26, pp. 546-
558.
Varga, A. & Schalk, A. (2004). Knowledge Spillovers, Agglomeration and
Macroeconomic Growth: An Empirical Approach. Regional Studies, Vol. 38,
No. 8, pp. 977-989.
Warhurst, C., Commander, J., Nickson, D., Symeonides, A. Furlong, A.,
Findlay, J., Wilson, F. & Hurrell, S. (2009). Higher and Further Education
Students’ Income, Expenditure and Debt in Scotland 2007-08. Edinburgh:
Scottish Government Social Research. Retrieved from the World Wide Web:
http://www.scotland.gov.uk/Publications/2009/06/24115743/02