Embed Size (px)
Citation preview

© 2017 Ipsos 1
The Economic Pulse of the WorldCitizens in 26 Countries Assess the Current State of their Country’s Economy for a Total Global Perspective
Global @dvisor
1A Global @dvisory – February 2017 – G@91
The Economic Pulse

© 2017 Ipsos 2
These are the findings of the Global @dvisor Wave 91 (G@91),an Ipsos survey conducted between January 20th and February 3rd, 2017.• The survey instrument is conducted monthly in 26 countries around the world via the Ipsos Online Panel system. The countries reporting herein are
Argentina, Australia, Belgium, Brazil, Canada, China, France, Great Britain, Germany, Hungary, India, Israel, Italy, Japan, Mexico, Peru, Poland, Russia, Saudi Arabia, Serbia, South Africa, South Korea, Spain, Sweden, Turkey and the United States of America.
• For the results of the survey presented herein, an international sample of 18,557 adults aged 18-64 in the US, Israel and Canada, and age 16-64 in all other countries, were interviewed. Approximately 1000+ individuals participated on a country by country basis via the Ipsos Online Panel with the exception of Argentina, Belgium, Hungary, Israel, Mexico, Peru, Poland, Russia, Saudi Arabia, South Africa, South Korea, Sweden and Turkey, where each have a sample approximately 500+. The precision of Ipsos online polls are calculated using a credibility interval with a poll of 1,000 accurate to +/- 3.1 percentage points and of 500 accurate to +/- 4.5 percentage points. For more information on the Ipsos use of credibility intervals, please visit the Ipsos website.
• 17 of the 26 countries surveyed online generate nationally representative samples in their countries (Argentina, Australia, Belgium, Canada, France, Germany, Great Britain, Hungary, Israel, Italy, Japan, Poland, Serbia, South Korea, Spain, Sweden, and United States).
• Brazil, China, India, Mexico, Peru, Russia, Saudi Arabia, South Africa and Turkey produce a national sample that is more urban & educated, and with higher incomes than their fellow citizens. We refer to these respondents as “Upper Deck Consumer Citizens”. They are not nationally representative of their country.

© 2017 Ipsos 3
ANALYTIC COMPONENTS…There are three analytic components that make up the findings of this monthly Economic Pulse report. Each question is tracked and analyzed from questions dealing with:
• Thinking about our economic situation, how would you describe the current economic situation in [insert country]? Is it very good, somewhat good, somewhat bad or very bad?
The currently perceived macroeconomic state of the respondent’s country:
• Rate the current state of the economy in your local area using a scale from 1 to 7, where 7 means a very strong economy today and 1 means a very weak economy.
The currently perceived state of the local economy:
• Looking ahead six months from now, do you expect the economy in your local area to bemuch stronger, somewhat stronger, about the same, somewhat weaker, or much weaker than it is now?
A six month outlook for the local economy:

© 2017 Ipsos 4
THE WORLD at a GLANCE

© 2017 Ipsos 5
Global @dvisor Welcomes Serbia
• The global national economic assessment holds steady this month, as four in ten (40%) respondents around the world rate their national economy as “good”. North America is a regional winner in February, as both the United States (55%, +3 pts.) and Canada (55%, +3 pts.) show an improvement since last sounding. Both Middle East (43%, -2 pts.) and Latin America (27%, -1 pt.) lose ground this month. The assessment average for all other regions remains unchanged.
• The local economic assessment average (30%) is down for a second month in a row. Regional players that drive the average lower this sounding are Middle East/Africa (37%, -2 pts.) and Latin America (19%, -1 pt.).
• The future national economic assessment remains unchanged since last sounding, as one quarter (26%) of respondents expect their national economy to be “stronger” in the next 6 months. Most of the regions stay in the positive territory, with only Europe (13%, -2 pts.) and Latin America (43%, -1 pt.) being down since January.
• The Global Economic Pulse welcomes the addition of a 26th country: Serbia
• While on par with most of the European countries, Serbia scores lower than the global average in all three assessment categories:
Global average Serbia average
National assessment 40% 21%
Local assessment 30% 8%
Future local assessment 26% 11%

© 2017 Ipsos 6
Global Average of National Economic Assessment Unchanged: 40%
• The average global economic assessment of national economies surveyed in 25 countries remains unchanged with 40% of global citizens rating their national economies as ‘good’.
• India (80%) takes the top spot in the national economic assessment category this month, followed by Saudi Arabia (78%), China (76%), Germany (74%), Sweden (69%), Peru (61%), Australia (57%), Canada (55%) and the United States (55%). South Korea (7%) remains at the lowest spot in this assessment, followed by Brazil (10%), Mexico (14%), France (14%), Italy (15%), Spain (16%), South Africa (18%), Argentina (23%) and Hungary (23%).
• Countries with the greatest improvements in this wave: Belgium (41%, +4 pts.), the United States (55%, +3 pts.), Japan (32%, +3 pts.), Canada (55%, +3 pts.), Argentina (23%, +3 pts.), South Africa (18%, +2 pts.), Israel (48%, +2 pts.), India (80%, +2 pts.) and China (76%, +2 pts.).
• Countries with the greatest declines: Turkey (29%, -8 pts.), Peru (61%, -6 pts.), Australia (57%, -3 pts.), Germany (74%, -3 pts.), France (14%, -2 pts.), Hungary (23%, -2 pts.) and Saudi Arabia (78%, -2 pts.).

© 2017 Ipsos 7
Global Average of Local Economic Assessment (30%) Down One Point
• When asked to assess their local economy, nearly one third (30%) of those surveyed in 25 countries agree that the state of the current economy in their local area is ‘good’. The local economic assessment is down one point since last sounding.
• India (61%) once again has the lead in the local assessment category, followed by China (57%), Saudi Arabia (56%), Israel (55%),Germany (53%), Sweden (52%), the United States (47%), Australia (38%) and Canada (34%). Despite gaining one point since last sounding, South Korea (7%) is the lowest ranked country this month again, followed by Mexico (10%), South Africa (14%), Japan (14%), Italy (14%), Spain (15%), France (16%), Brazil (16%), Hungary (18%) and Argentina (19%).
• Countries with the greatest improvements in this wave: Belgium (25%, +5 pts.), the United States (47%, +4 pts.), South Africa (14%, +2 pts.), Brazil (16%, +2 pts.) and Argentina (19%, +2 pts.).
• Countries with the greatest declines in this wave: Peru (29%, -10 pts.), Turkey (21%, -9 pts.), Sweden (52%, -4 pts.), Canada (34%, -2 pts.), Poland (24%, -2 pts.) and Saudi Arabia (56%, -2 pts.).

© 2017 Ipsos 8
Global Average of Future Outlook for Local Economy (26%) Unchanged
• The future outlook is unchanged since last month, with one quarter (26%) of global citizens surveyed in 25 countries expecting their local economy to be stronger six months from now.
• India (67%) once again leads in this assessment category, followed by Brazil (62%), China (52%), Saudi Arabia (51%), Peru (46%),Argentina (46%), the United States (42%), Turkey (25%), Russia (22%), Mexico (20%), Spain (19%) and South Africa (19%). France and Italy (both 8%) share the lowest future outlook score this month, followed by South Korea (10%), Sweden (10%), Japan (11%), Belgium (11%), Hungary (13%), Great Britain (15%), Poland (16%) and Australia (16%).
• Countries with the greatest improvements in this wave: Israel (17%, +8 pts.), South Africa (19%, +6 pts.), the United States (42%, +4 pts.), Brazil (62%, +3 pts.), South Korea (10%, +2 pts.), Japan (11%, +2 pt.), India (67%, +2 pts.) and Great Britain (15%, +12pts.).
• Countries with the greatest declines in this wave: Sweden (10%, -10 pts.), Peru (46%, -6 pts.), Turkey (25%, -6 pts.), Saudi Arabia (51%, -4 pts.), Canada (16%, -2 pts.), Germany (17%, -2 pts.), Hungary (13%, -2 pts.), Italy (8%, -2 pts.) and Poland (16%, -2 pts.).

© 2017 Ipsos 9
1. National Economic Assessments: Countries at a Glance Compared to the Last Wave…
Thinking about our economic situation, how would you describe the current economic situation in [insert country]? Is it very good, somewhat good, somewhat bad or very bad?
India 80% Belgium 4% Turkey -8% Poland 35%
Saudi Arabia 78% US 3% Peru -6% Russia 32%
China 76% Japan 3% Australia -3% Japan 32%
Germany 74% Canada 3% Germany -3% Turkey 29%
Sweden 69% Argentina 3% France -2% Hungary 23%
Peru 61% South Africa 2% Hungary -2% Argentina 23%
Australia 57% Israel 2% Saudi Arabia -2% South Africa 18%
Canada 55% India 2% Poland -1% Spain 16%
US 55% China 2% Russia -1% Italy 15%
Israel 48% Great Britain 1% Spain -1% France 14%
Great Britain 44% Brazil 1% Mexico 14%
Belgium 41% Brazil 10%
South Korea 7%
is HIGHEST this month
has experienced an
IMPROVEMENT since last
sounding
has experienced a DECLINE
since last soundingis LOWEST this month
Those Countries Where the Local National Economic Assessment…

© 2017 Ipsos 10
1. National Economic Assessment: Regions at a Glance Compared to the Last Wave…
Thinking about our economic situation, how would you describe the current economic situation in [insert country]? Is it very good, somewhat good, somewhat bad or very bad?
REGION
(in descending
order by NET)
NET
‘Good’
CHANGE
(since last sounding)
North America 55% 3%
BRIC 49% 0%
APAC 47% 0%
Middle East/Africa 43% -2%
G-8 Countries 40% 0%
Europe 37% 0%
LATAM 27% -1%

© 2017 Ipsos 11
2. Local Economic Assessment: Countries at a Glance Compared to the Last Wave…
Rate the current state of the economy in your local area using a scale from 1 to 7, where 7 means a very strong economy today and 1 means a very weak economy
India 61% Belgium 5% Peru -10% Russia 23%
China 57% US 4% Turkey -9% Turkey 21%
Saudi Arabia 56% South Africa 2% Sweden -4% Argentina 19%
Israel 55% Brazil 2% Canada -2% Hungary 18%
Germany 53% Argentina 2% Poland -2% Brazil 16%
Sweden 52% South Korea 1% Saudi Arabia -2% France 16%
US 47% Russia 1% China -1% Spain 15%
Australia 38% Japan 1% Germany -1% Italy 14%
Canada 34% India 1% Israel -1% Japan 14%
Great Britain 31% Great Britain 1% Italy -1% South Africa 14%
Peru 29% Mexico 10%
Belgium 25% South Korea 7%
Poland 24%
is HIGHEST this month
has experienced an
IMPROVEMENT since last
sounding
has experienced a DECLINE
since last soundingis LOWEST this month
Those Countries Where the Local Area Economic Assessment…

© 2017 Ipsos 12
2. Local Economic Assessment: Regions at a Glance Compared to the Last Wave…
Rate the current state of the economy in your local area using a scale from 1 to 7, where 7 means a very strong economy today and 1 means a very weak economy
REGION
(in descending
order by NET)
NET
‘Strong’
Top 3 Box
(5-6-7)
CHANGE
(since last sounding)
North America 41% 1%
BRIC 40% 2%
Middle East/Africa 37% -2%
APAC 33% 0%
G-8 Countries 29% 0%
Europe 28% 0%
LATAM 19% -1%

© 2017 Ipsos 13
3. Six Month Outlook on the Local Economy: Countries at a Glance Compared to the Last Wave…
Looking ahead six months from now, do you expect the economy in your local area to be much stronger, somewhat stronger, about the same, somewhat weaker, or much weaker than it is now?
India 67% Israel 8% Sweden -10% Germany 17%
Brazil 62% South Africa 6% Peru -6% Israel 17%
China 52% US 4% Turkey -6% Canada 16%
Saudi Arabia 51% Brazil 3% Saudi Arabia -4% Poland 16%
Peru 46% South Korea 2% Canada -2% Australia 16%
Argentina 46% Japan 2% Germany -2% Great Britain 15%
US 42% India 2% Hungary -2% Hungary 13%
Turkey 25% Great Britain 2% Italy -2% Belgium 11%
Russia 22% Argentina 1% Poland -2% Japan 11%
Mexico 20% Australia -1% Sweden 10%
Spain 19% Belgium -1% South Korea 10%
South Africa 19% China -1% Italy 8%
Spain -1% France 8%
is HIGHEST this month
has experienced an
IMPROVEMENT since last
sounding
has experienced a DECLINE
since last soundingis LOWEST this month
Countries where the Assessment of the Local Economic Strengthening …

© 2017 Ipsos 14
3. Six Month Outlook on Local Economy: Regions at a Glance Compared to Last Wave…
Looking ahead six months from now, do you expect the economy in your local area to be much stronger, somewhat stronger, about the same, somewhat weaker, or much weaker than it is now?
REGION
(in descending
order by NET)
NET
‘Stronger’
CHANGE
(since last sounding)
BRIC 51% 1%
LATAM 43% -1%
APAC 30% 1%
North America 29% 1%
Middle East/Africa 28% 1%
G-8 Countries 18% 1%
Europe 13% -2%

© 2017 Ipsos 15
DETAILED FINDINGS

© 2017 Ipsos 16
Detailed Tables B.3
Assessing The Current Economic Situation ……
in Their Country

© 2017 Ipsos 17
Global Citizens Assess the Current Economic Situation in their Country as “Good”
Now thinking about our economic situation, how would you describe the current economic situation in [insert country]? Is it very good, somewhat good, somewhat bad or very bad?
40%
80%
78%
76%
74%
69%
61%
57%
55%
55%
48%
44%
41%
35%
32%
32%
29%
23%
23%
21%
18%
16%
15%
14%
14%
10%
7%
All Countries
India
Saudi Arabia
China
Germany
Sweden
Peru
Australia
Canada
US
Israel
Great Britain
Belgium
Poland
Japan
Russia
Turkey
Argentina
Hungary
Serbia
South Africa
Spain
Italy
France
Mexico
Brazil
South Korea
‘Very Good / Somewhat Good’

© 2017 Ipsos 18
Global Average Tracked - Global Citizens Assess the Current Economic Situation in their Country as “Good”:…
Now thinking about our economic situation, how would you describe the current economic situation in [insert country]? Is it very good, somewhat good, somewhat bad or very bad?
40%
0%
5%
10%
15%
20%
25%
30%
35%
40%
45%
50%
Mar
-11
May
-11
Jul-
11
Sep
-11
No
v-1
1
Jan
-12
Mar
-12
May
-12
Jul-
12
Sep
-12
No
v-1
2
Jan
-13
Mar
-13
May
-13
Jul-
13
Sep
-13
No
v-1
3
Jan
-14
Mar
-14
May
-14
Jul-
14
Sep
-14
No
v-1
4
Jan
-15
Mar
-15
May
-15
July
-15
Sep
-15
No
v-1
5
Jan
-16
Mar
-16
May
-16
Jul-
16
Sep
-16
No
v-1
6
Jan
-17
Total Good
N/C

© 2017 Ipsos 19
For All Countries Tracked: Citizens Assess the Current Economic Situation in their Country as “Good”
Now thinking about our economic situation, how would you describe the current economic situation in [insert country]? Is it very good, somewhat good, somewhat bad or very bad?
Feb ’14
Mar’14
Apr’14
May
’14
Jun’14
Jul’14
Aug‘14
Sep‘14
Oct ‘14
Nov ‘14
Dec ‘14
Jan ‘15
Feb ‘15
Mar ’15
Apr ‘15
May
‘15
June
‘15
July ‘15
Aug ‘15
Sep ‘15
Oct ‘15
Nov ‘15
Dec ‘15
Jan ‘16
Feb`16
Mar`16
Apr`16
May
`16
Jun`16
Jul`16
Aug`16
Sep`16
Oct`16
Nov`16
Dec`16
Jan`17
Feb`17
Total 38% 38% 39% 39% 39% 39% 40% 40% 41% 40% 39% 41% 40% 39% 41% 40% 41% 42% 41% 39% 39% 39% 39% 40% 36% 37% 38% 39% 38% 40% 41% 41% 41% 40% 42% 40% 40%
Argentina 21% 18% 17% 18% 24% 21% 24% 19% 21% 19% 20% 21% 24% 25% 29% 28% 28% 29% 24% 28% 29% 29% 27% 28% 24% 15% 15% 17% 21% 19% 19% 18% 20% 21% 23% 20% 23%
Australia 57% 54% 60% 53% 52% 56% 57% 58% 65% 63% 57% 58% 56% 51% 54% 56% 56% 57% 56% 54% 53% 55% 57% 59% 56% 52% 52% 59% 51% 56% 55% 55% 58% 60% 62% 60% 57%
Belgium 37% 37% 40% 42% 39% 41% 40% 37% 35% 33% 31% 33% 39% 41% 35% 38% 44% 46% 45% 42% 35% 43% 35% 40% 38% 39% 33% 36% 27% 33% 39% 37% 28% 33% 36% 37% 41%
Brazil 26% 24% 26% 20% 31% 24% 25% 26% 32% 23% 22% 17% 12% 11% 11% 14% 9% 12% 10% 6% 8% 8% 4% 8% 8% 7% 8% 7% 6% 8% 12% 7% 9% 9% 13% 9% 10%
Canada 63% 66% 64% 65% 63% 70% 68% 65% 65% 67% 66% 63% 59% 61% 57% 63% 60% 65% 47% 45% 51% 52% 51% 44% 34% 36% 49% 52% 53% 57% 59% 56% 54% 53% 61% 52% 55%
China 69% 69% 68% 66% 65% 69% 73% 74% 70% 78% 71% 80% 71% 75% 79% 76% 75% 72% 70% 68% 69% 72% 74% 66% 61% 67% 67% 65% 69% 71% 72% 72% 76% 76% 79% 74% 76%
France 8% 10% 9% 9% 7% 8% 6% 5% 7% 6% 7% 7% 10% 9% 11% 11% 12% 11% 11% 10% 14% 12% 13% 18% 9% 12% 12% 13% 11% 13% 16% 13% 11% 14% 21% 16% 14%
Germany 74% 76% 75% 75% 76% 77% 75% 79% 75% 74% 75% 81% 76% 79% 74% 76% 75% 78% 79% 77% 73% 71% 74% 79% 72% 67% 74% 73% 74% 78% 76% 75% 75% 77% 76% 77% 74%
Great Britain 36% 36% 37% 43% 39% 41% 45% 42% 41% 45% 39% 46% 44% 48% 51% 51% 55% 49% 48% 53% 48% 45% 45% 48% 49% 49% 39% 44% 48% 37% 42% 45% 50% 41% 38% 43% 44%
Hungary 14% 17% 24% 18% 17% 20% 18% 16% 23% 13% 15% 16% 16% 13% 19% 15% 17% 18% 19% 16% 20% 19% 23% 16% 19% 20% 22% 16% 18% 18% 19% 21% 21% 17% 24% 25% 23%
India 61% 58% 60% 66% 75% 65% 72% 80% 80% 81% 81% 80% 80% 80% 82% 78% 83% 82% 79% 79% 82% 76% 79% 84% 76% 82% 81% 80% 81% 81% 83% 84% 82% 86% 79% 78% 80%
Israel 36% 34% 46% 47% 48% 51% 53% 52% 44% 42% 46% 42% 47% 43% 52% 42% 48% 50% 48% 52% 53% 49% 46% 46% 48%
Italy 7% 6% 10% 9% 7% 9% 8% 7% 8% 8% 7% 8% 8% 9% 10% 9% 11% 10% 12% 14% 13% 13% 16% 13% 14% 13% 14% 14% 14% 13% 15% 13% 15% 14% 18% 15% 15%
Japan 29% 25% 26% 26% 29% 28% 27% 22% 20% 19% 19% 23% 26% 31% 31% 31% 30% 36% 30% 27% 29% 26% 27% 29% 26% 23% 21% 19% 19% 21% 23% 26% 29% 28% 38% 29% 32%
Mexico 23% 24% 19% 20% 25% 26% 24% 22% 29% 23% 20% 19% 22% 16% 30% 16% 28% 33% 20% 21% 23% 27% 24% 24% 17% 23% 24% 20% 19% 14% 23% 20% 17% 20% 21% 14% 14%
Peru 52% 52% 46% 45% 52% 54% 54% 61% 62% 69% 65% 65% 72% 67% 61%
Poland 25% 22% 25% 31% 25% 26% 26% 28% 31% 35% 33% 28% 27% 29% 30% 29% 33% 29% 35% 35% 36% 30% 36% 35% 33% 29% 36% 31% 31% 38% 41% 42% 37% 36% 39% 36% 35%
Russia 32% 39% 50% 58% 47% 50% 59% 53% 47% 41% 36% 26% 28% 32% 33% 43% 36% 37% 38% 34% 30% 29% 36% 32% 21% 28% 25% 28% 26% 27% 29% 28% 28% 29% 29% 33% 32%
Saudi Arabia 85% 86% 89% 87% 85% 87% 85% 84% 87% 85% 84% 87% 94% 92% 93% 90% 91% 91% 90% 87% 90% 91% 90% 86% 88% 89% 86% 91% 88% 91% 87% 78% 80% 82% 79% 80% 78%
Serbia 21%
South Africa 17% 21% 18% 28% 23% 21% 24% 26% 22% 26% 23% 26% 27% 18% 25% 17% 20% 17% 21% 16% 19% 18% 12% 12% 13% 9% 11% 17% 13% 12% 12% 17% 18% 15% 15% 16% 18%
South Korea 23% 16% 23% 19% 17% 15% 17% 16% 14% 11% 12% 13% 13% 13% 14% 16% 15% 14% 14% 14% 18% 12% 13% 11% 13% 13% 13% 13% 10% 13% 14% 13% 15% 10% 15% 7% 7%
Spain 8% 6% 10% 10% 8% 9% 11% 10% 7% 10% 9% 11% 12% 13% 12% 16% 13% 16% 20% 19% 17% 17% 17% 18% 14% 15% 15% 14% 13% 14% 16% 16% 15% 13% 17% 17% 16%
Sweden 69% 80% 66% 64% 75% 73% 70% 77% 67% 67% 74% 72% 73% 69% 66% 65% 66% 66% 70% 65% 72% 63% 58% 65% 56% 63% 69% 68% 65% 74% 68% 70% 65% 66% 66% 69% 69%
Turkey 39% 40% 44% 45% 45% 44% 49% 47% 43% 46% 39% 45% 43% 39% 36% 38% 32% 38% 39% 28% 29% 42% 40% 45% 36% 38% 40% 42% 39% 41% 40% 43% 50% 45% 37% 37% 29%
United States
31% 31% 36% 37% 38% 33% 35% 36% 42% 41% 44% 51% 47% 47% 48% 47% 44% 43% 48% 42% 43% 44% 45% 45% 44% 45% 46% 48% 48% 49% 53% 50% 48% 45% 55% 52% 55%

© 2017 Ipsos 20
Countries Ranked and Marked By Change In Assessment From Last Month (Left Column)
Thinking about our economic situation, how would you describe the current economic situation in [insert country]? Is it very good, somewhat good, somewhat bad or very bad?
40%
41%
23%
55%
32%
55%
76%
80%
48%
18%
10%
44%
15%
14%
7%
69%
35%
32%
16%
14%
23%
78%
57%
74%
61%
29%
All Countries (N/C)
Belgium (4)
Argentina (3)
Canada (3)
Japan (3)
US (3)
China (2)
India (2)
Israel (2)
South Africa (2)
Brazil (1)
Great Britain (1)
Italy (N/C)
Mexico (N/C)
South Korea (N/C)
Sweden (N/C)
Poland (-1)
Russia (-1)
Spain (-1)
France (-2)
Hungary (-2)
Saudi Arabia (-2)
Australia (-3)
Germany (-3)
Peru (-6)
Turkey (-8)
% Very Good / Somewhat Good
Green marks countries experiencing improvement;Blue marks countries with no change from last month; Red marks countries experiencing a decline;

© 2017 Ipsos 21
Countries Ranked by Net Improvement, Decline or No Change Compared to Last Month:
Thinking about our economic situation, how would you describe the current economic situation in [insert country]? Is it very good, somewhat good, somewhat bad or very bad?
-8%-6%
-3%-3%
-2%-2%-2%
-1%-1%-1%
0%0%0%0%
1%1%
2%2%2%2%
3%3%3%3%
4%
-15% -10% -5% 0% 5% 10% 15%
Turkey (-8)
Peru (-6)
Australia (-3)
Germany (-3)
France (-2)
Hungary (-2)
Saudi Arabia (-2)
Poland (-1)
Russia (-1)
Spain (-1)
Italy (N/C)
Mexico (N/C)
South Korea (N/C)
Sweden (N/C)
Brazil (1)
Great Britain (1)
China (2)
India (2)
Israel (2)
South Africa (2)
Argentina (3)
Canada (3)
Japan (3)
US (3)
Belgium (4)

© 2017 Ipsos 22
Assessing the Current Economic Situation by All Regions:
Now thinking about our economic situation, how would you describe the current economic situation in [insert country]? Is it very good, somewhat good, somewhat bad or very bad?
55%
27%
37%
47%
40%
49%
43%
10%
20%
30%
40%
50%
60%
70%
Au
g 2
010
Oct
20
10
Dec
20
10
Feb
20
11
Ap
r 2
011
Jun
201
1
Au
g 2
011
Oct
20
11
Dec
20
11
Feb
20
12
Ap
r 2
012
Jun
201
2
Au
g 2
012
Oct
20
12
Dec
20
12
Feb
20
13
Ap
r 2
013
Jun
201
3
Au
g 2
013
Oct
201
3
Jan
20
14
Mar
20
14
May
20
14
Au
g 2
014
Oct
20
14
Dec
20
14
Feb
20
15
Ap
r 2
015
Jun
201
5
Au
g 2
015
Oct
20
15
Dec
20
15
Feb
20
16
Ap
r 2
016
Jun
201
6
Au
g 2
016
Oct
20
16
Dec
20
16
Feb
20
17
North America (Can/US) LATAM Europe APAC G8 BRIC Middle East/Africa
Very Good / Somewhat Good
© 2017 Ipsos 23
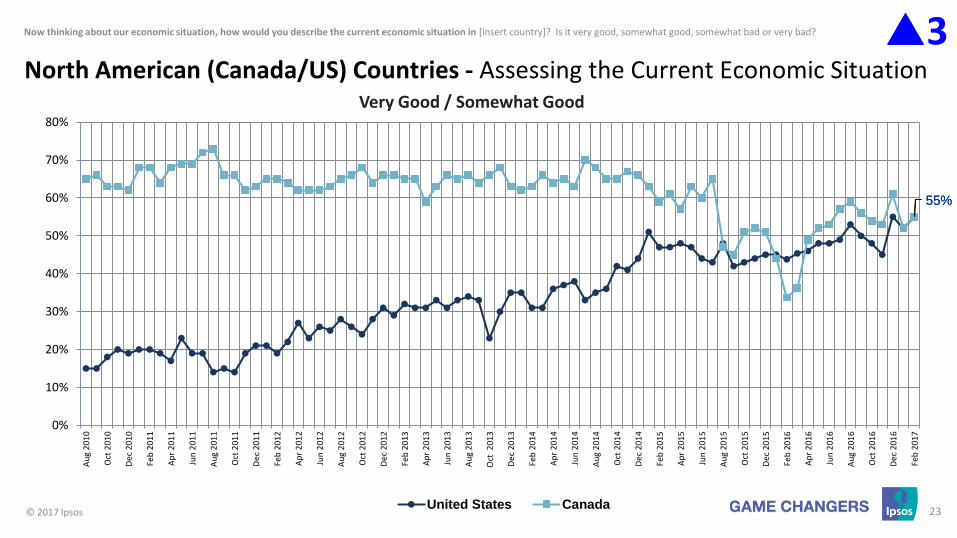
North American (Canada/US) Countries - Assessing the Current Economic Situation
Now thinking about our economic situation, how would you describe the current economic situation in [insert country]? Is it very good, somewhat good, somewhat bad or very bad?
Very Good / Somewhat Good
3
55%55%
0%
10%
20%
30%
40%
50%
60%
70%
80%
Au
g 2
010
Oct
201
0
Dec
20
10
Feb
20
11
Ap
r 2
011
Jun
201
1
Au
g 2
011
Oct
201
1
Dec
20
11
Feb
20
12
Ap
r 2
012
Jun
201
2
Au
g 2
012
Oct
201
2
Dec
20
12
Feb
20
13
Ap
r 2
013
Jun
201
3
Au
g 2
013
Oct
201
3
Dec
20
13
Feb
20
14
Ap
r 2
014
Jun
201
4
Au
g 2
014
Oct
201
4
Dec
20
14
Feb
20
15
Ap
r 2
015
Jun
201
5
Au
g 2
015
Oct
201
5
Dec
20
15
Feb
20
16
Ap
r 2
016
Jun
201
6
Au
g 2
016
Oct
201
6
Dec
20
16
Feb
20
17
United States Canada

© 2017 Ipsos 24
LATAM Countries - Assessing the Current Economic Situation
Now thinking about our economic situation, how would you describe the current economic situation in [insert country]? Is it very good, somewhat good, somewhat bad or very bad?
Very Good / Somewhat Good
1
10%
23%
14%
61%
0%
10%
20%
30%
40%
50%
60%
70%
80%
Au
g 2
010
Oct
201
0
Dec
20
10
Feb
20
11
Ap
r 2
011
Jun
201
1
Au
g 2
011
Oct
201
1
Dec
20
11
Feb
20
12
Ap
r 2
012
Jun
201
2
Au
g 2
012
Oct
201
2
Dec
20
12
Feb
20
13
Ap
r 2
013
Jun
201
3
Au
g 2
013
Oct
201
3
Dec
20
13
Feb
20
14
May
20
14
Jul 2
01
4
Sep
20
14
No
v 2
014
Jan
20
15
Mar
20
15
May
20
15
Jul 2
01
5
Sep
20
15
No
v 2
015
Jan
20
16
Mar
20
16
May
20
16
Jul 2
01
6
Sep
20
16
No
v 2
016
Jan
20
17
Brazil Argentina Mexico Peru

© 2017 Ipsos 25
European Countries - Assessing the Current Economic Situation
Now thinking about our economic situation, how would you describe the current economic situation in [insert country]? Is it very good, somewhat good, somewhat bad or very bad?
Very Good / Somewhat Good
N/C
74%
14%16%
69%
44%41%
15%
23%21%28% 29%
35%
0%
10%
20%
30%
40%
50%
60%
70%
80%
90%
100%
Au
g 2
010
Oct
201
0
Dec
20
10
Feb
20
11
Ap
r 2
011
Jun
201
1
Au
g 2
011
Oct
201
1
Dec
20
11
Feb
20
12
Ap
r 2
012
Jun
201
2
Au
g 2
012
Oct
201
2
Dec
20
12
Feb
20
13
Ap
r 2
013
Jun
201
3
Au
g 2
013
Oct
201
3
Dec
20
13
Feb
20
14
Ap
r 2
014
Jun
201
4
Au
g 2
014
Oct
201
4
Dec
20
14
Feb
20
15
Ap
r 2
015
Jun
201
5
Au
g 2
015
Oct
201
5
Dec
20
15
Feb
20
16
Ap
r 2
016
Jun
201
6
Au
g 2
016
Oct
201
6
Dec
20
16
Feb
20
17
Germany France Spain Sweden Great Britain Belgium Italy Hungary Serbia Poland

© 2017 Ipsos 26
APAC Countries - Assessing the Current Economic Situation
Now thinking about our economic situation, how would you describe the current economic situation in [insert country]? Is it very good, somewhat good, somewhat bad or very bad?
Very Good / Somewhat Good
N/C
57%
76%80%
32%32%
7%
0%
10%
20%
30%
40%
50%
60%
70%
80%
90%
100%
Au
g 2
010
Oct
201
0
Dec
20
10
Feb
20
11
Ap
r 2
011
Jun
201
1
Au
g 2
011
Oct
201
1
Dec
20
11
Feb
20
12
Ap
r 2
012
Jun
201
2
Au
g 2
012
Oct
201
2
Dec
20
12
Feb
20
13
Ap
r 2
013
Jun
201
3
Au
g 2
013
Oct
201
3
Dec
20
13
Feb
20
14
Ap
r 2
014
Jun
201
4
Au
g 2
014
Oct
201
4
Dec
20
14
Feb
20
15
Ap
r 2
015
Jun
201
5
Au
g 2
015
Oct
201
5
Dec
20
15
Feb
20
16
Ap
r 2
016
Jun
201
6
Au
g 2
016
Oct
201
6
Dec
20
16
Feb
20
17
Australia China India Japan Russia South Korea

© 2017 Ipsos 27
G8 Countries - Assessing the Current Economic Situation
Now thinking about our economic situation, how would you describe the current economic situation in [insert country]? Is it very good, somewhat good, somewhat bad or very bad?
Very Good / Somewhat Good
N/C
44%
55%
14%
74%
15%
32%32%
55%
0%
10%
20%
30%
40%
50%
60%
70%
80%
90%
Au
g 2
010
Oct
20
10
Dec
20
10
Feb
20
11
Ap
r 2
011
Jun
201
1
Au
g 2
011
Oct
20
11
Dec
20
11
Feb
20
12
Ap
r 2
012
Jun
201
2
Au
g 2
012
Oct
20
12
Dec
20
12
Feb
20
13
Ap
r 2
013
Jun
201
3
Au
g 2
013
Oct
201
3
Dec
20
13
Feb
20
14
Ap
r 2
014
Jun
201
4
Au
g 2
014
Oct
20
14
Dec
20
14
Feb
20
15
Ap
r 2
015
Jun
201
5
Au
g 2
015
Oct
20
15
Dec
20
15
Feb
20
16
Ap
r 2
016
Jun
201
6
Au
g 2
016
Oct
20
16
Dec
20
16
Feb
20
17
Great Britain Canada France Germany Italy Japan Russia United States

© 2017 Ipsos 28
BRIC Countries - Assessing the Current Economic Situation
Now thinking about our economic situation, how would you describe the current economic situation in [insert country]? Is it very good, somewhat good, somewhat bad or very bad?
Very Good / Somewhat Good
N/C
10%
32%
80%76%
0%
10%
20%
30%
40%
50%
60%
70%
80%
90%
100%
Au
g 2
010
Oct
201
0
Dec
20
10
Feb
20
11
Ap
r 2
011
Jun
201
1
Au
g 2
011
Oct
201
1
Dec
20
11
Feb
20
12
Ap
r 2
012
Jun
201
2
Au
g 2
012
Oct
201
2
Dec
20
12
Feb
20
13
Ap
r 2
013
Jun
201
3
Au
g 2
013
Oct
201
3
Dec
20
13
Feb
20
14
Ap
r 2
014
Jun
201
4
Au
g 2
014
Oct
201
4
Dec
20
14
Feb
20
15
Ap
r 2
015
Jun
201
5
Au
g 2
015
Oct
201
5
Dec
20
15
Feb
20
16
Ap
r 2
016
Jun
201
6
Au
g 2
016
Oct
201
6
Dec
20
16
Feb
20
17
Brazil Russia India China

© 2017 Ipsos 29
Middle East/African Countries - Assessing the Current Economic Situation
Now thinking about our economic situation, how would you describe the current economic situation in [insert country]? Is it very good, somewhat good, somewhat bad or very bad?
Very Good / Somewhat Good
2
29%
78%
18%
48%
0%
10%
20%
30%
40%
50%
60%
70%
80%
90%
100%
Au
g 2
010
Oct
201
0
Dec
20
10
Feb
20
11
Ap
r 2
011
Jun
201
1
Au
g 2
011
Oct
201
1
Dec
20
11
Feb
20
12
Ap
r 2
012
Jun
201
2
Au
g 2
012
Oct
201
2
Dec
20
12
Feb
20
13
Ap
r 2
013
Jun
201
3
Au
g 2
013
Oct
20
13
Dec
20
13
Feb
20
14
Ap
r 2
014
Jun
201
4
Au
g 2
014
Oct
201
4
Dec
20
14
Feb
20
15
Ap
r 2
015
Jun
201
5
Au
g 2
015
Oct
201
5
Dec
20
15
Feb
20
16
Ap
r 2
016
Jun
201
6
Au
g 2
016
Oct
201
6
Dec
20
16
Feb
20
17
Turkey Saudi Arabia South Africa Israel

© 2017 Ipsos 30
Detailed Tables B.6
Assessing The Economy...
…in Their Local Area

© 2017 Ipsos 31
Citizen Consumers Who Say The Economy In Their Local Area is Strong…
Rate the current state of the economy in your local area using a scale from 1 to 7, where 7 means a very strong economy today and 1 means a very weak economy
% Strong (Top 3: 5-6-7)30%
61%
57%
56%
55%
53%
52%
47%
38%
34%
31%
29%
25%
24%
23%
21%
19%
18%
16%
16%
15%
14%
14%
14%
10%
8%
7%
All Countries
India
China
Saudi Arabia
Israel
Germany
Sweden
US
Australia
Canada
Great Britain
Peru
Belgium
Poland
Russia
Turkey
Argentina
Hungary
Brazil
France
Spain
Italy
Japan
South Africa
Mexico
Serbia
South Korea

© 2017 Ipsos 32
Citizen Consumers Who Say The Economy In Their Local Area is Strong
Rate the current state of the economy in your local area using a scale from 1 to 7, where 7 means a very strong economy today and 1 means a very weak economy. 1
30%
0%
5%
10%
15%
20%
25%
30%
35%
40%
45%
50%
Mar
20
11
May
20
11
Jul 2
01
1
Sep
t 2
01
1
No
v 2
01
1
Jan
20
12
Mar
20
12
May
20
12
Jul 2
01
2
Sep
20
12
No
v 2
01
2
Jan
20
13
Mar
20
13
May
20
13
Jul 2
01
3
Sep
20
13
No
v 2
01
3
Jan
20
14
Mar
20
14
May
20
14
July
201
4
Sep
20
14
No
v 2
01
4
Jan
20
15
Mar
20
15
May
20
15
July
201
5
Sep
20
15
No
v 2
01
5
Jan
20
16
Mar
20
16
May
20
16
Jul 2
01
6
Sep
20
16
No
v 2
01
6
Jan
20
17
Total - % Strong (Top 3: 5-6-7)

© 2017 Ipsos 33
Citizen Consumers Who Say The Economy In Their Local Area is Strong
% Strong (Top 3 5-6-7)
Feb
’14
Mar
’14
Apr
’14
May
’14
Jun
’14
Jul
’14
Aug
‘14
Sep
‘14
Oct
‘14
Nov
‘14
Dec
‘14
Jan
‘15
Feb
‘15
Mar
’15
Apr
‘15
May
‘15
Jun
e
‘15
July
‘15
Aug
‘15
Sep
‘15
Oct
‘15
Nov
‘15
Dec
‘15
Jan
‘16
Feb
`16
Mar
`16
Apr
`16
May
`16
Jun
`16
Jul
`16
Aug
`16
Sep
`16
Oct
`16
Nov
`16
Dec
`16
Jan
`17
Feb
`17
Total 27% 27% 28% 29% 28% 28% 28% 29% 29% 29% 28% 29% 30% 31% 31% 31% 32% 30% 31% 29% 30% 30% 30% 30% 29% 29% 29% 30% 29% 30% 31% 30% 31% 30% 33% 31% 30%
Argentina 20% 17% 13% 15% 23% 18% 17% 15% 20% 21% 17% 17% 19% 22% 22% 21% 19% 21% 20% 20% 22% 22% 18% 20% 20% 14% 16% 18% 17% 18% 15% 14% 16% 15% 21% 17% 19%
Australia 39% 36% 40% 36% 35% 37% 39% 41% 42% 40% 38% 37% 35% 35% 34% 32% 34% 34% 35% 35% 33% 36% 42% 32% 38% 34% 33% 39% 32% 37% 36% 34% 38% 38% 39% 38% 38%
Belgium 21% 19% 24% 25% 22% 24% 24% 20% 21% 22% 14% 20% 23% 23% 20% 21% 25% 26% 26% 24% 22% 26% 19% 19% 24% 26% 19% 21% 16% 20% 24% 22% 20% 20% 23% 20% 25%
Brazil 23% 22% 31% 22% 30% 28% 25% 30% 30% 29% 26% 25% 22% 20% 18% 17% 14% 14% 16% 12% 14% 18% 14% 16% 13% 10% 13% 14% 12% 14% 16% 13% 15% 14% 17% 14% 16%
Canada 41% 44% 40% 42% 42% 49% 47% 46% 48% 47% 41% 41% 40% 37% 35% 40% 40% 40% 32% 35% 31% 34% 33% 32% 21% 24% 33% 33% 34% 37% 36% 39% 34% 36% 42% 36% 34%
China 52% 51% 52% 48% 47% 53% 53% 56% 51% 63% 60% 66% 53% 56% 63% 60% 60% 58% 53% 49% 54% 57% 58% 54% 50% 54% 55% 54% 55% 57% 58% 58% 59% 61% 62% 58% 57%
France 12% 12% 13% 13% 12% 11% 10% 12% 11% 12% 10% 12% 15% 11% 12% 14% 11% 13% 12% 12% 15% 15% 17% 20% 16% 15% 13% 16% 15% 14% 14% 15% 13% 17% 18% 16% 16%
Germany 51% 54% 52% 55% 55% 53% 52% 57% 47% 52% 55% 56% 53% 55% 53% 53% 55% 54% 58% 56% 52% 51% 49% 56% 53% 52% 54% 51% 51% 55% 51% 55% 53% 56% 59% 54% 53%
Great Britain 25% 26% 25% 28% 26% 29% 30% 29% 31% 33% 28% 33% 32% 38% 38% 41% 42% 34% 35% 36% 33% 29% 29% 33% 32% 33% 24% 30% 27% 27% 28% 30% 32% 32% 30% 30% 31%
Hungary 12% 13% 13% 13% 12% 13% 13% 12% 15% 14% 13% 12% 12% 13% 14% 14% 15% 13% 16% 13% 14% 15% 15% 16% 15% 17% 17% 15% 16% 14% 15% 17% 17% 15% 19% 18% 18%
India 37% 35% 38% 43% 47% 44% 47% 52% 53% 53% 51% 56% 50% 58% 53% 51% 56% 53% 52% 56% 53% 55% 50% 61% 52% 55% 57% 57% 54% 55% 55% 53% 62% 60% 62% 60% 61%
Israel 51% 49% 51% 56% 57% 59% 56% 59% 56% 53% 59% 50% 58% 53% 59% 55% 56% 50% 58% 53% 55% 62% 53% 56% 55%
Italy 9% 10% 11% 9% 9% 12% 8% 9% 11% 10% 8% 10% 11% 12% 11% 8% 12% 11% 11% 13% 13% 13% 14% 13% 13% 13% 13% 14% 16% 12% 12% 13% 12% 14% 15% 15% 14%
Japan 16% 13% 14% 14% 15% 15% 13% 11% 11% 10% 10% 12% 15% 17% 17% 16% 16% 18% 16% 15% 16% 12% 13% 11% 15% 12% 12% 11% 13% 11% 11% 12% 13% 12% 17% 13% 14%
Mexico 17% 19% 17% 16% 16% 21% 17% 16% 17% 18% 16% 17% 15% 14% 16% 15% 12% 22% 23% 10% 19% 24% 16% 20% 9% 18% 16% 24% 12% 10% 19% 17% 13% 11% 17% 10% 10%
Peru 25% 24% 20% 17% 22% 25% 28% 30% 32% 36% 35% 35% 42% 39% 29%
Poland 16% 21% 19% 23% 21% 19% 21% 23% 22% 24% 23% 19% 17% 22% 20% 22% 21% 18% 24% 21% 29% 20% 27% 26% 28% 19% 22% 25% 27% 26% 28% 28% 28% 23% 22% 26% 24%
Russia 22% 28% 31% 32% 25% 26% 33% 35% 30% 27% 26% 29% 22% 30% 27% 27% 32% 24% 29% 24% 25% 23% 24% 18% 24% 23% 20% 21% 17% 23% 20% 17% 19% 18% 24% 22% 23%
Saudi Arabia 58% 57% 64% 67% 59% 58% 62% 60% 62% 61% 61% 56% 68% 73% 72% 67% 71% 62% 65% 60% 65% 62% 66% 59% 61% 68% 59% 68% 64% 70% 62% 51% 57% 58% 56% 58% 56%
Serbia 8%
South Africa 17% 17% 15% 20% 16% 16% 22% 19% 18% 19% 15% 16% 18% 16% 16% 16% 17% 12% 19% 11% 16% 13% 12% 10% 10% 8% 9% 17% 11% 11% 11% 15% 16% 16% 13% 12% 14%
South Korea 21% 14% 21% 16% 13% 16% 14% 14% 12% 13% 9% 12% 13% 10% 11% 15% 13% 13% 13% 14% 13% 12% 11% 10% 13% 14% 12% 12% 10% 13% 15% 13% 14% 5% 15% 6% 7%
Spain 8% 6% 9% 11% 10% 10% 9% 9% 8% 9% 9% 10% 13% 13% 13% 12% 15% 12% 14% 15% 13% 15% 14% 15% 11% 13% 13% 12% 11% 14% 16% 12% 14% 14% 19% 15% 15%
Sweden 51% 60% 49% 51% 53% 56% 51% 59% 48% 47% 53% 54% 59% 53% 51% 51% 62% 54% 53% 58% 60% 50% 53% 59% 58% 57% 55% 57% 57% 51% 58% 48% 59% 54% 51% 56% 52%
Turkey 31% 30% 37% 35% 36% 33% 39% 33% 36% 35% 27% 30% 29% 38% 30% 29% 28% 27% 31% 23% 23% 33% 27% 39% 29% 33% 30% 31% 29% 29% 29% 36% 42% 33% 29% 30% 21%
United States
25% 25% 28% 27% 28% 29% 30% 30% 33% 35% 34% 40% 38% 40% 39% 38% 37% 35% 38% 35% 37% 36% 36% 36% 40% 40% 38% 40% 39% 39% 48% 43% 46% 39% 46% 43% 47%

© 2017 Ipsos 34
Countries Ranked and Marked By Change In Assessment From Last Month (Left Column):
Rate the current state of the economy in your local area using a scale from 1 to 7, where 7 means a very strong economy today and 1 means a very weak economy…
Green marks countries experiencing improvement;Blue marks countries with no change from last month; Red marks countries experiencing a decline;
30%
25%
47%
19%
16%
14%
31%
61%
14%
23%
7%
38%
16%
18%
10%
15%
57%
53%
55%
14%
34%
24%
56%
52%
21%
29%
All Countries (-1)
Belgium (5)
US (4)
Argentina (2)
Brazil (2)
South Africa (2)
Great Britain (1)
India (1)
Japan (1)
Russia (1)
South Korea (1)
Australia (N/C)
France (N/C)
Hungary (N/C)
Mexico (N/C)
Spain (N/C)
China (-1)
Germany (-1)
Israel (-1)
Italy (-1)
Canada (-2)
Poland (-2)
Saudi Arabia (-2)
Sweden (-4)
Turkey (-9)
Peru (-10)
% Very Good / Somewhat Good

© 2017 Ipsos 35
Countries Ranked by Net Improvement, Decline or No Change Compared to Last Month:
Rate the current state of the economy in your local area using a scale from 1 to 7, where 7 means a very strong economy today and 1 means a very weak economy…
-10%-9%
-4%-2%-2%-2%
-1%-1%-1%-1%
0%0%0%0%0%
1%1%1%1%1%
2%2%2%
4%5%
-15% -10% -5% 0% 5% 10% 15%
Peru (-10)
Turkey (-9)
Sweden (-4)
Canada (-2)
Poland (-2)
Saudi Arabia (-2)
China (-1)
Germany (-1)
Israel (-1)
Italy (-1)
Australia (N/C)
France (N/C)
Hungary (N/C)
Mexico (N/C)
Spain (N/C)
Great Britain (1)
India (1)
Japan (1)
Russia (1)
South Korea (1)
Argentina (2)
Brazil (2)
South Africa (2)
US (4)
Belgium (5)

© 2017 Ipsos 36
All Regions - Assess the Strength of Their Local Economy
Rate the current state of the economy in your local area using a scale from 1 to 7, where 7 means a very strong economy today and 1 means a very weak economy.
% Strong (Top 3 5-6-7)
41%
19%
28%
33%
30%
40%
37%
10%
15%
20%
25%
30%
35%
40%
45%
50%
55%
Jan
20
11
Mar
20
11
May
20
11
Jul 2
01
1
Sep
t 2
011
No
v 2
01
1
Jan
20
12
Mar
20
12
May
20
12
Jul 2
01
2
Sep
20
12
No
v 2
01
2
Jan
20
13
Mar
20
13
May
20
13
Jul 2
01
3
Sep
20
13
No
v 2
01
3
Jan
20
14
Mar
20
14
May
20
14
July
201
4
Sep
20
14
No
v 2
01
4
Jan
20
15
Mar
20
15
May
20
15
July
201
5
Sep
20
15
No
v 2
01
5
Jan
20
16
Mar
20
16
May
20
16
Jul 2
01
6
Sep
20
16
No
v 2
01
6
Jan
20
17
North America LATAM Europe APAC G-8 Countries BRIC Middle East/Africa

© 2017 Ipsos 37
North American Countries - Assess the Strength of Their Local Economy
Rate the current state of the economy in your local area using a scale from 1 to 7, where 7 means a very strong economy today and 1 means a very weak economy.
% Strong (Top 3 5-6-7)
1
47%
34%
10%
15%
20%
25%
30%
35%
40%
45%
50%
55%
Jan
20
11
Mar
20
11
May
20
11
Jul 2
01
1
Sep
t 2
011
No
v 2
011
Jan
20
12
Mar
20
12
May
20
12
Jul 2
01
2
Sep
20
12
No
v 2
012
Jan
20
13
Mar
20
13
May
20
13
Jul 2
01
3
Sep
20
13
No
v 2
013
Jan
20
14
Mar
20
14
May
20
14
Jul 2
01
4
Sep
20
14
No
v 2
014
Jan
20
15
Mar
20
15
May
20
15
July
201
5
Sep
20
15
No
v 2
015
Jan
20
16
Mar
20
16
May
20
16
Jul 2
01
6
Sep
20
16
No
v 2
016
Jan
20
17
United States Canada

© 2017 Ipsos 38
LATAM Countries - Assess the Strength of Their Local Economy
Rate the current state of the economy in your local area using a scale from 1 to 7, where 7 means a very strong economy today and 1 means a very weak economy.
% Strong (Top 3 5-6-7)
1
16%
19%
10%
29%
0%
10%
20%
30%
40%
50%
Jan
20
11
Mar
20
11
May
20
11
Jul 2
01
1
Sep
t 2
011
No
v 2
011
Jan
20
12
Mar
20
12
May
20
12
Jul 2
01
2
Sep
20
12
No
v 2
012
Jan
20
13
Mar
20
13
May
20
13
Jul 2
01
3
Sep
20
13
No
v 2
013
Jan
20
14
Mar
20
14
May
20
14
July
201
4
Sep
20
14
No
v 2
014
Jan
20
15
Mar
20
15
May
20
15
July
201
5
Sep
20
15
No
v 2
015
Jan
20
16
Mar
20
16
May
20
16
Jul 2
01
6
Sep
20
16
No
v 2
016
Jan
20
17
Brazil Argentina Mexico Peru

© 2017 Ipsos 39
European Countries - Assess the Strength of Their Local Economy
Rate the current state of the economy in your local area using a scale from 1 to 7, where 7 means a very strong economy today and 1 means a very weak economy.
% Strong (Top 3 5-6-7)
N/C
53%
16%15%
52%
31%
25%
14%
18%
8%
0%
10%
20%
30%
40%
50%
60%
70%
Jan
20
11
Mar
20
11
May
20
11
Jul 2
01
1
Sep
t 2
011
No
v 2
011
Jan
20
12
Mar
20
12
May
20
12
Jul 2
01
2
Sep
20
12
No
v 2
012
Jan
20
13
Mar
20
13
May
20
13
Jul 2
01
3
Sep
20
13
No
v 2
013
Jan
20
14
Mar
20
14
May
20
14
July
201
4
Sep
20
14
No
v 2
014
Jan
20
15
Mar
20
15
May
20
15
July
201
5
Sep
20
15
No
v 2
015
Jan
20
16
Mar
20
16
May
20
16
Jul 2
01
6
Sep
20
16
No
v 2
016
Jan
20
17
Germany France Spain Sweden Great Britain Belgium Italy Hungary Poland

© 2017 Ipsos 40
APAC Countries - Assess the Strength of Their Local Economy
Rate the current state of the economy in your local area using a scale from 1 to 7, where 7 means a very strong economy today and 1 means a very weak economy.
% Strong (Top 3 5-6-7)
N/C
38%
57%
61%
14%
23%
7%
0%
10%
20%
30%
40%
50%
60%
70%
Jan
20
11
Mar
20
11
May
20
11
Jul 2
01
1
Sep
t 2
011
No
v 2
011
Jan
20
12
Mar
20
12
May
20
12
Jul 2
01
2
Sep
20
12
No
v 2
012
Jan
20
13
Mar
20
13
May
20
13
Jul 2
01
3
Sep
20
13
No
v 2
013
Jan
20
14
Mar
20
14
May
20
14
Jul 2
01
4
Sep
20
14
No
v 2
014
Jan
20
15
Mar
20
15
May
20
15
July
201
5
Sep
20
15
No
v 2
015
Jan
20
16
Mar
20
16
May
20
16
Jul 2
01
6
Sep
20
16
No
v 2
016
Jan
20
17
Australia China India Japan Russia South Korea

© 2017 Ipsos 41
G8 Countries - Assess the Strength of Their Local Economy
Rate the current state of the economy in your local area using a scale from 1 to 7, where 7 means a very strong economy today and 1 means a very weak economy.
% Strong (Top 3 5-6-7)
N/C
31%34%
16%
53%
14%14%
23%
47%
0%
10%
20%
30%
40%
50%
60%
70%
Jan
20
11Fe
b 2
011
Mar
20
11A
pr
201
1M
ay 2
011
Jun
201
1Ju
l 20
11
Au
g 2
011
Sep
t 2
011
Oct
201
1N
ov
201
1D
ec 2
01
1Ja
n 2
012
Feb
20
12M
ar 2
012
Ap
r 2
012
May
20
12Ju
n 2
012
Jul 2
01
2A
ug
201
2Se
p 2
012
Oct
201
2N
ov
201
2D
ec 2
01
2Ja
n 2
013
Feb
20
13M
ar 2
013
Ap
r 2
013
May
20
13Ju
n 2
013
Jul 2
01
3A
ug
201
3Se
p 2
013
Oct
201
3N
ov
201
3D
ec 2
01
3Ja
n 2
014
Feb
20
14M
ar 2
014
Ap
r 2
014
May
20
14Ju
n 2
014
Jul 2
01
4A
ug
201
4Se
p 2
014
Oct
201
4N
ov
201
4D
ec 2
01
4Ja
n 2
015
Feb
20
15M
ar 2
015
Ap
r 2
015
May
20
15Ju
ne
201
5Ju
ly 2
015
Au
g 2
015
Sep
20
15O
ct 2
015
No
v 2
015
Dec
20
15
Jan
20
16Fe
b 2
016
Mar
20
16A
pr
201
6M
ay 2
016
Jun
201
6Ju
l 20
16
Au
g 2
016
Sep
20
16O
ct 2
016
No
v 2
016
Dec
20
16
Jan
20
17Fe
b 2
017
Great Britain Canada France Germany Italy Japan Russia United States

© 2017 Ipsos 42
BRIC Countries - Assess the Strength of Their Local Economy
Rate the current state of the economy in your local area using a scale from 1 to 7, where 7 means a very strong economy today and 1 means a very weak economy.
% Strong (Top 3 5-6-7)
2
16%
23%
61%
57%
0%
10%
20%
30%
40%
50%
60%
70%
Jan
20
11
Mar
20
11
May
20
11
Jul 2
01
1
Sep
20
11
No
v 2
011
Jan
20
12
Mar
20
12
May
20
12
Jul 2
01
2
Sep
20
12
No
v 2
012
Jan
20
13
Mar
20
13
May
20
13
Jul 2
01
3
Sep
20
13
No
v 2
013
Jan
20
14
Mar
20
14
May
20
14
Jul 2
01
4
Sep
20
14
No
v 2
014
Jan
20
15
Mar
20
15
May
20
15
July
201
5
Sep
20
15
No
v 2
015
Jan
20
16
Mar
20
16
May
20
16
Jul 2
01
6
Sep
20
16
No
v 2
016
Jan
20
17
Brazil Russia India China

© 2017 Ipsos 43
Middle East/African Countries - Assess the Strength of Their Local Economy
Rate the current state of the economy in your local area using a scale from 1 to 7, where 7 means a very strong economy today and 1 means a very weak economy.
% Strong (Top 3 5-6-7)
2
21%
56%
14%
55%
0%
10%
20%
30%
40%
50%
60%
70%
80%
Jan
20
11
Feb
20
11
Mar
20
11
Ap
r 2
011
May
20
11
Jun
201
1
Jul 2
01
1
Au
g 2
011
Sep
20
11
Oct
201
1
No
v 2
011
Dec
20
11
Jan
20
12
Feb
20
12
Mar
20
12
Ap
r 2
012
May
20
12
Jun
201
2
Jul 2
01
2
Au
g 2
012
Sep
20
12
Oct
201
2
No
v 2
012
Jan
20
13
Feb
20
13
Mar
20
13
Ap
r 2
013
May
20
13
Jun
201
3
Jul 2
01
3
Au
g 2
013
Sep
20
13
Oct
201
3
No
v 2
013
Dec
20
13
Jan
20
14
Feb
20
14
Mar
20
14
Ap
r 2
014
May
20
14
Jun
201
4
Jul 2
01
4
Au
g 2
014
Sep
20
14
Oct
201
4
No
v 2
014
Dec
20
14
Jan
20
15
Feb
20
15
Mar
20
15
Ap
r 2
015
May
20
15
Jun
e 2
015
July
201
5
Au
g 2
015
Sep
20
15
Oct
201
5
No
v 2
015
Dec
20
15
Jan
20
16
Feb
20
16
Mar
20
16
Ap
r 2
016
May
20
16
Jun
201
6
Jul 2
01
6
Au
g 2
016
Sep
20
16
Oct
201
6
No
v 2
016
Dec
20
16
Jan
20
17
Feb
20
17
Turkey Saudi Arabia South Africa Israel

© 2017 Ipsos 44
Detailed Tables B.7
Assessing the Strength of The Local Economy…
…Six Months From Now

© 2017 Ipsos 45
Citizen Consumers Who Say The Economy in the Local Area to be Stronger in The Next Six Months…
Looking ahead 6 months from now, do you expect the economy in your local area to be much stronger, somewhat stronger, about the same, somewhat weaker, or much weaker than it is now?
% Much Stronger / Somewhat Stronger
26%
67%
62%
52%
51%
46%
46%
42%
25%
22%
20%
19%
19%
17%
17%
16%
16%
16%
15%
13%
11%
11%
11%
10%
10%
8%
8%
All Countries
India
Brazil
China
Saudi Arabia
Argentina
Peru
US
Turkey
Russia
Mexico
South Africa
Spain
Germany
Israel
Australia
Canada
Poland
Great Britain
Hungary
Belgium
Japan
Serbia
South Korea
Sweden
France
Italy

© 2017 Ipsos 46
Citizen Consumers Who Say The Economy in the Local Area to be Stronger in The Next Six Months…
Looking ahead 6 months from now, do you expect the economy in your local area to be much stronger, somewhat stronger, about the same, somewhat weaker, or much weaker than it is now?
Global Total% Much Stronger / Somewhat Stronger
N/C
26%
0%
5%
10%
15%
20%
25%
30%
35%
40%
45%
50%
Mar
20
11
May
20
11
Jul 2
01
1
Sep
20
11
No
v 2
01
1
Jan
20
12
Mar
20
12
May
20
12
Jul 2
01
2
Sep
20
12
No
v 2
01
2
Jan
20
13
Mar
20
13
May
20
13
Jul 2
01
3
Sep
20
13
No
v 2
01
3
Jan
20
14
Mar
20
14
May
20
14
Jul 2
01
4
Sep
20
14
No
v 2
01
4
Jan
20
15
Mar
20
15
May
20
15
July
201
5
Sep
20
15
No
v 2
01
5
Jan
20
16
Mar
20
16
May
20
16
Jul 2
01
6
Sep
20
16
No
v 2
01
6
Jan
20
17

© 2017 Ipsos 47
Citizen Consumers Who Say The Economy in the Local Area to be Stronger in The Next Six Months…
% Much Stronger / Somewhat Stronger
Feb ’14
Mar’14
Apr’14
May
’14
Jun’14
Jul’14
Aug‘14
Sep‘14
Oct ‘14
Nov ‘14
Dec ‘14
Jan ‘15
Feb ‘15
Mar ’15
Apr ‘15
May
‘15
June
‘15
July ‘15
Aug ‘15
Sep ‘15
Oct ‘15
Nov ‘15
Dec ‘15
Jan ‘16
Feb`16
Mar`16
Apr`16
May
`16
Jun`16
Jul`16
Aug`16
Sep`16
Oct`16
Nov`16
Dec`16
Jan`17
Feb`17
Total 25% 24% 26% 25% 25% 25% 25% 25% 24% 25% 24% 25% 24% 24% 25% 25% 25% 24% 23% 22% 24% 24% 23% 26% 24% 24% 24% 25% 25% 26% 25% 26% 25% 25% 28% 26% 26%
Argentina 37% 33% 31% 31% 31% 33% 35% 31% 31% 34% 27% 33% 32% 32% 33% 34% 33% 36% 37% 35% 42% 61% 58% 65% 56% 49% 53% 59% 57% 54% 52% 53% 50% 50% 52% 45% 46%
Australia 16% 16% 17% 16% 13% 13% 15% 19% 18% 17% 18% 15% 17% 13% 18% 12% 17% 16% 15% 16% 20% 17% 19% 15% 14% 12% 14% 18% 17% 18% 16% 14% 14% 15% 15% 17% 16%
Belgium 11% 8% 8% 16% 9% 11% 10% 11% 10% 11% 6% 12% 10% 10% 11% 12% 14% 14% 12% 11% 9% 12% 9% 10% 10% 12% 7% 11% 8% 8% 12% 8% 6% 8% 9% 12% 11%
Brazil 64% 58% 58% 56% 57% 62% 57% 57% 64% 58% 57% 55% 51% 52% 53% 51% 51% 53% 52% 52% 52% 51% 53% 53% 53% 53% 54% 54% 55% 57% 56% 59% 59% 59% 54% 59% 62%
Canada 18% 18% 19% 18% 14% 18% 16% 18% 14% 18% 19% 18% 17% 16% 17% 19% 15% 16% 13% 16% 18% 24% 18% 15% 17% 16% 19% 20% 17% 18% 16% 17% 15% 16% 27% 18% 16%
China 40% 36% 41% 39% 37% 36% 42% 41% 37% 53% 46% 51% 44% 49% 50% 52% 52% 52% 46% 47% 44% 52% 49% 48% 41% 47% 49% 44% 49% 52% 50% 52% 53% 49% 56% 53% 52%
France 4% 5% 7% 6% 4% 3% 3% 2% 4% 4% 4% 4% 5% 5% 7% 5% 5% 5% 5% 4% 6% 5% 6% 11% 5% 5% 6% 8% 5% 6% 5% 5% 5% 6% 11% 8% 8%
Germany 19% 18% 21% 20% 17% 19% 16% 18% 14% 15% 14% 17% 21% 16% 16% 16% 15% 17% 16% 16% 17% 15% 16% 17% 15% 12% 15% 13% 16% 18% 13% 15% 13% 15% 26% 19% 17%
Great Britain 24% 21% 21% 21% 18% 19% 21% 20% 18% 19% 18% 19% 17% 21% 21% 22% 25% 19% 18% 19% 17% 14% 15% 16% 14% 12% 10% 12% 10% 12% 14% 12% 12% 12% 12% 13% 15%
Hungary 13% 12% 14% 14% 10% 11% 11% 13% 16% 11% 9% 8% 11% 10% 11% 8% 11% 10% 10% 8% 9% 12% 12% 11% 11% 11% 12% 9% 11% 12% 11% 13% 11% 9% 13% 15% 13%
India 48% 50% 53% 60% 70% 62% 61% 71% 69% 71% 65% 62% 64% 67% 59% 61% 66% 63% 56% 62% 63% 58% 56% 69% 57% 65% 63% 59% 61% 62% 60% 60% 62% 66% 67% 65% 67%
Israel 8% 15% 18% 13% 18% 11% 10% 14% 10% 11% 11% 15% 13% 13% 9% 14% 17% 12% 14% 18% 13% 13% 10% 9% 17%
Italy 13% 15% 13% 16% 15% 15% 12% 10% 10% 9% 8% 14% 12% 11% 13% 11% 12% 12% 11% 11% 14% 13% 14% 14% 12% 11% 11% 9% 12% 9% 8% 10% 9% 9% 10% 10% 8%
Japan 18% 15% 13% 14% 13% 15% 12% 12% 10% 10% 12% 13% 14% 15% 17% 14% 14% 15% 13% 12% 12% 11% 13% 11% 11% 9% 10% 7% 9% 9% 8% 10% 11% 9% 14% 9% 11%
Mexico 34% 29% 31% 31% 31% 34% 26% 30% 32% 31% 30% 33% 38% 25% 30% 28% 30% 30% 30% 22% 41% 32% 24% 32% 31% 31% 26% 27% 30% 27% 28% 32% 27% 22% 25% 20% 20%
Peru 47% 49% 53% 48% 47% 58% 58% 67% 69% 65% 60% 64% 58% 52% 46%
Poland 14% 14% 14% 17% 15% 17% 15% 15% 17% 18% 18% 13% 12% 15% 20% 16% 16% 17% 18% 16% 15% 14% 17% 13% 16% 14% 18% 16% 18% 18% 18% 15% 17% 14% 13% 18% 16%
Russia 17% 19% 26% 26% 24% 17% 34% 27% 27% 19% 20% 26% 18% 26% 25% 24% 33% 22% 30% 21% 20% 24% 21% 19% 31% 24% 21% 22% 20% 18% 16% 18% 17% 19% 21% 22% 22%
Saudi Arabia 49% 49% 59% 53% 56% 54% 55% 52% 48% 50% 51% 47% 60% 66% 58% 63% 66% 58% 58% 48% 55% 49% 53% 51% 51% 52% 51% 62% 58% 64% 52% 47% 48% 55% 55% 55% 51%
Serbia 11%
South Africa 13% 15% 11% 13% 15% 18% 16% 18% 15% 20% 16% 15% 16% 12% 13% 13% 11% 10% 13% 11% 12% 15% 11% 13% 13% 13% 15% 18% 16% 16% 16% 20% 22% 13% 16% 13% 19%
South Korea 15% 14% 18% 13% 10% 11% 12% 11% 10% 11% 9% 10% 11% 9% 12% 13% 11% 12% 9% 14% 11% 12% 10% 8% 10% 10% 10% 12% 10% 9% 10% 9% 9% 5% 17% 8% 10%
Spain 18% 19% 18% 19% 17% 19% 18% 20% 13% 17% 16% 20% 20% 20% 20% 20% 23% 21% 23% 22% 21% 21% 22% 23% 19% 19% 19% 14% 17% 16% 18% 15% 15% 18% 26% 20% 19%
Sweden 13% 15% 13% 20% 12% 12% 14% 13% 16% 16% 14% 11% 10% 11% 16% 13% 8% 16% 11% 11% 12% 8% 9% 9% 5% 10% 11% 14% 12% 16% 11% 15% 12% 11% 18% 20% 10%
Turkey 26% 26% 27% 25% 27% 24% 29% 22% 23% 25% 22% 26% 22% 22% 24% 24% 25% 20% 23% 23% 20% 32% 22% 35% 26% 24% 27% 24% 25% 26% 31% 32% 38% 32% 31% 31% 25%
United States
21% 19% 23% 23% 21% 22% 23% 21% 27% 26% 26% 29% 27% 29% 27% 28% 29% 24% 26% 24% 24% 25% 26% 23% 25% 26% 27% 29% 29% 31% 33% 31% 31% 25% 38% 38% 42%

© 2017 Ipsos 48
Countries Ranked and Marked By Change In Assessment From Last Month (Left Column):
Looking ahead six months from now, do you expect the economy in your local area to be much stronger, somewhat stronger, about the same, somewhat weaker, or much weaker than it is now?
Green marks countries experiencing improvement;Blue marks countries with no change from last month; Red marks countries experiencing a decline;
26%
17%
19%
42%
62%
15%
67%
11%
10%
46%
8%
20%
22%
16%
11%
52%
19%
16%
17%
13%
8%
16%
51%
46%
25%
10%
All Countries (N/C)
Israel (8)
South Africa (6)
US (4)
Brazil (3)
Great Britain (2)
India (2)
Japan (2)
South Korea (2)
Argentina (1)
France (N/C)
Mexico (N/C)
Russia (N/C)
Australia (-1)
Belgium (-1)
China (-1)
Spain (-1)
Canada (-2)
Germany (-2)
Hungary (-2)
Italy (-2)
Poland (-2)
Saudi Arabia (-4)
Peru (-6)
Turkey (-6)
Sweden (-10)
% Very Good / Somewhat Good

© 2017 Ipsos 49
Countries Ranked by Net Improvement, Decline or No Change Compared to Last Month:
Looking ahead six months from now, do you expect the economy in your local area to be much stronger, somewhat stronger, about the same, somewhat weaker, or much weaker than it is now?
-10%-6%-6%
-4%-2%-2%-2%-2%-2%
-1%-1%-1%-1%
0%0%0%
1%2%2%2%2%
3%4%
6%8%
-15% -10% -5% 0% 5% 10% 15%
Sweden (-10)
Peru (-6)
Turkey (-6)
Saudi Arabia (-4)
Canada (-2)
Germany (-2)
Hungary (-2)
Italy (-2)
Poland (-2)
Australia (-1)
Belgium (-1)
China (-1)
Spain (-1)
France (N/C)
Mexico (N/C)
Russia (N/C)
Argentina (1)
Great Britain (2)
India (2)
Japan (2)
South Korea (2)
Brazil (3)
US (4)
South Africa (6)
Israel (8)

© 2017 Ipsos 50
All Regions - Citizen Consumers Who Say The Economy in the Local Area to be Stronger in The Next Six Months
Looking ahead 6 months from now, do you expect the economy in your local area to be much stronger, somewhat stronger, about the same, somewhat weaker, or much weaker than it is now?
% Much Stronger / Somewhat Stronger
29%
43%
13%
30%
26%
51%
28%
0%
10%
20%
30%
40%
50%
60%
Jan
20
11
Mar
20
11
May
20
11
Jul 2
01
1
Sep
t 2
011
No
v 2
011
Jan
20
12
Mar
20
12
May
20
12
Jul 2
01
2
Sep
20
12
No
v 2
012
Jan
20
13
Mar
20
13
May
20
13
Jul 2
01
3
Sep
20
13
No
v 2
013
Jan
20
14
Mar
20
14
May
20
14
Jul 2
01
4
Sep
20
14
No
v 2
014
Jan
20
15
Mar
20
15
May
20
15
July
201
5
Sep
20
15
No
v 2
015
Jan
20
16
Mar
20
16
May
20
16
Jul 2
01
6
Sep
20
16
No
v 2
016
Jan
20
17
North America LATAM Europe APAC G-8 Countries BRIC Middle East/Africa

© 2017 Ipsos 51
North American Countries - Citizen Consumers Who Say The Economy in the Local Area to be Stronger in The Next Six Months
Looking ahead 6 months from now, do you expect the economy in your local area to be much stronger, somewhat stronger, about the same, somewhat weaker, or much weaker than it is now?
% Much Stronger / Somewhat Stronger
1
42%
16%
10%
15%
20%
25%
30%
35%
40%
45%
50%
Jan
20
11
Mar
20
11
May
20
11
Jul 2
01
1
Sep
t 2
011
No
v 2
011
Jan
20
12
Mar
20
12
May
20
12
Jul 2
01
2
Sep
20
12
No
v 2
012
Jan
20
13
Mar
20
13
May
20
13
Jul 2
01
3
Sep
20
13
No
v 2
013
Jan
20
14
Mar
20
14
May
20
14
Jul 2
01
4
Sep
20
14
No
v 2
014
Jan
20
15
Mar
20
15
May
20
15
July
201
5
Sep
20
15
No
v 2
015
Jan
20
16
Mar
20
16
May
20
16
Jul 2
01
6
Sep
20
16
No
v 2
016
Jan
20
17
United States Canada

© 2017 Ipsos 52
LATAM Countries - Citizen Consumers Who Say The Economy in the Local Area to be Stronger in The Next Six Months
Looking ahead 6 months from now, do you expect the economy in your local area to be much stronger, somewhat stronger, about the same, somewhat weaker, or much weaker than it is now?
% Much Stronger / Somewhat Stronger
1
62%
46%
20%
46%
0%
10%
20%
30%
40%
50%
60%
70%
80%
Jan
20
11
Mar
20
11
May
20
11
Jul 2
01
1
Sep
t 2
011
No
v 2
011
Jan
20
12
Mar
20
12
May
20
12
Jul 2
01
2
Sep
20
12
No
v 2
012
Jan
20
13
Mar
20
13
May
20
13
Jul 2
01
3
Sep
20
13
No
v 2
013
Jan
20
14
Mar
20
14
May
20
14
Jul 2
01
4
Sep
20
14
No
v 2
014
Jan
20
15
Mar
20
15
May
20
15
July
201
5
Sep
20
15
No
v 2
015
Jan
20
16
Mar
20
16
May
20
16
Jul 2
01
6
Sep
20
16
No
v 2
016
Jan
20
17
Brazil Argentina Mexico Peru

© 2017 Ipsos 53
APAC Countries - Citizen Consumers Who Say The Economy in the Local Area to be Stronger in The Next Six Months
Looking ahead 6 months from now, do you expect the economy in your local area to be much stronger, somewhat stronger, about the same, somewhat weaker, or much weaker than it is now?
% Much Stronger / Somewhat Stronger
1
16%
52%
67%
11%
22%
10%
0%
10%
20%
30%
40%
50%
60%
70%
80%
Jan
20
11
Mar
20
11
May
20
11
Jul 2
01
1
Sep
20
11
No
v 2
011
Jan
20
12
Mar
20
12
May
20
12
Jul 2
01
2
Sep
20
12
No
v 2
012
Jan
20
13
Mar
20
13
May
20
13
Jul 2
01
3
Sep
20
13
No
v 2
013
Jan
20
14
Mar
20
14
May
20
14
Jul 2
01
4
Sep
20
14
No
v 2
014
Jan
20
15
Mar
20
15
May
20
15
July
201
5
Sep
20
15
No
v 2
015
Jan
20
16
Mar
20
16
May
20
16
Jul 2
01
6
Sep
20
16
No
v 2
016
Jan
20
17
Australia China India Japan Russia South Korea

© 2017 Ipsos 54
European Countries - Citizen Consumers Who Say The Economy in the Local Area to be Stronger in The Next Six Months
Looking ahead 6 months from now, do you expect the economy in your local area to be much stronger, somewhat stronger, about the same, somewhat weaker, or much weaker than it is now?
% Much Stronger / Somewhat Stronger
2
17%
8%
19%
10%
15%
11%
8%
13%
11%
0%
5%
10%
15%
20%
25%
30%
35%
Jan
20
11
Mar
20
11
May
20
11
Jul 2
01
1
Sep
t 2
011
No
v 2
01
1
Jan
20
12
Mar
20
12
May
20
12
Jul 2
01
2
Sep
20
12
No
v 2
01
2
Jan
20
13
Mar
20
13
May
20
13
Jul 2
01
3
Sep
20
13
No
v 2
01
3
Jan
20
14
Mar
20
14
May
20
14
Jul 2
01
4
Sep
20
14
No
v 2
01
4
Jan
20
15
Mar
20
15
May
20
15
July
201
5
Sep
20
15
No
v 2
01
5
Jan
20
16
Mar
20
16
May
20
16
Jul 2
01
6
Sep
20
16
No
v 2
01
6
Jan
20
17
Germany France Spain Sweden Great Britain Belgium Italy Hungary Serbia Poland

© 2017 Ipsos 55
BRIC Countries - Citizen Consumers Who Say The Economy in the Local Area to be Stronger in The Next Six Months
Looking ahead 6 months from now, do you expect the economy in your local area to be much stronger, somewhat stronger, about the same, somewhat weaker, or much weaker than it is now?
% Much Stronger / Somewhat Stronger
1
62%
22%
67%
52%
0%
10%
20%
30%
40%
50%
60%
70%
80%
Jan
20
11
Mar
20
11
May
20
11
Jul 2
01
1
Sep
20
11
No
v 2
011
Jan
20
12
Mar
20
12
May
20
12
Jul 2
01
2
Sep
20
12
No
v 2
012
Jan
20
13
Mar
20
13
May
20
13
Jul 2
01
3
Sep
20
13
No
v 2
013
Jan
20
14
Mar
20
14
May
20
14
Jul 2
01
4
Sep
20
14
No
v 2
014
Jan
20
15
Mar
20
15
May
20
15
July
201
5
Sep
20
15
No
v 2
015
Jan
20
16
Mar
20
16
May
20
16
Jul 2
01
6
Sep
20
16
No
v 2
016
Jan
20
17
Brazil Russia India China

© 2017 Ipsos 56
G8 Countries - Citizen Consumers Who Say The Economy in the Local Area to be Stronger in The Next Six Months
Looking ahead 6 months from now, do you expect the economy in your local area to be much stronger, somewhat stronger, about the same, somewhat weaker, or much weaker than it is now?
% Much Stronger / Somewhat Stronger
1
15%16%
8%
17%
11%
8%
22%
0%
5%
10%
15%
20%
25%
30%
35%
40%
Jan
20
11
Mar
20
11
May
20
11
Jul 2
01
1
Sep
t 2
011
No
v 2
011
Jan
20
12
Mar
20
12
May
20
12
Jul 2
01
2
Sep
20
12
No
v 2
012
Jan
20
13
Mar
20
13
May
20
13
Jul 2
01
3
Sep
20
13
No
v 2
013
Jan
20
14
Mar
20
14
May
20
14
Jul 2
01
4
Sep
20
14
No
v 2
014
Jan
20
15
Mar
20
15
May
20
15
July
201
5
Sep
20
15
No
v 2
015
Jan
20
16
Mar
20
16
May
20
16
Jul 2
01
6
Sep
20
16
No
v 2
016
Jan
20
17
Great Britain Canada France Germany Japan Italy Russia United States

© 2017 Ipsos 57
Middle East/African Countries - Citizen Consumers Who Say The Economy in the Local Area to be Stronger in The Next Six Months
Looking ahead 6 months from now, do you expect the economy in your local area to be much stronger, somewhat stronger, about the same, somewhat weaker, or much weaker than it is now?
% Much Stronger / Somewhat Stronger
25%
51%
19%17%
0%
10%
20%
30%
40%
50%
60%
70%
Jan
20
11
Mar
20
11
May
20
11
Jul 2
01
1
Sep
t 2
011
No
v 2
011
Jan
20
12
Mar
20
12
May
20
12
Jul 2
01
2
Sep
20
12
No
v 2
012
Jan
20
13
Mar
20
13
May
20
13
Jul 2
01
3
Sep
20
13
No
v 2
013
Jan
20
14
Mar
20
14
May
20
14
Jul 2
01
4
Sep
20
14
No
v 2
014
Jan
20
15
Mar
20
15
May
20
15
July
201
5
Sep
20
15
No
v 2
015
Jan
20
16
Mar
20
16
May
20
16
Jul 2
01
6
Sep
20
16
No
v 2
016
Jan
20
17
Turkey Saudi Arabia South Africa Israel
1

© 2017 Ipsos 58
About Ipsos
• Ipsos is an independent market research company controlled and managed by research professionals. Founded in France in 1975, Ipsos has grown into a worldwide research group with a strong presence in all key markets. Ipsos ranks third in the global research industry.
• With offices in 87 countries, Ipsos delivers insightful expertise across five research specializations: brand, advertising and media, customer loyalty, marketing, public affairs research, and survey management.
• Ipsos researchers assess market potential and interpret market trends. They develop and build brands. They help clients build long-term relationships with their customers. They test advertising and study audience responses to various media and they measure public opinion around the globe.
• Ipsos has been listed on the Paris Stock Exchange since 1999 and generated global revenues €1,669.5 ($2,218.4 million) in 2014.
• Visit www.ipsos.com to learn more about Ipsos’ offerings and capabilities.

© 2017 Ipsos 59
For information about this and other Global @dvisor products contact http://www.ipsosglobaladvisor.com/ or:
• Julia ClarkSenior Vice PresidentIpsos Public Affairs +1 (312) 526-4919 [email protected]
• Nik SamoylovSenior Research ManagerIpsos Public Affairs +1 (416) 572-4471 [email protected]
• The Ipsos Global @dvisor Syndicate Study is a monthly, online survey of consumer citizens in 24 countries and produces syndicated reports and studies specifically tailored to the needs of corporations, advertising and PR agencies, and governments. For information contact:
• Chris DeeneySenior Vice President and Managing DirectorIpsos Public Affairs +1 (312) [email protected]
• Visit www.ipsos.com for information about all of our products and services.Copyright Ipsos 2010. All rights reserved. The contents of this publication constitute the sole and exclusive property of Ipsos.