Embed Size (px)
Citation preview

The economic value of informal care in Australia in 2015
Carers Australia
June 2015

The economic value of informal care in 2015
Liability limited by a scheme approved under Professional Standards Legislation.
Deloitte refers to one or more of Deloitte Touche Tohmatsu Limited, a UK private company limited by guarantee, and its network of member firms, each of which is a legally separate and independent entity. Please see www.deloitte.com/au/about for a detailed description of the legal structure of Deloitte Touche Tohmatsu Limited and its member firms.
© 2015 Deloitte Access Economics Pty Ltd
Contents Glossary ..................................................................................................................................... i
Executive summary ................................................................................................................... ii
1 Introduction .................................................................................................................... 1
What is an informal carer .................................................................................................. 1 1.1
Demographic profile of informal carers ............................................................................. 2 1.2
2 Replacement cost valuation .......................................................................................... 13
Methodology and data .................................................................................................... 13 2.1
Results ............................................................................................................................ 15 2.2
Discussion ....................................................................................................................... 15 2.3
Sensitivity analysis .......................................................................................................... 18 2.4
3 Demand and supply forecasts ....................................................................................... 20
Methodology .................................................................................................................. 20 3.1
Results ............................................................................................................................ 21 3.2
Scenario analysis ............................................................................................................. 22 3.3
Propensity to care ........................................................................................................... 23 3.4
Policy implications .......................................................................................................... 28 3.5
References .............................................................................................................................. 31
Limitation of our work ............................................................................................................ 35
Charts Chart 1.1 : Rates of informal care provision by age and gender, Australia (2012) ....................... 3
Chart 1.2 : Number of informal carers by age and gender, Australia (2015) ............................... 4
Chart 1.3 : Number of informal carers, by type of carer, Australia (2005, 2010 and 2015) ......... 5
Chart 1.4 : Number of primary carers by age and gender, Australia 2015 .................................. 6
Chart 1.5 : Average number of hours spent caring each week by carer status............................ 7
Chart 1.6 : Geographic location of carers, Australia ................................................................... 7
Chart 1.7 : Carer status by weekly cash income deciles (15-64 years) ........................................ 8
Chart 1.8 : Rates of full-time employment by age group, carer status, Australia ........................ 9
Chart 1.9 : Rates of part-time employment by age group, carer status, Australia ..................... 10
Chart 1.10 : Weekly hours of care, primary carers, main care recipient’s disability status ........ 11
Chart 1.11 : Primary carers – relationship to main recipient of care......................................... 12
Chart 3.1 : Demand and supply of carers ................................................................................. 21

Chart 3.2 : Demand and supply growth rates........................................................................... 22
Chart 3.3 : Growth in carer gaps under different scenarios ...................................................... 23
Chart 3.4 : Average propensity to care by age group, males .................................................... 24
Chart 3.5 : Average propensity to care by age group, females ................................................. 24
Chart 3.6 : Average propensity to care by age group, persons ................................................. 25
Tables Table 1.1 : Rates of informal care provision by aged and gender, Australia (2012) ..................... 3
Table 1.2 : Number of informal carers by age and gender, Australia (2015) ............................... 4
Table 1.3 : Number of informal carers by age, gender and type, Australia (2015) ...................... 6
Table 1.4 : Total weekly cash income by deciles ........................................................................ 9
Table 2.1 : Average hours of care provided per week by carer status ...................................... 13
Table 2.2 : Replacement valuation of informal care, unit cost components ............................. 14
Table 2.3 : Replacement cost of informal care, Australia 2015 ................................................. 15
Table 2.4 : Domestic studies of the value of informal care ....................................................... 16
Table 2.5 : Relative value of informal care ............................................................................... 17
Table 2.6 : International studies of the value of informal care ................................................. 18
Table 2.7 : Impacts of wage change on replacement value of informal care ............................ 19
The economic value of informal care in 2015
Deloitte Access Economics i Commercial-in-confidence
Glossary
ABS Australian Bureau of Statistics
ADL activities of daily living
AIFS Australian Institute of Family Studies
AIHW Australian Institute of Health and Welfare
AWE average weekly earnings
CURF Confidentialised Unit Record File
GDP gross domestic product
IADL instrumental activities of daily living
INSEE National Institute of Statistics and Economic Studies (France)
SDAC Survey of Disability, Ageing and Carers
US United States

ii Commercial-in-Confidence
Deloitte Access Economics
Executive summary In this report, Deloitte Access Economics estimates the total value of informal care being provided in Australia today and examines the implications of demographic trends and projections for informal care in the future. Informal unpaid carers provide care to others in need of assistance or support and are usually friends or family of the person in need. They make a significant contribution to the care and wellbeing of people with a disability, mental illness, chronic condition, terminal illness and the frail aged.
Section 1 identifies who Australia’s carers are and provides a demographic profile of carers and their characteristics.
In 2015, over 1 in 8 Australians (2.86 million people) are estimated to be providing informal care.
825,000 informal carers are ‘primary carers’, people who provide the majority of the recipient’s care1.
In absolute terms, there are approximately 10,000 fewer carers in 2015 than there were in 2010 due to a declining propensity to care. The composition of carer types among carers has also changed. There are 285,000 more primary carers in 2015 than there were in 2010 and 294,000 fewer non-primary carers. The majority of informal carers are female and predominantly fall within the age range of 25-64 years. The number of carers by gender and age group is shown in Chart i.
Chart i: Number of informal carers by age and gender, Australia (2015)
Source: Deloitte Access Economics calculations.
1 A primary carer is the person who provides the most informal assistance to a person with a disability, specifically related to one or more of the core activities of mobility, self-care and communication (ABS, 2014b).
0
50
100
150
200
250
300
350
400
< 15 15-24 25-34 35-44 45-54 55-64 65-74 75+
'000s
Male Female

iii Commercial-in-Confidence
Deloitte Access Economics
Section 2 provides an estimate of the replacement cost value of the total amount of informal care provided in Australia in 2015 and discusses this value in the context of existing literature on other domestic and international studies.
The replacement cost valuation refers to the total resources that would need to be diverted each year from the formal economy to replace the services provided by informal carers, were their services no longer available.
Informal carers provided an estimated 1.9 billion hours of care in 2015. This is equivalent to each carer providing 673 hours per year or 13 hours per week.
If all hours of informal care provided in 2015 are replaced with services purchased from formal care providers, the replacement value of informal care would be $60.3 billion (equivalent to 3.8% of gross domestic product and 60% of the health and social work industry).
Section 3 forecasts the supply and demand for informal carers over the next ten years and includes qualitative analysis of the issues raised by this analysis, including changes in the propensity to care and policy implications.
In the next ten years, the demand for informal care is set to significantly outstrip its supply. As Chart ii shows, the demand for informal carers (represented by the number of people with a profound or severe disability over 65 who are not living in cared accommodation) is growing at a faster rate than the supply of informal carers, with the ‘carer ratio’2 falling substantially from 2015 to 2025. Note that this ratio does not capture growth in disability and the number of people with psycho-social conditions who require the support of carers.
Chart ii: Demand and supply of carers
Source: Deloitte Access Economics calculations.
The growing gap between demand and supply was tested under three scenario analyses3:
An overall decline in the propensity to care, represented by a 20% across-the-board decrease in carer rates, increased the base case deficit by 14.9% in 2025.
A decline in the propensity of women to reduce paid employment in order to provide care, represented by a 20% decrease in the proportion of women aged 25-64 providing care, increased the base case deficit by 2.2% in 2025.
2 The carer ratio is calculated as the supply of carers divided by the demand for carers.
3 Assumptions have been derived from a scenario analysis undertaken by the AIHW (Jenkins et al, 2003).
38
40
42
44
46
48
50
-
100,000
200,000
300,000
400,000
500,000
600,000
700,000
800,000
2015 2016 2017 2018 2019 2020 2021 2022 2023 2024 2025
Ca
rer
rati
o
Pe
op
le
Supply of carers Demand for carers Carer ratio

iv Commercial-in-Confidence
Deloitte Access Economics
An increase in the availability of carers due to converging male and female life expectancy, represented by a 20% increase in carer rates in the 65+ age group, reduced the base case deficit by 0.7% in 2025.
The propensity to provide care has been observed to decline across almost all carers since 2003, regardless of gender, except for female carers over the age of 55. This may be attributed in part to differing life expectancies between men and women and higher rates of disability among older men.
Propensity to care is likely to be influenced by many factors in the future, such as:
current demographic trends in disproportionate population ageing;
changes to Australia’s societal structure such as smaller family sizes, higher divorce rates, rising childlessness and the increase of single-person households, which may reduce the pool of informal carers;
rising rates of female participation in the labour force, resulting in lower propensity to care among female carers;
rapidly rising rates of participation among older workers, resulting in lower propensity to care among older carers;
the increased availability of government-supported care in the home environment;
the changing average age of entry to residential aged care facilities;
changes in intergenerational attitudes and perceptions of caregiving, which may reduce willingness to care for friends and family members; and
the growing duration and complexity of caregiving as a result of extended life expectancy; which may place greater pressure on informal carers in the future.
The widening carer gap has significant policy implications for Australia’s future with the need to investigate possible solutions to help boost the propensity to supply care and to soften the demand for informal care where possible. There is a strong case to consider the following suggestions as part of a concerted policy effort to reduce the carer deficit:
greater flexibility in working arrangements to accommodate workers’ caring responsibilities and employment preferences;
improvements in access to, and awareness of, carer support services such as respite care to encourage service utilisation and alleviate the impact of caring;
further investigation of carer perceptions of the costs and quality of formal care to encourage an optimal mix of formal and informal care provision; and
adapting the formal care sector to meet the needs of older Australians from diverse backgrounds to improve the flexibility of care options.
As demonstrated in this report, informal carers provide a significant contribution to the health and wellbeing of Australians in need of support and assistance, the magnitude of which only underscores the impending policy challenges faced by Australia. Greater recognition and awareness of carer demographics and preferences will ensure that approaches to social policy are responsive to the needs of carers and care recipients alike, resulting in improvements in welfare for Australia in the future.
Deloitte Access Economics

1 Commercial-in-Confidence
Deloitte Access Economics
1 Introduction Deloitte Access Economics was commissioned by Carers Australia to estimate the economic value of Australia’s informal carers, and forecast the supply and demand of informal carers in Australia over ten years. This work updates previous work undertaken by Access Economics for Carers Australia which estimated the economic value of informal carers in Australia in 2005 and 20104.
Section 1 of this report identifies Australia’s informal carers and provides a demographic profile of carers and their characteristics.
Section 2 uses the replacement cost method to estimate the economic value of care provided by informal carers, and discusses these results in the context of other domestic and international studies.
Section 3 contains forecasts of the future supply of and demand for informal care, discusses the policy implications and challenges arising from the results of the forecasts, and analyses historical movements in the propensity to care.
What is an informal carer 1.1
Carers are people who provide care to others in need of assistance or support. An informal carer provides this service free of charge and does so outside of the formal care sector. An informal carer will typically be a family member or friend of the person receiving the care, and usually lives in the same household as the recipient of care. As such, many people receive informal care from more than one person. The person who provides the majority of informal care is known as the primary carer.
Although informal care can be defined to include parenting and other forms of unpaid child care, this report focuses solely on unpaid care provided to people with a disability, mental illness, chronic condition, terminal illness and the frail aged.
The most comprehensive profile of people receiving care and their carers in Australia is provided by the Survey of Disability, Ageing and Carers (SDAC). This national survey, conducted by the Australian Bureau of Statistics (ABS), covers people living in private dwellings in urban or rural areas. However, also within its scope are people living in non-private dwellings including care accommodation (such as nursing homes, hostels and other facilities). The most recent survey was conducted in 2012. As such, this report relies on data from the 2012 SDAC survey, combined with more recent data from other sources to generate estimates for 2015.
Where necessary, Confidentialised Unit Record File (CURF) data has been used. CURFs are data sets that contain detailed information for each individual response to ABS surveys or
4 The 2010 report is available online at http://carersaustralia.com.au/storage/Economic-Value-Informal-Care-Oct-2010.pdf.

2 Commercial-in-Confidence
Deloitte Access Economics
censuses, which have had specific identifying information about respondents made confidential for their privacy.
Demographic profile of informal carers 1.2
The demographic profile of informal carers includes data on:
number, age, gender, carer status (primary vs. non-primary) and amount of care provided (Section 1.2.1);
geographic location, income and employment status (Section 1.2.2); and
care needs of the recipients of care (Section 1.2.3).
The methodology, data and results of the demographic profiling are presented in the following sections.
1.2.1 Number, age, gender carer status and amount of care
This section of the report draws on ABS data concerning the rate of informal care provision (ABS, 2013b), and up-to-date population estimates (ABS, 2013a)5. The rate of informal care provision is defined as the proportion of that population sub-group who provide some form of informal care. Data on the propensity to care has been most recently published for 2012 by the ABS, while population projections are available for 2015. These two data sources were utilised to generate estimates of the number, age and gender of informal carers in Australia in 2015.
In 2012, there were estimated to be 2.7 million carers in Australia providing informal care to people requiring assistance with age or disability, which is equivalent to 11.9% of all Australians at that time (ABS, 2013b). The breakdown of this proportion by age and gender is shown in Chart 1.1, with the underlying data provided in Table 1.1.
5 The most recent estimated resident population data provided by the ABS is for 2014. As such, projections for 2015 have been used.

3 Commercial-in-Confidence
Deloitte Access Economics
Chart 1.1: Rates of informal care provision by age and gender, Australia (2012)
Source: ABS (2013b)
Table 1.1: Rates of informal care provision by aged and gender, Australia (2012)
Male (%) Female
Age Primary Non-primary
All carers Primary Non-primary
All carers
< 15 0.0 1.5 1.5 0.0 1.9 1.9
15-24 0.6 6.6 7.1 0.9 6.6 7.7
25-34 1.0 5.8 6.8 3.6 5.3 9.0
35-44 1.5 8.7 10.2 6.9 9.3 16.3
45-54 2.8 11.8 14.6 7.6 13.9 21.4
55-64 4.7 14.1 18.8 9.6 15.4 24.8
65-75 5.5 14.1 19.4 8.1 12.3 20.4
75+ 6.1 15.8 21.7 5.1 8.5 13.9
Source: ABS (2013b).
The data shows that the rate of informal care provision is not uniformly distributed among the population. Proportionally, older age groups are more likely to provide care than younger people. For men, the likelihood of providing care increases steadily with age. Women also experience an increased likelihood of providing care up to the age of 65, when the propensity to care begins to decrease.
This change in the relative propensity to care among males and females over the age of 65 may be attributed in part to lower male life expectancy. The earlier loss of male partners means that older females are more likely to be widowed while older males are more likely to still be married. In older age groups care is predominantly provided to a partner with 81% of all primary carers aged 65 and over caring for a spouse or partner, which makes surviving older men more likely to be carers than older women (ABS, 2013b). Another
0
5
10
15
20
25
< 15 15-24 25-34 35-44 45-54 55-64 65-74 75+
%
Male Female
4 Commercial-in-Confidence
Deloitte Access Economics
explanation might be that older men are healthier than older women, with the rates of severe or profound disability lower for men than they are for women over the age of 65 (ABS, 2013b). However, this may be reflective of the difference in life expectancy.
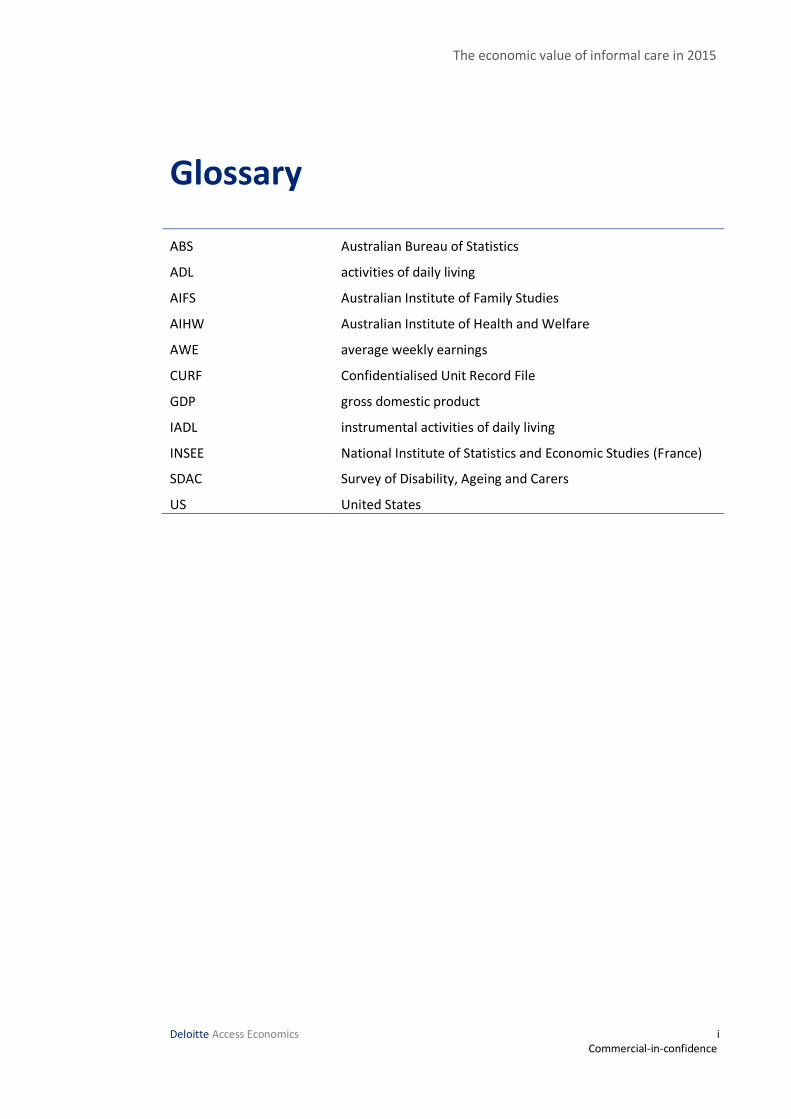
This report uses the ABS Series B population projections (ABS, 2013a) to estimate the number of informal carers in 2015, as these are mid-level population projections. These projections are based on data from the 2011 Census of Population and Housing, and are adjusted for factors such as births, deaths, and net migration into Australia. Combining these population projections with the data on the rate of informal care provision, there are estimated to be 2.86 million informal carers in Australia in 2015. The total represents a 6.3% net increase in the number of informal carers since 2012, due to population change. Chart 1.2 and Table 1.2 show the estimated number of carers in 2015 by age and gender.
Chart 1.2: Number of informal carers by age and gender, Australia (2015)
Source: Deloitte Access Economics calculations.
Table 1.2: Number of informal carers by age and gender, Australia (2015)
Age All carers (‘000)
Males Females Total
< 15 35.8 42.2 77.9
15-24 114.3 115.5 229.8
25-34 120.3 156.7 277.0
35-44 166.6 266.6 433.1
45-54 227.7 340.3 568.0
55-64 254.9 347.0 601.9
65-74 193.9 207.6 401.5
75+ 147.0 120.3 267.4
Total 1,260.5 1,596.2 2,856.7
Source: Deloitte Access Economics calculations. Note: totals may not add due to rounding.
0
50
100
150
200
250
300
350
400
< 15 15-24 25-34 35-44 45-54 55-64 65-74 75+
'000s
Male Female
5 Commercial-in-Confidence
Deloitte Access Economics
The data shows that approximately one in eight Australians is an informal carer. The majority of carers are female (56%) and most carers are aged between 35 and 54 years.
There are also an estimated 78,000 informal carers under the age of 15, equating to 1.7% of all Australian children aged under 15.
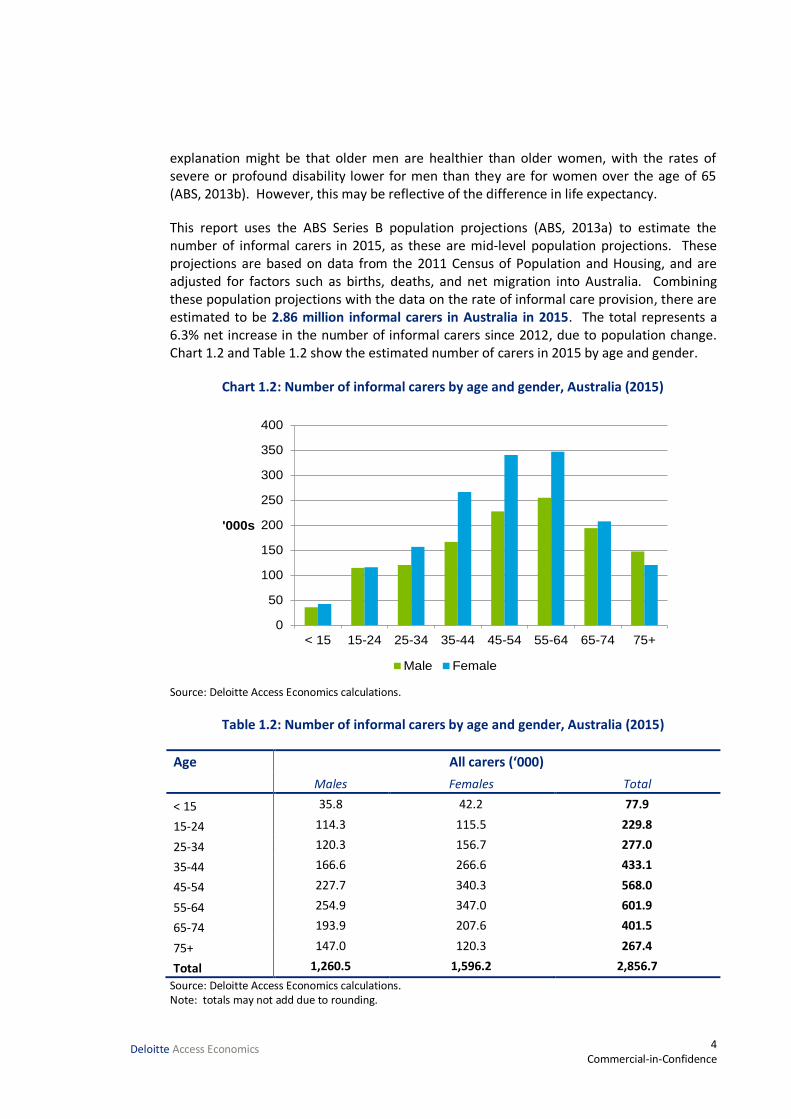
The total number of informal carers estimated for 2015 represents an overall increase from the 2005 total of 2.64 million but a slight decrease from the 2010 estimate of 2.87 million (Access Economics, 2005 and 2010). The fall in numbers consists largely of a decrease in the number of male carers. While the number of female carers has increased since 2005, the number of male carers has decreased from 1.32 million in 2010 to 1.26 million in 20156.
Informal carers are either primary carers, non-primary carers, or other carers, which includes unconfirmed primary carers. Chart 1.3 shows the number of informal carers by type in 2005, 2010 and 2015. The figures for 2015 were calculated by combining estimates of the proportion of informal carers by type in Australia in 2012, with 2015 population projections.
Chart 1.3: Number of informal carers, by type of carer, Australia (2005, 2010 and 2015)
Source: Deloitte Access Economics calculations.
Table 1.3 provides the underlying data on the number of informal carers by type, age and gender. In 2015, there are an estimated 825,000 primary carers in Australia, compared to 2.03 million non-primary carers.
6 The fall in the number of carers is likely to be due to sampling variability as the population data previously used for 2010 estimates has since been revised down substantially. This suggests that the 2010 estimate is more likely to reflect changes resulting from 2011 Census data rebasing than from a decline in the propensity to care.
2082.32325.9
2032
474.6
539.4824.6
0
500
1000
1500
2000
2500
3000
2005 2010 2015
'000
Non-primary carers Primary carers
6 Commercial-in-Confidence
Deloitte Access Economics
Table 1.3: Number of informal carers by age, gender and type, Australia (2015)
Primary carers
(‘000)
Non-primary carers
(‘000)
All carers
(‘000)
Males Females Total Males Females Total Males Females Total
< 15 - - - 35.8 42.2 77.9 35.8 42.2 77.9
15-24 9.1 14.1 23.2 105.2 101.4 206.7 114.3 115.5 229.8
25-34 17.1 62.7 79.8 103.2 94.0 197.2 120.3 156.7 277.0
35-44 24.2 113.2 137.4 142.3 153.4 295.7 166.6 266.6 433.1
45-54 43.7 120.5 164.2 184.0 219.8 403.8 227.7 340.3 568.0
55-64 64.1 133.2 197.3 190.8 213.7 404.6 254.9 347.0 601.9
65-74 54.4 82.5 137.0 139.4 125.1 264.5 193.9 207.6 401.5
75+ 40.9 44.8 85.7 106.1 75.5 181.6 147.0 120.3 267.4
Total 253.5 571.1 824.6 1,007.0 1,025.1 2,032.0 1,260.5 1,596.2 2,856.7 Source: Deloitte Access Economics calculations. Note: totals may not add due to rounding.
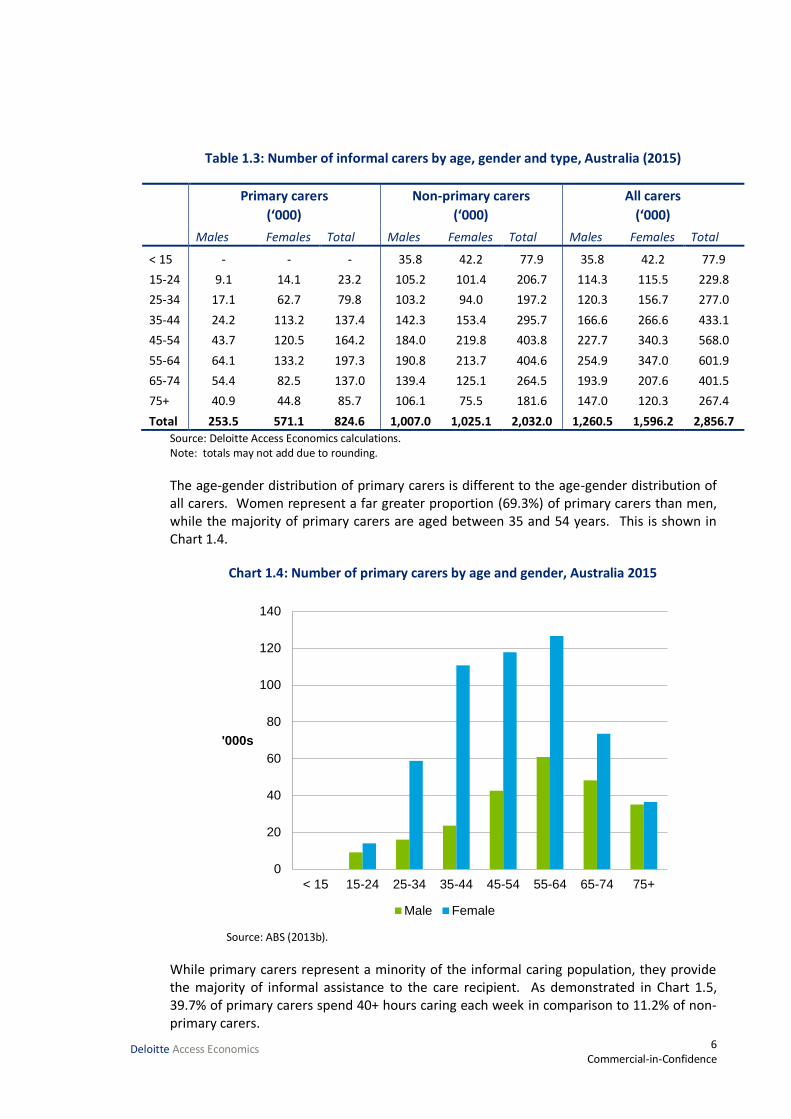
The age-gender distribution of primary carers is different to the age-gender distribution of all carers. Women represent a far greater proportion (69.3%) of primary carers than men, while the majority of primary carers are aged between 35 and 54 years. This is shown in Chart 1.4.
Chart 1.4: Number of primary carers by age and gender, Australia 2015
Source: ABS (2013b).
While primary carers represent a minority of the informal caring population, they provide the majority of informal assistance to the care recipient. As demonstrated in Chart 1.5, 39.7% of primary carers spend 40+ hours caring each week in comparison to 11.2% of non-primary carers.
0
20
40
60
80
100
120
140
< 15 15-24 25-34 35-44 45-54 55-64 65-74 75+
'000s
Male Female

7 Commercial-in-Confidence
Deloitte Access Economics
Chart 1.5: Average number of hours spent caring each week by carer status
Source: ABS (2013b).
1.2.2 Location, income and employment status
This section compares the geographic location, income distribution and employment status of informal carers with the general population.
Compared to the Australian population and to non-carers, carers are slightly more likely to live outside of major cities. An estimated 22.7% of all carers live in inner regional areas (Chart 1.6) compared to 20.3% of all people. Primary carers are also more likely to live in inner regional areas (24.5%) compared to 22% of non-primary carers.
Chart 1.6: Geographic location of carers, Australia
Source: ABS (2013b).
0% 20% 40% 60% 80% 100%
Total
Non-primary carer
Primary carer
< 20 hours 20-29 hours 30-39 hours 40+ hours
0% 20% 40% 60% 80% 100%
Australia
Non-carer
Total carers
Non-primary carer
Primary carer
Major cities Inner regional Other

8 Commercial-in-Confidence
Deloitte Access Economics
This greater proportion of informal carers in regional Australia may be attributed to a number of different reasons. First, greater difficulty accessing care services in regional and remote areas may result in greater reliance on friends and family for care. Second, higher rates of disability and reduced activity due to illness in males in all regional and remote areas may necessitate greater provision of informal care (AIHW, 2010). The higher proportion of Indigenous Australians in remote areas, who report lower than average health outcomes, may also account for higher levels of informal care (AIHW, 2014b). Lastly, a noted trend in declining prosperity in parts of outer regional and remote Australia may suggest a decline in the capacity to pay for formal care services (Edwards et al, 2009).
Carers are more likely to live in households with lower than average gross incomes with carers over-represented in the lower weekly income deciles and under-represented in the higher deciles. Primary carers are particularly affected by this income disparity relative to non-primary carers in these deciles. Chart 1.7 compares data for the working age carer population (people aged between 15 and 64 years of age) who are in the labour force to data for the average Australian in the labour force. Table 1.4 lists the weekly cash income ranges for each decile.
Chart 1.7: Carer status by weekly cash income deciles (15-64 years)
Source: ABS (2014c) Note: chart shows data for the working age population (15 – 64 years old) only.
0
2
4
6
8
10
12
14
16
1stdecile
2nddecile
3rddecile
4thdecile
5thdecile
6thdecile
7thdecile
8thdecile
9thdecile
10thdecile
%
Primary carer Non-primary carer Australia
9 Commercial-in-Confidence
Deloitte Access Economics
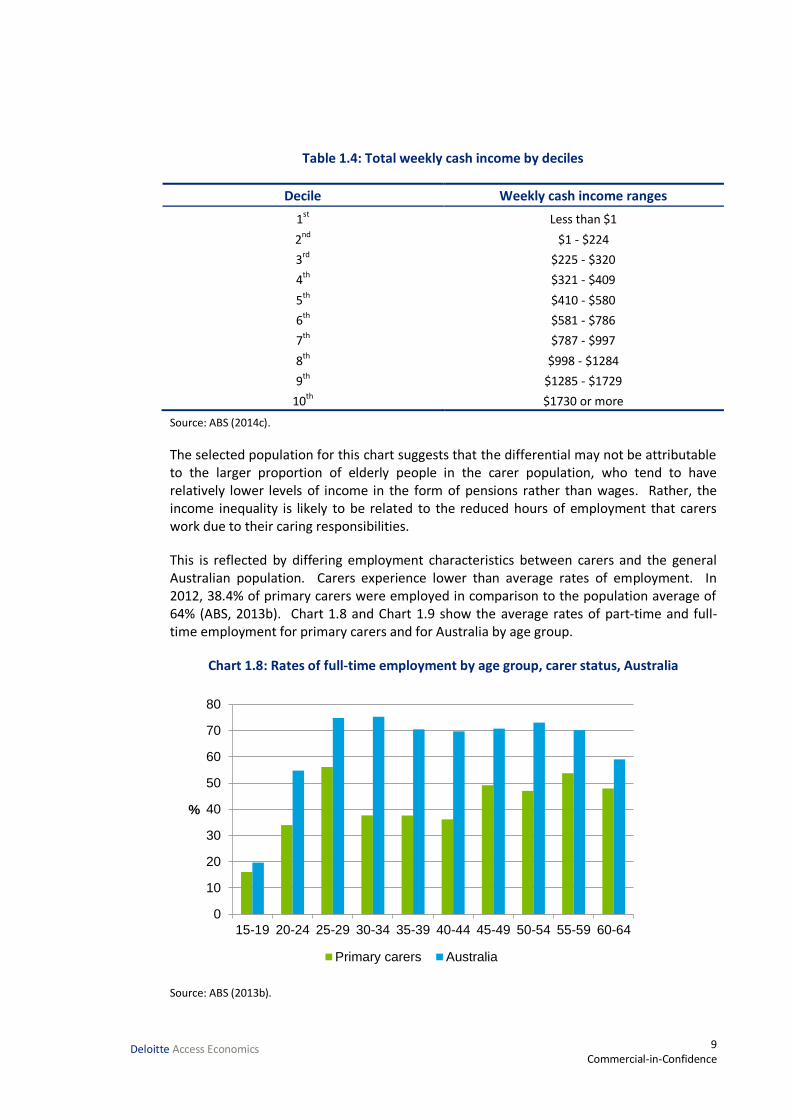
Table 1.4: Total weekly cash income by deciles
Decile Weekly cash income ranges
1st
Less than $1
2nd $1 - $224
3rd $225 - $320
4th
$321 - $409
5th $410 - $580
6th $581 - $786
7th $787 - $997
8th $998 - $1284
9th $1285 - $1729
10th $1730 or more
Source: ABS (2014c).
The selected population for this chart suggests that the differential may not be attributable to the larger proportion of elderly people in the carer population, who tend to have relatively lower levels of income in the form of pensions rather than wages. Rather, the income inequality is likely to be related to the reduced hours of employment that carers work due to their caring responsibilities.
This is reflected by differing employment characteristics between carers and the general Australian population. Carers experience lower than average rates of employment. In 2012, 38.4% of primary carers were employed in comparison to the population average of 64% (ABS, 2013b). Chart 1.8 and Chart 1.9 show the average rates of part-time and full-time employment for primary carers and for Australia by age group.
Chart 1.8: Rates of full-time employment by age group, carer status, Australia
Source: ABS (2013b).
0
10
20
30
40
50
60
70
80
15-19 20-24 25-29 30-34 35-39 40-44 45-49 50-54 55-59 60-64
%
Primary carers Australia
10 Commercial-in-Confidence
Deloitte Access Economics
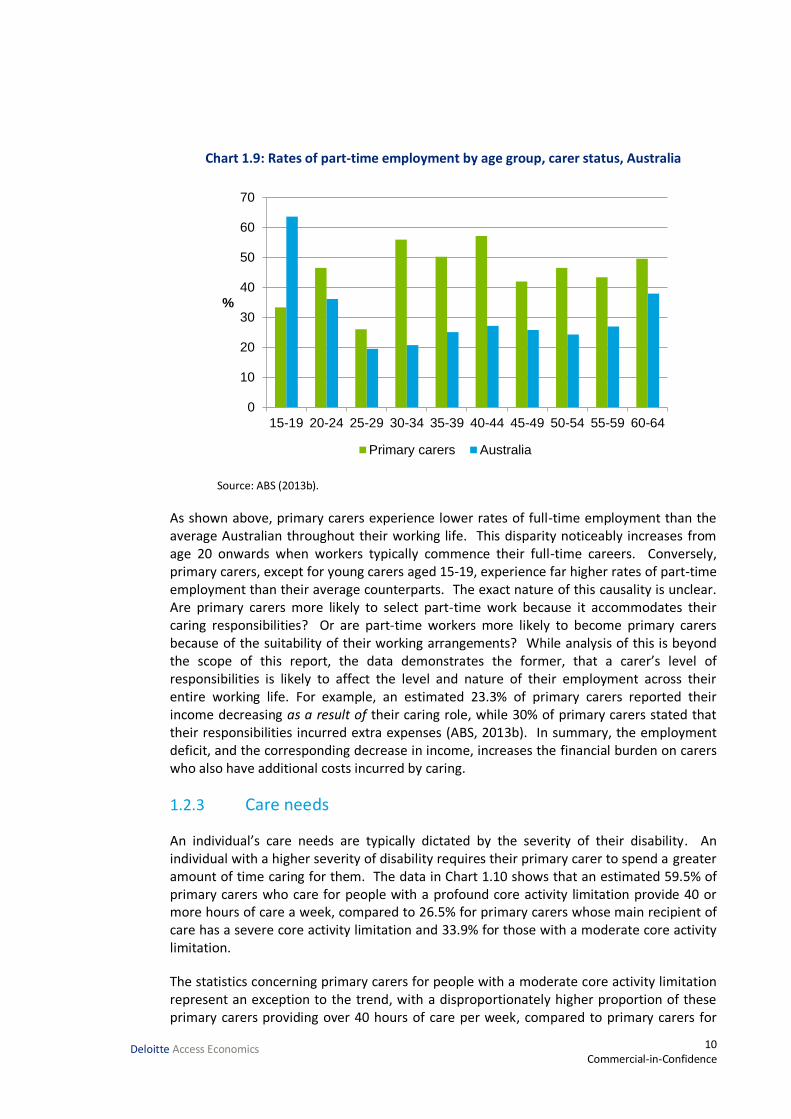
Chart 1.9: Rates of part-time employment by age group, carer status, Australia
Source: ABS (2013b).
As shown above, primary carers experience lower rates of full-time employment than the average Australian throughout their working life. This disparity noticeably increases from age 20 onwards when workers typically commence their full-time careers. Conversely, primary carers, except for young carers aged 15-19, experience far higher rates of part-time employment than their average counterparts. The exact nature of this causality is unclear. Are primary carers more likely to select part-time work because it accommodates their caring responsibilities? Or are part-time workers more likely to become primary carers because of the suitability of their working arrangements? While analysis of this is beyond the scope of this report, the data demonstrates the former, that a carer’s level of responsibilities is likely to affect the level and nature of their employment across their entire working life. For example, an estimated 23.3% of primary carers reported their income decreasing as a result of their caring role, while 30% of primary carers stated that their responsibilities incurred extra expenses (ABS, 2013b). In summary, the employment deficit, and the corresponding decrease in income, increases the financial burden on carers who also have additional costs incurred by caring.
1.2.3 Care needs
An individual’s care needs are typically dictated by the severity of their disability. An individual with a higher severity of disability requires their primary carer to spend a greater amount of time caring for them. The data in Chart 1.10 shows that an estimated 59.5% of primary carers who care for people with a profound core activity limitation provide 40 or more hours of care a week, compared to 26.5% for primary carers whose main recipient of care has a severe core activity limitation and 33.9% for those with a moderate core activity limitation.
The statistics concerning primary carers for people with a moderate core activity limitation represent an exception to the trend, with a disproportionately higher proportion of these primary carers providing over 40 hours of care per week, compared to primary carers for
0
10
20
30
40
50
60
70
15-19 20-24 25-29 30-34 35-39 40-44 45-49 50-54 55-59 60-64
%
Primary carers Australia

11 Commercial-in-Confidence
Deloitte Access Economics
individuals with a severe restriction. The anomaly can be attributed to the relatively small sample size of respondents for this question. Only 36 primary carers, who are providing care to moderately restricted recipients, participated in this survey, in comparison to 1,038 and 748 primary carers who are providing care to profoundly and severely restricted recipients respectively. As such, the results for this particular question have been skewed.
Chart 1.10: Weekly hours of care, primary carers, main care recipient’s disability status
Source: ABS (2014c).
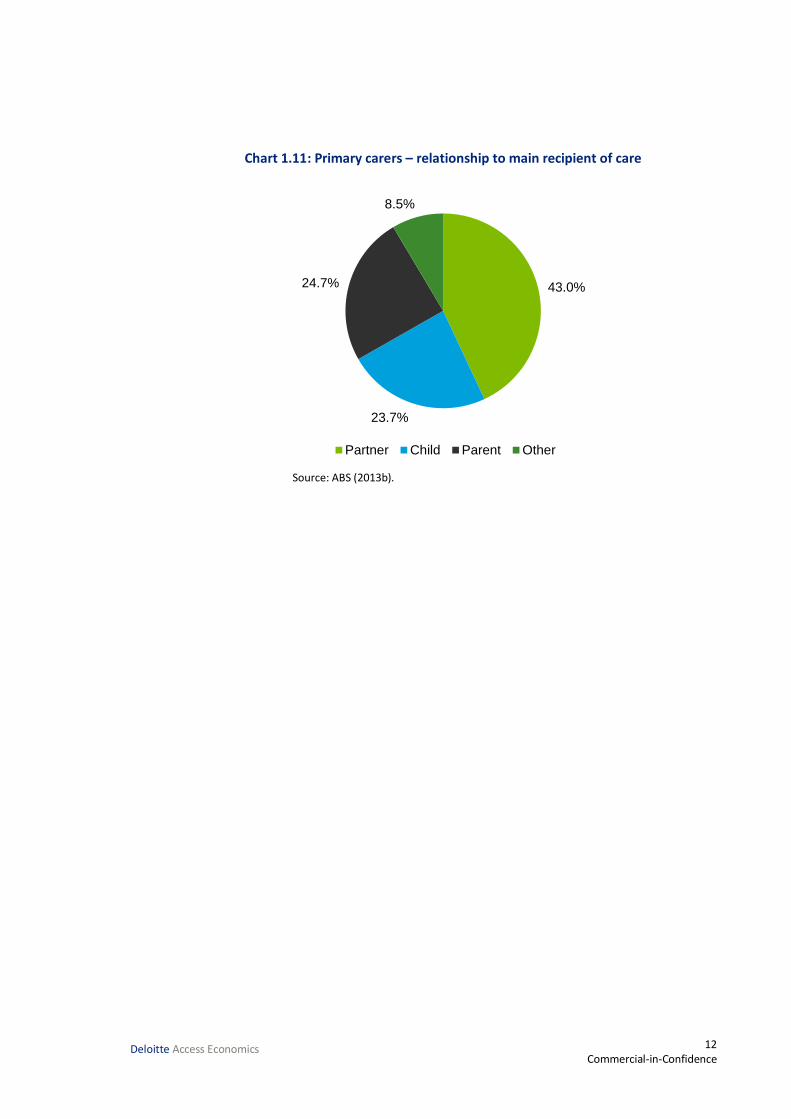
Informal care is most often provided by close family members. About 70.9% of all carers live with one or more of the recipients they provide care to (ABS, 2013b). As demonstrated by Chart 1.11, 91.5% of primary carers are providing assistance to a partner, child or parent. The remaining 8.5% of primary carers have care recipients who are other relatives, friends or neighbours.
0% 20% 40% 60% 80% 100%
Total
Other
Moderately restricted
Severely restricted
Profoundly restricted
< 20 hours 20 - 39 hours 40+ hours Does not know
12 Commercial-in-Confidence
Deloitte Access Economics
Chart 1.11: Primary carers – relationship to main recipient of care
Source: ABS (2013b).
43.0%
23.7%
24.7%
8.5%
Partner Child Parent Other
13 Commercial-in-Confidence
Deloitte Access Economics
2 Replacement cost valuation While informal carers are not paid for providing this care, informal care is not free in an economic sense. Time spent caring involves forfeiting time that could have been spent on paid work or leisure. As such, informal care can be valued as the opportunity cost associated with the loss of economic resources (labour) and the loss in leisure time valued by the carer.
There are three potential methodologies which can be used to place a dollar value on informal care.
The replacement cost method measures the cost of ‘buying’ an equivalent amount of care from the formal sector if the informal care were not supplied.
The opportunity cost method measures the formal sector productivity losses associated with caring, as time devoted to caring responsibilities is time which cannot be spent in the paid workforce.
The self-valuation method measures how much carers themselves feel they should be paid for undertaking their responsibilities.
The scope of this study has been restricted to only include the replacement cost method.
Methodology and data 2.1
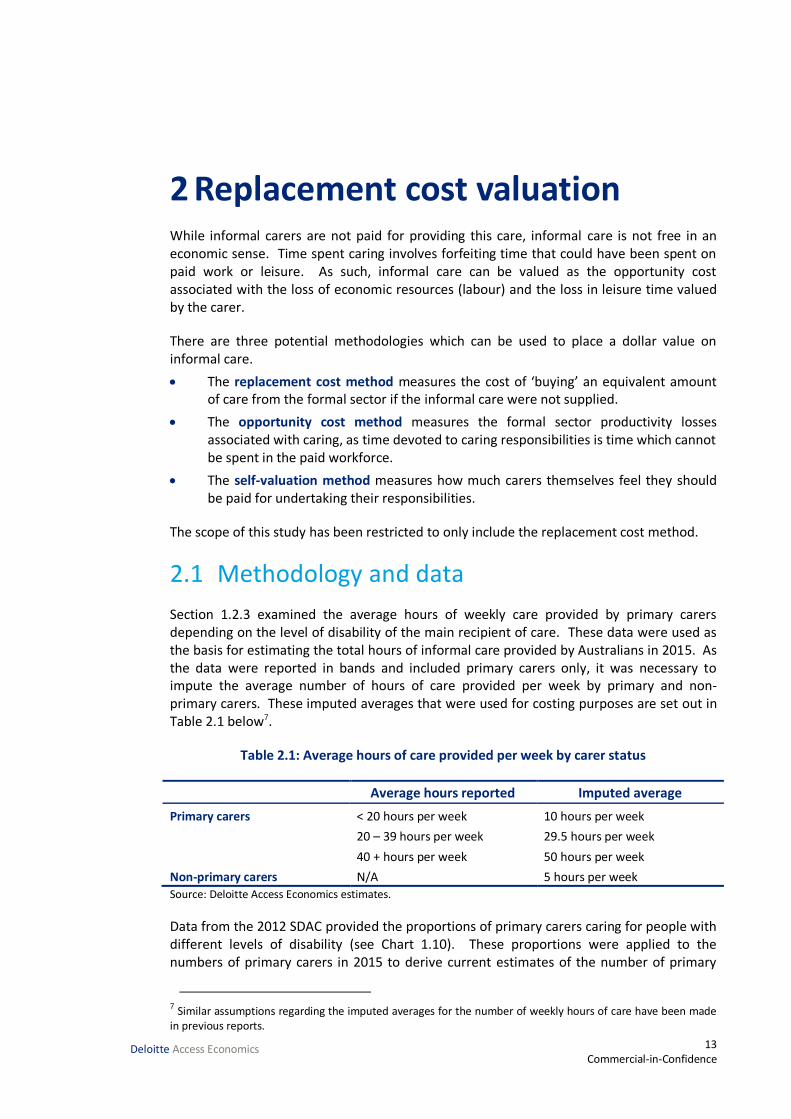
Section 1.2.3 examined the average hours of weekly care provided by primary carers depending on the level of disability of the main recipient of care. These data were used as the basis for estimating the total hours of informal care provided by Australians in 2015. As the data were reported in bands and included primary carers only, it was necessary to impute the average number of hours of care provided per week by primary and non-primary carers. These imputed averages that were used for costing purposes are set out in Table 2.1 below7.
Table 2.1: Average hours of care provided per week by carer status
Average hours reported Imputed average
Primary carers < 20 hours per week 10 hours per week
20 – 39 hours per week 29.5 hours per week
40 + hours per week 50 hours per week
Non-primary carers N/A 5 hours per week
Source: Deloitte Access Economics estimates.
Data from the 2012 SDAC provided the proportions of primary carers caring for people with different levels of disability (see Chart 1.10). These proportions were applied to the numbers of primary carers in 2015 to derive current estimates of the number of primary
7 Similar assumptions regarding the imputed averages for the number of weekly hours of care have been made in previous reports.

14 Commercial-in-Confidence
Deloitte Access Economics
carers by disability status of the main recipient of care. These totals, in addition to estimates of the number of non-primary carers in Australia, were combined with their respective imputed averages listed in Table 2.1 to calculate the total number of hours spent on providing care in 2015. The replacement value of informal care provided by carers was then calculated by multiplying hours spent caring by average wage rates for workers from the formal care sector.
The estimate of the replacement value of care is sensitive to changes in the estimate of the wage parameter for alternate formal sector care. In this analysis, the unit cost used has been based on the wage of moderately skilled formal sector carers (supervised employees), based on the Australian and New Zealand Standard Classification of Occupations. Full-time personal carers and assistants employed in the formal sector received an average wage of $27.20 per hour, or $1020.00 for a 37.5 hour week in May 2014 (ABS, 2014a). This is inclusive of personal income tax and superannuation, and includes payment of overtime for after-hours work.
However, the hourly rate received by employees does not account for on-costs such as the wages of supervisors, managers or administrative support staff, or other capital overheads. Loadings are added for each of these additional costs, and for average wage growth between May 2014 (when the survey was last undertaken) and May 2015, which was taken as the average of the growth rates for the last five periods of average weekly earnings (AWE). Loadings for capital and administrative overheads were based on the relative shares of capital expenditure and administrative costs to other areas of recurrent spending in Australia’s formal health sector (AIHW, 2014a). The loading for on-costs was sourced from the ABS’ report on labour costs in 2011 (ABS, 2012c).
Table 2.2: Replacement valuation of informal care, unit cost components
% Loading Hourly rate ($)
Base rate per hour – May 2014 27.20
Loading for growth in AWE May 2014 to November 2014
4.22 1.15
Loading for on-costs 2.72 0.74
Loading for capital 6.2 1.69
Loading for supervision & administration
2.13 0.58
Total hourly rate including overheads 31.36 Source: Deloitte Access Economics calculations.
When these loadings were added, the average hourly cost of employing a carer in the formal sector to replace an informal carer was estimated at $31.36 in 2015. These loadings reflect the fact that formal sector community care involves more than just labour inputs.

15 Commercial-in-Confidence
Deloitte Access Economics
Results 2.2
Table 2.3 outlines the estimated total replacement cost of informal care and includes a breakdown of results by carer type and by the level of disability of the main recipient of care.
Table 2.3: Replacement cost of informal care, Australia 2015
Level of Disability Profound Severe Moderate Other Total
Primary carers
Avg. hours of care per week 39 25 29 22
Number of primary carers (000s) 458 324 15 28.0 825
Total hours per annum (m) 919 420 23 32 1,394
Replacement cost ($m) 28,830 13,162 713 1,001 43,706
Non-primary carers
Avg. hours of care per week 5 5 5 5 5
Number of non-primary carers (000s) N/A N/A N/A N/A 2,032
Total hours per annum (m) 528
Replacement cost ($m) 16,566
Total replacement cost ($m) 60,272 Source: Deloitte Access Economics calculations. Note: totals may not add due to rounding
The total replacement cost of informal care in 2015 is estimated as $60.3 billion. Informal carers provide an estimated 1.9 billion hours of care in 2015, providing an average of nearly 673 hours of care per year or 13 hours per week.
In 2015 the value of informal care provided by primary carers is estimated as $43.7 billion, of which $28.8 billion is provided to people with a profound disability and $13.2 billion is provided to people with a severe disability. Primary informal care provided to people with a moderate disability accounts for $0.7 billion while the remaining $1.0 billion accounts for care provided to people with a mild disability or a disability that does not affect core activities.
The SDAC does not provide sufficient data to determine the disability level of the recipients of care provided by non-primary carers and the average hours of care that they provide. As such, the replacement cost for the value of informal care provided by non-primary carers has been based on an estimate that each of the 2.03 million non-primary carers in Australia in 2015 provides an average of five hours of care per week, given that non-primary carers, by definition, do not provide the majority of informal care. On this basis, the replacement value of care provided by non-primary carers is $16.6 billion per annum.
Discussion 2.3
The replacement cost measure does not take into consideration differences in efficiency of providing care. For example, many informal carers only provide care to one recipient of care while workers in the formal sector may provide care to multiple people at the same
16 Commercial-in-Confidence
Deloitte Access Economics
time in residential settings. However, in order to match the number of hours and intensity of care provided by informal carers in the community setting, a formal carer may need to spend more hours overall – for example, to receive paid training and to travel between care locations. As such, the replacement cost estimate may not accurately reflect the number of hours needed to provide an equivalent level of care in the formal sector, with both upside and downside risks to the estimates.
Since the estimation risks counter each other, the estimate provided is likely to represent a sound valuation of the contribution of informal care and provides a useful point of comparison with previous estimates of the value of informal care in Australia, and the estimated size of other sectors in the Australian economy. A literature search did not identify any studies that had valued informal care in Australia since 2010.
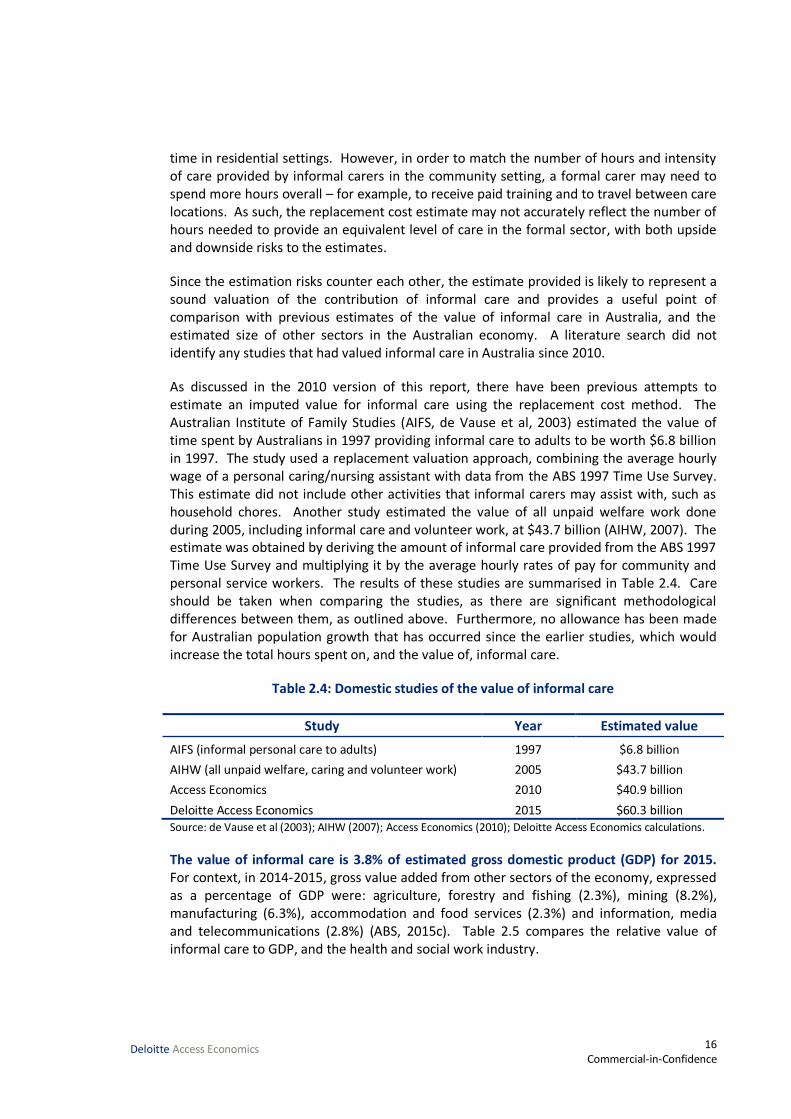
As discussed in the 2010 version of this report, there have been previous attempts to estimate an imputed value for informal care using the replacement cost method. The Australian Institute of Family Studies (AIFS, de Vause et al, 2003) estimated the value of time spent by Australians in 1997 providing informal care to adults to be worth $6.8 billion in 1997. The study used a replacement valuation approach, combining the average hourly wage of a personal caring/nursing assistant with data from the ABS 1997 Time Use Survey. This estimate did not include other activities that informal carers may assist with, such as household chores. Another study estimated the value of all unpaid welfare work done during 2005, including informal care and volunteer work, at $43.7 billion (AIHW, 2007). The estimate was obtained by deriving the amount of informal care provided from the ABS 1997 Time Use Survey and multiplying it by the average hourly rates of pay for community and personal service workers. The results of these studies are summarised in Table 2.4. Care should be taken when comparing the studies, as there are significant methodological differences between them, as outlined above. Furthermore, no allowance has been made for Australian population growth that has occurred since the earlier studies, which would increase the total hours spent on, and the value of, informal care.
Table 2.4: Domestic studies of the value of informal care
Study Year Estimated value
AIFS (informal personal care to adults) 1997 $6.8 billion
AIHW (all unpaid welfare, caring and volunteer work) 2005 $43.7 billion
Access Economics 2010 $40.9 billion
Deloitte Access Economics 2015 $60.3 billion Source: de Vause et al (2003); AIHW (2007); Access Economics (2010); Deloitte Access Economics calculations.
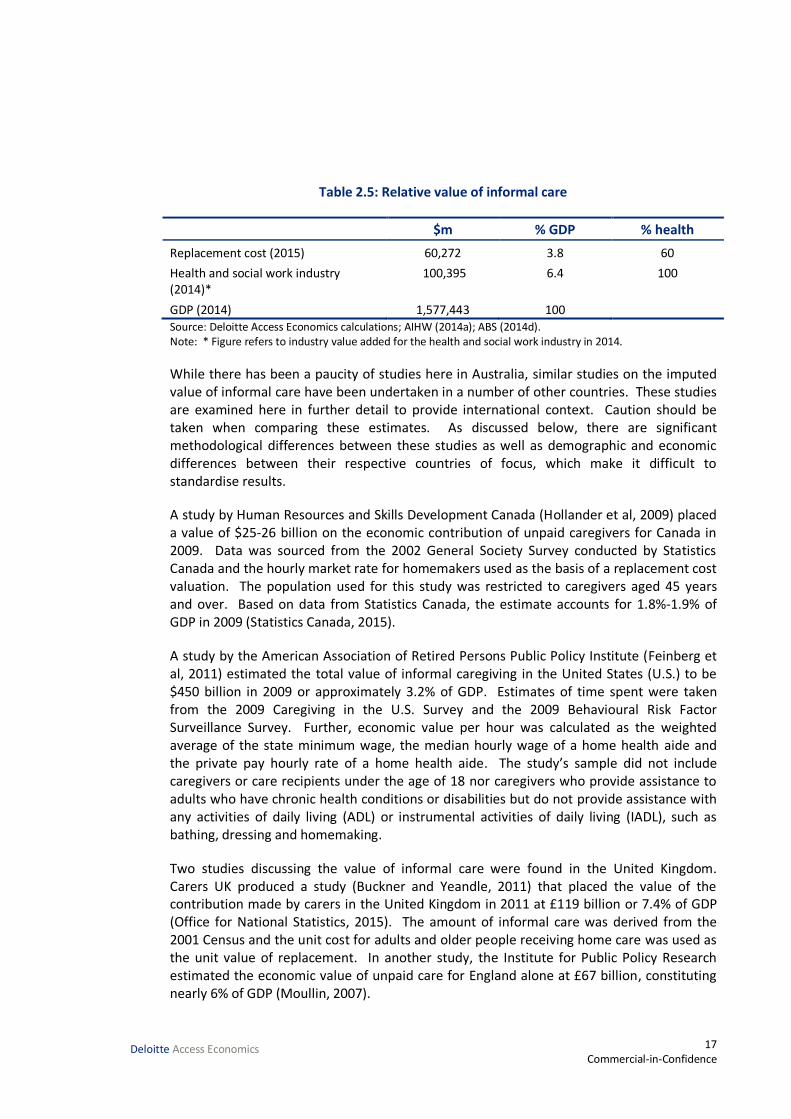
The value of informal care is 3.8% of estimated gross domestic product (GDP) for 2015. For context, in 2014-2015, gross value added from other sectors of the economy, expressed as a percentage of GDP were: agriculture, forestry and fishing (2.3%), mining (8.2%), manufacturing (6.3%), accommodation and food services (2.3%) and information, media and telecommunications (2.8%) (ABS, 2015c). Table 2.5 compares the relative value of informal care to GDP, and the health and social work industry.
17 Commercial-in-Confidence
Deloitte Access Economics
Table 2.5: Relative value of informal care
$m % GDP % health
Replacement cost (2015) 60,272 3.8 60
Health and social work industry (2014)*
100,395 6.4 100
GDP (2014) 1,577,443 100 Source: Deloitte Access Economics calculations; AIHW (2014a); ABS (2014d). Note: * Figure refers to industry value added for the health and social work industry in 2014.
While there has been a paucity of studies here in Australia, similar studies on the imputed value of informal care have been undertaken in a number of other countries. These studies are examined here in further detail to provide international context. Caution should be taken when comparing these estimates. As discussed below, there are significant methodological differences between these studies as well as demographic and economic differences between their respective countries of focus, which make it difficult to standardise results.
A study by Human Resources and Skills Development Canada (Hollander et al, 2009) placed a value of $25-26 billion on the economic contribution of unpaid caregivers for Canada in 2009. Data was sourced from the 2002 General Society Survey conducted by Statistics Canada and the hourly market rate for homemakers used as the basis of a replacement cost valuation. The population used for this study was restricted to caregivers aged 45 years and over. Based on data from Statistics Canada, the estimate accounts for 1.8%-1.9% of GDP in 2009 (Statistics Canada, 2015).
A study by the American Association of Retired Persons Public Policy Institute (Feinberg et al, 2011) estimated the total value of informal caregiving in the United States (U.S.) to be $450 billion in 2009 or approximately 3.2% of GDP. Estimates of time spent were taken from the 2009 Caregiving in the U.S. Survey and the 2009 Behavioural Risk Factor Surveillance Survey. Further, economic value per hour was calculated as the weighted average of the state minimum wage, the median hourly wage of a home health aide and the private pay hourly rate of a home health aide. The study’s sample did not include caregivers or care recipients under the age of 18 nor caregivers who provide assistance to adults who have chronic health conditions or disabilities but do not provide assistance with any activities of daily living (ADL) or instrumental activities of daily living (IADL), such as bathing, dressing and homemaking.
Two studies discussing the value of informal care were found in the United Kingdom. Carers UK produced a study (Buckner and Yeandle, 2011) that placed the value of the contribution made by carers in the United Kingdom in 2011 at £119 billion or 7.4% of GDP (Office for National Statistics, 2015). The amount of informal care was derived from the 2001 Census and the unit cost for adults and older people receiving home care was used as the unit value of replacement. In another study, the Institute for Public Policy Research estimated the economic value of unpaid care for England alone at £67 billion, constituting nearly 6% of GDP (Moullin, 2007).
18 Commercial-in-Confidence
Deloitte Access Economics
A study by Carers NZ and the NZ Carers Alliance (Grimmond, 2014) estimated the value of informal care in New Zealand in 2013 to be worth $10.8 billion, or 5% of GDP. The study used the 2013 Census and 2009/10 Time Use Survey to calculate an estimate for time spent providing informal care and adjusted the minimum wage rate to provide a replacement carer wage cost. The estimate does not include any overhead costs.
A study of care provided to disabled elderly people living at home in France estimated informal care at a total of 6.6 billion euros in 2011 (Paraponaris et al, 2012). The study used estimates of the weekly number of care hours required to perform ADL and IADL to derive the total number of care hours received and applied a market wage rate using the French minimum gross hourly wage. The estimate assumed perfect substitution between formal and informal types of care and only considered a specific number of ADL and IADL in its calculations. Based on data from the National Institute of Statistics and Economic Studies (INSEE), the estimate accounts for 0.3% of GDP in 2011 (INSEE, 2015).
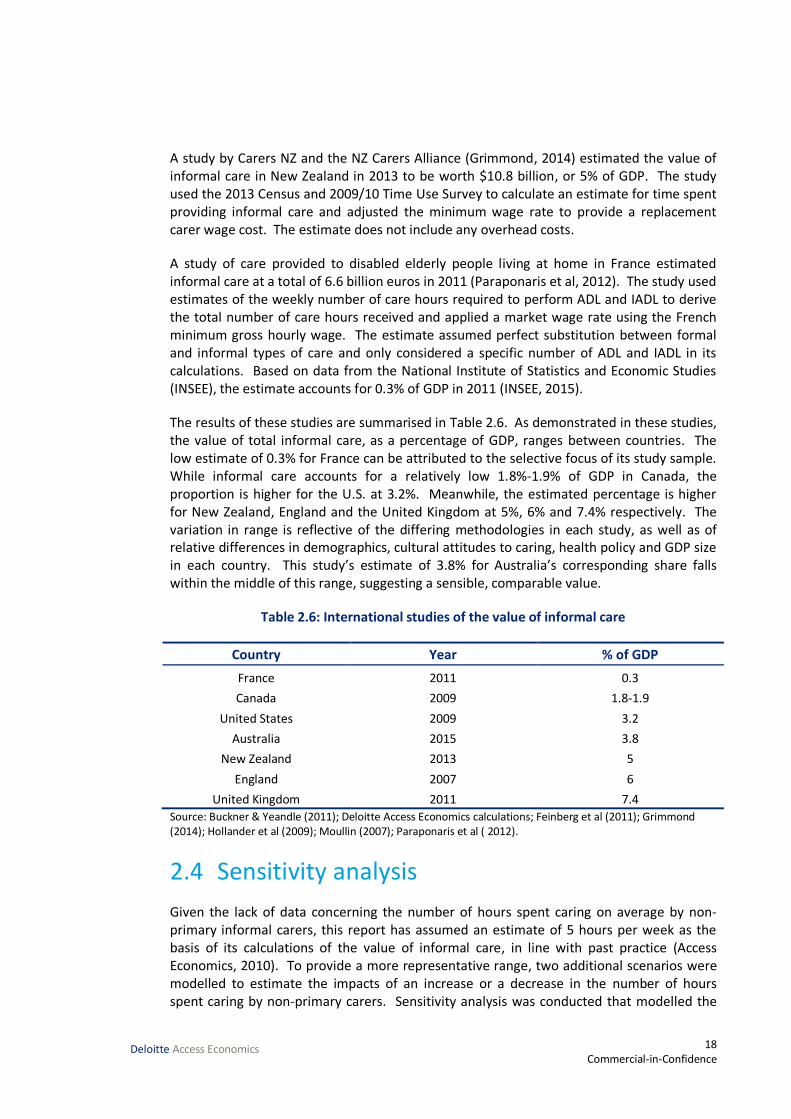
The results of these studies are summarised in Table 2.6. As demonstrated in these studies, the value of total informal care, as a percentage of GDP, ranges between countries. The low estimate of 0.3% for France can be attributed to the selective focus of its study sample. While informal care accounts for a relatively low 1.8%-1.9% of GDP in Canada, the proportion is higher for the U.S. at 3.2%. Meanwhile, the estimated percentage is higher for New Zealand, England and the United Kingdom at 5%, 6% and 7.4% respectively. The variation in range is reflective of the differing methodologies in each study, as well as of relative differences in demographics, cultural attitudes to caring, health policy and GDP size in each country. This study’s estimate of 3.8% for Australia’s corresponding share falls within the middle of this range, suggesting a sensible, comparable value.
Table 2.6: International studies of the value of informal care
Country Year % of GDP
France 2011 0.3
Canada 2009 1.8-1.9
United States 2009 3.2
Australia 2015 3.8
New Zealand 2013 5
England 2007 6
United Kingdom 2011 7.4
Source: Buckner & Yeandle (2011); Deloitte Access Economics calculations; Feinberg et al (2011); Grimmond (2014); Hollander et al (2009); Moullin (2007); Paraponaris et al ( 2012).
Sensitivity analysis 2.4
Given the lack of data concerning the number of hours spent caring on average by non-primary informal carers, this report has assumed an estimate of 5 hours per week as the basis of its calculations of the value of informal care, in line with past practice (Access Economics, 2010). To provide a more representative range, two additional scenarios were modelled to estimate the impacts of an increase or a decrease in the number of hours spent caring by non-primary carers. Sensitivity analysis was conducted that modelled the

19 Commercial-in-Confidence
Deloitte Access Economics
effects on the total replacement value of informal care in 2015 of increasing and decreasing the estimate by 50% - to 2.5 and 7.5 hours weekly, respectively.
Table 2.7: Impacts of wage change on replacement value of informal care
Average hours of non-primary care
per week
Total hours of non-primary care per
annum
Replacement cost of non-primary care
($m)
Total replacement cost of informal
care ($m)
2.5 264 8,283 51,989
5 528 16,566 60,272
7.5 792 24,849 68,555 Source: Deloitte Access Economics calculations.
A decrease or increase of 50% in the average hours of non-primary care per week results in a corresponding decrease or increase of 13.74% in the total replacement cost value of informal care. Given the uncertainty surrounding the total hours of non-primary care provided per annum, the total replacement cost of informal care falls within a range of $52.0-$68.6 billion.

20 Commercial-in-Confidence
Deloitte Access Economics
3 Demand and supply forecasts This section of the report forecasts the supply and demand for informal carers over the next ten years to 2025, and presents qualitative analysis of the issues raised by the results of the forecasts.
Methodology 3.1
Forecasting the future demand and supply of informal carers is a complex exercise, due to the number of variables that could be included in the analysis. These include (Nepal et al, 2011; Access Economics, 2010):
the age and gender profile of Australia;
prevalence of chronic illness and disability;
care needs among the disabled population;
supply of care provided through the formal care sector;
adequacy of care quality provided through the formal care sector;
labour force participation rates;
rates of relationship breakdowns;
fertility rates;
family mobility and dispersion;
the proportion of the population living in single person households; and
propensity to care.
Undertaking an analysis which combines all these variables is beyond the scope of this report (however, the potential impact of these variables is examined in Section 3.3). This report utilises the methodology provided in Access Economics (2010), which draws on reports by the AIHW (Jenkins et al, 2003) and the University of Canberra (National Centre for Social and Economic Modelling, 2004).
Demand and supply forecasts were constructed by estimating the future requirements for primary co-residential care for people aged over 65 years with a severe or profound disability.
Demand for informal care has been modelled using the number of people with a profound or severe disability over 65 who were not living in cared accommodation. Age and gender-specific disability rates and living arrangements from the SDAC were applied to population projections to determine the number of people requiring care in the next decade.
This methodology was used to ensure consistency with previous forecasts (such as Jenkins et al, 2003; Gibson et al, 1995; Walsh and de Ravin, 1995). People with severe disability require care sometimes, while people with a profound disability require care all the time (ABS, 2013b). Care for these people is typically provided by co-resident carers, either in a
21 Commercial-in-Confidence
Deloitte Access Economics
community-based setting (for example, at the person’s home) or in a formal setting (for example, a residential aged care facility).
The supply of co-resident primary informal carers from 2016 to 2025 was forecast by applying the current age-gender specific propensity to care in the Australian population with the Australian population estimates (Series B) published by the ABS (2013a). The analysis drew on data that was extracted from the 2012 SDAC CURF (ABS, 2014c), on the number of people who were co-resident with a person with a severe or profound disability, and who were the primary carer for that person.
In each year, a “carer gap” was calculated, based on the number of people over 65 with a profound or severe disability who were not living in cared accommodation, and the forecast number of co-resident primary carers in that year. From this data, a “carer ratio” was also calculated as the supply of carers divided by the demand for carers8. A larger carer gap (and a smaller carer ratio) indicates that demand is growing at a faster rate than supply.
Results 3.2
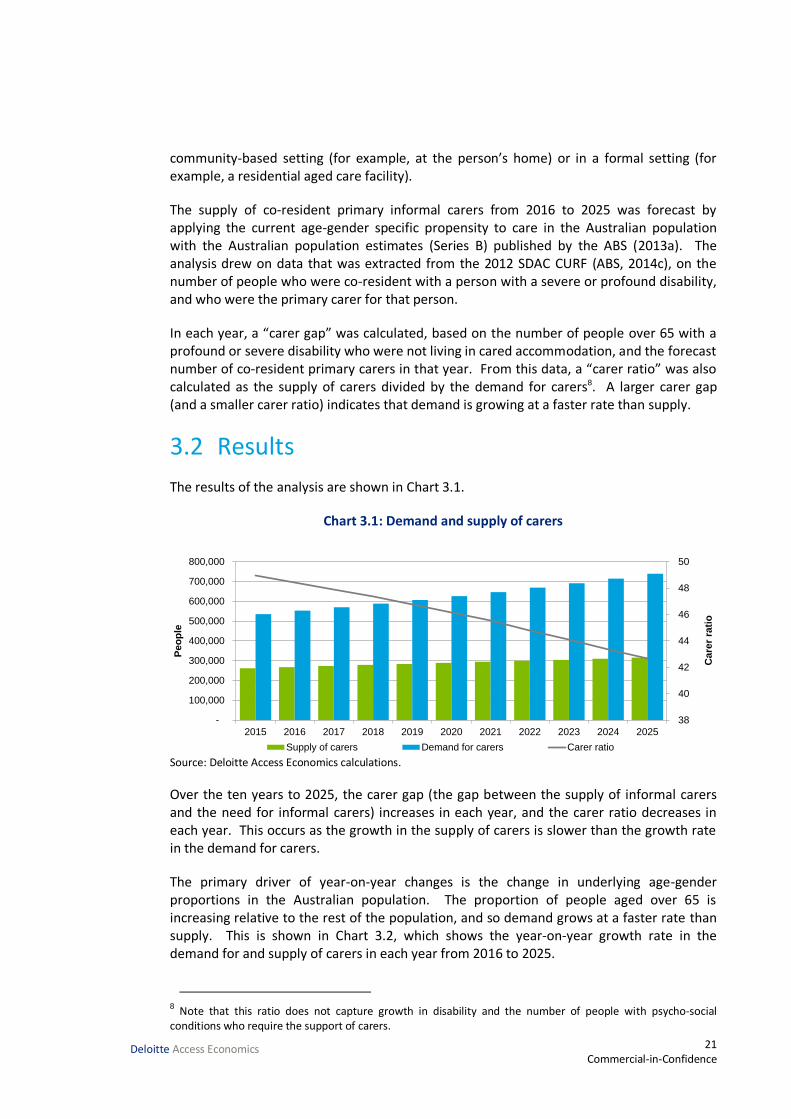
The results of the analysis are shown in Chart 3.1.
Chart 3.1: Demand and supply of carers
Source: Deloitte Access Economics calculations.
Over the ten years to 2025, the carer gap (the gap between the supply of informal carers and the need for informal carers) increases in each year, and the carer ratio decreases in each year. This occurs as the growth in the supply of carers is slower than the growth rate in the demand for carers.
The primary driver of year-on-year changes is the change in underlying age-gender proportions in the Australian population. The proportion of people aged over 65 is increasing relative to the rest of the population, and so demand grows at a faster rate than supply. This is shown in Chart 3.2, which shows the year-on-year growth rate in the demand for and supply of carers in each year from 2016 to 2025.
8 Note that this ratio does not capture growth in disability and the number of people with psycho-social conditions who require the support of carers.
38
40
42
44
46
48
50
-
100,000
200,000
300,000
400,000
500,000
600,000
700,000
800,000
2015 2016 2017 2018 2019 2020 2021 2022 2023 2024 2025
Care
r ra
tio
Peo
ple
Supply of carers Demand for carers Carer ratio
22 Commercial-in-Confidence
Deloitte Access Economics
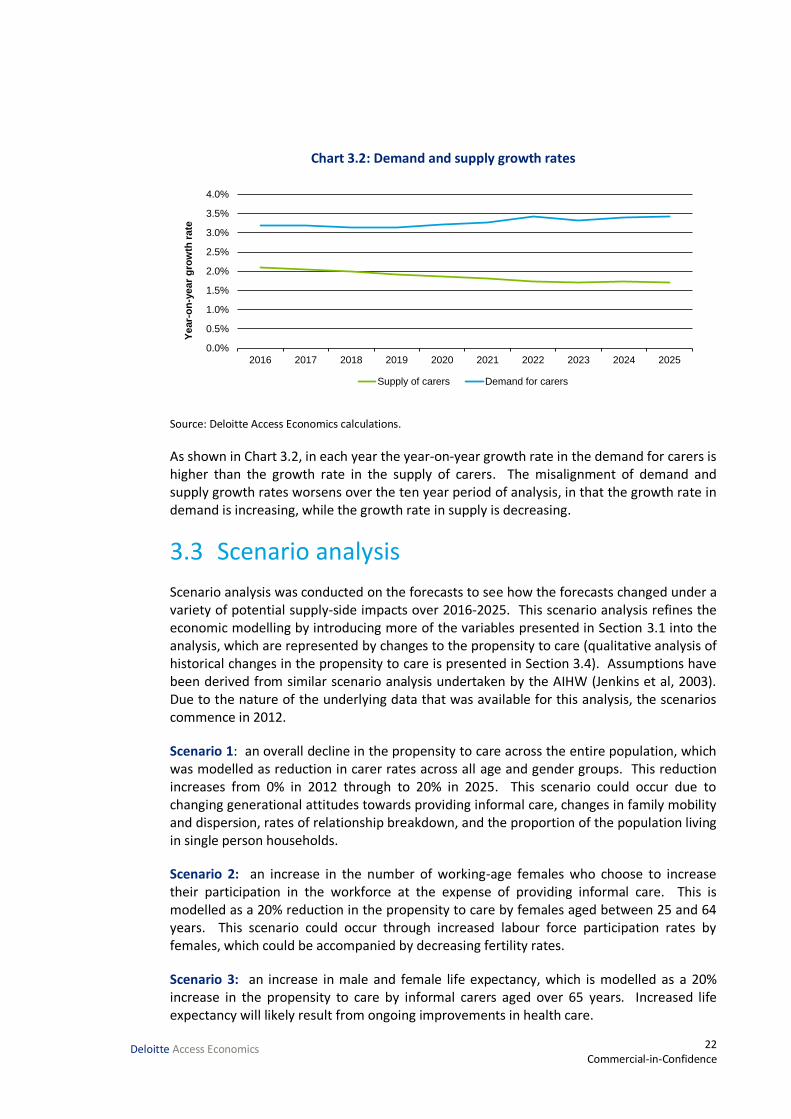
Chart 3.2: Demand and supply growth rates
Source: Deloitte Access Economics calculations.
As shown in Chart 3.2, in each year the year-on-year growth rate in the demand for carers is higher than the growth rate in the supply of carers. The misalignment of demand and supply growth rates worsens over the ten year period of analysis, in that the growth rate in demand is increasing, while the growth rate in supply is decreasing.
Scenario analysis 3.3
Scenario analysis was conducted on the forecasts to see how the forecasts changed under a variety of potential supply-side impacts over 2016-2025. This scenario analysis refines the economic modelling by introducing more of the variables presented in Section 3.1 into the analysis, which are represented by changes to the propensity to care (qualitative analysis of historical changes in the propensity to care is presented in Section 3.4). Assumptions have been derived from similar scenario analysis undertaken by the AIHW (Jenkins et al, 2003). Due to the nature of the underlying data that was available for this analysis, the scenarios commence in 2012.
Scenario 1: an overall decline in the propensity to care across the entire population, which was modelled as reduction in carer rates across all age and gender groups. This reduction increases from 0% in 2012 through to 20% in 2025. This scenario could occur due to changing generational attitudes towards providing informal care, changes in family mobility and dispersion, rates of relationship breakdown, and the proportion of the population living in single person households.
Scenario 2: an increase in the number of working-age females who choose to increase their participation in the workforce at the expense of providing informal care. This is modelled as a 20% reduction in the propensity to care by females aged between 25 and 64 years. This scenario could occur through increased labour force participation rates by females, which could be accompanied by decreasing fertility rates.
Scenario 3: an increase in male and female life expectancy, which is modelled as a 20% increase in the propensity to care by informal carers aged over 65 years. Increased life expectancy will likely result from ongoing improvements in health care.
0.0%
0.5%
1.0%
1.5%
2.0%
2.5%
3.0%
3.5%
4.0%
2016 2017 2018 2019 2020 2021 2022 2023 2024 2025
Year-
on
-year
gro
wth
rate
Supply of carers Demand for carers

23 Commercial-in-Confidence
Deloitte Access Economics
The results of the modelling are expressed in terms of the carer gap that has been calculated for each scenario. The results of the scenario analysis are shown in Chart 3.3.
Chart 3.3: Growth in carer gaps under different scenarios
Source: Deloitte Access Economics calculations.
The two scenarios which represent a decrease in the propensity to care (Scenario 1 and Scenario 2) result in a carer gap in 2025 that is higher than the carer gap that exists under the Baseline scenario. Scenario 1 results in a 14.9% increase in the base case deficit by 2025 while Scenario 2 results in a 2.2% increase in the base case deficit by 2025. Scenario 3, which models an increase in the propensity to care, results in a slightly lower carer gap in 2025 compared to the Baseline scenario, with a decrease of 0.7% in the base case deficit by that year.
Scenario 1 results in the largest carer gap, as this models a 20% reduction in the propensity to care across the entire population, while Scenario 2 restricts the 20% reduction to the females of working age demographic group.
Propensity to care 3.4
3.4.1 Historical changes in the propensity to care
Building on the scenario analysis undertaken in Section 3.3, this section examines historical changes in the propensity to care in the Australian population. An analysis of the SDAC data in 2003, 2009 and 2012 identifies an overall decrease in the propensity to care across the Australian population. The average propensity to care rate was calculated for each year and then weighted by the historical population to adjust for population growth. Chart 3.4 and Chart 3.5 depict the average propensity to care rates by age against the population-
200,000
250,000
300,000
350,000
400,000
450,000
500,000
2012 2013 2014 2015 2016 2017 2018 2019 2020 2021 2022 2023 2024 2025
Care
r g
ap
Baseline Scenario 1 Scenario 2 Scenario 3

24 Commercial-in-Confidence
Deloitte Access Economics
weighted average for each gender over the years 2003, 2009 and 2012, with the data for males and females combined in Chart 3.6.
Chart 3.4: Average propensity to care by age group, males
Source: Deloitte Access Economics calculations.
Chart 3.5: Average propensity to care by age group, females
Source: Deloitte Access Economics calculations.
0 5 10 15 20 25
0-24
25-34
35-44
45-54
55-64
65-74
75 and over
Total
%
2003 2009 2012
0 5 10 15 20 25 30
0-24
25-34
35-44
45-54
55-64
65-74
75 and over
Total
%
2003 2009 2012
25 Commercial-in-Confidence
Deloitte Access Economics
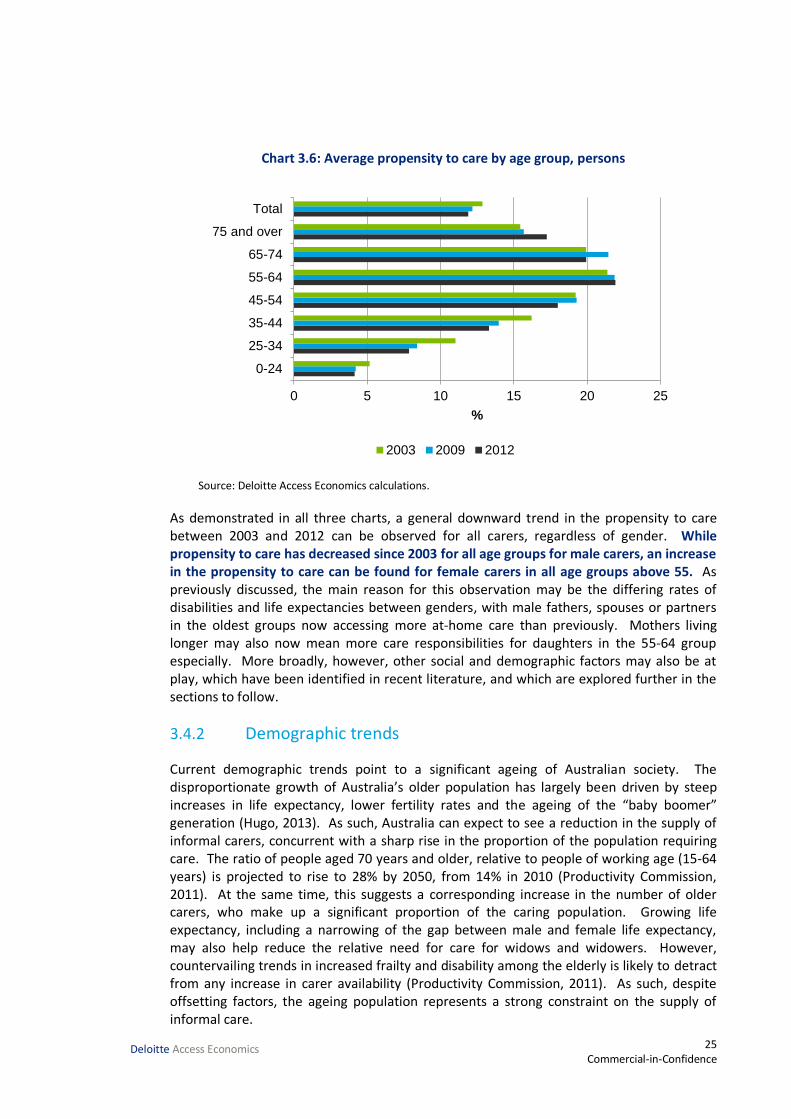
Chart 3.6: Average propensity to care by age group, persons
Source: Deloitte Access Economics calculations.
As demonstrated in all three charts, a general downward trend in the propensity to care between 2003 and 2012 can be observed for all carers, regardless of gender. While propensity to care has decreased since 2003 for all age groups for male carers, an increase in the propensity to care can be found for female carers in all age groups above 55. As previously discussed, the main reason for this observation may be the differing rates of disabilities and life expectancies between genders, with male fathers, spouses or partners in the oldest groups now accessing more at-home care than previously. Mothers living longer may also now mean more care responsibilities for daughters in the 55-64 group especially. More broadly, however, other social and demographic factors may also be at play, which have been identified in recent literature, and which are explored further in the sections to follow.
3.4.2 Demographic trends
Current demographic trends point to a significant ageing of Australian society. The disproportionate growth of Australia’s older population has largely been driven by steep increases in life expectancy, lower fertility rates and the ageing of the “baby boomer” generation (Hugo, 2013). As such, Australia can expect to see a reduction in the supply of informal carers, concurrent with a sharp rise in the proportion of the population requiring care. The ratio of people aged 70 years and older, relative to people of working age (15-64 years) is projected to rise to 28% by 2050, from 14% in 2010 (Productivity Commission, 2011). At the same time, this suggests a corresponding increase in the number of older carers, who make up a significant proportion of the caring population. Growing life expectancy, including a narrowing of the gap between male and female life expectancy, may also help reduce the relative need for care for widows and widowers. However, countervailing trends in increased frailty and disability among the elderly is likely to detract from any increase in carer availability (Productivity Commission, 2011). As such, despite offsetting factors, the ageing population represents a strong constraint on the supply of informal care.
0 5 10 15 20 25
0-24
25-34
35-44
45-54
55-64
65-74
75 and over
Total
%
2003 2009 2012
26 Commercial-in-Confidence
Deloitte Access Economics
3.4.3 Social trends
The effects of this demographic trend may be further compounded by other changes to Australia’s societal structure. Jenkins et al (2003) note a range of familial trends that are likely to reduce the supply of informal carers such as smaller family sizes, higher divorce rates, rising childlessness and the increase of single person households. Given the high proportion of carers, and primary carers in particular, that consist of family members and co-residents, the trend has notable implications for the pool of available carers in the future. While people aged 65 years and over are most likely to be living with a spouse or partner, 25.4% of people aged 65 years and over were estimated to live alone in 2011, making it the second most common living arrangement (ABS, 2013d). Due to gendered differences in life expectancy, women account for the majority of this figure, with 32.2% of females aged 65 years and over living alone in comparison to 17.4% of men (ABS, 2013d). If trends in diminishing family size persist and Australians age with fewer sources of familial support, these rates are likely to increase in the future.
3.4.4 Female participation in the labour force
Rising female participation in the labour force represents another significant potential pressure on the supply of informal care. Since 1978, the female labour force participation rate has increased from 43.4% to 58.5% (ABS, 2015a). As women assume the majority of the responsibilities associated with informal care, as well as with childcare, increased female labour force participation reduces the hours available to provide care. However, while Australia has experienced substantial growth in female labour force participation, much of this increase can be attributed to growth in part-time employment, which may be more conducive to informal caring (Productivity Commission, 2011).
The extent to which female carers may choose to work, in lieu of caring, is also contingent on other factors. In their study on the determinants of the labour force status of female carers, Gray and Edwards (2009) identified a number of additional deterrents to employment, including low levels of educational attainment, poor health, full-time care responsibilities, caring for a child with a disability and not having people outside the household to provide support. As such, the impact of growing female participation on informal care in the future is difficult to predict. Studies have suggested that the impact of female labour supply on informal care depends on current labour force participation with female caregiving more likely to decrease where current labour participation rates, relative to males, are low (Colombo et al, 2011). Given the persisting gap between the female and male labour force participation rate (71.2%) in Australia today, it is possible that future growth could precipitate a fall in the supply of informal carers (ABS, 2015a).
3.4.5 Participation of older workers in the labour force
Rising rates in the participation of older workers in the labour force may place downward pressure on the availability of older carers in the future. Indeed, the participation rate of Australians aged 55 years and over has increased from 25% to 34% over the past three decades (ABS, 2010b). The rise in participation has largely been precipitated by an extension in the traditional working age with people tending to work later into their lives (Productivity Commission, 2011). This is only likely to increase in the future, partly because of persisting trends but also as a result of government impetus. Recent changes to the

27 Commercial-in-Confidence
Deloitte Access Economics
eligibility age for pension recipients in Australia and policies designed to encourage the employment of older Australians have been implemented to mitigate the effects of an ageing population on the labour force (Chomik & Piggott, 2012).
If faced with greater opportunities and motivations to continue or commence participation in the labour force, older carers may choose to reduce their caring hours or responsibilities to work. Given the significant proportion of the informal caring population that older carers constitute, a fall in the older carer population could greatly diminish the supply of available informal care.
3.4.6 Government-supported care in the home environment
One countervailing trend in the demand for and supply of informal care has been the growing availability of government-supported care in the home environment. Persistent trends in the individualisation and privatisation of health care, as driven by policy changes in the past 20 years, have placed greater emphasis on community care and informal caregiving (Yeandle et al, 2012). The result has been an increase in government-supported care in the home environment with a greater emphasis placed on encouraging ‘ageing in place’, allowing formal care providers to assist elderly Australians in their own homes and communities (Productivity Commission, 2011). This has been reflected in changes to the average age of entry into residential care facilities. The average age of entry into residential aged care for females and males rose from 82.8 years and 79.5 years, respectively, in 1997-1998 to 84.3 years and 81.6 years in 2008-2009 (Department of Health and Ageing, 2011). As such, the demand for informal care may be alleviated by such government support, resulting in a fall in the supply of informal carers.
3.4.7 Intergenerational attitudes
Sociological studies have also taken note of the possible impacts of changes in intergenerational attitudes and perceptions of caregiving. Research suggests that growing diversity in the family form has challenged compliance with the traditional values of the nuclear family with the possible effect of diminishing familial responsibility (Lindsay & Dempsey, 2009; Ganong & Coleman, 1999).
Indeed, there is strong support across generations for a continuing role in governmental provision of aged care-related services, including compensation for those who leave paid employment to provide care (Hodgkin, 2014). However, despite these attitudes, carers appear to be largely motivated by a strong sense of responsibility and obligation. Among the reasons listed for taking on a caring role, primary carers most commonly responded with ‘family responsibility’, ‘could provide better care’ and ‘emotional obligation’ (ABS, 2013b). While these motivations may persist, it is important to account for how caring may affect their willingness or capacity to continue providing care.
Caring responsibilities have a significant impact on carers’ physical and emotional welfare and employment status. Ranmuthugala (2009) found that carers report the lowest level of collective wellbeing of any group studied and exhibit higher than average levels of depression, financial strain and social isolation than the average Australian. In response to whether they felt satisfied due to their caring role in the 2012 SDAC, only 27.3% of primary carers reported feeling satisfied (ABS, 2013b). The demands of informal care are likely to
28 Commercial-in-Confidence
Deloitte Access Economics
intensify in the future due to the growing complexity of recipient needs and the lengthened duration of caregiving as a result of extended life expectancy (Fine, 2012). As such, changes in the level of support services for carers, the flexibility of work arrangements and technological innovation may be integral to sustaining willingness to care in the future.
Policy implications 3.5
As demonstrated by the projections in Section 3.2, the demand for informal care is increasing at a faster rate than its supply, with the carer gap predicted to widen in the next ten years. While the scenarios modelled in Section 3.3 represent possible rather than certain trends in caring, the qualitative analysis in Section 3.4 suggests that propensity to care is likely to decrease in the future, further exacerbating the carer gap described in the baseline scenario.
A mismatch between the demand and supply of informal care presents significant challenges for the management of Australia’s health and welfare. If left unmet, growing demand for care is likely to result in a strain on the formal health sector and poorer health outcomes for those who are unable to afford formal care or services. The growing complexity and duration of care required may also place greater pressure on informal carers. Further consideration of the available policy solutions is required to mitigate these problems. This section of the report does not present a comprehensive policy discussion but notes some of the preliminary issues and concerns that will need to be taken into account by policymakers.
3.5.1 Working arrangements
While the demand for informal care clearly outstrips its available supply, current rates of informal care provision suggest that there is potential to increase the proportion of informal carers in the future. There exist a number of policy mechanisms through which more people may be encouraged to provide informal care. For example, greater flexibility in working arrangements can allow workers to provide care where they were previously unable or reluctant to due to constraints imposed by workplace policy. Such policy proposals have particular salience for female carers who assume the majority of informal care and may do so in conjunction with other caring duties, such as childcare. In a Scottish study on the relationship between employees’ access to flexible working arrangements and the amount of informal care they provided, Bryan (2012) identified a 13% increase in the hours of informal care provided that was associated with access to flexitime and the ability to reduce working hours.
Additional benefits may also accrue to existing informal carers who wish to enter or return to the workforce following a prior departure. In the 2012 SDAC, an estimated 22.9% of primary carers who were not in the labour force expressed a desire to work (ABS, 2014b). Given the growing rate of female participation in the labour force and the extended age of workforce participation, it is likely that increasing numbers of people will combine work and informal care in the future (Kenny et al, 2014). As such, flexible working arrangements will be instrumental in allowing carers to maintain a desired or sufficient level of employment while responding to the specific needs of their recipients of care. Furthermore, caregivers may enjoy improvements in personal welfare with recent studies suggesting that greater

29 Commercial-in-Confidence
Deloitte Access Economics
job involvement may in fact counteract the time and psychological demands of caregiving (Gordon and Rouse, 2013).
3.5.2 Carer support
Improvements in approaches to support services available for informal carers represent another opportunity to alleviate the costs of caring, which may have previously deterred friends and family from providing informal care. As discussed, caring incurs significant financial, health and emotional costs to the informal carer. While not all carers suffer adverse health impacts as a result of caring, carers are at greater risk of negative physical and mental health effects, with working carers who provide high levels of care notably vulnerable (Kenny et al, 2014). The Commonwealth Government currently provides a range of support services to alleviate carer burdens, including respite and counselling programs, as well as selected payments such as the Carer Payment and the Carer Allowance (AIHW, 2013). Despite the availability of these services, an estimated 62.1% of primary carers surveyed in the SDAC did not receive assistance from organised services (ABS, 2014b). Of those surveyed, 34.2% were not satisfied or were unsure about the range of organised services available to assist with their caring role, and 25.9% were unaware of the range of services available. A significant proportion of primary carers (89%) had never used respite care.
The figures suggest a strong misalignment between the provision and utilisation of support services for informal carers. While it is true that certain carers may not require assistance or support, further investigation should be undertaken into the specific nature of their needs to better tailor support services to carer requirements. Particularly vulnerable subgroups of carers (such as working carers, carers who are themselves infirm or aged, and young carers) are likely to have needs that differ from those of the general caring population. Studies about appropriate support for young carers suggest that a greater emphasis should be placed on mitigation-type services and preventive strategies to reduce care responsibilities and avoid the entrenchment of a young person’s caring role (Purcal et al, 2012). These may include respite services, education assistance and personalised case management.
Limited awareness among carers of available support and low utilisation of respite services suggest more work can be done to improve accessibility to services and promote awareness of their existence. Furthermore, additional efforts may need to be undertaken to promote greater awareness of the health risks and effects of caring among carers themselves. A stronger prioritisation of the health and wellbeing of informal carers may encourage greater use of respite services, resulting in better health outcomes and quality of care for carers and recipients alike.
3.5.3 Formal and informal care sector balance
Finally, another policy consideration may involve looking at the demand-side determinants of informal care. While policymakers face far more limited means of controlling the demand for care than they do of its supply, greater reliance on the formal care sector may help compensate for the deficit in informal carers. The Australian Government provides a range of subsidised formal community aged care programs including the Commonwealth Home Support Programme for lower intensity care needs and the Home Support Packages

30 Commercial-in-Confidence
Deloitte Access Economics
Programme for higher intensity care needs. In addition to community care, residential aged care has increased as an option for older people whose care needs require specific attention (Productivity Commission, 2011).
While user contributions account for low percentages of the cost of community care packages and Australian Government funding subsidises 71% of the cost of residential care, there may be further scope to consider recipients of care for whom formal care remains unaffordable (National Commission of Audit, 2014). An estimated 18.9% of primary carers surveyed in the SDAC stated that they took on a caring role because alternative care was too costly (ABS, 2014b). An additional consideration may be the quality of formal care that is currently being provided. A detailed examination of the state of the formal care sector is beyond the scope of this report. However, the significant proportions of primary carers (49.8%) who stated that the ability to provide better care was their main reason for taking on a caring role suggests further research into perceptions of the quality of formal care, and the appropriate balance between formal and informal care, is warranted.
Policymakers may also wish to consider the implications of Australia’s increasingly diverse population for achieving an optimal mix of informal and formal care in the future. Increasing levels of migration are likely to add to Australia’s existing elderly migrant population whose cultural and linguistic needs may not be currently met in formal care services. Indeed, studies have shown that older people from culturally and linguistically diverse backgrounds exhibit a significantly lower use of residential aged care, suggesting a preference for care that is sensitive to their cultural needs and preferences (Productivity Commission, 2011). Further research into how the formal care sector can adapt to groups with different aged care needs may help soften demand for informal care where informal care is deemed the only viable option and identify a better balance of reliance on both formal and informal sectors.
As demonstrated in this report, informal carers provide a significant contribution to the health and wellbeing of Australians in need of support and assistance, the magnitude of which only underscores the impending policy challenges faced by Australia. Greater recognition and awareness of carer demographics and preferences will ensure that approaches to health, disability and ageing policies are responsive to the needs of carers and care recipients alike, resulting in improvements in welfare for Australia in the future.

31 Commercial-in-Confidence
Deloitte Access Economics
References Access Economics 2010, The value of informal care in 2010, Report for Carers Australia,
Canberra.
- 2005, The economic value of informal care, Report for Carers Australia, Canberra.
Australian Bureau of Statistics 2015a, Labour force, Australia, April 2015, ABS Cat No 6202.0, Australian Government, Canberra.
- 2015b, Key economic indicators, 2015, ABS Cat No 1345.0, Australian Government, Canberra.
- 2015c, Australian national accounts: national income, expenditure and product, ABS Cat No 5206.0, Australian Government, Canberra.
- 2015d, Employee earnings and hours, Australia, May 2014, ABS Cat No 6306.0, Australian Government, Canberra.
- 2014a, Average weekly earnings, Australia, May 2014, ABS Cat No 6302.0, Australian Government, Canberra.
- 2014b, Caring in the community, Australia, 2012: summary of findings, 2012, ABS Cat No 4436.0, Australian Government, Canberra.
- 2014c, Microdata: disability, ageing and carers, Australia, 2012, ABS Cat No 4430.0.30.002, Australian Government, Canberra.
- 2014d, Australian national accounts: national income, expenditure and product, June 2014, ABS Cat No 5206.0, Australian Government, Canberra.
- 2013a, Population projections, Australia, 2012 (base) to 2101, ABS Cat No 3222.0, Australian Government, Canberra.
- 2013b, Disability, ageing and carers, Australia: summary of findings, 2012, ABS Cat No 4430.0, Australian Government, Canberra.
- 2013c, Average weekly earnings, Australia, May 2013, ABS Cat No 6302.0, Australian Government, Canberra.
- 2013d, Reflecting a nation: stories from the 2011 census, 2012-2013, ABS cat No 2071.0, Australian Government, Canberra.
- 2012a, Australian social trends, data cube – family and community, ABS Cat No 4102.0, Australian Government, Canberra.
- 2012b, Average weekly earnings, Australia, May 2012, ABS Cat No 6302.0, Australian Government, Canberra.

32 Commercial-in-Confidence
Deloitte Access Economics
- 2012c, Labour costs, Australia, 2010-11, ABS Cat No 6348.0, Australian Government, Canberra.
- 2011, Average weekly earnings, Australia, May 2011, ABS Cat No 6302.0, Australian Government, Canberra.
- 2010a, Disability, ageing and carers, Australia: summary of findings, 2009, ABS Cat No 4430.0, Australian Government, Canberra.
- 2010b, Australian social trends, Sep 2010, ABS Cat No 4102.0, Australian Government, Canberra.
- 2004, Disability, ageing and carers, Australia: summary of findings, 2003, ABS cat No 4430.0, Australian Government, Canberra.
Australian Institute of Health and Welfare 2014a, Health expenditure Australia 2012-13: analysis by sector, Cat No HWE 62, Australian Government, Canberra.
- 2014b, Australia’s health 2014, Cat No AUS 178, Australian Government, Canberra.
- 2013, Australia’s welfare 2013, Cat No AUS 174, Australian Government, Canberra.
- 2010, A snapshot of men’s health in regional and remote Australia, Cat No PHE 120, Australian Government, Canberra.
- 2008, Rural, regional and remote health: indictors of health status and determinants of health, Cat No PHE 97, Australian Government, Canberra.
- 2007, Australia’s welfare 2007, Cat No AUS 93, Australian Government, Canberra.
Boldy D, Grenade L, Lewin G, Karol E and Burton E 2011, ‘Older people’s decisions regarding ‘ageing in place’: a Western Australian case study’, Australasian Journal on Ageing, 30(3): 136-142.
Buckner L and Yeandle S 2011, Valuing carers 2011 – calculating the value of carers’ support, Carers UK, London.
Chomick R and Piggott J 2012, Mature-age labour force participation: trends, barriers, incentives, and future potential, ARC Centre of Excellence in Population Ageing Research, Sydney.
Colombo F, Llenz-Noza A, Mercier J and Tjadens F 2011, Help wanted? Providing and paying for long-term care, Organisation for Economic Cooperation and Development, Paris.
Department of Health and Ageing 2011, Technical paper on the changing dynamics of residential aged care prepared to assist the Productivity Commission Inquiry caring for older Australians, Department of Health and Ageing, Canberra.
Edwards B, Gray M, Baxter J and Hunter B 2009, The tyranny of distance? Carers in regional and remote areas of Australia, Australian Institute of Family Studies, Canberra.

33 Commercial-in-Confidence
Deloitte Access Economics
Feinberg L, Reinhard S, Houser A and Choula, R 2011, Valuing the invaluable: 2011 update: the growing contributions and costs of family caregiving, AARP Public Policy Institute, Washington DC.
Fine MD 2012,’Employment and informal care: sustaining paid work and caregiving in community and home-based care’, Ageing International, 37(1): 57-68.
Ganong LH and Coleman M 1999, Changing families, changing responsibilities: family obligations following divorce and remarriage, Lawrence Erlbaum Associates, New Jersey.
Gibson D, Liu Z and Choi C 1995, ‘The changing availability of residential aged care in Australia’, Health Policy, 31(3): 211-224.
Gordon J and Rouse E 2013, ‘The relationship of job and elder caregiving involvement to work-caregiving conflict and work costs’, Research on Aging, 35(1): 96-117.
Gray M and Heinsch M 2009, ‘Ageing in Australia and the increased need for care’, Ageing International, 34(3):102-118.
Gray M and Edwards B 2009, ‘Determinants of the labour force status of female carers’, Australian Journal of Labour Economics, 12(1): 5-20.
Grimmond D 2014, The economic value and impacts of informal care in New Zealand, Infometrics, Wellington.
Hodgkin S 2014, ‘Intergenerational solidarity: an investigation of attitudes towards the responsibility for formal and informal elder care in Australia’, Health Sociology Review, 23(1): 53-64.
Hollander M, Liu G and Chappell N 2009, ‘Who cares and how much – the imputed economic contribution to the Canadian healthcare system of middle-aged and older unpaid caregivers providing care to the elderly’, Healthcare Quarterly, 12(2): 42-49.
Hugo G 2013, ‘The changing demographics of Australia over the last 30 years’, Australasian Journal on Ageing, 32(S2): 18-27.
Jenkins A, Rowland F, Angus P and Hales C 2003, The future supply of informal care 2003 to 2013, Australian Institute of Health and Welfare, Canberra.
Kenny P, King M and Hall J 2014, ‘The physical functioning and mental health of informal carers: evidence of care-giving impacts from an Australian population-based cohort’, Health and Social Care in the Community, 22(6): 646-659.
Lindsay J and Dempsey D 2009, Families, relationships and intimate life, Victoria Oxford University Press, South Melbourne.
Moullin S 2007, Care in a new welfare society: unpaid care, welfare and employment, Institute for Public Policy Research, London.
34 Commercial-in-Confidence
Deloitte Access Economics
National Commission of Audit 2014, The Report of the National Commission of Audit: Appendix to Volume 1, Australian Government, Canberra.
National Institute of Statistics and Economic Studies (INSEE) 2015, 1.101 – Gross domestic product and its components at current prices (billions of euros), INSEE, France.
Office for National Statistics 2015, Quarterly national accounts – national accounts aggregates, Office for National Statistics, United Kingdom.
Paraponaris A, Davin B and Verger P 2012, ‘Formal and informal care for disabled elderly living in the community: an appraisal of French care composition and costs’, European Journal of Health Economics, 13(3): 327-336.
Productivity Commission 2011, Caring for older Australians, Australian Government, Canberra.
Purcal C, Hamilton M, Thomson C and Cass B 2012, ‘From assistance to prevention: categorising young carer support services in Australia and international implications’, Social Policy & Administration, 46(7): 788-806.
Ranmuthugala G 2009, ‘Impact of home based long term care on informal carers’, Australian Family Physician, 38(8): 618-620.
Statistics Canada 2015, Gross domestic product, expenditure-based, Statistics Canada, Canada.
Walsh J and de Ravin J 1995, Long Term Care – Disability and Ageing, The Institute of Actuaries, London.
Yeandle S, Kröger T and Cass B 2012, ‘Voice and choice for users and carers? Developments in patterns of care for older people in Australia, England and Finland’, Journal of European Social Policy, 22(4): 432-445.

35 Commercial-in-Confidence
Deloitte Access Economics
Limitation of our work General use restriction
This report is prepared solely for the use of Carers Australia. This report is not intended to and should not be used or relied upon by anyone else and we accept no duty of care to any other person or entity. The report has been prepared for the purpose of assisting Carers Australia to increase awareness of the economic value of informal care. You should not refer to or use our name or the advice for any other purpose.
Contact us
Deloitte Access Economics ACN: 149 633 116 Level 1 9 Sydney Avenue Barton ACT 2600 PO Box 6334 Kingston ACT 2604 Australia Tel: +61 2 6175 2000 Fax: +61 2 6175 2001 www.deloitteaccesseconomics.com.au
Deloitte Access Economics is Australia’s pre-eminent economics advisory practice and a member of Deloitte's global economics group. For more information, please visit our website www.deloitteaccesseconomics.com.au
About Deloitte
Deloitte refers to one or more of Deloitte Touche Tohmatsu Limited, a UK private company limited by guarantee, and its network of member firms, each of which is a legally separate and independent entity. Please see www.deloitte.com/au/about for a detailed description of the legal structure of Deloitte Touche Tohmatsu Limited and its member firms.
Deloitte provides audit, tax, consulting, and financial advisory services to public and private clients spanning multiple industries. With a globally connected network of member firms in more than 150 countries, Deloitte brings world-class capabilities and deep local expertise to help clients succeed wherever they operate. Deloitte's approximately 200,000 professionals are committed to becoming the standard of excellence.
About Deloitte Australia
In Australia, the member firm is the Australian partnership of Deloitte Touche Tohmatsu. As one of Australia’s leading professional services firms. Deloitte Touche Tohmatsu and its affiliates provide audit, tax, consulting, and financial advisory services through approximately 6,000 people across the country. Focused on the creation of value and growth, and known as an employer of choice for innovative human resources programs, we are dedicated to helping our clients and our people excel. For more information, please visit our web site at www.deloitte.com.au.
Liability limited by a scheme approved under Professional Standards Legislation.
Member of Deloitte Touche Tohmatsu Limited
© 2015 Deloitte Access Economics Pty Ltd